Development and Characterisation of an in vitro Model of Wallerian Degeneration
 Heba Elsayed1,2
  Alessandro Faroni1
  Mohammad R. Ashraf1 Judith Osuji1
  Lydia Wunderley3 Ling Zhang4
  Hesham Elsobky2 Mohamed Mansour2 Ashraf S. Zidan2,5
  Adam J. Reid1,6*
- 1Blond McIndoe Laboratories, Division of Cell Matrix Biology and Regenerative Medicine, School of Biological Sciences, Faculty of Biology, Medicine and Health, The University of Manchester, Manchester Academic Health Science Centre, Manchester, United Kingdom
- 2Department of Neurosurgery, Mansoura University Hospitals, Mansoura, Egypt
- 3Division of Cellular and Molecular Function, School of Biological Sciences, Faculty of Biology, Medicine and Health, The University of Manchester, Manchester Academic Health Science Centre, Manchester, United Kingdom
- 4College of Polymer Science and Engineering, Sichuan University, Chengdu, China
- 5Mansoura University Hospital, Mansoura, Egypt
- 6Department of Plastic Surgery & Burns, Wythenshawe Hospital, Manchester University NHS Foundation Trust, Manchester Academic Health Science Centre, Manchester, United Kingdom
Following peripheral nerve injury, a sequence of events termed Wallerian degeneration (WD) takes place at the distal stump in order to allow the regenerating axons to grow back toward the target organs. Schwann cells (SCs) play a lead role in this by initiating the inflammatory response attracting macrophages and immune cells, as well as producing neurotrophic signals that are essential for nerve regeneration. The majority of existing research has focused on tools to improve regeneration, overlooking the critical degeneration phase. This is also due to the lack of in vitro models recapitulating the features of in vivo WD. In particular, to understand the initial SC response following injury, and to investigate potential interventions, a model that isolates the nerve from other systemic influences is required. Stem cell intervention has been extensively studied as a potential therapeutic intervention to augment regeneration; however, data regarding their role in WD is lacking. Thus, in this study we describe an in vitro model using rat sciatic nerve explants degenerating up to 14 days. Characterisation of this model was performed by gene and protein expression for key markers of WD, in addition to immunohistochemical analysis and electron microscopy. We found changes in keeping with WD in vivo: upregulation of repair program protein CJUN, downregulation of myelin protein genes and subsequent disorganisation and breakdown of myelin structure. As a means of testing the effects of stem cell intervention on WD we established indirect co-cultures of human adipose-derived mesenchymal stem cells (AD-MSC) with the degenerating nerve explants. The stem cell intervention potentiated neurotrophic factors and Cjun expression. We conclude that our in vitro model shares the main features of in vivo WD, and we provide proof of principle on its effectiveness to study experimental approaches for nerve regeneration focused on the events happening during WD.
Introduction
Treatment options following peripheral nerve injuries are dependent on surgical interventions which have demonstrated that the perfect microsurgical repair of injured nerve stumps cannot alone restore prior function to the patient (Palispis and Gupta, 2017). A multitude of research has therefore focused on enhancing regeneration of peripheral nerves, perhaps neglecting the pre-requisite of distal stump degeneration to lay the groundwork for subsequent regeneration. WD is orchestrated by SC plasticity (Boerboom et al., 2017) with the ability to dedifferentiate from a myelinating phenotype to a repair phenotype. This process involves upregulation of genes such as Cjun and P75 encoding proteins responsible for proliferation, migration, adhesion and systemic inflammatory response activation (Jessen and Arthur-Farraj, 2019). SCs initiate the inflammatory response to increase the number of macrophages and monocytes in the distal stump; moreover, both act to clear myelin debris in order to pave the way for the regenerating growth cone to navigate toward the distal stump (Dubovy, 2011). Therefore, it is logical that the degenerative phase of clearing axon-myelin debris could be targeted for therapeutic intervention in order to accelerate or improve efficiency of the process and ultimately promote regeneration.
Models of WD used in research are limited by poor characterisation, failure to isolate the critical SC response from the systemic response and lack of potential to translate into human tissue models. Recent insightful studies have used injured ex vivo nerve models of WD in genetic knockout mice to identify mechanisms underpinning autophagic action of SCs (Gomez-Sanchez et al., 2015; Jang et al., 2016). Furthermore, macrophages and SCs are known to act synergistically in the degradation and removal of myelin (myelinophagy) following injury (Gaudet et al., 2011; Rotshenker, 2011). In order to understand the capacity of the resident cells to regulate myelinophagy independent of the systemic response, it is necessary to characterise a model which isolates the injured nerve immediately following injury. This model would also permit investigation of interventions in the degenerative phase following nerve injury.
Perhaps the most promising experimental intervention for regeneration is the use of stem cells; however, nothing is known of their impact on WD (Dezawa et al., 2001; Kingham et al., 2007). AD-MSCs have been demonstrated to improve neuronal regeneration in vitro and in vivo models following chemical stimulation into a Schwann-like phenotype (dASC) (Faroni et al., 2013); however, survival in vivo after nerve injury has been demonstrated to be less than a few weeks, therefore their therapeutic window spans only the initial regenerative response (Faroni et al., 2016). As such, it stands to reason that AD-MSC and dASC may impact WD as well as the regenerative response and perhaps through a similar mechanism of growth factor (BDNF and NGF) production. In this work, we establish and characterise an in vitro model of WD to determine ultrastructural and histological morphology, alongside a timeline of important gene and protein expression changes over 14 days. We subsequently use this model to test the effect of AD-MSCs and dASC intervention on SC functions during WD.
Materials and Methods
Establishing an in vitro Explant Model
All the animal work was performed in accordance with the UK Animal Scientific Procedures Act 1986. Following CO2 euthanasia and cervical dislocation (S1) the hind limbs of adult 200–300 g Sprague Dawley rats were carefully dissected in surgical planes to expose the whole course of sciatic nerve up to its origin. Blunt dissection freed the nerve from underlying fascia and muscle before being divided and placed into Hanks balanced salt solution (HBSS, Sigma-Aldrich). Four rats (eight sciatic nerves) were used per experiment. Nerves were de-sheathed (removal of the epineurium) unless otherwise specified under a microscope at 20× magnification, and subsequently divided into smaller pieces (nerve explants) of 5–10 mm size, using sharp micro-scissors. For all experiments, day 0 time points were processed first and frozen at −80°C or fixed immediately, whereas for days 1, 3, 5, 7, and 14, the nerve explants were placed in six well plates containing 2 ml of low glucose Dulbecco’s Modified Eagle’s Medium (DMEM; Sigma-Aldrich, United Kingdom) supplemented with 10% (v/v) of FBS (LabTech, Uckfield, United Kingdom), 1% (v/v) of penicillin–streptomycin solution (PS; Sigma-Aldrich, United Kingdom), and 2 mM L-glutamine (GE Healthcare UK, Little Chalfont, United Kingdom). No media change was performed in the first 7 days of culture; however, for explants to be collected at day 14, a single media change was performed at day 7. All explants were incubated in 5% CO2 at 37°C, frozen or fixed at their respective time points, and stored at −80°C until further processing.
Transmission Electron Microscope (TEM)
For electron microscopy studies, nerve explants (not de-sheathed) at each time point were pinned to a plastic strip with sterile needles and fixed by immersing in a 2% (w/v) PFA and 2% (v/v) glutaraldehyde solution for 24 h, transferred into PBS, and refrigerated until all time points were collected. The samples were then processed by University of Manchester Electron Microscopy Facility as ultrathin nerve cross sections for TEM imaging. The nerve samples were fixed for an hour in 1% osmium tetroxide and 1.5% potassium ferrocyanide in 0.1 M cacodylate buffer, followed by another 24 h in 1% uranyl acetate in water. The sample was then dehydrated in an ethanol series with 812 resin (TAAB laboratories), before polymerization for 24 h at 60°C. Samples were cut with the Reichert Ultracut Ultra-Microtome as ultra-thin sections. These were visualised with FEI Tecnai 12 Biotwin microscope at 100 kV accelerating voltage, and snapshots saved with Gatan Orius SC1000 CCD camera.
Immunohistochemistry (IHC)
In order to preserve the fine structure of the nerve, samples were not de-sheathed when processed for IHC, with the exception of the DAPI count experiment (Figure 2B). Nerve explants were pinned to a plastic strip to straighten up with minimal tension and were fixed for 24 h by immersing in 4% (w/v) PFA, followed by three serial changes with 15% (w/v) sucrose and 0.1% (w/v) sodium azide in PBS. Samples were refrigerated until embedding in optimal cutting temperature (OCT) cryo-compound (Klinipath), after which they were stored at −80°C. The blocks were then cut longitudinally at University of Manchester histology facility by using cryostat (Leica ASP300). Sections were cut at 5 um and caught in between the microtome blade and glass. The sections were transferred to pre-heated Superfrost Plus slides (VWR International) and then incubated overnight at 37°C. Slides were then stored at −80°C until staining procedure. On the staining day, the slides were submerged in 0.2% Triton X-100/PBS for 1 h at RT then a blocking serum containing normal goat or donkey serum solution (both 5:100; Sigma-Aldrich, Poole, United Kingdom) was added for 1 h at RT after 2 × PBS washes 5 min each. The slides were incubated with the primary antibody [P0 Abcam (ab183868) 1:200], [MBP Millipore (MAB384-1ML) 1:200] βIII Tubulin [βIIIT Sigma (ab6046) 1:200] and CD68 [AbD serotec (MCA1957GA) 1:200] overnight at 4°C followed by two PBS washes and secondary antibody incubation the following day for 1 h at RT [goat/monkey anti-rabbit and goat/monkey anti-mouse (488 for green and 568 for red) (Life Technologies, Thermo Fisher Scientific)] in dark.
In desheathed nerve segments, explants were treated as above with the addition of three PBS washes for 5 min before mounting with Vectashield (Vector Laboratories, United Kingdom) containing 4′,6-diamidino-2-phenylindole (DAPI) for nuclear staining. This permitted the quantification of cells which are presumed to be predominantly SCs.
For FluoroMyelin staining: the slides were washed with PBS for 20 min and stained with green FluoroMyelin dye [1:300 in PBS, Molecular Probes, United Kingdom (F34651)] for 20 min at RT. Sections were washed 3 × 5 min with PBS before mounting with aqueous media containing DAPI (Vector Laboratories, United Kingdom).
Images were acquired using a fluorescence microscope (Olympus BX60, Southend-on-Sea, United Kingdom), and processed with ImageJ imaging software (Version 1.52a, National Institutes of Health NIH, Bethesda, MD, United States).
RNA Extraction
The RNeasy Lipid Tissue Mini Kit (QIAGEN, United Kingdom) was used to extract purified RNA from the nerve samples according to the manufacturer’s protocol. Briefly, each of the frozen nerve samples were placed in 5 ml Falcon Polypropylene Rounded-Bottom Tube containing 1 ml QIAzol Lysis Reagent (QIAGEN, United Kingdom). A TissueRupter tissue homogeniser (QIAGEN, United Kingdom) was used to homogenise the nerve explants on ice. After 5 min, the sample was transferred to a 1.5 ml Eppendorf tube to which 200 ul of chloroform was added (Sigma-Aldrich). The tube was then vortexed for a few seconds, allowed to sit for 2–3 min, before being centrifuged at 12,000 × g for 15 min at (4°C). The aqueous phase was isolated and one volume of 70% ethanol (Fisher Chemical) was added; following gentle pipetting, the resulting solution was transferred to RNeasy Mini spin column (QIAGEN) in 2 ml collection tube and centrifuged for 30 s at 13,000 rpm at RT. Columns were then washed with Buffer RW1, and twice with Buffer RPE. Finally, the column was placed into a 1.5 ml Eppendorf tube, and 30 ul of RNase free water (QIAGEN) was added directly to the column to elute RNA with a 1 min centrifugation at 13,000 rpm at RT.
The RNA concentration was determined by spectrophotometric analysis with a NanoDrop ND-100 (Thermo Fisher Scientific, Waltham, MA, United States).
Real Time qPCR (RT-qPCR)
1 μg of each sample was reverse transcribed using the RT2 First Strand Kit (Qiagen), according to the manufacturer’s instructions. Briefly, 2 μl buffer GE (QIAGEN) was added to 1 μg of RNA diluted in 8 μl RNase free water and the resulting mixture was incubated for 5 min at 42°C to eliminate genomic DNA, before being cooled down to 4°C for 20 min. 10 μl of Reverse Transcription mix was added to the sample according to manufacturer’s guide. Each sample was then incubated at 42°C for 15 min using the PTC-200 Peltier Thermal Cycler (MJ Research). The reaction was stopped by incubating the samples at (95°C) for 5 min, before being cooled down to 4°C for 20 min. 91 ul of RNase free water was finally added to the resulting reverse transcribed cDNA sample.
RT-qPCR was performed using a Corbett Rotor Gene 6000 (Qiagen) and RT2 SYBR Green qPCR Mastermix (Qiagen) as follows: hot start for 10 min at 95°C, followed by 40 cycles of 15 s at 95°C, annealing for 30 s at 55°C, and extension for 30 s at 72°C. Melting curve was obtained as follow: 95°C for 1 min, 65°C for 2 min, and a gradual temperature increase from 65°C to 95°C at 2°C/min. All of the primers for the genes of interest and for the housekeeping gene were obtained from Sigma-Aldrich (listed in Table 1). Data were normalised for the housekeeping gene (GAPDH or 18S) and the ΔΔCt method was used to determine the fold changes in gene expression. Data is presented as mean ± standard error of the mean (SEM, error bars) and analysed by one-way ANOVA (Tukey’s multiple comparison test).
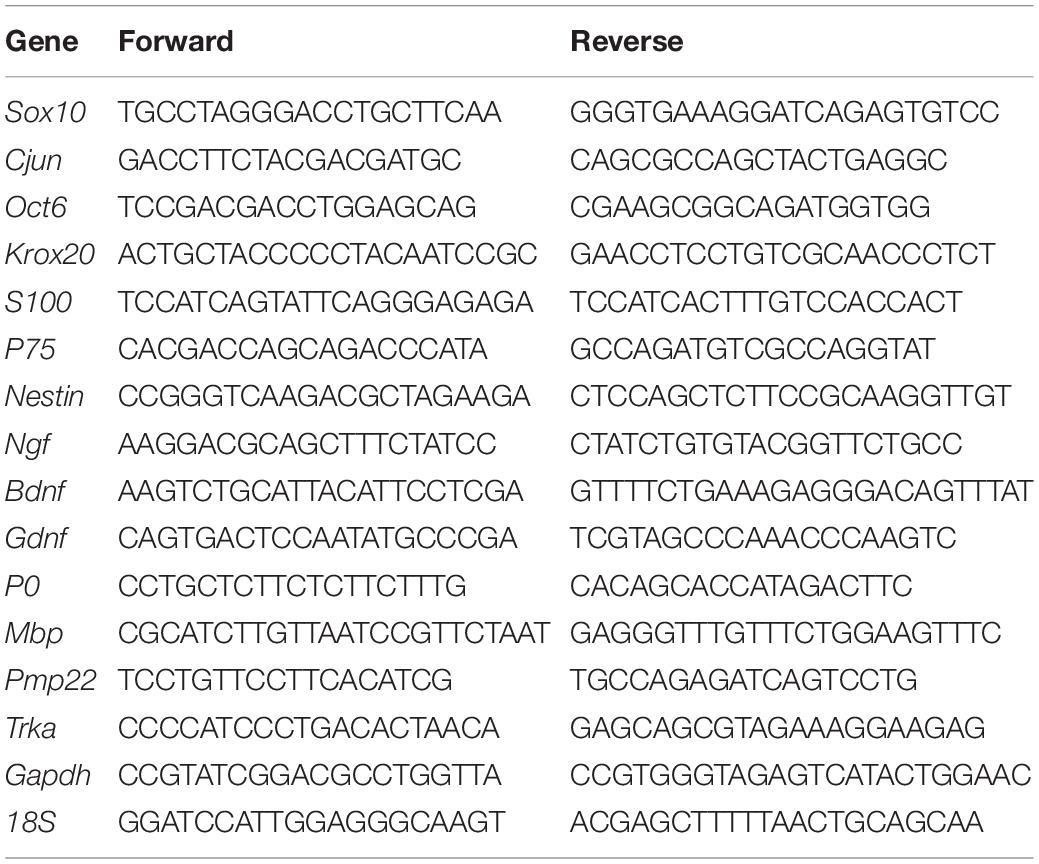
Table 1. Primer sequences used in PCR studies.
Western Blot
Nerve explants were homogenised using a TissueRuptor (QIAGEN) in radio-immunoprecipitation assay (RIPA Sigma, United Kingdom) buffer (800 μl each) supplemented with a cocktail of protease and phosphatase inhibitors (Thermo Scientific, Loughborough, United Kingdom), and left for 30 min on ice. Following centrifugation at 14,000 rpm for 20 min at (4°C), proteins were quantified using PierceTM BCA Protein Assay Kit (Thermo Scientific, Waltham, MA, United States) according to the manufacturer’s instruction. Protein samples were boiled in RIPA buffer and Laemmli sample buffer (×6) for 5 min at 100°C. An equal amount of the protein of interest (listed in Table 2) was loaded and run in sodium dodecyl sulphate polyacrylamide gels (SDS-PAGE) using Tris-glycine running buffer [25 mM Tris, 190 mM glycine, 0,08% (w/v) SDS]. The proteins were then transferred onto a nitrocellulose membrane (GE Healthcare Life Science, Amersham, Germany) in transfer buffer [25 mM Tris-base; 192 nM glycine, 20% (v/v) methanol]. The membranes were blocked for 1 h in a Tris-buffer saline (TBS) - Tween Solution containing 5% non-fat dry milk. Membranes were incubated overnight with primary antibodies (details in Table 2) diluted in blocking buffer or 5% bovine serum albumin (BSA) (Sigma-Aldrich, United Kingdom). Washes were done using TBS-Tween followed by 1 h incubation of the secondary antibody horseradish peroxidase (HRP) conjugated against rabbit or mouse (Cell Signaling, Hitchin, United Kingdom) for chemiluminescence detection. For housekeeping protein (GAPDH) membranes were stripped with a glycine solution (100 mM, pH 2.9; Sigma-Aldrich, United Kingdom) for 15 min at RT and re-blocked again as before, prior to further blotting. Membranes were exposed to SuperSignal West Pico Chemiluminescent Substrate (Thermo Scientific, Waltham, MA, United States), and the signal was analysed by densitometry using ImageJ 64 imaging software (Version 1.52a, National Institutes of Health NIH, United States). Western blot densitometry data of all proteins were normalised for the levels of GAPDH for each time point and used as a loading control.
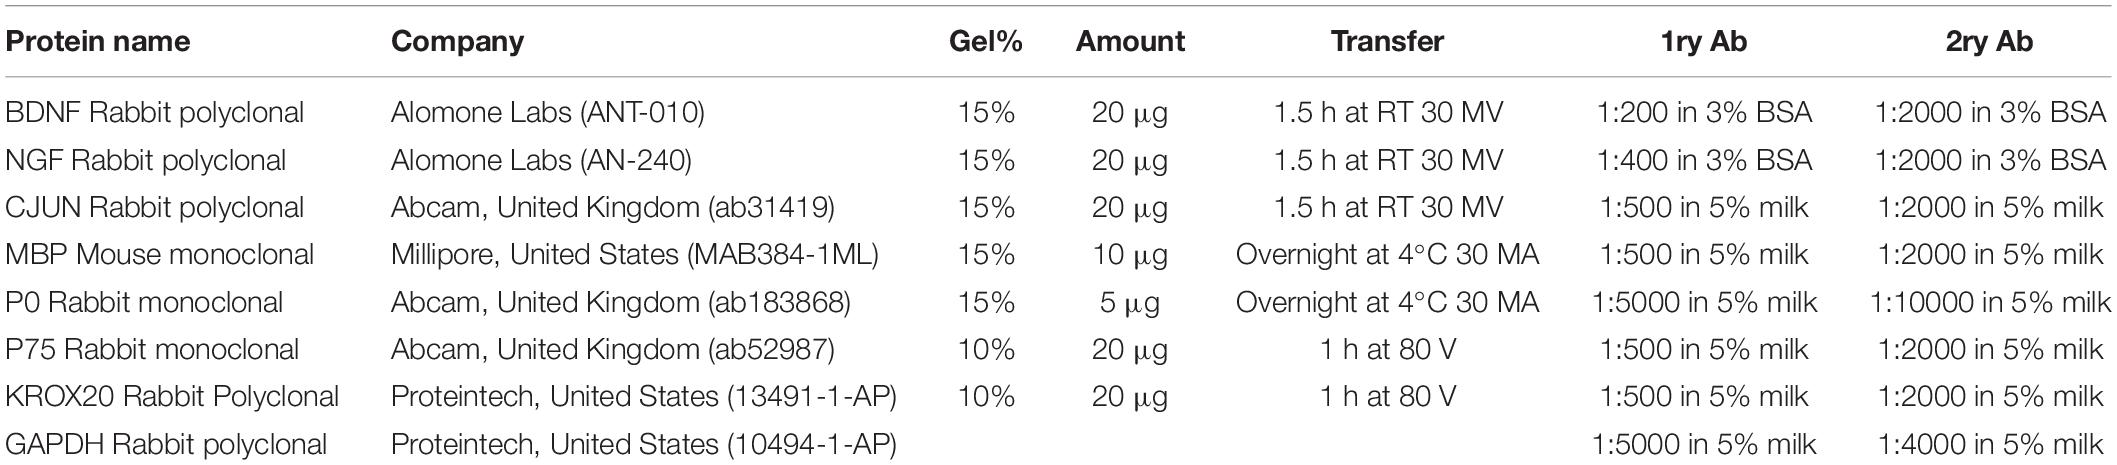
Table 2. Antibodies and experimental conditions used for Western Blot analyses.
Harvest and Culture of Human AD-MSCs
Adipose tissue samples were collected from patients undergoing reconstructive breast surgery at Wythenshawe Hospital, Manchester University NHS Foundation Trust, Manchester, United Kingdom. Patients were fully consented and procedures approved by the National Research Ethics Committee (NRES 13/SC/0499). All the samples were derived from subcutaneous abdominal fat. All patients were females aged 45–65 years and otherwise fit and healthy. AD-MSCs were obtained according to previously described protocol (Kingham et al., 2007). The adipose tissue was cut into small pieces then minced with razor blade and digested enzymatically using 0.2% (w/v) collagenase (Life Technologies, Paisley, United Kingdom) at 37°C for 45 min under constant agitation. The resulting tissue was filtered through a vacuum-assisted 100 μm nylon mesh (Merck Millipore UK, Watford, United Kingdom), followed by the addition of an equal amount of alpha-modified Minimum Essential Eagle’s medium (aMEM) (Sigma-Aldrich, Poole, United Kingdom) supplemented with, 10% (v/v) FBS (LabTech, Uckfield, United Kingdom), 2 mM L-glutamine (GE Healthcare UK, Little Chalfont, United Kingdom), and 1% (v/v) penicillin–streptomycin solution. After centrifugation at 400 × g for 10 min, the SVF was pelleted. 1 ml of Red Blood Cell Lysis Buffer (Sigma-Aldrich) was added for 1 min followed by the addition of 15 ml of fresh aMEM and further centrifugation at 400 × g for 10 min. The resulting SVF pellet was plated in T75 at 37°C and 5% CO2 with media change twice to three times a week and split when confluent. Characterisation was done according to our previously published protocol (Faroni et al., 2016). Passage 2 cells were used for co-culture experiments involving AD-MSC.
Stimulation of AD-MSC to a Schwann-Like Phenotype dASC
As previously described (Kingham et al., 2007), passage 2 AD-MSC were plated at 20 to 30% confluency and treated with 1 mM b-mercaptoethanol (Sigma-Aldrich) for 24 h, prior to 72 h of exposure to 35 ng/mL all-trans-retinoic acid (Sigma-Aldrich). The differentiation media (d-aMEM) was then added ([aMEM) + 14 μM forskolin (Sigma-Aldrich) + 5 ng/mL platelet-derived growth factor (Peprotech EC, London, United Kingdom) + 192 ng/mL glial growth factor-2 (GGF-2) (Acorda Therapeutics, Ardsley, NY, United States) + 10 ng/mL basic fibroblast growth factor (Peprotech EC)]. Cells were split at the fourth and tenth days of differentiation, and cells were considered differentiated (dASCs) after 14 days, as previously reported (Kingham et al., 2007). Cells at passage 4 to 6 were used in co-culture experiment involving dASCs.
Co-culture Experiments
Twenty-four hours before nerve explants were harvested, both AD-MSC and dASCs cells from confluent flasks were collected and counted using a Scepter 2.0 (Merck-Millipore). 100,000 cell per well were plated in 24-well plates (three wells for each time point) and 500 μl of either aMEM or d-aMEM media was used for each well.
Nerve explants were collected from four Sprague Dawley rats as described above, with 15–20 nerve explants collected for each condition. All the nerves were de-sheathed under the microscope and cut into 5–10 mm length. Experimental groups were as follow: D0 healthy nerve explants (D0 c), D3 degenerated nerve explants cultured without cells (D3 c), D3 nerves co-cultured with AD-MSC (uASCs) and D3 nerve explants cultured with dASCs (dASCs).
Using an insert with a 0.4 um porous membrane (Greiner Bio-One), the nerve explants were inserted into the 24 well plate containing the plated cells after a media change and HBSS wash. 1200 μl of DMEM media was added to both the cells and the nerves (across the permeable membrane). The well insert ensured that no direct contact between AD-MSC and explants occurred. The co-cultures were kept in the incubator at 37°C at 5% CO2 for 3 days without a media change. The nerve explants were collected at each time point and processed for either gene or protein expression as described above.
Statistical Analysis
Data analysis were performed using GraphPad Prism 5 (7.0, GraphPad Software Inc., La Jolla, CA, United States). PCR data were presented as mean ± standard error of the mean (SEM, error bars) by one-way ANOVA (Tukey’s multiple comparison test) (*p < 0.05, **p < 0.01, ***p < 0.001, ****p < 0.0001).
Results
TEM Highlights Morphological/Structural Features of Degenerating Nerves in the in vitro WD Model
In order to assess WD in vitro, we performed TEM analysis of degenerating explants at day 0, 2, 5, and 12 after transection and degeneration in vitro. Transmission electron micrographs showed degeneration of both axons and myelin with loss of nerve structure and disorganisation (Figure 1). Day 0 (D0) healthy non-injured sciatic nerve (Figure 1A) (left panel) showed preserved myelin structures (blue arrows) and cytoplasm of surrounding SCs was visible (yellow arrow). At higher magnification (right panel) we observed regular myelin lamellae (blue arrow) with SC nucleus (red arrow), alongside multiple unmyelinated axons (green arrow) surrounded by Remak SC (yellow arrow) to form Remak bundles. Two days after the in vitro degeneration (D2) the injured sciatic nerves contained multiple vacuoles within the myelin structure with evidence of early disorganisation and myelin collapse, accompanied by gradual loss of lamellar myelin structure (highlighted by green arrows at low (left) and high (right) magnification, Figure 1B). At day 5 (D5) post injury we observed the disappearance of some axons and the presence of multiple myelin debris within SC cytoplasm (green arrows), at low (left) and high (right) magnification (Figure 1C). After 12 days (D12) of WD induction in vitro, the nerve structure was compromised, myelin was unfolded or completely degenerated (yellow arrows), and axonal structure was replaced by amorphous material (green arrows) denoting the complete degeneration of the nerve sections (Figure 1D).
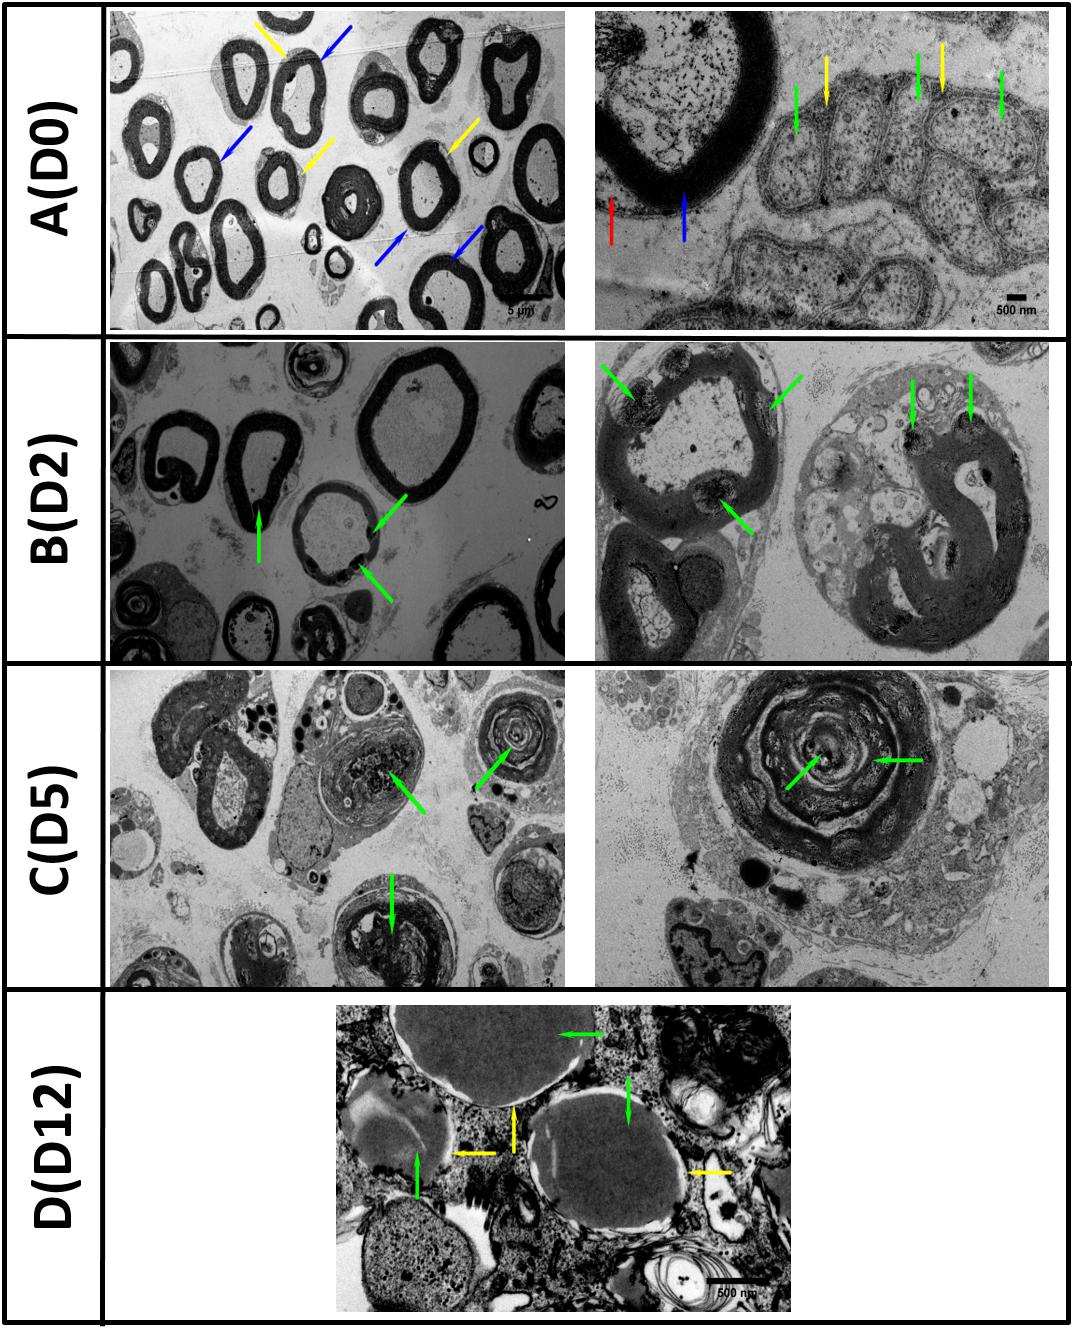
Figure 1. TEM images of in vitro Wallerian degeneration model showing ongoing degeneration of the nerve axons and myelin. (A) (D0 left) Healthy rat sciatic nerve at day zero (D0) showed preserved myelin structures (blue arrows) and surrounded by Schwann cells cytoplasm (yellow arrow). (A) (D0 right) Nerve at higher magnification with regular myelin lamellae (blue arrow) and Schwann cell nucleus (red arrow). Multiple unmyelinated axons (green arrow) surrounded by Remak Schwann cell (yellow arrow) grouped in Remak bundles were also observed. (B) (D2 left) The second day (D2) post transection, the Wallerian Degeneration (WD) was evidenced by the appearance of multiple vacuoles within the myelin structures (green arrows) with the collapse of myelin evident at higher magnification (B) (D2 right). (C) Five days (D5) post in vitro WD we observed the disappearance of axonal structures and abundance of myelin debris within Schwann cell cytoplasm (green arrows). (D) Twelve days (D12) post transection and WD, the axons were replaced with amorphous material (green arrows) and myelin structures disappeared (yellow arrows) (Scale bars as in the top row are 5 μm on the right and 500 nm on the left).
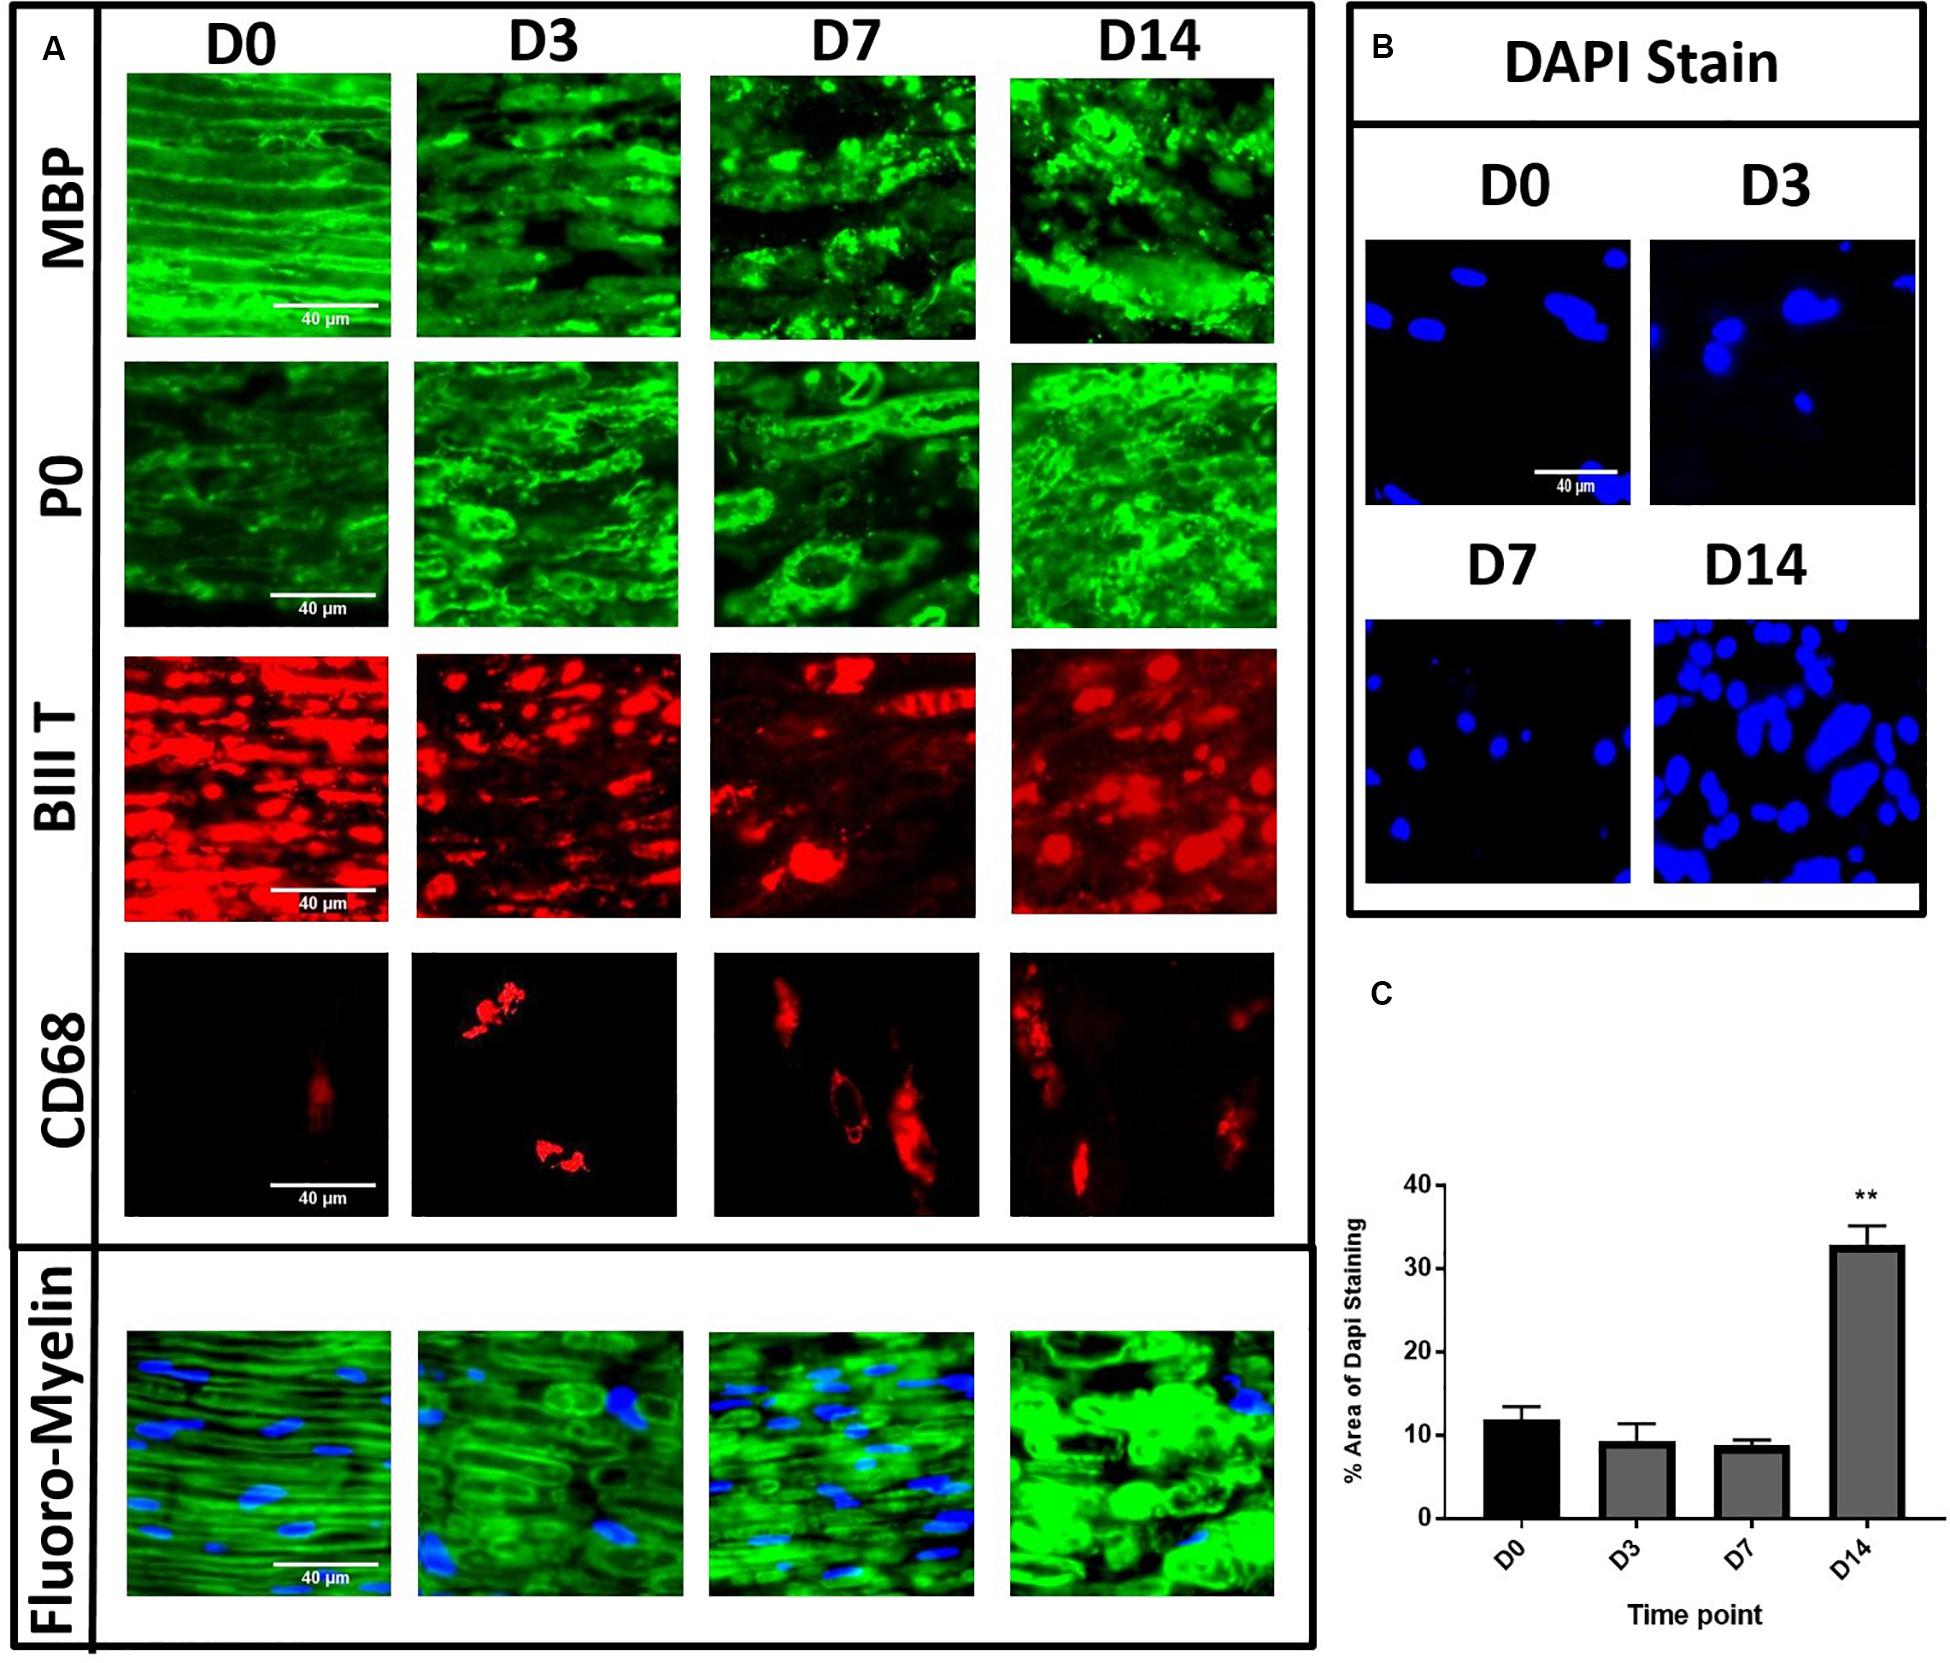
Figure 2. Immunohistochemistry of in vitro model of degeneration showing degenerative changes to both myelin lipids, myelin proteins and axons. Panel (A) showed MBP/βIIIT/P0 staining with evident degeneration at D14 and Fluoro-Myelin staining with lipid degeneration. (D0) Compact homogenous organised myelin and axons resembling normal nerve. (D3) Loosening and disorganisation of myelin with multiple discontinuity. (D7) Continued loosening and disorganisation with greater disruption of myelin structure. (D14) Consolidated mass with loss of architecture. CD68 staining with gradual increase in numbers of cells after degeneration induction. (B,C) Gradual increase of % area of DAPI staining in desheathed explants at different time points showing significant increase at D14. (D0 is control.) (**P < 0.001) Scale bar for MBP, P0, βIIIT, Fluoro-Myelin and DAPI is 40 μm. Scale bar for CD68 is 200 μm.
The in vitro Explant Model Shows Typical Immunohistochemical Features of WD
To further investigate the extent of WD in our in vitro model, we performed immunohistochemical analyses for myelin proteins, axonal structures and macrophage markers. The nerve explants were collected and fixed at different time points following in vitro WD (D0, 3, 7, and 14). Embedded nerves were cut in longitudinal sections and stained with myelin protein antibodies MBP and P0, FluoroMyelin (a non-specific stain for myelin lipids), axonal marker βIII tubulin as well as macrophage marker CD68. We observed consistent patterns of distribution of myelin and axonal structures at the different time points in three separate experiments. Healthy nerve at D0 (Figure 2A) showed compact myelin structures with complete homogeneity of the MBP and P0 staining (green), with lamellar organisation of myelin proteins and associated axons (βIII tubulin, red staining). At D3 post WD induction we observed early loosening and subtle disorganisation of both myelin lamellae (green) and corresponding axons (red) with appearance of multiple myelin discontinuity. With the progression of degeneration at D7, we found further loosening of the myelin structures and disorganisation, which progressed to a complete loss of tissue architecture at D14 post-harvest (Figure 2A). Interestingly, we noticed a progressive increase in the number of CD68 positive cells from D0 to D14, a macrophage marker, in non-desheathed nerves (Figure 2A), compared to nearly complete absence in de-sheathed nerve sections (results not shown), suggesting that macrophages only migrate within the nerve after WD is induced. Finally, we quantified the number of nuclei present in the nerve sections, stained by DAPI as an indication of cell density within the explant. The area of DAPI staining (%) in desheathed nerves was calculated from three independent experiments and showed a significant three-fold increase in the number of cells at D14 in the in vitro model (p < 0.01) compared to D0 intact nerve (Figures 2B,C).
Gene Expression Level of WD Markers Indicate Progression of Degeneration in the in vitro Model
In order to assess the efficacy of the in vitro model to recapitulate WD, gene expression for key transcription factors, SC markers, neurotrophic markers and myelin genes was performed on D0 to 7 samples of degenerating nerves.
We analysed key transcription factors for SC function. We did not observe any change in Sox10 gene expression levels after in vitro degeneration (Figure 3A). Conversely, there was significant upregulation of Cjun post WD induction, especially at D1 compared to D0 healthy nerve (*P < 0.05), although levels returned at baseline levels by D7 (Figure 3B). Oct6 and Krox20 genes were significantly and progressively downregulated with in vitro degeneration, reaching minimal levels at D7 following injury (****P < 0.0001 vs. D0) (Figures 3C,D).
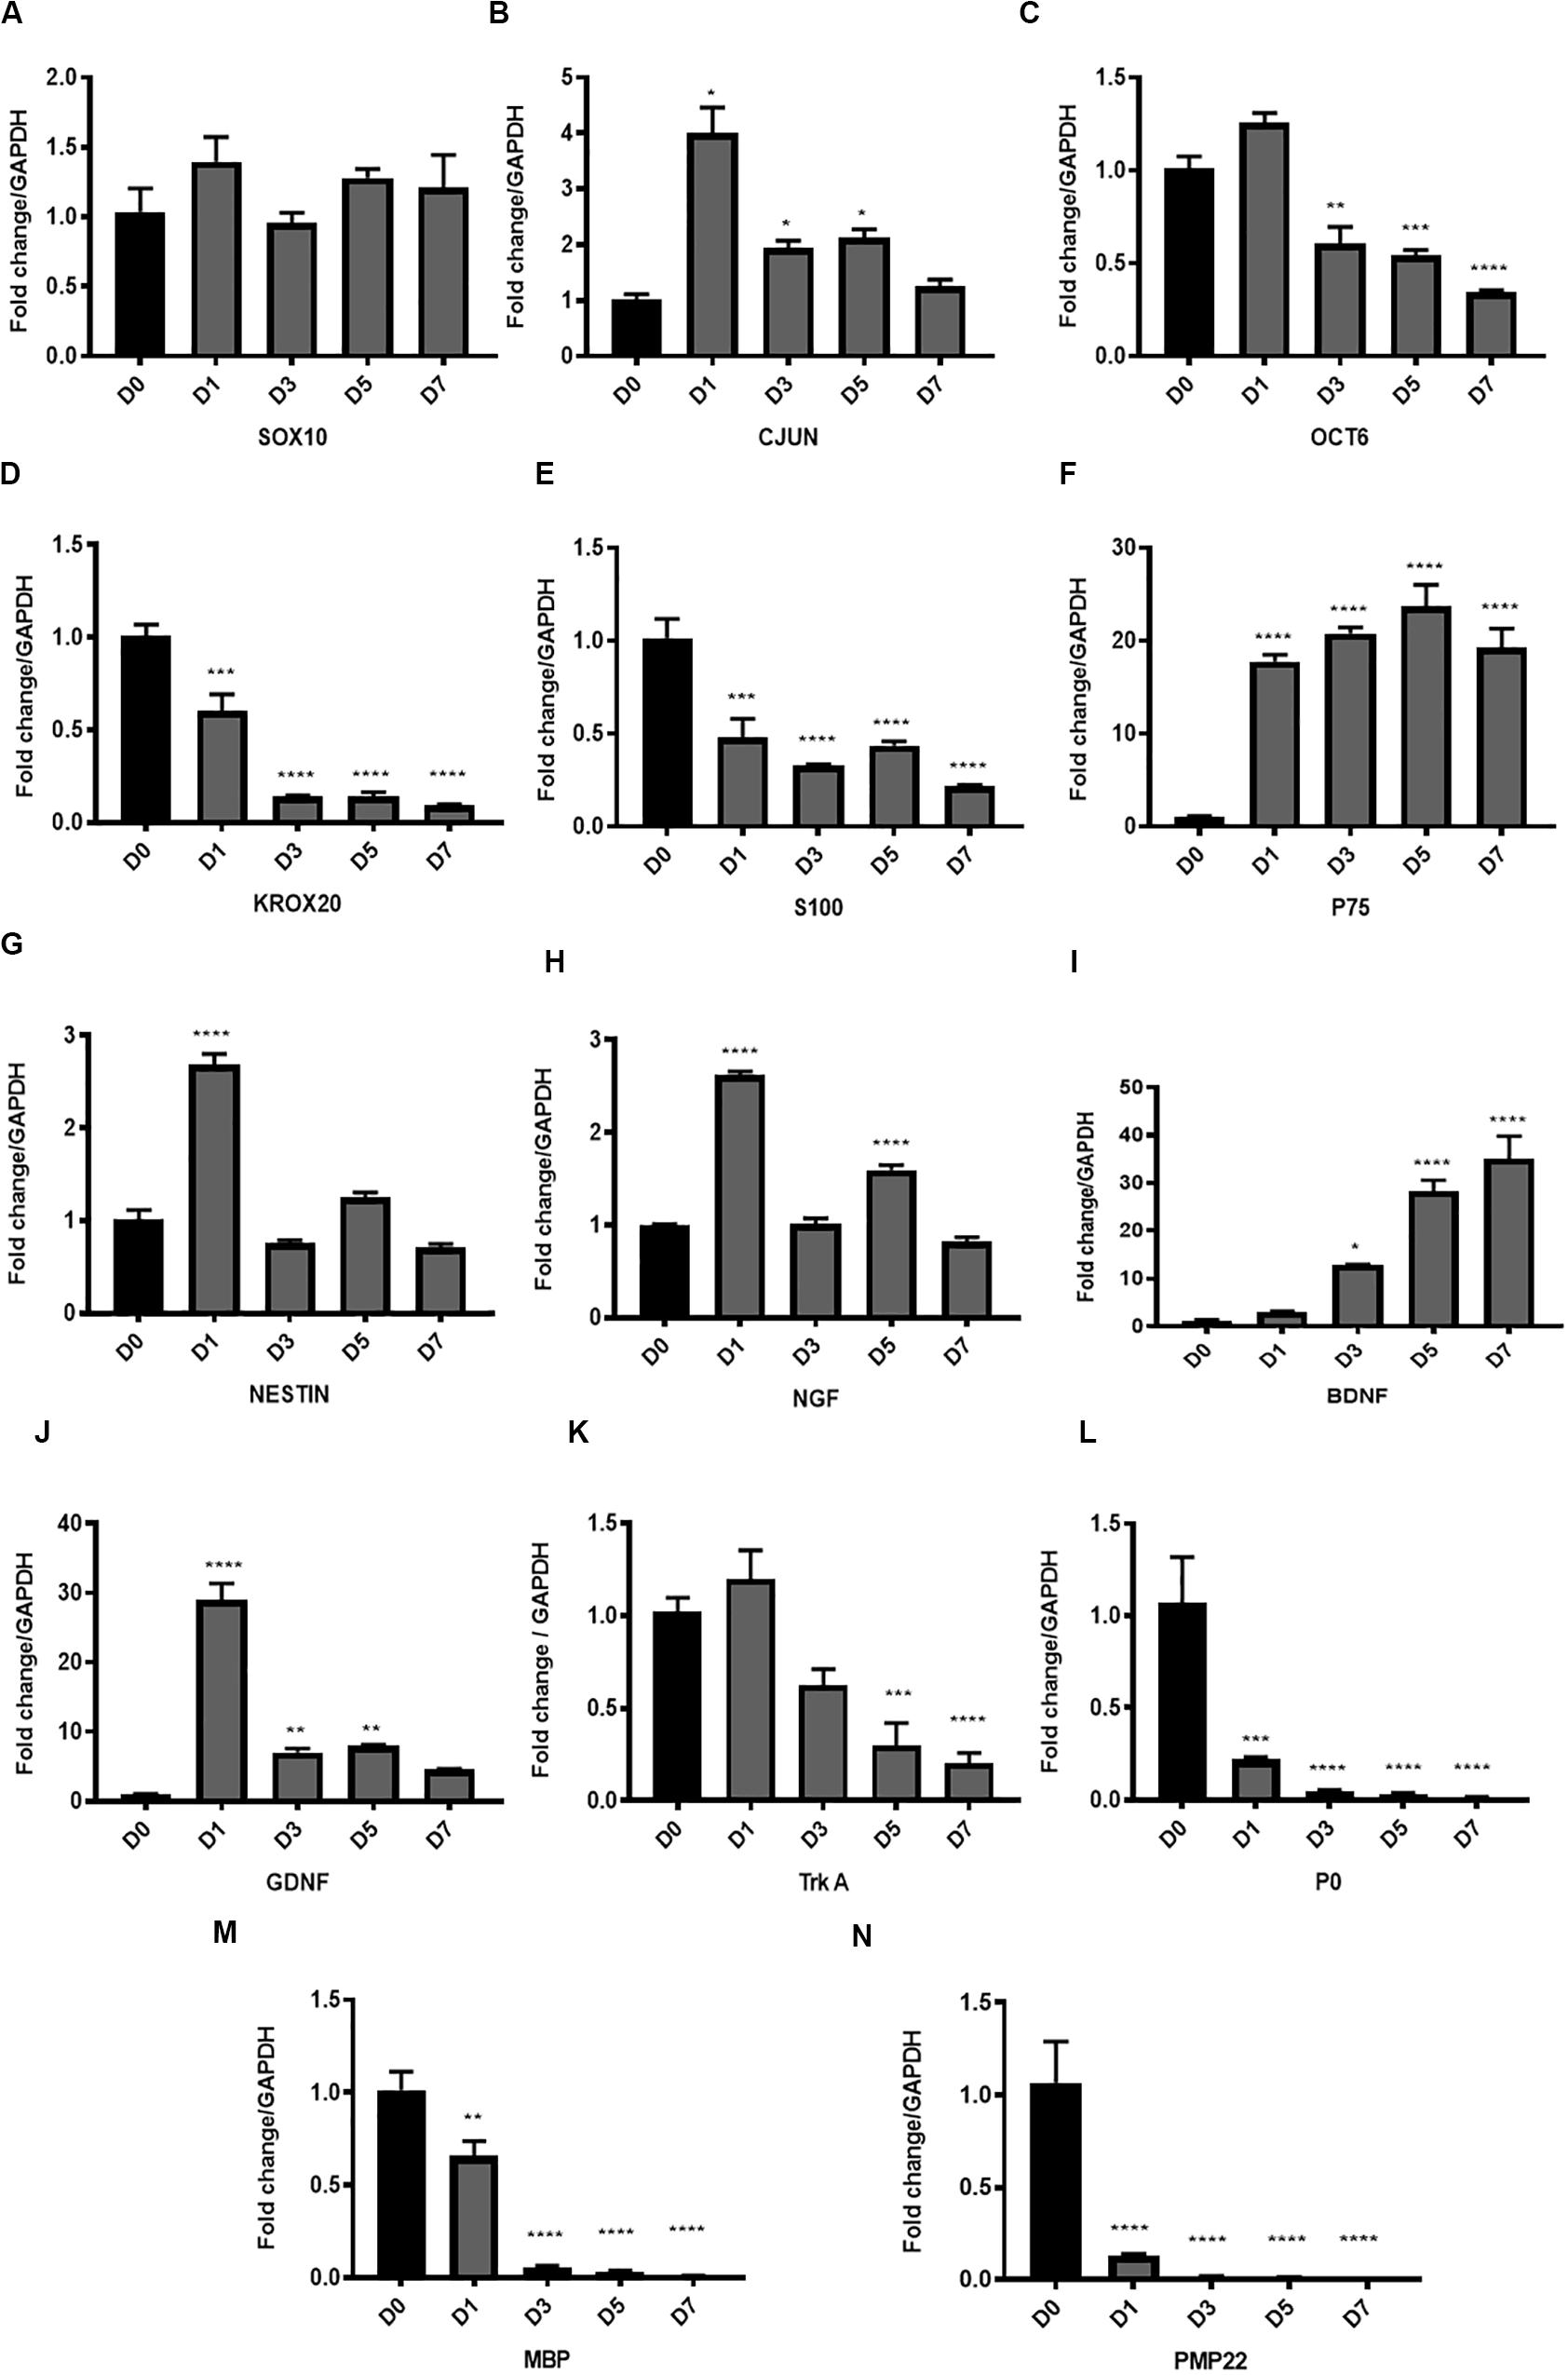
Figure 3. Gene expression of key transcription factors, Schwann cell markers, myelin proteins and neurotrophic factors in the in vitro model of Wallerian degeneration. (A) No significant change in Sox10 gene expression levels after in vitro degeneration. (B) Significant upregulation of Cjun transcription factor after injury mostly at D1 compared to D0 healthy nerve with return to baseline levels at D7. (C) Transcription factor Oct 6 expression after WD induction showed significant downregulation at D3, 5 and 7 post transection. (D) Transcription factor Krox20 showed significant progressive downregulation in its expression levels with in vitro degeneration. (E) SC marker S100 after in vitro WD showed significant downregulation relative to D0 (control healthy nerve). (F) P75 after in vitro WD showed significant persistent upregulation. (G) Neuronal marker and intermediate filament Nestin showed transient significant upregulation at D1 post-harvest followed by return to baseline levels at later time points. (H) Expression of Ngf after in vitro WD was biphasic with significant surge of its expression at D1 and D5 compared to D0 healthy nerve. (I) Neurotrophic factor Bdnf showed significant continuous upregulation after in vitro WD in later time points. (J) Neurotrophic factor Gdnf showed significant early upregulation at D1 followed by gradual reduction at D3, 5 and D7 post-harvest. (K) The Ngf receptor Trka showed gradual downregulation of its gene expression in in vitro WD reaching significant reduction at D7 compared to D0 (control healthy nerve). (L) Gene expression of P0 after WD induction showed early significant downregulation relative to D0 (control). (M) Gene expression of Mbp showed early significant downregulation relative to D0 (control). (N) Gene expression of Pmp 22 after WD induction showed significant downregulation relative to D0 (control). Data are expressed as log2 fold change in D1, 3, 5 and 7 relative to D0 healthy nerve control sample. Data is presented as mean ± SEM (error bars) by one-way ANOVA (Tukey’s multiple comparison test) (*P < 0.05, **P < 0.01, ***P < 0.001, ****P < 0.0001).
Amongst the SC markers, we found significant downregulation of S100 expression levels (***P < 0.001 and ****P < 0.0001 at D1 and D3, 5, 7, respectively, vs. D0) (Figure 3E), and significant upregulation of P75 (D0 vs. D1, 3, 5, 7, ****P < 0.0001) (Figure 3F) with progression of the degeneration. Neuronal marker and intermediate filament Nestin, showed transient significant upregulation at D1 post-harvest (****P < 0.0001), followed by return to baseline levels at later time points (Figure 3G).
The analysis of neurotrophic factors expression in our model showed upregulation of the key neurotrophins such as Ngf, Bdnf and Gdnf. Ngf expression after in vitro WD was biphasic, with significant surge of Ngf expression at D1 and D5 (****P < 0.0001) compared to D0 samples (Figure 3H). The upregulation of Bdnf was gradual during the progression of WD, and significantly higher at D3 (*P < 0.05), D5 and D7 (****P < 0.0001) post-harvest, compared to D0 healthy nerve (Figure 3I). Furthermore, Gdnf expression levels were significantly increased at the earliest time point (D1, ****P < 0.0001), and gradually declined at D3 and 5 (**P < 0.01), to finally reach baseline levels at D7, all compared to D0 healthy nerve (Figure 3J). We also analysed at Ngf receptor Trka and noticed gradual downregulation of gene expression after WD induction, with levels significantly decreased at D5 (***P < 0.001) and D7 (****P < 0.0001) compared to D0 intact nerve (Figure 3K).
Finally, the gene expression of myelin proteins P0, Pmp22 and Mbp was significantly downregulated following WD as early as the day after the harvest. Indeed, P0 expression significantly decreased at D1 following degeneration (***P < 0.001), and was almost absent at D3, 5 and 7 (****P < 0.0001) (Figure 3L). Similarly, Mbp expression levels were significantly downregulated at D1 (**P < 0.01), and nearly undetectable at D3, 5, and 7 (****P < 0.0001) (Figure 3M). In addition, expression of Pmp22 gene was significantly decreased at D1 (****P < 0.0001) and completely abolished at later time points (****P < 0.0001) (Figure 3N).
Expression Changes of Key Proteins Confirm Features of WD
To evaluate the extent to which our model recapitulates WD, we assessed the expression of some of these genes at the protein level.
We observed upregulation of both CJUN and P75 proteins after in vitro WD with levels reaching up to seven fold and six fold, respectively, at D7 compared to D0 healthy nerve (Figures 4A,B). MBP protein showed gradual downregulation resulting in approximately 50% of expression at D14, compared to D0 healthy nerve. Conversely, P0 protein expression remained constant throughout the 14 days of the in vitro WD model (Figures 4C,D). KROX 20 protein expression levels raised at D3 post-degeneration, reaching a plateau which remained constant until D14 post WD induction (Figures 4E,F). PRO-BDNF protein expression showed an opposite trend with the neurotrophin gradually downregulated starting from D3 post degeneration and reaching 60% expression at D14 compared to D0 controls (Figures 4E,F). In addition. PRO-NGF protein expression gradually decreased: interestingly, amongst the PRO-NGF isoforms, the 25 kDa variant showed the greatest decrease in expression levels at D14 post degeneration compared to D0 control (Figures 4G,H).
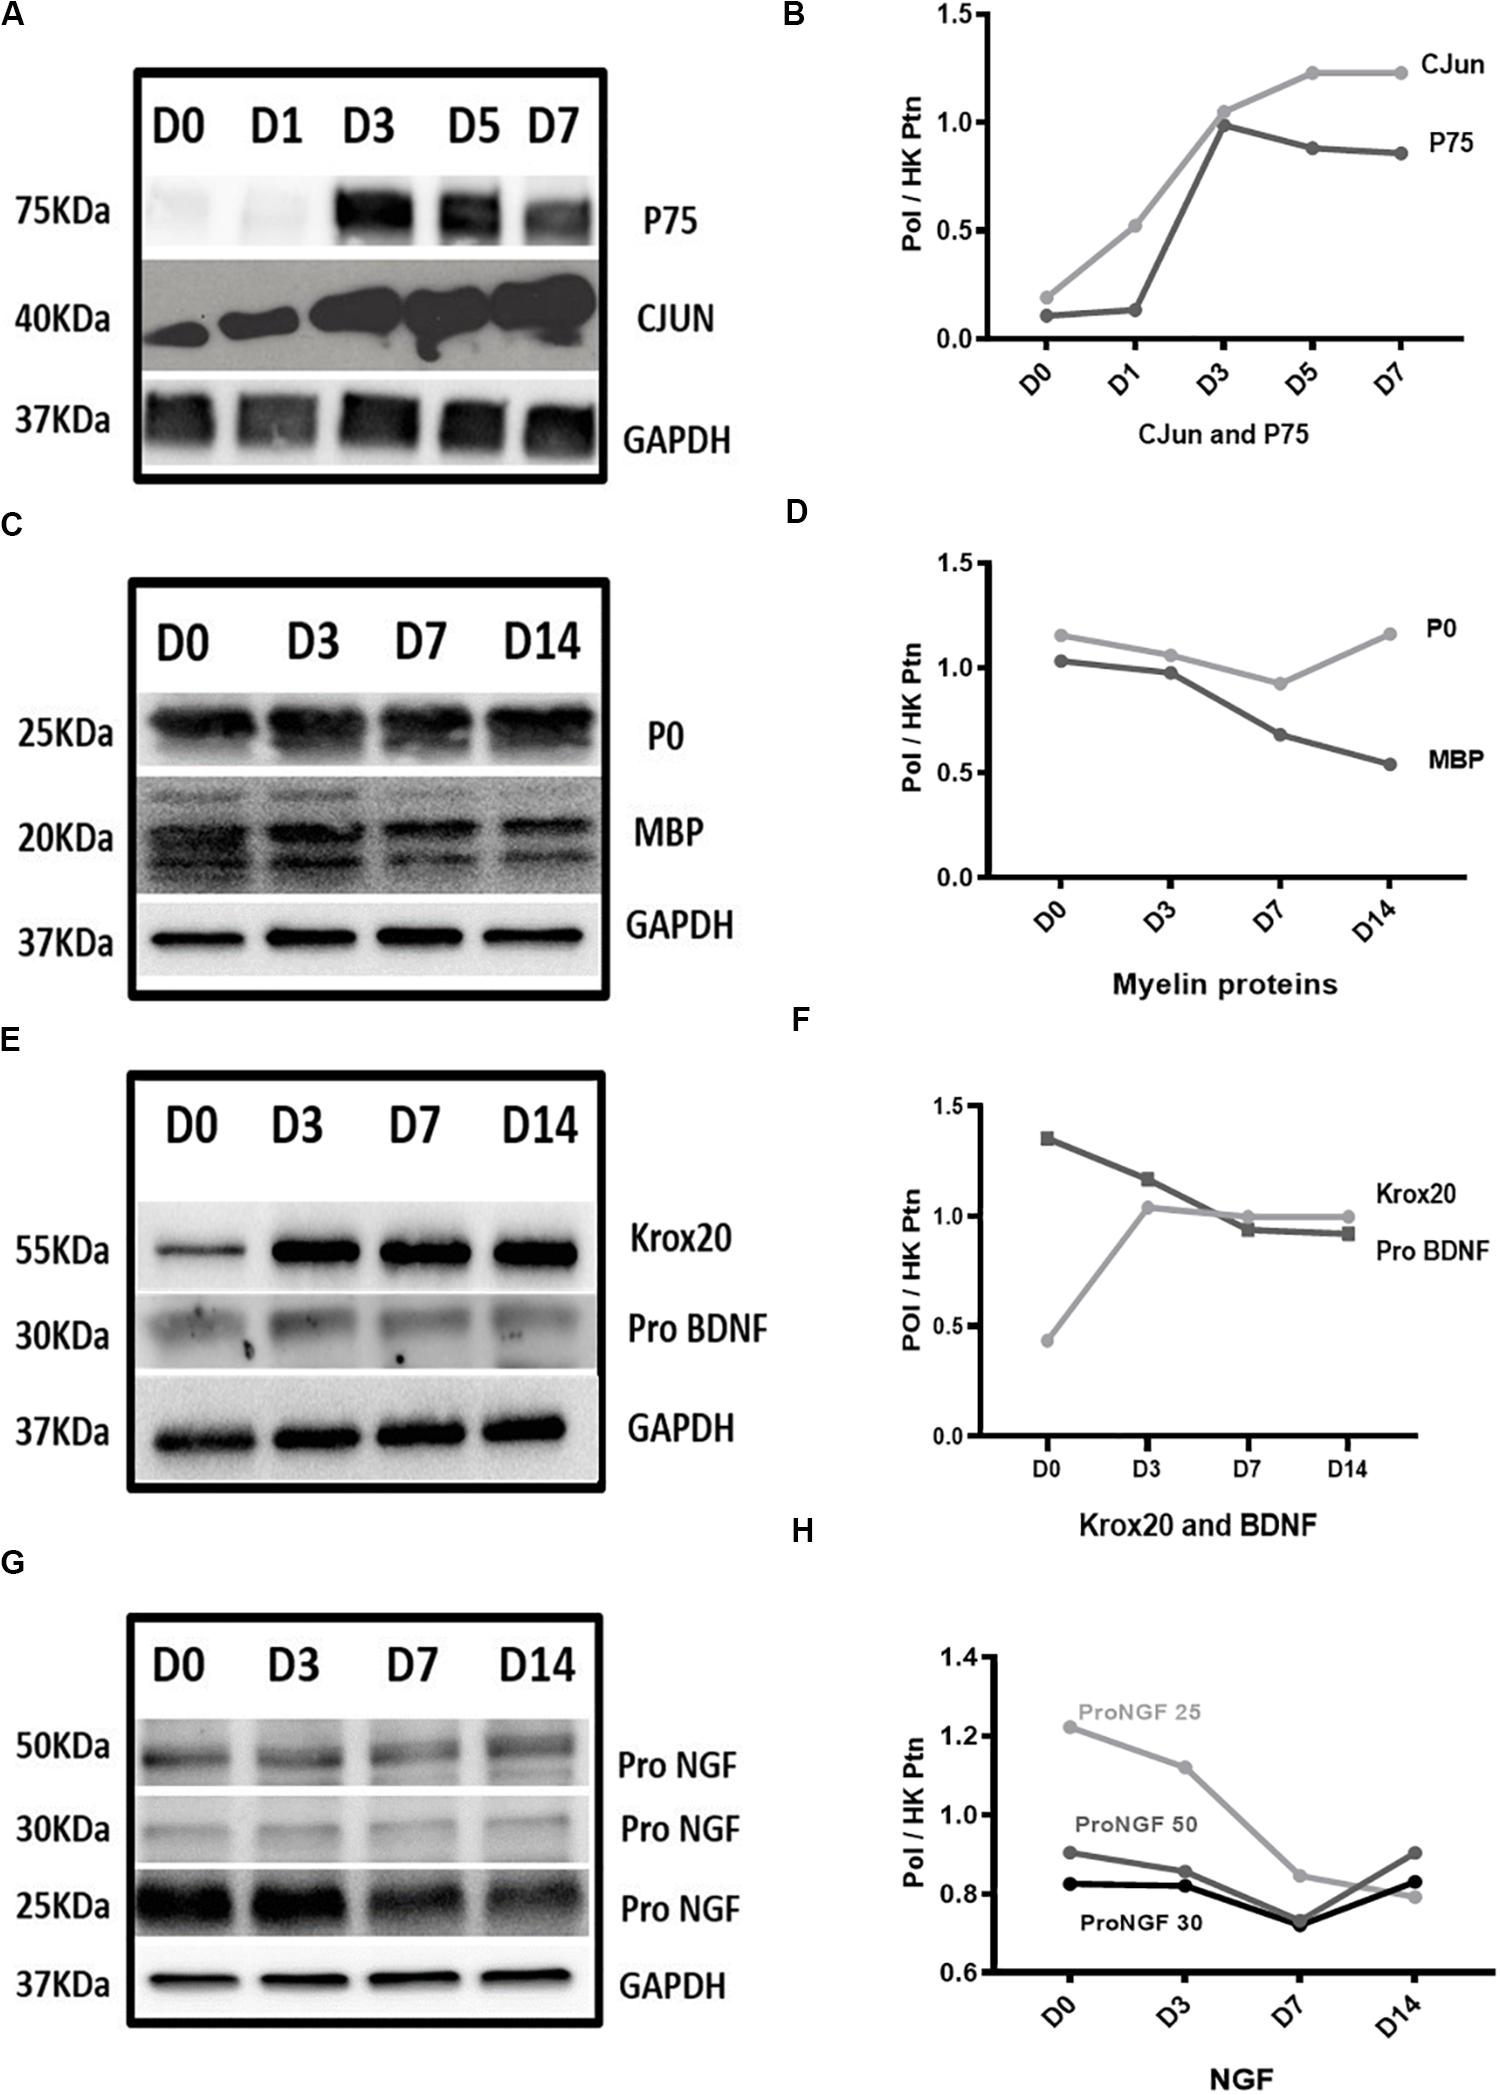
Figure 4. Protein expression results in Wallerian degeneration in vitro model. (A,B) Western blot images and graph, respectively, showed persistent upregulation of CJUN and P75 proteins after WD induction. (C,D) Western blot images and graph, respectively, showed gradual downregulation of MBP protein reaching approximately 50% of its expression at D14 and P0 remained constant throughout the 14 days of in vitro WD compared to D0 healthy nerve. (E,F) Western blot images and graph, respectively, showed upregulation of KROX20 protein at D3 post-degeneration reaching a plateau which remained constant until D14 post-degeneration. PRO-BDNF protein expression showed gradual downregulation starting from D3 post-regeneration and reaching 60% of expression at D14 compared to D0 control. (G,H) Western blot graph and image of PRO-NGF, respectively, showed gradual reduction of different isoforms gradually reaching almost the same level at D14. Data is normalised by GAPDH for each time point. (PoI) is Protein of Interest. (HK ptn) is house-keeping protein.
Assessing Novel Stem Cell Therapies With the in vitro WD Model: A Proof of Principle
To test the efficacy of our model to evaluate the potential of novel therapeutic approaches for nerve regeneration, we tested stem cell intervention with degenerating nerve explants. The nerve explants were co-cultured indirectly with AD-MSC or dASCs for 3 days; we then performed analysis of both gene and protein expression for the key markers of WD previously characterised (Figure 5).
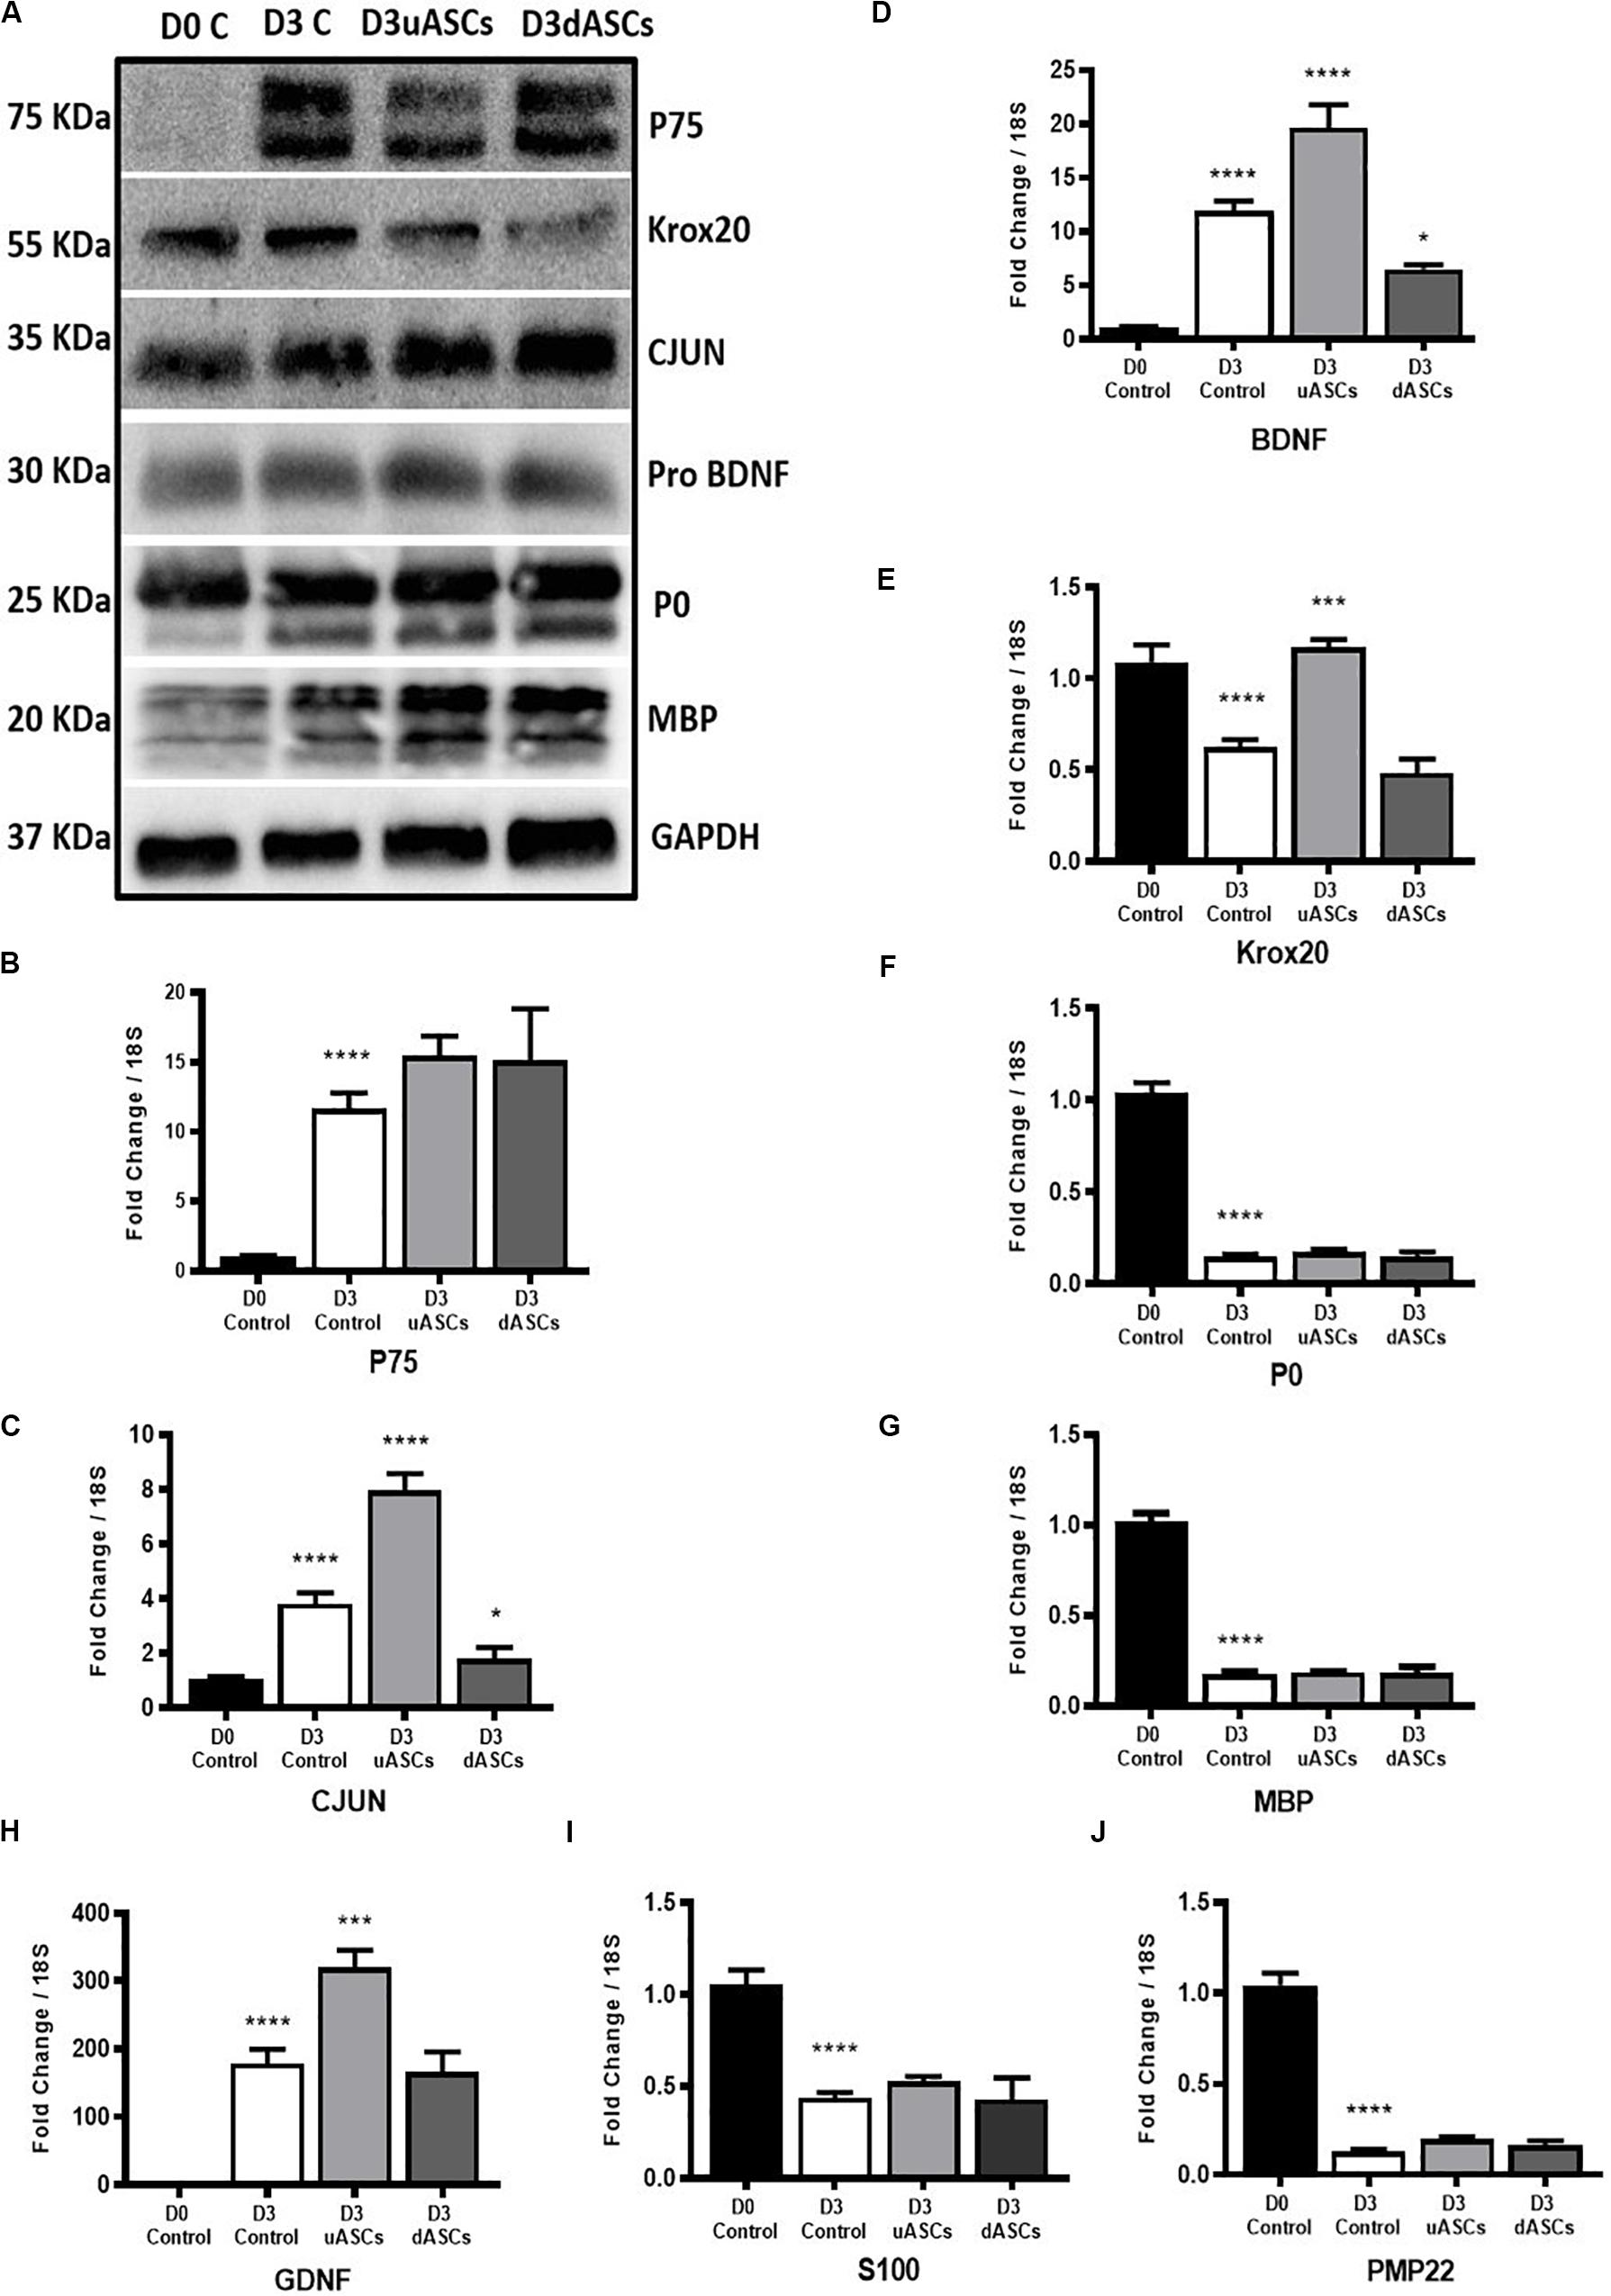
Figure 5. Gene and protein expression results of key transcription factors, Schwann cell markers, neurotrophic factors and myelin proteins of Wallerian degeneration model application. Indirect co-culture with both undifferentiated and differentiated adipose stem cells (uASCs, dASCs). (A) Protein expression of P75, KROX20, CJUN PRO-BDNF, P0 and MBP showing: an increase in the expression of P75 by five-fold at D3 without intervention and almost the same folds increase with AD-MSCs intervention compared to D0 control. An increase in expression of CJUN at D3 without intervention and continued upregulation by 30% for AD-MSCs and 50% fold for dASCs intervention compared to D0 control. Protein expression of KROX20 showing: upregulation of KROX20 at D3 without intervention with 30% and 50% downregulation at both AD-MSCs and dASCs intervention, respectively, compared to D0 control. No change in PRO-BDNF expression at D3 control, AD-MSCs and dASCs intervention compared to D0 control. Protein expression of myelin proteins showing: persistence of P0 and MBP proteins at D3 control and after stem cell intervention. (B) P75 gene expression is upregulated in all D3 groups compered to D0 control that is further potentiated with both AD-MSCs and dASCs intervention. (C) Cjun gene expression is upregulated at D3 control group and AD-MSCs intervention markedly upregulates it gene expression in uASCs and dASCs were compared regarding D3c not D0 control whereas dASCs downregulates Cjun transcripts compared to D3 control levels (D) Bdnf gene expression is upregulated in all D3 groups compared to D0 control. AD-MSCs further potentiates this upregulation while dASCs intervention supresses it compared to D3 control group. (E) Krox20 gene expression is downregulated at D3 non-interventional control group there is marginal downregulation with with dASCs intervention compared to D3 control; however, significant upregulation is noticed with AD-MSCs intervention compared to D3 control. (F) Significant downregulation of P0 gene in all D3 groups compared to D0 control (G) Significant downregulation of Mbp gene in all D3 groups compared to D0 control. (H) The Gdnf gene is upregulated in all D3 groups compared to D0 control. Relative to D3 non-interventional control, AD-MSCs upregulates Gdnf levels but no effect is observed in the dASCs group. (I) S100 gene expression is significantly downregulated to roughly about the same degree in nerves in all D3 groups compared to D0 control. (J) Pmp22 gene expression is significantly downregulates in all D3 groups compared to D0 control. Gene data is presented as mean ± SEM (error bars) by one-way ANOVA (Tukey’s multiple comparison test) (*P < 0.05, **P < 0.01, ***P < 0.001, ****P < 0.0001).
We confirmed upregulation of P75 gene/protein following 3 days of WD (****P < 0.0001), compared to D0 (control); nevertheless, AD-MSC and dASC intervention only marginally increased P75 expression at the gene level compared to D3 control (Figure 5B), and did not seem to affect protein levels (Figure 5A). Expression of Cjun gene was also significantly upregulated at D3 of WD (****P < 0.0001) compared to D0 (control); AD-MSC intervention further increased the gene expression of Cjun (P < 0.0001), whereas dASCs contributed to a downregulation of the Cjun transcripts to D3 control levels (*P < 0.05, Figure 5C). At protein levels, we observed upregulation of CJUN in all D3 groups, with a 50% increase in the dASCs groups compared to D0 control (Figure 5A). Similarly, Bdnf gene expression is significantly increased following WD compared to D0 (****P < 0.0001), further upregulated by co-culture with AD-MSC (****P < 0.0001), but significantly decreased following dASCs intervention compared to D3 control (*P < 0.05, Figure 5D). On the other hand, the levels of expression of PRO-BDNF proteins were largely unaltered in all experimental groups (Figure 5A).
As shown during baseline characterisation of the in vitro model, we confirmed that Krox20 gene expression is significantly downregulated following WD (****P < 0.0001), whereas protein levels are increased at D3 (Figures 5A,E). AD-MSC intervention caused a significant upregulation of Krox20 transcript compared to D3 control (***P < 0.001) which did not translate to an increase in protein levels (Figures 5A,E). Conversely, co-culture to dASC did not significantly alter gene expression levels of Krox20, which was comparable to D3 control (Figures 5A,E). All myelin genes were found to be downregulated following the in vitro degeneration, and stem cell interventions did not alter the gene expression levels (Figures 5F,G,J for P0, Mbp and Pmp22, respectively). This was not the case at protein level, where expression of P0 and MBP was sustained despite in vitro WD and AD-MSC/dASCs intervention (Figure 5A). We confirmed the increase in Gdnf gene expression at D3 post WD (****P < 0.0001) with further significant upregulation in the AD-MSC co-culture group compared to D3 control (***P < 0.001, Figure 5H), but no effect was observed in the dASCs group. The gene expression levels of the SC marker S100 showed significant decline at D3 control and no changes after AD-MSC/dASC intervention compared to D3 control (Figure 5I).
Discussion
The vast majority of scientific endeavour in the field of peripheral nerve injury focuses on the regenerative response of nerves, including stem cell interventions. Given that efficient degeneration of the distal stump is a prerequisite for regeneration, it is an important target for interventions aimed at improving nerve regeneration outcomes. Studies on WD have predominantly been performed in vivo which incorporates the local response of SCs and resident macrophages with the more complex systemic pathophysiological immune response following injury. Establishing a model for WD, in which the immune response and other systemic influences are excluded is appealing because such a model would permit the exploration of novel therapies such as stem cell intervention, in higher throughput in vitro systems and focus on local effects which can otherwise be lost. Although the concept of using nerve segments in vitro as a representative of WD model was adopted previously, the cut nerve segments were allowed to degenerate in vitro for only 48 h without characterisation; moreover, the nerves were not de-sheathed, a condition that allows cells other than SCs to engage in the degenerative response and influences the cell population being characterised (Fex Svenningsen and Kanje, 1998). In this work, we have characterised an in vitro model of WD allowing better understanding of the biological changes that take place within the nerve without systemic influence. Our model clearly demonstrates histoarchitectural degeneration and gene/protein expressions in keeping with significant degeneration of the nerve and switching on of the SC regenerative response. In addition, as a proof of principle, we have used the model to study the effect of AD-MSC intervention in WD. Day 3 was selected for study of this intervention for two reasons: (i) many of the WD events are underway with morphological and molecular changes clearly evidenced in our model; and (ii) it is hypothesised that the impact of stem cell intervention is likely to be early before the onset of transplanted cell death.
Transcription Factors
Our in vitro model identified early and persistent upregulation of CJUN protein after injury. There is strong evidence that the transcription factor CJUN is a key reprogramming factor modulating the activity of repair SCs (Parkinson et al., 2008; Glenn and Talbot, 2013; Boerboom et al., 2017). CJUN drives increase in the expression levels of a multitude of trophic factors that are necessary for nerve regeneration acting both directly, such as GDNF and artemin, and indirectly, BDNF and NGF (Fontana et al., 2012). Gene ontology analyses have shown that Cjun modulates the expression of 172 genes, all involved in neuronal growth and regeneration (Arthur-Farraj et al., 2012). In our in vitro model of WD Cjun gene expression is upregulated at day 1 post injury but returns to normal over the 7 day time course; however, its levels are sufficient to induce persistent elevation of its protein levels which is the ultimate goal to trigger its cascade of influence in particular negative regulation of myelination and upregulation of neurotrophic factors. It is worth mentioning that upregulation of CJUN after nerve injury has been recently observed in human degenerating nerves, an observation that is comparable to our rodent in vitro model (Wilcox et al., 2020).
Mature SCs constitutively express SOX10 (Britsch et al., 2001; Jessen and Mirsky, 2019) which maintains expression of ErbB3 receptors for NRG1 and regulates Oct 6 and Krox20 in controlling myelination (Pereira et al., 2012). Whilst Sox10 gene expression levels are unchanged following injury, our in vitro model demonstrates that this regulatory pathway is interrupted after nerve injury leading to a dramatic decrease in the level of both Oct6 and Krox20 genes across all time points after nerve injury induction. Although KROX20 protein is present at D14, the changes in gene expression of these transcriptional factors are in line with in vivo models of WD (Jessen and Arthur-Farraj, 2019). The accumulated KROX20 protein in our model may be attributed to the lack of systemic inflammatory response that enhances the capability SCs to remove cell debris and non-functioning proteins. Furthermore, the expression of S100, a pan SC marker, is rapidly reduced and does not return for at least 7 days in our model and in previous in vivo models (Perez and Moore, 1968). Together, the expression patterns of these key SC mediators confirms the reliability of our model to be used as a simulator to the previously described in vivo models of WD.
With the intervention of human AD-MSC to the in vitro WD model system, we noticed a promising effect of human dASCs increasing the upregulation of CJUN protein to 1.5-fold increase at D3 compared to D3 control; and downregulation of both gene and protein expression of KROX20. This significant enhancement of transcriptional control could result in a rapid switch off of pro-myelinating pathways which may result in a more rapid deployment in greater scale of the ‘repair’ SCs in their critical roles in WD.
Neurotrophic Factors
Our in vitro WD model produces neurotrophic factor expression largely in keeping with that observed in in vivo models of injury. SCs upregulate neurotrophic factor expression and their cell surface receptors to prevent the death of injured neurons and stimulate axonal regeneration (Jessen and Arthur-Farraj, 2019).
In keeping with gene expression changes in our model, Bdnf expression has been demonstrated to increase up to 28 days post rat sciatic nerve transection (Meyer et al., 1992; Funakoshi et al., 1993); Gdnf upregulated progressively to day 7 post injury (Naveilhan et al., 1997); Ngf had a biphasic pattern of upregulation after nerve injury with a rapid surge within 6 h followed by sharp decrease and subsequent increase again by day 3 with persistent elevation up to 14 days post transection (Heumann et al., 1987a; Meyer et al., 1992); and upregulation of the neurotrophin receptor P75ntr (You et al., 1997; Boyd and Gordon, 2003). It is difficult to compare the temporal relationship of these models too precisely with our own given the nature of the injury differs from crush to single cut as opposed to our own double level transection; however, it is clear that the systemic immune response to injury will play an important role in neurotrophic factor expression, in particular Ngf via IL-1β. Macrophage invasion occurs 3 days after injury which is correlated with the second surge of Ngf levels in the in vivo model. This observation is further accredited in vitro by addition of macrophages or IL-1β (Heumann et al., 1987b). However, in our model SCs achieved a delayed second surge of Ngf gene expression at day 5 without the systemic inflammatory triggers.
Protein expression of the neurotrophic growth factors in our model decreases over time which is likely as a result of increased growth factor secretion, although we did not measure this directly. NGF protein has different isoforms with distinct molecular weights and is secreted as a PRO-NGF precursor biologically active on differing tissues (Fahnestock et al., 2004). PRO-NGF 25 protein expression was most significantly depleted in our model over 14 days post WD induction implying gradual secretion of this mature NGF. It is also notable that the P75 receptor increases by day 3 and remains at this level for at least 7 days.
AD-MSC have the ability to improve neurite outgrowth in vitro and in vivo which is likely as a result of neurotrophic factor expression (Faroni et al., 2014; Kingham et al., 2014). In our in vitro WD model, the upregulation of Bdnf and Gdnf in SCs was significantly greater after co-culture with AD-MSC than compared to control degenerated nerve explants at D3. This provides further evidence that AD-MSC can potentiate SCs into a regenerative phenotype. Interestingly, dASC failed to produce this response in SCs which may be attributable to the de-differentiation of dASC following growth factor withdrawal (Faroni et al., 2016).
Myelin Features in Our in vitro Model
Following peripheral nerve injury, the adaptive injury response triggered in SCs results in loss of axonal contact and myelin maintenance is switched to clearance initiated by SC myelinophagy (Gomez-Sanchez et al., 2015; Jang et al., 2016). In accordance with this, myelin protein gene (P0, Mbp and Pmp22) expression was switched off and there was progressive morphological disorganisation and degradation of myelin protein and lipid structures following injury in our in vitro WD model.
Using TEM and immunohistochemistry on the injured nerve in vitro over 2 weeks, we noted the early appearance of multiple vacuoles and myelin lamellae collapse, followed by axonal degeneration and complete myelin disorganisation in keeping with previous findings (Johannessen, 1979; King, 1999; Kidd et al., 2013); however, myelin debris persisted in our model and this may be an important attribute to explore further because myelin debris inhibits pathways for axonal regeneration (Boerboom et al., 2017). SCs work in combination with resident and haematogenous macrophages toward myelinophagy, an active macro-autophagic process induced by SCs after injury (Gomez-Sanchez et al., 2015; Jang et al., 2016). In non-desheathed nerves, we noted an increase in CD68 staining for macrophages at days 7 and 14. These are presumed to be epineurium resident macrophages responding to the inflammatory process initiated by repair SCs although the systemic response describes invasion of macrophages by day 3 (Mueller et al., 2001). In our desheathed model, however, the epineurium is removed which likely removes the majority of resident macrophages although internal connective tissue structure is maintained. The persistence of myelin proteins at 14 days reveals one significant difference between our model and other systems either in vivo or the culture of dissociated SCs in which myelin degradation occurs (Gomez-Sanchez et al., 2015).
The importance of the systemic immune response in particular macrophages has been described as mandatory for complete and effective WD and myelin clearance (Scheidt et al., 1986). In a model of in vivo WD in which the mouse nerve explants were embedded in chambers with differential pore sizes to permit or exclude immune cells. Nerves exposed to macrophages and leucocytes permitted complete degeneration of myelin, whilst the lack of immune cells resulted in persistent myelin debris at 28 days. Furthermore, SCs secrete and activate pro-inflammatory markers after WD induction, such as TNFα and interleukin which lead to disturbance of the blood nerve barrier and allow monocytes and haematogenous macrophages to reach the field (Gaudet et al., 2011). Toll like receptors (TLRs) are expressed on the surface of SCs after injury and full knockout of TLRs in injured nerve leads to retardation in myelin clearance and macrophage recruitment (Chen et al., 2015). We can conclude that our in vitro model, in which there is no systemic inflammatory or immune response to aid SCs in myelinophagy, succeeded in early myelin collapse and breakdown but failed to achieve myelin clearance. There is promising pharmaceutical research targeting WD in many disorders of the central and peripheral nervous system (Coleman and Hoke, 2020). This leaves the in vitro WD model open to controlled manipulation of the key immune players in an in vitro system; in addition to the investigation of interventions such as pharmaceutical agents and stem cells to activate or inhibit autophagy machinery in SCs.
Data Availability Statement
All datasets presented in this study are included in the article/supplementary material.
Ethics Statement
The studies involving human participants were reviewed and approved by National Research Ethics Committee (NRES 13/SC/0499). The patients/participants provided their written informed consent to participate in this study. Ethical review and approval was not required for the animal study because only ex vivo animal tissue was used. All the animal work was performed in accordance with the UK Animal Scientific Procedures Act 1986.
Author Contributions
HbE, AF, MA, JO, and LW performed all studies and analysis. HbE, HsE, MM, AZ, and AR conceived of the study and drafted the manuscript. All authors read and approved the final manuscript.
Funding
HbE has been supported by a scholarship programme, under the Newton Mosharafa Fund partnership. The grant was funded by the UK Department for Business, Energy and Industrial Strategy and Central Department of Missions and delivered by the British Council. AF and AR are supported by the Hargreaves and Ball Trust and the Academy of Medical Sciences (AMS-SGCL7).
Conflict of Interest
The authors declare that the research was conducted in the absence of any commercial or financial relationships that could be construed as a potential conflict of interest.
The reviewer VM declared a past co-authorship with one of the authors AF to the handling Editor.
Acknowledgments
Thank you to Mr. Jonathan Duncan, Miss Siobhan O’Ceallaigh (Consultant Plastic Surgeons) and their patients at Wythenshawe Hospital, Manchester University NHS Foundation Trust for donation of adipose tissue. The authors would like to thank Acorda Therapeutics for kindly supplying us with recombinant GGF-2 for use in this study.
Abbreviations
AD-MSCs, adipose derived mesenchymal stem cells; aMEM, alpha-modified minimum essential Eagle’s medium; BDNF, brain derived neurotropic factor; DAPI, 4’,6-diamidino-2-phenylindole; dASCs, differentiated adipose stem cells; DMEM, glucose Dulbecco’s Modified Eagle’s medium; FBS, foetal bovine serum; GAPDH, glyceraldehyde 3-phosphate dehydrogenase; GDNF, glial derived neurotropic factor; HBSS, Hanks balanced salt solution; IHC, immunohistochemistry; MBP, myelin basic protein; NGF, nerve growth factor; OCT, optimum cutting temperature; P0, myelin protein zero; PBS, phosphate-buffered saline; PCR, polymerase chain reaction; PFA, paraformaldehyde; PMP22, peripheral myelin protein 22; RNA, ribonucleotide acid; RT, room temperature; SCs, Schwann cells; SVF, stromal vascular fraction; TEM, transmission electron microscope; TLRs, toll like receptors; WD, Wallerian degeneration.
References
Arthur-Farraj, P. J., Latouche, M., Wilton, D. K., Quintes, S., Chabrol, E., Banerjee, A., et al. (2012). c-Jun reprograms schwann cells of injured nerves to generate a repair cell essential for regeneration. Neuron 75, 633–647. doi: 10.1016/j.neuron.2012.06.021
Boerboom, A., Dion, V., Chariot, A., and Franzen, R. (2017). Molecular mechanisms involved in schwann cell plasticity. Front. Mol. Neurosci. 10:38. doi: 10.3389/fnmol.2017.00038
Boyd, J. G., and Gordon, T. (2003). Neurotrophic factors and their receptors in axonal regeneration and functional recovery after peripheral nerve injury. Mol. Neurobiol. 27, 277–324. doi: 10.1385/mn:27:3:277
Britsch, S., Goerich, D. E., Riethmacher, D., Peirano, R. I., Rossner, M., Nave, K. A., et al. (2001). The transcription factor Sox10 is a key regulator of peripheral glial development. Genes Dev. 15, 66–78. doi: 10.1101/gad.186601
Chen, P., Piao, X., and Bonaldo, P. (2015). Role of macrophages in Wallerian degeneration and axonal regeneration after peripheral nerve injury. Acta Neuropathol. 130, 605–618. doi: 10.1007/s00401-015-1482-4
Coleman, M. P., and Hoke, A. (2020). Programmed axon degeneration: from mouse to mechanism to medicine. Nat. Rev. Neurosci. 21, 183–196. doi: 10.1038/s41583-020-0269-3
Dezawa, M., Takahashi, I., Esaki, M., Takano, M., and Sawada, H. (2001). Sciatic nerve regeneration in rats induced by transplantation of in vitro differentiated bone-marrow stromal cells. Eur. J. Neurosci. 14, 1771–1776. doi: 10.1046/j.0953-816x.2001.01814.x
Dubovy, P. (2011). Wallerian degeneration and peripheral nerve conditions for both axonal regeneration and neuropathic pain induction. Ann. Anat. Anatomisch. Anzeig. 193, 267–275. doi: 10.1016/j.aanat.2011.02.011
Fahnestock, M., Yu, G., and Coughlin, M. D. (2004). Prongf: a neurotrophic or an apoptotic molecule? Prog. Brain Res. 146, 101–110. doi: 10.1016/s0079-6123(03)46007-x
Faroni, A., Smith, R. J., Lu, L., and Reid, A. J. (2016). Human schwann-like cells derived from adipose-derived mesenchymal stem cells rapidly de-differentiate in the absence of stimulating medium. Eur. J. Neurosci. 43, 417–430. doi: 10.1111/ejn.13055
Faroni, A., Smith, R. J., and Reid, A. J. (2014). Adipose derived stem cells and nerve regeneration. Neural Regen. Res. 9, 1341–1346.
Faroni, A., Terenghi, G., and Reid, A. J. (2013). Adipose-derived stem cells and nerve regeneration: promises and pitfalls. Int. Rev. Neurobiol. 108, 121–136. doi: 10.1016/b978-0-12-410499-0.00005-8
Fex Svenningsen, A., and Kanje, M. (1998). Regulation of Schwann cell proliferation in cultured segments of the adult rat sciatic nerve. J. Neurosci. Res. 52, 530–537. doi: 10.1002/(sici)1097-4547(19980601)52:5<530::aid-jnr5>3.0.co;2-d
Fontana, X., Hristova, M., Da Costa, C., Patodia, S., Thei, L., Makwana, M., et al. (2012). c-Jun in Schwann cells promotes axonal regeneration and motoneuron survival via paracrine signaling. J. Cell Biol. 198, 127–141. doi: 10.1083/jcb.201205025
Funakoshi, H., Frisen, J., Barbany, G., Timmusk, T., Zachrisson, O., Verge, V. M., et al. (1993). Differential expression of mrnas for neurotrophins and their receptors after axotomy of the sciatic nerve. J. Cell Biol. 123, 455–465. doi: 10.1083/jcb.123.2.455
Gaudet, A. D., Popovich, P. G., and Ramer, M. S. (2011). Wallerian degeneration: gaining perspective on inflammatory events after peripheral nerve injury. J. Neuroinflamm. 8:110. doi: 10.1186/1742-2094-8-110
Glenn, T. D., and Talbot, W. S. (2013). Signals regulating myelination in peripheral nerves and the Schwann cell response to injury. Curr. Opin. Neurobiol. 23, 1041–1048. doi: 10.1016/j.conb.2013.06.010
Gomez-Sanchez, J. A., Carty, L., Iruarrizaga-Lejarreta, M., Palomo-Irigoyen, M., Varela-Rey, M., Griffith, M., et al. (2015). Schwann cell autophagy, myelinophagy, initiates myelin clearance from injured nerves. J. Cell Biol. 210, 153–168. doi: 10.1083/jcb.201503019
Heumann, R., Korsching, S., Bandtlow, C., and Thoenen, H. (1987a). Changes of nerve growth factor synthesis in nonneuronal cells in response to sciatic nerve transection. J. Cell Biol. 104, 1623–1631. doi: 10.1083/jcb.104.6.1623
Heumann, R., Lindholm, D., Bandtlow, C., Meyer, M., Radeke, M. J., Misko, T. P., et al. (1987b). Differential regulation of mrna encoding nerve growth factor and its receptor in rat sciatic nerve during development, degeneration, and regeneration: role of macrophages. Proc. Natl. Acad. Sci. U.S.A. 84, 8735–8739. doi: 10.1073/pnas.84.23.8735
Jang, S. Y., Shin, Y. K., Park, S. Y., Park, J. Y., Lee, H. J., Yoo, Y. H., et al. (2016). Autophagic myelin destruction by Schwann cells during wallerian degeneration and segmental demyelination. Glia 64, 730–742. doi: 10.1002/glia.22957
Jessen, K. R., and Arthur-Farraj, P. (2019). Repair Schwann cell update: adaptive reprogramming, Emt, and stemness in regenerating nerves. Glia 67, 421–437. doi: 10.1002/glia.23532
Jessen, K. R., and Mirsky, R. (2019). Schwann cell precursors; multipotent glial cells in embryonic nerves. Front. Mol. Neurosci. 12:69. doi: 10.3389/fnmol.2017.00069
Kidd, G. J., Ohno, N., and Trapp, B. D. (2013). Biology of Schwann cells. Handb. Clin. Neurol. 115, 55–79.
Kingham, P. J., Kalbermatten, D. F., Mahay, D., Armstrong, S. J., Wiberg, M., and Terenghi, G. (2007). Adipose-derived stem cells differentiate into a Schwann cell phenotype and promote neurite outgrowth in vitro. Exper. Neurol. 207, 267–274. doi: 10.1016/j.expneurol.2007.06.029
Kingham, P. J., Reid, A. J., and Wiberg, M. (2014). Adipose-derived stem cells for nerve repair: hype or reality? Cells Tissues Organs. 200, 23–30. doi: 10.1159/000369336
Meyer, M., Matsuoka, I., Wetmore, C., Olson, L., and Thoenen, H. (1992). Enhanced synthesis of brain-derived neurotrophic factor in the lesioned peripheral nerve: different mechanisms are responsible for the regulation of Bdnf and Ngf mrna. J. Cell Biol. 119, 45–54. doi: 10.1083/jcb.119.1.45
Mueller, M., Wacker, K., Ringelstein, E. B., Hickey, W. F., Imai, Y., and Kiefer, R. (2001). Rapid response of identified resident endoneurial macrophages to nerve injury. Am. J. Pathol. 159, 2187–2197. doi: 10.1016/s0002-9440(10)63070-2
Naveilhan, P., Elshamy, W. M., and Ernfors, P. (1997). Differential regulation of mrnas for Gdnf and its receptors Ret and Gdnfr alpha after sciatic nerve lesion in the mouse. Eur. J. Neurosci. 9, 1450–1460. doi: 10.1111/j.1460-9568.1997.tb01499.x
Palispis, W. A., and Gupta, R. (2017). Surgical repair in humans after traumatic nerve injury provides limited functional neural regeneration in adults. Exp. Neurol. 290, 106–114. doi: 10.1016/j.expneurol.2017.01.009
Parkinson, D. B., Bhaskaran, A., Arthur-Farraj, P., Noon, L. A., Woodhoo, A., Lloyd, A. C., et al. (2008). c-Jun is a negative regulator of myelination. J. Cell Biol. 181, 625–637. doi: 10.1083/jcb.200803013
Pereira, J. A., Lebrun-Julien, F., and Suter, U. (2012). Molecular mechanisms regulating myelination in the peripheral nervous system. Trends Neurosci. 35, 123–134. doi: 10.1016/j.tins.2011.11.006
Perez, V. J., and Moore, B. W. (1968). Wallerian degeneration in rabbit tibial nerve: changes in amounts of the S-100 protein. J. Neurochem. 15, 971–977. doi: 10.1111/j.1471-4159.1968.tb11640.x
Rotshenker, S. (2011). Wallerian degeneration: the innate-immune response to traumatic nerve injury. J. Neuroinflamm. 8:109. doi: 10.1186/1742-2094-8-109
Scheidt, P., Waehneldt, T. V., Beuche, W., and Friede, R. L. (1986). Changes of myelin proteins during Wallerian degeneration in situ and in millipore diffusion chambers preventing active phagocytosis. Brain Res. 379, 380–384. doi: 10.1016/0006-8993(86)90795-x
Wilcox, M. B., Laranjeira, S. G., Eriksson, T. M., Jessen, K. R., Mirsky, R., Quick, T. J., et al. (2020). Characterising cellular and molecular features of human peripheral nerve degeneration. Acta Neuropathol. Commun. 8:51.
Keywords: Wallerian degeneration, Schwann cells, nerve injury, myelin degradation, neurotrophic factors, in vitro model, adipose-derived mesenchymal stem cells
Citation: Elsayed H, Faroni A, Ashraf MR, Osuji J, Wunderley L, Zhang L, Elsobky H, Mansour M, Zidan AS and Reid AJ (2020) Development and Characterisation of an in vitro Model of Wallerian Degeneration. Front. Bioeng. Biotechnol. 8:784. doi: 10.3389/fbioe.2020.00784
Received: 07 May 2020; Accepted: 22 June 2020;
Published: 10 July 2020.
Edited by:
Srinivas Madduri, University Hospital of Basel, SwitzerlandReviewed by:
Petr Dubový, Masaryk University, CzechiaJose Antonio Gomez-Sanchez, University College London, United Kingdom
Valerio Magnaghi, University of Milan, Italy
Copyright © 2020 Elsayed, Faroni, Ashraf, Osuji, Wunderley, Zhang, Elsobky, Mansour, Zidan and Reid. This is an open-access article distributed under the terms of the Creative Commons Attribution License (CC BY). The use, distribution or reproduction in other forums is permitted, provided the original author(s) and the copyright owner(s) are credited and that the original publication in this journal is cited, in accordance with accepted academic practice. No use, distribution or reproduction is permitted which does not comply with these terms.
*Correspondence: Adam J. Reid, Adam.Reid@manchester.ac.uk