Air Quality Modeling Study on the Controlling Factors of Fine Particulate Matter (PM2.5) in Hanoi: A Case Study in December 2010


1
Graduate school of Life and Environmental Sciences, University of Tsukuba, Tennodai 1-1-1, Tsukuba 305-8572, Ibaraki, Japan
2
Center for Regional Environmental Research, National Institute for Environmental Studies, 16-2 Onogawa, Tsukuba 305-8506, Ibaraki, Japan
3
Center for Computational Sciences, University of Tsukuba, Tennodai 1-1-1, Tsukuba 305-8577, Ibaraki, Japan
*
Author to whom correspondence should be addressed.
Atmosphere 2020, 11(7), 733; https://doi.org/10.3390/atmos11070733
Submission received: 25 May 2020
/
Revised: 1 July 2020
/
Accepted: 2 July 2020
/
Published: 10 July 2020
(This article belongs to the Special Issue Asian/Pacific Air Pollution and Environment)
Abstract
:Meteorology and emission sources are the two main factors determining concentrations of air pollutants, including fine particulate matter. A regional air quality modeling system was used to analyze the sources of fine-particulate air pollution in Hanoi, Vietnam, in December 2010. The impacts of precipitation and winds on PM2.5 concentrations was investigated. Precipitation was negatively correlated with PM2.5 concentrations. However, winds showed both positive and negative correlations with PM2.5 concentrations, depending on wind direction (WD) and the level of upwind concentrations. Sensitivity simulations were conducted to investigate the contribution of local and non-local emissions sources on total PM2.5 by perturbing the emission inputs of the model. Overall, local and non-local sources contributed equally to the total PM2.5 in Hanoi. Local emission sources comprised 57% of the total PM2.5 concentrations for the high PM2.5 pollution levels, while only comprising 42% of the total PM2.5 for low levels of PM2.5 concentrations. In Hanoi’s urban areas, local sources contributed more to the total PM2.5 than non-local sources. In contrast, non-local sources were the main contributors to the PM2.5 in Hanoi’s rural areas. Additional sensitivity simulations were conducted to identify the main local emission sources of PM2.5 concentrations in December 2010. The industrial and residential sectors collectively comprised 79% of the total PM2.5 concentrations while the transport and power sectors comprised only 2% and 3%, respectively. This is the first case study which used a regional air quality modeling system to provide new and informative insights into PM2.5 air pollution in Hanoi by estimating the contributions of local and non-local emissions sources, as well as the contribution of local emission sectors to PM2.5 concentrations in Hanoi.
1. Introduction
Air pollution is known to cause disease in humans and shorten life expectancy [1,2,3,4], It also caused severe damage across various ecosystems [5]. PM2.5 (particulate matter with a diameter less than 2.5 μm) is one of the most harmful air pollutants known to enter the human body [6,7]; contributing to cardiovascular disease [8], asthma, allergic diseases [9], and lung cancer [10].
PM2.5 and its precursors, including black carbon (BC), organic carbon (OC), sulfur dioxide (SO2), nitrogen oxides (NOx), ammonia (NH3), and non-methane volatile organic carbon (NMVOC) can be emitted from both anthropogenic and natural sources, including volcanoes, wildfires, dust storms, biomass burning, sea spray, wood heaters, fuel combustion, tailpipe exhaust, and industrial processes [6,11,12,13,14]. Secondary PM2.5 forms through the chemical reactions of its precursors. Concentration levels and the percentage of PM2.5 components vary considerably according to meteorological conditions and emission sources [15,16].
Hanoi, Vietnam, has been facing severe PM2.5 air pollution in recent years due to rapid economic development within the city, its surrounding provinces and neighboring countries, including China. According to the Ministry of Natural Resources and Environment (MONRE), the air quality index (AQI) of Hanoi experienced unhealthy levels for sensitive groups (AQI = 101–200) for 40–60% of the monitored days between 2010 and 2013 [17]. Between 2010 and 2013, there were 102 days when the AQI showed very unhealthy air quality levels in Hanoi (AQI = 201–300), and 20 days when the AQI showed hazardous air quality levels in Hanoi (AQI > 300; [17]). According to the ambient air quality data on PM2.5 in Hanoi observed by the Center for Environmental Monitoring (CEM), the annual mean concentrations of PM2.5 from 2010–2017 ranged from 36.7 µg/m3 in 2012 to 66.5 µg/m3 in 2010. These values violated the acceptable concentration ceiling of PM2.5 given by MONRE, which is 25 µg/m3. Therefore, environmental policies must be revised to combat air pollution in Hanoi.
To adopt effective environmental policies for tackling such severe air pollution in Hanoi, the sources of air pollutants in Hanoi require identification. An air quality model (AQM) can consider the contribution of all emissions sources to the total concentrations of an air pollutant. AQMs can be used in various sensitivity analyses and should be used more widely for air pollution studies in highly polluted areas, such as Hanoi.
In Vietnam, AQMs have been utilized for air quality studies in Ho Chi Minh City (HCMC) and Hanoi. The infinite volume model (IVM) and the transport and photochemistry mesoscale model (TAPOM) were applied in a study on ozone (O3) pollution [18]. In Hanoi, the operational streets pollution model (OSPM) was applied to predict air pollution levels of five streets located inside the city [19]. However, the study did not include PM2.5, and only used a two-dimensional (2-D) modeling system. Unlike 2-D AQMs which only consider the horizontal dispersion of air pollutants, a three-dimensional (3-D) modeling system, such as the Weather Research and Forecasting/Community Multiscale Air Quality Modeling system (WRF/CMAQ) also considers factors such as vertical mixing during simulations. In 2015, a joint study was conducted by the International Institute for Applied Systems Analysis (IIASA, Laxenburg, Austria) and Vietnam Academy of Science and Technology (VAST), to estimate and predict the PM2.5 air pollution in several provinces located in North Vietnam, including Hanoi [20]. In the study, the greenhouse gas–air pollution interactions and synergies (GAINS) model estimated emission for different sectors in Hanoi and the EMEP atmospheric chemistry model was used for simulations of PM2.5 and its precursors. The GAINS tool was also used to carry out a source apportionment of PM2.5 in Hanoi in 2015. However, the contributions of local and non-local emission sources to the total concentration of PM2.5 in Hanoi are not clearly indicated in that study. In addition, the study using the GAINS model focused on the entire 2015 and hence, it may have overlooked the impact of meteorological phenomena on PM2.5 in Hanoi in winter.
The current study aims to evaluate the impact of controlling factors, including meteorology and emissions on PM2.5 pollution in Hanoi in December 2010 using 3-D model sensitivity analysis. We selected a winter month as winter is the season with the highest PM2.5 concentrations in Hanoi due to winds originating from the north. During winter, winds transport air pollutants from the eastern part of China and Taiwan to Northern and Central Vietnam, degrading the air quality in these areas with pollutant gases and fine dust [17,21]. Moreover, the population of Hanoi tends to use more energy for heating in winter, which produces more air pollutants. We selected December as it represents typical winter characteristics in Hanoi with climate conditions that affect the formation and dispersion of secondary PM2.5 and its precursors. In addition, previous reports and studies on air quality in Hanoi have clearly indicated that Hanoi is heavily polluted by PM2.5 in December [22,23,24]. Although studies on PM2.5 in Hanoi have been conducted [22,23,25,26], none have quantified the contribution of the controlling factors on PM2.5 pollution in Hanoi. In addition, all of the previous studies were done using data collected from a few monitoring sites in Hanoi. This study is the first case study of applications of the WRF/CMAQ system to evaluate the contribution of the controlling factors on PM2.5 in Hanoi. The objective of our work is to investigate the influence of meteorology and emission sources on PM2.5 pollution in Hanoi in December 2010.
2. Material and Methods
2.1. Study Area
Hanoi is one of the most populous cities in Vietnam. In 2010, the area and population of Hanoi was 3329 km2 and approximately 6.6 million, respectively [27]. The city is located on the plain of the Red River Delta (Figure 1). The complexity of the climate in winter is one of the governing factors of air pollution in Hanoi. Cold surges, which usually occur in winter, can transport air pollutants to Hanoi from other locations. The model output was validated against observational data from meteorological and air quality stations in Hanoi (Table 1). PM2.5 was monitored at NVC station using the light scattering technology (GRIMM—Germany) while PM10 was monitored at Lang station using a beta ray attenuation method (Kimoto—Japan). As Lang station provided only data on PM10, we applied the PM2.5/PM10 ratio = 0.74 for winter in Hanoi to estimate the concentrations of PM2.5 [28]. The PM2.5/PM10 ratio used in this study was the result of a comprehensive monitoring program in which samples were collected at different locations across Hanoi to represent the air pollution conditions across the city [28].
2.2. Models Used and Model Configuration
The WRF/CMAQ system has been widely used across the world to study the interaction among the atmosphere, meteorology, natural processes, and human activities. For example, a study was conducted in China to evaluate the impact of cold frontal passage on PM2.5 over the Yangtze River Delta using the WRF/CMAQ system [29]. Another study in China applied the WRF/CMAQ system to create a forecast system of air quality for Xi’an city [30]. In Korea, the WRF/CMAQ system was utilized to evaluate the regional contributions to the particulate matter concentration in Seoul [31]. In Japan, the WRF/CMAQ system was used to assess the impact of long-range transport of PM2.5 emitted from Siberian biomass burning on the air quality in Japan [32]. In South East Asia, the WRF/CMAQ system was applied to assess the direct effects of aerosol on air quality and meteorology in South East Asia and to address the impact of climate change on the air quality in South East Asia [33,34].
The WRF/CMAQ system was used to conduct a one-month simulation in December of 2010 for the base case and two sensitivity analyses. First, the base case run was conducted for validation against observations and were then used to explain the impact of meteorology and emissions on the temporal variations of total PM2.5. Second, anthropogenic emissions inside Hanoi were turned off simultaneously to determine the contributions of local and non-local emission sources to the concentration of total PM2.5 in Hanoi. Finally, each anthropogenic emission sector inside Hanoi was zeroed out in turn and the modified emission data were used as inputs for the Community Multiscale Air Quality Modeling model (CMAQ) to determine the contribution of each local emission sector to the concentration of total PM2.5 in Hanoi.
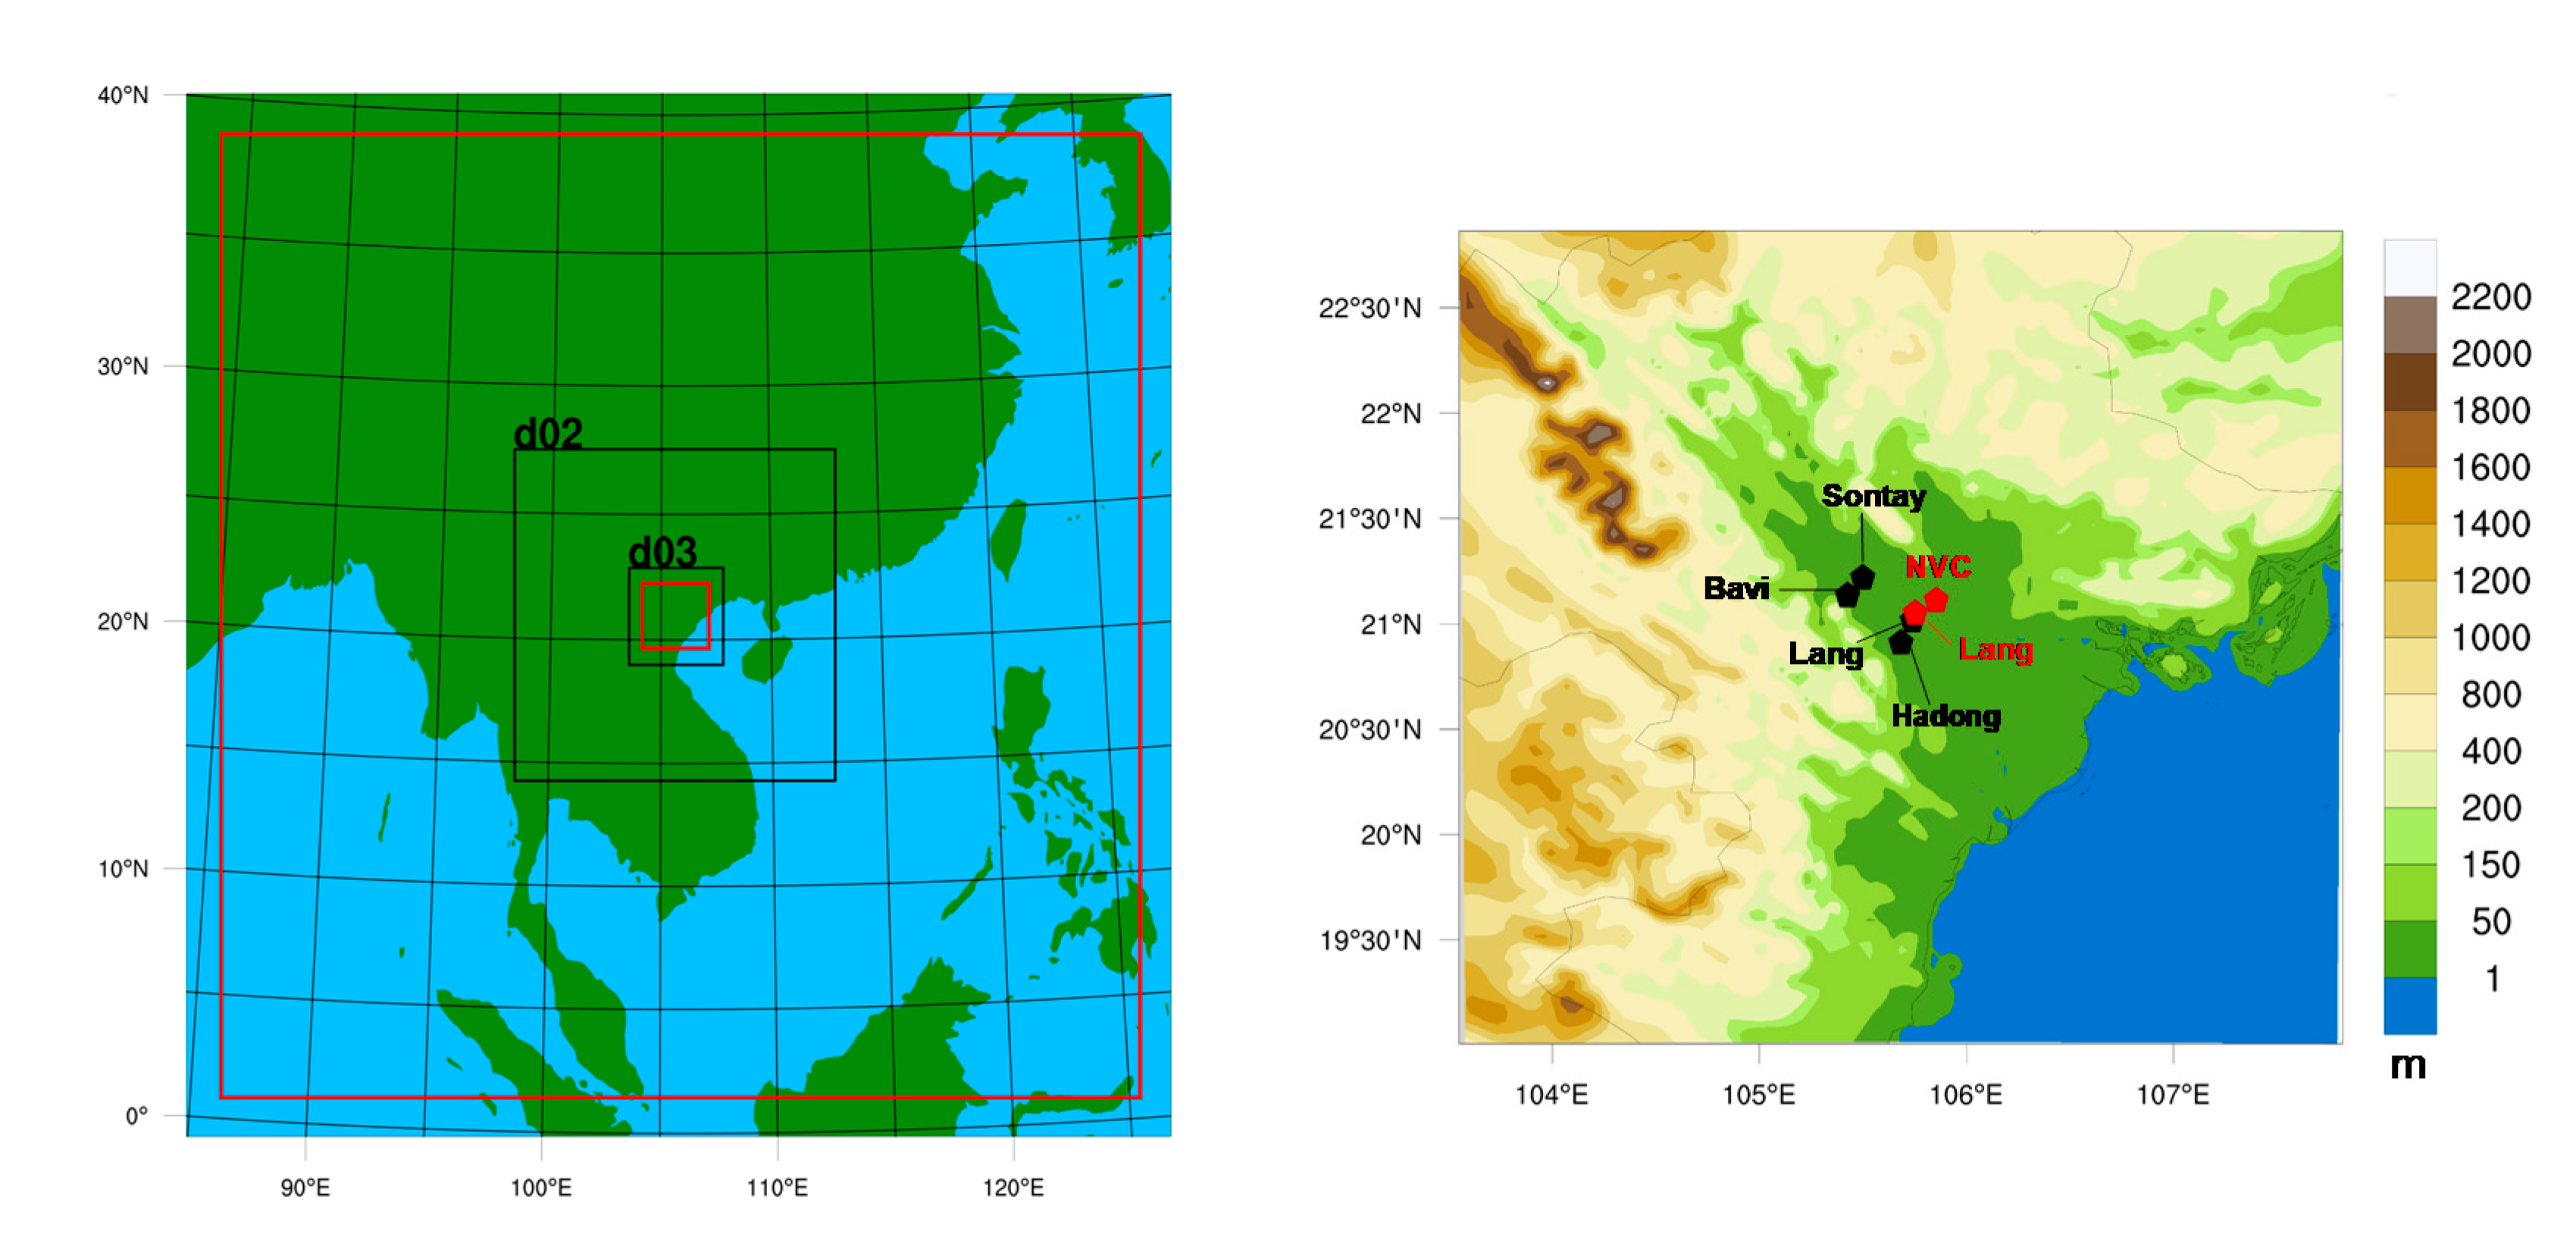
Meteorological parameters were simulated with the Weather Research and Forecasting model (WRF) version 3.8.1 as they are important driving factors that decide the quality of the AQM. Precipitation, PBL, and atmospheric ventilation are important factors affecting these concentrations as well as the dispersions of PM2.5 in the atmosphere. Triple nested domains were used, with the outermost domain (d01) containing a grid cell size of 36 km that covered all of Vietnam, most of the bordering southeast Asian countries, and southern China. The first nested domain, with a grid cell size of 12 km, included northern and central Vietnam (d02), and the third domain, with a grid cell size of 4 km, included Hanoi (d03). The total number of grids of WRF domains were 130 × 130, 127 × 124, and 112 × 109 for d01, d02, and d03, respectively. The WRF configuration included the unified Noah land surface model for the land surface scheme [35], the WRF single-moment three-class scheme [36], the Dudhia scheme for shortwave radiation [37], the rapid radiative transfer model (RRTMG) for longwave radiation [38], and the Yonsei University scheme for PBL [39]. Additionally, analysis nudging was used on temperature and winds across all domains. The USGS 24 category land cover data were used during simulations. In urban areas, urban land cover with a value of roughness length (Z0 = 1.0) was used to represent the drag force of buildings in Hanoi. The initial conditions (ICONs), boundary conditions (BCONs), and analysis nudging data were from 1° × 1° National Centers for Environmental Prediction (NCEP) FNL (Final) Operational Global Analysis data [40].
CMAQ version 5.0.2 was used and run for d01 and d03 with each domain smaller than the corresponding WRF domain by five grids on each side (Figure 2). The horizontal resolution of each grid cell used for CMAQ was the same as that used for WRF. The main configurations for CMAQ included SAPRC99 [41] for the chemical mechanism and AERO05 for the aerosol module. The ICONs and BCONs of d01 were created from predefined profiles and the BCONs of d03 were created from the parent domain (d01), including the potential sources of PM2.5 in Hanoi in December 2010 such as the eastern part of China. In addition, look-up tables were used to estimate the photolysis rates for CMAQ simulations. The simulation period was run from 28 November to 31 December 2010 with the last three days of November served as model spin-up to minimize the impact of the ICONs on the model output.
2.3. Emission Inventory
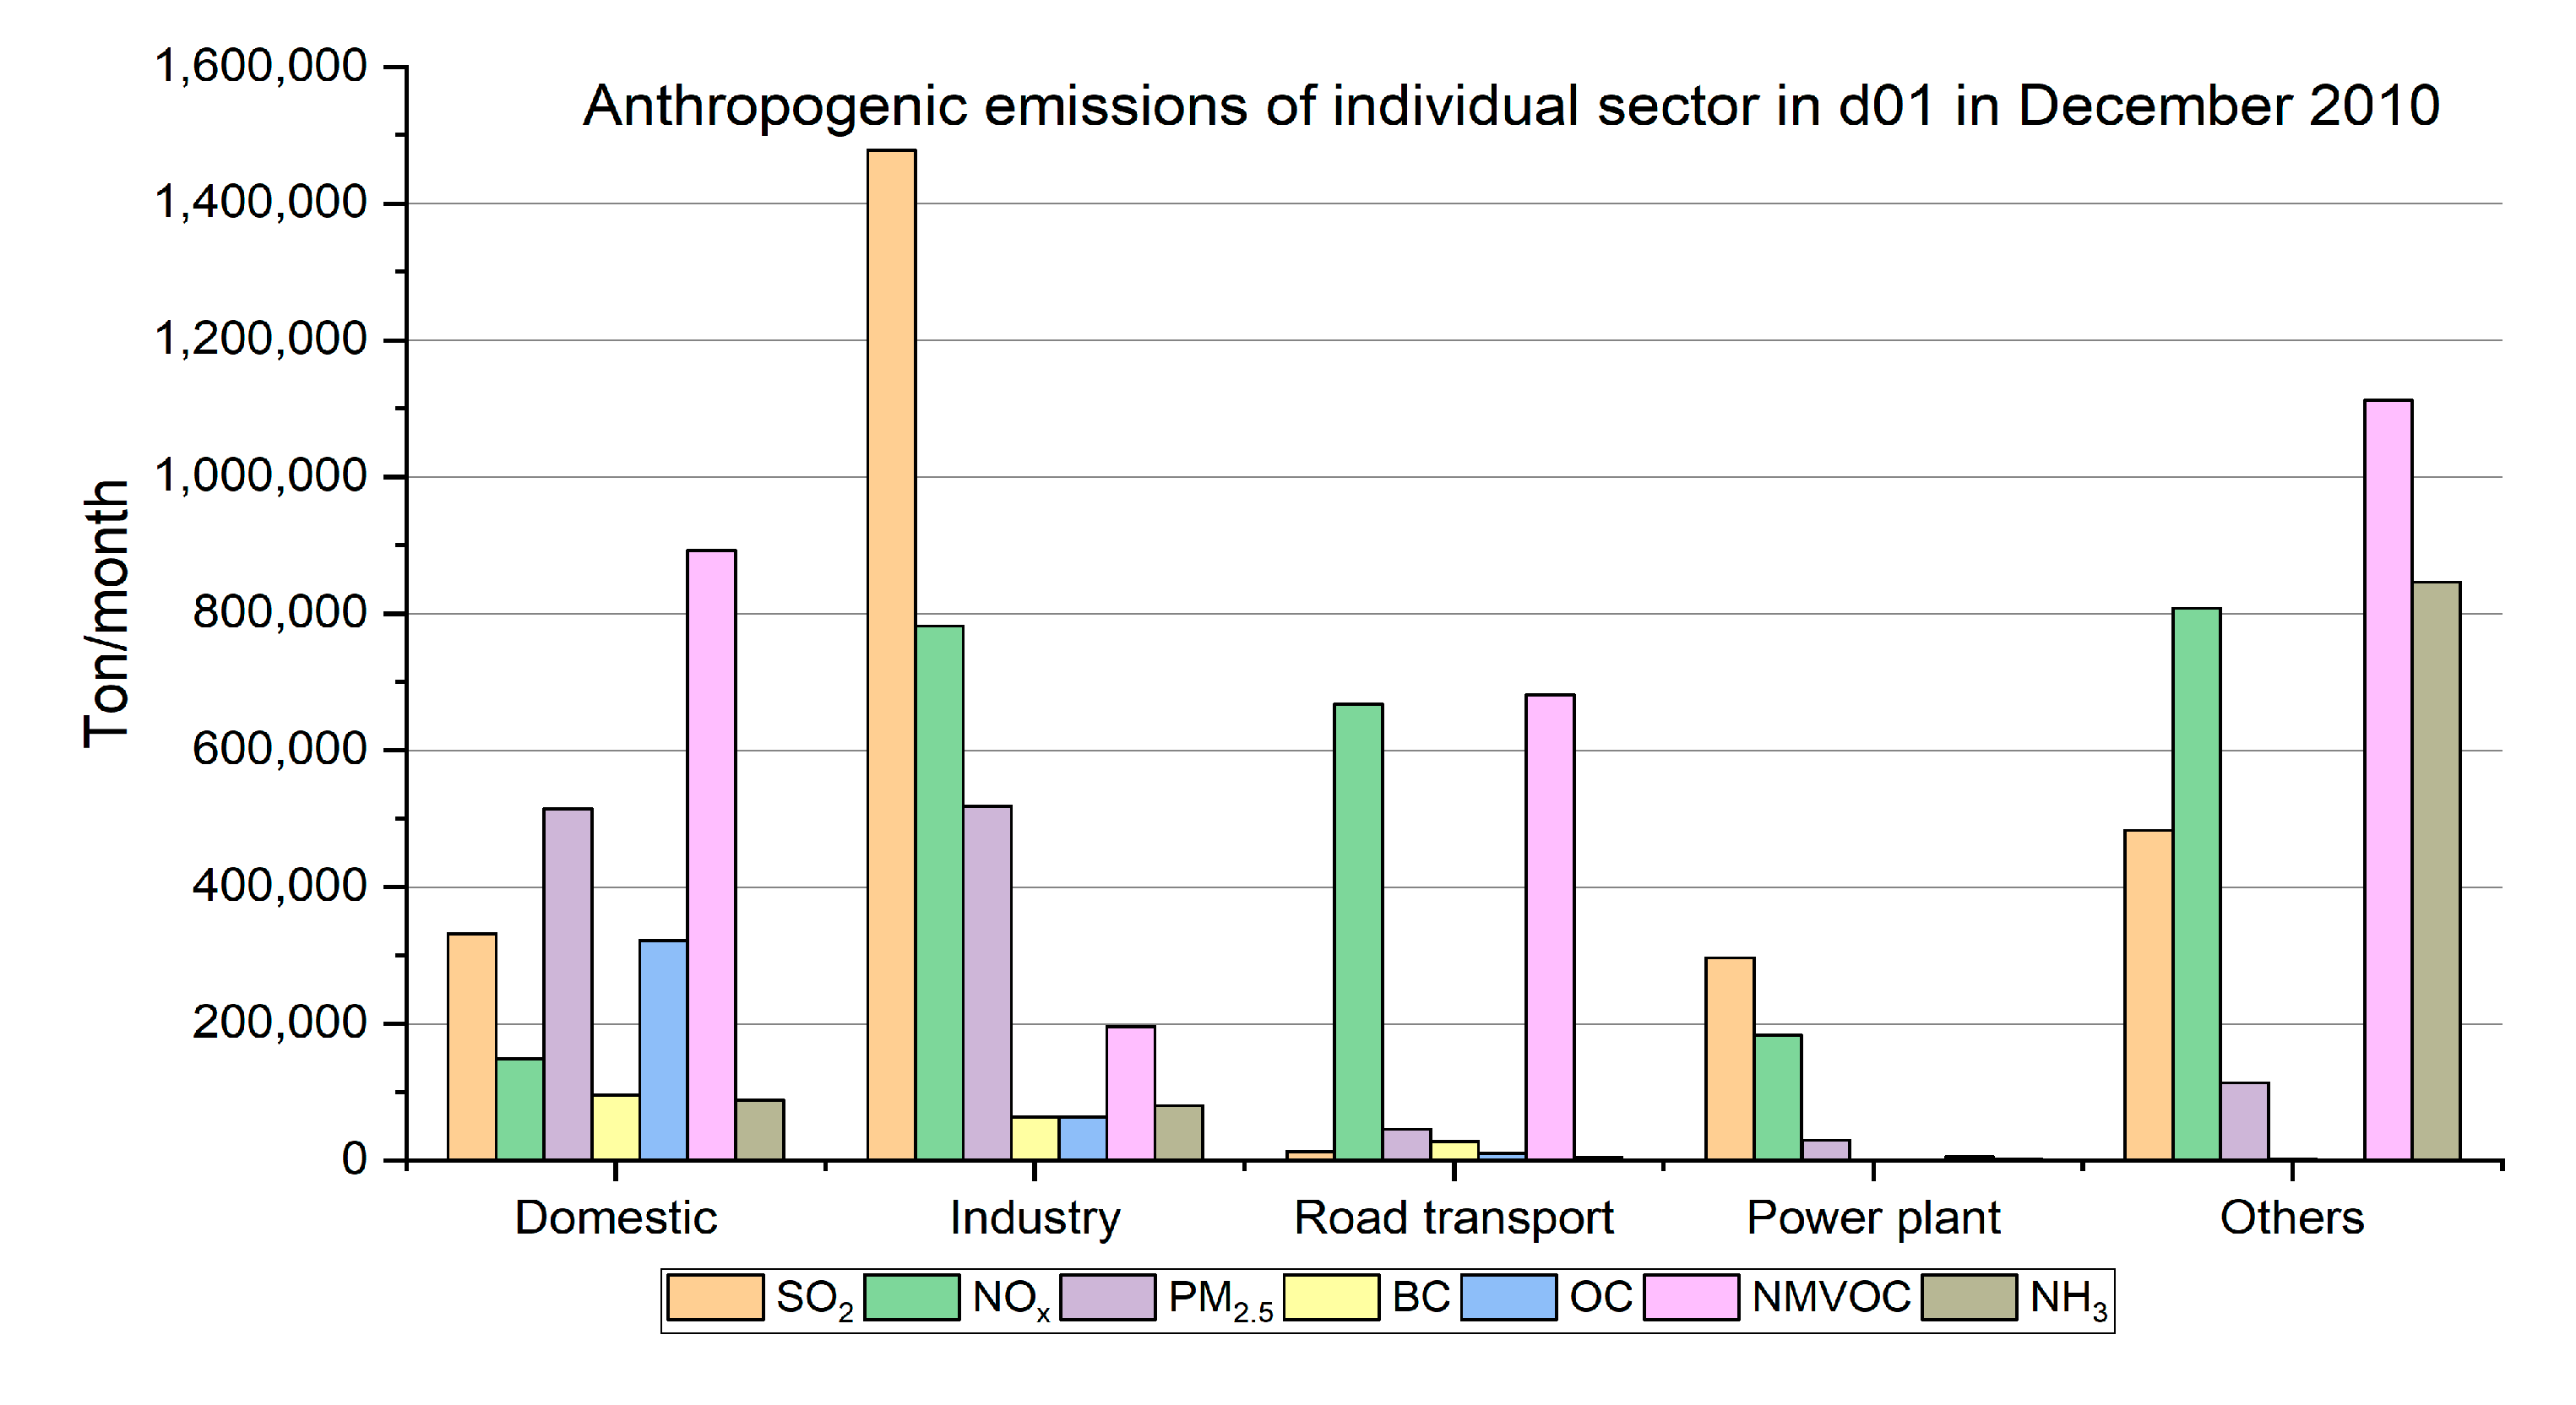
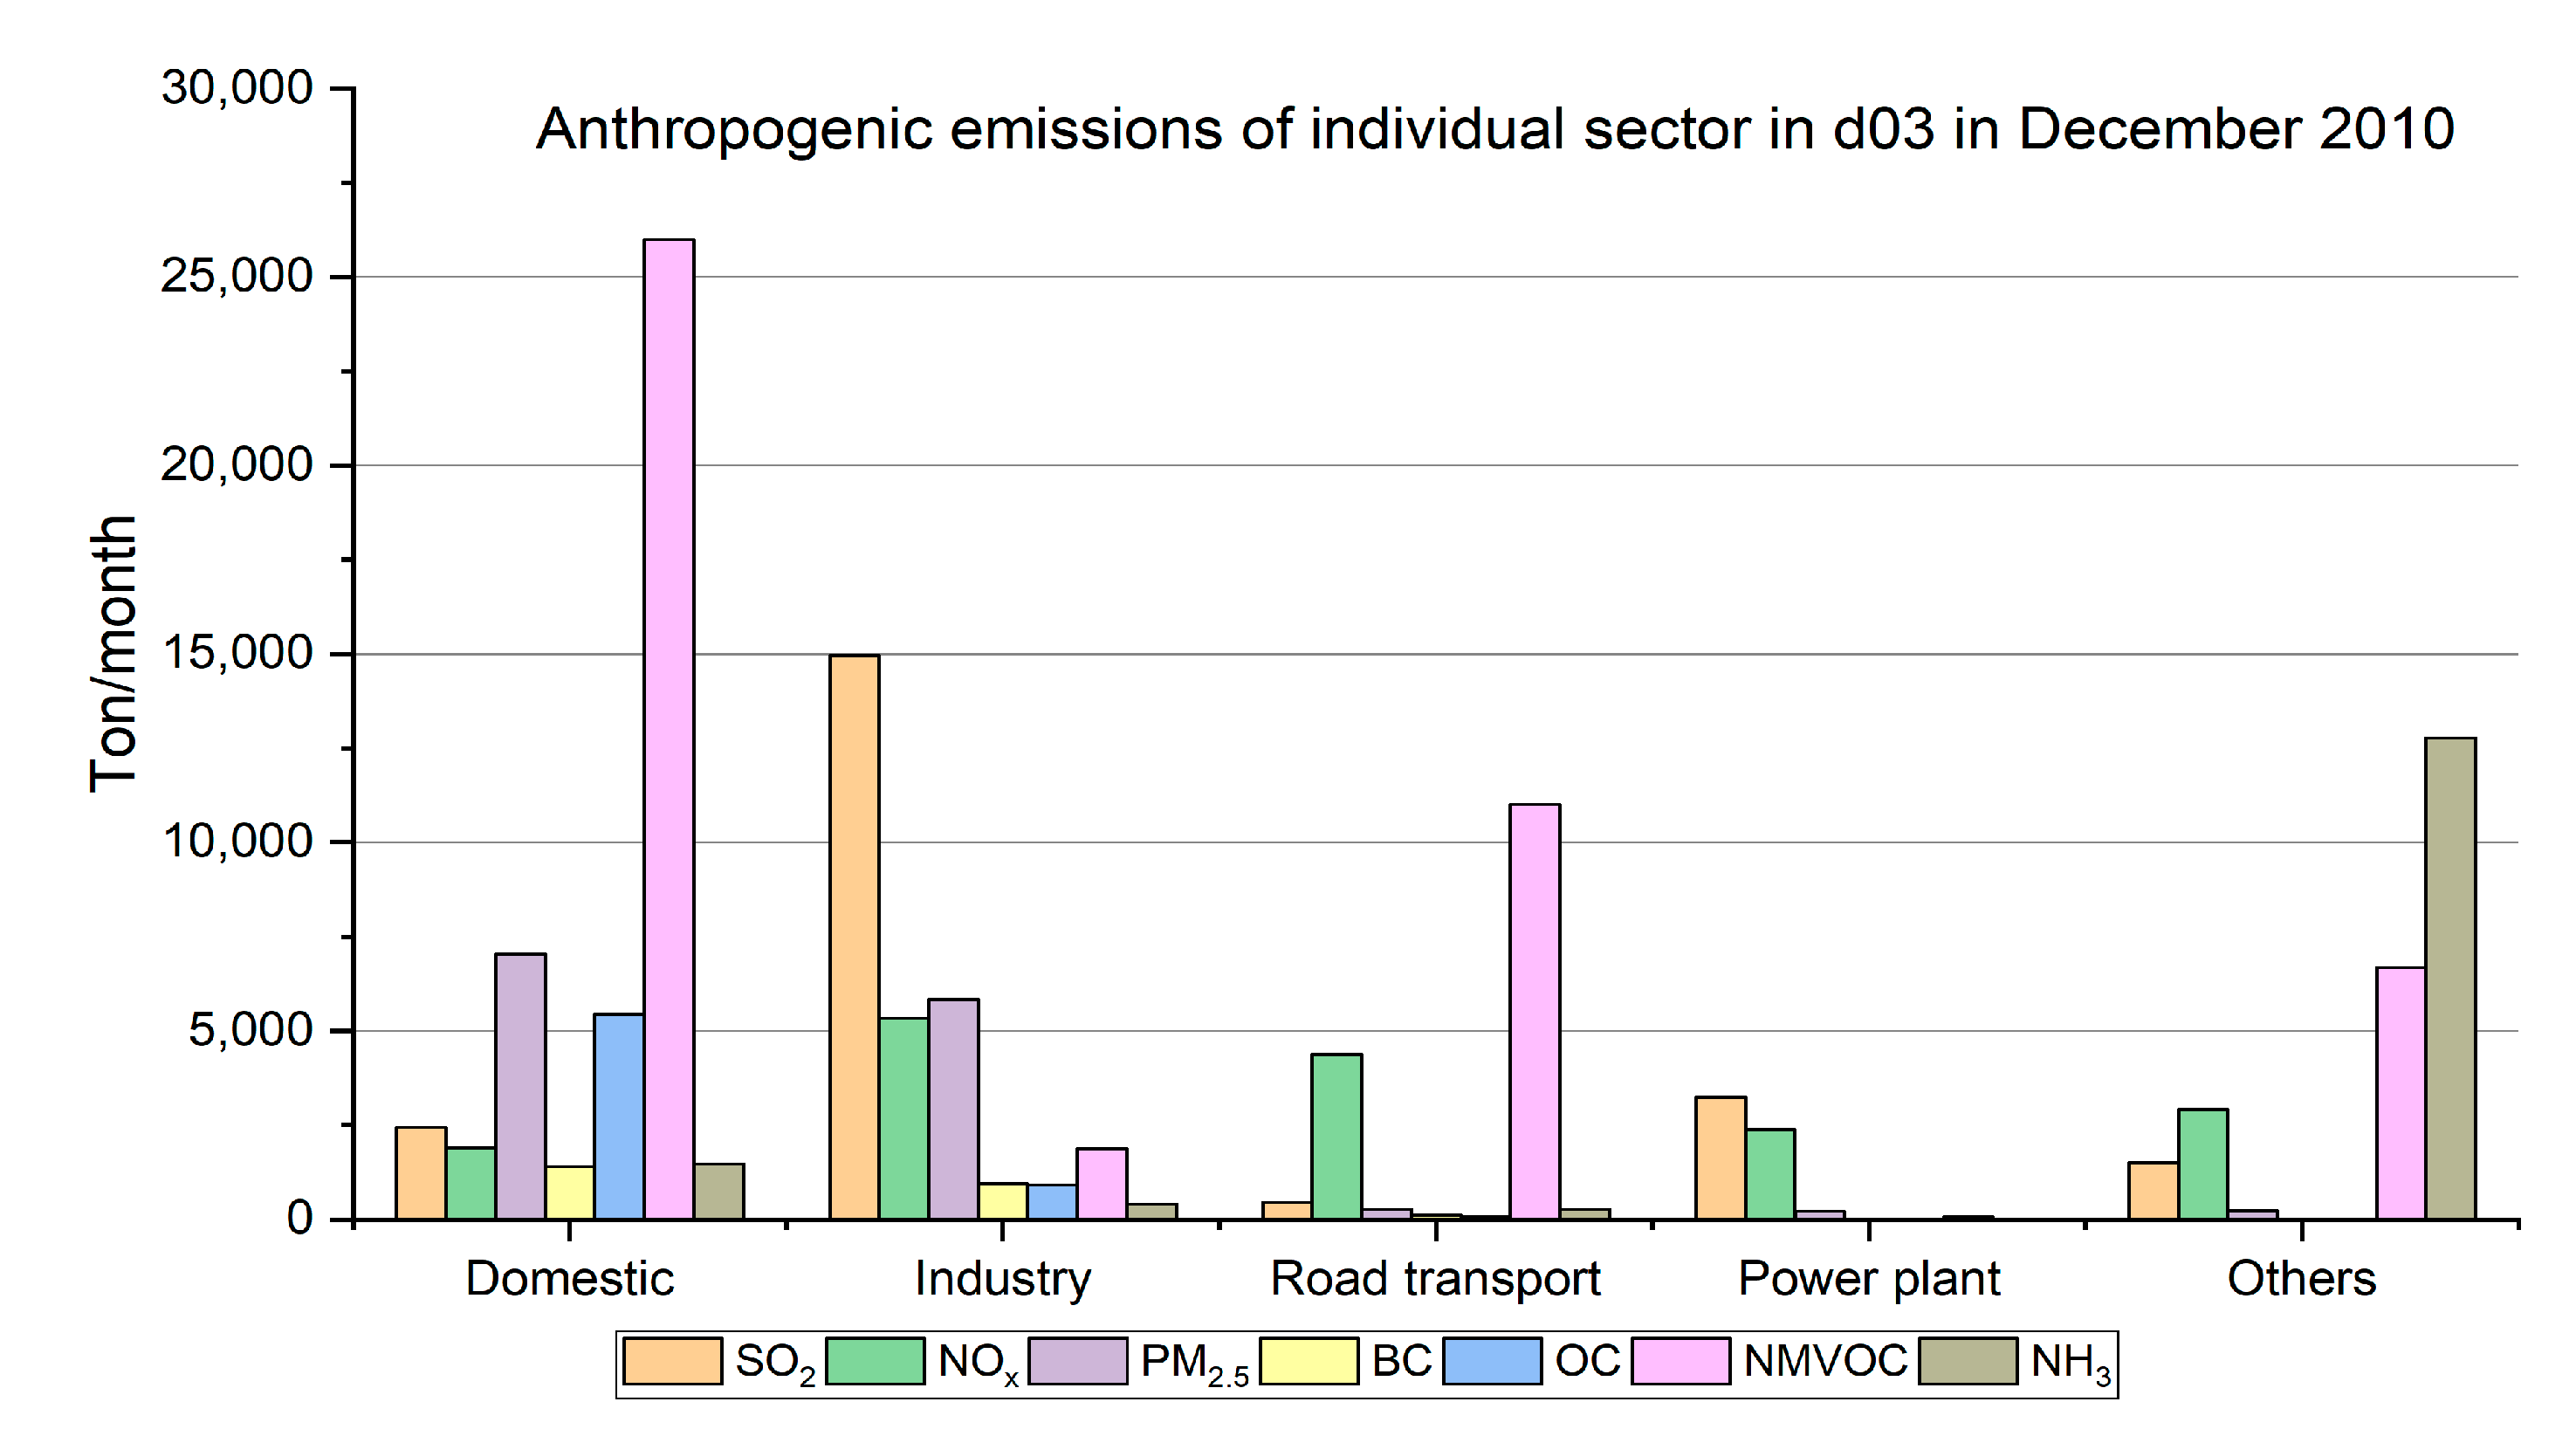
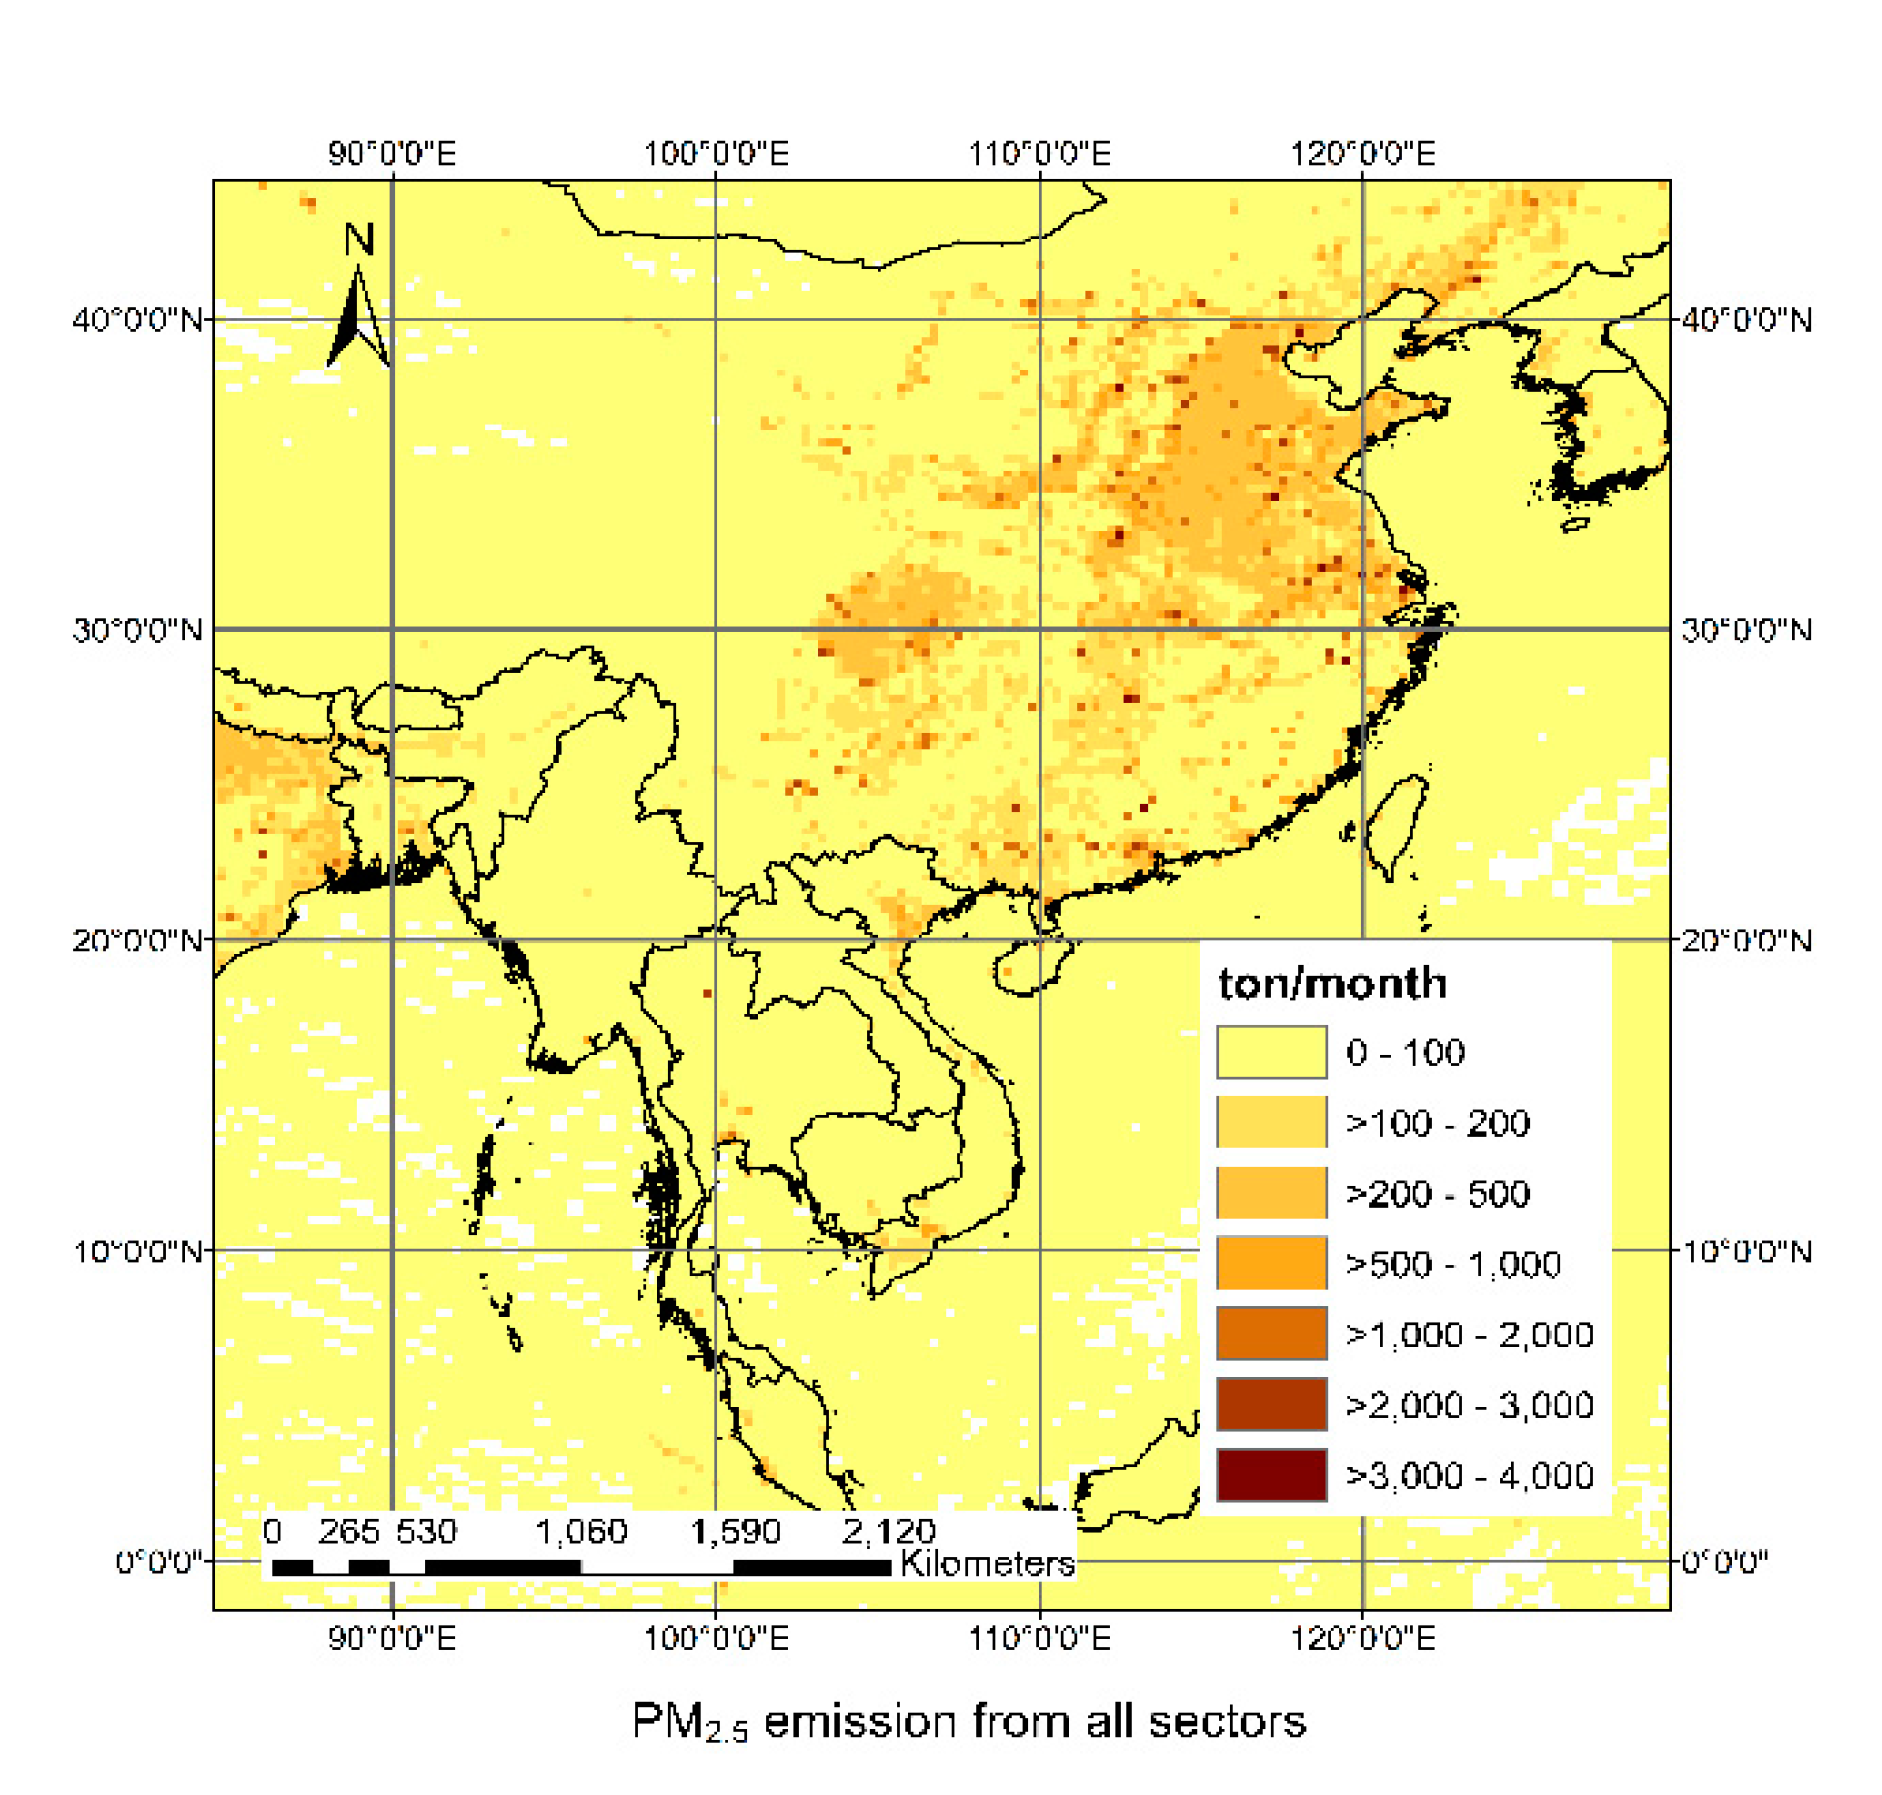
We used the Regional Emission Inventory in Asia (REAS) version 2.1 [42] as the input data for CMAQ. REAS provides past and present anthropogenic emission data of air pollutants, including primary PM2.5 and its precursors for Asian countries on spatial grids at a resolution of 0.25° × 0.25°. REAS covers a wide range of emission sources, including transport, industry, power plants, residential sources, and other anthropogenic emissions sources. Emission data in REAS were calculated considering several factors such as emission factors, fuel, and sector types. Biogenic emissions were calculated with the Model for Emission of Gases and Aerosol from Nature (MEGAN) v2.10 [43]. For input data, monthly average leaf area index (LAI) data for 2003 was used. The plant function type (PFT) data and meteorological data for MEGAN were the same as the data used for CMAQ. Emissions from biomass burning were generated by the Global Fire Emission Database (GFED) version 3.1 [44,45]. Emissions of each source taken from REASv2.1 in CMAQ domain 3 were regridded from a resolution of 0.25° × 0.25° (approximately 27 × 27 km) per grid cell to 4 × 4 km per grid cell. The total anthropogenic emissions in d01 and d03 in December 2010 taken from REASv2.1 are summarized in Figure 3 and Figure 4. Contributions of emission sectors to total emissions of air pollutants in d03 (ton/month) and sectoral contribution to the total emission (%) are shown in Table A1 (Appendix A). According to REASv2.1, the domestic sector and industry are two main sources of primary PM2.5. Precursor gases of PM2.5 such as NOx or VOC were mainly contributed by industry, the domestic sector, and road transport. SO2 is mainly emitted from the industrial sector. The spatial distribution of primary PM2.5 from all sectors are shown in Figure 5.
2.4. Statistical Metrics for Model Evaluation
Several statistical metrics were used to verify model performance, including: the mean bias (MB), root mean-squared error (RMSE), normalized mean bias (NMB), normalized mean gross errors (NME), mean fraction error (MFE), correlation coefficient (R), and mean fractional bias (MFB). The formulas are as follows:
where and are the modeled and observed values, respectively, and N is the sample size.
For meteorological parameters, hourly average values were used for statistical metrics calculation (N = 744). For total PM2.5, daily average values were used for statistical metrics calculation (N = 31).
3. Results and Discussion
3.1. Model Validation
3.1.1. Meteorology
The hourly observed relative humidity (RH), temperature (T2), wind speed (WS), and wind direction (WD) were used to validate WRF outputs in d03 (Figure 6). Simulated RH was calculated from T2, water vapor mixing ratio (Q2), and air pressure (P). Similarly, the hourly ‘observed’ Q2 was calculated using observed T2, P, and RH. The average value of the grid point nearest to each monitoring station was used to compare with the average observational data. The WD observed at NVC station was used to compare with observations, since it was the only station providing numerical data on WD in Hanoi. Table 2 lists the statistical parameters of WRF performance.
The temporal variation in T2 in December was well simulated by the model (R = 0.92). Analysis nudging improved WRF simulation on T2 in Hanoi. WRF underestimated observations by 0.23 °C, indicating that WRF simulated T2 well. WRF captured the temporal variation in the actual RH well (R = 0.82). However, WRF underestimated RH by 13.3%. Underestimations of Q2 simulated by WRF could account for the differences in RH (Figure 6b). The overall temporal variation in the actual WS was well captured by WRF. However, WS was slightly overestimated by WRF by 0.58 m/s (Figure 6c). The WS of north-easterly winds from 6–9, 15–17, and 25–27 of December were overestimated by WRF (Figure 6c). As listed in Table 1, two air quality stations are located in urban areas. Therefore, one possible reason for this overestimation is that the strong north-easterly winds were blocked by tall buildings in the real situation, which could not be accurately reproduced by WRF. The urban land use could not completely consider the impact of high buildings on WS at those sites, leading to overestimation of the model to observations. Previous studies using WRF model also showed that WS simulated by WRF usually overestimated observed WS over complex terrain such as urban or mountainous areas [46,47]. To support our discussions on WS, we included integer WS data from four meteorological stations which are not surrounded by high buildings, namely Lang meteorological station, Sontay station, Bavi station, and Hadong station (Figure 1, Table 1). WS simulated by WRF agreed well with those observed at the meteorological stations during strong wind events (Figure 6c). WD was accurately reproduced by WRF in December. The simulation results showed that in December 2010, the prevailing WDs were north and northeast. However, between the 9 and 15 December, the main WDs were south and southeast.
3.1.2. Total PM2.5 Concentration.
Similar to meteorological parameters, the average values the grid points of simulated PM2.5 nearest to two air quality stations in d03 were compared with the average values of observed PM2.5 at NVC and Lang stations (Figure 7). The total PM2.5 is the sum of its components (primary PM2.5, secondary organic aerosols (SOA), primary organic carbon (POC), EC, ). Table 3 shows the statistical parameters used to evaluate model performance.
Simulated PM2.5 concentrations were in noticeable agreement with observed PM2.5 (Figure 7) with R = 0.77 which met the criteria given by Emery et al., 2017 [48]. The values of MFB and MFE for model performance on PM2.5 met the model performance criteria (MFB 60% and MFE 75%) [49]. Furthermore, Emery et al. (2017) stated that a simulation is acceptable if NMB values fall within −30% and +30% and NME values < 50% [48]. This criterion was met by CMAQ in this study. Although CMAQ slightly overestimated several peaks of PM2.5 concentrations, the model effectively reproduced a low concentration range of PM2.5 in December. CMAQ overestimated observations by approximate 11.2%. However, the PM2.5 simulation was suitable for the model sensitivity analyses of the controlling factors of PM2.5 in Hanoi in December 2010.
3.2. Impact of Controlling Factors on PM2.5 Variations
The WRF/CMAQ system showed a good performance when simulating meteorology and total PM2.5. Good agreement between simulations and observations provides a solid foundation for analyzing the impact of controlling factors on PM2.5 distribution and the sensitivity simulations.
Both simulated and observed PM2.5 showed an apparent diurnal variation with peak concentrations that usually appeared at night, which were superposed on a clear baseline variation with a time scale of one week to 10 days (Figure 7). Nighttime peak concentrations of PM2.5 investigated in previous studies showed that peak concentrations of PM2.5 could appear during nighttime due to the formation of secondary PM2.5 under stagnant conditions [23,50] or nighttime radiation temperature inversion [51]. Another reason for higher concentration of PM2.5 in Hanoi may be due to the impact of diurnal development of planetary boundary layer (PBL). PM2.5 and its precursors that are emitted into the atmosphere accumulate overnight, causing high PM2.5 concentrations when the PBL height is low [52]. The baseline variation of PM2.5 concentration has a strong relationship with WS, WD, and precipitation. The investigation of the influence of these meteorological factors on PM2.5 in Hanoi is presented below.
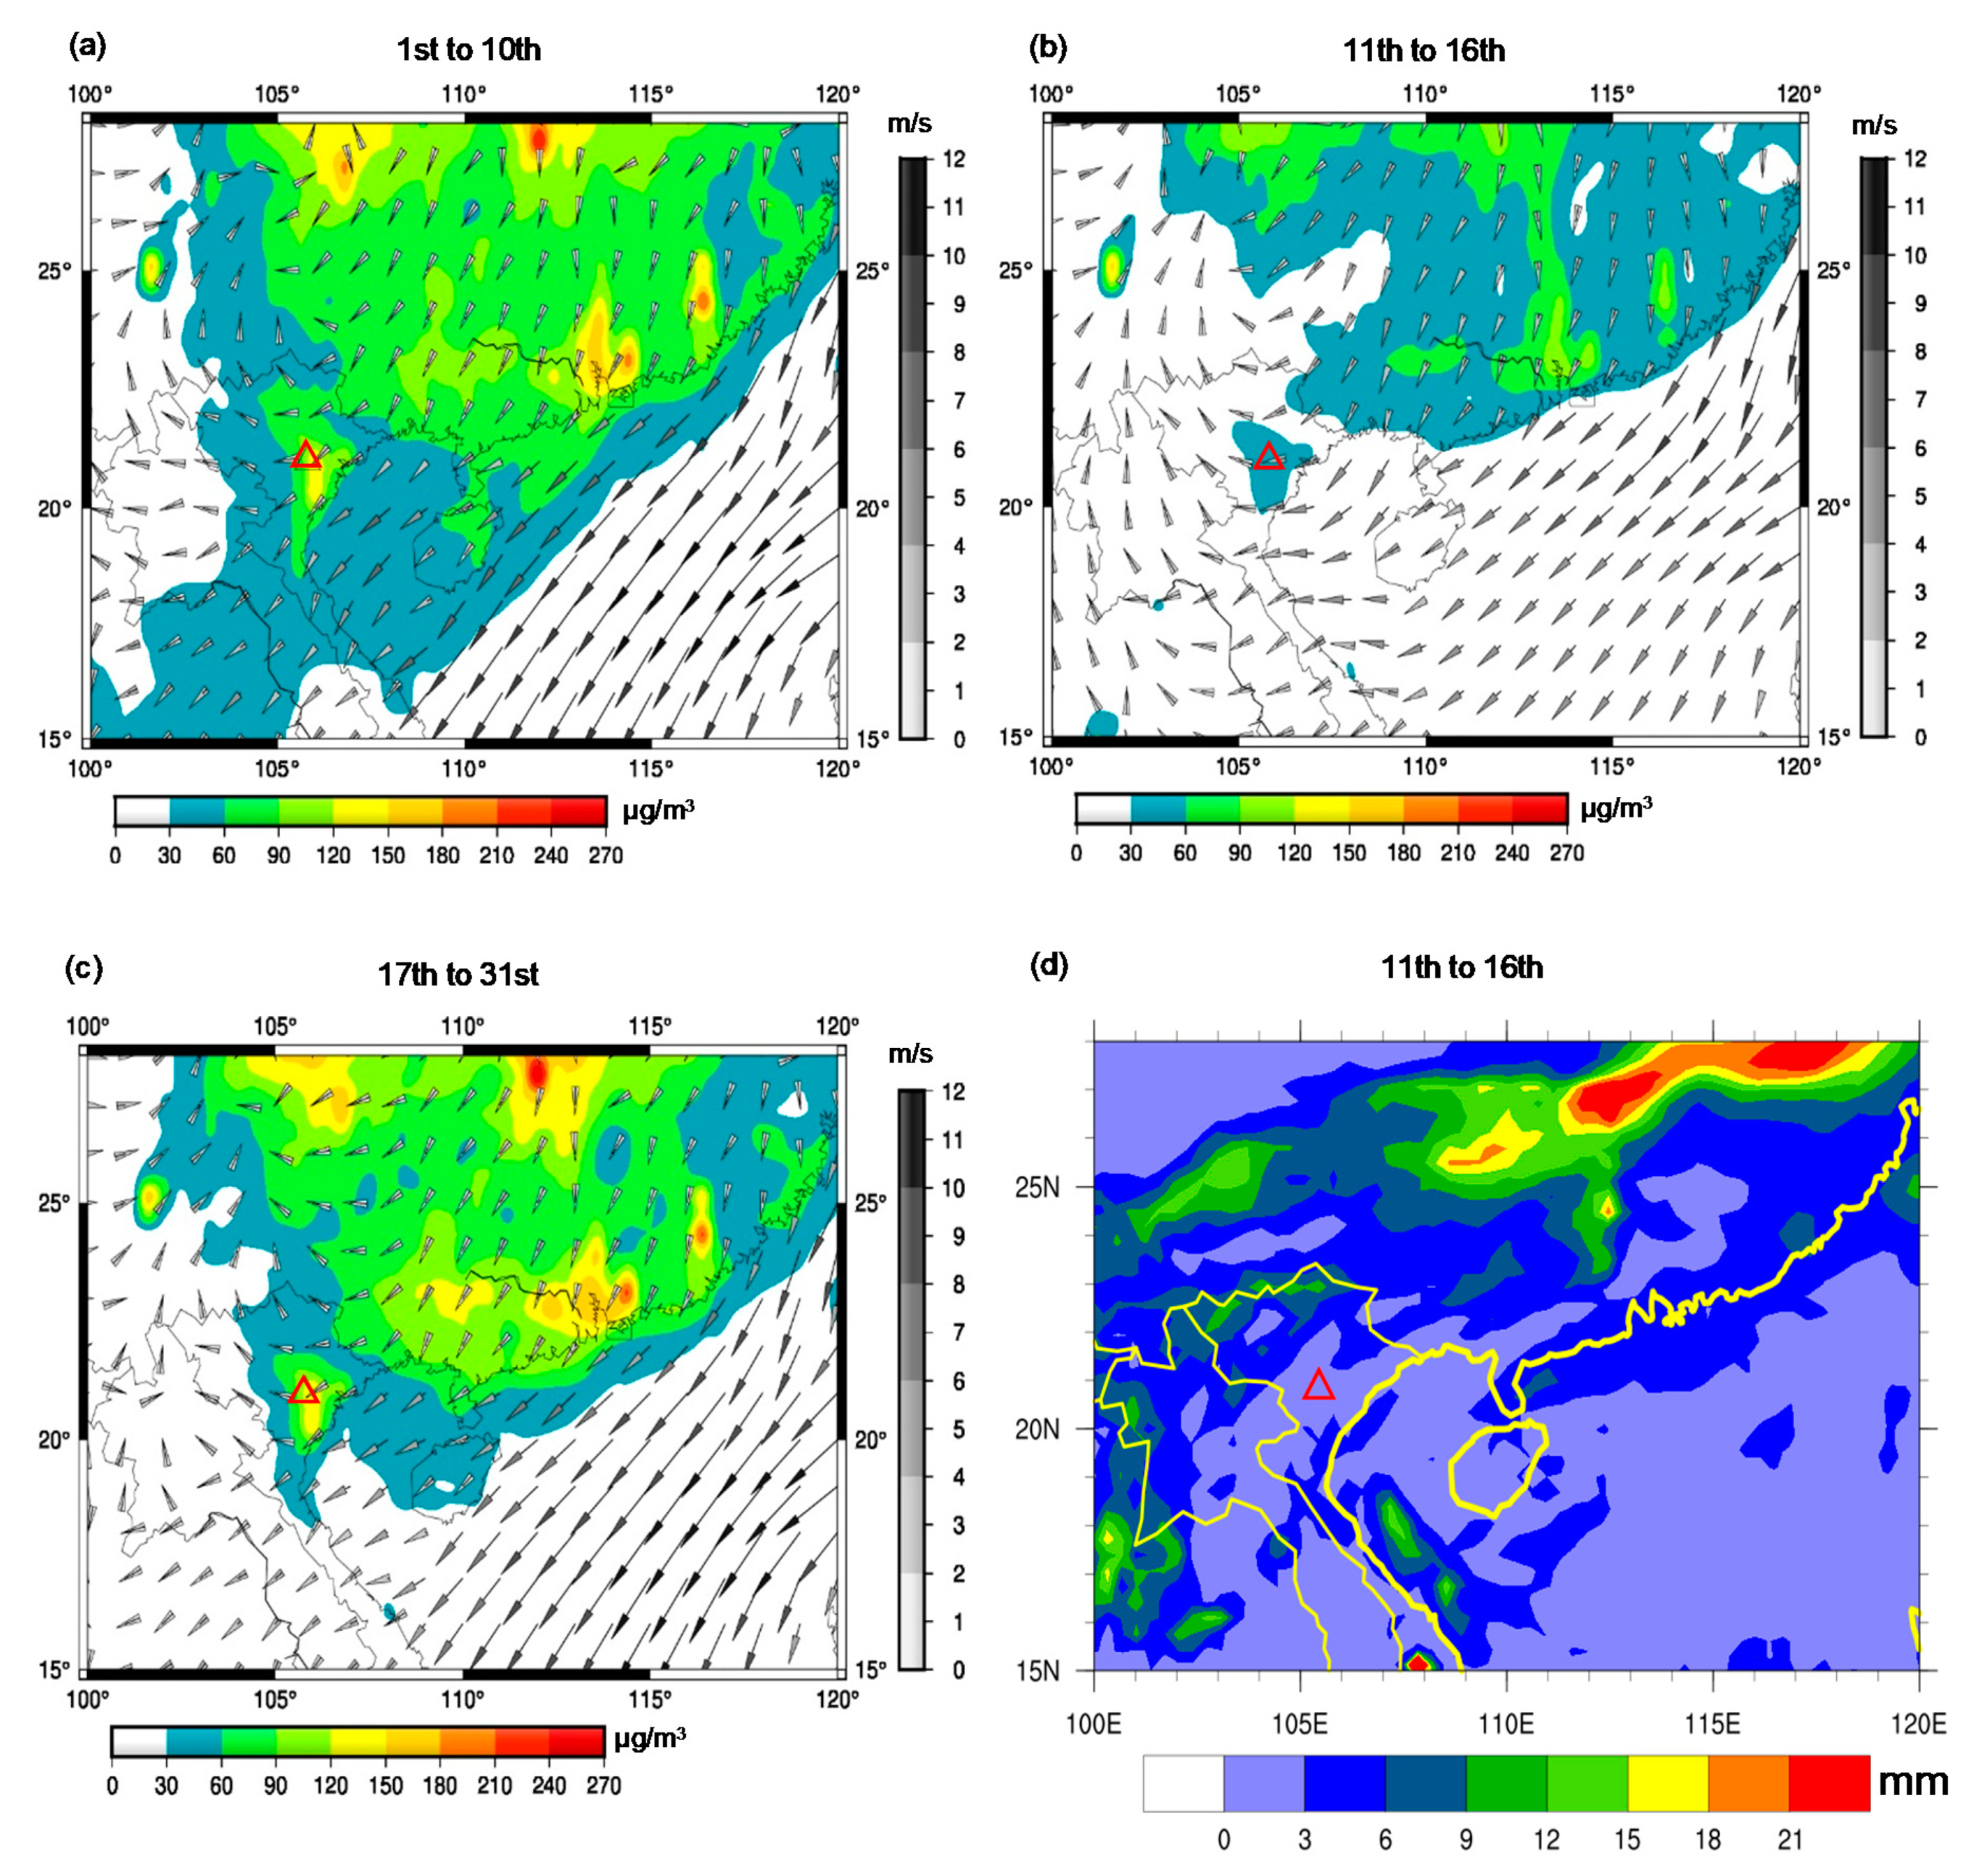
Based on the baseline temporal variation in PM2.5 with a time scale of approximately 1 week to 10 days (Figure 7), we divided the time series of PM2.5 concentrations into three periods: From the 1st–10th, the 11th–16th, and 17th–31st. The first and the third time periods represented high concentrations of PM2.5 while the second time period represented low concentrations of PM2.5. The difference in total PM2.5 concentrations among the three time periods can be observed not only in Hanoi, but over a wider area around the city, as well as the southern part of China, especially between the second time period and the first and third time periods. This difference was caused by a synoptic scale phenomenon which was related to a synoptic scale meteorological perturbation. Among many meteorological factors, WS and WD can strongly affect the concentrations of air pollutants. Previous studies have shown that air pollutants can be transported across continents or countries, depending on WS and WD [53,54,55]. Winds can improve or worsen the air quality of a certain location by carrying air pollutants away or bringing in air pollutants from surrounding areas. In Hanoi, winds can decrease (if the wind starts to blow from clean areas or from local emission sources) or increase (if the wind starts to blow from a highly polluted area to a less polluted area) PM2.5 concentrations. According to Figure 5, emissions of total PM2.5 in eastern part of China were higher than that in north of Vietnam. Therefore, when north-eastern wind starts to blow from China, it brings PM2.5 and precursor gases to Hanoi and other provinces in northern Vietnam. This showed a very complicated relationship between winds and PM2.5 air pollution in Hanoi in December 2010.
Regional scale wind patterns around Hanoi across these three time periods were similar to one another, as the north-easterly wind coming from southern China, turned to the west near Hanoi, passed through the city, and headed northward. Therefore, it was not WD but the difference in the concentration of PM2.5 in the upwind region that was the dominant cause of this synoptic scale phenomenon. During the first and the third time periods, PM2.5 concentrations over southern China were >60 μg/m3 (Figure 8a,c), and the strong north-easterly winds brought PM2.5 and its precursors to Hanoi. However, there was a large-scale precipitation over eastern China and northern Vietnam during the second time period, which significantly reduced PM2.5 concentrations to < 60 μg/m3 (Figure 8b,d). Simultaneously, a strong cold surge coming from the northeast brought low-polluted air masses from southern China to Hanoi.
PM2.5 concentrations at the center of Hanoi ranged from 90−150 μg/m3 while those over the surrounding areas ranged from 60−90 μg/m3, meaning that local emissions also contributed to the distribution of PM2.5 (Figure 8a,c). During the second time period, the concentrations of PM2.5 in Hanoi only ranged from 30−60 μg/m3 (Figure 8b).
The difference in PM2.5 concentrations between the second time period and the first and third were determined by a combined impact of physical processes through meteorology including large scale precipitation, advection by wind and local emission sources.
3.3. Sensitivity Analyses
This section presents a further quantitative analysis of the contribution of local (inside Hanoi) and non-local (outside Hanoi) emissions sources as well as the contribution of each emission sector to the total PM2.5 in Hanoi, through sensitivity simulations with the use of perturbed data.
3.3.1. Contributions of Local and Non-Local Emission Sources to PM2.5 in Hanoi
The zero-out method was applied in this study to find out the contributions of local and non-local emission sources to PM2.5 concentration in Hanoi in December 2010. All anthropogenic emissions inside Hanoi, which were used in the CMAQ simulation, were turned off such that only non-local emission sources and the background concentrations composed the total concentration of PM2.5 in Hanoi. Other simulation settings, ICONs and BCONs, were kept the same as the base case. The difference between PM2.5 simulated in the base case (with both local and non-local emission sources) and that simulated without local emission sources can be regarded as the contribution of local emission sources. Additionally, local and non-local contributions were estimated for low and high PM2.5 pollution levels separately as well as overall pollution levels. Low PM2.5 pollution level included all hourly PM2.5 concentrations which were less than 25th percentile of the hourly total PM2.5 concentration. Similarly, high PM2.5 pollution level included all hourly PM2.5 concentrations which were greater than 75th percentile of the hourly total PM2.5 concentration. We also estimated relative contribution of local and non-local emission sources to PM2.5 air pollution not only for Hanoi as a whole, but also for several urban and rural locations in the city, to understand how these contributions varied at different locations.
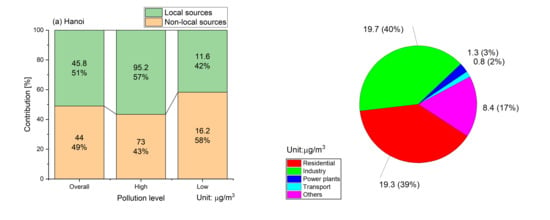
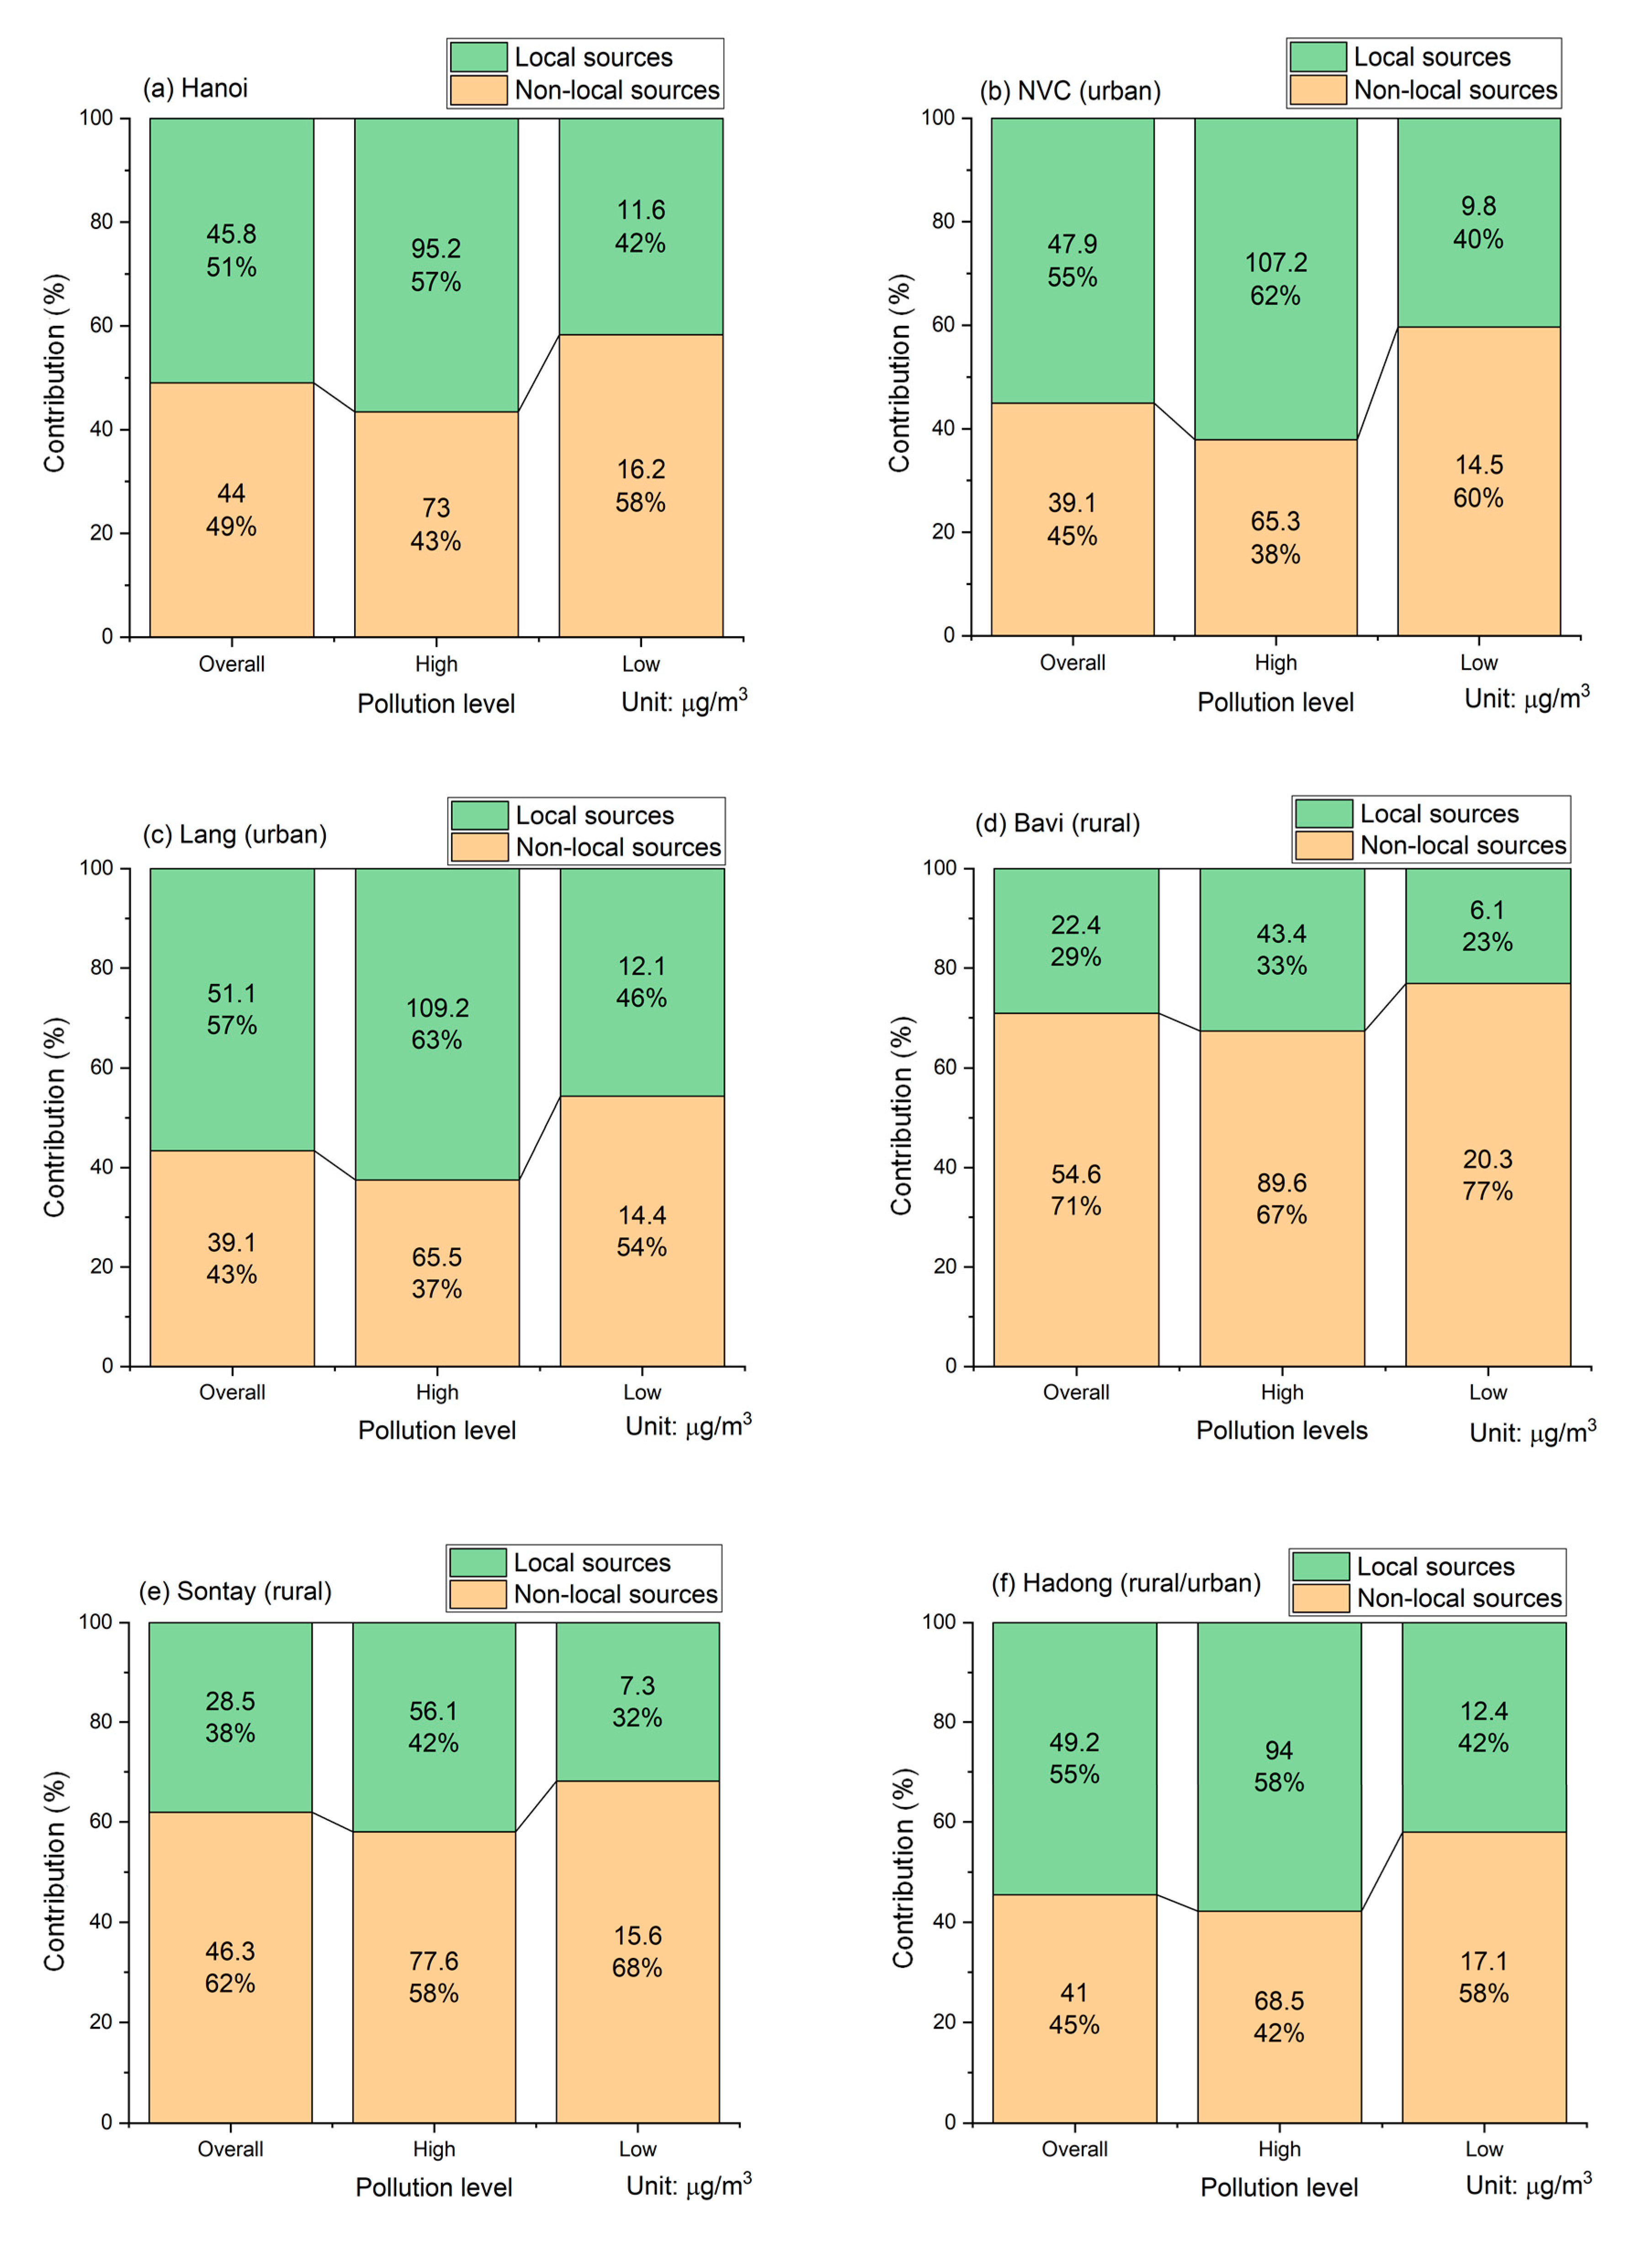
In December 2010, local and non-local pollution sources contributed similarly in terms of the city average for overall pollution levels (Figure 9a). Local emission sources contributed more to the total PM2.5 in Hanoi at high pollution levels and less at low pollution levels (Figure 9a). However, the contributions of local and non-local sources to the total PM2.5 concentration varied substantially depending on location. In urban areas (NVC, Lang and Hadong), local emission sources contributed more to the total PM2.5 at high pollution levels and less at low pollution levels than non-local emission sources (Figure 9b,c,f), with local emission sources comprising 55%, 62%, and 40% at NVC station and 57%, 63%, and 46% at Lang station during the overall, high, and low pollution levels, respectively. While Hadong station was classified as a rural station in this study, as the surrounding conditions were open grass fields and residential areas [56], Hadong itself is an urban district which is located near the most developed part of Hanoi, and thus is affected by the urbanization and industrialization of the city. Local emission sources comprised 55%, 58%, and 42% of the total concentrations of PM2.5 while non-local sources comprised 45%, 42%, and 58% of the total concentrations of PM2.5 for overall, high and low pollution levels, respectively. This may have been affected by the high density of pollution sources in urban areas. In contrast, non-local emission sources were the main contributor of PM2.5 for all pollution levels in the rural areas of Bavi and Sontay. Air pollutants coming from non-local emission sources comprised 71%, 67%, and 77% of the total concentrations of PM2.5 at Bavi station for overall, high and low pollution levels, respectively (Figure 9d). Similarly, non-local emission sources comprised 62%, 58%, and 68% of the total concentrations of PM2.5 at Sontay station for overall, high and low pollution levels, respectively (Figure 9e). This is supported by the fact that local emission sources dominantly contributed to PM2.5 in urban areas while non-local emission sources contributed more to PM2.5 in rural areas. Therefore, attention should be paid to both local and non-local emission sources when dealing with PM2.5 pollution in Hanoi.
3.3.2. Long-Range Transboundary Pollution in Urban Areas Caused by Cold Surge Events
There were some exceptional events associated with large contributions from non-local pollution sources at the stations located in urban areas; specifically, there were three events where the contribution of non-local sources accounted for nearly all the concentrations of PM2.5 at two urban stations (NVC and Lang; Figure 10, dashed lines). These events were associated with cold surges, which usually occur in winter and can transport air pollutants from other locations to Hanoi.
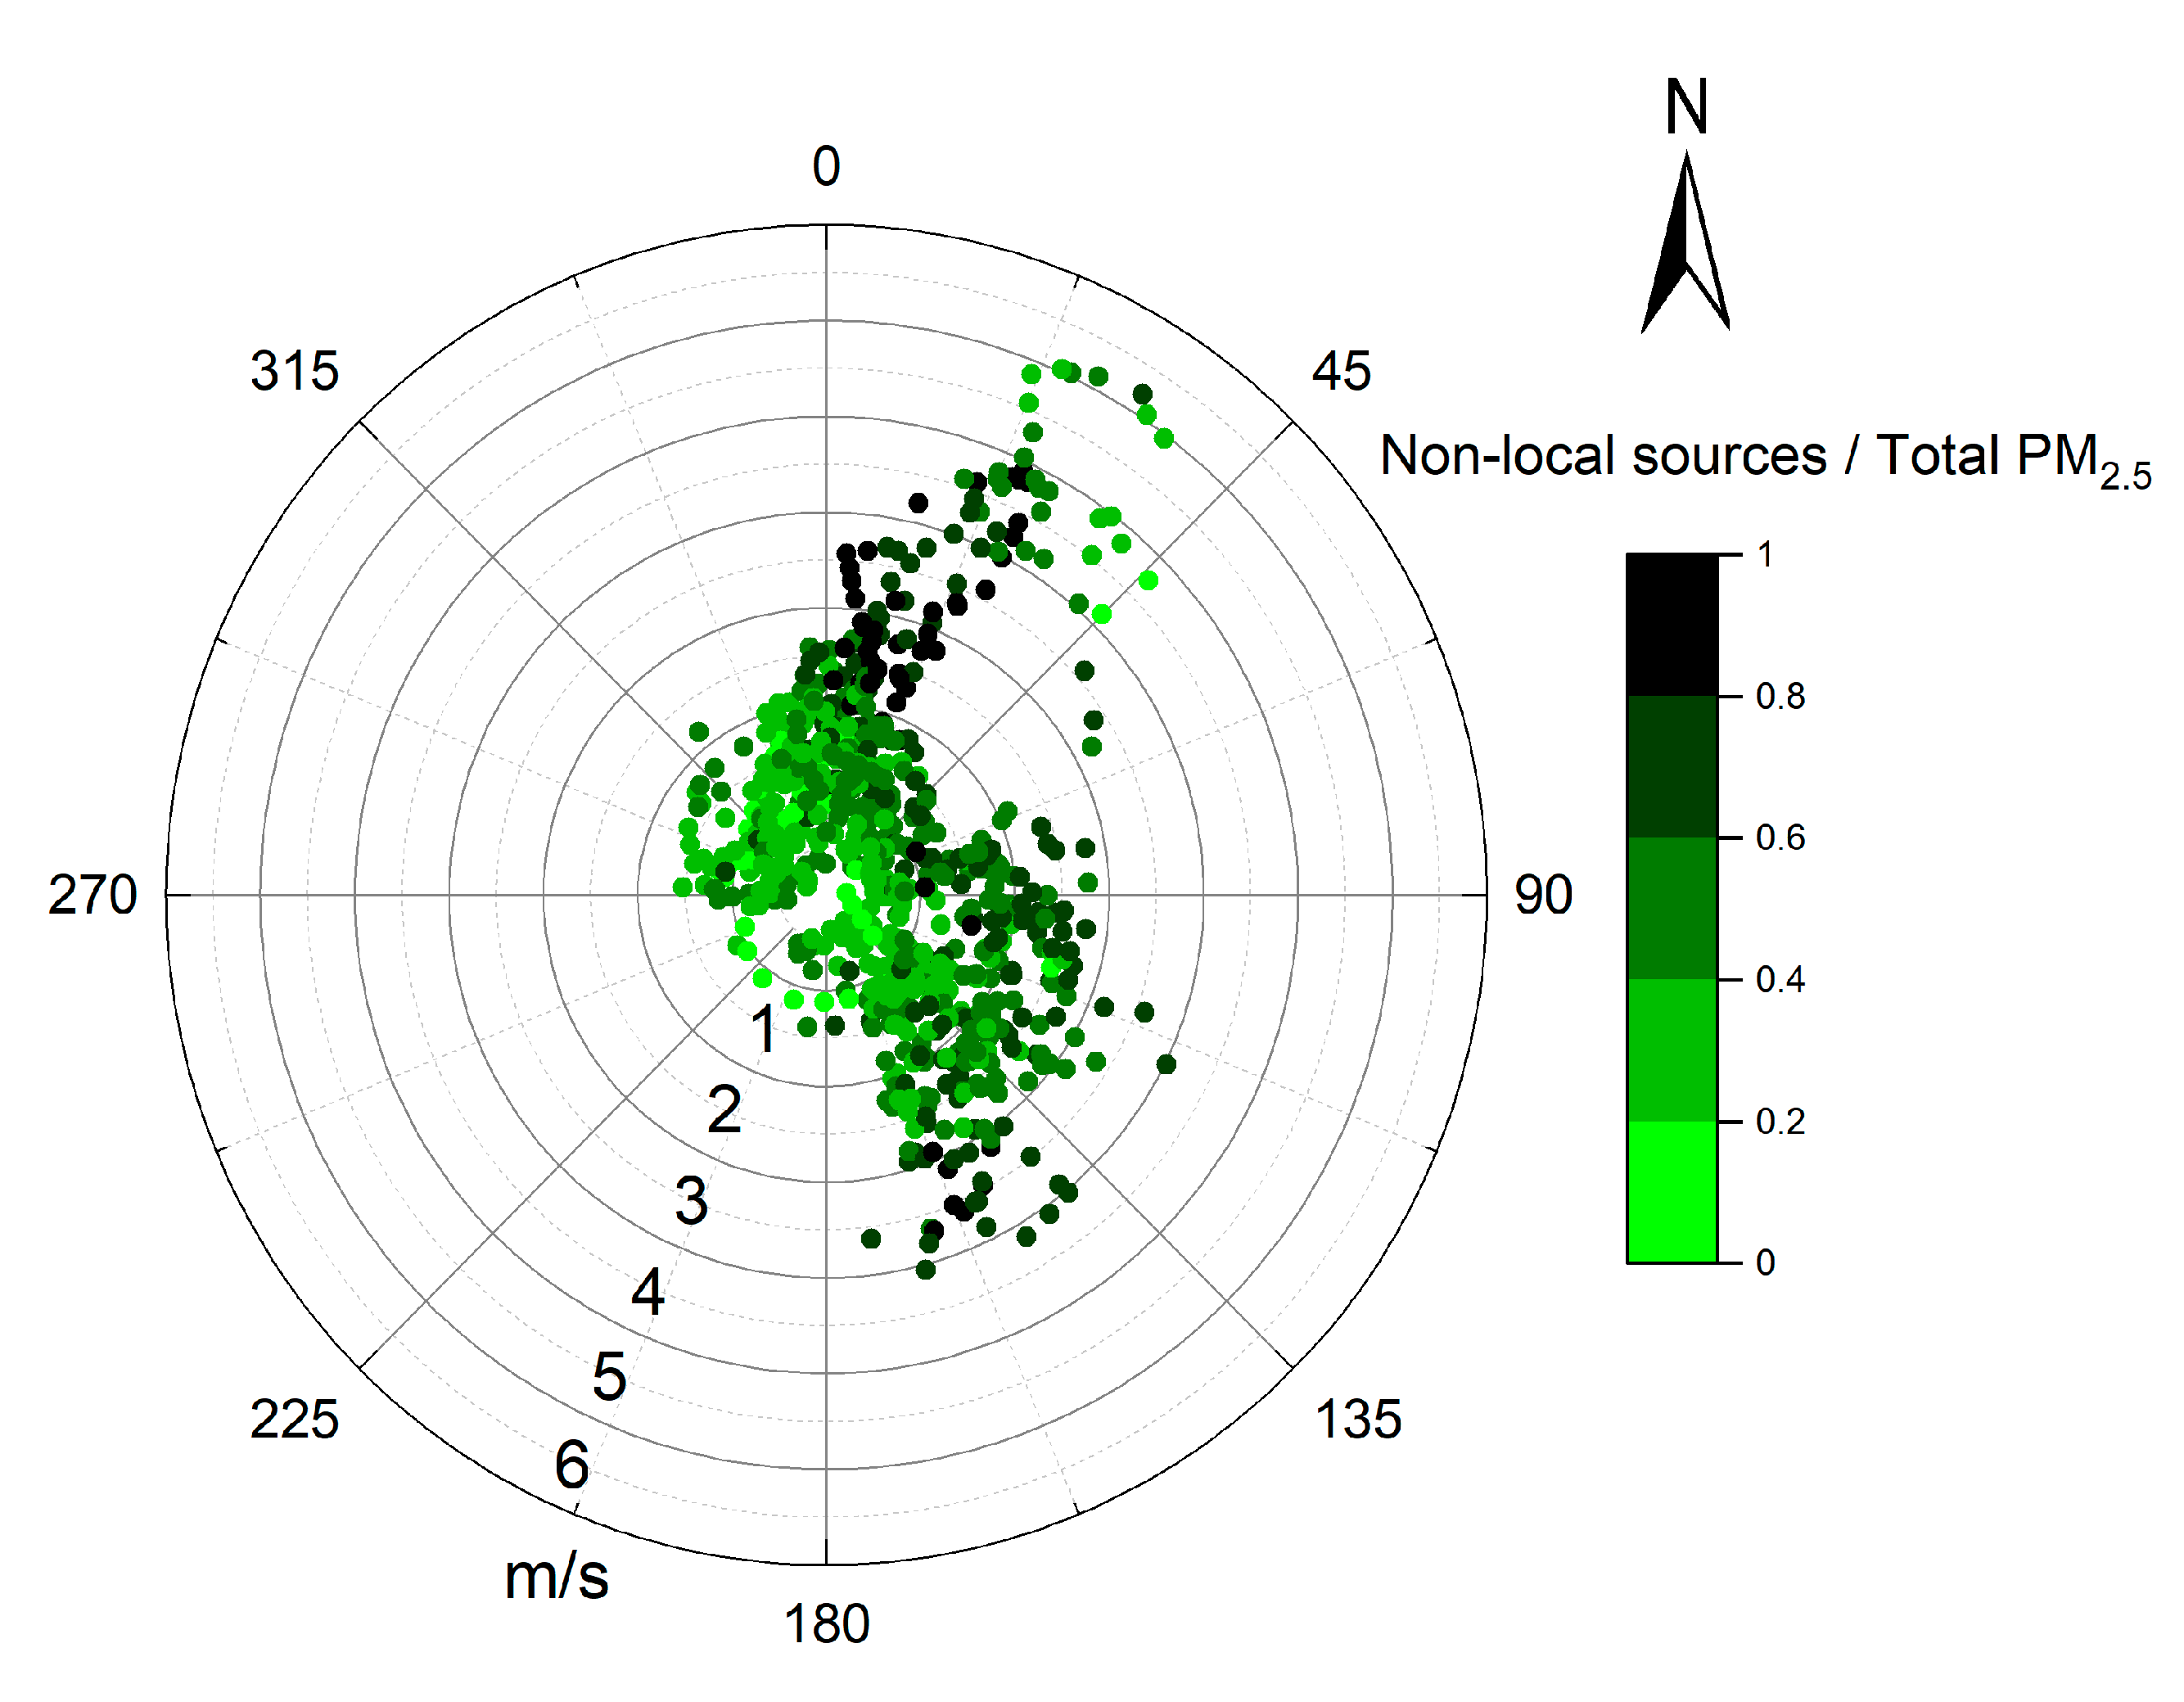
In December, three cold surges were captured by the WRF model (Figure 10). The criteria established in [57] was used to identify a cold surge (T2 drops (≥4 °C) and WS (≥3 m/s)). The maximum WS for each event was 4.74 m/s on 7 December, 6.2 m/s on 15 December, and 4.9 m/s on 25 December. These strong winds mostly derived from north of Hanoi which blew away the local air pollutants and bring the air pollutants from non-local emission sources into the city. Therefore, the contribution of non-local sources was dominant in these events. The relative contribution of non-local sources as a function of WS and WD showed the dominance of non-local source contribution for strong north to north-easterly winds (Figure 11). Note that not all cold surge events were associated with severe transboundary air pollution. For instance, the second cold surge event also showed a dominant contribution of non-local pollution sources, but the total concentration of PM2.5 was low due to the depleted concentration of PM2.5 in the upwind region (Figure 8b).
3.3.3. Contributions of Different Emission Sectors Inside Hanoi to Total Concentration of PM2.5
We carried out an additional sensitivity simulation to estimate the contribution of each local emission sources to the total PM2.5 in Hanoi. In this sensitivity analysis, we also applied the zero-out method by turning off, in turn, the emissions in Hanoi from each of the four major sources and used the modified emission data as input data for CMAQ. Other simulation settings, ICONs and BCONs, were kept the same as the base case. As the REAS emission inventory was used in this study, the results of this sensitivity analysis depended on this emission inventory selection. Here, we focused on four emission sources in Hanoi: transport, industry, residential sources, and power plants. Other emission sectors were grouped into ‘Others’.
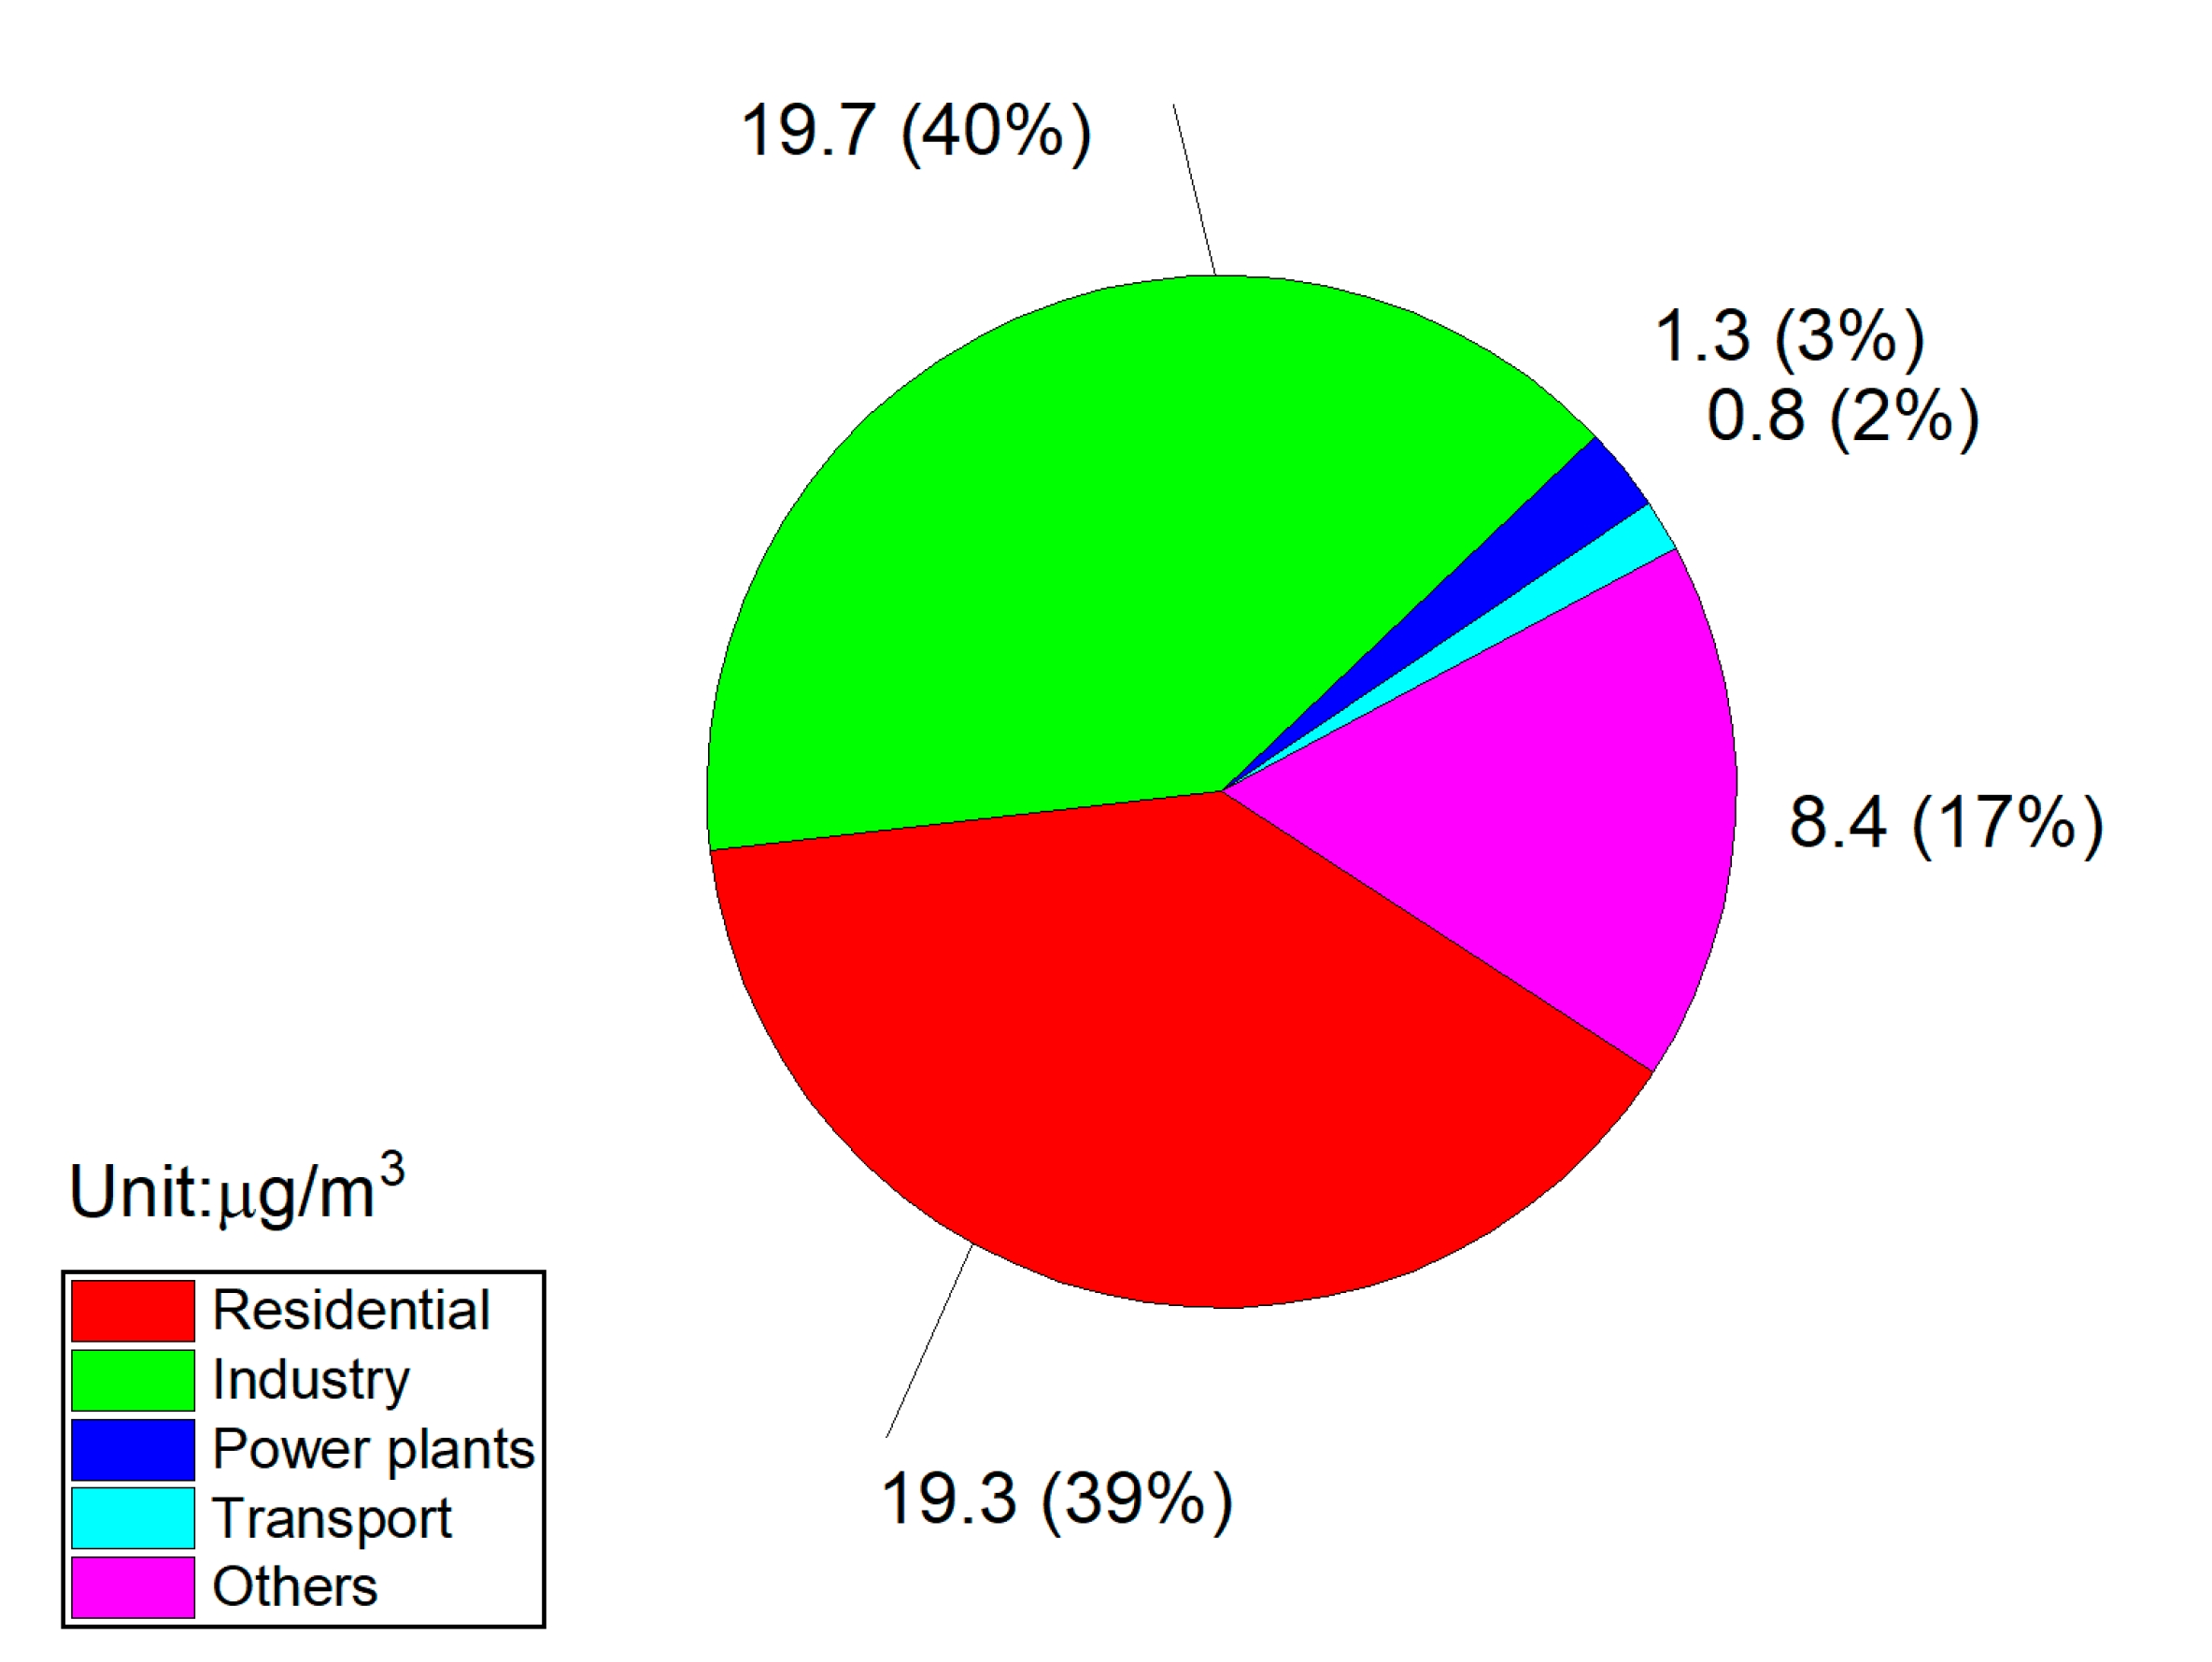
According to the results of the CMAQ simulations, in December 2010, industry and residential sources were the two main local sources of PM2.5 in Hanoi, comprising approximately 79% of the total concentration of PM2.5. The transport and power sectors only contributed 2% and 3% to the total concentrations of PM2.5, respectively (Figure 12). These findings differ from those in previous studies on PM2.5 in Hanoi [22,25]. Cohen et al. (2010) reported that vehicle exhausts contributed approximately 40.2% to PM2.5 concentrations followed by industry (18.7%), coal mining (17%), smoke (12.7%), secondary sulphates (7.8%), and soil (3.4%) [22]. In contrast, Hai and Kim Oanh (2013) observed that secondary mixed was the chief source of PM2.5 (40%) followed by secondary sulphates rich (16%), residential/commercial cooking (16%), aged sea-salt (11%), transport (diesel) (10%), industry (6%), and construction/soil (1%) [25]. Several factors such as the method, the type of data used in each study, the number and type of emission sources considered, as well as time period of each study may have accounted for the differences between the results presented in our study and those by previous works. In Cohen et al. [22], samples were only collected at one site in Hanoi, from 2000−2008. Positive matrix factorization (PMF) techniques were used to determine the contributions of emission sources. Similarly, in Hai and Kim Oanh [25], the PMF receptor model was used for the samples collected at only one site in Hanoi from 12 January to 20 February 2007 for PM2.5 source apportionment. On the other hand, the results of our modeling study were calculated for the entire city based on the REASv2.1 emission data. One of the disadvantages of sampling methods used in previous studies is that the result of source apportionment of PM2.5 depends largely on the location of the collected samples. Using modeling methods, our results represented the source distribution of PM2.5 for the entire city. However, it should be noted that the emission data for Vietnam in REASv2.1 were developed using international input data at a horizontal resolution of 0.25° × 0.25° [42]. Therefore, the number of emission sources, the horizontal resolution of REASv2.1 as well as the emissions inside modeling domains may have also been the reasons for the differences mentioned above. In the project using the GAINS and EMEP models, source apportionment of PM2.5 in Vietnam was also conducted [20]. The results showed that road transport was the main source of air pollution in Hanoi with about 25% contribution, followed by power plants and large industries (20%), residential cooking (15%), ammonia emissions from livestock farming and fertilizer (15%), open burning of agricultural waste (7%), and from other sectors (18%). Both studies used modeling methods to estimate the source apportionments for PM2.5 in Hanoi. There are several factors which might have led to the differences between the results of our study and those of the study [20] such as the differences in input emission data, the target year of each study, or the models used in each study. Among these, input emission data used in each study may have been the main reason for the differences in the results of each source apportionment simulation.
The zero-out method used in this study is a special case of the brute-force method which has been widely used to estimate the contributions of local and non-local emission sources or sectoral emission sources to the concentration of air pollutants at specific locations [32,58,59,60]. The BFM quantifies the contribution of one or more emission sources to the concentration of air pollutants at specific locations through a series of simulations including a base case simulation where no changes to emission sources are made and other simulations with modified emissions. The differences in concentrations of air pollutants between the base case simulation and the simulation with modified emissions can be considered as the contributions of individual emission sources to those specific locations. Estimated source contribution by the BFM is nearly linearly proportional to the perturbation for primary PM2.5 (BC, primary OC) but non-linearly depends on the perturbation for secondary PM2.5 (sulphate, nitrate, etc.), which can induce an uncertainty in the source contribution estimates [61,62]. For example, some global scale AQM analyses have revealed that the change in sulphate due to 100% reduction in anthropogenic SO2 emission calculated by zero-out method tends to be larger than that due to smaller (e.g., 25%) reduction in SO2 emission [63,64,65], suggesting that the results in this study may be subject to the non-linear effect. However, quantitative assessment of this effect is out of the scope of this study.
4. Suggestions for Improvement in Future Modeling Studies on PM2.5 in Hanoi
This study is the first case study to have evaluated the impact of emission sources and meteorology on the concentrations of PM2.5 in Hanoi using the WRF/CMAQ system. Based on the results of this study, we offer some suggestions for improvements in future modeling studies on PM2.5 in Hanoi:
Although REASv2.1 have been widely used for air quality studies in Asian countries [32,66,67,68], the emission data for Vietnam in REASv2.1 was developed based on international data at a horizontal resolution of 0.25° × 0.25° [42]. For better modeling studies on PM2.5 in Hanoi, local input data should also be used to develop emissions inventories for Hanoi at a higher horizontal resolution which are more suitable for simulations at urban areas.
One-month simulations in a particular year (December 2010) were carried out in this study to evaluate the contribution of each emission source to the total PM2.5 in Hanoi. This may not be long enough to represent the overall situation of PM2.5 air pollution in Hanoi because the emissions and the concentrations of PM2.5 and its precursors vary according to seasons, years, and emission sources. A more comprehensive modeling study for a recent year should be conducted which covers all seasons to provide a broader and more comprehensive look at the PM2.5 air pollution in Hanoi.
There were only two monitoring sites in Hanoi in December 2010 with data on PM which were suitable for validating CMAQ simulations. Future modeling studies should consider including more monitoring sites for better validation of CMAQ simulations.
5. Conclusions
This study is the first case study which investigated the impacts of emission sources and meteorology (Precipitation, WS, and WD) on the concentrations of PM2.5 in Hanoi in December 2010, using the WRF/CMAQ system. The WRF captured the temporal variations in T2, WS, and RH. WRF overestimated WS mainly due to the insufficient representation of the impact of tall buildings near the NVC site. Regarding the quality of CMAQ simulations, the model captured the temporal variation in the observed total PM2.5. However, CMAQ tended to overestimate observed PM2.5 at peak concentrations. This study presents new findings on the contributions of local and non-local emission sources, as well as the contributions of local emission sectors to PM2.5 in Hanoi in December 2010. This study is a good basis for further environmental studies supporting air quality management in Hanoi and the region.
On a larger scale, precipitation can positively impact PM2.5 concentrations by removing air pollutants in the surrounding areas, including eastern China. As a result, there was a substantial decrease in the contribution of transboundary air pollution on PM2.5 pollution in Hanoi. WS and WD were also important factors affecting PM2.5 concentrations in winter. High WS accounted for the dominance of the impact of non-local sources over that of local sources on the air quality in Hanoi when the upwind PM2.5 concentrations were high. In contrast, when the upwind PM2.5 concentrations were low, high WS did not bring high PM2.5 concentrations due to non-local source but rather removed local air pollutants from the city.
Two sensitivity simulations were established in this study. The first simulation investigated the relative impact of total PM2.5 and its precursors that were emitted from local and non-local emission sources, on the air quality in Hanoi, while the second simulation determined the main local emission sector of PM2.5 in Hanoi in December 2010. The results of the first simulation showed that local and non-local emission sources contributed similarly to the total PM2.5 concentration, when overall concentration ranges were considered and averaged over the entire Hanoi area. Local and non-local sources made up 57% and 43% of the total PM2.5 concentration, respectively, during high pollution levels, and 42% and 58%, respectively, during low pollution levels. In urban areas, local emission sources contributed more to the total concentrations of PM2.5 especially during the overall and high pollution levels. However, local emission sources had a lower impact than non-local emission sources on the air quality in rural areas. During high WS events (cold surges), PM2.5 transported from outside Hanoi can become the main source of total PM2.5 even in urban areas. The results of the second simulation showed that the main local sources of PM2.5 in Hanoi in December 2010 were industrial and residential activities which contributed 79% to the total PM2.5, while transport and power sectors contributed only 2% and 3% to the total PM2.5, respectively.
Author Contributions
Conceptualization, T.H.N. and T.N.; Methodology, T.H.N. and T.N.; Validation, T.H.N.; Formal analysis, T.H.N.; Writing—original draft preparation, T.H.N.; Writing—review and editing, T.H.N., T.N., and Q.-V.D. All authors have read and agreed to the published version of the manuscript.
Funding
This research received no external funding.
Acknowledgments
The computational resources were provided by the National Institute for Environmental Studies.
Conflicts of Interest
The authors declare no conflict of interest.
Appendix A

Table A1.
Contributions of emission sectors to total emissions of air pollutants in d03 (ton/month). Parentheses show sectoral contributions in % to the total emissions.
Table A1.
Contributions of emission sectors to total emissions of air pollutants in d03 (ton/month). Parentheses show sectoral contributions in % to the total emissions.
| SO2 | NOx | PM2.5 | BC | OC | VOC | NH3 | |
|---|---|---|---|---|---|---|---|
| Domestic | 2440.90 (10.81) | 1888 (11.16) | 7035.04 (51.77) | 1400.29 (56.65) | 5436.31 (84.6) | 25,996.49 (56.98) | 1474.96 (9.88) |
| Industry | 14,963.63 (66.25) | 5340.97 (31.56) | 5831.59 (42.91) | 943.56 (37.17) | 905.53 (14.09) | 1871.92 (4.1) | 396.78 (2.66) |
| Road transport | 445.46 (1.97) | 4378.04 (25.87) | 269.55 (1.98) | 120.86 (4.89) | 83.29 (1.3) | 11,007.58 (24.13) | 272.33 (1.82) |
| Power plant | 3238.94 (14.34) | 2394.83 (14.15) | 213.66 (1.57) | 3.70 (0.15) | 0.64 (0.01) | 65.87 (0.14) | 7.79 (0.05) |
| Others | 1498.34 (6.63) | 2921.92 (17.26) | 238.96 (1.76) | 3.54 (0.14) | 0.23 (0.004) | 6679.23 (14.64) | 12,779.24 (85.59) |
References
- Dockery, D.W.; Pope, C.A.; Xu, X.; Spengler, J.D.; Ware, J.H.; Fay, M.E.; Ferris, B.G.; Speizer, F.E. An Association between Air Pollution and Mortality in Six U.S. Cities. N. Engl. J. Med. 1993, 329, 1753–1759. [Google Scholar] [CrossRef] [PubMed] [Green Version]
- Linares, B.; Guizar, J.M.; Amador, N.; Garcia, A.; Miranda, V.; Perez, J.R.; Chapela, R. Impact of air pollution on pulmonary function and respiratory symptoms in children. Longitudinal repeated-measures study. BMC Pulm. Med. 2010, 10, 62. [Google Scholar] [CrossRef] [PubMed] [Green Version]
- Michiels, H.; Mayeres, I.; Int Panis, L.; De Nocker, L.; Deutsch, F.; Lefebvre, W. PM2.5 and NOx from traffic: Human health impacts, external costs and policy implications from the Belgian perspective. Transp. Res. D. Transp. Environ. 2012, 17, 569–577. [Google Scholar] [CrossRef]
- Schulze, F.; Gao, X.; Virzonis, D.; Damiati, S.; Schneider, M.; Kodzius, R. Air Quality Effects on Human Health and Approaches for Its Assessment through Microfluidic Chips. Genes 2017, 8, 244. [Google Scholar] [CrossRef]
- Herrera-Dueñas, A.; Pineda, J.; Antonio, M.T.; Aguirre, J.I. Oxidative stress of House Sparrow as bioindicator of urban pollution. Ecol. Indic. 2014, 42, 6–9. [Google Scholar] [CrossRef]
- Pope, C.A.; Dockery, D.W. Health Effects of Fine Particulate Air Pollution: Lines that Connect. J. Air Waste Manag. Assoc. 2006, 56, 709–742. [Google Scholar] [CrossRef]
- Xing, Y.-F.; Xu, Y.-H.; Shi, M.-H.; Lian, Y.-X. The impact of PM2.5 on the human respiratory system. J. Thorac. Dis. 2016, 8, 69–74. [Google Scholar] [CrossRef]
- Weber, S.A.; Insaf, T.Z.; Hall, E.S.; Talbot, T.O.; Huff, A.K. Assessing the impact of fine particulate matter (PM2.5) on respiratory-cardiovascular chronic diseases in the New York City Metropolitan area using Hierarchical Bayesian Model estimates. Environ. Res. 2016, 151, 399–409. [Google Scholar] [CrossRef] [Green Version]
- Chen, F.; Lin, Z.; Chen, R.; Norback, D.; Liu, C.; Kan, H.; Deng, Q.; Huang, C.; Hu, Y.; Zou, Z.; et al. The effects of PM2.5 on asthmatic and allergic diseases or symptoms in preschool children of six Chinese cities, based on China, Children, Homes and Health (CCHH) project. Environ. Pollut. 2018, 232, 329–337. [Google Scholar] [CrossRef] [PubMed]
- Guo, Y.; Zeng, H.; Zheng, R.; Li, S.; Barnett, A.G.; Zhang, S.; Zou, X.; Huxley, R.; Chen, W.; Williams, G. The association between lung cancer incidence and ambient air pollution in China: A spatiotemporal analysis. Environ. Res. 2016, 144, 60–65. [Google Scholar] [CrossRef]
- Chang, L.; Scorgie, Y.; Duc, H.; Monk, K.; Fuchs, D.; Trieu, T. Major Source Contributions to Ambient PM2.5 and Exposures within the New South Wales Greater Metropolitan Region. Atmosphere 2019, 10, 138. [Google Scholar] [CrossRef] [Green Version]
- Ferm, M.; Sjöberg, K. Concentrations and emission factors for PM2.5 and PM10 from road traffic in Sweden. Atmos. Environ. 2015, 119, 211–219. [Google Scholar] [CrossRef]
- Luong, L.M.T.; Phung, D.; Sly, P.D.; Morawska, L.; Thai, P.K. The association between particulate air pollution and respiratory admissions among young children in Hanoi, Vietnam. Sci. Total Environ. 2017, 578, 249–255. [Google Scholar] [CrossRef] [PubMed] [Green Version]
- Srimuruganandam, B.; Shiva Nagendra, S.M. Source characterization of PM10 and PM2.5 mass using a chemical mass balance model at urban roadside. Sci. Total Environ. 2012, 433, 8–19. [Google Scholar] [CrossRef]
- Guo, H.; Kota, S.H.; Sahu, S.K.; Hu, J.; Ying, Q.; Gao, A.; Zhang, H. Source apportionment of PM2.5 in North India using source-oriented air quality models. Environ. Pollut. 2017, 231, 426–436. [Google Scholar] [CrossRef]
- Querol, X.; Alastuey, A.; Ruiz, C.R.; Artiñano, B.; Hansson, H.C.; Harrison, R.M.; Buringh, E.; ten Brink, H.M.; Lutz, M.; Bruckmann, P.; et al. Speciation and origin of PM10 and PM2.5 in selected European cities. Atmos. Environ. 2004, 38, 6547–6555. [Google Scholar] [CrossRef]
- Ministry of Natural Resources and Environment. National State of Environment: Air Environment; Vietnam Publishing House of Natural Resources, Environment and Cartography: Hanoi, Vietnam, 2014; p. 138. ISBN 978-604-904-248-5.
- Ho, B.Q.; Clappier, A.; François, G. Air pollution forecast for Ho Chi Minh City, Vietnam in 2015 and 2020. Air Qual. Atmos. Health 2011, 4, 145–158. [Google Scholar] [CrossRef]
- Hung, N.T.; Ketzel, M.; Jensen, S.S.; Oanh, N.T.K. Air Pollution Modeling at Road Sides Using the Operational Street Pollution Model—A Case Study in Hanoi, Vietnam. J. Air Waste Manag. Assoc. 2010, 60, 1315–1326. [Google Scholar] [CrossRef]
- Amann, M.; Klimont, Z.; Truong, A.H.; Rafaj, P.; Kiesewetter, G.; Nguyen, B.; Nguyen Thi, T.; Thuy Kim, M.; Schopp, W.; Sander, R.; et al. Future Air Quality in Ha Noi and Northern Vietnam; IIASA Research Report: Laxenburg, Austria, 2018; RR-19-003. [Google Scholar]
- Lasko, K.; Vadrevu, K.P.; Nguyen, T.T.N. Analysis of air pollution over Hanoi, Vietnam using multi-satellite and MERRA reanalysis datasets. PLoS ONE 2018, 13, e0196629. [Google Scholar] [CrossRef] [PubMed] [Green Version]
- Cohen, D.D.; Crawford, J.; Stelcer, E.; Bac, V.T. Characterisation and source apportionment of fine particulate sources at Hanoi from 2001 to 2008. Atmos. Environ. 2010, 44, 320–328. [Google Scholar] [CrossRef]
- Ly, B.-T.; Matsumi, Y.; Nakayama, T.; Sakamoto, Y.; Kajii, Y.; Nghiem, T.-D. Characterizing PM2.5 in Hanoi with New High Temporal Resolution Sensor. Aerosol Air Qual. Res. 2018, 18, 2487–2497. [Google Scholar] [CrossRef]
- Ministry of Natural Resources and Environment. National State of Environment: Urban Environment; Vietnam Publishing House of Natural Resources, Environment and Cartography: Hanoi, Vietnam, 2017; p. 168. ISBN 978-604-952-138-6.
- Hai, C.D.; Kim Oanh, N.T. Effects of local, regional meteorology and emission sources on mass and compositions of particulate matter in Hanoi. Atmos. Environ. 2013, 78, 105–112. [Google Scholar] [CrossRef]
- Snider, G.; Weagle, C.L.; Murdymootoo, K.K.; Ring, A.; Ritchie, Y.; Stone, E.; Walsh, A.; Akoshile, C.; Anh, N.X.; Balasubramanian, R.; et al. Variation in global chemical composition of PM2.5: Emerging results from SPARTAN. Atmos. Chem. Phys. 2016, 16, 9629–9653. [Google Scholar] [CrossRef] [Green Version]
- General Statistic Office Statistical Yearbook of Vietnam 2011; Statistical Publishing House: Hanoi, Vietnam, 2012.
- Kim Oanh, N.T.; Upadhyay, N.; Zhuang, Y.-H.; Hao, Z.-P.; Murthy, D.V.S.; Lestari, P.; Villarin, J.T.; Chengchua, K.; Co, H.X.; Dung, N.T. Particulate air pollution in six Asian cities: Spatial and temporal distributions, and associated sources. Atmos. Environ. 2006, 40, 3367–3380. [Google Scholar] [CrossRef]
- Kang, H.; Zhu, B.; Gao, J.; He, Y.; Wang, H.; Su, J.; Pan, C.; Zhu, T.; Yu, B. Potential impacts of cold frontal passage on air quality over the Yangtze River Delta, China. Atmos. Chem. Phys. 2019, 19, 3673–3685. [Google Scholar] [CrossRef] [Green Version]
- Yang, X.; Wu, Q.; Zhao, R.; Cheng, H.; He, H.; Ma, Q.; Wang, L.; Luo, H. New method for evaluating winter air quality: PM2.5 assessment using Community Multi-Scale Air Quality Modeling (CMAQ) in Xi’an. Atmos. Environ. 2019, 211, 18–28. [Google Scholar] [CrossRef]
- Kim, H.C.; Kim, E.; Bae, C.; Cho, J.H.; Kim, B.-U.; Kim, S. Regional contributions to particulate matter concentration in the Seoul metropolitan area, South Korea: Seasonal variation and sensitivity to meteorology and emissions inventory. Atmos. Chem. Phys. 2017, 17, 10315–10332. [Google Scholar] [CrossRef] [Green Version]
- Ikeda, K.; Tanimoto, H. Exceedances of air quality standard level of PM2.5 in Japan caused by Siberian wildfires. Environ. Res. Lett. 2015, 10, 105001. [Google Scholar] [CrossRef]
- Nguyen, G.T.H.; Shimadera, H.; Uranishi, K.; Matsuo, T.; Kondo, A. Numerical assessment of PM2.5 and O3 air quality in Continental Southeast Asia: Impacts of potential future climate change. Atmos. Environ. 2019, 215, 116901. [Google Scholar] [CrossRef]
- Nguyen, G.T.H.; Shimadera, H.; Uranishi, K.; Matsuo, T.; Kondo, A.; Thepanondh, S. Numerical assessment of PM2.5 and O3 air quality in continental Southeast Asia: Baseline simulation and aerosol direct effects investigation. Atmos. Environ. 2019, 219, 117054. [Google Scholar] [CrossRef]
- Tewari, M.; Chen, F.; Wang, W.; Dudhia, J.; Lemone, M.A.; Mitchell, K.E.; Gayno, M.E.; Wegiel, J.W.; Cuenca, R. Implementation and Verification of the Unified Noah Land-Surface Model in the WRF Model [Presentation]; American Meteorological Society: Seattle, WA, USA, 2004. [Google Scholar]
- Hong, S.-Y.; Dudhia, J.; Chen, S.-H. A Revised Approach to Ice Microphysical Processes for the Bulk Parameterization of Clouds and Precipitation. Mon. Weather Rev. 2004, 132, 103–120. [Google Scholar] [CrossRef]
- Dudhia, J. Numerical Study of Convection Observed during the Winter Monsoon Experiment Using a Mesoscale Two-Dimensional Model. J. Atmos. Sci. 1989, 46, 3077–3107. [Google Scholar] [CrossRef]
- Mlawer, E.J.; Taubman, S.J.; Brown, P.D.; Iacono, M.J.; Clough, S.A. Radiative transfer for inhomogeneous atmospheres: RRTM, a validated correlated-k model for the longwave. J. Geophys. Res. Atmos. 1997, 102, 16663–16682. [Google Scholar] [CrossRef] [Green Version]
- Hong, S.-Y.; Noh, Y.; Dudhia, J. A New Vertical Diffusion Package with an Explicit Treatment of Entrainment Processes. Mon. Wea. Rev. 2006, 134, 2318–2341. [Google Scholar] [CrossRef] [Green Version]
- National Centers for Environmental Prediction/National Weather Service/NOAA/U.S. Department of Commerce. 2000, updated daily. NCEP FNL Operational Model Global Tropospheric Analyses, Continuing from July 1999. Research Data Archive at the National Center for Atmospheric Research, Computational and Information Systems Laboratory. Available online: https://doi.org/10.5065/D6M043C6 (accessed on 19 May 2019).
- Carter, W.P.L. Implementation of the Saprc-99 Chemical Mechanism into the Models-3 Framework; United States Environmental Protection Agency: Washington, DC, USA, 2000; p. 101.
- Kurokawa, J.; Ohara, T.; Morikawa, T.; Hanayama, S.; Janssens-Maenhout, G.; Fukui, T.; Kawashima, K.; Akimoto, H. Emissions of air pollutants and greenhouse gases over Asian regions during 2000–2008: Regional Emission inventory in ASia (REAS) version 2. Atmos. Chem. Phys. 2013, 13, 11019–11058. [Google Scholar] [CrossRef] [Green Version]
- Guenther, A.B.; Jiang, X.; Heald, C.L.; Sakulyanontvittaya, T.; Duhl, T.; Emmons, L.K.; Wang, X. The Model of Emissions of Gases and Aerosols from Nature version 2.1 (MEGAN2.1): An extended and updated framework for modeling biogenic emissions. Geosci. Model Dev. 2012, 5, 1471–1492. [Google Scholar] [CrossRef] [Green Version]
- Randerson, J.T.; van der Werf, G.R.; Giglio, L.; Collatz, G.J.; Kasibhatla, P.S. Global Fire Emissions Database, Version 3.1. ORNL DAAC: Oak Ridge, TN, USA, 2013. [Google Scholar] [CrossRef]
- van der Werf, G.R.; Randerson, J.T.; Giglio, L.; Collatz, G.J.; Mu, M.; Kasibhatla, P.S.; Morton, D.C.; DeFries, R.S.; Jin, Y.; van Leeuwen, T.T. Global fire emissions and the contribution of deforestation, savanna, forest, agricultural, and peat fires (1997–2009). Atmos. Chem. Phys. 2010, 10, 11707–11735. [Google Scholar] [CrossRef] [Green Version]
- Wang, N.; Guo, H.; Jiang, F.; Ling, Z.H.; Wang, T. Simulation of ozone formation at different elevations in mountainous area of Hong Kong using WRF-CMAQ model. Sci. Total Environ. 2015, 505, 939–951. [Google Scholar] [CrossRef]
- Darmanto, N.S.; Varquez, A.C.G.; Kanda, M. Urban roughness parameters estimation from globally available datasets for mesoscale modeling in megacities. Urban Clim. 2017, 21, 243–261. [Google Scholar] [CrossRef]
- Emery, C.; Liu, Z.; Russell, A.G.; Odman, M.T.; Yarwood, G.; Kumar, N. Recommendations on statistics and benchmarks to assess photochemical model performance. J. Air Waste Manag. Assoc. 2017, 67, 582–598. [Google Scholar] [CrossRef] [Green Version]
- Boylan, J.W.; Russell, A.G. PM and light extinction model performance metrics, goals, and criteria for three-dimensional air quality models. Atmos. Environ. 2006, 40, 4946–4959. [Google Scholar] [CrossRef]
- Wu, J.; Xu, C.; Wang, Q.; Cheng, W. Potential Sources and Formations of the PM2.5 Pollution in Urban Hangzhou. Atmosphere 2016, 7, 100. [Google Scholar] [CrossRef] [Green Version]
- Hien, P.D.; Loc, P.D.; Dao, N.V. Air pollution episodes associated with East Asian winter monsoons. Sci. Total Environ. 2011, 409, 5063–5068. [Google Scholar] [CrossRef] [PubMed]
- Brasseur, G.P.; Jacob, D.J. Modeling of Atmospheric Chemistry; Cambridge University Press: Cambridge, UK, 2017; ISBN 978-1-107-14696-9. [Google Scholar]
- Ngo, N.S.; Zhong, N.; Bao, X. The effects of transboundary air pollution following major events in China on air quality in the U.S.: Evidence from Chinese New Year and sandstorms. J. Environ. Manag. 2018, 212, 169–175. [Google Scholar] [CrossRef]
- Wang, J.; Zhang, M.; Bai, X.; Tan, H.; Li, S.; Liu, J.; Zhang, R.; Wolters, M.A.; Qin, X.; Zhang, M.; et al. Large-scale transport of PM2.5 in the lower troposphere during winter cold surges in China. Sci. Rep. 2017, 7, 13238. [Google Scholar] [CrossRef] [Green Version]
- Lee, S.; Ho, C.-H.; Lee, Y.G.; Choi, H.-J.; Song, C.-K. Influence of transboundary air pollutants from China on the high-PM10 episode in Seoul, Korea for the period 16–20 October 2008. Atmos. Environ. 2013, 77, 430–439. [Google Scholar] [CrossRef]
- Kubota, T.; Lee, H.S.; Trihamdani, A.R.; Phuong, T.T.T.; Tanaka, T.; Matsuo, K. Impacts of land use changes from the Hanoi Master Plan 2030 on urban heat islands: Part 1. Cooling effects of proposed green strategies. Sustain. Cities Soc. 2017, 32, 295–317. [Google Scholar] [CrossRef]
- Chen, T.-C.; Yen, M.-C.; Huang, W.-R.; Gallus Jr, W.A. An East Asian Cold Surge: Case Study. Mon. Weather Rev. 2002, 130, 2271–2290. [Google Scholar] [CrossRef]
- Li, N.; Lu, Y.; Liao, H.; He, Q.; Li, J.; Long, X. WRF-Chem modeling of particulate matter in the Yangtze River Delta region: Source apportionment and its sensitivity to emission changes. PLoS ONE 2018, 13, e0208944. [Google Scholar] [CrossRef] [PubMed]
- Sharma, S.; Chatani, S.; Mahtta, R.; Goel, A.; Kumar, A. Sensitivity analysis of ground level ozone in India using WRF-CMAQ models. Atmos. Environ. 2016, 131, 29–40. [Google Scholar] [CrossRef]
- Zhang, Z.; Wang, W.; Cheng, M.; Liu, S.; Xu, J.; He, Y.; Meng, F. The contribution of residential coal combustion to PM2.5 pollution over China’s Beijing-Tianjin-Hebei region in winter. Atmos. Environ. 2017, 159, 147–161. [Google Scholar] [CrossRef]
- Burr, M.J.; Zhang, Y. Source apportionment of fine particulate matter over the Eastern U.S. Part I: Source sensitivity simulations using CMAQ with the Brute Force method. Atmos. Pollut. Res. 2011, 2, 300–317. [Google Scholar] [CrossRef] [Green Version]
- Clappier, A.; Belis, C.A.; Pernigotti, D.; Thunis, P. Source apportionment and sensitivity analysis: Two methodologies with two different purposes. Geosci. Model Dev. 2017, 10, 4245–4256. [Google Scholar] [CrossRef] [Green Version]
- Liu, J.; Mauzerall, D.L.; Horowitz, L.W. Source-receptor relationships between East Asian sulfur dioxide emissions and Northern Hemisphere sulfate concentrations. Atmos. Chem. Phys. 2008, 8, 3721–3733. [Google Scholar] [CrossRef] [Green Version]
- Lin, M.; Oki, T.; Bengtsson, M.; Kanae, S.; Holloway, T.; Streets, D.G. Long-range transport of acidifying substances in East Asia—Part II: Source–receptor relationships. Atmos. Environ. 2008, 42, 5956–5967. [Google Scholar] [CrossRef]
- Task Force on Hemispheric Transport of Air Pollution (HTAP). Hemispheric Transport of Air Pollution 2010 Part A: Ozone and Particulate Matter Air Pollution Studies No. 17; Dentener, F., Keating, T., Akimoto, H., Eds.; United Nations Publication: Geneva, Switzerland; New York, NY, USA, 2010; p. 278. [Google Scholar]
- Hu, J.; Chen, J.; Ying, Q.; Zhang, H. One-year simulation of ozone and particulate matter in Chinausing WRF/CMAQ modeling system. Atmos. Chem. Phys. 2016, 16, 10333–10350. [Google Scholar] [CrossRef] [Green Version]
- Hu, J.; Li, X.; Huang, L.; Ying, Q.; Zhang, Q.; Zhao, B.; Wang, S.; Zhang, H. Ensemble prediction of air quality using the WRF/CMAQ model system for health effect studies in China. Atmos. Chem. Phys. 2017, 17, 13103–13118. [Google Scholar] [CrossRef] [Green Version]
- Itahashi, S.; Yumimoto, K.; Kurokawa, J.; Morino, Y.; Nagashima, T.; Miyazaki, K.; Maki, T.; Ohara, T. Inverse estimation of NOx emissions over China and India 2005–2016: Contrasting recent trends and future perspectives. Environ. Res. Lett. 2019, 14, 124020. [Google Scholar] [CrossRef] [Green Version]
Figure 1.
(Left) Map of Vietnam and neighboring countries. (Right) Administrative map of Hanoi and its districts (colored parts). Two air quality stations (red triangles) and four meteorological stations (black triangles) are shown. The areas in green represent urban districts which are in the center of Hanoi. The areas in yellow represent rural districts.

Figure 2.
(Left) Three nested domains for WRF (black boxes) and CMAQ (red boxes). d02 for CMAQ is not shown because we did not consider it in this study. (Right) Terrain height with location of each station in d03.
Figure 2.
(Left) Three nested domains for WRF (black boxes) and CMAQ (red boxes). d02 for CMAQ is not shown because we did not consider it in this study. (Right) Terrain height with location of each station in d03.

Figure 3.
Anthropogenic emissions of individual sector in d01 in December 2010.

Figure 4.
Anthropogenic emissions of individual sector in d03 in December 2010.

Figure 5.
Spatial distribution of primary PM2.5 in December 2010 from all sectors in d01.

Figure 6.
Comparison of (a) temperature, (b) relative humidity (solid lines) and water mixing ratio (dotted lines), (c) wind speed and (d) wind direction at NVC station. The magnitude of each vector represents the wind speed.
Figure 6.
Comparison of (a) temperature, (b) relative humidity (solid lines) and water mixing ratio (dotted lines), (c) wind speed and (d) wind direction at NVC station. The magnitude of each vector represents the wind speed.

Figure 7.
Comparison of simulated (black line) and observed (red line) PM2.5 in December 2010. The grey bars denote nighttime periods.
Figure 7.
Comparison of simulated (black line) and observed (red line) PM2.5 in December 2010. The grey bars denote nighttime periods.

Figure 8.
Simulated surface concentrations of hourly mean PM2.5 concentration, WS and WD (a) from 1 to 10 December; (b) from 11 to 16 December; (c) from 17 to 31 December 2010; and (d) daily mean precipitation from 11 to 16 December. The red triangle in each map represents the center of Hanoi.
Figure 8.
Simulated surface concentrations of hourly mean PM2.5 concentration, WS and WD (a) from 1 to 10 December; (b) from 11 to 16 December; (c) from 17 to 31 December 2010; and (d) daily mean precipitation from 11 to 16 December. The red triangle in each map represents the center of Hanoi.

Figure 9.
Relative contributions of local and non-local emission sources to PM2.5 concentrations at three pollution levels: overall, high, and low. Contribution averaged across Hanoi (a) and those deduced from the grid points closest to five stations used in this study: (b) Lang (urban), (c) NVC (urban), (d) Bavi (rural), (e) Sontay (rural), (f) Hadong (rural/urban).

Figure 10.
Temporal variations in the simulated hourly mean WS and WD (Top) and PM2.5 concentrations determined in standard and sensitivity runs (Bottom) at two air quality stations. The black and the red lines show values from the standard and sensitivity runs, respectively. Total PM2.5 is depicted by the black line while the PM2.5 from non-local emission sources is shown by the red line. The dashed columns show the periods when transported PM2.5 was dominant.

Figure 11.
Ratio of non-local PM2.5 to total PM2.5 concentrations against wind speed and wind direction.
Figure 11.
Ratio of non-local PM2.5 to total PM2.5 concentrations against wind speed and wind direction.

Figure 12.
Percent distribution of total PM2.5 across Hanoi from different emission sector.

Table 1.
List of air quality and meteorological stations.
| Station | Lat | Lon | Parameters Used | Temporal Resolution |
|---|---|---|---|---|
| Nguyen Van Cu (NVC) (Urban) | 21.05° | 105.88° | T2, RH, WS, WD, PM2.5 | 1-h |
| Lang air quality station (Urban) | 21.02° | 105.80° | T2, RH, WS, PM10 | 1-h |
| Lang meteorological station (Urban) | 21.02° | 105.80° | T2, RH, WS | 1-h for T2, RH |
| 3-h for WS | ||||
| Bavi (Rural) | 21.10° | 105.43° | T2, RH, WS | 1-h for T2, RH |
| 6-h for WS | ||||
| Sontay (Rural) | 21.13° | 105.51° | T2, RH, WS | 1-h for T2, RH |
| 6-h for WS | ||||
| Hadong (Urban/Rural) | 20.95° | 105.75° | WS | 6-h |
T2: temperature, RH: relative humidity, WS: wind speed, WD: wind direction.
Table 2.
Statistical parameters for T2, RH, and WS in December 2010.
| Parameter | Mean WRF | Mean Observation | Unit | R | MB | NMB (%) | NME (%) | RMSE |
|---|---|---|---|---|---|---|---|---|
| T2 | 18.8 | 19.04 | °C | 0.92 | −0.23 | −1.2 | 6.9 | 1.7 |
| RH | 66.9 | 80.24 | % | 0.82 | −13.3 | −16.6 | 17.3 | 17.1 |
| WS | 1.86 | 1.26 | m/s | 0.54 | 0.58 | 46.6 | 63.2 | 1.1 |
Table 3.
Statistical parameters of CMAQ performance for daily concentrations of PM2.5.
| Parameter | Mean CMAQ | Mean Observation | Unit | R | MB | NMB (%) | NME (%) | MFB (%) | MFE (%) | RMSE |
|---|---|---|---|---|---|---|---|---|---|---|
| PM2.5 | 88.7 | 79.7 | µg/m3 | 0.77 | 8.9 | 11.2 | 25 | 6.8 | 23.2 | 24.6 |
| Benchmark (Criteria) | >0.4 |
© 2020 by the authors. Licensee MDPI, Basel, Switzerland. This article is an open access article distributed under the terms and conditions of the Creative Commons Attribution (CC BY) license (http://creativecommons.org/licenses/by/4.0/).
Share and Cite
MDPI and ACS Style
Nguyen, T.H.; Nagashima, T.; Doan, Q.-V. Air Quality Modeling Study on the Controlling Factors of Fine Particulate Matter (PM2.5) in Hanoi: A Case Study in December 2010. Atmosphere 2020, 11, 733. https://doi.org/10.3390/atmos11070733
AMA Style
Nguyen TH, Nagashima T, Doan Q-V. Air Quality Modeling Study on the Controlling Factors of Fine Particulate Matter (PM2.5) in Hanoi: A Case Study in December 2010. Atmosphere. 2020; 11(7):733. https://doi.org/10.3390/atmos11070733
Chicago/Turabian StyleNguyen, Thanh Hung, Tatsuya Nagashima, and Quang-Van Doan. 2020. "Air Quality Modeling Study on the Controlling Factors of Fine Particulate Matter (PM2.5) in Hanoi: A Case Study in December 2010" Atmosphere 11, no. 7: 733. https://doi.org/10.3390/atmos11070733
Note that from the first issue of 2016, this journal uses article numbers instead of page numbers. See further details here.