Trends of Business-to-Business Transactions to Develop Innovative Cancer Drugs


1
Graduate School of Technology Management, Ritsumeikan University, Osaka 567-8570, Japan
2
Faculty of Business Administration, Ritsumeikan University, Osaka 567-8570, Japan
3
School of Environment and Society, Tokyo Institute of Technology, Tokyo 152-8550, Japan
4
Center for Research and Education on Drug Discovery, The Graduate School of Pharmaceutical Sciences in Hokkaido University, Sapporo 060-0812, Japan
*
Author to whom correspondence should be addressed.
Sustainability 2020, 12(14), 5535; https://doi.org/10.3390/su12145535
Submission received: 1 June 2020
/
Revised: 25 June 2020
/
Accepted: 6 July 2020
/
Published: 9 July 2020
(This article belongs to the Special Issue Innovation and the Development of Enterprises II)
Abstract
:A key concept in the pharmaceutical industry is open innovation, in which pharmaceutical companies contribute to human health and adapt to a changing business environment by acquiring external knowledge. As successful drug discoveries and developments have become challenging, pharmaceutical companies must proactively pursue the open innovation of new drugs through various inter-firm partnerships to be more sustainable. This study aims to interpret the trend of inter-firm partnerships in the development of cancer drugs and to evaluate their effectiveness by examining inter-firm transactions related to cancer drugs approved by the US Food and Drug Administration (FDA). It is a novel approach to exercise this on each product instead of at the company level. The findings revealed that the number of inter-firm transactions in the oncology field has increased over the past 20 years. Furthermore, the annual number of transactions related to biologics has surpassed that of small molecules since 2015 and has been primarily driven by three PD-(L)1 inhibitors: Keytruda, Opdivo, and Tecentriq. Moreover, the average number of inter-firm transactions related to biologics is significantly higher than that of small molecules in total, in alliances, and in financing, suggesting that inter-firm transactions for biologic cancer drugs actively occur through various means. Additionally, a positive and significant correlation exists between the number of transactions and the average number of approved indications for biologics, but not for small molecules. These results suggest that the observed trend of active inter-firm transactions is key in increasing the probability of success in cancer drug research and development. This could provide a potential breakthrough in this industry for the successful development of innovative drug candidates to address unmet medical needs. Further study is necessary to confirm the applicability of this paradigm in broader drug discoveries and development.
1. Introduction
The pharmaceutical industry occupies an important position in society in terms of its ability to generate valuable solutions for the treatment of diseases and contribute to global human health. Recently, the environment surrounding the pharmaceutical industry has become challenging, as most companies have struggled with longer durations to develop drugs, a lower probability of success [1] that is defined as phase transition rates or approval rate in most cases in this industry, and increased research and development (R&D) costs [2,3]. Recently, drug development has become more complicated due to various modalities (i.e., gene and cell therapies), and high unmet medical needs in a specific target population (i.e., patients with rare diseases). In this situation, pharmaceutical companies require a dynamic shift in terms of R&D toward their sustainable development. Specifically, key regulatory authorities—including the US Food and Drug Administration (FDA), the European Medicine Agency (EMA), and the Japan Ministry of Health, Labour and Welfare/Pharmaceuticals and Medical Devices Agency (MHLW/PMDA)—have started to prioritize more innovative, differentiated drugs by enforcing special regulatory paths for prioritized drug candidates and health economic analyses for reimbursement. For example, the distinct and successful approaches by the FDA, MHLW/PMDA, and EMA in their development phases, such as the breakthrough designation (BTD) launched in 1997, the Sakigake Designation launched in 2015, and Priority Medicines (PRIME) launched in 2016, respectively, have accelerated drug development [4,5].
While pharmaceutical companies have realized the necessity of external knowledge and expertise in addressing a diverse R&D pipeline, open innovation is recognized as a potential option in establishing an adaptive business model in the changing industrial environment, with many major pharmaceutical companies having already implemented open innovation platforms [6]. While Chesbrough [7] originally advocated for the open innovation concept, each industry has recently integrated it into their own business operations [8,9,10,11].
Inter-firm transactions in the pharmaceutical industry are considered as part of open innovation, and this paradigm shift has affected the active partnerships and transactions across companies [12]. From the late 1990s and through to 2010, mergers and acquisitions (M&As) intermittently occurred between pharmaceutical companies, and the most noteworthy of these were the M&As between the largest pharmaceutical companies. However, the M&As have recently lost momentum, and previous research has argued that M&As do not create positive value in terms of R&D productivity, returns on investments, and profit margins [13,14]. Subsequently, business conditions became increasingly diverse, with many cases of strategic partnerships without M&As emerging [15,16]. Inter-firm transactions exist not only between private sectors, but also in various combinations among the private sectors, venture companies, investment enterprises, and academia. These have gained momentum with each passing year, resulting in the generation of new drug discoveries or pipelines; moreover, these partnerships have established biotechnology venture companies by increasing access to external capabilities and knowledge [17,18,19]. It is particularly noteworthy that generally licensed compounds have higher clinical approval success rates than self-originated compounds [20].
Therefore, this work aims to explore the following key question: are inter-firm transactions effective in the pharmaceutical industry? Many studies argue that open innovation is effective in this industry, although most focus on the company level, rather than individual products. For example, Carroll studied the effectiveness of open innovation and its impact in terms of investments, pipeline health, returns, culture, and capabilities by using real-time data from Eli Lilly [6]. Additionally, Mazzola argued that institutional collaborations—measured by the number of university research centers and public and non-profit organizational collaborations for knowledge inflows—positively affect both innovation performance and financial performance [12]. Bianchi studied the uniqueness of the organizational models of biopharmaceutical companies with external partners at the company level [21]. Although a company’s open innovation performance is an important perspective, it is difficult to discern how inter-firm transactions affect the successful discovery and development of drugs. This is because many pharmaceutical companies apply different empirical strategies for each drug during their R&D, manufacturing, and commercialization phases; R&D tactics vary among individual drugs depending on mode of action, target indication, type of modality, and regional environment, including clinical practices and regulatory policies, among other factors. Therefore, our approach in this study is to evaluate the effects of inter-firm transactions on each product.
To investigate this effectively, we focus on cancer drugs that treat tumors, but we exclude drugs for cancer prevention, such as cancer vaccines. The scientific field specializing in cancer is also called oncology or neoplastic, and has been a top therapeutic class in terms of the number of candidates and approved drugs and active inter-firm deals conducted over the past three decades [3,6,19,22]. Therefore, we believe that sufficient data exist compared to other therapeutic areas. In the oncology field, immune checkpoint inhibitors represent a major breakthrough, and anti-programmed death-1 (anti-PD-1) antibody and anti-programmed death ligand-1 (anti-PD-L1) antibody are examples of these. Anti-PD-(L)1 antibody is designed to activate anti-tumor immunity by blocking the PD pathway. Keytruda (pembrolizumab or lambrolizumab, Merck) was the first PD-1 inhibitor approved by the FDA for the treatment of melanoma in September 2014, and Opdivo (nivolumab, Bristol-Myers Squibb) was then approved for the treatment of melanoma in December 2014. Tecentriq (Atezolizumab, Genentech/Roche) was the first PD-L1 inhibitor approved by the FDA for the treatment of urothelial carcinoma in May 2016. There have been other PD-(L)1 inhibitors in the market or under development for treatment of various types of cancer [23,24,25].
We also focus on a comparison between small molecules and biologics. On the one hand, small molecules have been an essential modality in the pharmaceutical industry, generated through well-established techniques and synthetic organic and drug discovery chemistry platforms for over half a century [26,27,28]. On the other hand, biologics were first approved in 1998 in the United States when Embrel was approved by the FDA, and they are currently a major modality in this industry. Biologics are primarily discovered and developed by biotechnology companies [29]. Small molecules and biologics are often compared in their specificity and safety [30,31], success rates [1,20,32,33,34], development costs [34,35], and drug pricing [36]. Previous research has generally suggested that biologics have a higher specificity and safety, higher success rates, higher R&D costs, and a longer R&D period than small molecules. Therefore, it is important to compare small molecules and biologics in the field of oncology, in terms of inter-firm transaction trends and how these are effective for drug discovery and development.
We establish the following two hypotheses:
- Much more inter-firm partnerships are performed for biologics in their product life cycle than for small molecules.
- Inter-firm transactions positively impact drug values, or specifically, the number of drug approvals.
We aim to evaluate whether inter-firm transaction trends differ depending on the type of action by comparing small molecules and biologics. This work also aims to determine whether a correlation exists between the number of inter-firm transactions and approval rate as a success parameter for drug discoveries and development, such as the number of approvals. This will provide proof of the potential effectiveness of active transactions in the pharmaceutical industry.
2. Materials and Methods
2.1. Samples and Data Sources
Sample data on cancer drugs were collected from the FDA’s New Molecular Entity (NME) list of approved small molecules, and the New Biological Entity (NBE) list of approved biologics [25] from the calendar years spanning 1999 to 2018. Target drugs are determined based on CenterWatch’s list [37] of new cancer drug approvals, which we cross-referenced against the FDA’s NME and NBE lists. We selected 77 small molecules and 30 biologics as samples for this study according to this approach.
Drugs were then identified as approved under BTD by matching our cancer drug list to the list of breakthrough therapy approvals on the FDA website [38] from the calendar years spanning 2013 to 2018. We identified 21 small molecules and 17 biologics that were approved under BTD for this study according to this approach.
2.2. Variables and Data Sources
Information on the number of transactions per product was collected from the Informa database’s strategic transactions list [39]. We examined 1193 transactions related to identified 107 cancer drugs approved by FDA. The first layer of deal categories includes acquisitions, alliances, and financing. The second layer of deal categories in acquisitions includes the acquisition of private biotech; full acquisitions; includes contracts; includes earn-outs; intra-biotech deals; payment includes cash; payment includes stocks; reverse acquisitions. The second layer in the alliances category includes co-promotions; includes contract; includes equity; includes royalties or profit split information; intra-biotech deals; marketing-licensing; product or technology swaps; R&D and marketing-licensing; and trial collaborations. The second layer in the financing category includes follow-on public offerings; initial public offerings; nonconvertible debt; private investments in public equity; and private placement.
The number of indications were collected from labels on the FDA website [25]. We counted the number of indications listed in the Indication and Usage section of each drug’s label, which is the X in the “Section 1.X” noted on each label.
2.3. Statistical Analysis
Microsoft Excel 2016 is used for our study’s statistical analysis. We performed Welch’s t-test and ordinary least squares (OLS) regression corresponding 95% confidence intervals. p-value were obtained and showed p < 0.01 as **, p < 0.05 as * and p < 0.1 as † in figures.
3. Results
3.1. Inter-Firm Partnerships for Biologics and Small Molecules
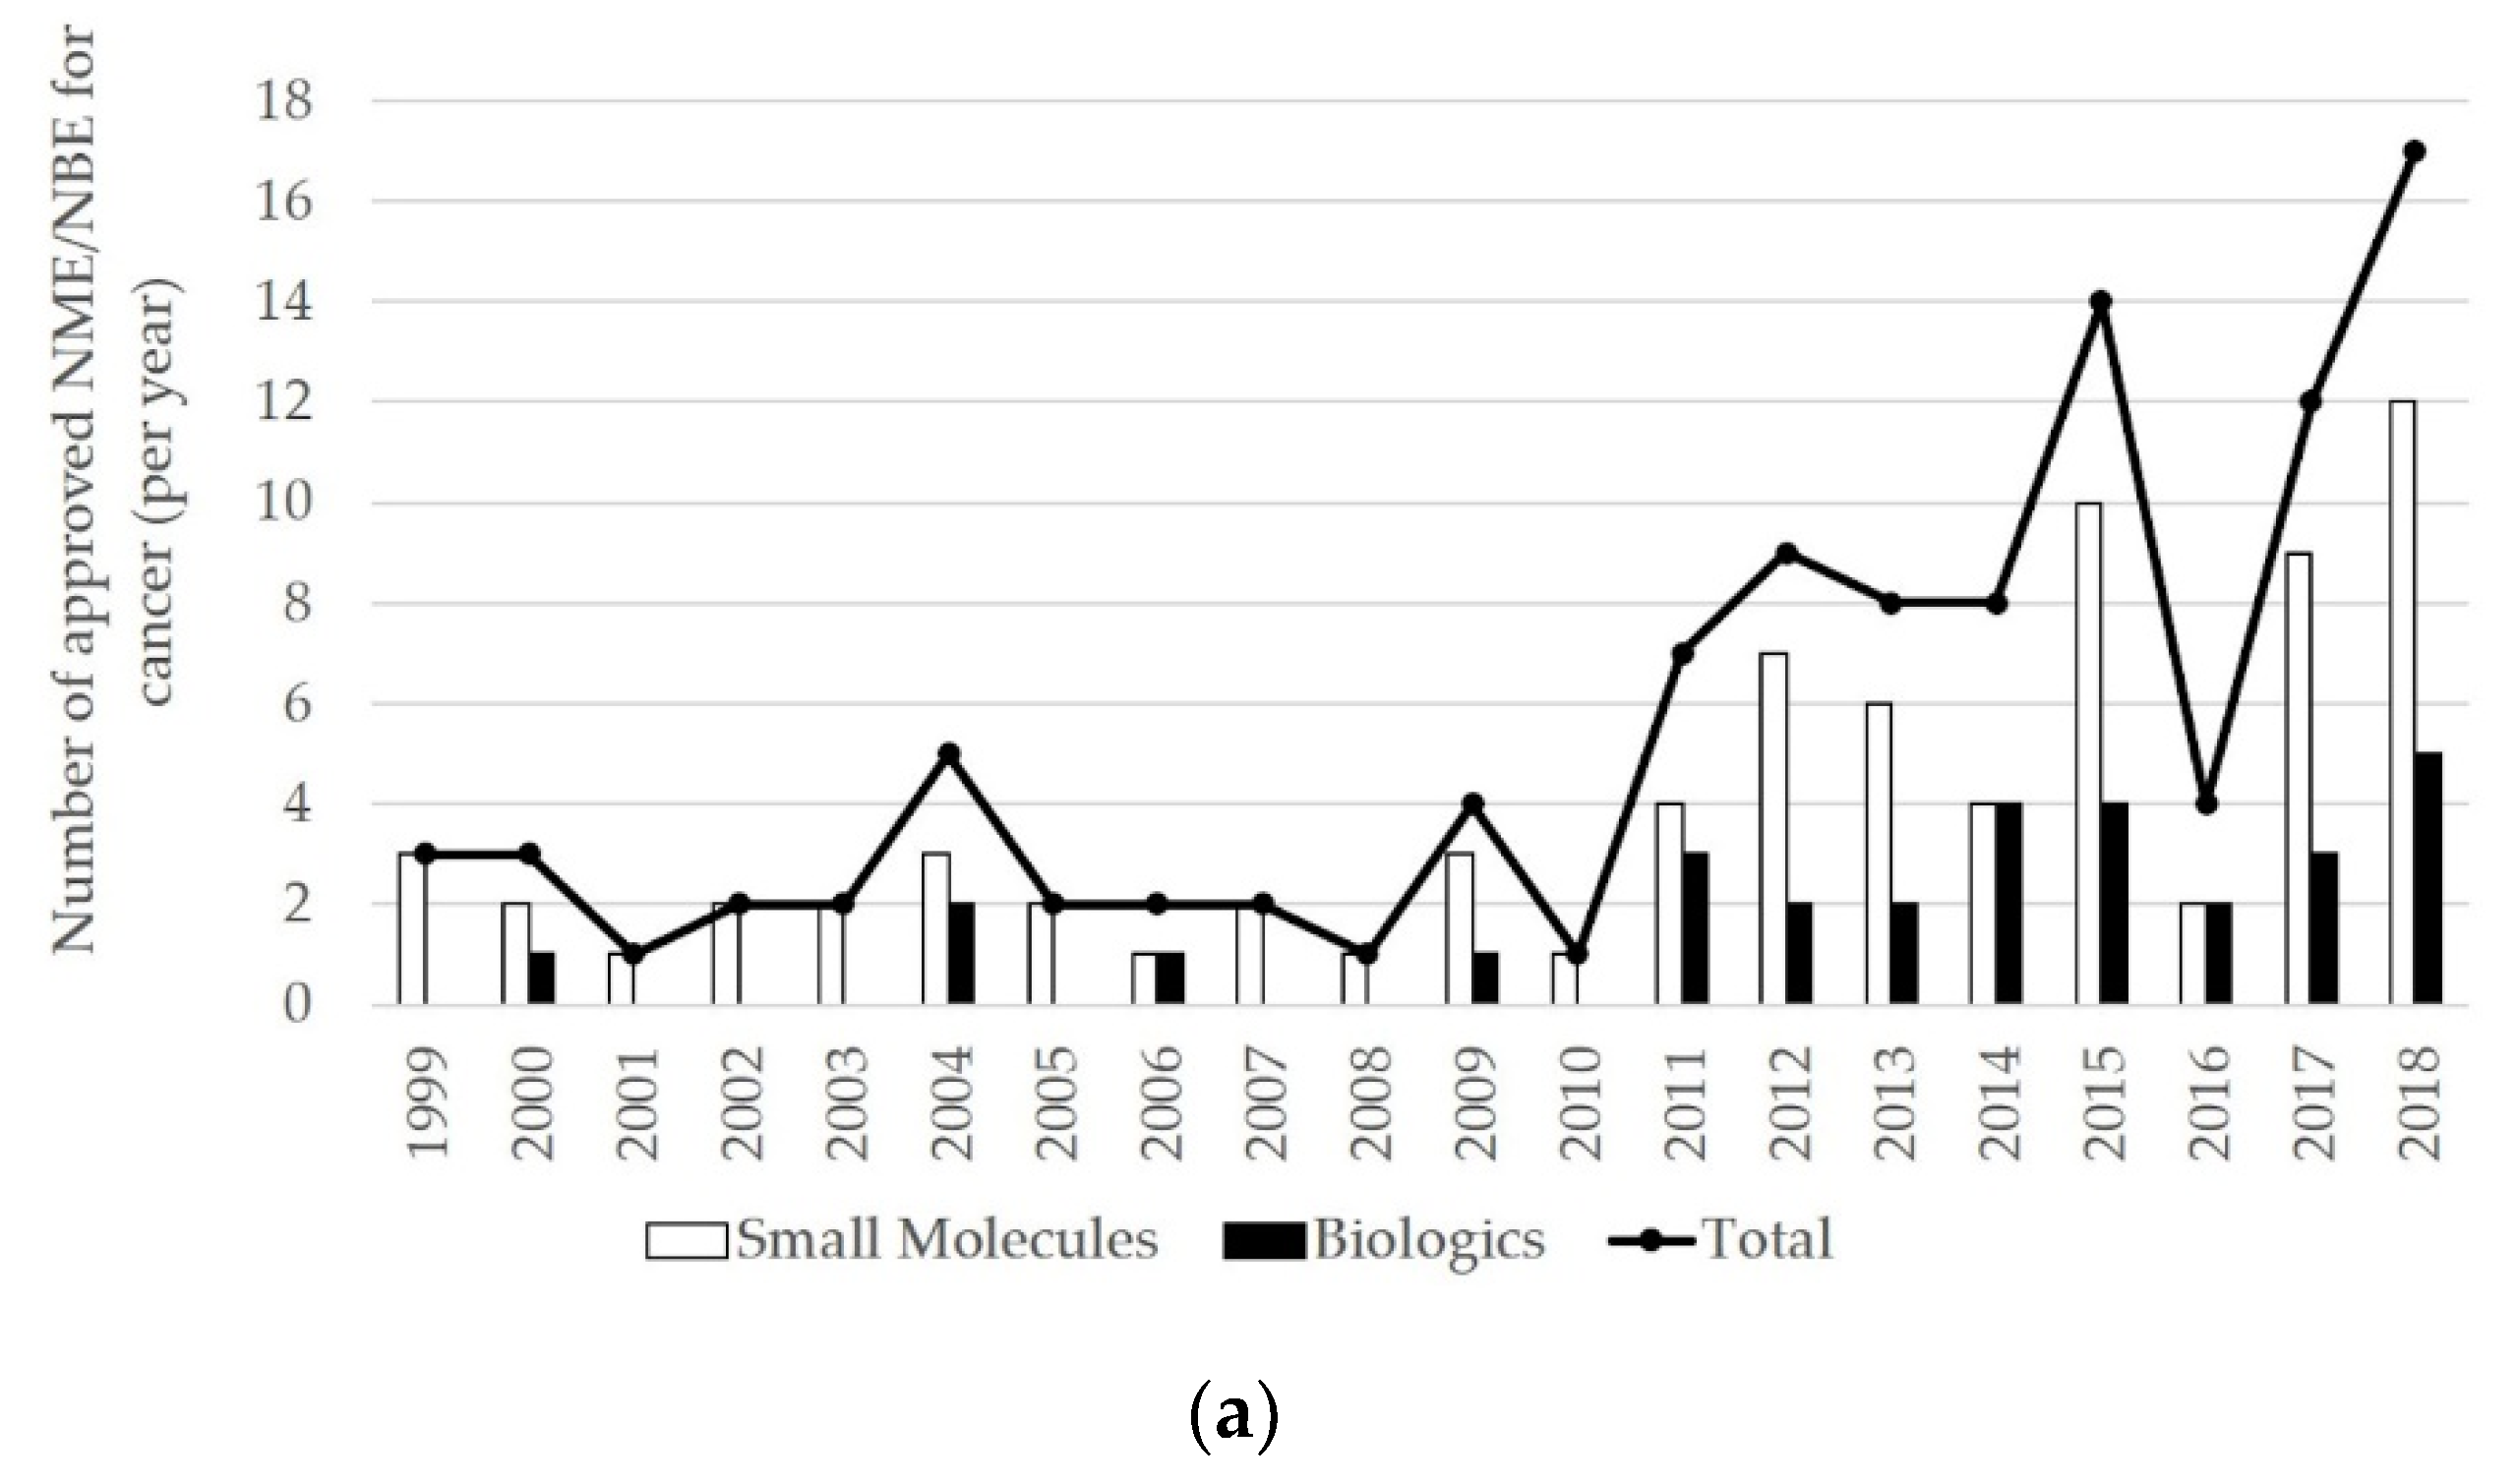
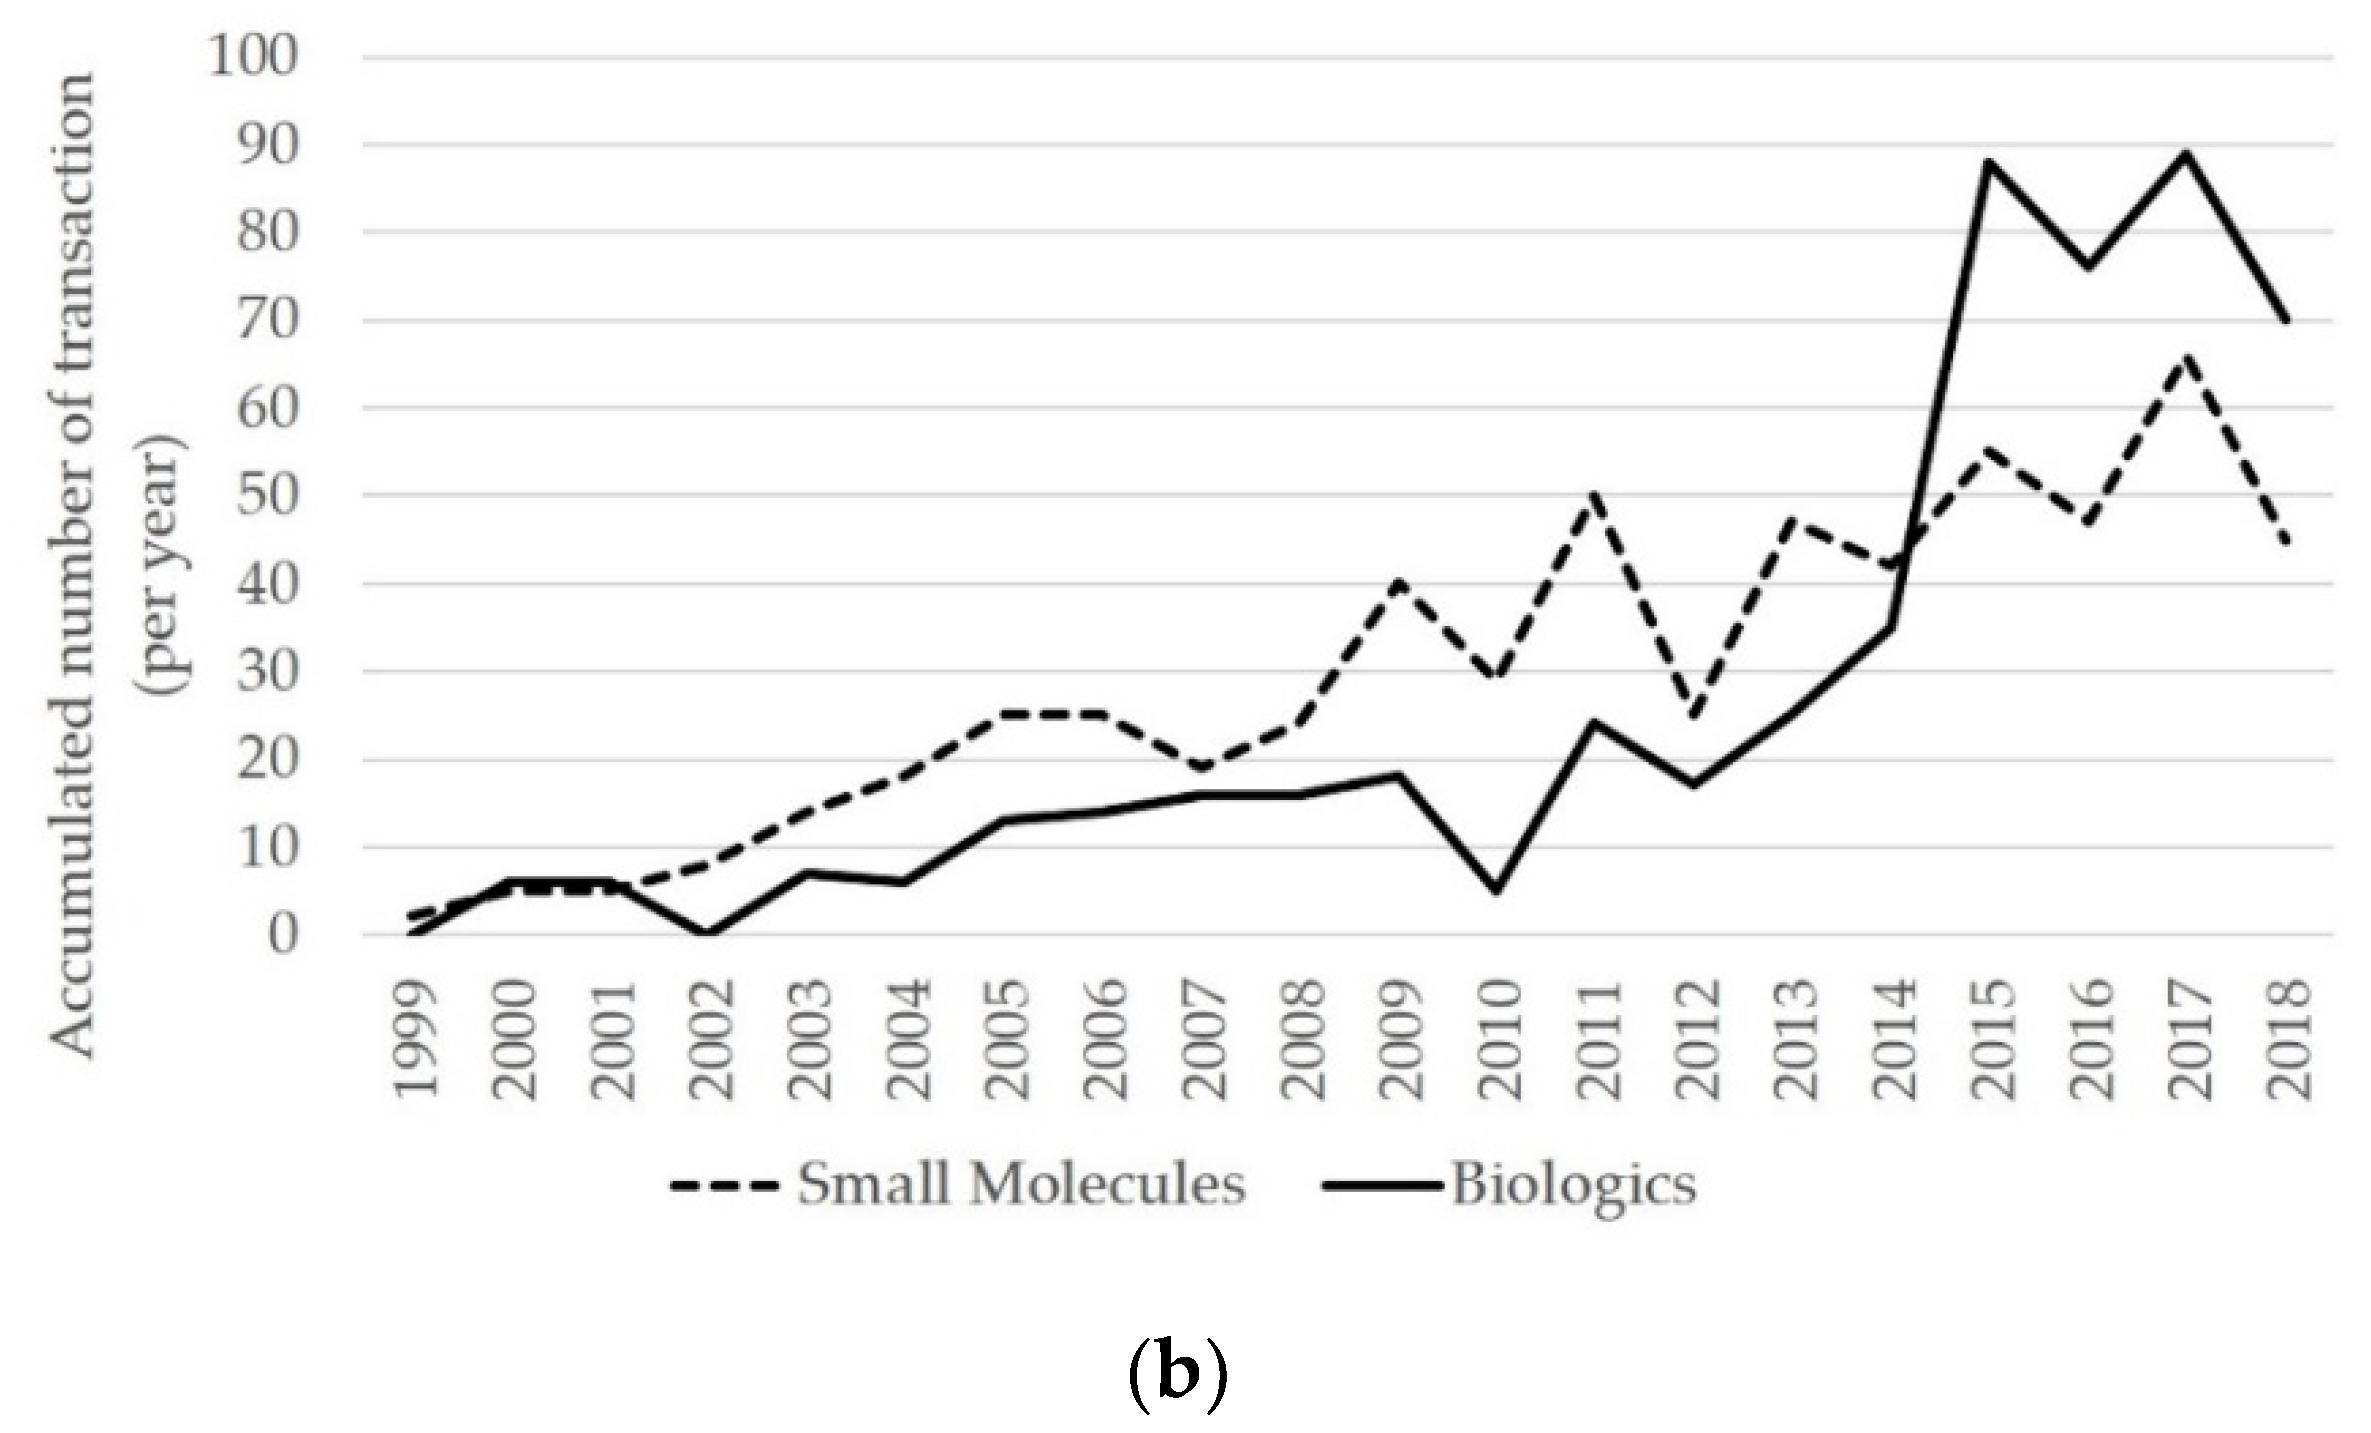
First, Figure 1a displays the transition in the number of approved cancer drugs’ NME and NBE, for small molecules and biologics, respectively, from year 1999 to 2018. It reveals that the number of both small molecules and biologics generally increased every year in the sample period. Figure 1b illustrates the accumulated number of transactions for cancer drugs in each year. Clearly, transactions increase yearly for both small molecules and biologics, with a substantial increase in biologics transactions from 2015.
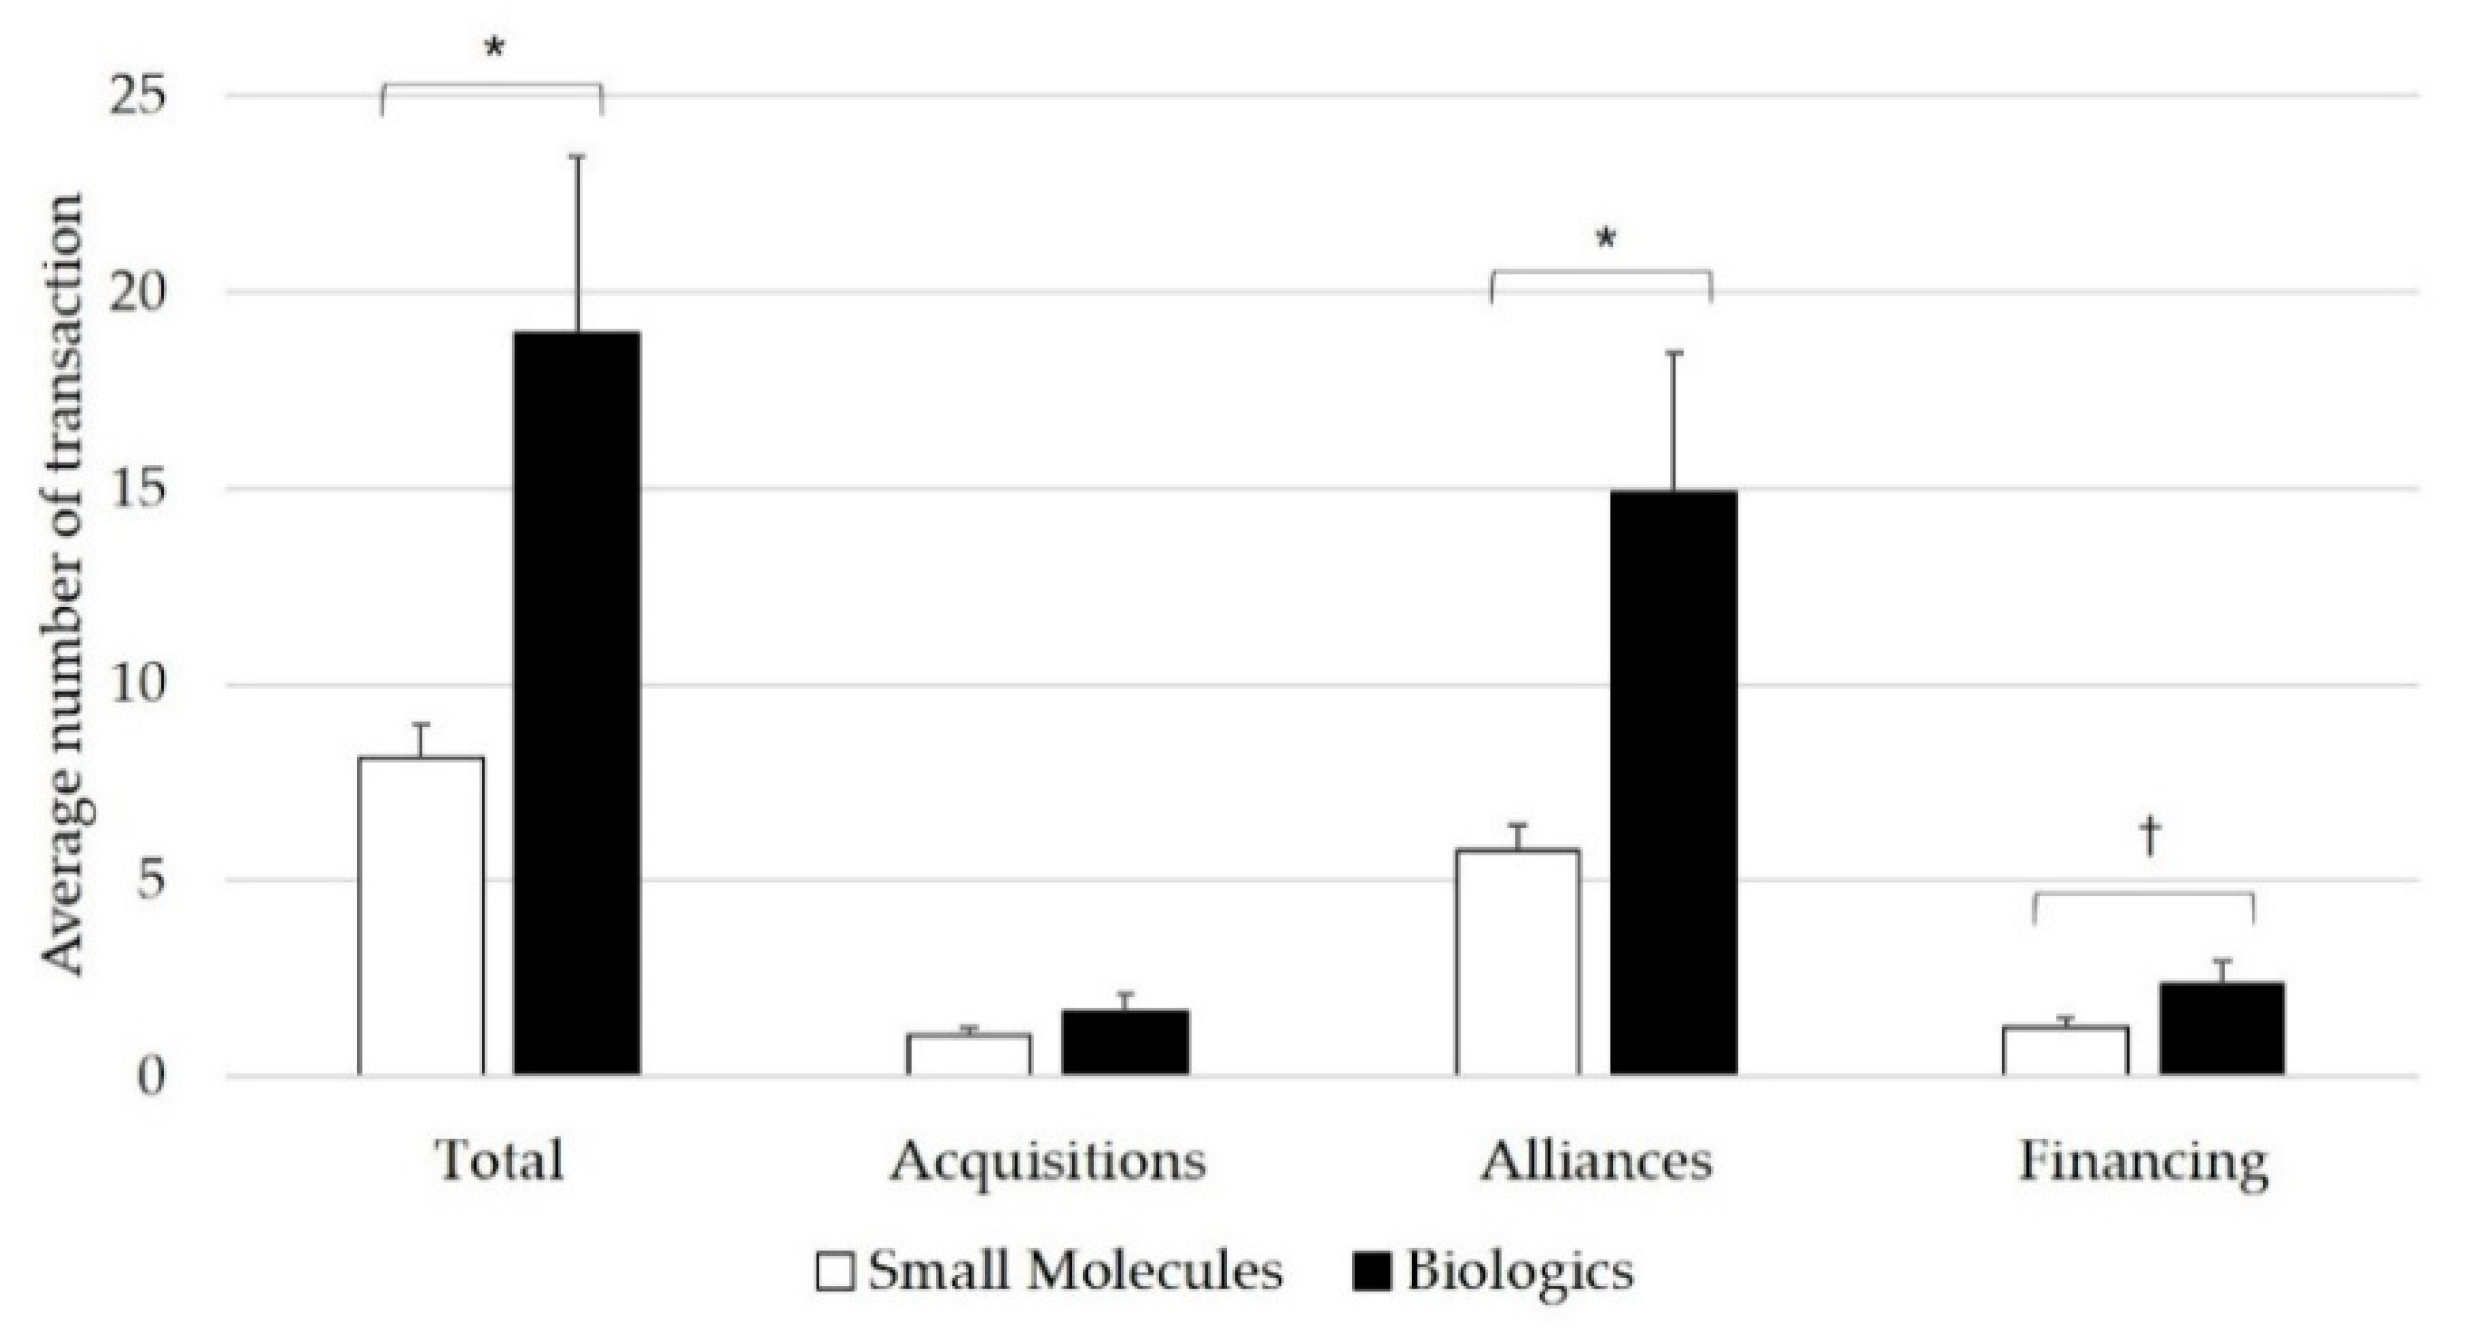
We investigate Hypothesis 1 by performing Welch’s t-test between small molecules and biologics in terms of the average number of transactions of individual drugs in total and the three major strategic transaction categories: acquisitions, alliances, and financing. Figure 2 indicates that inter-firm transactions occur more actively occur with biologics than small molecules, and the average number of total, alliances, and financing transactions are significantly higher for biologics than small molecules (small molecules: biologics’ total = 8.12, SD 7.439: 18.93, SD 24.673, p < 0.05; alliances = 5.77, SD 5.647: 14.90, SD 19.485, p < 0.05; financing = 1.27, SD 2.017: 2.37, SD 3.388, p < 0.1). In other words, Hypothesis 1 is supported given the number of transactions in total, as well as in the alliances and financing categories.
3.2. Key Driver of Inter-Firm Transactions for Biologics in 2015
As we discovered that the total number of small molecules and biologics transactions reversed since 2015, we decide to investigate why this occurred. Table 1 indicate that Keytruda, Opdivo, and Tecentriq were key drivers of the number of transactions in 2015. All three of these drugs are noteworthy immune-checkpoint inhibitors, which are the new standard of care in patients with cancer (including non-small-cell lung cancer and melanoma, among others), since Keytruda and Opdivo were originally approved in 2014 and Tecentriq was approved in 2016. It is observed that the transactions for these three drugs increased just after their original approvals. It is also suggested that the number of transactions after the original approval in biologics generally exhibited a much more substantial increase than that of small molecules. When only observing the year 2015, the number of transactions for Imfinzi, Kadcyla, and Yervoy are also high, but with no tendency toward continuity.
3.3. Relationship between Inter-Firm Transactions and Approved Indications
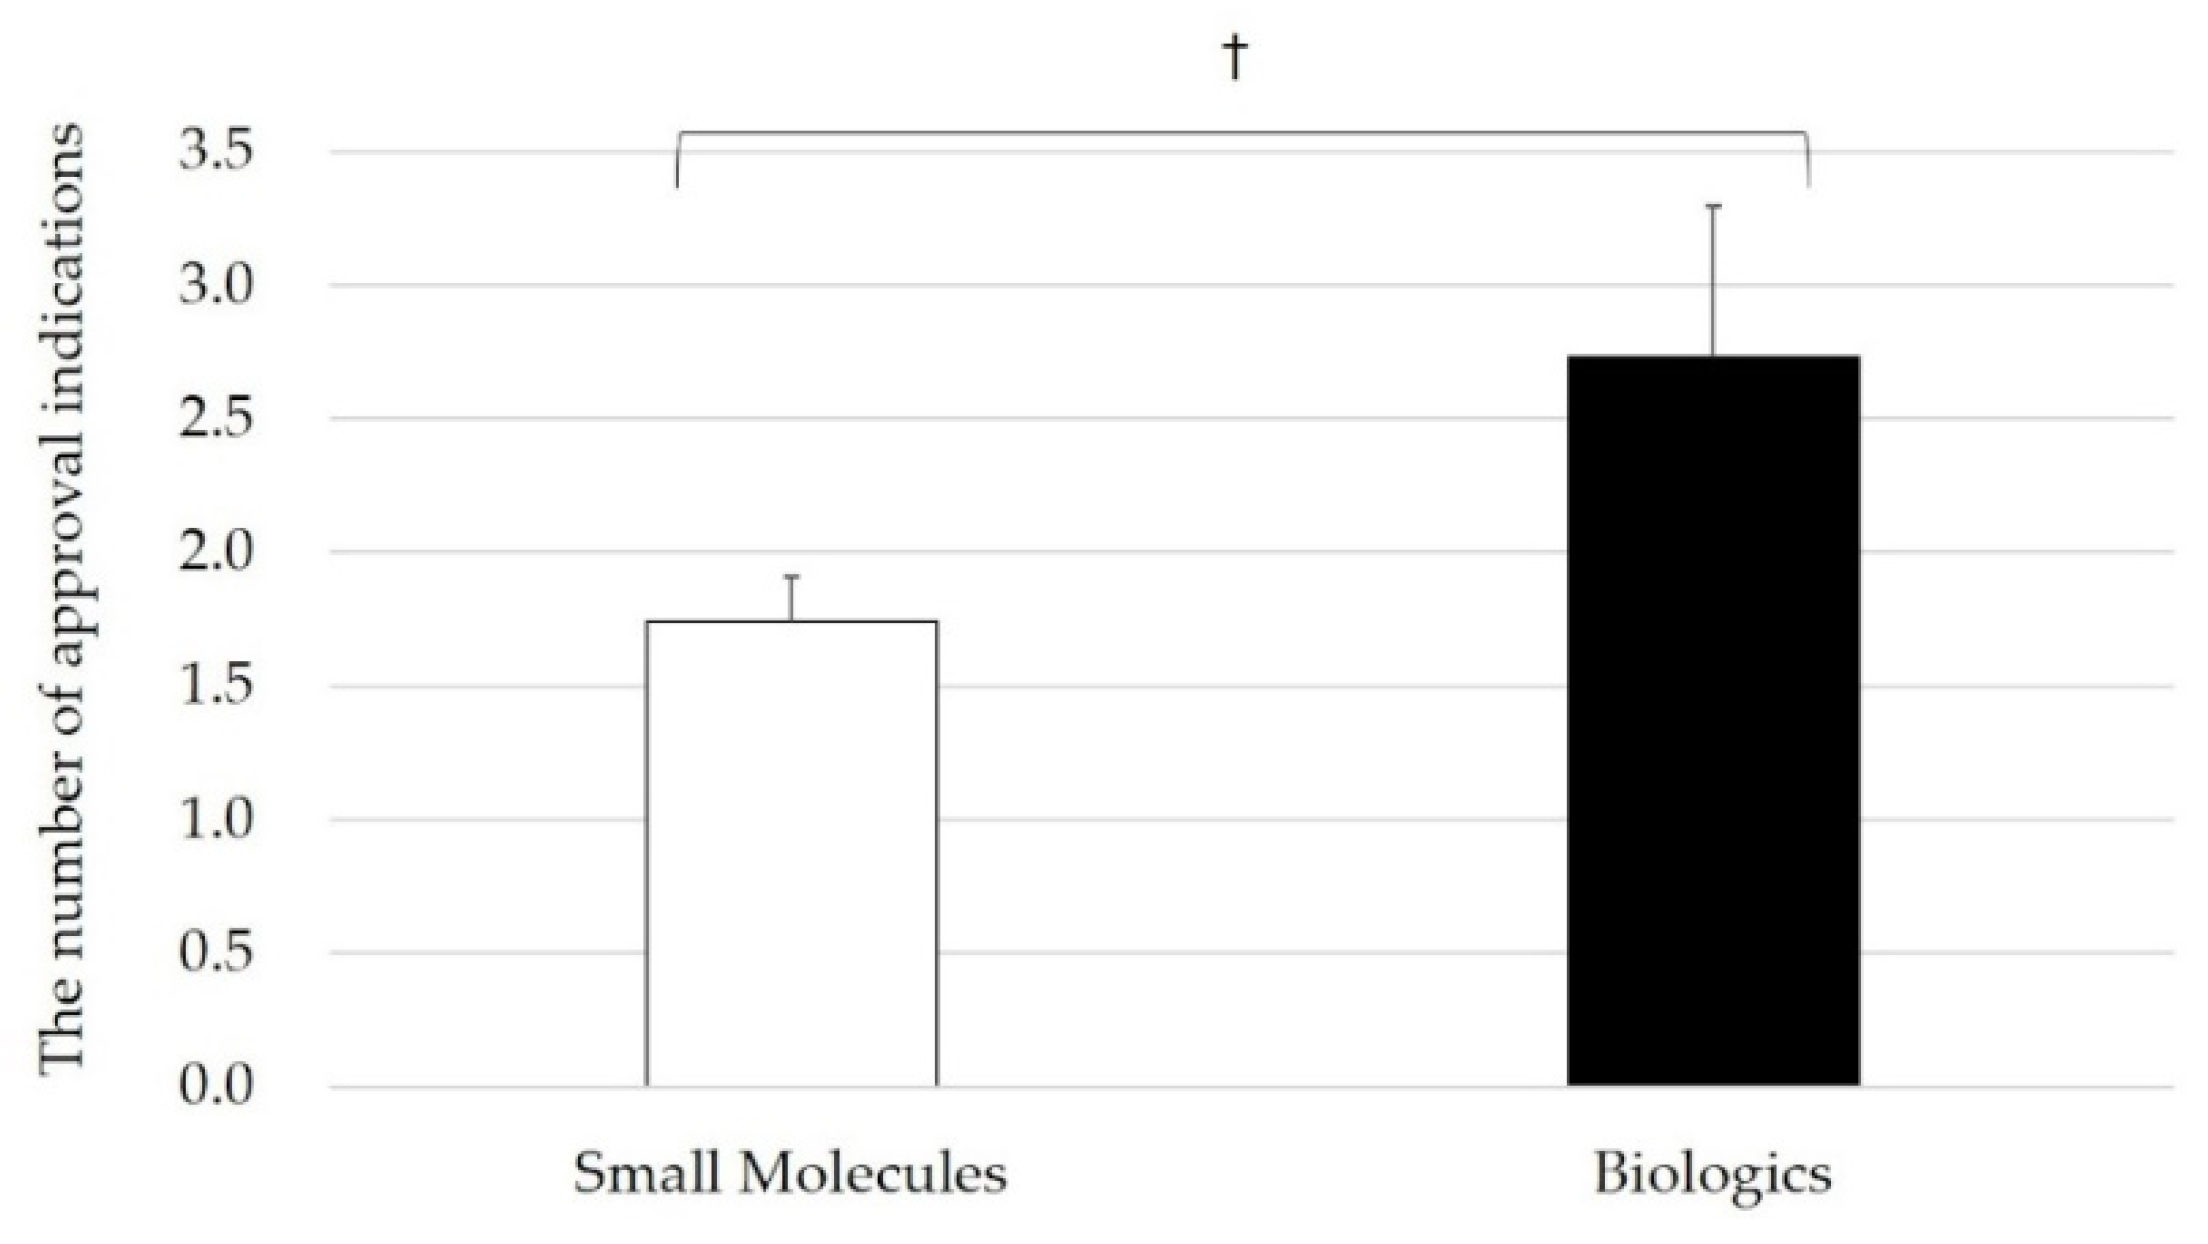
We investigate Hypothesis 2 by comparing the number of approved indications between small molecules and biologics and performing Welch’s t-test. As Figure 3 demonstrates, biologics have statistically more approved indications than small molecules (small molecules: biologics = 1.74, SD 1.490: < 2.73, SD 3.084, p < 0.1).
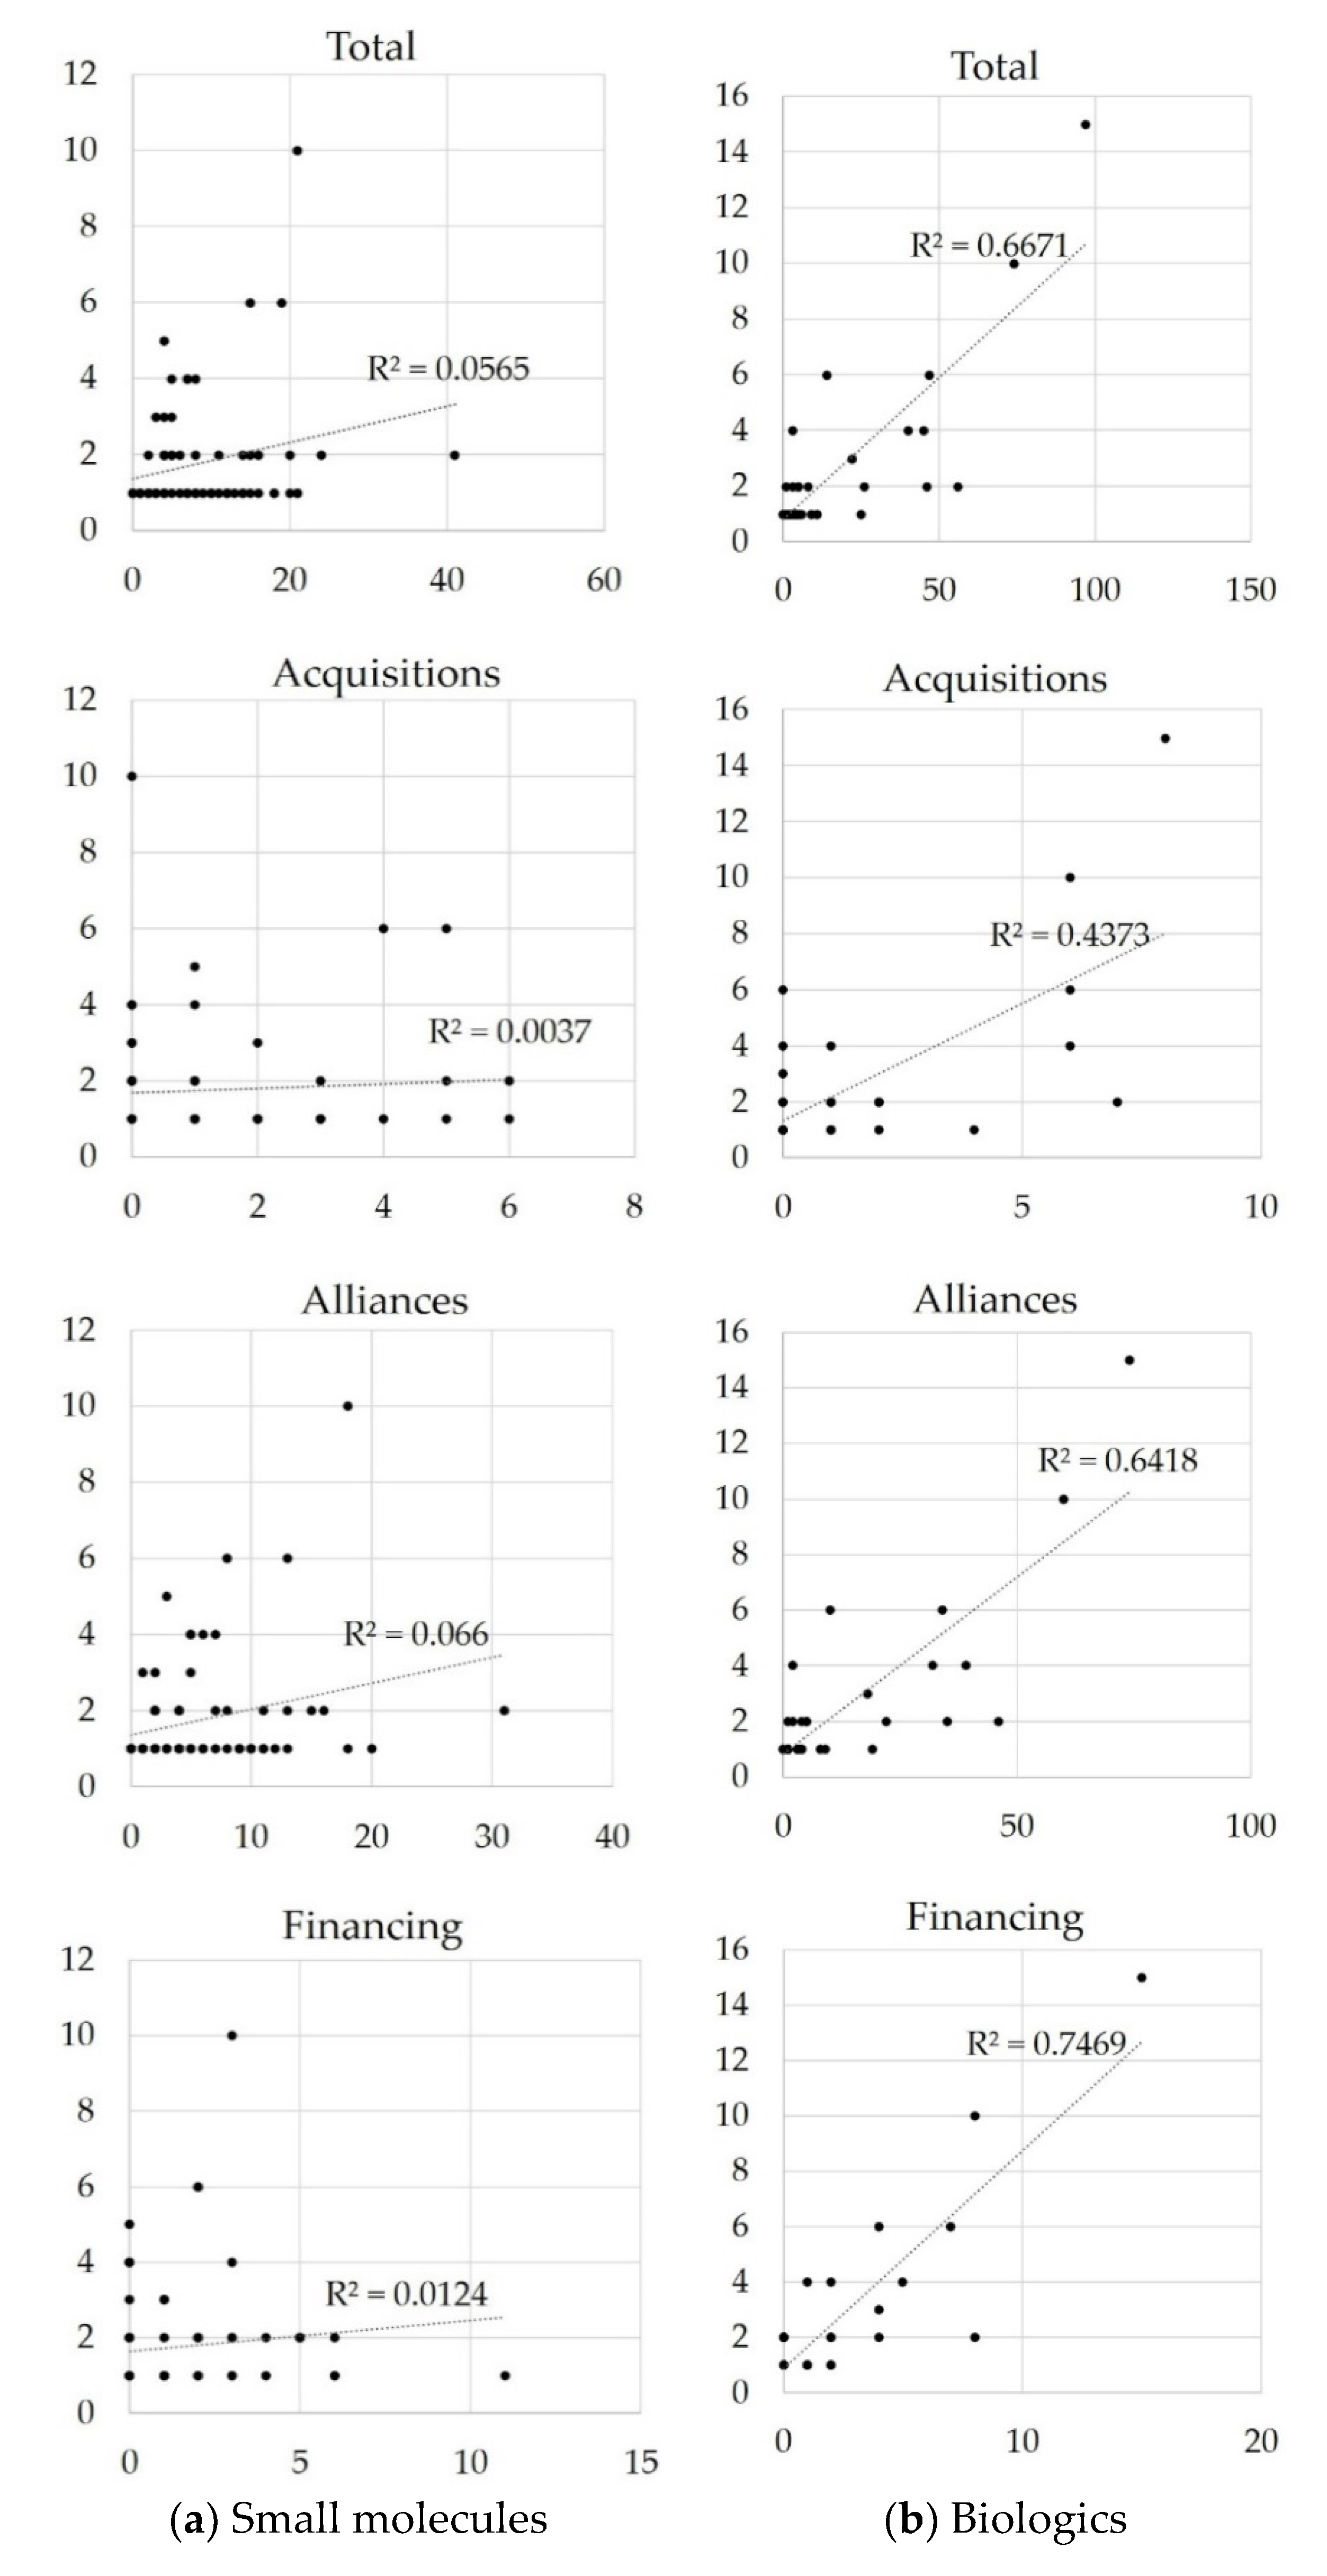
We then investigate the correlation between the number of approved indications and the number of inter-firm transactions in both small molecules and biologics, then perform an OLS regression for each transaction category. The results shown in Figure 4 reveal that all categories of biologics transactions statistically correlate with the number of approved indications, although this is not observed with small molecules (R in the total, acquisitions, alliances, and financing categories are 0.82, 0.66, 0.80, and 0.84, respectively; p < 0.01). This supports Hypothesis 2.
3.4. Relationship between Inter-Firm Transactions and Approved Indication under BTD
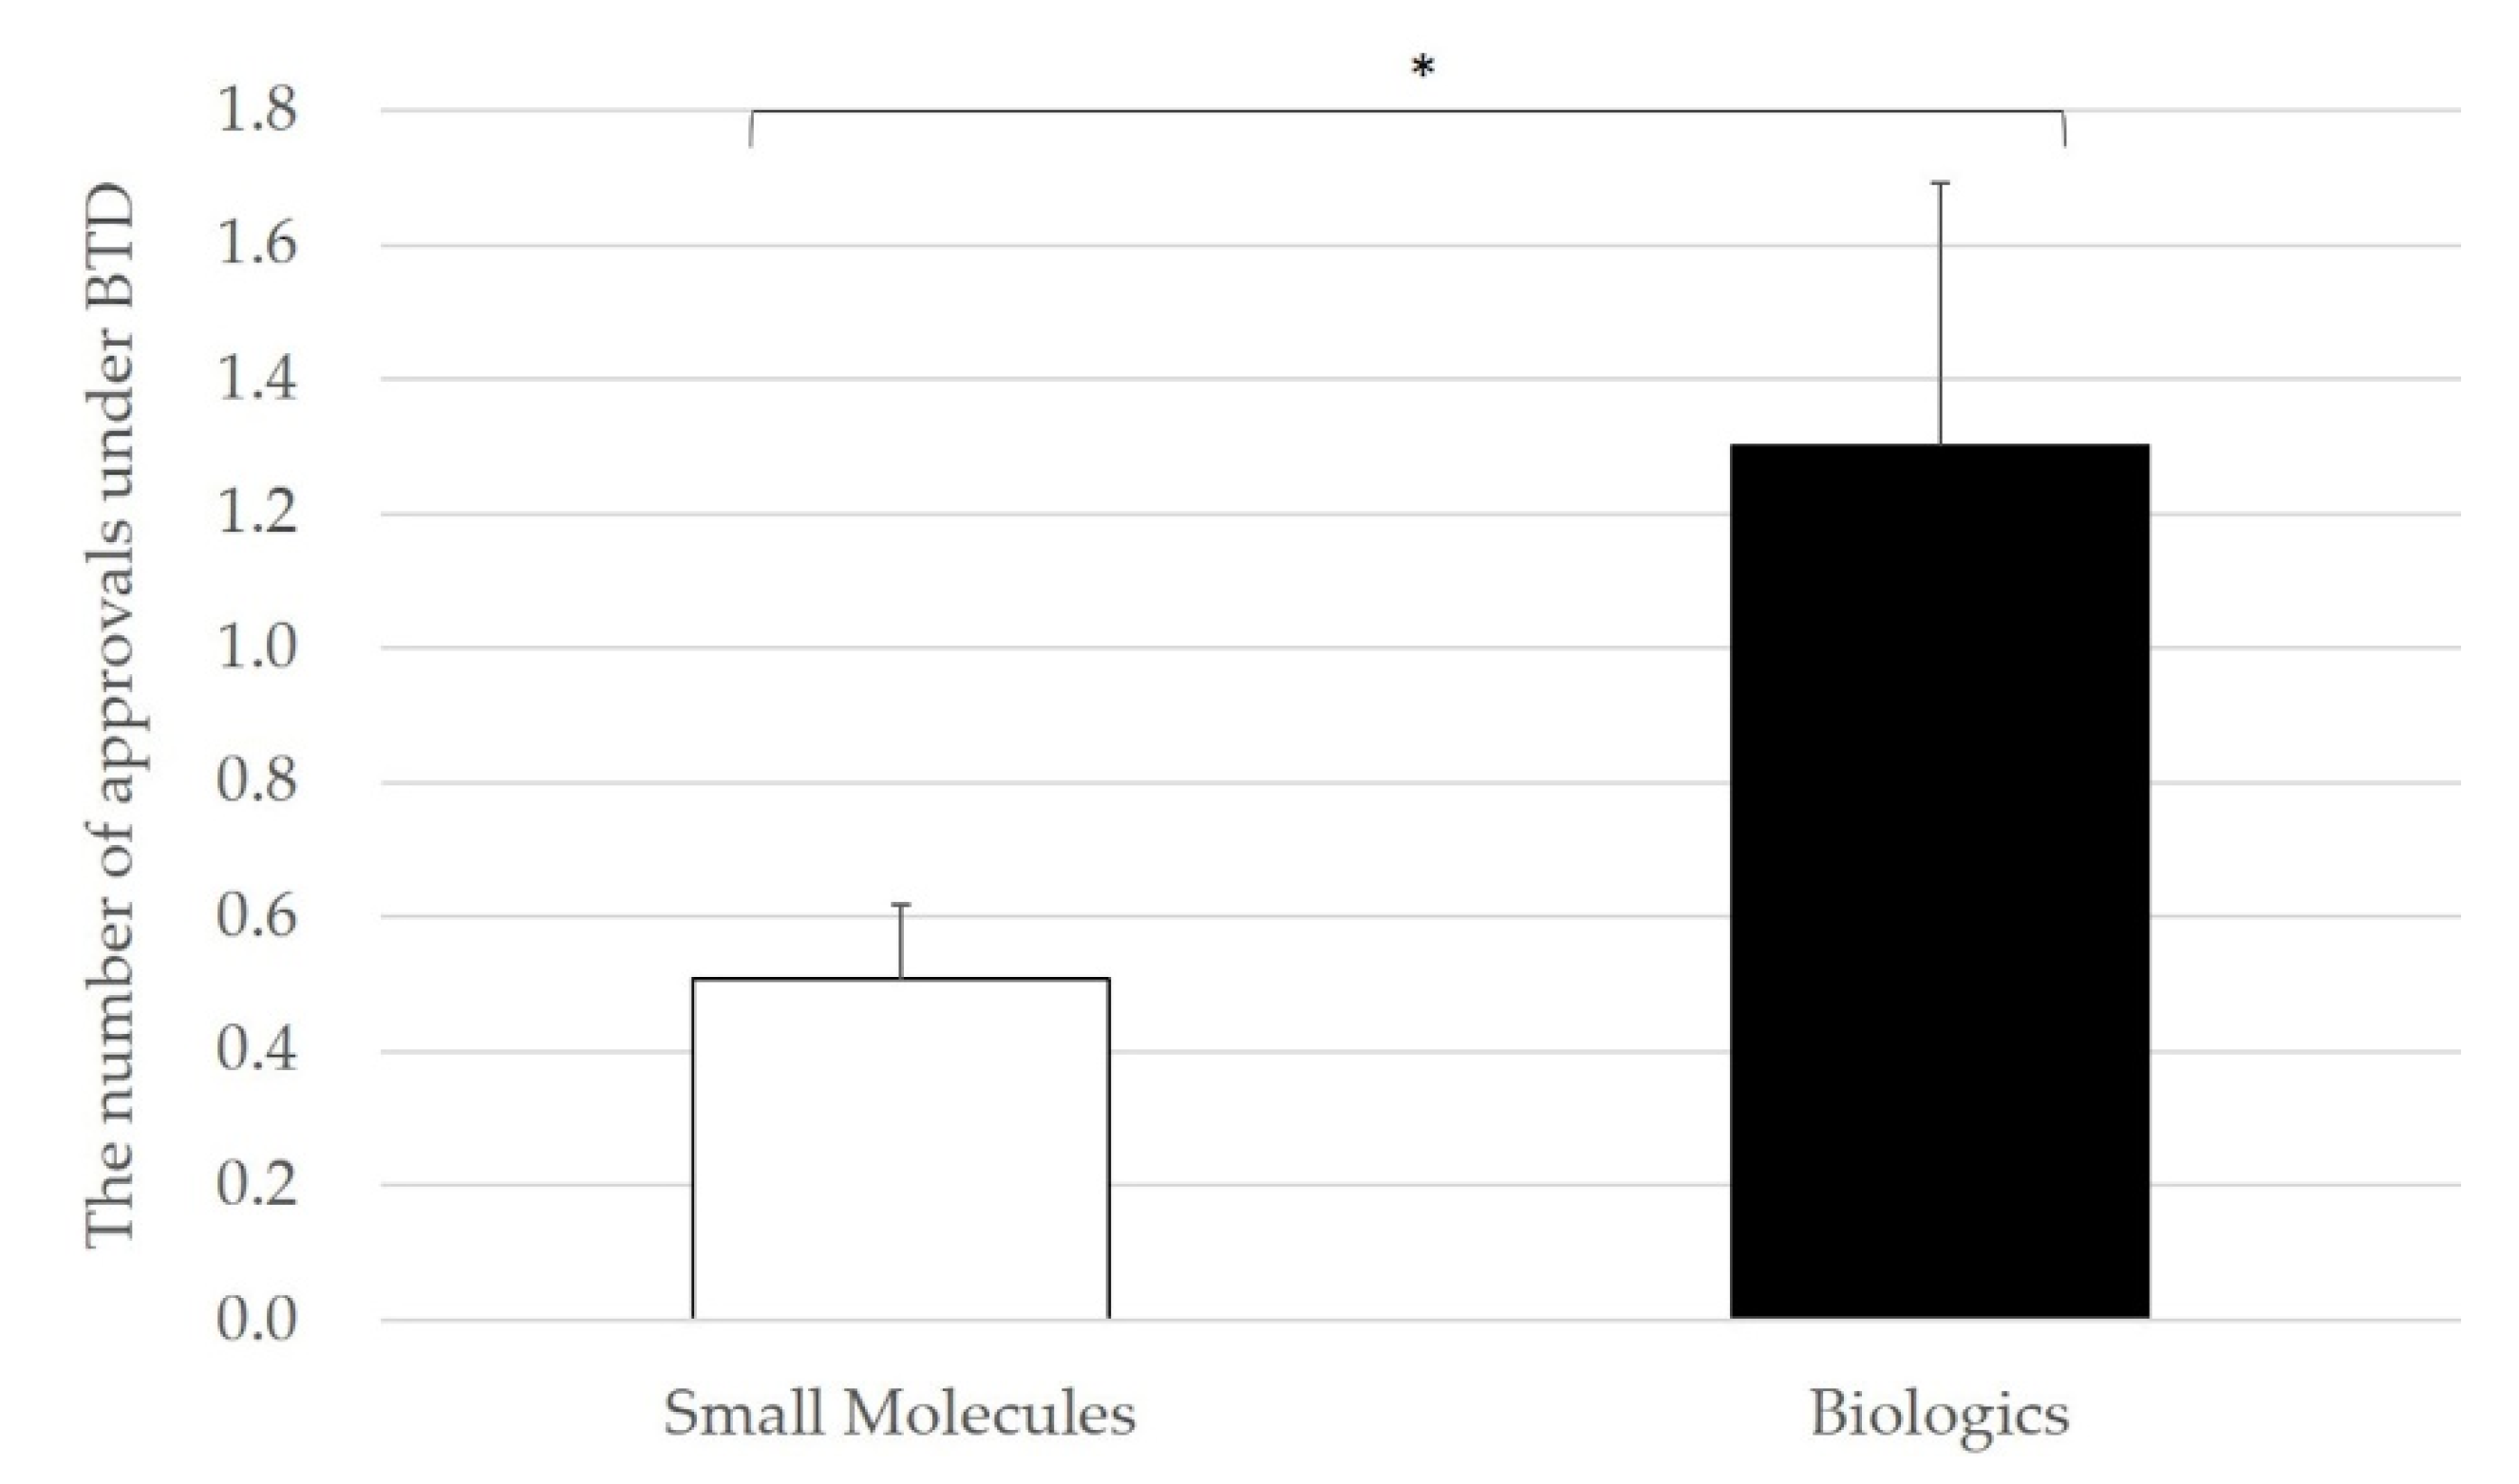
To further study Hypotheses 1 and 2, we compare the number of approvals for cancer drugs under BTD in small molecules and biologics as BTD. This is a relatively new regulatory path as previously described. Specifically, it aims to provide patients with better access to innovative drugs through generous regulatory and scientific support from the FDA. The results reveal that a higher ratio of biologics is approved under BTD, or 27.3% (21 out of 77) for small molecules and 56.7% (17 out of 30) for biologics. We also compare the average number of approvals under BTD between small molecules and biologics, then performed Welch’s t-test. Figure 5 illustrates a noteworthy finding, in that the number of approvals under BTD for biologics are statistically higher than that for small molecules (small molecules: biologics = 0.50, SD 0.995: < 1.30, SD 2.152, p < 0.05).
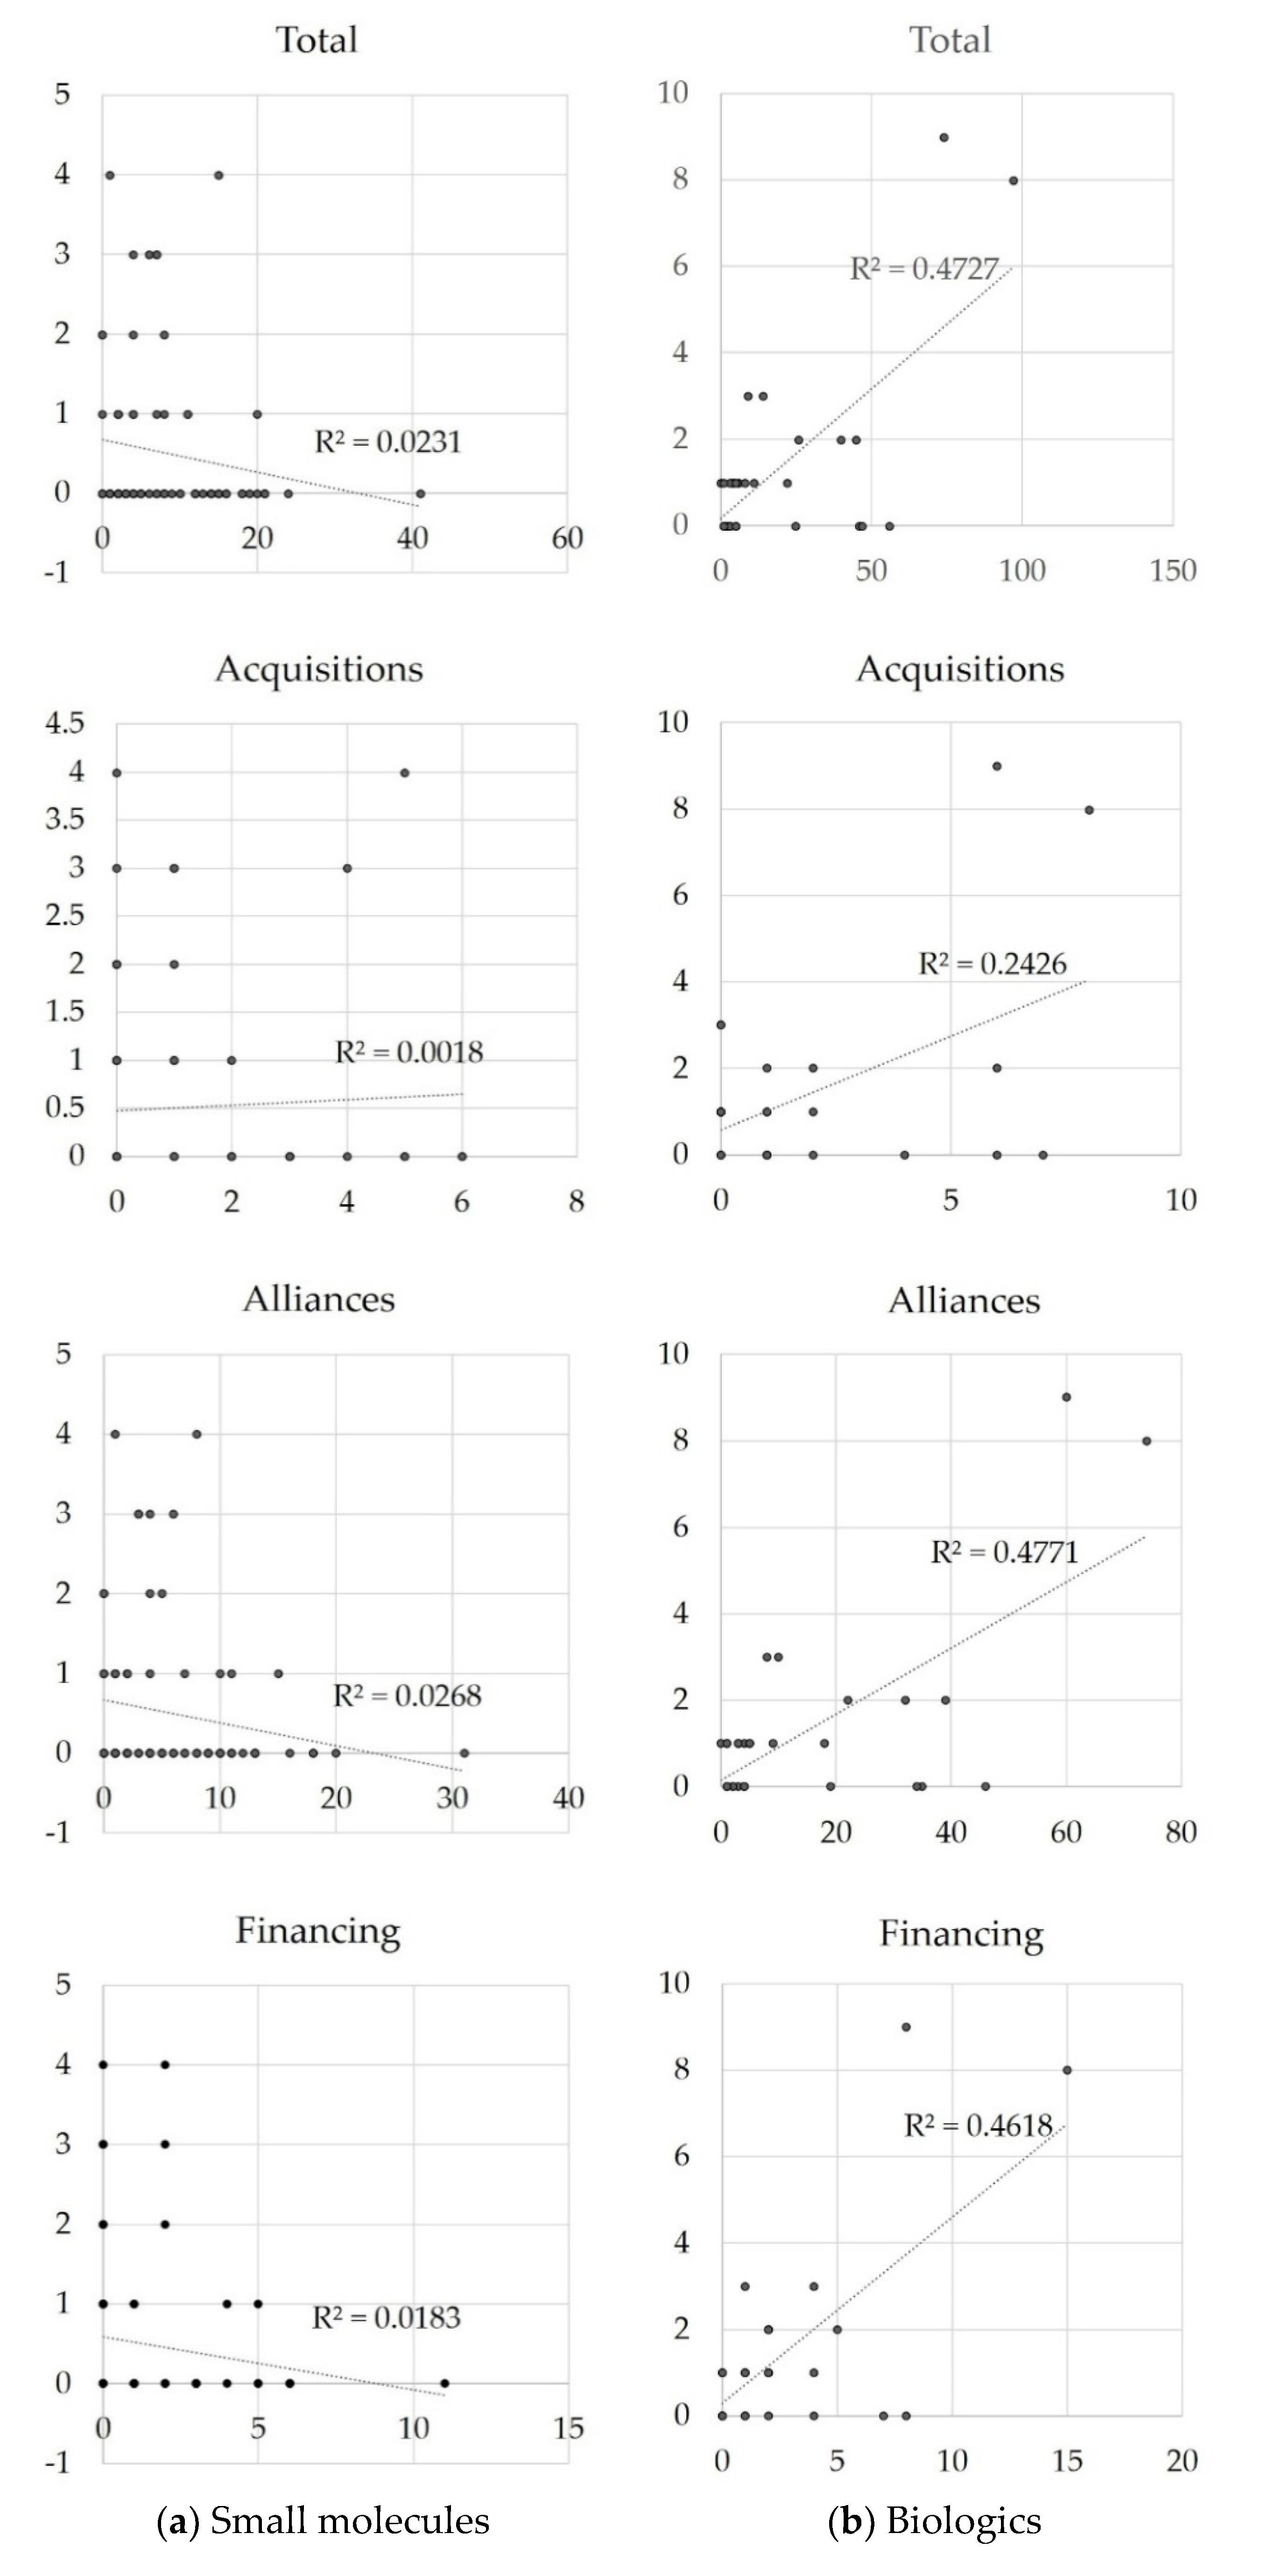
We also study the correlation between the number of approvals under BTD and the number of inter-firm transactions in both small molecules and biologics, then perform an OLS regression in each transaction category. Consequently, Figure 6 shows that all biologics transaction categories statistically correlate with the number of approved indications, although this is not observed with small molecules (R of the total, acquisitions, alliances, and financing categories are 0.69, 0.49, 0.69, and 0.68, respectively; p < 0.01). This result suggests that active inter-firm transactions involving biologics positively affect approvals under BTD. This is an important finding, as the same tendency occurs under the innovative indicator, which is confirmed in Figure 4.
4. Discussion
We investigate the effectiveness of inter-firm transactions during the discovery and development phases of oncology drugs by evaluating the number of transactions and approved indications. We collected data for each parameter from an open source database and performed statistical analyses to study the trends of inter-firm transactions, the correlation between inter-firm transactions and approved indications, the correlation between inter-firm transactions and the number of approvals under BTD, and the trends in small molecules and biologics over the past 20 years. Our findings support our hypotheses and suggest that inter-firm transactions could be an important success factor in generating innovative biologics in the oncology field, although this would not be the case for small molecules.
As to the effective judgement of transactions by partners, these occurred more in the approval year or after, as shown in Table 1. This suggests that external partners tend to make decisions regarding deals after the candidate drugs are deemed promising. Bianchi argues that two dimensions exist for open innovations in bio-pharmaceutical companies: inbound and outbound open innovation [21]. The former involves collaborations with other companies to sense and absorb the novel knowledge and technologies to trigger new innovations in early developmental stages, while the latter includes collaborations for commercial exploitation in later developmental stages. The majority of the data observed in this study could be categorized as outbound innovation, while further study is needed to unveil the prospects for inbound open innovation in this field. The limitations of the database used could also be a factor, as we searched for transactions by generic and brand names, but not by development code, as this would not work well with strategic transactions.
Regarding the type of enterprise, biologics are primarily discovered by biotechnology companies [18,29] and these had smaller R&D budgets during the timespan addressed in this study’s developed hypotheses. In fact, the ratio of applicants that were originally approved in small molecules was 70% for pharmaceutical companies versus 30% for biotechnology companies; of those approved in biologics, 53% were pharmaceutical companies, while 47% were biotechnology companies. This suggests that a higher ratio of biologics is developed by biotechnology companies. Alternatively, pharmaceutical and biotechnology companies applied an average of 18 and 21 biologics transactions, respectively, which are not statistically significant (p = 0.7). This may be because the top two biologics of the total number of transactions are Keytruda and Opdivo, which were developed by pharmaceutical companies. Additionally, more than half of biotechnology companies hold a large share of the market: Genentech, which is now a member of the Roche Group, holds five drugs; Amgen holds two; and Janssen holds one. These three companies have developed 8 of the 14 biologics developed by biotechnology companies. It is compelling that frequent inter-firm transactions may not relate to the company type or size.
We further investigated details regarding the types of inter-firm transactions that occurred for Keytruda, Opdivo, and Tecentriq, which led the transition period in 2015. We classified the transactions’ levels in detail by observing the second layer of deal categories. Some deals overlapped, in that one deal covered multiple types of transactions at the second layer of deal categories, and we counted these cases in all types of transactions. Table 2 illustrates that the trial collaboration is a common type of active transaction for all three drugs, which includes therapies combining other drugs licensed by other companies, followed by R&D and marketing-licensing, and includes royalty or profit split information. This can be objectively observed that life cycle management is highly active. This is also can be seen on company websites and ClinicalTrials.gov [40], an Internet-based resource that provides information on publicly and privately supported clinical studies of a range of diseases and conditions provided and updated by the study’s sponsor or principal investigator. The number of approved indications is also high, as Keytruda is ranked first of the 30 biologics that we investigated, with 15 indications; it is followed by Opdivo, ranked second with 10 indications; and Tecentriq, which was ranked fifth, with 4 indications. These observations suggest that inter-firm transactions are effective for successful drug discoveries and development in biologics. It is also noteworthy that trends in inter-firm transactions over the past two decades differ between PD-(L)1 inhibitors and other types of cancer drugs, even in biologics. As differences in the observed durations for each drug exist depend on the original approval year, future researchers could further investigate this topic.
As another point to expand, our study’s evaluation of trends among inter-firm transactions also revealed that horizontal collaborations have occurred more actively in biologics, and especially in the PD-(L)1 inhibitor segment of cancer drugs. This point should be investigated in depth in future research. Originally, the pharmaceutical industry comprised vertically integrated organizations, in which adjusting several different types of specialized knowledge and compiling a myriad of research was both necessary and important in creating novel types of drugs [41]. However, the trends of open innovations have expanded to several other industries and, thus, we observe the current, horizontally collaborative modes between pharmaceutical firms and start-ups [42,43].
5. Conclusions and Implications
We originally attempt to evaluate the effectiveness of inter-firm partnership in this pharmaceutical industry. Our findings suggest that a new paradigm exists to determine a pathway for successful drug discoveries and development in oncology; the more inter-firm transactions that are performed (especially trial collaborations), the more approvals that are achieved. This could provide a potential breakthrough in this industry to successfully develop innovative drug candidates to address current critically unmet medical needs. While we have not focused on other modes of action to investigate this issue, further study is necessary to confirm the applicability of this paradigm in broader drug discoveries and development in the pharmaceutical industry, which has a very important role in society. The pharmaceutical industry is expected to continuously deliver innovative treatment options to patients and healthcare providers for a sustainable future. We have realized this through our own experiences, especially when we face critical situations such as the current COVID-19 pandemic, where effective collaboration across companies is necessary to share knowledge, pool capabilities and resources, and leverage these for timely and effective drug research and development.
Author Contributions
Conceptualization, A.D.; methodology, A.D.; software, A.D.; validation, A.D.; formal analysis, A.D.; investigation, A.D.; resources, A.D.; data curation, A.D.; writing—original draft preparation, A.D; writing—review and editing, T.M., Y.L., S.S. and K.K.; supervision, K.K. All authors have read and agreed to the published version of the manuscript.
Funding
We acknowledge the support from the Japan Society for the Promotion of Science grant Numbers JP23730336, JP26301022, and 20H01546. We also appreciate all open source and database developers used in this research. The funding sources was not involved in the study design; in the collection, analysis and interpretation of data; in the writing of the report; and in the decision to submit the article for publication.
Acknowledgments
We are grateful to the editors and the referees for their valuable comments that helped to improve this paper.
Conflicts of Interest
Arisa Djurian is an employee of Takeda Pharmaceutical Company Limited; Tomohiro Makino is an employee of Daiichi Sankyo Company Limited. Neither company has any direct relationship to the content of this article.
References
- Kola, I.; Landis, J. Can the pharmaceutical industry reduce attrition rates? Nat. Rev. Drug Discov. 2004, 3, 711–715. [Google Scholar] [CrossRef]
- DiMasi, J.A.; Hansen, R.W.; Grabowski, H.G. The price of innovation: New estimates of drug development costs. J. Health Econ. 2003, 22, 151–185. [Google Scholar] [CrossRef] [Green Version]
- Adams, C.P.; Van Brantner, V. Market watch: Estimating the cost of new drug development: Is it really $802 million? Health Aff. 2006, 25, 420–428. [Google Scholar] [CrossRef] [PubMed] [Green Version]
- Kondo, H.; Hata, T.; Ito, K.; Koike, H.; Kono, N. The Current Status of Sakigake Designation in Japan, PRIME in the European Union and Breakthrough Therapy Designation in the United States. Ther. Innov. Regul. Sci. 2017, 51, 51–54. [Google Scholar] [CrossRef] [PubMed]
- Muensterman, E.T.; Luo, Y.; Parker, J.M. Breakthrough Therapy, PRIME and Sakigake: A Comparison Between Neuroscience and Oncology in Obtaining Preferred Regulatory Status. Ther. Innov. Regul. Sci. 2020, 54, 658–666. [Google Scholar] [CrossRef]
- Carroll, G.P.; Srivastava, S.; Volini, A.S.; Piñeiro-Núñez, M.M.; Vetman, T. Measuring the effectiveness and impact of an open innovation platform. Drug Discov. Today 2017, 22, 776–785. [Google Scholar] [CrossRef] [PubMed]
- Chesbrough, H.W. Open Innovation for Creating and Profiting from Technology; Harvard Business Review Press: Cambridgde, MA, USA, 2003. [Google Scholar]
- Gassmann, O.; Ellen, E.; Chesbrough, H. The future of open innovation. R D Manag. 2010, 40, 213–221. [Google Scholar] [CrossRef]
- Dries, L.; Pascucci, S.; Török, Á.; Tóth, J. Keeping your secrets public? Open versus closed innovation processes in the hungarian wine sector. Int. Food Agribus. Manag. Rev. 2014, 17, 147–162. [Google Scholar]
- Chiang, Y.H.; Hung, K.P. Exploring open search strategies and perceived innovation performance from the perspective of inter-organizational knowledge flows. R D Manag. 2010, 40, 292–299. [Google Scholar] [CrossRef]
- Mazzola, E.; Bruccoleri, M.; Perrone, G. The effect of inbound, outbound and coupled innovation on performance. Int. J. Innov. Manag. 2012, 16. [Google Scholar] [CrossRef]
- Mazzola, E.; Bruccoleri, M.; Perrone, G. Open innovation and firms’ performance: State of the art and empirical evidences from the bio-pharmaceutical industry. Int. J. Technol. Manag. 2016, 70, 109–134. [Google Scholar] [CrossRef] [Green Version]
- Demirbag, M.; Ng, C.-K.; Tatoglu, E. Performance of Mergers and Acquisitions in the Pharmaceutical Industry: A Comparative Perspective. Multinatl. Bus. Rev. 2007, 15, 41–62. [Google Scholar] [CrossRef]
- Munos, B. Lessons from 60 years of pharmaceutical innovation. Nat. Rev. Drug Discov. 2009, 8, 959–968. [Google Scholar] [CrossRef]
- Lamattina, J.L. The impact of mergers on pharmaceutical R&D. Nat. Rev. Drug Discov. 2011, 10, 559–560. [Google Scholar] [CrossRef] [PubMed]
- Schuhmacher, A.; Germann, P.-G.; Trill, H.; Gassmann, O. Models for open innovation in the pharmaceutical industry. Drug Discov. Today 2013, 18, 1133–1137. [Google Scholar] [CrossRef]
- Dahlander, L.; Gann, D.M. How open is innovation? Res. Policy 2010, 39, 699–709. [Google Scholar] [CrossRef]
- Lazonick, W.; Tulum, Ö. US biopharmaceutical finance and the sustainability of the biotech business model. Res. Policy 2011, 40, 1170–1187. [Google Scholar] [CrossRef]
- Wang, L.; Plump, A.; Ringel, M. Racing to define pharmaceutical R&D external innovation models. Drug Discov. Today 2015, 20, 361–370. [Google Scholar] [CrossRef]
- DiMasi, J.A.; Feldman, L.; Seckler, A.; Wilson, A. Trends in risks associated with new drug development: Success rates for investigational drugs. Clin. Pharmacol. Ther. 2010, 87, 272–277. [Google Scholar] [CrossRef] [PubMed]
- Bianchi, M.; Cavaliere, A.; Chiaroni, D.; Frattini, F.; Chiesa, V. Organisational modes for Open Innovation in the bio-pharmaceutical industry: An exploratory analysis. Technovation 2011, 31, 22–33. [Google Scholar] [CrossRef]
- Kinch, M.S.; Griesenauer, R.H. 2018 in review: FDA approvals of new molecular entities. Drug Discov. Today 2019, 24, 1710–1714. [Google Scholar] [CrossRef]
- Chen, L.; Han, X. Anti-PD-1/PD-L1 therapy of human cancer: Past, present, and future Find the latest version. J. Clin. Investig. 2015, 125, 3384–3391. [Google Scholar] [CrossRef] [PubMed] [Green Version]
- Nishijima, T.F.; Shachar, S.S.; Nyrop, K.A.; Muss, H.B. Safety and Tolerability of PD-1/PD-L1 Inhibitors Compared with Chemotherapy in Patients with Advanced Cancer: A Meta-Analysis. Oncologist 2017, 22, 470–479. [Google Scholar] [CrossRef] [PubMed] [Green Version]
- Drugs@FDA: FDA-Approved Drugs. Available online: https://www.accessdata.fda.gov/scripts/cder/daf/ (accessed on 20 July 2019).
- Merrifield, R.B. Solid Phase Peptide Synthesis. I. The Synthesis of a Tetrapeptide. J. Am. Chem. Soc. 1963, 85, 2149–2154. [Google Scholar] [CrossRef]
- Schreiber, S.L. Target-oriented and diversity-oriented organic synthesis in drug discovery. Science 2000, 287, 1964–1969. [Google Scholar] [CrossRef] [Green Version]
- Bleicher, K.H.; Böhm, H.J.; Müller, K.; Alanine, A.I. Hit and lead generation: Beyond high-throughput screening. Nat. Rev. Drug Discov. 2003, 2, 369–378. [Google Scholar] [CrossRef]
- DiMasi, J.A.; Grabowski, H.G. The cost of biopharmaceutical R&D: Is biotech different? Manag. Decis. Econ. 2007, 28, 469–479. [Google Scholar] [CrossRef]
- Carter, P.J. Potent antibody therapeutics by design. Nat. Rev. Immunol. 2006, 6, 343–357. [Google Scholar] [CrossRef]
- Huang, S.; Armstrong, E.A.; Benavente, S.; Chinnaiyan, P.; Harari, P.M. Dual-agent molecular targeting of the epidermal growth factor receptor (EGFR): Combining anti-EGFR antibody with tyrosine kinase inhibitor. Cancer Res. 2004, 64, 5355–5362. [Google Scholar] [CrossRef] [Green Version]
- Hay, M.; Thomas, D.W.; Craighead, J.L.; Economides, C.; Rosenthal, J. Clinical development siccess rates for investigational drugs. Nat. Biotechnol. 2014, 32, 40–51. [Google Scholar] [CrossRef]
- Schuhmacher, A.; Gassmann, O.; Hinder, M. Changing R&D models in research-based pharmaceutical companies. J. Transl. Med. 2016, 14, 1–11. [Google Scholar] [CrossRef] [Green Version]
- Imai, K.; Takaoka, A. Comparing antibody and small-molecule therapies for cancer. Nat. Rev. Cancer 2006, 6, 714–727. [Google Scholar] [CrossRef]
- DiMasi, J.A.; Grabowski, H.G.; Hansen, R.W. Innovation in the pharmaceutical industry: New estimates of R&D costs. J. Health Econ. 2016, 47, 20–33. [Google Scholar] [CrossRef] [PubMed] [Green Version]
- Calfee, J.E.; DuPré, E. The emerging market dynamics of targeted therapeutics. Health Aff. 2006, 25, 1302–1308. [Google Scholar] [CrossRef] [PubMed] [Green Version]
- CenterWatch. Available online: https://www.centerwatch.com/directories/1067-fda-approved-drugs (accessed on 20 July 2019).
- Breakthrough Therapy Approvals. Available online: https:https://www.fda.gov/drugs/nda-and-bla-approvals/breakthrough-therapy-approvals (accessed on 20 September 2019).
- Strategic Transactions. Available online: https://www.pharmamedtechbi.com/search (accessed on 26 July 2019).
- ClinicalTrials. Available online: https://clinicaltrials.gov/ (accessed on 1 November 2019).
- Pisano, G. Science Business: The Promise, the Reality and the Future of Biotech; Harvard Business School Press: Cambridge, MA, USA, 2006. [Google Scholar]
- Makino, T.; Lim, Y.; Kodama, K. Strategic R&D transactions in personalized drug development. Drug Discov. Today 2018, 23, 1334–1339. [Google Scholar] [CrossRef] [PubMed]
- Makino, T.; Sengoku, S.; Ishida, S.; Kodama, K. Trends in interorganizational transactions in personalized medicine development. Drug Discov. Today 2019, 24, 364–370. [Google Scholar] [CrossRef] [PubMed]
Figure 1.
(a) Annual number of approved NME and NBE for cancer drugs from year 1999 to 2018. NME: New Molecule Entity, NBE: New Biological Entity. (b) Annual accumulated number of transactions for cancer drugs from year 1999 to 2018. NME: New Molecule Entity, NBE: New Biological Entity.
Figure 1.
(a) Annual number of approved NME and NBE for cancer drugs from year 1999 to 2018. NME: New Molecule Entity, NBE: New Biological Entity. (b) Annual accumulated number of transactions for cancer drugs from year 1999 to 2018. NME: New Molecule Entity, NBE: New Biological Entity.


Figure 2.
Average number of transactions of individual drugs performed from 1999 to 2018 in the total, acquisitions, alliances, and financing categories for small molecules and biologics. n = 77 (small molecules) and 30 (biologics), *, p < 0.05, †, p < 0.1.
Figure 2.
Average number of transactions of individual drugs performed from 1999 to 2018 in the total, acquisitions, alliances, and financing categories for small molecules and biologics. n = 77 (small molecules) and 30 (biologics), *, p < 0.05, †, p < 0.1.

Figure 3.
Comparing the average number of approved indications from year 1999 to 2018. n = 77 (small molecules) and 30 (biologics), †, p < 0.1.
Figure 3.
Comparing the average number of approved indications from year 1999 to 2018. n = 77 (small molecules) and 30 (biologics), †, p < 0.1.

Figure 4.
Scatterplot: Number of transactions versus approved indications from year 1999 to 2018. R in the total, acquisitions, alliances, and financing categories are 0.82, 0.66, 0.80, and 0.84, respectively; p < 0.01.
Figure 4.
Scatterplot: Number of transactions versus approved indications from year 1999 to 2018. R in the total, acquisitions, alliances, and financing categories are 0.82, 0.66, 0.80, and 0.84, respectively; p < 0.01.

Figure 5.
Compare average number of approvals under BTD from year 2013 to 2018. BTD: Breakthrough therapy designation. *, p < 0.05.
Figure 5.
Compare average number of approvals under BTD from year 2013 to 2018. BTD: Breakthrough therapy designation. *, p < 0.05.

Figure 6.
Scatterplot: Number of transactions versus the number of approvals under BTD from year 2013 to 2018. BTD: Breakthrough therapy designation. R of the total, acquisitions, alliances, and financing categories are 0.69, 0.49, 0.69, and 0.68, respectively; p < 0.01.
Figure 6.
Scatterplot: Number of transactions versus the number of approvals under BTD from year 2013 to 2018. BTD: Breakthrough therapy designation. R of the total, acquisitions, alliances, and financing categories are 0.69, 0.49, 0.69, and 0.68, respectively; p < 0.01.


Table 1.
The annual number of transactions for each drug from year 1999 to 2018: Small molecules and Biologics.
Table 1.
The annual number of transactions for each drug from year 1999 to 2018: Small molecules and Biologics.
| Original Approval Year | Brand Name | Generic Name | +5y | +4y | +3y | +2y | +1y | App | −1y | −2y | −3y | −4y | −5y |
|---|---|---|---|---|---|---|---|---|---|---|---|---|---|
| Small Molecules | |||||||||||||
| 2018 | VITRAKVI | LAROTRECTINIB | NA | NA | NA | NA | NA | 0 | 6 | 0 | 0 | 0 | 1 |
| 2018 | COPIKTRA | DUVELISIB | NA | NA | NA | NA | NA | 6 | 2 | 1 | 0 | 1 | 0 |
| 2017 | ZEJULA | NIRAPARIB | NA | NA | NA | NA | 4 | 6 | 5 | 1 | 1 | 1 | 1 |
| 2012 | XTANDI | ENZALUTAMIDE | 0 | 6 | 3 | 3 | 2 | 0 | 0 | 0 | 1 | 0 | 0 |
| 2012 | ICLUSIG | PONATINIB | 3 | 5 | 3 | 6 | 1 | 0 | 1 | 1 | 0 | 0 | 0 |
| 2004 | TARCEVA | ERLOTINIB HYDROCHLORIDE | 4 | 5 | 5 | 2 | 2 | 1 | 2 | 1 | 1 | 0 | 0 |
| Biologics | |||||||||||||
| 2017 | BAVENCIO | AVELUMAB | NA | NA | NA | NA | 7 | 5 | 6 | 3 | 1 | 0 | 0 |
| 2017 | IMFINZI | DURVALUMAB | NA | NA | NA | NA | 8 | 4 | 1 | 10 | 2 | 0 | 0 |
| 2016 | TECENTRIQ | ATEZOLIZUMAB | NA | NA | NA | 10 | 10 | 12 | 5 | 1 | 1 | 0 | 0 |
| 2014 | KEYTRUDA | PEMBROLIZUMAB | NA | 20 | 28 | 15 | 19 | 3 | 0 | 1 | 0 | 0 | 0 |
| 2014 | OPDIVO | NIVOLUMAB | NA | 11 | 23 | 15 | 12 | 6 | 0 | 0 | 1 | 0 | 0 |
| 2013 | KADCYLA | TRASTUZUMAB EMTANSINE | 5 | 5 | 6 | 7 | 2 | 7 | 3 | 2 | 1 | 5 | 0 |
| 2011 | YERVOY | IPILIMUMAB | 7 | 7 | 5 | 1 | 1 | 4 | 0 | 1 | 0 | 0 | 2 |
| 2004 | ERBITUX | CETUXIMAB | 1 | 1 | 5 | 6 | 5 | 6 | 2 | 2 | 0 | 2 | 1 |
| 2004 | AVASTIN | BEVACIZUMAB | 1 | 2 | 2 | 8 | 2 | 2 | 1 | 2 | 0 | 0 | 0 |
The annual number of transactions in the original approval year and ±5 years are indicated as 6–10 (light gray), 11–20 (dark gray), or 21 or more (black). Drugs with less than six transactions per year are excluded from this table. App = original approval year, y = year(s), and NA = not applicable.
Table 2.
Detailed types of inter-firm transactions for Keytruda, Opdivo, and Tecentriq performed from 1999 to 2018.
Table 2.
Detailed types of inter-firm transactions for Keytruda, Opdivo, and Tecentriq performed from 1999 to 2018.
| Acquisition | Alliance | Financing | ||||||||||||||||||||
|---|---|---|---|---|---|---|---|---|---|---|---|---|---|---|---|---|---|---|---|---|---|---|
| Acquisition of Private Biotech | Full Acquisition | Includes Contract | Includes Earn-outs | Intra-Biotech Deal | Payment Includes Cash | Payment Includes Stock | Reverse Acquisition | Co-Promotion | Includes Contract | Includes Equity | Includes Royalty or Profit Split Information | Intra-Biotech Deal | Marketing-Licensing | Product or Technology Swap | R&D and Marketing-Licensing | Trial Collaborations | Follow-On Public Offering | Initial Public Offering | Nonconvertible Debt | Private Investment in Public Equity | Private Placement | |
| Keytruda | 3 | 8 | 4 | 4 | 0 | 8 | 1 | 0 | 7 | 1 | 3 | 11 | 6 | 4 | 0 | 16 | 56 | 5 | 3 | 0 | 3 | 7 |
| Opdivo | 4 | 6 | 3 | 4 | 1 | 5 | 2 | 1 | 3 | 2 | 6 | 18 | 2 | 1 | 1 | 27 | 40 | 2 | 4 | 1 | 0 | 2 |
| Tecentriq | 1 | 1 | 0 | 1 | 0 | 1 | 0 | 0 | 5 | 1 | 2 | 12 | 18 | 0 | 0 | 12 | 30 | 0 | 4 | 0 | 0 | 1 |
The number of transactions is indicated as 10 or less (white), 11–19 (light yellow), or 20 or more (yellow).
© 2020 by the authors. Licensee MDPI, Basel, Switzerland. This article is an open access article distributed under the terms and conditions of the Creative Commons Attribution (CC BY) license (http://creativecommons.org/licenses/by/4.0/).
Share and Cite
MDPI and ACS Style
Djurian, A.; Makino, T.; Lim, Y.; Sengoku, S.; Kodama, K. Trends of Business-to-Business Transactions to Develop Innovative Cancer Drugs. Sustainability 2020, 12, 5535. https://doi.org/10.3390/su12145535
AMA Style
Djurian A, Makino T, Lim Y, Sengoku S, Kodama K. Trends of Business-to-Business Transactions to Develop Innovative Cancer Drugs. Sustainability. 2020; 12(14):5535. https://doi.org/10.3390/su12145535
Chicago/Turabian StyleDjurian, Arisa, Tomohiro Makino, Yeongjoo Lim, Shintaro Sengoku, and Kota Kodama. 2020. "Trends of Business-to-Business Transactions to Develop Innovative Cancer Drugs" Sustainability 12, no. 14: 5535. https://doi.org/10.3390/su12145535
Note that from the first issue of 2016, this journal uses article numbers instead of page numbers. See further details here.