Ten Principles to Determine Environmental Flow Requirements for Temporarily Closed Estuaries


1
Botany Department, Nelson Mandela University, Port Elizabeth 6031, South Africa
2
DST/NRF Research Chair in Shallow Water Ecosystems, Institute for Coastal and Marine Research, Nelson Mandela University, Port Elizabeth 6031, South Africa
3
Council for Scientific and Industrial Research (CSIR), P.O. Box 320, Stellenbosch 7599, South Africa
*
Author to whom correspondence should be addressed.
Water 2020, 12(7), 1944; https://doi.org/10.3390/w12071944
Submission received: 29 May 2020
/
Revised: 28 June 2020
/
Accepted: 6 July 2020
/
Published: 8 July 2020
(This article belongs to the Special Issue Environmental Flows, Ecological Quality and Ecosystem Services)
Abstract
:Temporarily closed estuaries require seasonal opening to tidal flows to maintain normal ecological processes. Each estuary has specific environmental flow (EFlow) requirements based on the relationship between freshwater inflow, coastal dynamics, rate of sandbar formation, and the open/closed state of the mouth. Key abiotic processes and ecosystem services linked to mouth state were highlighted. We reviewed completed EFlow requirement studies for temporarily closed estuaries in South Africa and found that the formulation of these requirements should consider the timing and magnitude of flows in relation to the morphology of an estuary, its mouth structure, catchment size, and climate. We identified ten key principles that could be adapted to similar systems in equivalent climatic settings. Principle 1 recognizes that each estuary is unique in terms of its EFlow requirements because size, scale, and sensitivity of core elements to freshwater inflow are specific for each system; EFlows cannot be extrapolated from one estuary to another. Principle 2 highlights the importance of baseflows in keeping an estuary mouth open because a small reduction in flow can cause the mouth to close and alter essential ecological processes. Principle 3 outlines the role of floods in resetting natural processes by flushing out large volumes of sediment and establishing the equilibrium between erosion and sedimentation. Principle 4 emphasizes the need for open mouth conditions to allow regular tidal flushing that maintains water quality through reducing retention times and preventing the onset of eutrophic conditions. Principle 5 advises artificial breaching to be practiced with caution because execution at low water levels encourages sedimentation that reduces the scouring effect of flushing. Principle 6 holds that elevated inflow volumes from wastewater treatment works or agricultural return flows can increase the frequency of mouth opening and cause ecological instability. Principle 7 states that water released from dams to supply the environmental flow cannot mimic the natural flow regime. Principle 8 specifies the need for short- and long-term data to increase the confidence levels of EFlow assessments, with data to be collected during the open and closed mouth states. Principle 9 advocates the implementation of a monitoring program to track the achievement of EFlow objectives as part of a strategic adaptive management cycle. Finally, Principle 10 recommends the adoption of a holistic catchment-to-coast management approach underpinned by collaboration with regulatory authorities and stakeholders across a range of sectors. These principles can be used to guide the formulation and management of EFlows, an essential strategy that links the maintenance of estuarine ecological integrity with social well-being.
Keywords:
intermittently; lakes; lagoons; bar; microtidal; coastal; semi-closed; berm; water quality; ecosystem services
1. Introduction
The importance of freshwater inflow to estuaries and their response to altered flows are particularly relevant in semi-arid countries such as South Africa. Rainfall is variable and unpredictable with approximately 1000 mm per annum falling along the eastern subtropical coast and <200 mm per annum on the west coast. Modifications to freshwater inflow by human activities threaten the health and functioning of South African estuaries. While several studies have addressed responses to change in freshwater inflow [1,2,3,4,5,6,7], few have quantified the environmental flow (EFlow) required to maintain these ecosystems and their benefits in the face of competing water uses and regulated flows. Flow studies in estuaries pose unique challenges because the combined influence of the river and the sea generates spatial and temporal variability at a range of scales.
In South Africa, estuaries are defined as partially enclosed, permanent water bodies, either continuously or periodically open to the sea and extending landwards as far as the upper limit of tidal action, salinity penetration, or back-flooding under closed-mouth conditions. During floods, they can become river mouths where no seawater enters. When there is little or no fluvial input, they can be isolated from the sea by a sandbar and become fresh or hypersaline [8]. More than 90% of South African estuaries have restricted inlets brought about by low river runoff combined with strong coastal wave action and high rates of sediment movement [7,9]. Sand bars (berms) form in mouth regions causing >75% to intermittently close off from the sea [8,10,11]. Such estuaries have been classified globally as either temporarily closed estuaries (TCEs), temporarily open/closed estuaries (TOCEs), intermittently open lakes and lagoons (ICOLLS), or intermittently open/closed estuaries (IOCEs) that remain closed until sufficient inflow, often flood events, enables the berm to be breached [9,12,13]. They are also known collectively as blind estuaries, bar-built systems, coastal plain estuaries, barrier beaches, and estuarine embayments and are located in coastal plains where there is sufficient marine sediment to support the development of barrier beaches, dunes, or bars [14]. They are a feature of microtidal (<2m tidal range) and low-mesotidal (1.3 m mean tidal range) coastlines in the mid-latitudes, predominantly those with temperate climates [12]. These estuaries occur on the south-eastern coast of New Zealand, Australia, Brazil, and Uruguay; the south-western coast of India and Sri Lanka [15]; and are numerically dominant in microtidal Mediterranean climates. For example, of the 47 estuaries in south-western Australia, 82% are close to the sea [16]. Lagoons, creeks, and back dune lagoons in south-eastern Australia are also close to the sea during low flow conditions [17].
Artificial breaching of closed estuaries and coastal lagoons is a common practice worldwide, used to offset flow reduction, prevent flooding, and improve fisheries and water quality [18,19,20,21]. In Central and Southern California, many historically closed estuaries have been permanently opened using groins, levees, and regular dredging [22], practices that can have unforeseen negative environmental impacts. TCEs can have high biodiversity importance and productivity. Closed phases are associated with high abundance and biomass of benthic microalgae, submerged macrophytes, zooplankton, and hyper- and zoobenthos [23]. Peaks in food resources and available habitats coupled with stable physico-chemical conditions benefit estuarine-spawning fish that, in turn, support piscivorous avifauna. The estuaries function as important roosting and feeding sites for resident and migratory birds. Similarly, closed systems in south-eastern Australia and in California provide nursery habitats for juvenile fish and migratory shore birds [17,24,25].
This article focuses specifically on South African TCEs that are < 500 ha in size and seasonally or intermittently open with land–sea connectivity occurring at annual scales. This group differs from large (>500 ha) closed systems such as ICOLLS and coastal lagoons that often remain closed for several years at a time. Recently, the sizeable group of South African TCEs [10] was sub-divided into large and small systems based on a threshold estuarine habitat area of 15 ha [8]. Small TCEs are strongly event-driven and can experience rapid increases and decreases in freshwater inflow over a few hours. They are generally perched and when open (semi-closed), the outflow channel restricts tidal amplitude to 10–15 cm compared to 15–30 cm in large TCEs. The main forces that maintain open mouth conditions are river inflow and to a lesser extent tidal flows [8], while the main closing forces are wave energy and sediment availability from marine, fluvial, or aeolian sources (Figure 1). South Africa’s microtidal estuaries are sensitive to changes in river inflow as comparatively low runoff is discharged into a high energy coastal environment [26]. They stay closed until their basins fill up and the sand berm is breached. Mouth opening may result in the removal of significant amounts of sediment. However, infilling from marine and fluvial sediment following flow reduction can be rapid. Groundwater inflows are an important additional source of freshwater input in arid and semi-arid environments for the development of refugia during droughts, and the maintenance of water level and salinity regimes [27]. However, surface water flow is the dominant driver in mouth behavior of TCEs given their small size and sensitivity to flow changes and are thus the focus of EFlow studies.
Estuaries require an adequate flow of freshwater to maintain a healthy state. EFlows describe the quantity and quality of freshwater flows in terms of timing, duration, frequency, and intensity necessary to sustain aquatic ecosystems. Managing EFlows to estuaries should account for these aspects of the annual and multi-year hydrograph. These EFlows support human cultures, economies, sustainable livelihoods, and well-being [28]. EFlow requirements were seldom considered in water resource planning and management [29,30,31,32,33] until methods were developed for estuaries in South Africa, Australia, and the USA (CA and TX) [33,34]. EFlow requirements have also been described for Mediterranean coastal ecosystems, such as the Ebro Delta, where anthropogenic pressures are magnified by the natural hydrological variability of aquatic ecosystems [35,36]. To ensure ecological sustainability and social well-being, innovation is needed in the emerging science of EFlows [28].
The aim of the study was to review EFlow assessments conducted for a range of these systems to identify and describe general principles that can be applied to this category of estuary worldwide. The exercise was based on EFlow studies conducted over the past 25 years in South Africa and included the outcome of research aimed at understanding the responses of TCEs to changes in freshwater inflow [15,23,31,32,37,38]. The discussion includes estuarine lakes and predominantly open estuaries where they illustrate a relevant phenomenon during the closed-mouth state. Processes under these conditions are comparable to that in TCEs. Reviews of TCE responses to changes in freshwater inflow are described in detail elsewhere [15,23]. The study presented in this paper updates these reviews and relates estuary response to changes in important ecosystem services [39]. Some of the key abiotic processes and biotic responses that occur when freshwater is abstracted and the mouth of the estuary closes more frequently to the sea were highlighted (Table 1).
2. EFlow Studies in South Africa
South Africa’s National Water Act (Act 38 of 1998) recognizes water as a national asset and requires sufficient quality and quantity of water to be “reserved” for estuaries to ensure their functioning and health. EFlows must be allocated to meet environmental and basic human needs before water can be abstracted for other uses. In response, the Ecological Reserve Method to determine the Environmental Water Requirements (EWR) of estuaries was devised in 1999 by a core team of estuary specialists [40,41]. The method summarized in Figure 2 incorporates an ecosystem approach that requires an understanding of the effect of changes in river inflow on the abiotic components of an estuary (e.g., hydrodynamics, sediment dynamics, and water quality) and the response of its biotic elements (e.g., microalgae, macrophytes, invertebrates, fishes and birds) [32,40,41].
An estuarine health index is applied to measure the present state from a reference condition taken approximately 120 years ago, before large-scale urban and water resource development occurred in South Africa. The index rates estuaries from 0 to 100 as natural (91–100), largely natural (74–90), moderately modified (75–61), largely modified (60–39), and highly degraded (40–21) to extremely degraded (20–0) [42,43]. Changes in health state provide a measure of how resilient an estuary is to changes in EFlows. EFlows are set to maintain the estuary in the desired condition identified after taking different development and hydrological scenarios into account. The achievement of the desired state depends on the provision of minimum flows from the catchment that will keep the mouth open, flush the water column, scour sediments, and ensure the maintenance of ecosystem services such as the estuary nursery function.
The South African EFlow method uses a “top down” approach, which defines freshwater inflows from the perspective of the natural flow regime using a scenario-based approach [28,29]. Because of the lack of measured river inflow data for smaller estuaries, rainfall-runoff models are used to simulate inflows. Either monthly and/or daily-flow time-series are generated with the temporal resolution determined by variability in river flow and its influence on salinity distribution and mouth conditions. However, hydrological data for long time-periods (e.g., 60–80 year simulation periods), which are more representative of South Africa’s highly variable runoff regimes, are normally only available for monthly flow data. Drought flows are generally assumed at 90% exceedance of mean monthly flows over the simulation period, seasonal low flows at between 80 and 50% exceedance (with a focus on the dry season), and floods at a greater-than-95% exceedance. Estuary sensitivity to flow can vary depending on estuary size and associated tidal flows, wave exposure, and catchment runoff signal. While some estuaries only close under drought conditions, others may close under dry-season base flows. Correlations between mouth state and measured and/or simulated flows are therefore used to determine an estuary’s responses to flow variations and superimpose that on the natural, present, and potential future flow regimes to quantify change (see [31,32] for more information on ecohydrological coupling).
EFlow requirement data for this review were available for 38% of TCEs in South Africa from studies commissioned by the government department responsible for water resource management or by regional catchment management agencies that needed the data to issue new water use licenses. Data were also obtained from assessments undertaken on behalf of local municipal authorities such as eThekweni Municipality that planned to release treated sewerage into the Mdloti and Mhlanga estuaries [44]. The company Richards Bay Minerals commissioned an EFlow study for the Siyaya Estuary in KwaZulu-Natal [45], and the Water Research Commission funded an assessment of the East Kleinemonde Estuary as part of a larger Resource Directed Measures project [46]. Studies that advanced the understanding of EFlows were identified in this review in an effort to document incremental learning. Applying the EFlow requirement method in South Africa has followed a “learning-by-doing” approach. The principles and lessons learnt were identified mainly from five estuary case studies (Great Brak, Uilkraals, Mhlanga, Goukamma, and East Kleinemonde estuaries). The location of these and other estuaries mentioned in the text are shown in Figure 3.
3. Understanding the Relationship between Freshwater Inflow and Ecosystem Services
This section updates our knowledge on the response of TCEs to changes in freshwater inflow and links these responses to changes to Ecosystem Services. Managing estuaries through EFlows requires that a balance be achieved between using estuary resources and sustaining their ability to continue to deliver goods and services. Table 1 outlines the responses of TCEs to reduced freshwater inflow and closed mouth conditions that influence their abiotic properties and causes changes in the biota, thus ultimately impacting on the provision of ecosystem services.
3.1. Maintaining Intertidal Habitat Is Key to Productivity
Freshwater input helps maintain an open estuary mouth that allows tidal exchange with nearshore marine water and supports the formation of intertidal habitat. South African estuaries experience three dominant hydrodynamic states defined by the state of the mouth, i.e., open, semi-closed and closed [47]. In the semi-closed state, the mouth is shallow and perched (elevated above mean sea level) with a narrow opening that restricts tidal exchange by allowing only a trickle of water out to sea. This leads to the loss of intertidal habitat, such as salt marsh, and bird species that feed in this area (Table 1). When this state persists and little tidal exchange occurs, the estuary becomes “fresh”, benefiting biota that prefer fresh to brackish conditions, e.g., the submerged macrophyte Ruppia cirrhosa instead of Zostera capensis.
The loss of tidal action adversely affects the quantity and availability of intertidal benthic organisms that provide food for wading birds. Since many are Palaearctic migrants, the impact of persistent mouth closures on global bird populations is far reaching [48]. Other effects include the loss of shallow water habitats, favored by herons and flamingos, and the loss of islands that provide roosts and breeding sites safe from terrestrial predators [46]. In response, EFlows are set to maintain intertidal habitats as this provides ecosystem services such as water quality maintenance, erosion control, bank protection, and flood mitigation (Table 1).
3.2. Catchment and Marine Connectivity Sustain Biodiversity, Fisheries, and Genetic Diversity
Mouth closure leads to the loss of land–sea connectivity and nursery habitats, which affects recruitment of invertebrates and fish, and impacts fisheries (Table 1). Some migratory invertebrates, such as penaeid swimming prawns, anomuran mudprawns and mangrove crabs, have an obligatory marine phase in their life cycle and cannot re-enter estuaries under closed conditions [49]. Predominantly adult fish communities were recorded at the Swartvlei Estuary during closed periods because juveniles could not reach nursery areas [50]. Prolonged closure results in low recruitment to estuaries of juvenile marine fish and prevents the migration of adults back to the sea [51,52]. In the Bot Estuary, non-migrating resident fish were dominant after three years of closure [53]. Some species can, however, be recruited into closed systems by larval fish moving over the berm during overwash events, as recorded at East Kleinemonde Estuary, where marine species, e.g., Rhabdosargus holubi, were encountered in nursery areas [9,49,54]. During extended closures, fish populations decline rapidly due to predation by other fish, birds, and mammals.
EFlows are designed and set to ensure an estuary mouth is open during key recruitment periods, i.e., spring and summer for most migratory fish. More recently, they have been used to ensure genetic exchange between TCEs by ensuring simultaneous breaching in adjacent systems [55]. Freshwater species with estuarine or marine life-cycle phases, e.g., freshwater prawns and shrimps (Macrobrachium spp.), catadromous crabs (Varuna litterata) and Anguillidae eels, can be cut off from these estuaries if there is inadequate freshwater inflow [32]. Consequently, they depend on a catchment-to-coast management approach for their survival. Coastal connectivity is maintained through freshwater flow to the sea that carries nutrients, detritus, and sediment in the form of productive plumes or fronts. These serve as migration and spawning cues [5,32,56]. Lamberth et al. [56] showed the negative influence of freshwater inflow reduction on commercial line fish catchments documented for 40 km off the east coast of South Africa.
3.3. Duration and Extent of Water Level Fluctuations Act as Biological Resetting Events
When an estuary mouth closes, water levels can build up behind the sand bar and flood nearby habitats, leading to a loss of ecosystem services such as bird watching (Table 1). Macrophyte response to water level changes is summarized in Table 2. The ecosystems approach requires that the relationship between abiotic drivers and biotic responses is central to the EFlow assessment. Succulent salt marsh species are sensitive to prolonged inundation and die back after three months [57,58,59]. The impact of changes in water level on plants depends on the duration, intensity, and frequency of an event and the phenology of the plant at the time [60]. Large sediment seed reserves ensure macrophyte survival and persistence even after prolonged unfavorable conditions [61]. If evaporation exceeds freshwater inflow, water levels decrease exposing habitats to desiccation. Extensive submerged macrophyte beds (e.g., Ruppia cirrhosa) can form during mouth closures but desiccate and die back if permanently exposed; they recover rapidly, however, from a large seed bank [62]. In contrast, low water levels associated with floods and mouth opening act as natural stressors, causing extensive dieback of submerged macrophytes, and boom-and-bust population dynamics in the endemic red-listed fish, Clinus spatulatus, has been reported [55]. Submerged macrophyte die-back and fish kills were also reported in the West Kleinemonde Estuary where the water level naturally decreased by 1.65 m in 24 h when the mouth opened; thousands of fish became trapped in the littoral submerged macrophyte beds [63].
Extreme water level fluctuations thus act as biological resetting events, preventing dominance of selected species and temporarily reducing estuary productivity and biodiversity. These events need to be identified, understood, and incorporated into the allocation of EFlows given that the management objective is to maintain biodiversity and the natural estuary functioning as best as possible. Increasing freshwater abstraction can mimic this stress in a system not previously subjected to it, causing disruption of natural processes. Freshwater abstraction caused the Kobonqaba Estuary in the Eastern Cape and Uilkraals Estuary in the Western Cape to close to the sea in 2010, the first time in recorded history [64]. High water levels in the Kobonqaba Estuary flooded the mangroves, causing die-back and tree loss [65] and die-back of salt marsh in the Uilkraals. In future, sea level rises in response to climate change could result in more frequent open mouth states and increased tidal exchange. However, an increase in the frequency and intensity of sea storms would increase sand delivery, thus raising the berm height and causing the estuary mouth to close. Predicted decreases in dry-season base flows and increases in droughts could also cause more frequent mouth closures, flooding, and die-back of salt marsh plants, or low water levels causing die-back of submerged macrophytes. These extreme conditions need to be incorporated into EFlow assessments to ensure natural variability and future resilience to climate change.
3.4. Water Quality Changes Impacts on Nutrient Cycling, Fisheries, and Cultural Values
TCEs are particularly vulnerable to water quality changes during the closed state when longer water residence times allow nutrients to accumulate and primary producers to grow. Micro- and macroalgal blooms have increased in South African estuaries, particularly in TCEs. Besides wastewater input, agricultural return flow also reduces water quality that leads to anoxic conditions and eutrophication. Oxygen extremes and fish kills are common. A recent assessment showed the largest wastewater volumes to be discharged to TCEs compared to other estuary types [66]. Input of sewage effluent is a major problem on the developed east coast around Durban, where this is often the only flow into small estuaries [31]. River flow into the Mdloti Estuary was found not to be a predictor of physico-chemical state as the system is driven by effluent inflows [67]. The minimum discharge standards of municipal effluents are extremely high (21 mg L−1 (ca. 1500 µM)) for inorganic nitrogen (DIN) and 10 mg L−1 (ca. 320 µM) for phosphorus (DIP) and cause estuary eutrophication [31,66]. Some estuaries (e.g., Wildevoëlvlei and Zeekoe) have transitioned to alternate stable states characterized by toxic cyanobacteria blooms resulting from wastewater inputs and increased residence times [66]. Nutrient assimilation and cycling function of estuaries are essential ecosystem services that need to be protected for estuaries to retain their resilience. Polluted estuaries lose their recreational and aesthetic value (Table 1). In particular, during the closed state, there is an increase in the retention of pollutants and human pathogens. Microbiological indicators used for contact recreation are the abundance of Enterococci and Escherichia coli [68].
3.5. Salinity Extremes Drive Biological Responses and Can Limit the Provision of Ecosystem Services
Depending on rainfall and salinity conditions, closed estuaries can become hyper- or hyposaline. Along the semi-arid west coast, hypersaline conditions occur regularly during closed phases, whereas hyposaline conditions are common on South Africa’s subtropical east coast (Figure 3). However, many east coast estuaries have lost their marine connection to the sea owing to encroachment by infrastructure. EFlow assessments use the duration and extent of salinity penetration as a key indicator to evaluate estuary health state, and where possible, recommend mitigation measures that control salinity regimes to protect estuary biodiversity and productivity. Common to hypersaline estuaries is a low freshwater supply that persists for varying times, relatively long water residence times, high evaporative loss from the estuary basin, and temporary loss of connectivity to the sea [69]. South Africa’s arid environment has resulted in a number of case studies that highlight the relationship between flow, salinity regimes, and biotic responses. In the hypersaline Groen Estuary (Figure 3), biotic recruitment from the marine environment follows mouth opening, but species disappear progressively as salinity increases and threshold salinity values are reached. Salinity ranged from 223 in the lower reaches to <10 upstream over a distance of <1 km [70]. In the Seekoei Estuary, fish kills occurred when salinity rose above 90. Mass mortality of estuarine fish is also associated with exposure to low salinity (<6) resulting from extended closed-mouth conditions [71]. The sand prawn (Callianassa kraussi) cannot breed in salinity less than 20, suggesting that infrequent mouth openings substantially reduce populations [72]. Dieback of vegetation due to salinity changes results in the destabilization and erosion of banks with potential flooding of surrounding properties (Table 1). Where no site-specific information is available, generic abiotic-biotic (driver-response) relationships are extrapolated to systems that share characteristics in EFlow studies.
4. Principles for the Determination of EFlows for Temporarily Closed Estuaries
Completed EFlow studies in South Africa were critically assessed for lessons learnt and to identify key principles (Table 3). These principles are specific to temporarily closed estuaries, with a bias towards smaller-sized classes by global standards (<500 ha in size). This unique subset of estuaries often requires additional considerations in the determination of EFlows and associated management mitigations, such as the importance of mouth state, and related sensitivity to water quality and water level change. EFlow determination for estuaries lags behind that of river assessments; these principles can be used globally to assist in the setting of EFlows for similar types of estuaries.
4.1. Principle 1: EFlows Are Unique for Every Estuary
The way in which estuaries are influenced by freshwater inflow is the result of flow patterns that occur over weeks or months. Strong longitudinal abiotic gradients develop and change in response to tides and freshwater inflow and, in turn, influence biotic composition and function. The size, shape (bathymetry and topography), and characteristics of the freshwater inflow regime of an estuary determines its EFlow requirements. Each one has unique elements that govern its sensitivity to freshwater inflow modifications. For example, large estuarine lakes experience changes in water level and salinity on annual time scales, whereas smaller closed estuaries experience these on a monthly scale. In general, the smaller an estuary, the more sensitive it will be to a modification in river flow [32]. While low flows are generally associated with closed-mouth conditions and high flows (particularly episodic flood events), with open mouth conditions, actual flow magnitudes are specific to each estuary and have little relevance to others. Table 3 indicates the river flow at which the mouth closes for different estuaries. This is not related to the MAR or the present ecological state of the estuary. The objective of EFlow studies in South Africa is to maintain the natural mouth phase regime of an estuary, whether it be predominantly open or closed most of the time, and thus supports natural functions and ecosystems services. Only in exceptional circumstances, e.g., as a result of historical poor land-use planning or management of effluent and storm water, will deviation from what is natural be deemed an appropriate management response.
The wave climate and tidal regime at an estuary’s location, and associated cross-shore and longshore sediment transports, are key factors influencing mouth functioning. For example, the temporarily closed Mngazi Estuary drains a much larger catchment area than the predominantly open Mngazana Estuary, but closes to the sea as the mouth is exposed to high wave energy and sediment deposition. On the other hand, a rocky headland at Mngazana Estuary leads to increased turbulence and scouring of the channel, preventing sediment deposition and provides protection from wave action (Figure 4). In addition, the neap tidal volume of the estuary (170,000 m3) is larger than the Mngazi Estuary (65,000 m3), indicating that tidal flows assist in keeping the mouth open under higher wave conditions. The median flow (50th percentile) for the Mngazana Estuary is 0.3 m3 s−1 compared to 0.6 m3 s−1 in the Mngazi Estuary. Due to wave refraction and diffraction around the headland at Mngazana mouth, a rip current is often generated, which flows adjacent to the rocky shoreline towards the sea. This current assists in removing sediment from the mouth area. These factors contribute to keeping the Mngazana Estuary permanently open. This shows the need for site-specific data for EFlow assessments and shows that EFlow requirements cannot be extrapolated from one adjacent estuary to the others without considering site-specific variances.
Along high-energy coastlines, the mouths of TCEs can close within days to weeks because flows from relatively small catchments rapidly decrease below the volumes needed to maintain an open mouth, while the mouths of more protected TCEs may only close after a few months. For example, at the larger Great Brak TCE (105 ha), tidal flows through an unrestricted (non-perched) mouth assist in maintaining open mouth conditions. Mouth closure occurs over neap tides and high wave conditions during low flow periods (Table 4). In other small estuaries, e.g., Little Amanzimtoti (10 ha) and Mbokodweni (18 ha), mouth opening and closing often occurs in less than a day during low-flow conditions. Such systems can be open for a few hours at a time depending on the rate at which the sand berm at the mouth is built by the sea. Aided by high wave energy and high volumes of suspended sediment, the height of the sand berm at the Mhlanga Estuary in KwaZulu-Natal (KZN) increased over seven days to reach its maximum [49], while the Great Brak Estuary took up to four months to reach similar levels [73].
4.2. Principle 2: A Small Reduction in Baseflow Leads to Mouth Closure
A small reduction in baseflow can cause the mouth of an estuary to close. The relatively large 286 ha Uilkraals Estuary (Figure 5, Table 2) changed from a predominantly open to a temporarily closed estuary following the construction of the Kraaibosch dam 10 km upstream from the mouth. The estuary now receives 70% of its natural MAR [77] and the mouth closes at flows less than 0.03 m3 s−1 (Figure 5). The EFlow study for this estuary recommended that invasive alien plants be removed from the catchment in an effort to restore dry season baseflow. While a relatively low flow rate is needed to keep the Uilkraals mouth open, which is protected from wave energy, much higher flow rates may be needed for estuaries located along high-energy beaches, such as those of the KwaZulu-Natal south coast (Figure 3). Changes in annual flow rates given as a percentage change in mean annual runoff mask the degree to which seasonal flows can be modified. For example, while the MAR may only be modified by 10%, the dry-season baseflows may be altered by as much as 50%, thus stressing the importance of baseflow regimes in EFlow allocations to ensure the flow of ecosystem benefits.
4.3. Principle 3: Floods Flush and Reset Closed Estuaries
Floods are the most important natural means of eroding and transporting sediment from estuaries. Large volumes can be rapidly removed during major floods, with a return period of 1 in 20 years or more. Floods therefore determine the equilibrium between sedimentation and erosion (Figure 6). Smaller floods with return periods of 1–2 years can sometimes also have a significant influence [81]. The annual runoff of South African rivers is highly variable and unpredictable compared with larger Northern Hemisphere systems, and fluctuates between floods and extremely low to zero freshwater inflow [82,83]. Droughts and floods determine the envelope in which estuaries operate [84] and must be included in EFlow assessments. Accumulated sediment is both catchment-derived and transported into estuaries on flood tides by longshore coastal currents. Soil erosion in catchments poses a major threat to estuaries and can cause rapid infilling of small systems [24,85]. In the small Onrus Estuary (10 ha), flows of ~2 m3 s−1 (Oct 2012) resulted in mouth opening but no sediment scouring (Figure 7a). Larger flows of between 4 and 12 m3 s−1 (August to December 2013) were required to remove accumulated sediments and organic matter and to reset the sediment cycle and tidal conditions (Figure 7b).
4.4. Principle 4: Open Mouth Conditions Maintain Good Water Quality
When the mouth of a closed estuary opens and normal tidal exchanges occur, regular flushing improves water quality (Figure 8) [66]. Reduced flow and no tidal exchange leads to higher water retention times and limited mixing that creates eutrophic and polluted conditions, particularly in urbanized freshwater-dominated estuaries. To illustrate these cause-effect relationships, increased freshwater abstraction upriver of the Palmiet Estuary has increased the duration and frequency of closed mouth conditions and has resulted in the development of algal blooms and anoxic conditions, particularly in the stratified, deeper waters [32]. EFlow assessments can prescribe a minimum baseflow to maintain open mouth conditions and resultant tidal flushing [28]. Flow releases and mouth states should always mimic the natural conditions and maintain historically established mouth dynamics. In Southern California, temporarily closed estuaries have been changed to permanently open under the pretext of restoration. This has resulted in changes to habitat types because the closed state is essential to normal estuarine function. For an activity to be restorative, it should follow natural hydrological and sediment dynamic regimes [22].
In urban estuaries affected by low-lying development and nutrient enrichment, management objectives can also focus on the maintenance of water quality for socio-economic and human health reasons [86]. In these systems, artificial breaching of the mouth to flush out contaminants is seen as a solution to ameliorate poor water quality. The mouth of the Zand Estuary in South Africa has been actively managed to facilitate the penetration of seawater on spring tides, thus keeping the estuary well flushed in the low flow season. Reduced water residence times and elevated salinity limited the occurrence of harmful algal blooms, bacterial contamination, and fish kills [87]. However, artificial breaching as a flow mitigation measure without supporting freshwater input from the catchment can result in reduced water column depth and increases stress on resident biota by exposing communities to low oxygen bottom waters that occur in enriched systems [88,89,90]. Artificial breaching is thus not advocated as a mitigation for poor water quality and this should rather be addressed at source. Restoration of morphological complexity including green infrastructure such as wetlands will help retain sediment and nutrient inputs, thus mitigating adverse water quality. In addition, artificial breaching of an estuary with poor water quality can pose a risk to near shore marine ecology and users (e.g., recreational beaches or aquaculture facilities). This aspect is less relevant for small estuaries (with small volumes) discharging in high energy coastal environments that assist with dilution of pollutants.
4.5. Principle 5: Artificial Breaching Causes Sedimentation
Artificial breaching as a flow mitigation measure needs to be practiced with caution because, besides the adverse ecological effects, it leads to sedimentation and thus reduced flushing in an estuary (Figure 9). Estuaries are frequently breached to lower water levels and reduce floods risks to low-lying development. Artificial breaching is usually advocated when an estuary is closed for a prolonged period. Flooding of the causeway for extended periods at the Seekoei Estuary, which has seen substantial flow reduction, provided the motivation for artificial breaching. However, its estuary management plan indicates that mouth management only would not restore estuary function, and freshwater inflow is essential to maintain estuary health [91].
When breaching occurs at natural levels (often 1–2 m higher than at present), a large volume of water flows out to sea over an extended period which, in turn, scours sediment from the lower and middle reaches of the estuary (Figure 9). The sediment flushing potential increases exponentially with increasing outflow velocities. When breaching takes place at lower water levels, flushing intensity is reduced and sediment accumulates. This practice also disrupts normal deposition-erosion cycles and reduces the scouring effectiveness of subsequent breaching. Consequently, the berm widens and estuary channels constrict [64].
Environmental Impact Assessment legislation in South Africa makes provision for the formulation of a Mouth Management Plan (captured in an operational Maintenance Management Plan) that enables artificial breaching to be based on sound scientific knowledge of estuary function. Timing of breaching must take ecological processes, such as fish and invertebrate recruitment, into account. Artificial breaching practices are not advocated as a mitigation measure for freshwater inflow reduction as it comes with its own long-term impacts, but where it is an established practice, it should be integrated into EFlow studies and freshwater allocated to support the mitigation where needed.
4.6. Principle 6: Wastewater Input and Agricultural Return Flow Can Cause Unstable Conditions
Increased inflow volumes from wastewater treatment works can be detrimental because increased baseflows and higher water levels cause more frequent mouth openings in TCEs (Figure 10a) causing ecological instability, low biotic diversity, and biomass. At the Mhlanga Estuary, sewage discharge and growing urbanization have resulted in freshwater inflow volumes increasing by 158% to a present MAR of 19.6 × 10⁵ m3 [92]. Consequently, the estuary has changed from being predominantly closed to predominantly open. For example, between March 2002 and March 2003, the mouth opened 23 times and the ecosystem became unstable with reduced microalgal biomass and low biodiversity [49]. Because the estuary is perched above mean sea level, it drains when the mouth opens. Water levels fall and much of the floodplain becomes permanently exposed, losing important invertebrate and fish habitats. Reed beds dry out and periphyton, which forms the base of the food chain, no longer grows. Limited reed productivity reduces detrital input to the ecosystem, affecting the entire food chain, especially detritivore fish [93]. In some smaller closed estuaries, such the Tongati (37 ha), input from the wastewater treatment works in the dry season exceeds the minimum flow by approximately 300% and keeps the mouth open. Eutrophic freshwater conditions that develop in small closed KwaZulu-Natal systems promote colonization by invasive aquatic plants such as water hyacinth [31,66]. EFlow assessments that aim to improve estuary ecological status will focus on returning the flow regime as close as possible back to natural, which may involve diversion or reuse of wastewater.
4.7. Principle 7: Water Released from Dams to Supplement the EFlow Cannot Replace the Natural Flow Regime
Releasing water from upstream dams to keep an estuary mouth open can be viewed as a mitigation strategy to reduce the impact of reduced freshwater inflow (Figure 10b). There is little published on this as dam releases are mostly used as a mitigation measure in river ecosystems. In South Africa, freshwater releases from the Wolwedans Dam upstream of the Great Brak Estuary facilitated the development of an in-depth understanding of estuarine EFlow requirements as an early case study (Table 2). Thirty years of monitoring and adaptive management involving scientists, government departments, and citizens refined the flow releases and subsequent management practices [81]. Planned releases in spring and summer allowed the mouth to remain open and improved its ecological health by supporting salt marsh growth, fish, and mudprawn recruitment [73]. However, while the dam releases maintained open mouth conditions, they did not ensure sustained good water quality. When closed, decomposition of residual organic material caused oxygen stress to fish, and the development of macroalgal blooms indicated deteriorating water quality that nutrient measurements alone did not reveal [38,73,74,75,76]. Floods are therefore needed to flush out organic material accumulated during the closed period. In addition, natural flood patterns act as a queuing factor to attract juvenile fish and invertebrates to the estuary as nursery habitats. Most South African dams were not, however, designed for flood releases and cannot meet this EFlow requirement to support critical ecosystem services.
4.8. Principle 8: Field and Long-Term Data Are Needed for High-Confidence EFlow Assessments
The availability of high-confidence data influences the reliability of EFlow study outcomes. Funds are often too limited to support the acquisition of sufficient detail, which leads to low-confidence results [32]. Confidence in hydrology data are particularly important. Essential relationships between flow, hydrodynamics, sediment dynamics, water quality, and biotic responses can only be determined from field data collected concurrently. Discipline-orientated data sets are often unrelated to influencing environmental factors [41]. Long-term water level data and mouth state observations allow for the correlation between mouth state and specific flow ranges in TCEs. For high-confidence studies and accurate assessments of estuary health, closed systems must also be sampled in the open and closed mouth states (Table 2).
Although the Great Brak Estuary was monitored for 12 years, an accurate assessment of ecological health was only achieved once the “higher trophic level” biotic components, particularly fish, were included [73]. The Goukamma Estuary, situated in a scenic protected area, was thought to be in good condition until regular sampling of the water column exposed eutrophic and anoxic conditions in highly stratified bottom waters caused by inputs from surrounding dairy farms ([78], Table 3). Artificial breaching of an estuary mouth can confuse the understanding of the relationship between freshwater inflow and mouth condition unless there are accurate long-term records. Field and long-term monitoring data are thus especially needed at modified systems to assess the environmental flow requirements of estuaries. Figure 11 (modified from [55]) indicates an excellent long-term data set for water level, fish abundance, and mouth state that was used to identify status and trends needed to set high-confidence EFlows.
The EFlows method used in South Africa analyses changes in runoff on a monthly time scale. This scale is inadequate for small estuaries as they are highly variable and respond to daily flows [32]. Reliable EFlow requirement estimations sometimes need flow data on a daily basis to quantify and incorporate high variability. The installation of flow gauges and water level recorders at TCEs enable important relationships between abiotic drivers and biotic responses to be measured and incorporated. Such long-term monitoring data were used, for example, to link macrophyte response to changing mouth conditions in the unmodified East Kleinemonde Estuary (Table 4). Established flow-response relationships for critical ecosystem services can, in turn, be extrapolated to similar systems where observational data are absent, thus increasing confidence in EFlow assessments.
4.9. Principle 9: Monitoring Must Take Place in a Strategic Adaptive Management Cycle
Most EFlow studies emphasize the need for detailed resource monitoring such as water level recordings, continuous gauging of river inflow, mouth observations, longitudinal and vertical salinity distributions, and monitoring of nutrient concentrations and selected biotic components. Table 5 shows the data required for an EFlow assessment (Figure 2). Resource monitoring assesses whether the allocated EFlow is achieving the desired state (health category) and associated ecosystem services (as captured in ecological condition categories). Each EFlow assessment identifies the monitoring required for selected abiotic and biotic components and specifies the temporal and spatial scale required for interpretation. Optimal frequency and duration of measurement is indicated where appropriate (Table 5), however, because of the variability of estuaries’ high-confidence studies would benefit from continuous monitoring and frequent measurements. This mostly does not take place because of limited resources (funding and human).
Implementation of EFlows and compliance monitoring must take place in an adaptive management cycle as natural systems can behave in complex manners and resource use changes over time, thus requiring modifications to EFlow allocations to achieve management objectives (Figure 12a). This “learning-by-doing” approach is well documented in ecological monitoring programs [94]. Finally, the national department responsible for water initiated a National Estuary Monitoring Programme in South Africa where the first tier focused on abiotic parameters and the second tier monitored biotic parameters [95]. Significant funding constraints has however halted progress with this program. This emphasizes the need to secure high-level government support and to embed monitoring in regional or national budgets.
4.10. Principle 10: Catchment to Coast Integrated Management Approach Needed
Small catchments mean TCEs are sensitive to local land use changes. This necessitates a holistic catchment-to-coast management approach that requires collaboration across government departments and sectors (Figure 12b). The Integrated Water Resource Management (IWRM) process captures some of this complexity and EFlows are an important component [30]. Estuaries are subjected to multiple pressures, e.g., artificial breaching and biological invasions [7], and need to be assessed as part of an estuary EFlow assessment to ensure that desired state objectives are achievable. Co-operative governance can address non-flow related impacts. For example, fishing during the closed mouth state in a small estuary can constitute “mining” of estuarine-dependent species. This requires fisheries management interventions to ensure stock recovery. Implementing EFlows is an important component of estuary restoration and a socio-ecological systems approach is necessary to achieve estuary health, ecosystem services, and human wellbeing objectives [86]. The Emerald Growth concept of Tagliapietra et al. [96] presents a new framework for managing ecological quality by analyzing socio-economic growth and human well-being as part of ecosystem services of transitional waters. The determination of EFlow allocations should be a cross-sectorial endeavor because reduced flows to estuaries have effects in sectors such as fisheries, tourism, and biodiversity [31]. Many of these sectors are regarded as “just another stakeholder” in water management instead of becoming an integral part of steering or oversight committees leading EFlow processes. Integration would allow broad discussions across all sectors, not only from a water supply perspective. In South African EFlow studies, international obligations (e.g., Ramsar, Convention on Biological Diversity) are often not achieved owing to an under-representation of sectors in decision-making. In order to ensure a sustainable flow of ecosystem services, EFlows should thus not be set in isolation from other sector objectives.
5. Conclusions and Recommendations
Increasing human pressures on estuaries highlights the need for effective EFlow assessments for these systems. TCEs are threatened by relatively small levels of water abstraction and related changes in mouth condition. Similarly, small changes in water quality in high retention systems can lead to a rapid degradation in overall condition. This is further exacerbated by poor land-use, over exploitation of living resources, and artificial breaching. EFlows should always be assessed in the context of natural estuary functioning, present management actions, and restoration activities needed to maintain or improve conditions.
This article highlights 10 principles that underpin the determination of EFlow requirements (Table 6). Principles 1–4 address recommendations for EFlows, namely the importance of base flows, floods, and open mouth conditions and that each estuary is considered unique as EFlow requirements do not transfer well between systems. Principles 5–7 address some of the pressures such as additional flows, artificial breaching, and water releases from dams. These are mitigation and management actions that need to be addressed in EFlow studies. Principles 8–10 consider monitoring and management recommendations relating to long term monitoring, strategic adaptive management, and an integrated catchment-to-coast approach. These 10 principles can be adapted to TCEs in climatic settings similar to those in South Africa. Globally, studies have incorporated social, economic, and cultural issues into integrated water resources management frameworks. The emerging frontier of EFlows is an essential strategy that links the maintenance of ecological integrity with social wellbeing.
The 10 key principles identified from evaluating several completed studies can be used to guide the allocation of estuarine EFlows. Although EFlow implementation is often slow, there have been successes. EFlows have, for example, prevented the issuing of water use licenses in stressed catchments and in ecologically sensitive estuaries where EFlow requirements are high. They have guided plans to divert sewage effluent in an effort to restore its health. Water demand and/or the need for wastewater disposal in urban areas, however, means that the health of some systems will never be improved. The “learning-by-doing” approach would benefit from a globally based comparative assessment of successes and failures in implementing estuary EFlows so that lessons learnt can be shared.
Challenges facing the implementation of EFlows include those related to a changing climate, which will shift baselines for estuary management and prompt a precautionary approach to development. Implementation of EFlow requirements is necessary to improve the resilience of estuarine ecosystems. Essential elements of climate-related change need to be integrated into estuary management plans and governance policies.
Author Contributions
Conceptualization, J.B.A. and L.V.N.; Data curation, J.B.A. and L.V.N.; Funding acquisition, J.B.A. and L.V.N.; Writing—original draft, J.B.A. and L.V.N.; Writing—review & editing, J.B.A. and L.V.N. All authors have read and agreed to the published version of the manuscript.
Funding
The Water Research Commission, Department of Water and Sanitation, and the National Research Foundation (NRF) have all funded aspects of EFlow studies on estuaries. The National Research Foundation of South Africa through the support of the Department of Science and Technology (DST)/NRF Research Chair in Shallow Water Ecosystems (UID 84375) funded the first author. The second author was supported by a DST/CSIR Parliamentary grant.
Acknowledgments
Stephen Lamberth, Department of Forestry, Fisheries, and Environment is thanked for his input on biotic processes and responses. Carla Dodd is thanked for assistance with the figures and Lesley McGwynne provided editorial input. Teddy Hiscock provided excellent support during completion of this ten pretty principles paper in lockdown. Three anonymous reviewers are thanked for their useful input that improved the final version.
Conflicts of Interest
The authors declare no conflict of interest. The funders had no role in the design of the study; in the collection, analyses, or interpretation of data; in the writing of the manuscript, or in the decision to publish the results.
Ethics Statement
No human or animal samples were involved in this study. We have accurately presented our research findings and objectively discussed the significance of the findings.
References
- Whitfield, A.K.; Wooldridge, T. Changes in Freshwater Supplies to Southern African Estuaries: Some Theoretical and Practical Considerations. In Changes in Fluxes in Estuaries: Implications from Science to Management; Dyer, K., Orth, R., Eds.; Olsen & Olsen: Fredensborg, Denmark, 1994; pp. 41–50. [Google Scholar]
- Bate, G.; Adams, J.B. The Effects of a Single Artificial Freshwater Release into the Kromme Estuary. 1: Overview and Interpretation for the Future. Water SA 2000, 26, 329–332. [Google Scholar]
- Alber, M. A Conceptual Model of Estuarine Freshwater Inflow Management. Estuar. Coasts 2002, 25, 1246–1261. [Google Scholar] [CrossRef]
- Estevez, E. Review and Assessment of Biotic Variables and Analytical Methods Used in Estuarine Inflow Studies. Estuaries 2002, 25, 1291–1303. [Google Scholar] [CrossRef]
- Gillanders, B.; Kingsford, M. Impact of Changes in Flow of Freshwater on Estuarine and Open Coastal Habitats and the Associated Organisms. In Oceanography and Marine Biology: An Annual Review; Gibson, R., Barnes, M., Atkinson, R., Eds.; Taylor & Francis: New York, NY, USA, 2002; Volume 40, pp. 233–309. [Google Scholar]
- Fohrer, N.; Chicharo, L. Interaction of River Basins and Coastal Waters—An Integrated Ecohydrological View. In Treatise on Estuarine and Coastal Science; McLusky, D., Wolanski, E., Eds.; Elsevier: Amsterdam, The Netherlands, 2011; pp. 109–150. [Google Scholar]
- Van Niekerk, L.; Adams, J.B.; Bate, G.; Forbes, N.; Forbes, A.; Huizinga, P.; Lamberth, S.; MacKay, F.; Petersen, C.; Taljaard, S.; et al. Country-Wide Assessment of Estuary Health: An Approach for Integrating Pressures and Ecosystem Response in a Data Limited Environment. Estuar. Coast. Shelf Sci. 2013, 130, 239–251. [Google Scholar] [CrossRef]
- Van Niekerk, L.; Adams, J.B.; James, N.; Lamberth, S.; MacKay, C.; Turpie, J.K.; Rajkaran, A.; Weerts, S.; Whitfield, A.K. An Estuary Ecosystem Classification That Encompasses Biogeography and a High Diversity of Types in Support of Protection and Management. Afr. J. Aquat. Sci. 2020, 45, 199–216. [Google Scholar] [CrossRef] [Green Version]
- Whitfield, A.K.; Bate, G. A Review of Information on Temporarily Open/Closed Estuaries in the Warm and Cool Temperate Biogeographic Regions of South Africa, with Particular Emphasis on the Influence of River Flow on These Systems; WRC Report No. 1581/1/07; Water Research Commission: Pretoria, South Africa, 2007.
- Whitfield, A.K. A Characterization of Southern African Estuarine Systems. S. Afr. J. Aquat. Sci. 1992, 18, 89–103. [Google Scholar]
- Taljaard, S.; Van Niekerk, L.; Joubert, W. Extension of a Qualitative Model on Nutrient Cycling and Transformation to Include Microtidal Estuaries on Wave-Dominated Coasts: Southern Hemisphere Perspective. Estuar. Coast. Shelf Sci. 2009, 85, 407–421. [Google Scholar] [CrossRef] [Green Version]
- McSweeney, S.; Kennedy, D.; Rutherford, I.; Stout, J. Intermittently Closed/Open Lakes and Lagoons: Their Global Distribution and Boundary Conditions. Geomorphology 2017, 292, 142–152. [Google Scholar] [CrossRef] [Green Version]
- Hadwen, W.L.; Arthington, A. Ecology, Threats and Management Options for Small Estuaries and ICOLLS; Technical Report; Sustainable Tourism Cooperative Research Center: Queensland, Australia, 2006.
- Whitfield, A.K.; Elliot, M. Ecosystem and Biotic Classification of Estuaries and Coasts. In Treatise on Estuarine and Coastal Science 2; McLusky, D., Wolanski, E., Eds.; Elsevier: Amsterdam, The Netherlands, 2011. [Google Scholar]
- Perissinotto, R.; Stretch, D.; Whitfield, A.K.; Adams, J.B.; Forbes, A.; Demetriades, N. Ecosystem Functioning of Temporarily Open/Closed Estuaries in South Africa. In Estuaries: Types, Movement Patterns and Climatical Impacts; Crane, J., Solomon, A., Eds.; Nova Science Publishers: New York, NY, USA, 2010; pp. 1–69. [Google Scholar]
- Tweedley, J.R.; Warwick, R.M.; Hallett, C.S.; Potter, I.C. Fish-Based Indicators of Estuarine Condition That Do Not Require Reference Data. Estuar. Coast. Shelf Sci. 2017, 191, 209–220. [Google Scholar] [CrossRef] [Green Version]
- Scanes, E.; Scanes, P. Climate Change Rapidly Warms and Acidifies Australian Estuaries. Nat. Commun. 2020, 11, 1803. [Google Scholar] [CrossRef] [Green Version]
- Chávez, V.; Mendoza, E.; Ramírez, E.; Silva, R. Impact of Inlet Management on the Resilience of a Coastal Lagoon: La Mancha, Veracruz, Mexico. J. Coast. Res. 2017, 77, 51–61. [Google Scholar] [CrossRef]
- Gale, E.; Pattiaratchi, C.; Ranasinghe, R. Processes Driving Circulation, Exchange and Flushing within Intermittently Closing and Opening Lakes and Lagoons. Mar. Freshw. Res. 2007, 58, 709–719. [Google Scholar] [CrossRef]
- Conde, D.; Solari, S.; De Àlava, D.; Rodríguez-Gallego, L.; Verrastro, N.; Chreties, C.; Lagos, X.; Piñeiro, G.; Teixeira, L.; Seijo, L.; et al. Ecological and Social Basis for the Development of a Sand Barrier Breaching Model in Laguna de Rocha, Uruguay. Estuar. Coast. Shelf Sci. 2019, 219, 300–316. [Google Scholar] [CrossRef]
- Behrens, D.K.; Bombardelli, F.A.; Largier, J.L.; Twohy, E. Episodic closure of the tidal inlet at the mouth of the Russian River—A small bar-built estuary in California. Geomorphology 2013, 189, 66–80. [Google Scholar] [CrossRef]
- Jacobs, D.; Stein, E. Classification of California Estuaries Based on Natural Closure Patterns: Templates for Restoration and Management; Southern California Coastal Water Research Project: Costa Mesa, CA, USA, 2011; Volume 619.
- Whitfield, A.K.; Bate, G.C.; Adams, J.B.; Cowley, P.; Froneman, P.; Gama, P.; Strydom, N.A.; Taljaard, S.; Theron, A.; Turpie, J.K.; et al. A Review of the Ecology and Management of Temporarily Open/Closed Estuaries in South Africa, with Particular Emphasis on River Flow and Mouth State as Primary Drivers of These Systems. Afr. J. Mar. Sci. 2012, 34, 163–180. [Google Scholar] [CrossRef]
- Roper, T.; Creese, B.; Scanes, P.; Stephens, K.; Williams, R.; Dela-Cruz, J.; Coade, G.; Coates, B.; Fraser, M. Assessing the Condition of Estuaries and Coastal Lake Ecosystems in NSW. Monitoring, Evaluation and Reporting Program; NSW Office of Environment and Heritage: Sydney, Australia, 2011.
- Behrens, D.K.; Brennan, M.; Battalio, P.E. A quantified conceptual model of inlet morphology and associated lagoon hydrology. Shore Beach 2015, 83, 33–42. [Google Scholar]
- Cooper, J.A.G. Geomorphological Variability among Microtidal Estuaries from the Wave-Dominated South African Coast. Geomorphology 2001, 40, 99–122. [Google Scholar] [CrossRef]
- DWS (Department of Water and Sanitation). Determination of Ecological Water Requirements for Surface Water (River, Estuaries and Wetlands) and Groundwater in the Lower Orange WMA. Buffels, Swartlintjies, Spoeg, Groen and Sout Estuaries Ecological Water Requirement. Available online: http://www.dwa.gov.za/rdm/currentstudies/doc/lowerorange/Buffels,%20Swartlientjies%20Spoeg,%20Groen%20and%20Sout%20EWR%20Report.pdf (accessed on 7 July 2020).
- Arthington, A.; Bhaduri, A.; Bunn, S.; Jackson, S.; Tharme, R.; Tickner, D.; Young, B.; Acreman, M.; Baker, N.; Capon, S.; et al. The Brisbane Declaration and Global Action Agenda on Environmental Flows. Front. Environ. Sci. 2018, 6, 45. [Google Scholar] [CrossRef] [Green Version]
- Arthington, A.; Bunn, S.; Poff, N.; Naiman, R. The Challenge of Providing Environmental Flow Rules to Sustain River Ecosystems. Ecol. Appl. 2006, 16, 1311–1318. [Google Scholar] [CrossRef]
- Brown, C.; Campher, D.; King, J. Status and Trends in EFlows in Southern Africa. Nat. Resour. Forum 2020, 44, 66–88. [Google Scholar] [CrossRef] [Green Version]
- Van Niekerk, L.; Adams, J.B.; Allen, D.; Taljaard, S.; Weerts, S.; Louw, D.; Talanda, C.; Van Rooyen, P. Assessing and Planning Future Estuarine Resource Use: A Scenario-Based Regional Scale Freshwater Allocation Approach. Sci. Total Environ. 2019, 657, 1000–1013. [Google Scholar] [CrossRef] [PubMed]
- Van Niekerk, L.; Taljaard, S.; Adams, J.B.; Lamberth, S.; Huizinga, P.; Turpie, J.K.; Wooldridge, T. An Environmental Flow Determination Method for Integrating Multiple-Scale Ecohydrological and Complex Ecosystem Processes in Estuaries. Sci. Total Environ. 2019, 656, 482–494. [Google Scholar] [CrossRef]
- Adams, J.B. Determination and Implementation of Environmental Water Requirements for Estuaries; Ramsar Technical Report No. 9; CBD Technical Series No. 69; Ramsar Convention Secretariat: Gland, Switzerland; Secretariat of the Convention on Biological Diversity: Montreal, QC, Canada, 2012.
- Borja, A.; Bricker, S.; Dauer, D.; Demetriades, N.; Ferreira, J.; Forbes, A.; Hutchings, P. Overview of Integrative Tools and Methods in Assessing Ecological Integrity in Estuarine and Coastal Systems Worldwide. Mar. Pollut. Bull. 2008, 56, 1519–1537. [Google Scholar] [CrossRef] [PubMed]
- Ibáñez, C.; Prat, N. The Environmental Impact of the Spanish National Hydrological Plan on the Lower Ebro River and Delta. Int. J. Water Resour. Dev. 2003, 19, 485–500. [Google Scholar] [CrossRef]
- Belmar, O.; Ibáñez, C.; Forner, A.; Caiola, N. The Influence of Flow Regime on Ecological Quality, Bird Diversity, and Shellfish Fisheries in a Lowland Mediterranean River and Its Coastal Area. Water 2019, 11, 918. [Google Scholar] [CrossRef] [Green Version]
- Adams, J.B. A Review of Methods and Frameworks Used to Determine the Environmental Water Requirements of Estuaries. Hydrol. Sci. J. 2014, 59, 451–465. [Google Scholar] [CrossRef] [Green Version]
- Human, L.; Snow, G.; Adams, J.B. Responses in a Temporarily Open/Closed Estuary to Natural and Artificial Mouth Breaching. S. Afr. J. Bot. 2016, 107, 39–48. [Google Scholar] [CrossRef]
- Costanza, R.; de Groot, R.; Braat, L.; Kubisze-Wski, I.; Fioramonti, L.; Sutton, P.; Farber, S.; Grasso, M. Twenty Years of Ecosystem Services: How Far Have We Come and How Far Do We Still Need to Go? Ecosyst. Serv. 2017, 28, 1–16. [Google Scholar] [CrossRef]
- Adams, J.B.; Bate, G.C.; Harrison, T.D.; Huizinga, P.; Taljaard, S.; Van Niekerk, L.; Plumstead, E.; Whitfield, A.K.; Wooldridge, T. A Method to Assess the Freshwater Inflow Requirements of Estuaries and Application to the Mtata Estuary, South Africa. Estuaries 2002, 25, 1382–1393. [Google Scholar] [CrossRef]
- Taljaard, S.; Adams, J.B.; Turpie, J.K.; Van Niekerk, L.; Demetriades, N.; Bate, G.C.; Cyrus, D.; Huizinga, P.; Lamberth, S.; Weston, B. Water Resource Protection and Assessment Policy Implementation Process. Resource Directed Measures for Protection of Water Resources: Methodology for the Determination of the Ecological Water Requirements for Estuaries; Version 2; Department of Water Affairs: Pretoria, South Africa, 2004.
- Turpie, J.K.; Taljaard, S.; Van Niekerk, L.; Adams, J.B.; Wooldridge, T.; Cyrus, D.; Clark, B.; Forbes, N. The Estuary Health Index: A Standardised Metric for Use in Estuary Management and the Determination of Ecological Water Requirements; WRC Report No. 1930/1/12; Water Research Commission: Pretoria, South Africa, 2012.
- Van Niekerk, L.; Adams, J.B.; Lamberth, S.; Mackay, F.; Taljaard, S.; Turpie, J.K.; Weerts, S. South Afr. National Biodiversity Assessment 2018: Technical Report Volume 3: Estuarine Realm; Department of Environmental Affairs: Pretoria, South Africa, 2019.
- DWAF. Rapid Determination of Resource Directed Measures of the Mdloti Estuary (Including Preliminary Estimates of Capping Flows for Mdloti and Mhlanga Estuaries); Specialist Report Prepared by the CSIR for the Department of Water Affairs & Forestry; CSIR: Pretoria, South Africa, 2002.
- Department of Water Affairs and Forestry (DWAF). Determination of the Preliminary Ecological Reserve on a Rapid Level for the Siyaya Estuary; Demetriades, N., Huizinga, P., Van Niekerk, L., Pillay, S., McKay, F., Cyrus, D., Forbes, A.T., Eds.; Department of Department of Water Affairs and Forestry: Pretoria, South Africa, 2006.
- Whitfield, A.K.; Adams, J.; Bate, G.; Bezuidenhout, K.; Bornman, T.G.; Cowley, P.; Froneman, P.; Gama, P.; James, N.; Mackenzie, B.; et al. A Multidisciplinary Study of a Small, Temporarily Open/Closed South African Estuary, with Particular Emphasis on the Influence of Mouth State on the Ecology of the System. Afr. J. Mar. Sci. 2008, 30, 453–473. [Google Scholar] [CrossRef]
- Snow, G.; Taljaard, S. Water Quality in South African Temporarily Open/Closed Estuaries: A Conceptual Model. Afr. J. Aquat. Sci. 2007, 32, 99–111. [Google Scholar] [CrossRef]
- Terörde, A.; Turpie, J.K. Influence of Habitat Structure and Mouth Dynamics on Avifauna of Intermittently-Open Estuaries: A Study of Four Small South African Estuaries. Estuar. Coast. Shelf Sci. 2013, 125, 10–19. [Google Scholar] [CrossRef]
- Perissinotto, R.; Blair, A.; Connell, A.; Demetriades, N.; Forbes, A.; Harrison, T.D.; Iyer, K.; Joubert, M.; Kibirige, I.; Mundree, S.; et al. Contributions to Information Requirements for the Implementation of Resource Directed Measures for Estuaries. Responses of the Biological Communities to Flow Variation and Mouth State in Two KwaZulu-Natal Temporarily Open/Closed Estuaries; WRC Report; Water Research Commission: Pretoria, South Africa, 2004; Volume 2.
- Kok, H.; Whitfield, A.K. The Influence of Open and Closed Mouth Phases on the Marine Fish Fauna of the Swartvlei Estuary. S. Afr. J. Zool. 1986, 21, 309–315. [Google Scholar] [CrossRef] [Green Version]
- James, N.; Cowley, P.; Whitfield, A.K. Abundance, Recruitment and Residency of Two Sparids in an Intermittently Open South African Estuary. Afr. J. Mar. Sci. 2007, 29, 527–538. [Google Scholar] [CrossRef]
- Vorwerk, P.; Whitfield, A.K.; Cowley, P.; Paterson, A. The Influence of Selected Environmental Variables on Fish Assemblage Structure in a Range of Southeast African Estuaries. Environ. Biol. Fishes 2003, 66, 237–247. [Google Scholar] [CrossRef]
- Bennett, B. The Fish Community of a Moderately Exposed Beach on the South Western Cape Coast of South Africa and an Assessment of This Habitat as a Nursery for Juvenile Fish. Estuar. Coast. Shelf Sci. 1989, 28, 293–305. [Google Scholar] [CrossRef]
- Cowley, P.; Whitfield, A.K. Ichthyofaunal Characteristics of a Typical Temporarily Open/Closed Estuary on the Southeast Coast of South Africa. Ichthyol. Bull. JLB. Smith Inst. Icthyol. 2001, 71, 1–19. [Google Scholar]
- Von der Heyden, S.; Toms, J.; Teske, P.; Lamberth, S.; Holleman, W. Contrasting Signals of Genetic Diversity and Historical Demography between Two Recently Diverged Marine and Estuarine Fish Species. Mar. Ecol. Prog. Ser. 2015, 526, 157–167. [Google Scholar] [CrossRef]
- Lamberth, S.; Drapeau, L.; Branch, G. The Effects of Altered Freshwater Inflows on Catch Rates of Non-Estuarine-Dependent Fish in a Multispecies Nearshore Line-Fishery. Estuar. Coast. Shelf Sci. 2009, 84, 527–538. [Google Scholar] [CrossRef]
- Riddin, T.; Adams, J.B. The Effect of a Storm Surge Event on the Macrophytes of a Temporarily Open/Closed Estuary, South Africa. Estuar. Coast. Shelf Sci. 2010, 89, 119–123. [Google Scholar] [CrossRef]
- Riddin, T.; Adams, J.B. Influence of Mouth Status and Water Level on the Macrophytes in a Small Temporarily Open/Closed Estuary. Estuar. Coast. Shelf Sci. 2008, 79, 86–92. [Google Scholar] [CrossRef]
- Adams, J.B.; Bate, G. The Effect of Salinity and Inundation on the Estuarine Macrophyte Sarcocornia Perennis (Mill.) A.J. Scott. Aquat. Bot. 1994, 47, 341–348. [Google Scholar] [CrossRef]
- Riddin, T.; Adams, J.B. Water Level Fluctuations and Phenological Responses in a Salt Marsh Succulent. Aquat. Bot. 2019, 153, 58–66. [Google Scholar] [CrossRef]
- Riddin, T.; Adams, J.B. The Seed Banks of Two Temporarily Open/Closed Estuaries in South Africa. Aquat. Bot. 2009, 90, 328–332. [Google Scholar] [CrossRef]
- Adams, J.B.; Knoop, W.; Bate, G.C. The Distribution of Estuarine Macrophytes in Relation to Freshwater. Bot. Mar. 1992, 35, 215–226. [Google Scholar] [CrossRef]
- Whitfield, A.K.; Cowley, P. A Mass Mortality of Fishes Caused by Receding Water Levels in the Vegetated Littoral Zone of the West Kleinemonde Estuary, South Africa. Afr. J. Aquat. Sci. 2018, 43, 179–186. [Google Scholar] [CrossRef]
- Van Niekerk, L.; Huizinga, P.; Theron, A. Semi-Closed Mouth States in Estuaries along the South African Coastline. In Proceedings of the Environmental Flows for River Systems, Fourth International Ecohydraulics Symposium, Cape Town, South Africa, 3–8 March 2002. [Google Scholar]
- Mbense, S.; Rajkaran, A.; Bolosha, U.; Adams, J.B. Rapid Colonization of Degraded Mangrove Habitat by Succulent Salt Marsh. S. Afr. J. Bot. 2016, 107, 129–136. [Google Scholar] [CrossRef]
- Adams, J.B.; Taljaard, S.; Van Niekerk, L.; Lemley, D.A. Nutrient Enrichment as a Threat to the Ecological Resilience and Health of Microtidal Estuaries. Afr. J. Aquat. Sci. 2020, 45, 23–40. [Google Scholar] [CrossRef] [Green Version]
- Brooker, B.; Scharler, U.M. The Importance of Climatic Variability and Human Influence in Driving Aspects of Temporarily Open-Closed Estuaries. Ecohydrology 2020, e2205. [Google Scholar] [CrossRef]
- DEA (Department of Environmental Affairs). South Afr. Water Quality Guidelines for Coastal and Marine Waters; Volume 2: Guidelines for Recreational Use; Department of Environmental Affairs: Pretoria, South Africa, 2012.
- Largier, J.; Hollibaugh, J.T.; Smith, S. Seasonally Hypersaline Estuaries in Mediterranean-Climate Regions. Estuar. Coast. Shelf Sci. 1997, 45, 789–797. [Google Scholar] [CrossRef]
- Wooldridge, T.; Adams, J.B.; Fernandes, M. Biotic Response to Extreme Hypersalinity in an Arid Zone Estuary, South Africa. S. Afr. J. Bot. 2016, 107, 160–169. [Google Scholar] [CrossRef]
- Bennett, B. A Mass Mortality of Fish Associated with Low Salinity Conditions in the Bot River Estuary. Trans. R. Soc. S.Afr. 1985, 45, 437–447. [Google Scholar] [CrossRef]
- an Niekerk, L.; Taljaard, S.; Adams, J.B.; Huizinga, P.; Lamberth, S.; Riddin, T.; Turpie, J.K.; Mallory, S.; Wooldridge, T. Rapid Assessment of the Ecological Water Requirements for the Bot Estuary; Report No. CSIR/NRE/CO/ER/2011/0035/B; CSIR: Pretoria, South Africa, 2011.
- DWA (Department of Water Affairs). Reserve Determination Studies for Selected Surface Water, Groundwater, Estuaries and Wetlands in the Outeniqua (Groot Brak and Other Water Resources, Excluding Wetlands) Catchment; Report No. RDM/K10-K30, K40E/00/CON/0307; DWA: Pretoria, South Africa, 2009.
- Nunes, M.; Adams, J.B. Responses of Primary Producers to Mouth Closure in the Temporarily Open/Closed Great Brak Estuary in the Warm-Temperate Region of South Africa. Afr. J. Aquat. Sci. 2014, 39, 387–394. [Google Scholar] [CrossRef]
- Human, L.; Snow, G.; Adams, J.B.; Bate, G.C.; Yang, S.-C. The Role of Submerged Macrophytes and Macroalgae in Nutrient Cycling in the Great Brak Estuary South Africa: A Budget Approach. Estuar. Coast. Shelf Sci. 2015, 154, 169–178. [Google Scholar] [CrossRef]
- Human, L.; Snow, G.; Adams, J.B.; Bate, G. The Benthic Regeneration of N and P in the Great Brak Estuary. Water SA 2015, 41, 594–605. [Google Scholar] [CrossRef]
- Anchor Environmental Consultants. Determination of the Ecological Reserve for the Uilkraals Estuary; Anchor Environmental: Cape Town, South Africa, 2012. [Google Scholar]
- Kaselowski, T.; Adams, J.B. Not so Pristine—Characterising the Physico-Chemical Conditions of an Undescribed Temporarily Open/Closed Estuary. Water 2013, 39, 627–637. [Google Scholar] [CrossRef] [Green Version]
- Van Niekerk, L.; Bate, G.C.; Whitfield, A.K. An Intermediate Ecological Reserve Determination Study of the East Kleinemonde Estuary; WRC Report No. 1581/2/08; Water Research Commission: Pretoria, South Africa, 2008.
- Riddin, T.; Adams, J.B. Predicting Macrophyte States in a Small Temporarily Open/Closed Estuary. Mar. Freshw. Res. 2012, 63, 616–623. [Google Scholar] [CrossRef]
- Van Niekerk, L.; Adams, J.B.; Taljaard, S.; Huizinga, P.; Lamberth, S. Advancing Mouth Management Practices in Groot Brak Estuary, South Africa. In Complex Coastal Systems—Transdisciplinary Learning on International Case Studies; Slinger, J., Taljaard, S., D’Hont, F., Eds.; Delft Academic Press: Delft, The Netherlands, 2020; pp. 89–104. [Google Scholar]
- Dettinger, M.; Diaz, H. Global Characteristics of Stream Flow Seasonality and Variability. J. Hydrometeorol. 2000, 1, 289–310. [Google Scholar] [CrossRef] [Green Version]
- Poff, N.; Ward, J.V. Implications of Streamflow Variability and Predictability for Lotic Community Structure: A Regional Analysis of Streamflow Patterns. Can. J. Fish. Aquat. Sci. 1989, 46, 1805–1818. [Google Scholar] [CrossRef]
- James, N.; Adams, J.B.; Connell, A.; Lamberth, S.; MacKay, C.; Snow, G.; Van Niekerk, L.; Whitfield, A.K. High Flow Variability and Storm Events Shape the Ecology of the Mbhashe Estuary, South Africa. Afr. J. Aquat. Sci. 2020, 45, 131–151. [Google Scholar] [CrossRef]
- Le Roux, J.; Morgenthal, T.; Malherbe, J.; Pretorius, D.; Sumner, P. Water Erosion Prediction at a National Scale for South Africa. Water 2008, 34, 305–314. [Google Scholar] [CrossRef] [Green Version]
- Adams, J.B.; Whitfield, A.K.; Van Niekerk, L. A Socio-Ecological Systems Approach towards Future Research for the Restoration, Conservation and Management of Southern African Estuaries. Afr. J. Aquat. Sci. 2020, 45, 231–241. [Google Scholar] [CrossRef]
- Lemley, D.A.; Adams, J.B.; Rishworth, G.M.; Bouland, C. Phytoplankton Responses to Adaptive Management Interventions in Eutrophic Urban Estuaries. Sci. Total Environ. 2019, 693, 133601:1–133601:12. [Google Scholar] [CrossRef]
- Schallenberg, M.; Larned, S.; Hayward, S.; Arbuckle, C. Contrasting Effects of Managed Opening Regimes on Water Quality in Two Intermittently Closed and Open Coastal Lakes. Estuar. Coast. Shelf Sci. 2010, 86, 587–597. [Google Scholar] [CrossRef]
- Hoeksema, S.; Chuwen, B.; Tweedly, J.; Potter, I.C. Factors Influencing Marked Variations in the Frequency and Timing of Bar Breaching and Salinity and Oxygen Regimes among Normally-Closed Estuaries. Estuar. Coast. Shelf Sci. 2018, 208, 205–218. [Google Scholar] [CrossRef]
- Suari, Y.; Amit, T.; Gilboa, M.; Sade, T.; Krom, M.; Gafny, S.; Topaz, T.; Yahel, G. Sandbar Breaches Control of the Biogeochemistry of a Micro-Estuary. Front. Mar. Sci. 2019, 6, 224. [Google Scholar] [CrossRef] [Green Version]
- Wooldridge, T.; Adams, J.B. The Development and Implementation of a Management Plan for the Seekoei Estuary: A Case Study Guided by Socio-Economic Issues. Afr. J. Aquat. Sci. 2020, 45, 83–93. [Google Scholar] [CrossRef]
- Stretch, D.; Zietsman, I. The Hydrodynamics of Mhlanga & Mdloti Estuaries: Flows, Residence Times, Water Levels and Mouth Dynamics; WRC K5/1247 Final Report; Water Research Commission: Pretoria, South Africa, 2004.
- Whitfield, A.K. A Quantitative Study of the Trophic Relationships within the Fish Community of the Mhlanga Estuary, South Africa. Estuar. Coast. Mar. Sci. 1980, 10, 417–435. [Google Scholar] [CrossRef]
- Holling, C. Adaptive Environmental Assessment and Management; John Wiley & Sons: Chichester, UK, 1978. [Google Scholar]
- Cilliers, G.; Adams, J.B. Development and Implementation of a Monitoring Programme for South African Estuaries. Water 2016, 42, 279–290. [Google Scholar] [CrossRef] [Green Version]
- Tagliapietra, D.; Povilanskas, R.; Razinkovas-Baziukas, A.; Taminskas, J. Emerald Growth: A New Framework Concept for Managing Ecological Quality and Ecosystem Services of Transitional Waters. Water 2020, 12, 894. [Google Scholar] [CrossRef] [Green Version]
- Taljaard, S.; Van Niekerk, L.; Huizinga, P.; Joubert, W. Resource Monitoring Procedures for Estuaries for Application in the Ecological Reserve Determination and Implementation Process; Report No. 1308/1/03; Water Research Commission: Pretoria, South Africa, 2003.
Figure 1.
Longitudinal representation of a temporarily closed estuary showing the main opening and closing forces that influence mouth condition.
Figure 1.
Longitudinal representation of a temporarily closed estuary showing the main opening and closing forces that influence mouth condition.

Figure 2.
The method used to determine EFlows for estuaries (modified from [32] (Figure 2 Reprinted from Science of the Total Environment, 656, An environmental flow determination method for integrating multiple-scale ecohydrological and complex ecosystem processes in estuaries, 482–494, 2018, with permission from Elsevier)).

Figure 3.
The South African coastline indicating estuaries mentioned in the text.

Figure 4.
Characteristics of the predominantly open Mngazana Estuary compared to the temporarily closed Mngazi Estuary.
Figure 4.
Characteristics of the predominantly open Mngazana Estuary compared to the temporarily closed Mngazi Estuary.

Figure 5.
The Uilkraals Estuary open in 2006 (left) and closed in 2019 (right).

Figure 6.
Longitudinal view of a temporarily closed estuary showing the influence of freshwater inflow on the accumulation of sediment and organic matter during closed, artificially breached, and flood-scoured phases.
Figure 6.
Longitudinal view of a temporarily closed estuary showing the influence of freshwater inflow on the accumulation of sediment and organic matter during closed, artificially breached, and flood-scoured phases.

Figure 7.
Relative water level (m) (blue line) and freshwater inflow (m3 s−1) (red line) measured at the Onrus Estuary in 2012 (a) and 2013 (b).
Figure 7.
Relative water level (m) (blue line) and freshwater inflow (m3 s−1) (red line) measured at the Onrus Estuary in 2012 (a) and 2013 (b).

Figure 8.
Longitudinal view of a temporarily closed estuary, illustrating how open mouth conditions ensure tidal flushing and good water quality.
Figure 8.
Longitudinal view of a temporarily closed estuary, illustrating how open mouth conditions ensure tidal flushing and good water quality.

Figure 9.
Longitudinal view of a temporarily closed estuary showing the influence of artificial breaching on sediment scouring and flushing.
Figure 9.
Longitudinal view of a temporarily closed estuary showing the influence of artificial breaching on sediment scouring and flushing.

Figure 10.
Graphics comparing (a) natural and elevated baseflows, highlighting their effect on estuary mouth condition, and (b) flow patterns from natural flow regimes and those of regulated dam releases.
Figure 10.
Graphics comparing (a) natural and elevated baseflows, highlighting their effect on estuary mouth condition, and (b) flow patterns from natural flow regimes and those of regulated dam releases.

Figure 11.
Graphic illustration of the long-term data for water levels (yellow line), fish abundance (blue bars), and mouth state used to identify trends and patterns on which high-confidence EFlow assessments were based (modified from [55]).
Figure 11.
Graphic illustration of the long-term data for water levels (yellow line), fish abundance (blue bars), and mouth state used to identify trends and patterns on which high-confidence EFlow assessments were based (modified from [55]).

Figure 12.
(a) The Strategic Adaptive Management cycle for the implementation of EFlows and compliance monitoring, and (b) Sectors involved in a catchment-to-coast integrated management approach.
Figure 12.
(a) The Strategic Adaptive Management cycle for the implementation of EFlows and compliance monitoring, and (b) Sectors involved in a catchment-to-coast integrated management approach.


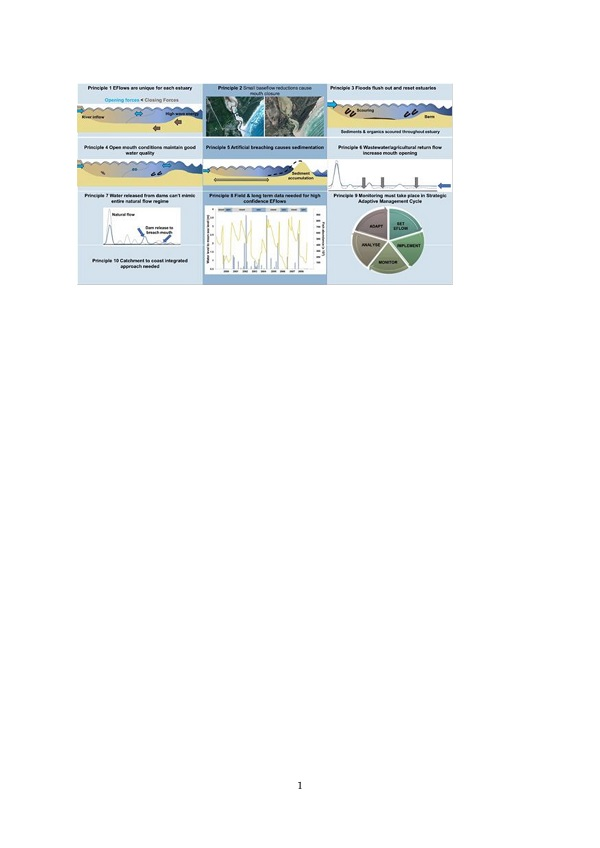
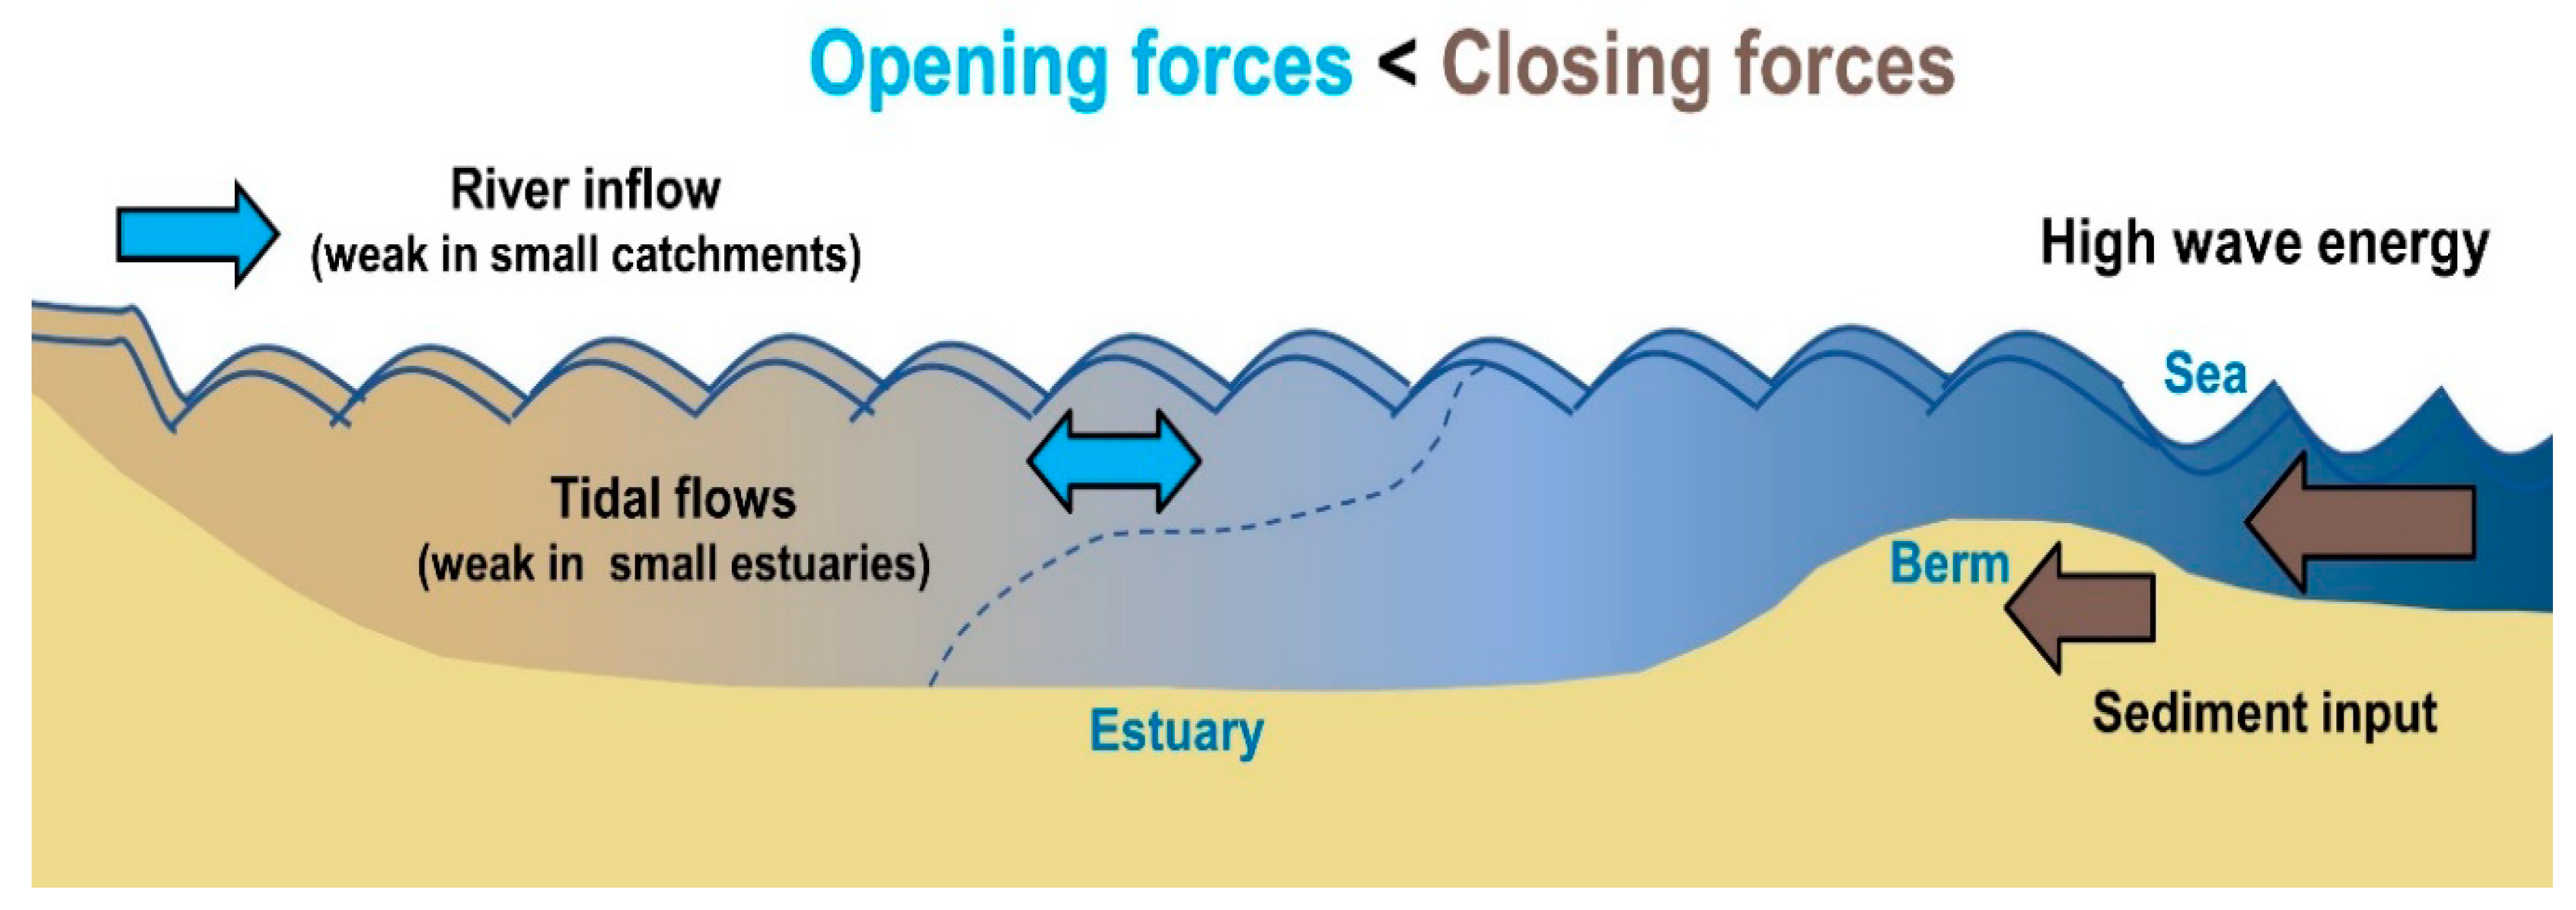
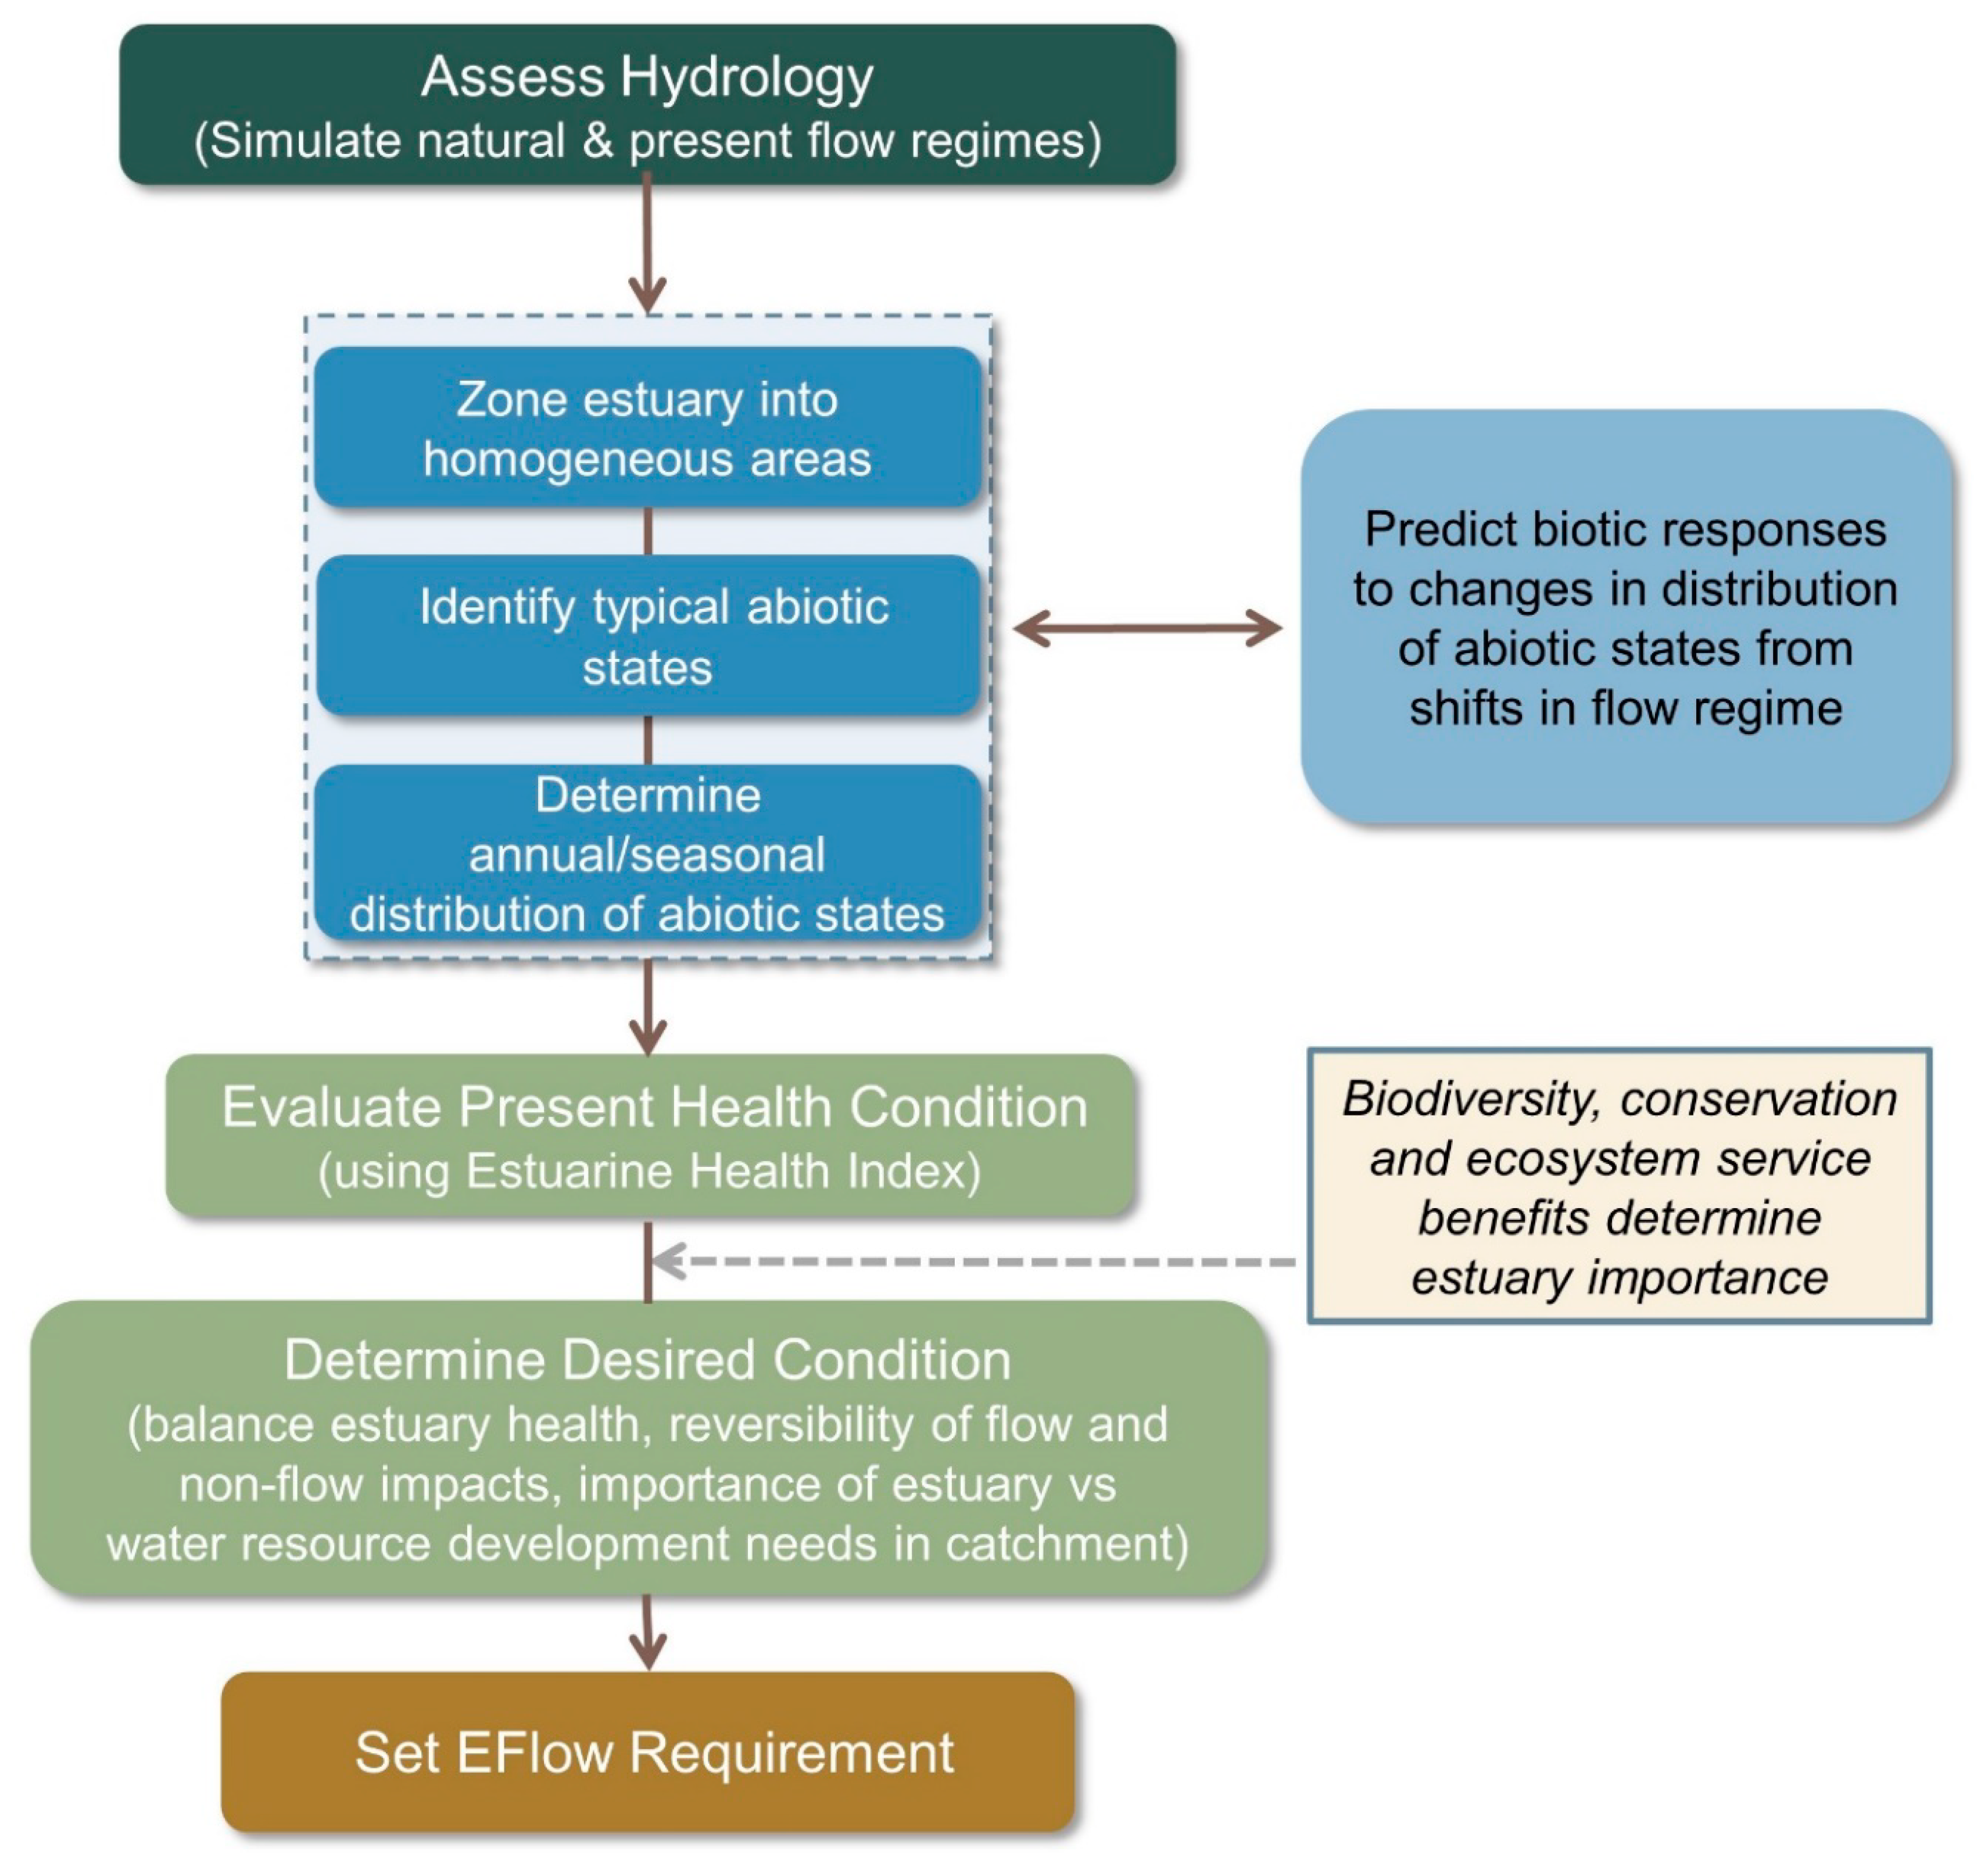
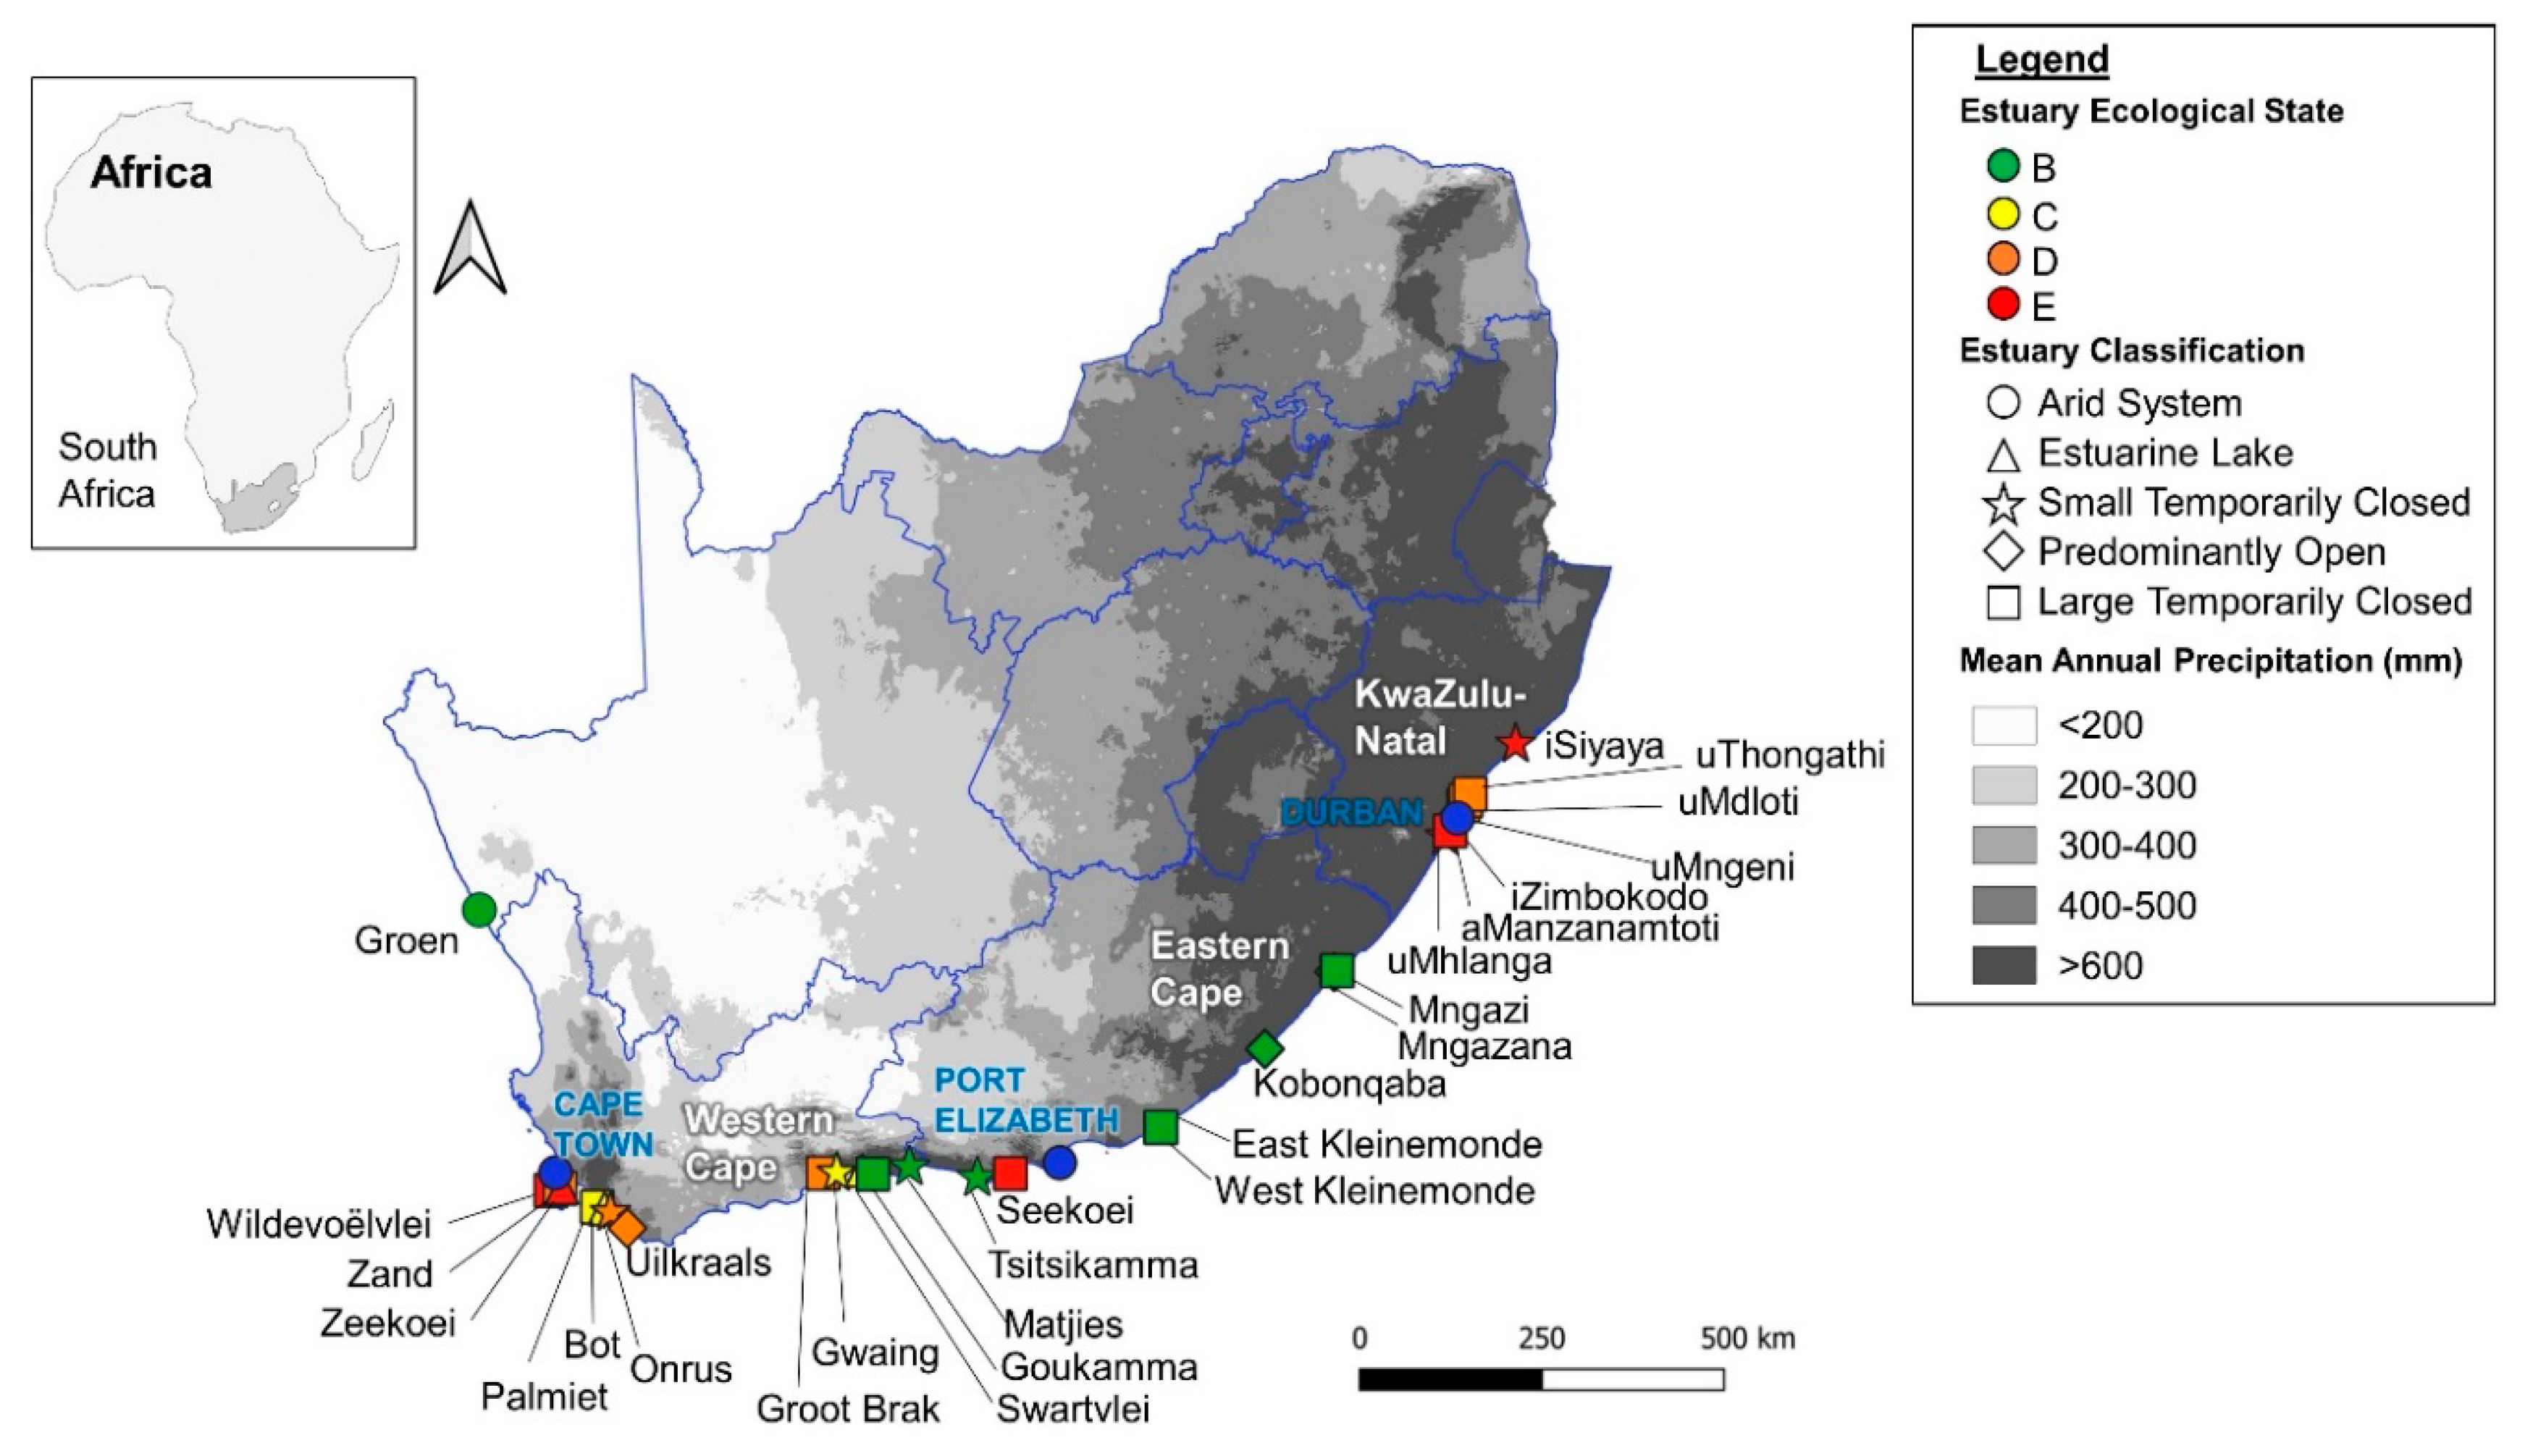
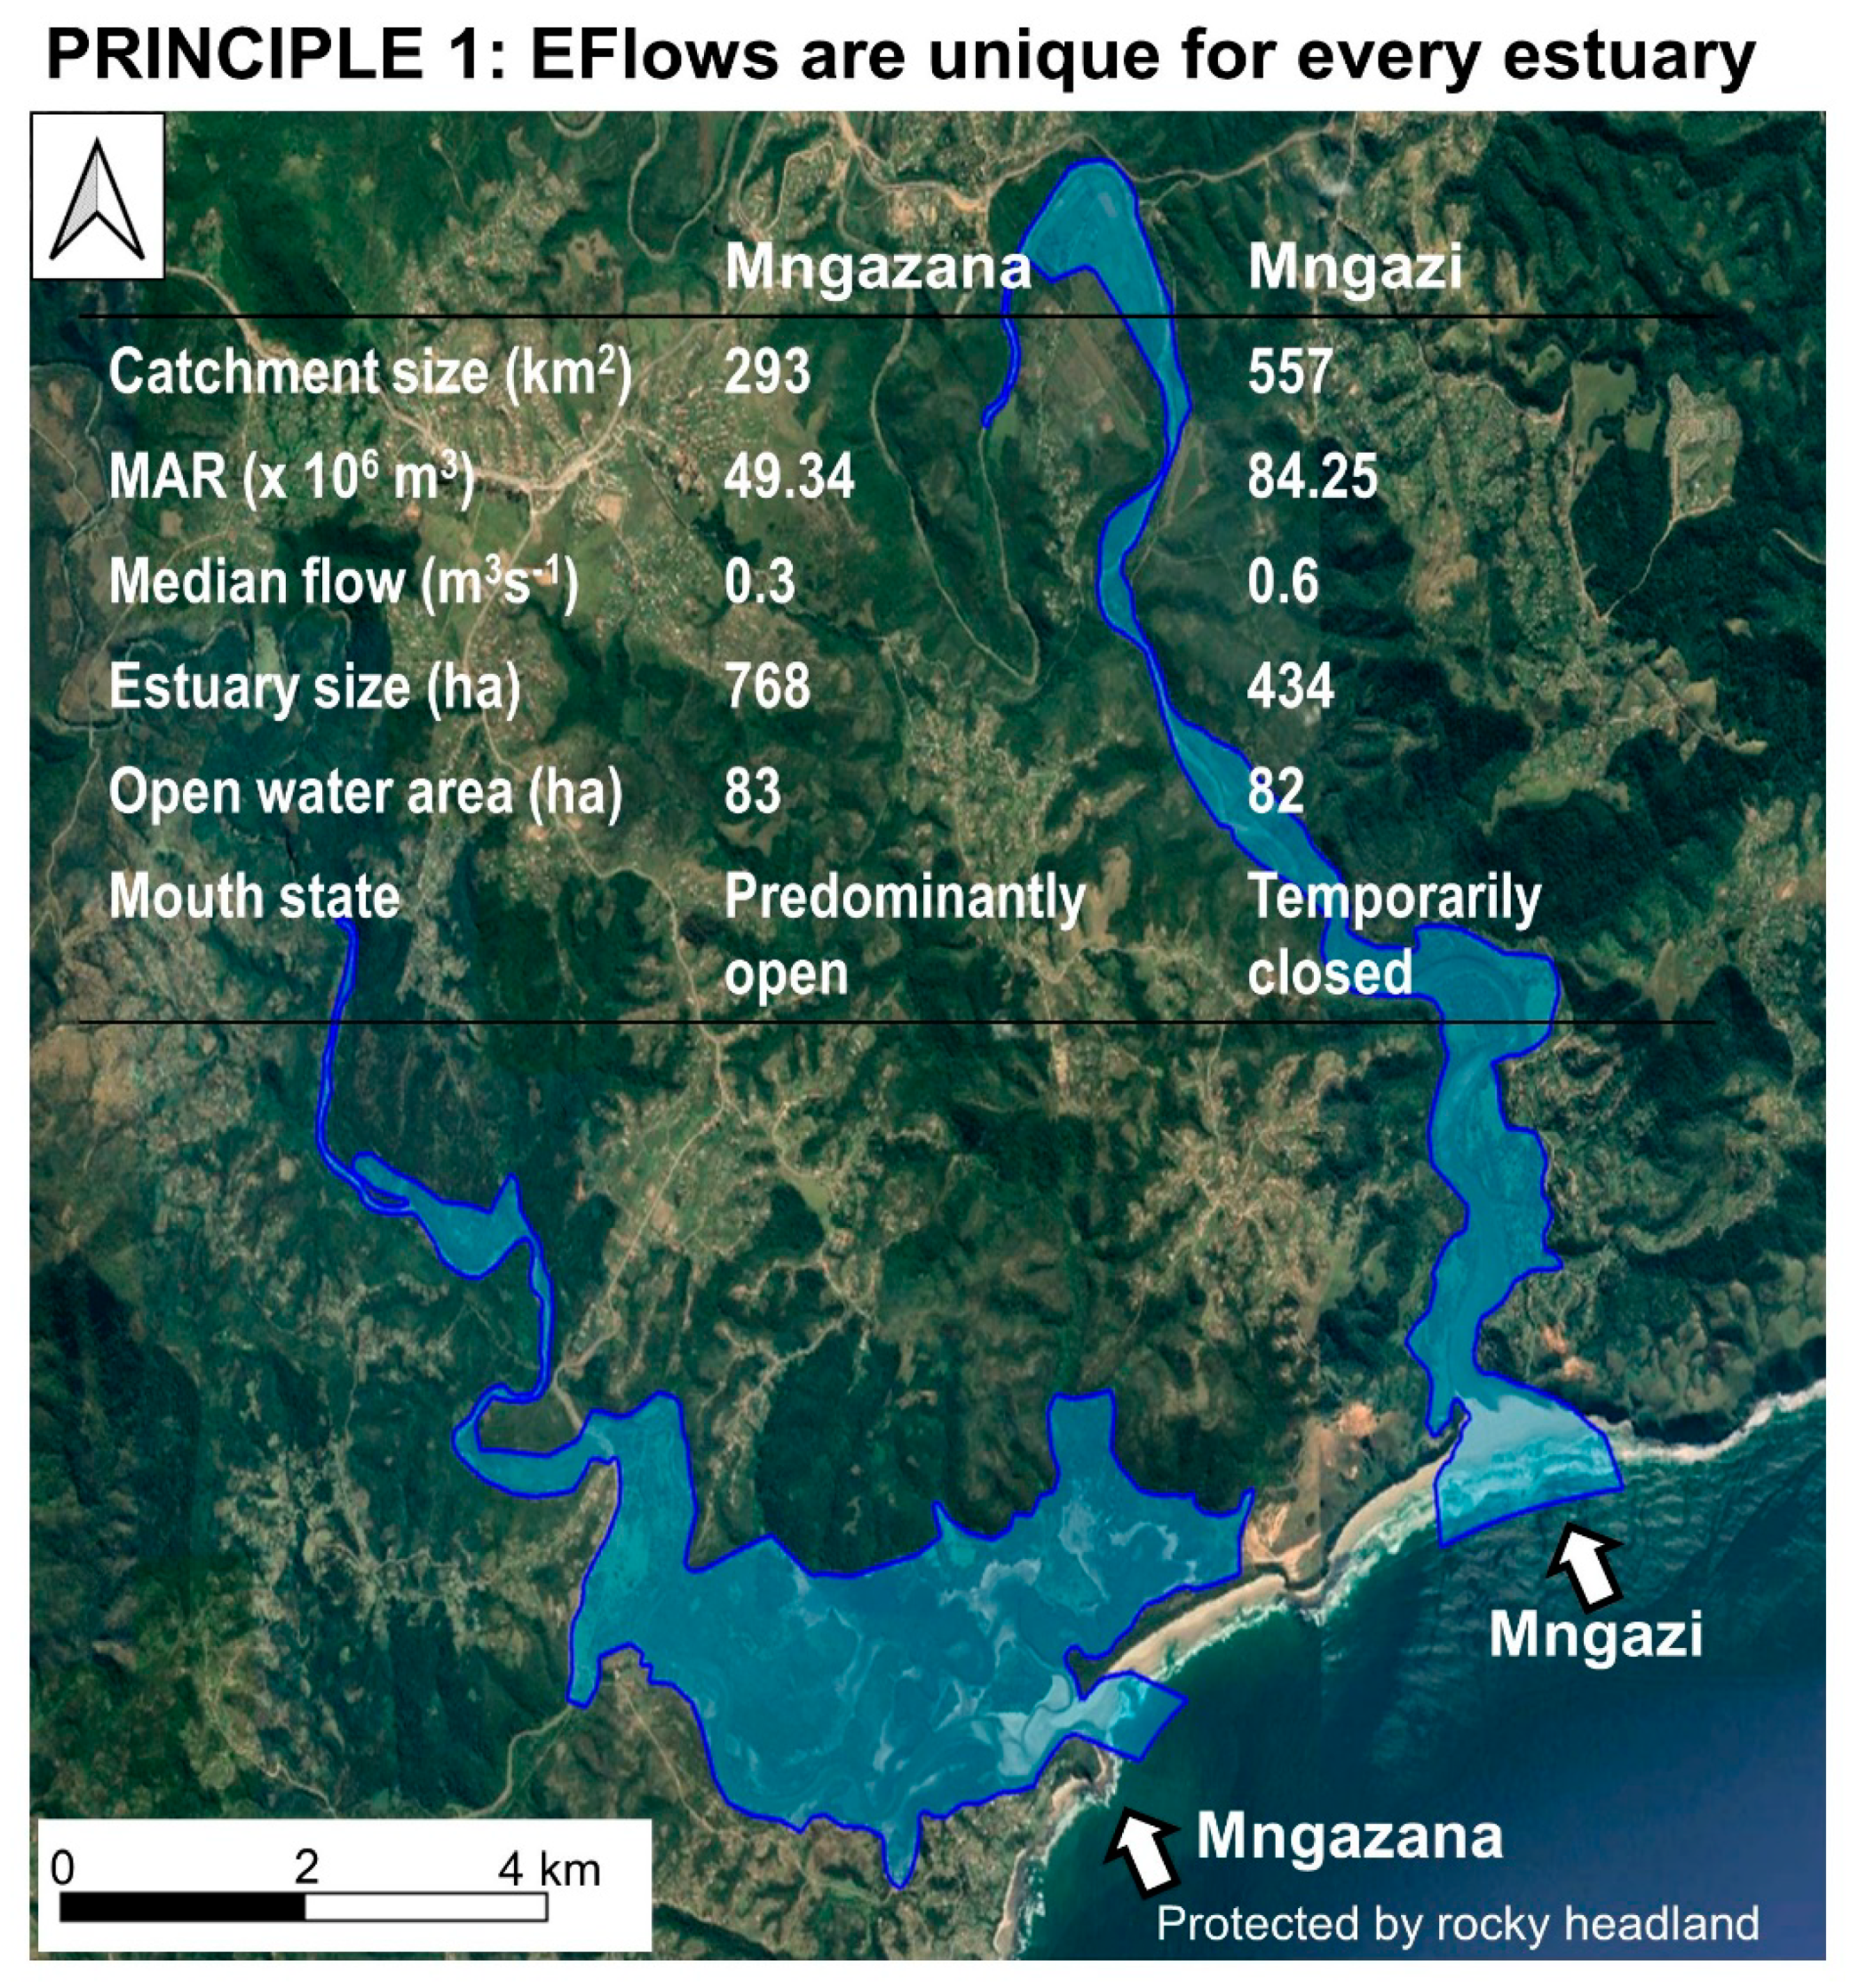
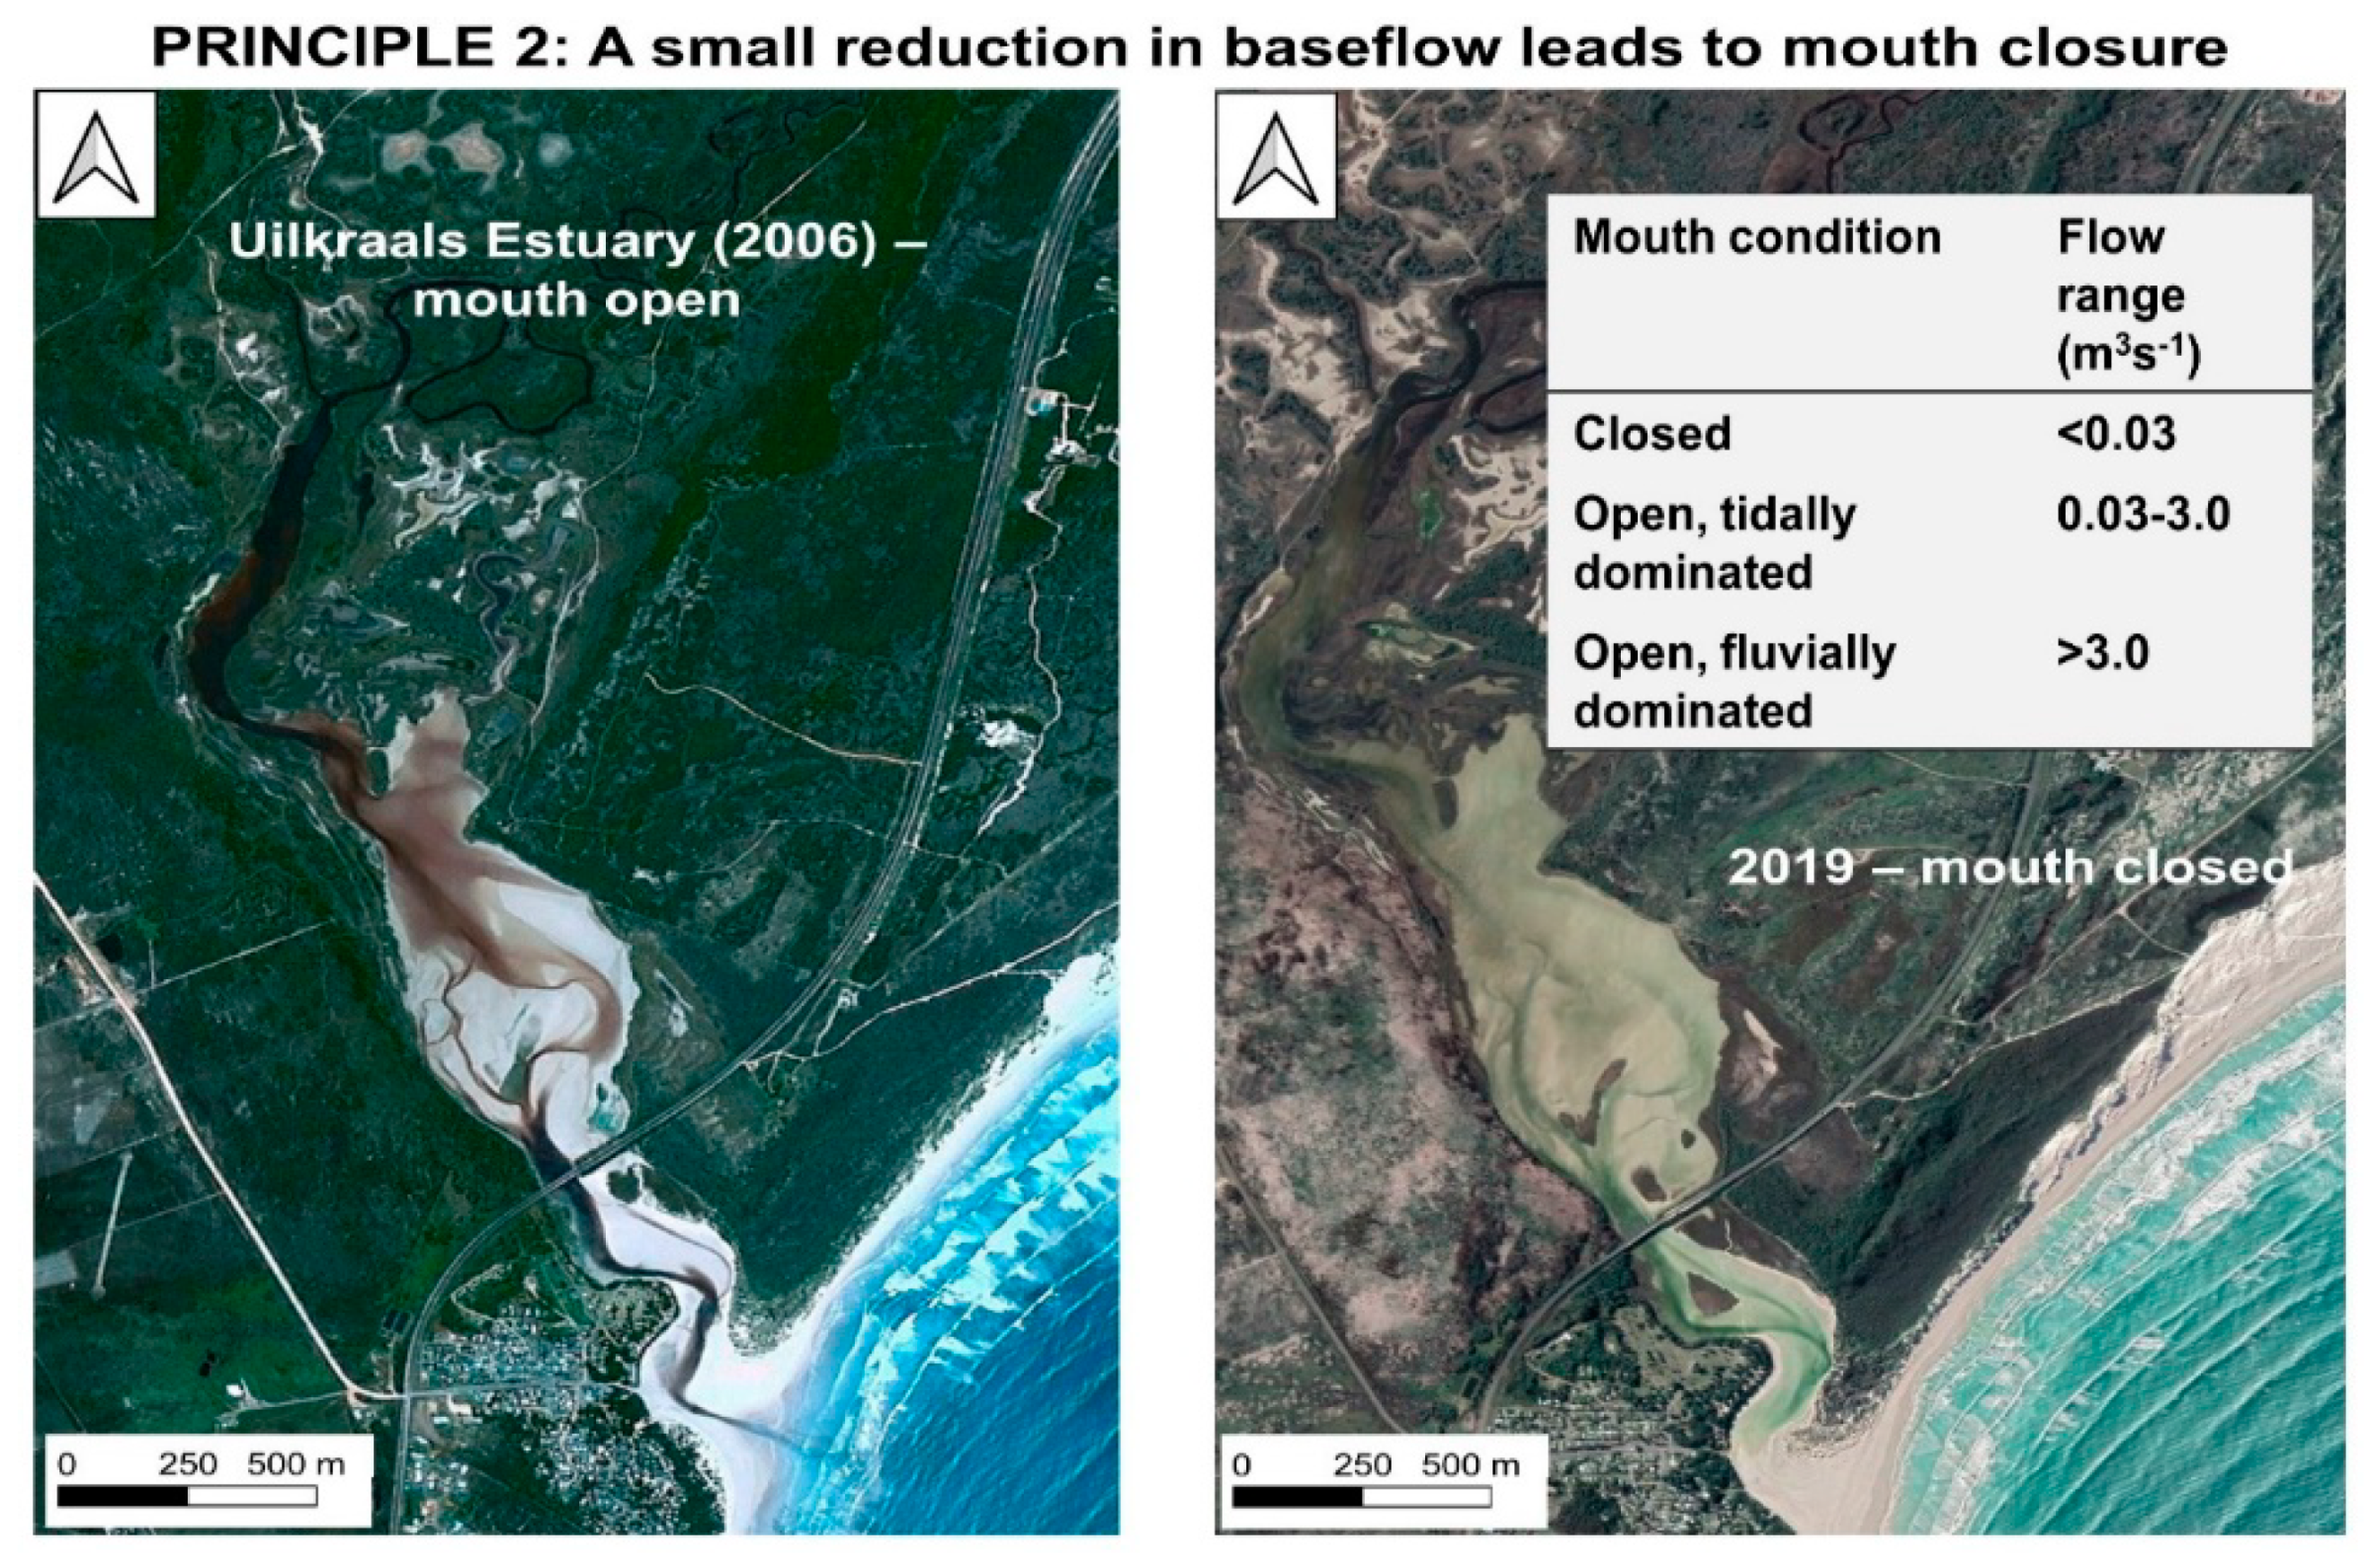
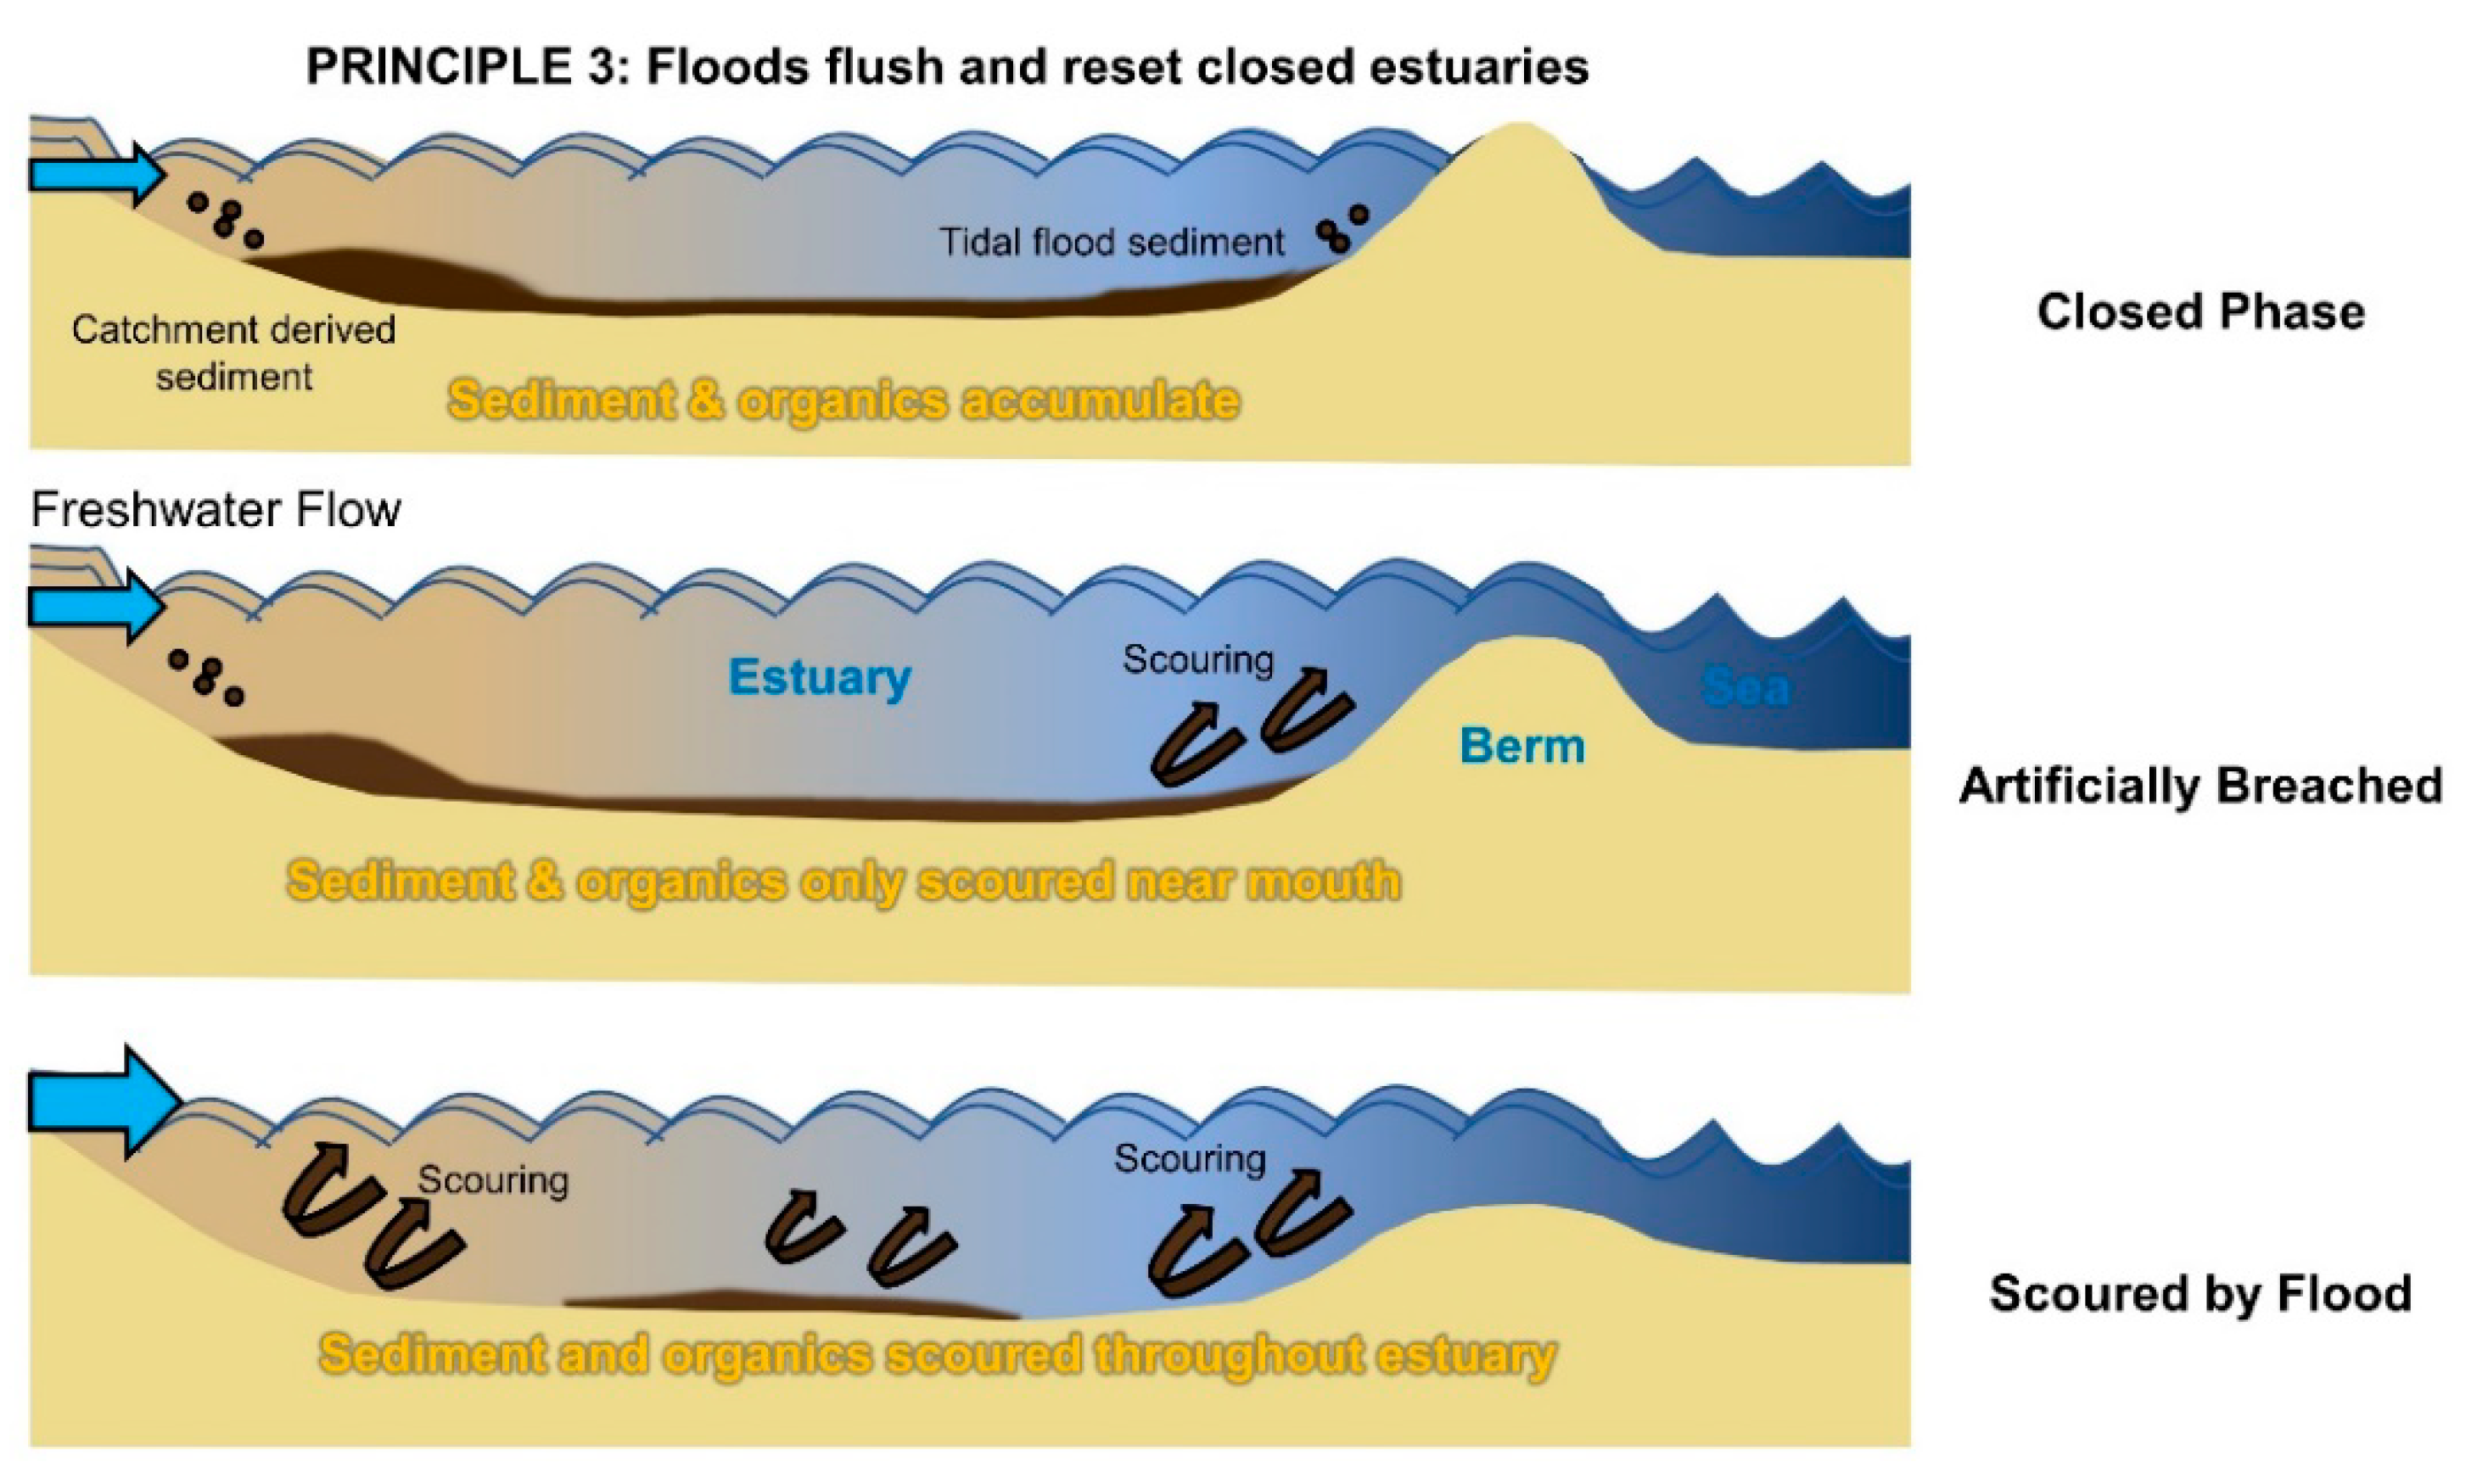
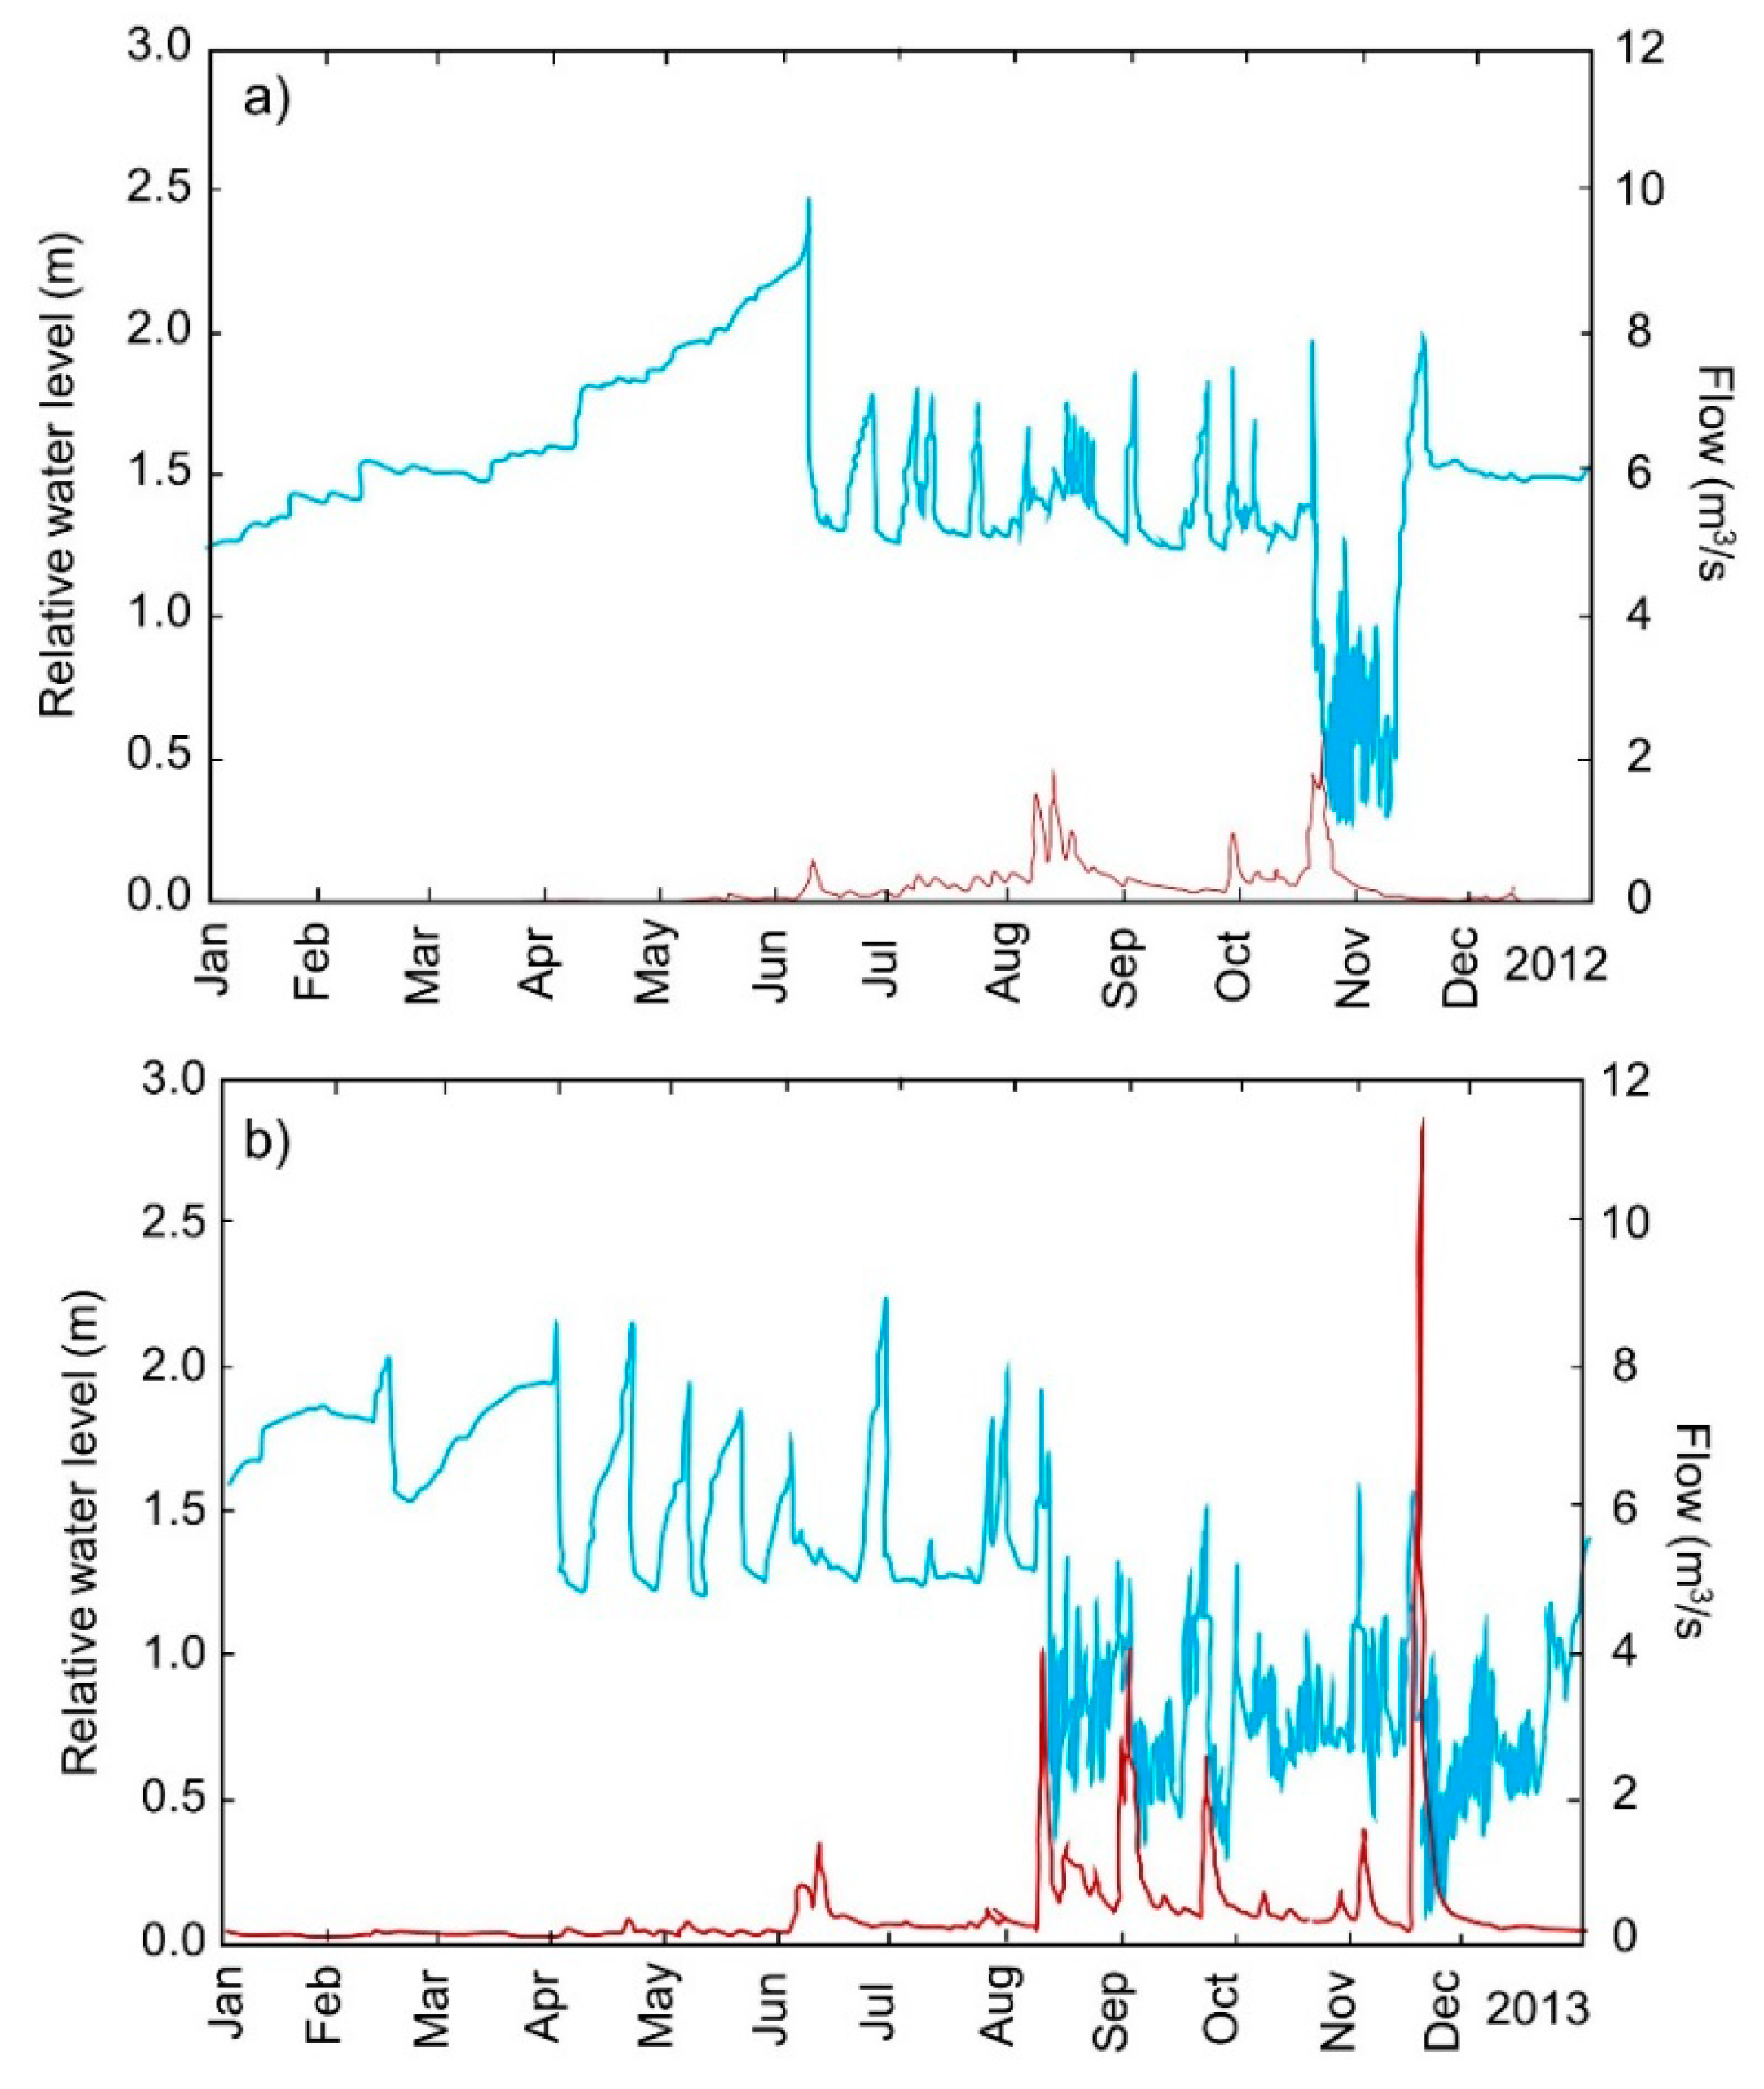
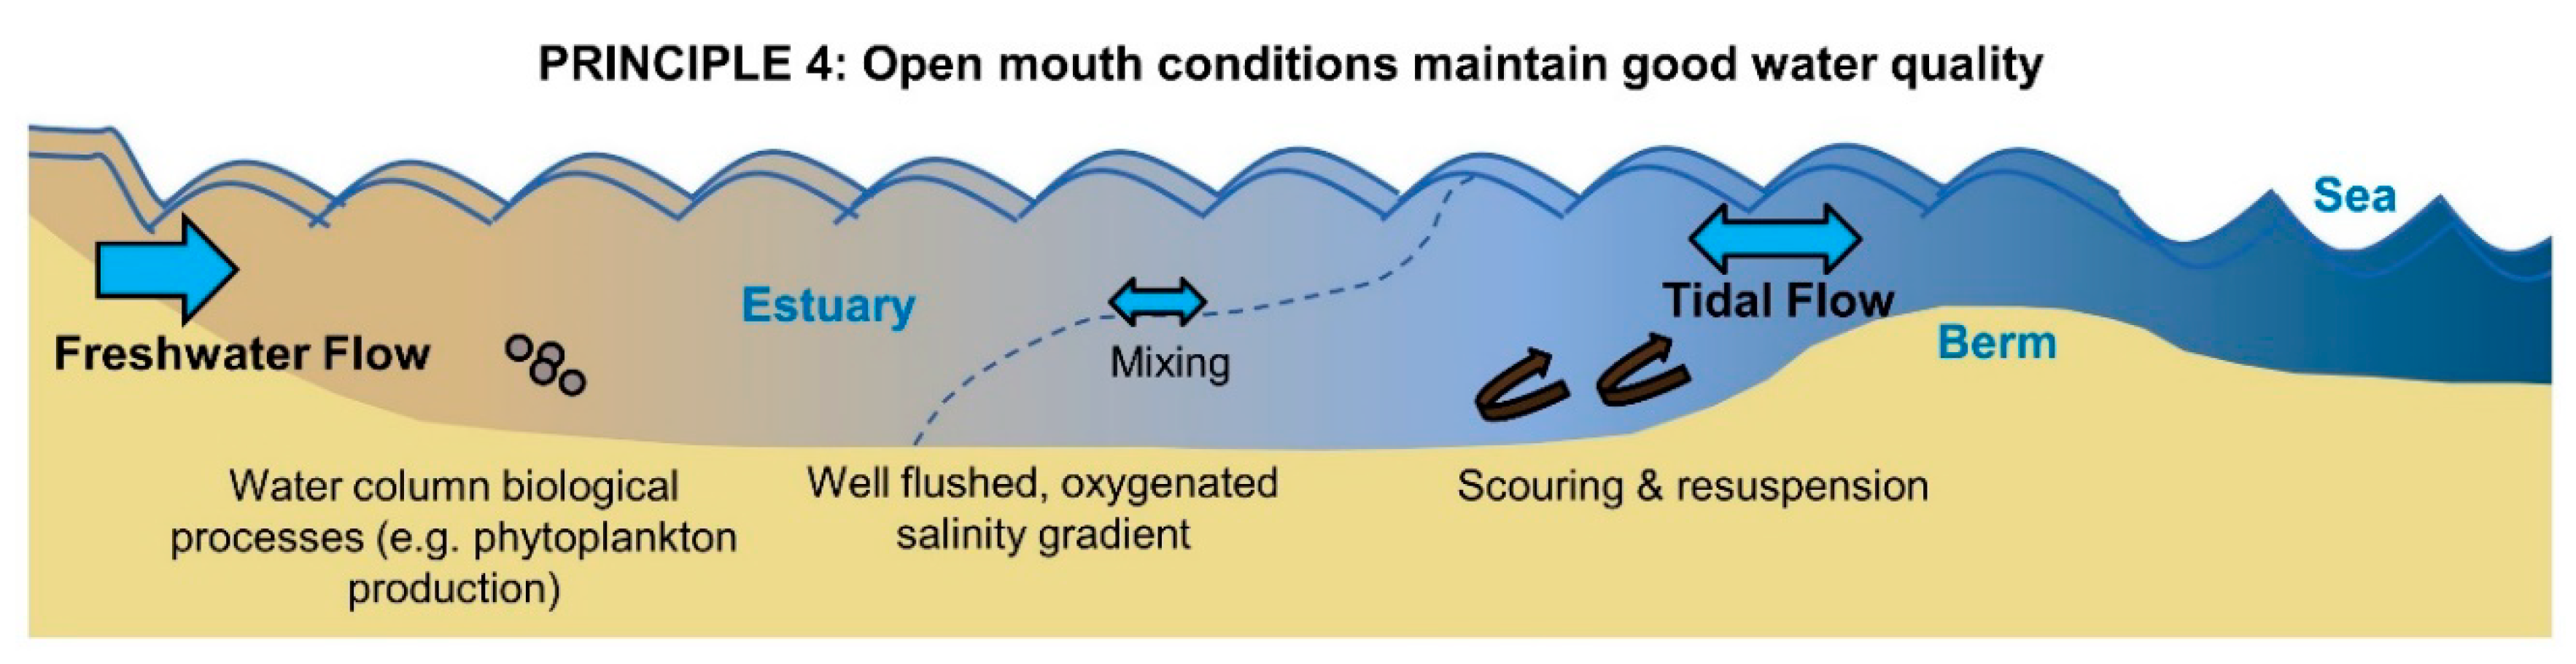
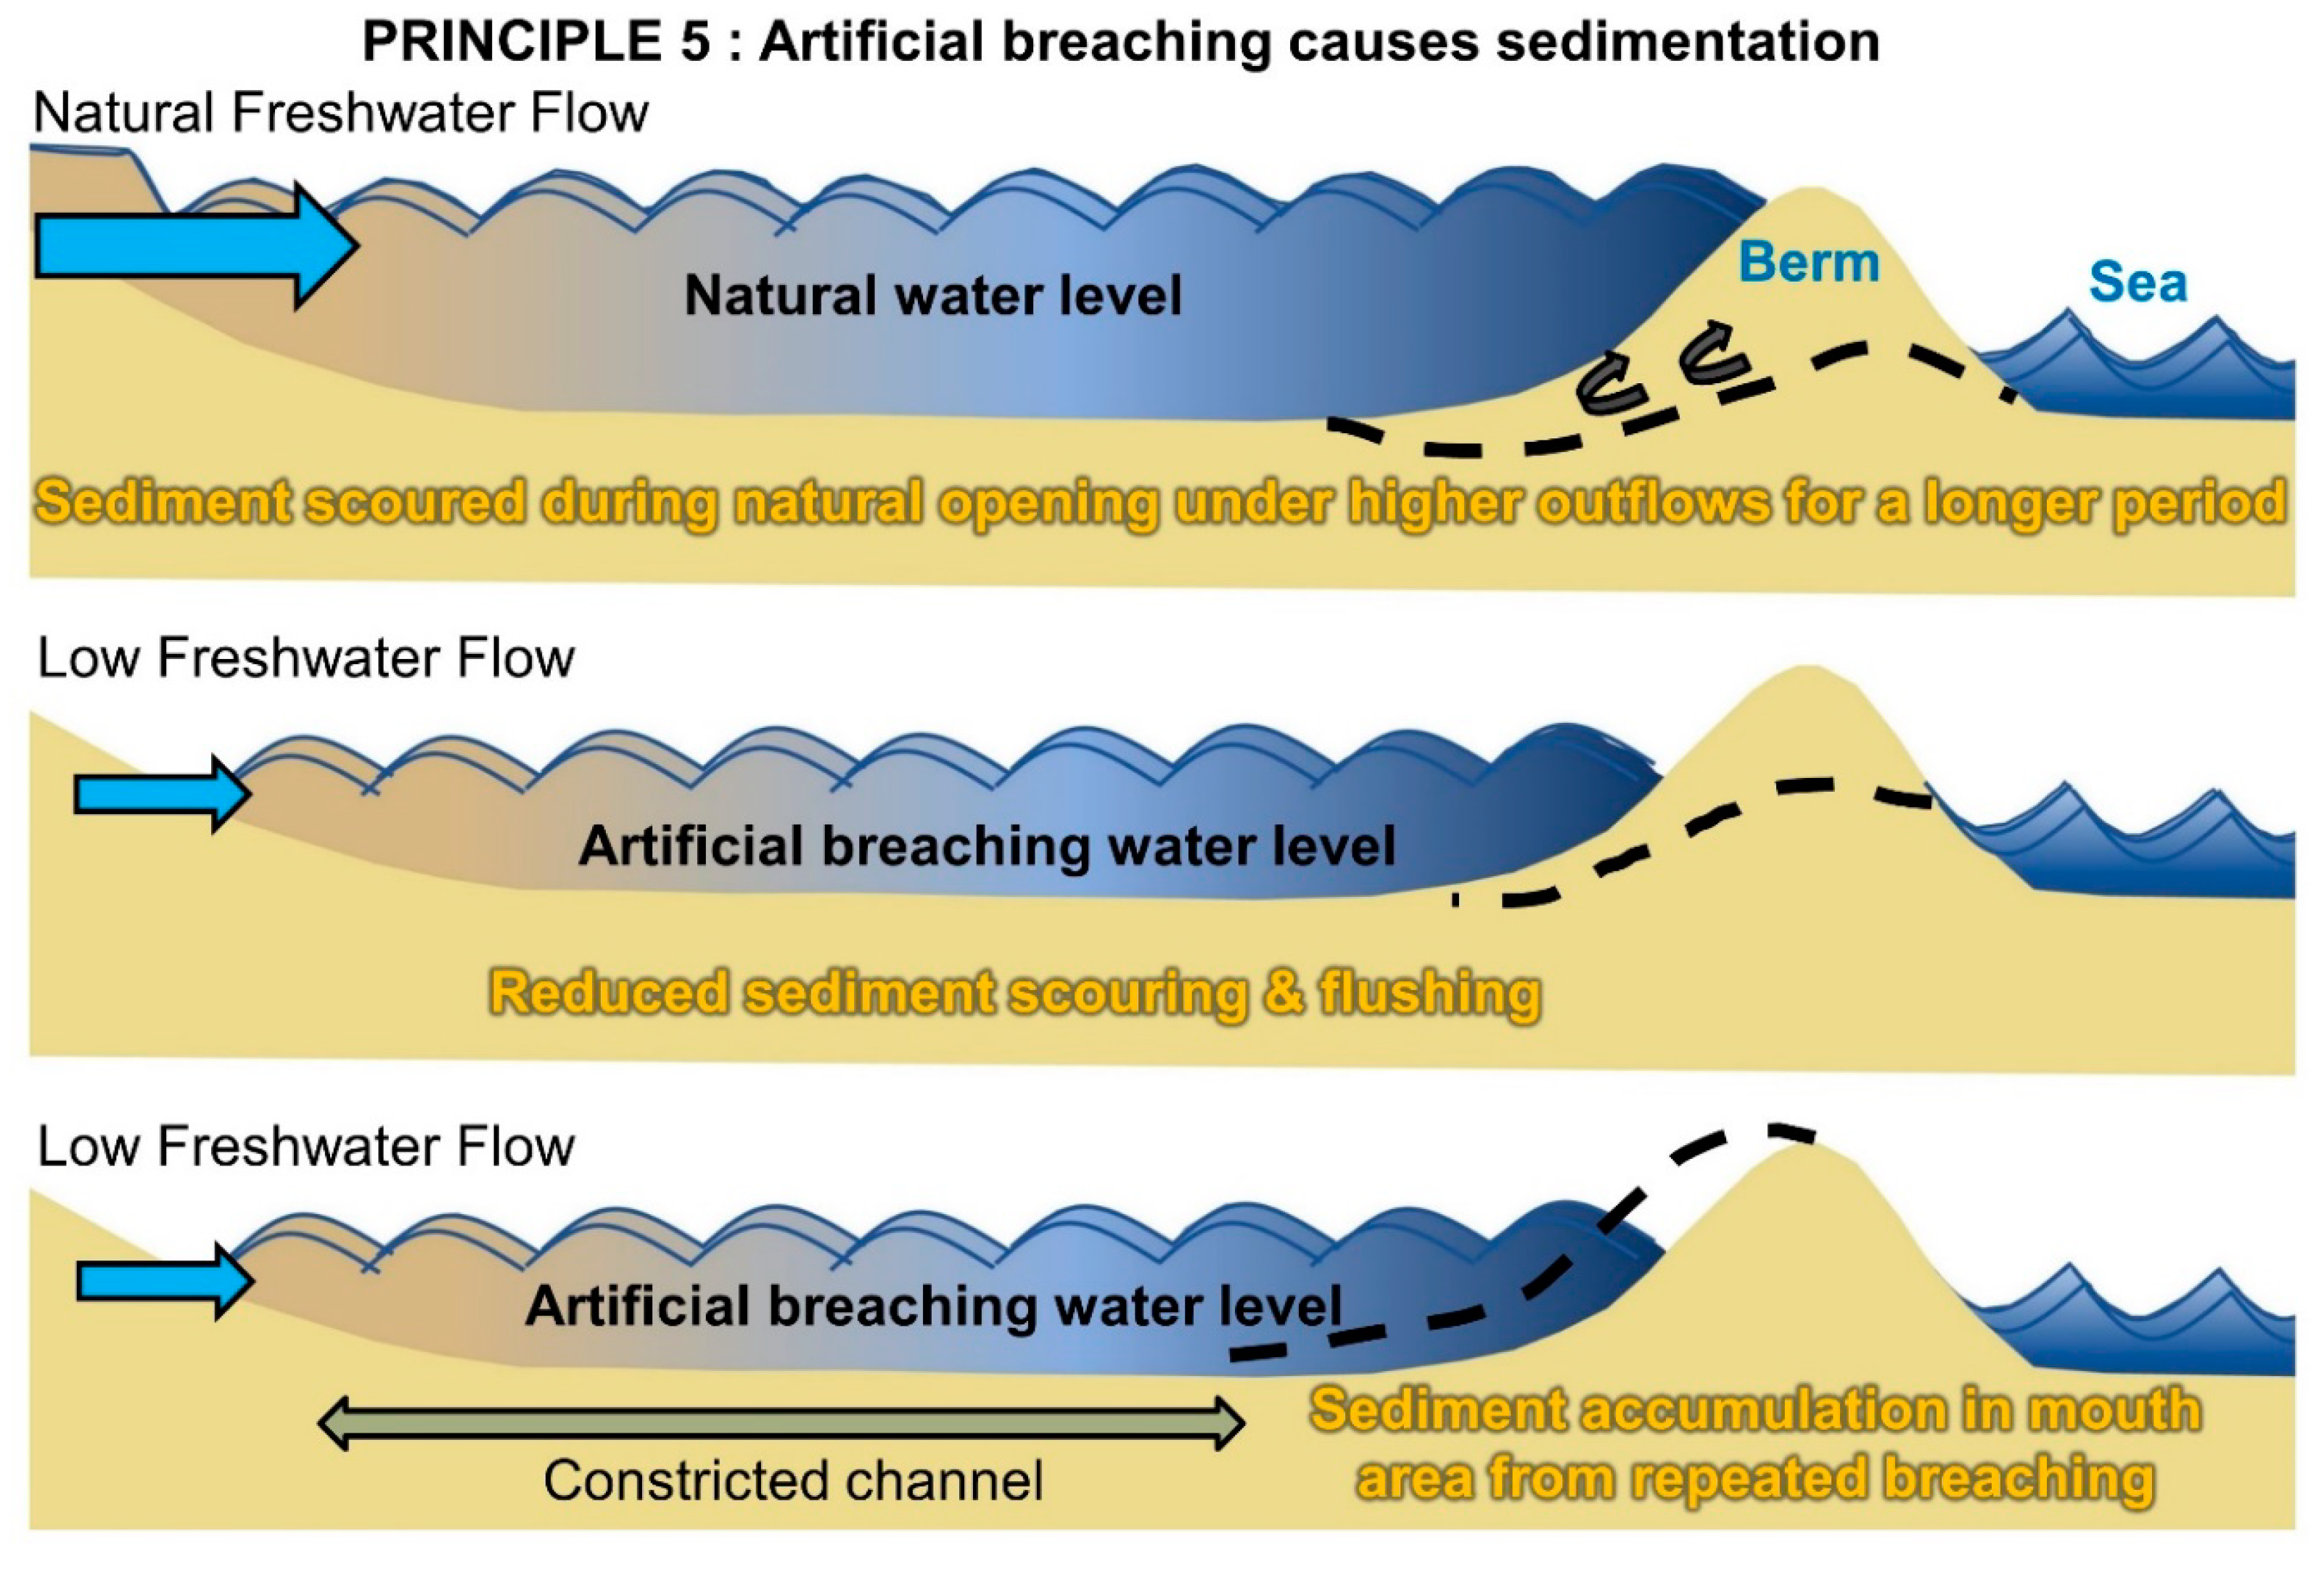
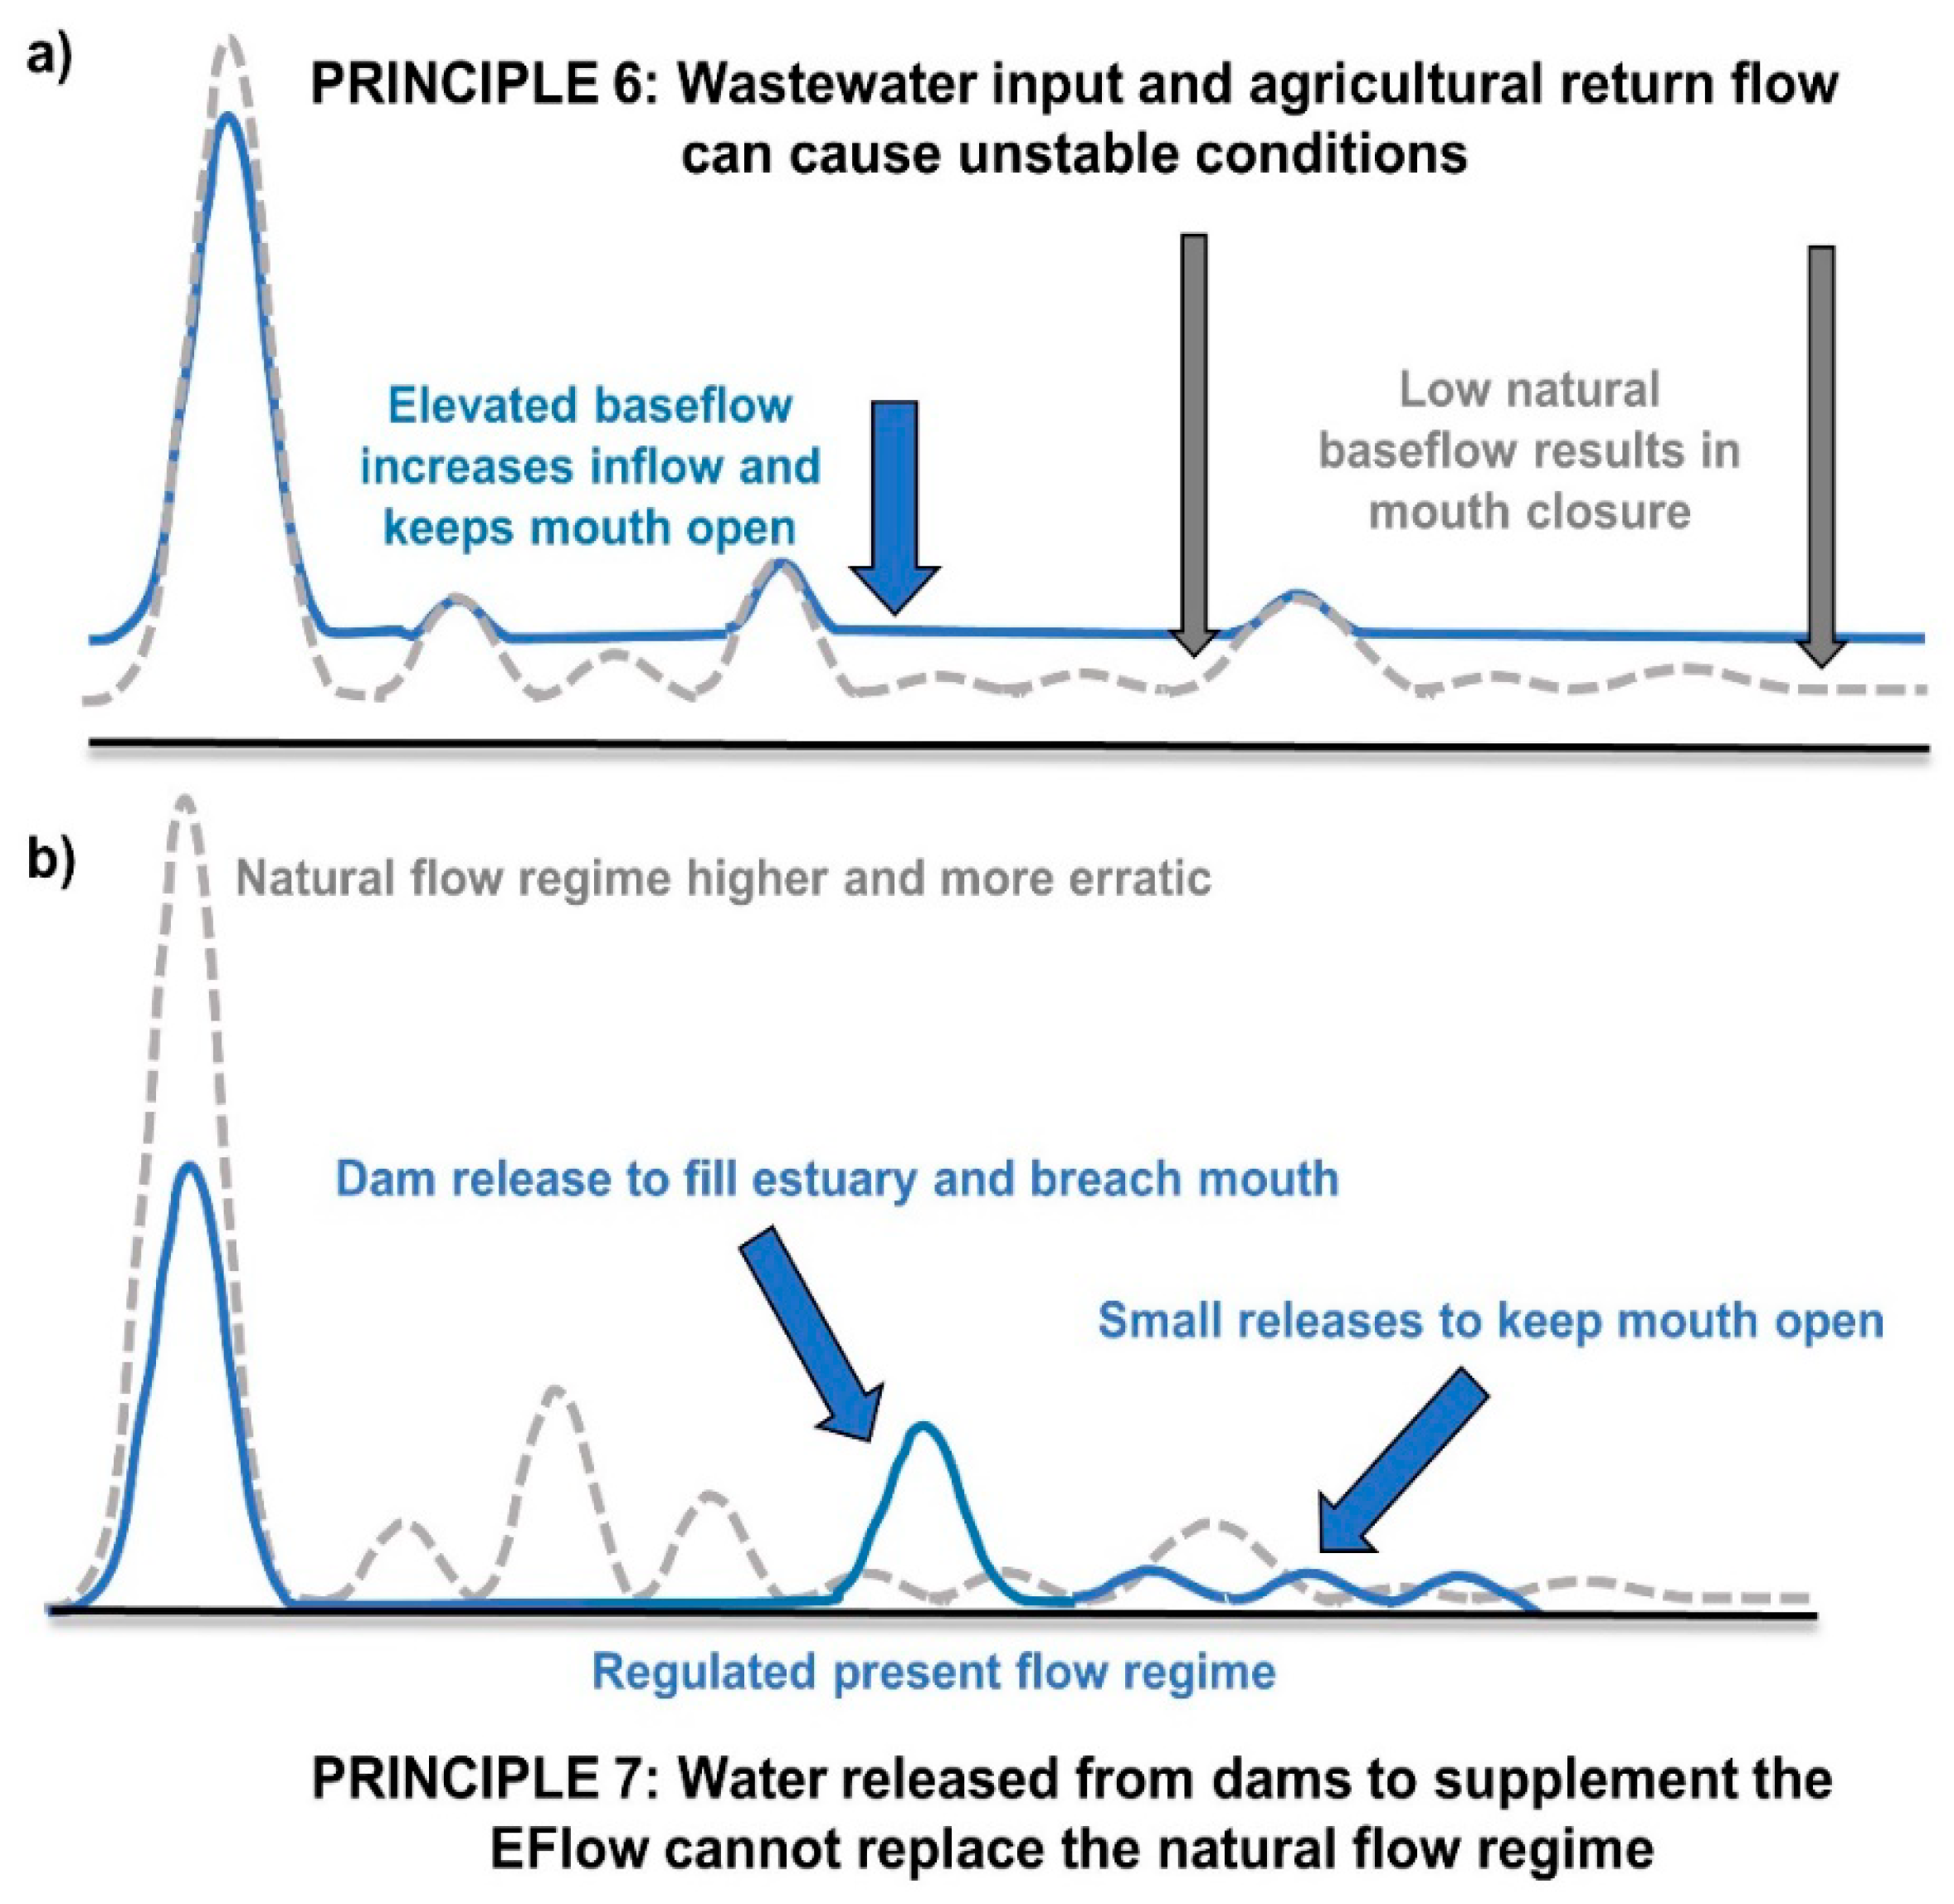
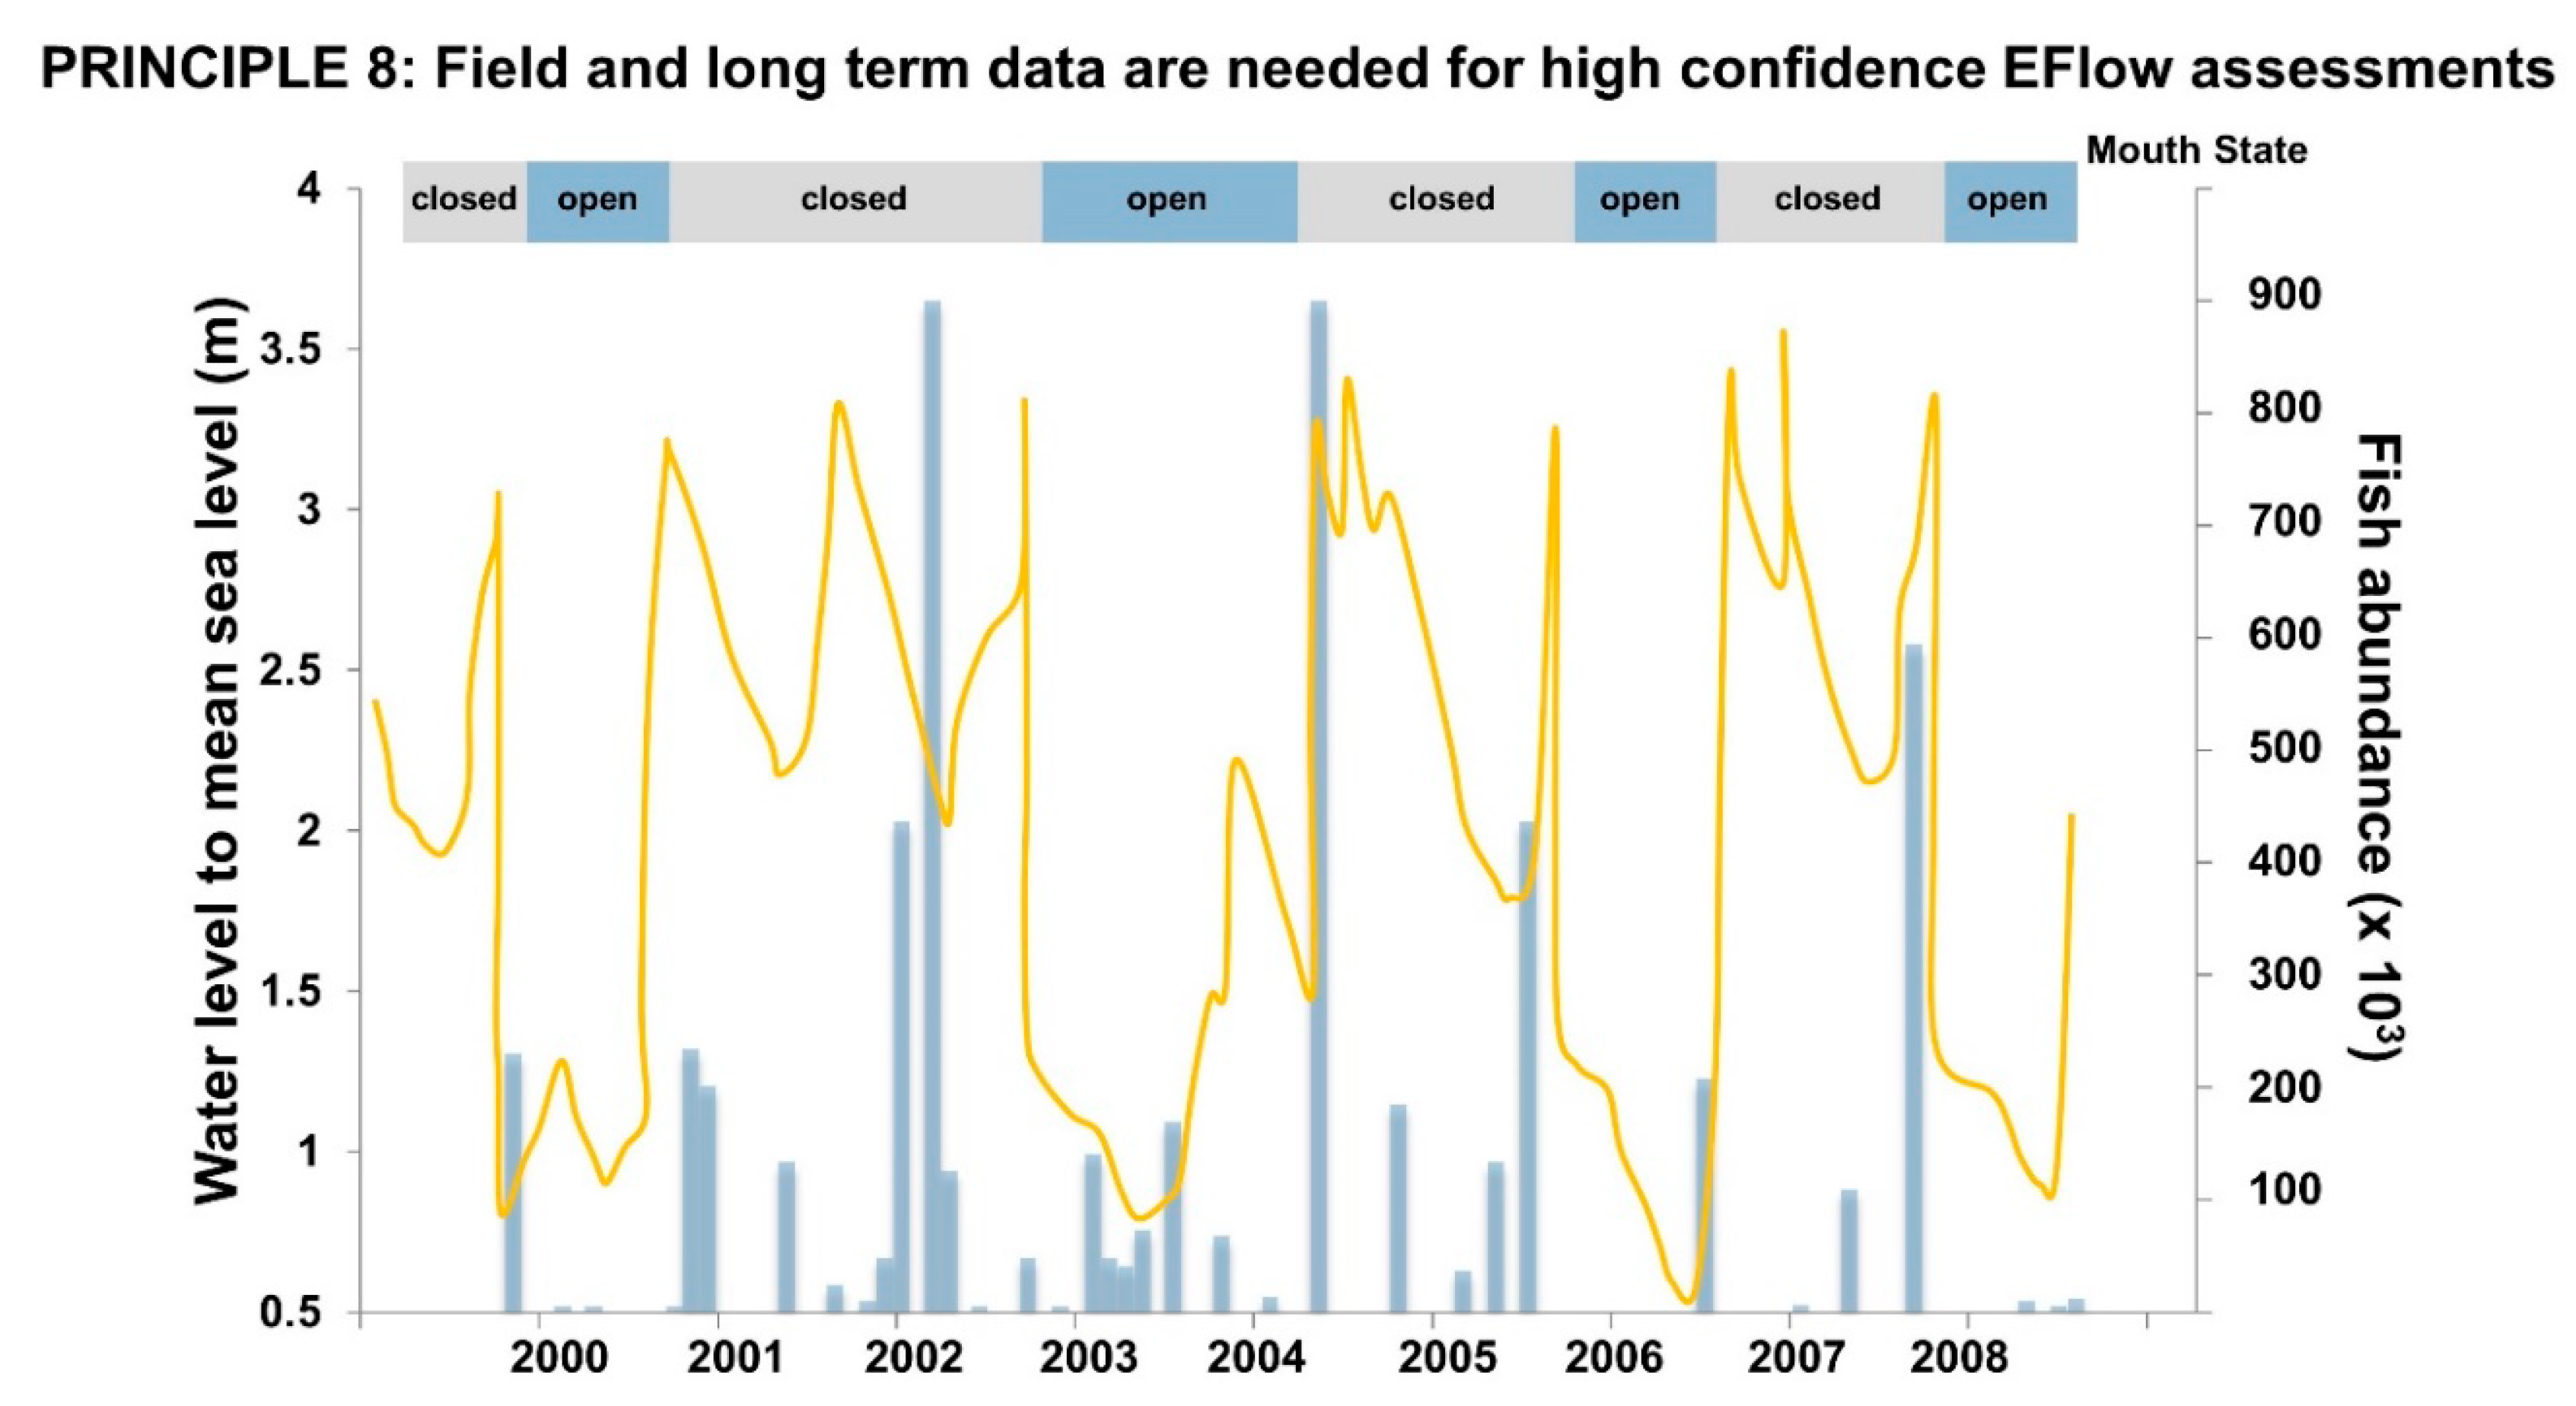
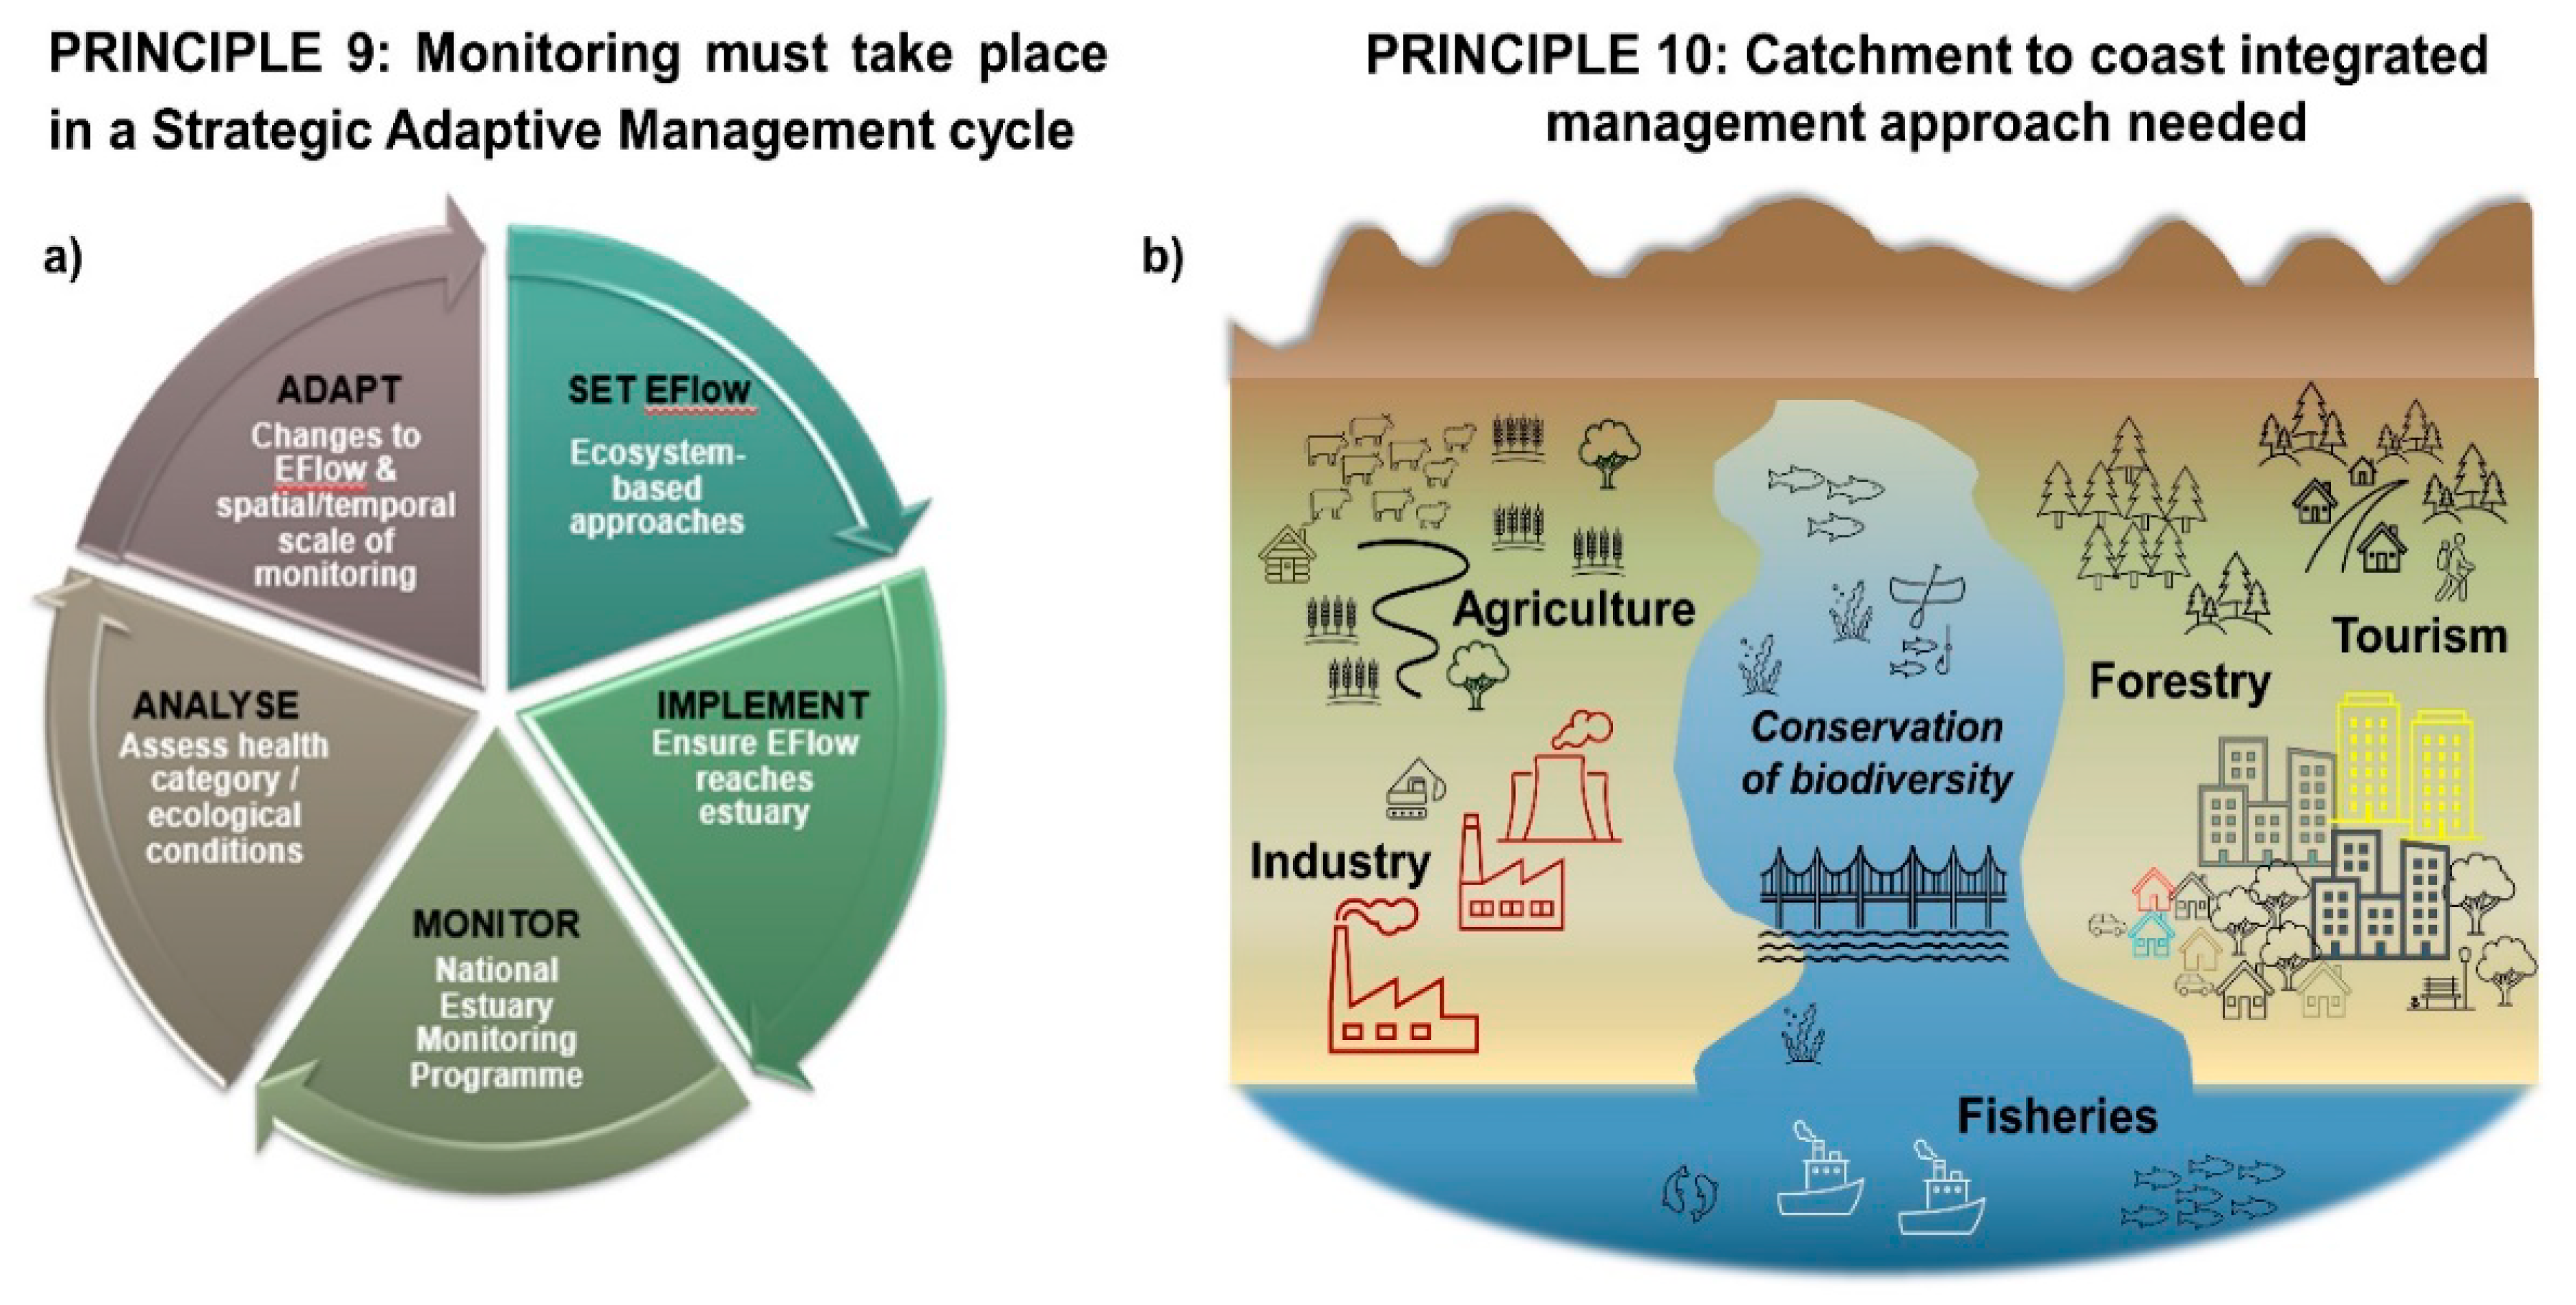
Table 1.
Response of temporarily closed estuaries (TCEs) to reduced freshwater inflow and increased duration and frequency of closed-mouth conditions in terms of resultant abiotic drivers, the main flow component driving the process, biotic responses, and impacts on ecosystem services.
Table 1.
Response of temporarily closed estuaries (TCEs) to reduced freshwater inflow and increased duration and frequency of closed-mouth conditions in terms of resultant abiotic drivers, the main flow component driving the process, biotic responses, and impacts on ecosystem services.
| Closed-Mouth Conditions and Abiotic Driver | Flow Component * | Biotic Response | Impact on Ecosystem Services |
|---|---|---|---|
| No tidal exchange | Reduced dry-season base flows and/or drought flows | Loss of intertidal habitat, salt marsh and nursery habitat. Reduced biological diversity (birds, macrofauna, macrophytes). | Loss of wetland purification capacity, erosion control, bank protection, and flood mitigation. |
| Loss of connectivity with sea | Reduced dry-season base flows and/or drought flows | Loss of invertebrate and fish recruitment. Interruption to faunal life cycles. Decline in salt tolerant biota. | Loss of nursery habitat and biodiversity. Reduced fisheries. |
| Loss of connectivity with the catchment | No dry-season base flows or drought flows, reduction in flood occurrence and magnitude | No recruitment of catadromous fauna (eels and freshwater mullet) that live in freshwater and breed in the sea. | Reduced food security and loss of cultural elements. |
| Increased water level (wet conditions) | Reduced dry-season base flows | Loss of intertidal habitat (intertidal salt marsh) and wading birds due to flooding. | Reduced tourism appeal. Less recreational bird watching opportunities. Flooding of adjacent properties leading to artificial breaching. |
| Decreased water level (dry conditions) | Reduced/no drought flows | Die-back of submerged plants. Loss of nursery habitat. Reduced foraging and nesting habitat for water birds. | Reduced bait and fisheries resources. Reduced ecotourism. |
| Eutrophication and low water transparency | Increase or decrease dry-season base flows, coupled with nutrient enrichment | Loss of submerged aquatic vegetation (seagrass). Occurrence of harmful algal blooms and invasive aquatic macrophytes. Fish kills. | Loss of waste assimilative capacity. Reduced nutrient cycling. Loss of fisheries. Reduced revenues from recreation and tourism. Decline in real estate values. |
| Increased retention of pollutants and human pathogens | Reduced dry-season base flows and/or reduction in flood occurrence and magnitude | Accumulation of pollutants in fish and shellfish. | Biota unsuitable for human consumption. Reduced food supply Loss of recreational facility (no swimming or boating). Negative impact on human health and wellbeing. |
| Salinity extremes (hypersaline/hyposaline) | Reduced or no dry-season base flows or drought flows | Die-back of sensitive biota. Changes in species and community composition. Reduced biomass. | Reduced biodiversity. Erosion and destabilization of vegetated banks. Loss in bank buffering capacity and flood control. Flooding of adjacent properties. Reduced aesthetic appeal and real estate value. |
* Drought flows are generally assumed at 90% exceedance of mean monthly flows over a 60 to 80 year simulation period, seasonal low flows at 80–50% exceedance during the dry season, and floods greater than 95% exceedance. However, estuary sensitivity to flow can vary outside these ranges depending on estuary size, wave exposure, and catchment runoff.
Table 2.
Response of macrophytes in TCEs to changes in environmental conditions.
| Condition | Macrophyte Response |
|---|---|
| Increase in freshwater inflow | |
| ↑ mouth breaching perched estuaries drain ↓ water level | Submerged macrophytes die back, epiphytes on reeds and sedges become lost. |
| ↓ salinity | Salt marsh, salt pans and mangroves decline. |
| Decrease in freshwater inflow | |
| ↑ duration mouth closure ↑ water level | Loss of intertidal salt marsh, reeds, sedges, and mangroves, submerged macrophytes increase. |
| ↑ salinity | Submerged macrophyte species composition changes rapidly in response to altered salinity. |
| ↑ sedimentation | Reed growth increases. Macroalgal and submerged macrophyte growth increase in response to low flow conditions. |
| Artificial mouth opening | |
| ↑ salinity ↑ tidal currents | Reed beds and swamp forest die-back. Submerged macrophytes die-back |
Table 3.
Key lessons from EFlow case studies that advanced the understanding of the relationship between flow and estuary response.
Table 3.
Key lessons from EFlow case studies that advanced the understanding of the relationship between flow and estuary response.
| Great Brak Estuary [73,74,75,76] |
|
| Uilkraals Estuary [77] |
|
| Mhlanga Estuary [31,44] |
|
| Goukamma Estuary [73,78] |
|
| East Kleinemonde Estuary [58,79,80] |
|
Table 4.
Relevant data on the percentage Mean Annual Runoff remaining, and flow required to maintain an open mouth in temporarily closed estuaries. Estuary size (ha) is provided as a proxy for tidal flows, while wave exposure is rated from very exposed to protected. Mouth constriction (perched above normal tidal action) is indicated and the resultant annual percentage open mouth conditions are provided as an indication of the interplay between runoff, tidal flows, and wave exposure. These data were extracted for each estuary from reports of the Department of Water Affairs. Estuaries are listed from west to east (Figure 2) and are classified as large and small temporarily closed, as per [8].
| Estuary | Present Ecological State | Natural MAR (× 106 m3) | % of Natural MAR to Maintain Present State | River Flow at Which Mouth Closes (m3 s−1) | Estuary size (ha) | Wave Exposure | Mouth Perched above Normal Tidal Action | % Mouth Open |
|---|---|---|---|---|---|---|---|---|
| Palmiet (large) | Moderately modified | 255 | 63 | 0.3–1 | 33 | Medium exposure | Yes | 99–75 |
| Onrus (small) | Largely modified | 9.6 | 77 | 0.015 | 11 | Medium exposure | Yes | 50–25 |
| Great Brak (large) | Largely modified | 36.79 | 44 | <0.3 | 105 | Exposed | No | 50–25 |
| Gwaing (small) | Moderately modified | 26.64 | 75 | <0.2 | 9 | Protected | No | 99–75 |
| Goukamma (large) | Near Natural | 57.5 | 85 | <0.5 | 18 | Very Exposed | No | 99–75 |
| Matjies (small) | Near Natural | 5.10 | 84 | <0.03 | 3 | Medium exposure | Yes | 75–50 |
| Tsitsikamma (small) | Near Natural | 19.90 | 67 | <0.05 | 7 | Exposed | Yes | 75–50 |
| East Kleinemonde (large) | Near Natural | 2.856 | 96 | <0.03 | 59 | Protected | Yes | 50–25 |
| Mngazi (large) | Near Natural | 84 | 97 | <0.3 | 17 | Very Exposed | No | 75–50 |
| Little Amanzimtoti (small) | Highly degraded | 2.8 | 232.5 | <0.03 | 10 | Exposed | Yes | 75–50 |
| Mbokodweni (large) | Highly degraded | 31.5 | 169.8 | <0.2 | 18 | Very Exposed | Yes | 99–75 |
| Mhlanga (large) | Largely modified | 12.4 | 158 | <0.4 | 83 | Very Exposed | Yes | 50–25 |
| Mdloti (large) | Largely modified | 98.7 | 73 | <0.3 | 58 | Very Exposed | Yes | 50–25 |
| Tongati (large) | Largely modified | 70.79 | 111.9 | <0.4 | 37 | Very Exposed | Yes | 99–75 |
| Siyaya (small) | Highly degraded | 6.5 | 71 | <0.3 | 10 | Very Exposed | Yes | 25–0 |
Table 5.
Data and monitoring pre-requisites for EFlow studies (modified from Taljaard et al. 2003, [97]).
Table 5.
Data and monitoring pre-requisites for EFlow studies (modified from Taljaard et al. 2003, [97]).
| Component | Baseline Data and Monitoring Requirements for High-Confidence EFlow Studies |
|---|---|
| Hydrology | Primary catchment delineation. |
| Measured rainfall data in the catchment (or a representative adjacent catchment) for 50 years. | |
| Hydrological parameters (evaporation rates, radiation rates, soil permeability, catchment land use) based on long-term studies. | |
| Measured river inflow data (gauging station) at the head of the estuary over 5–20 years. | |
| Record of flow reduction activities (e.g., abstraction, impoundment) and flow enhancement activities (e.g., discharges, transfer schemes). | |
| Flood hydrographs (hourly measurements at calibrated weir) for a range of flood size classes and preferably for a minimum of 50 years. | |
| Bathymetry | Bathymetric/topographical surveys including berm height, cross sections at 10–50 m in the mouth region, cross section profiles at 500 to 1000 m intervals upstream of the mouth, and floodplain topography preferably done with Lidar. Repeated every 3 years and after episodic events like floods to record changes and erosion/deposition cycles. |
| Hydrodynamics | Continuous water level recordings near estuary mouth (but away from wave action). Minimum period of 5 to 20 years depending on frequency of breaching. |
| Water level recordings at 2 to 6 stations along the length of the estuary over a spring and a neap tidal cycle (14 days). Data are used for model calibration. In large complex estuaries recorders to be left for ongoing monitoring. | |
| Daily mouth state observations (open/closed/overtopping), particularly those with a semi-closed mouth state. Minimum period of 5 to 20 years depending on frequency of breaching. | |
| Stationary camera observations of mouth behavior. Minimum period of 5 to 20 years depending on frequency of breaching. | |
| High resolution historical aerial photography and satellite imagery (1:10,000 scale), preferably rectified going as far back as historically possible (e.g., in South Africa 1920s). Old maps, anecdotal information and farm records are also used to determine natural process regimes. | |
| Data on wave conditions near mouth (minimum period of 5 to 20 years). | |
| Sediments | Sediment samples collected along length of entire estuary at 500 to 1000 m intervals using a Van Veen or a Zabalocki-type Eckman grab (to characterize recent sediment movement) for particle size analyses. Samples preferably collected at 3-year intervals and after floods. |
| Sediment core samples collected using a corer (for historical sediment characterization) at intervals similar to cross-section profiles (see bathymetry) or where considered appropriate by sediment specialist. Collected at 3-to-6-year intervals and after floods. | |
| Long-term suspended sediment load near head of estuary over 5–15 years (including detritus component—particulate carbon/loss on ignition), needed to compile sediment transport curve for river inflow. | |
| Water quality | Quarterly/monthly longitudinal profiles (salinity, temperature, oxygen, pH, turbidity, nutrients) along the length of the estuary collected over a spring and neap tide during high and low tide with a focus on the end of low flow season and the peak of high flow season. Preferably for 5 to 20 years. |
| If possible, long-term stationary in situ salinity and temperature loggers (minimum wet-dry cycle) placed in the lower, middle, and upper estuary reaches. Minimum period of 5 to 20 years depending on frequency of breaching. | |
| Water quality (e.g., system variables, nutrients, and toxic substances) measurements for river water entering at the head of the estuary and for nearshore seawater. Minimum period of 5 to 20 years, but ongoing preferable. | |
| Measurements of organic content and toxic substances (e.g., trace metals and hydrocarbons) in sediments along the length of the estuary for urban estuaries (once off). | |
| Microalgae | Quarterly data on relative abundance of dominant phytoplankton groups, i.e., flagellates, dinoflagellates, diatoms, and blue-green algae, during typical high and low flow conditions preferably for a series of years, thereafter every 3 years. |
| Quarterly chlorophyll-a measurements taken at the surface, 0.5 m and 1 m depths, under typically high and low flow conditions, preferably for a series of years, thereafter every 3 years. | |
| Quarterly intertidal and subtidal benthic chlorophyll-a measurements preferably for a series of years, thereafter every 3 years. | |
| Macrophytes | Aerial photographs or high resolution satellite imagery of the estuary (ideally 1:5000 scale) reflecting the present state and reference condition (earliest year available). A GIS vegetation map indicating the present and reference condition distribution of the different macrophyte habitat types (e.g., salt marsh, mangroves, reeds, and sedges) to be repeated every 3 years. |
| Number of macrophyte habitat types, identification and total number of macrophyte species, number of rare or endangered species, or those with limited populations documented during a field visit. The extent of anthropogenic impacts (e.g., trampling, mining) must be noted. To be repeated every 3 years. | |
| Permanent transects (fixed monitoring stations that can be used to measure change in salt marsh in response to changes in salinity and inundation patterns) set up along an elevation gradient. Measurements of percentage cover of each plant species in duplicate quadrats (1 m2). Measurements of sediment salinity, water content, depth to water table and water table salinity. These data should be available for low- and high-flow periods and repeated every 3 years. | |
| Invertebrates | Species and abundance of zooplankton, based on quarterly samples collected across the estuary at each of a series of stations along the estuary. Sampling stations must be representative of the substrate and salinity zones typical of a particular estuary, e.g., 0–10, 10–20, 20–30, >30. |
| Benthic invertebrate species and abundance, based on subtidal grab samples and intertidal core samples at a series of stations up the estuary, and pump sampling or counts of hole densities. Sampling stations must be representative of the substrate and salinity zones characteristic of the estuary. | |
| Macrocrustacean species and abundance based on sampling at each station using a benthic sled with flow meter, prawn/crab traps, and appropriate gear for shoreline. | |
| Measures of sediment characteristics at each station. In situ water quality variables need to be collected at time of sampling (e.g., salinity, temperature, oxygen). These data should be available for summer and winter seasons of the year, or for low- and high-flow periods every 3 years. | |
| Fish | Species and abundance data of fish, based on quarterly seine net and gill net sampling, with less gill net than seine samples. In small estuaries, these nets should only be used in the mouth, middle, and upper reaches. Sampling stations must be representative of the salinity zones characteristic of the particular estuary, i.e., 0–10, 10–20, 20–30, >30 (at least one station should be in this range). Within each salinity zone, representative habitats need to be sampled, such as submerged macrophytes, prawn beds, sand flats (representing different food sources). In situ water quality variables need to be collected at time of sampling (e.g., salinity, temperature, oxygen). The number of seine net stations in a small estuary (<5 km long) should not be <5, distributed along the length of the estuary. For larger estuaries, 10 to 15 seine net stations selected geographically along the entire length of the estuary. A rough estimate for setting the distance between stations is to divide the length of the estuary by 10 (i.e., if an estuary is 30 km long, the distance between stations should be about 3 km). These data should be available for four seasons of the year, or for low- and high-flow periods in a series of years. To be repeated every 3 years. |
| Birds | One year of monthly counts of all water-associated birds, by species, for the whole estuary, preferably separated into counting areas and/or a series of at least 10 years of summer and winter counts, in addition to historical data on the same. |
Table 6.
Summary of the 10 principles to determine the EFlows for temporarily closed estuaries.
| Principle 1 | EFlows are unique for every estuary |
| Principle 2 | A small reduction in baseflow leads to mouth closure |
| Principle 3 | Floods flush and reset closed estuaries |
| Principle 4 | Open mouth conditions maintain good water quality |
| Principle 5 | Artificial breaching causes sedimentation |
| Principle 6 | Wastewater input and agricultural return flows can cause unstable conditions |
| Principle 7 | Water released from dams to supplement the EFlow cannot replace the natural flow regime |
| Principle 8 | Field and long-term data are needed for high-confidence EFlow assessments |
| Principle 9 | Monitoring must take place in a strategic adaptive management cycle |
| Principle 10 | Catchment to coast integrated management approach needed |
© 2020 by the authors. Licensee MDPI, Basel, Switzerland. This article is an open access article distributed under the terms and conditions of the Creative Commons Attribution (CC BY) license (http://creativecommons.org/licenses/by/4.0/).
Share and Cite
MDPI and ACS Style
Adams, J.B.; Van Niekerk, L. Ten Principles to Determine Environmental Flow Requirements for Temporarily Closed Estuaries. Water 2020, 12, 1944. https://doi.org/10.3390/w12071944
AMA Style
Adams JB, Van Niekerk L. Ten Principles to Determine Environmental Flow Requirements for Temporarily Closed Estuaries. Water. 2020; 12(7):1944. https://doi.org/10.3390/w12071944
Chicago/Turabian StyleAdams, Janine Barbara, and Lara Van Niekerk. 2020. "Ten Principles to Determine Environmental Flow Requirements for Temporarily Closed Estuaries" Water 12, no. 7: 1944. https://doi.org/10.3390/w12071944
Note that from the first issue of 2016, this journal uses article numbers instead of page numbers. See further details here.