Farming Influence on Physical-Mechanical Properties and Microstructural Characteristics of Backfilled Loess Farmland in Yan’an, China

 ,
,
Abstract
:1. Introduction
2. Materials and Methods
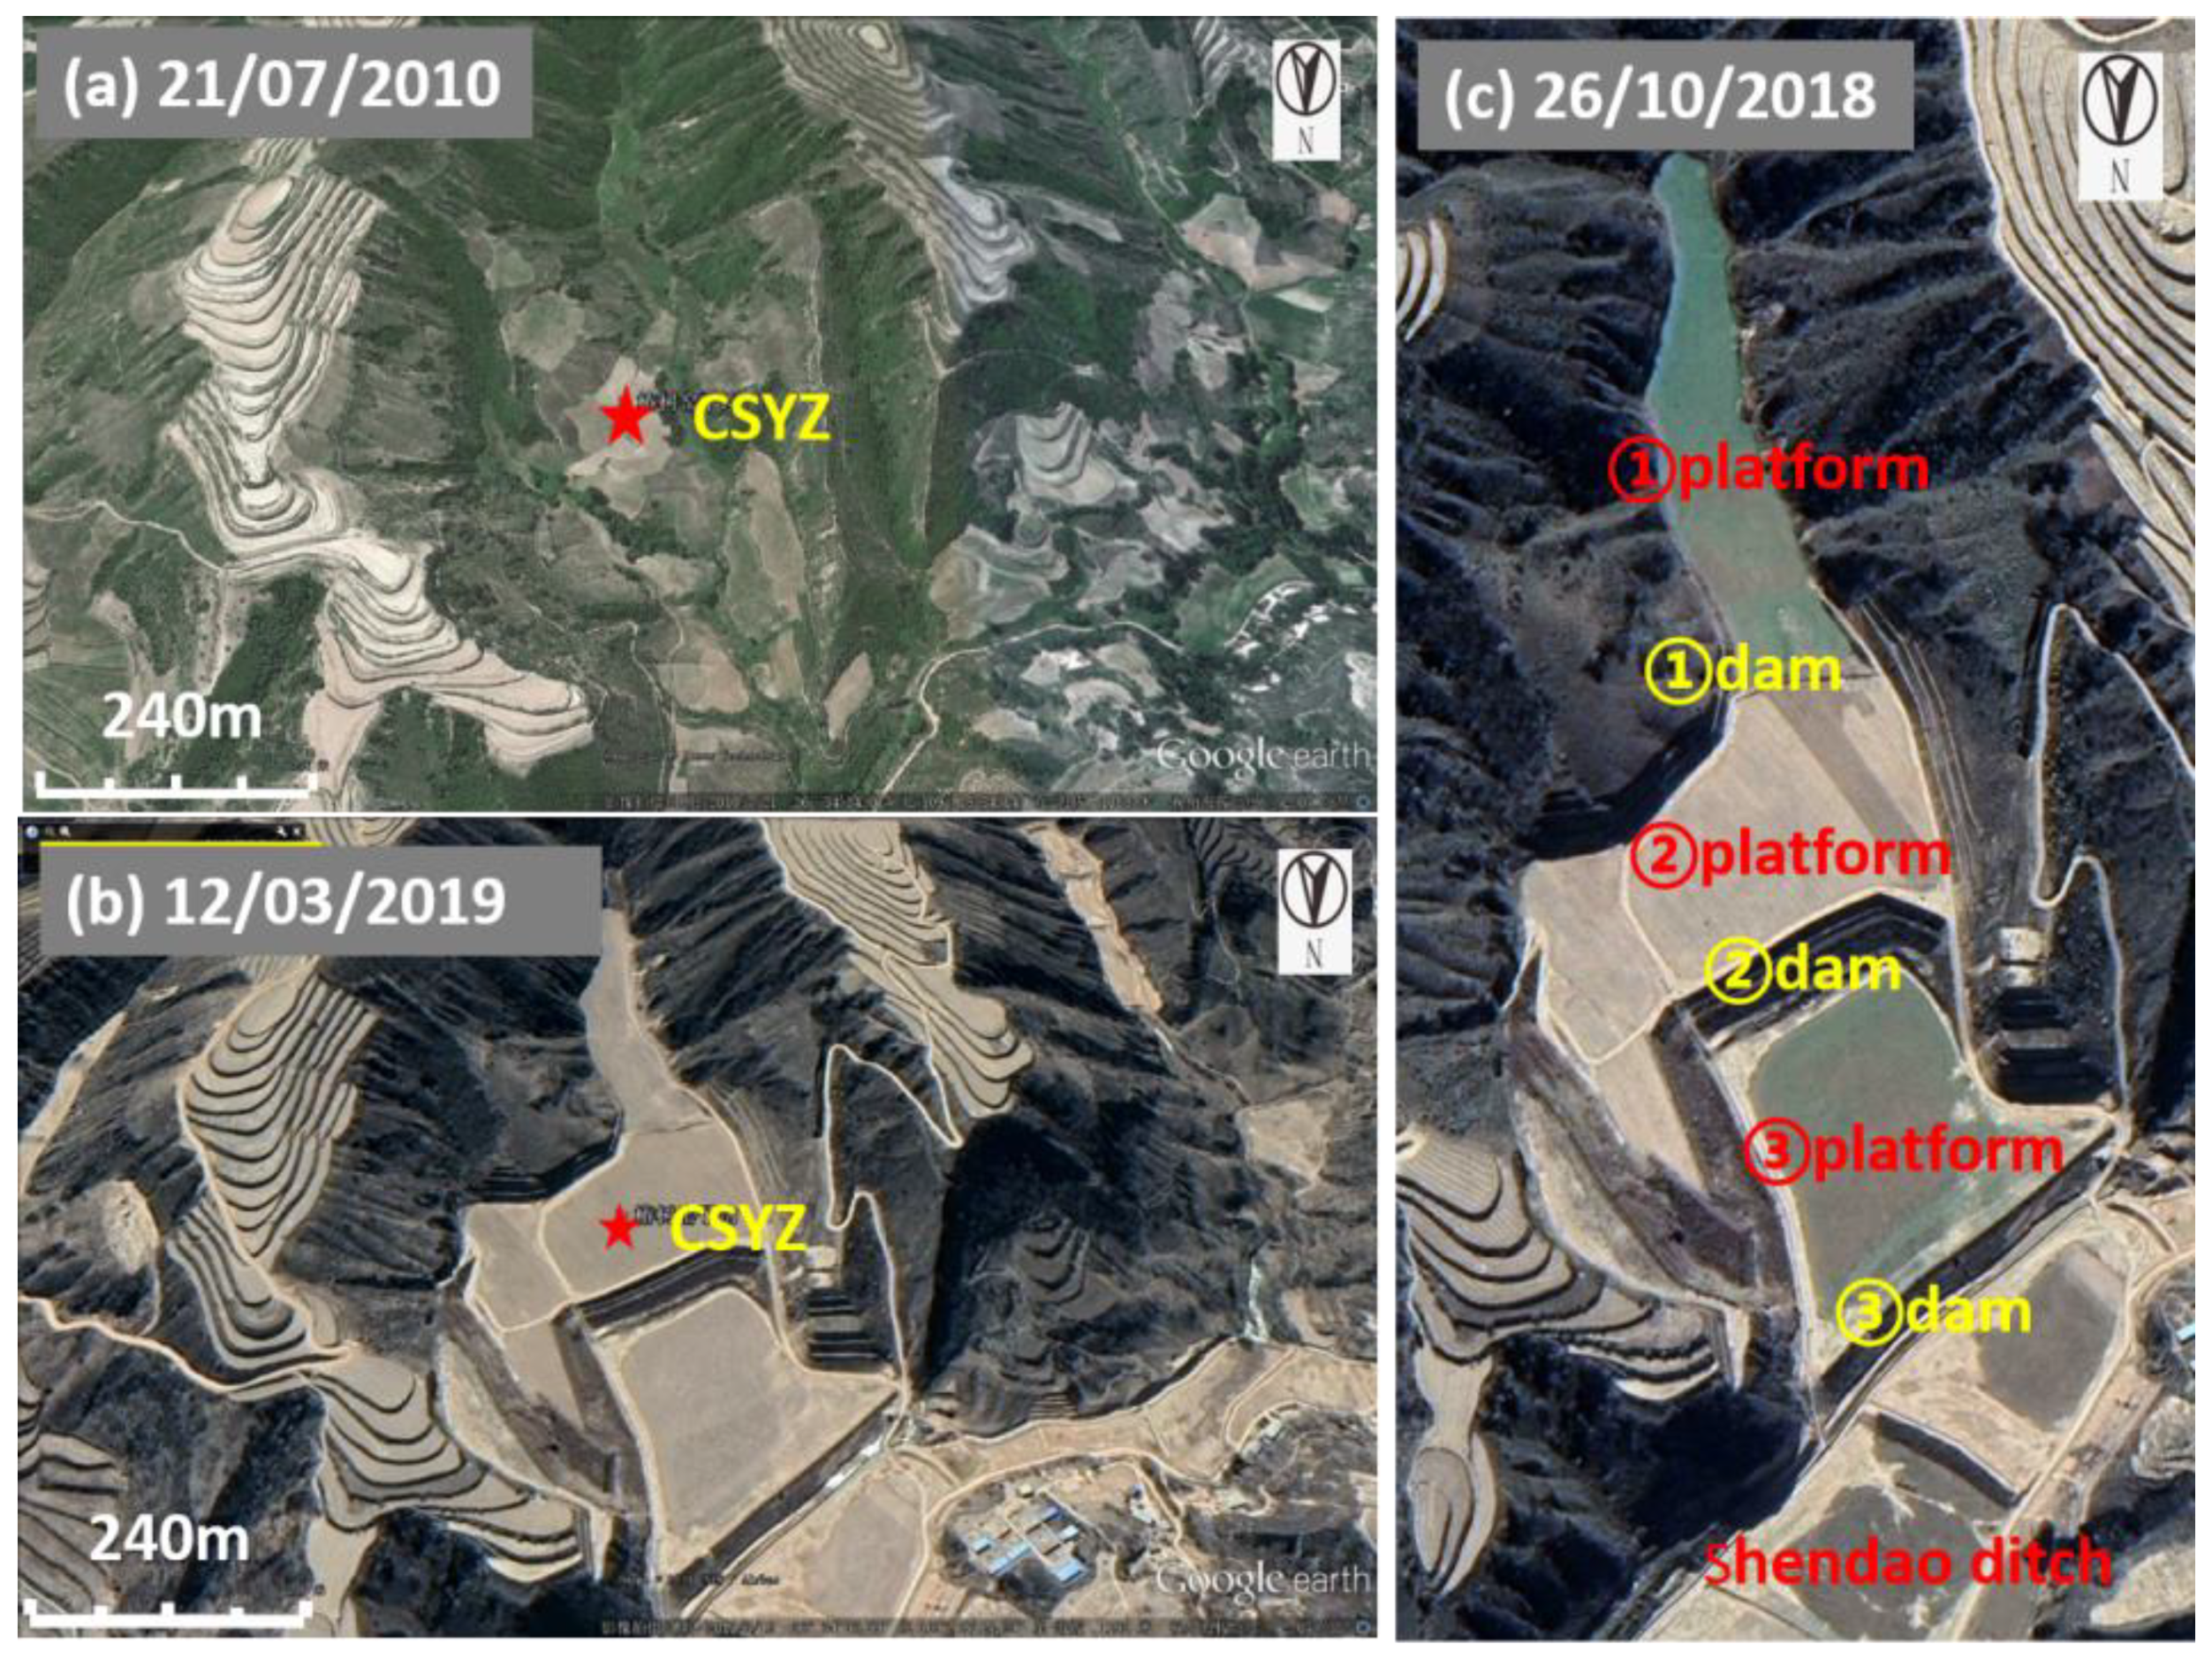
2.1. Study Site
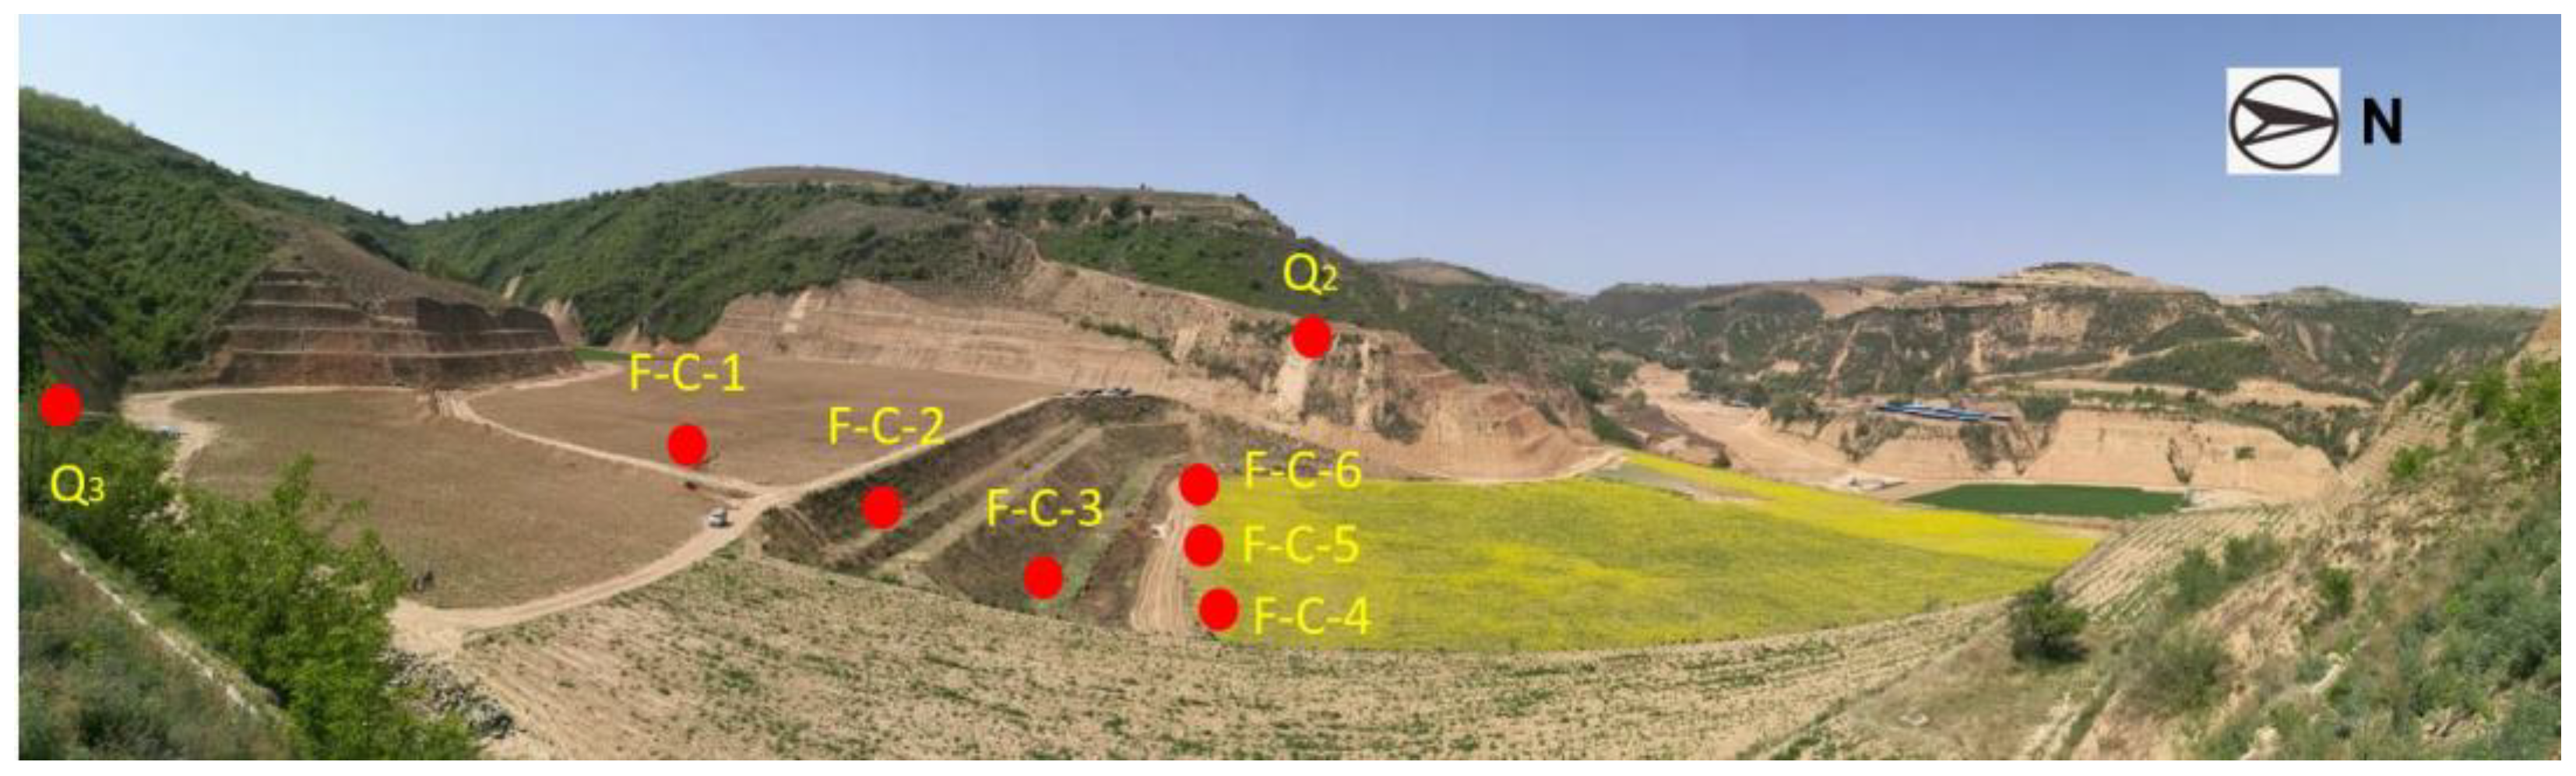
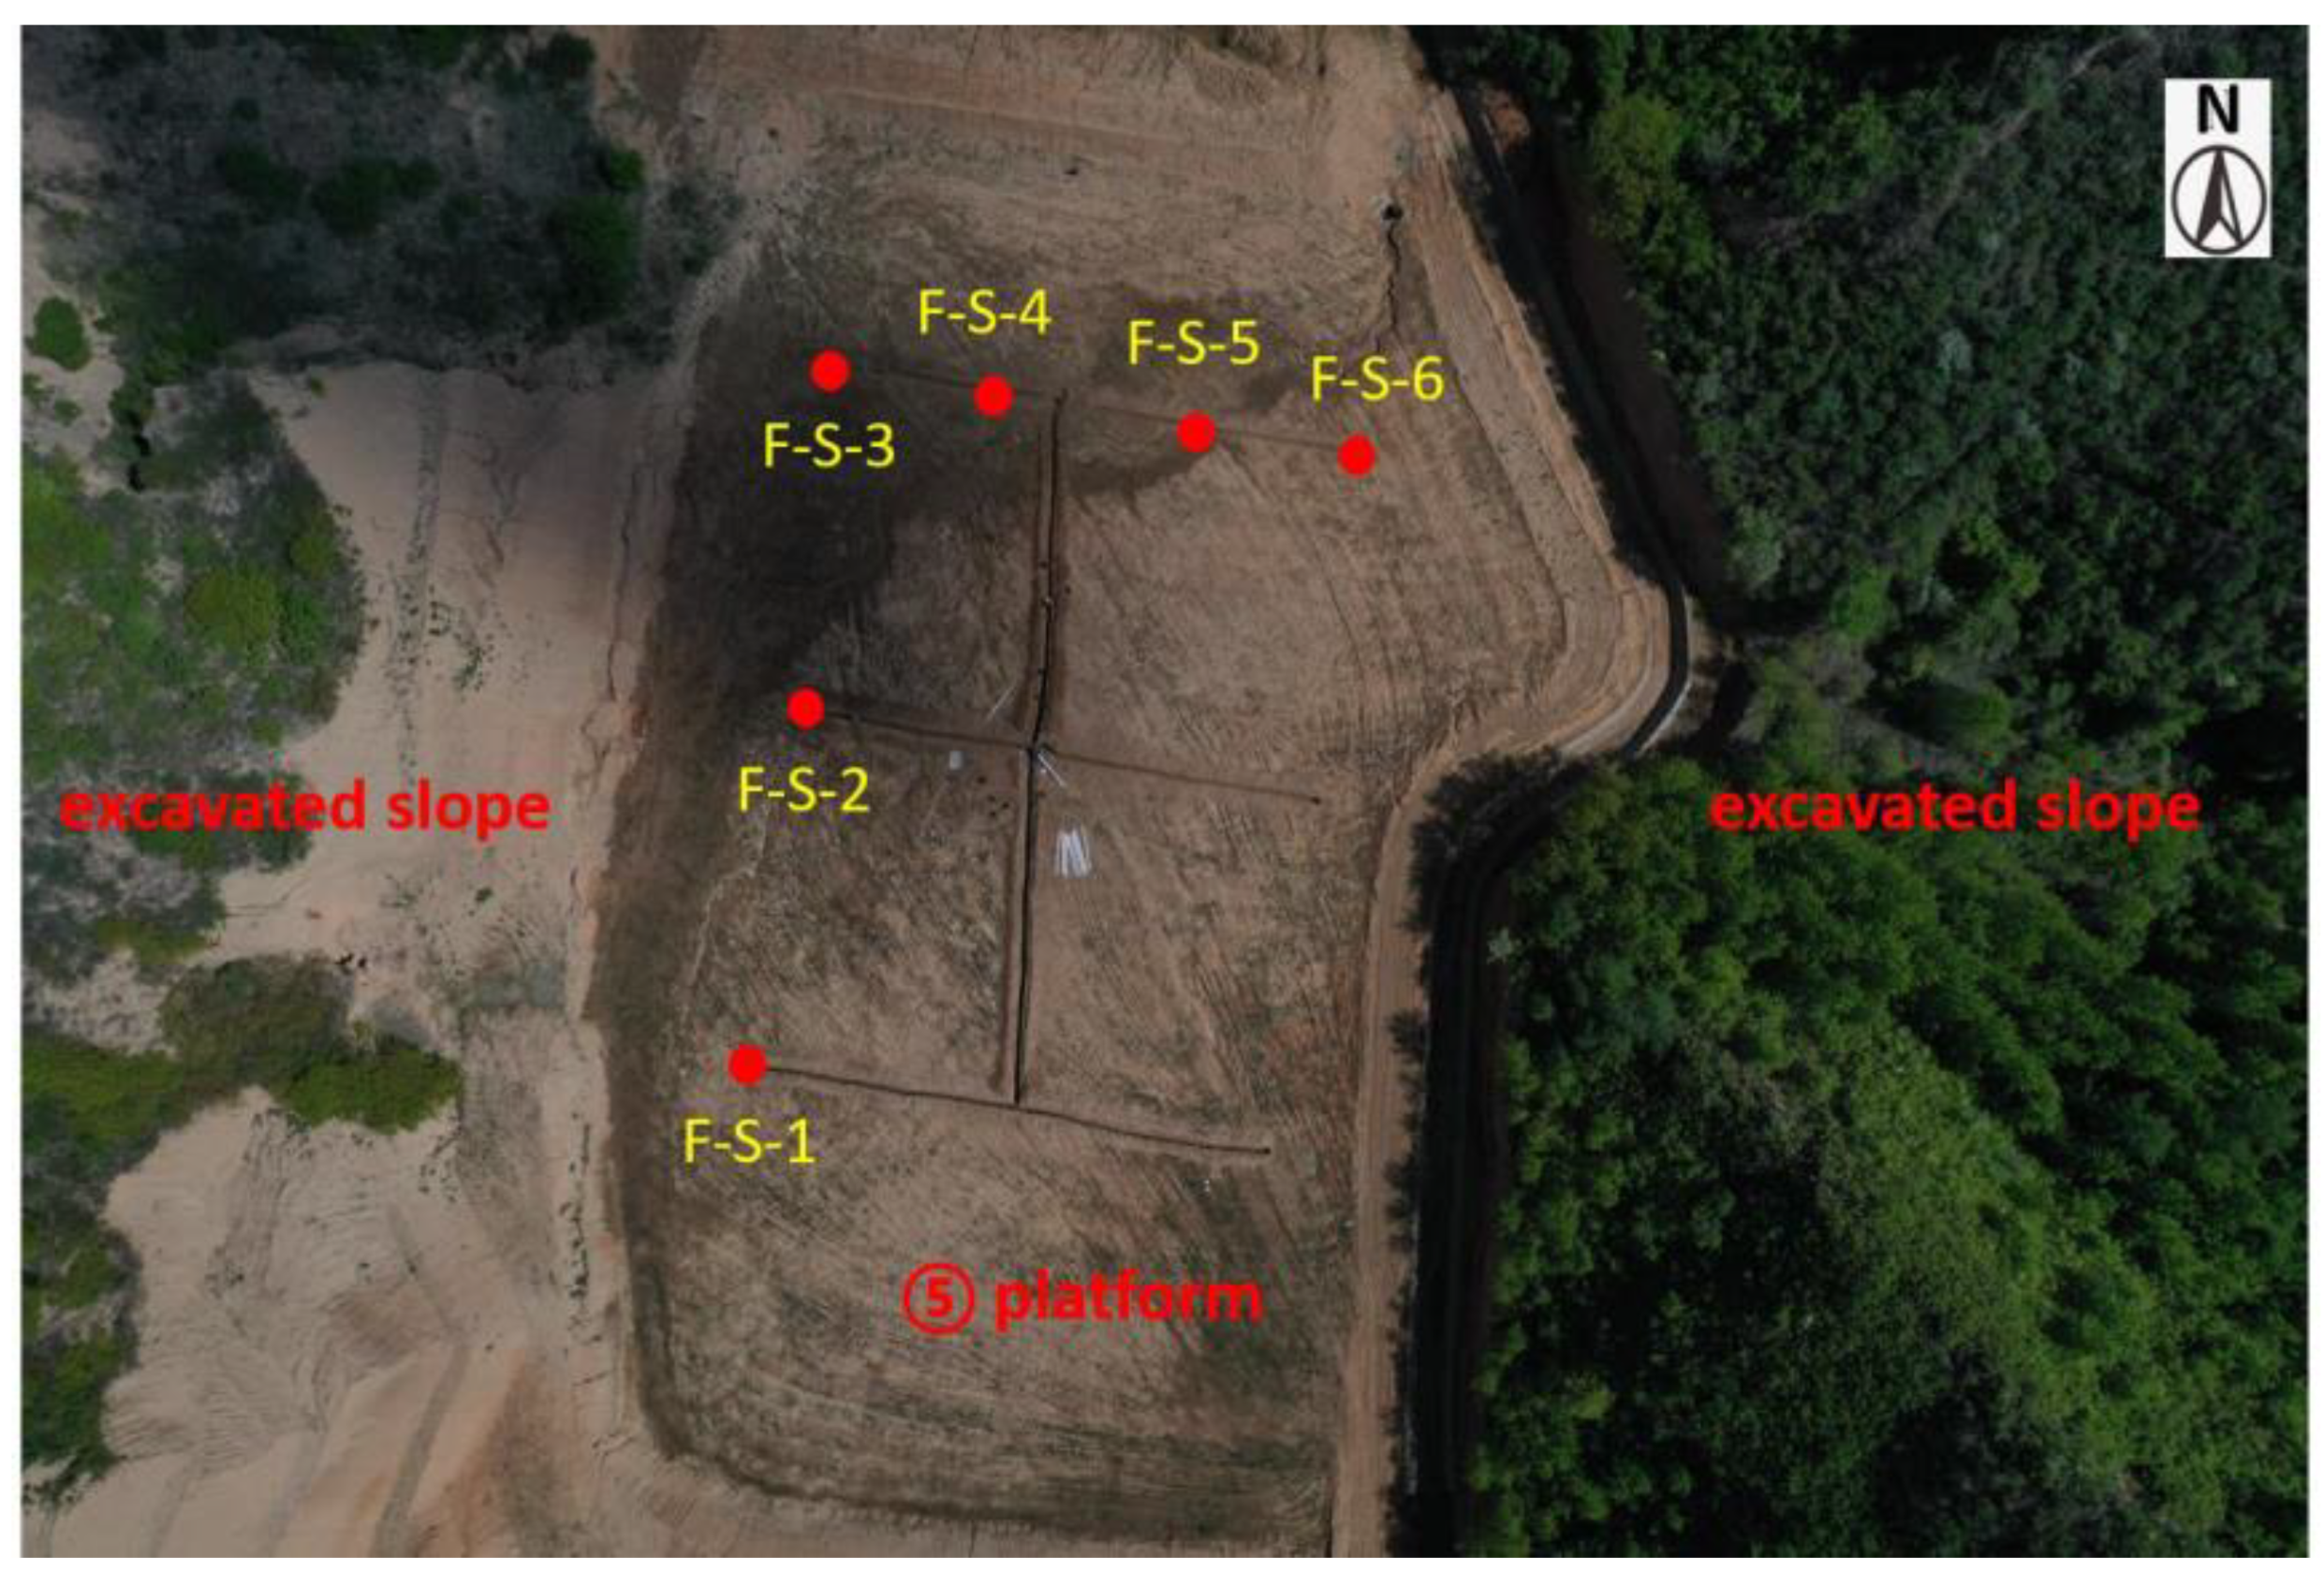
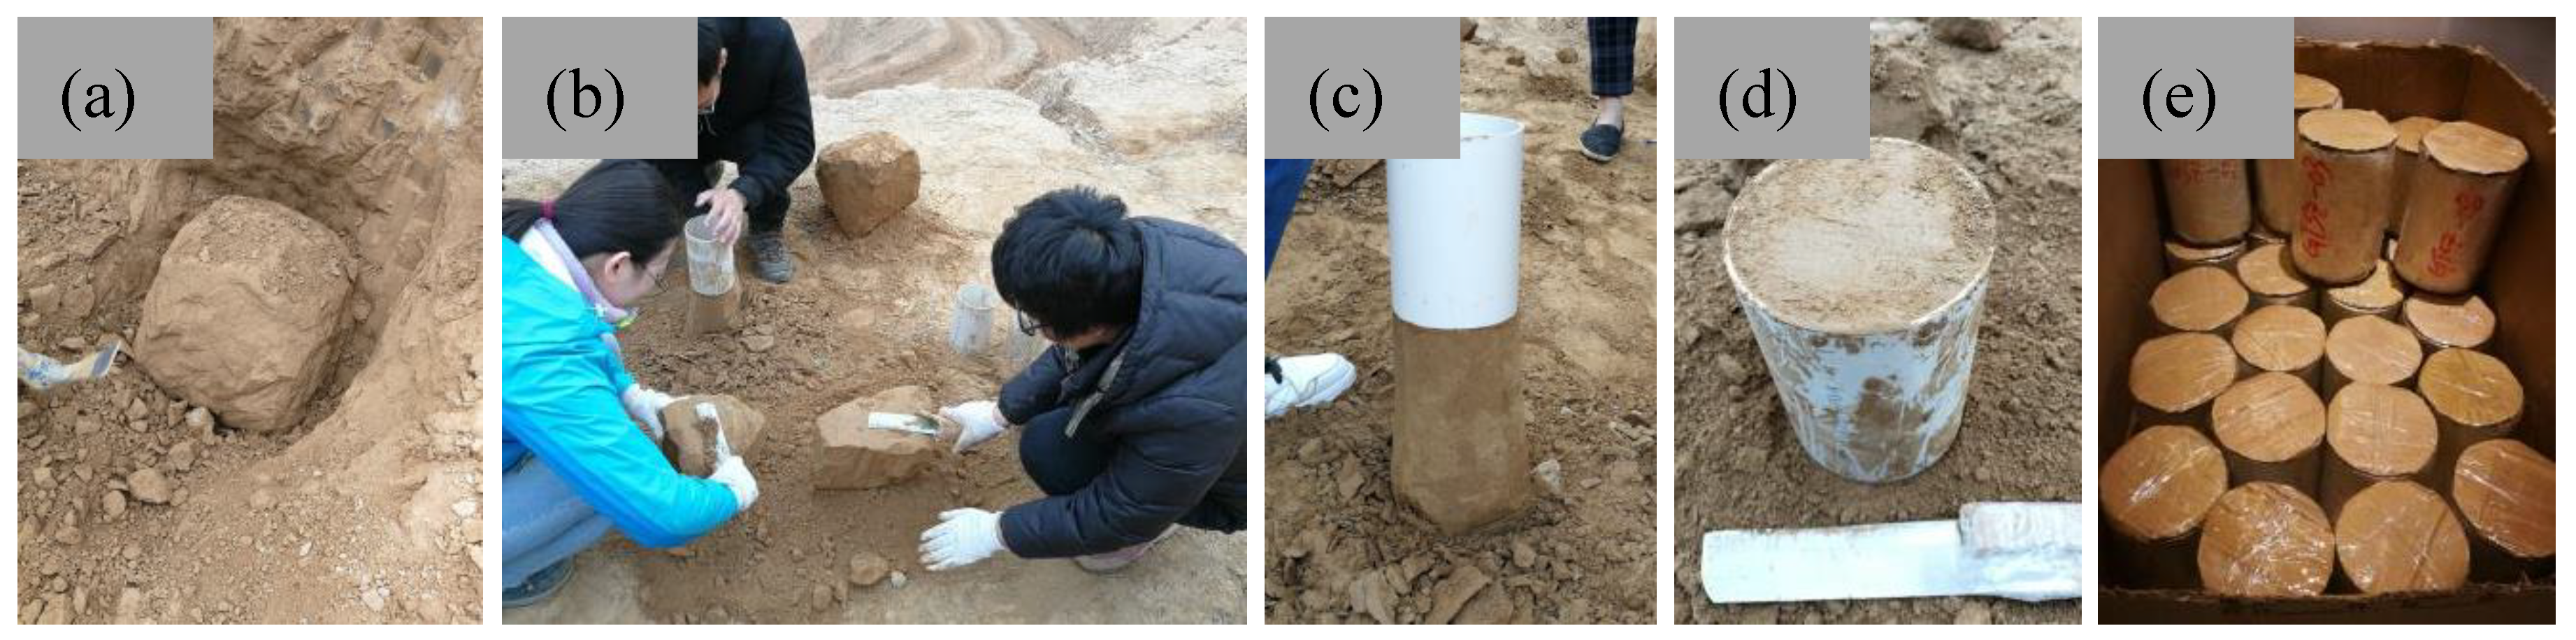
2.2. Soil Sampling
2.3. Experimental Method and Design
3. Results
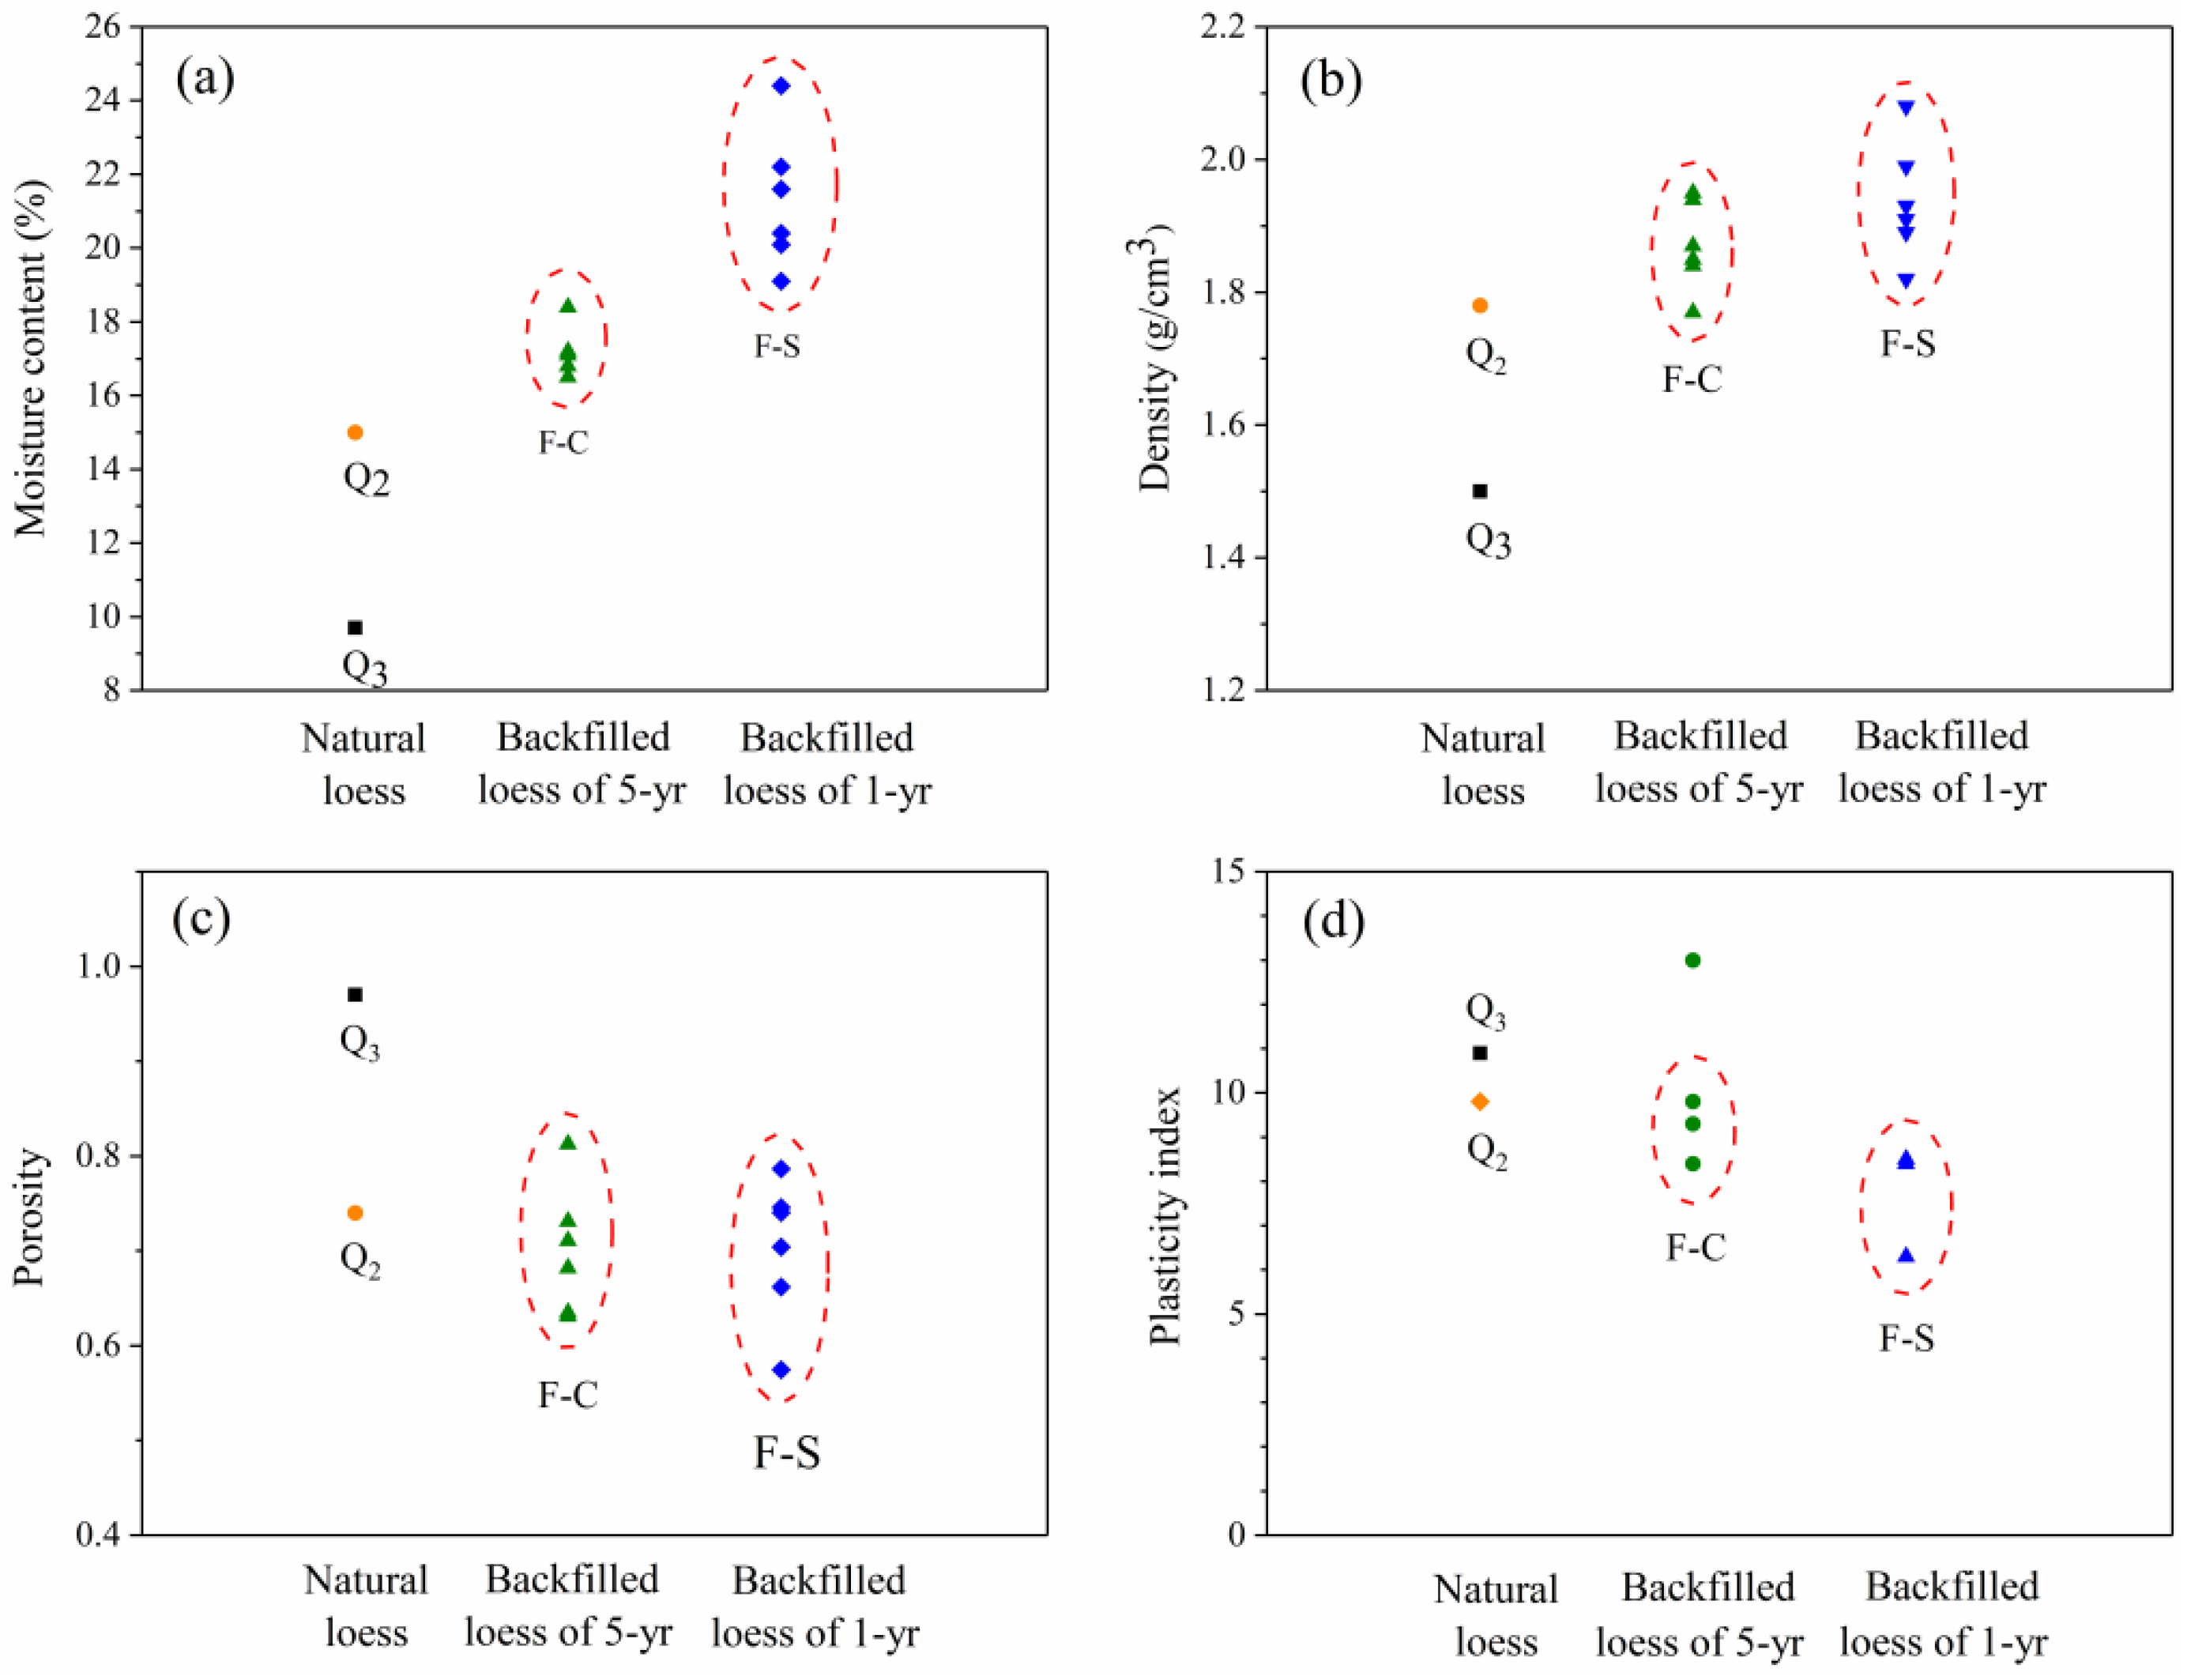
3.1. Tests of Basic Physical Properties
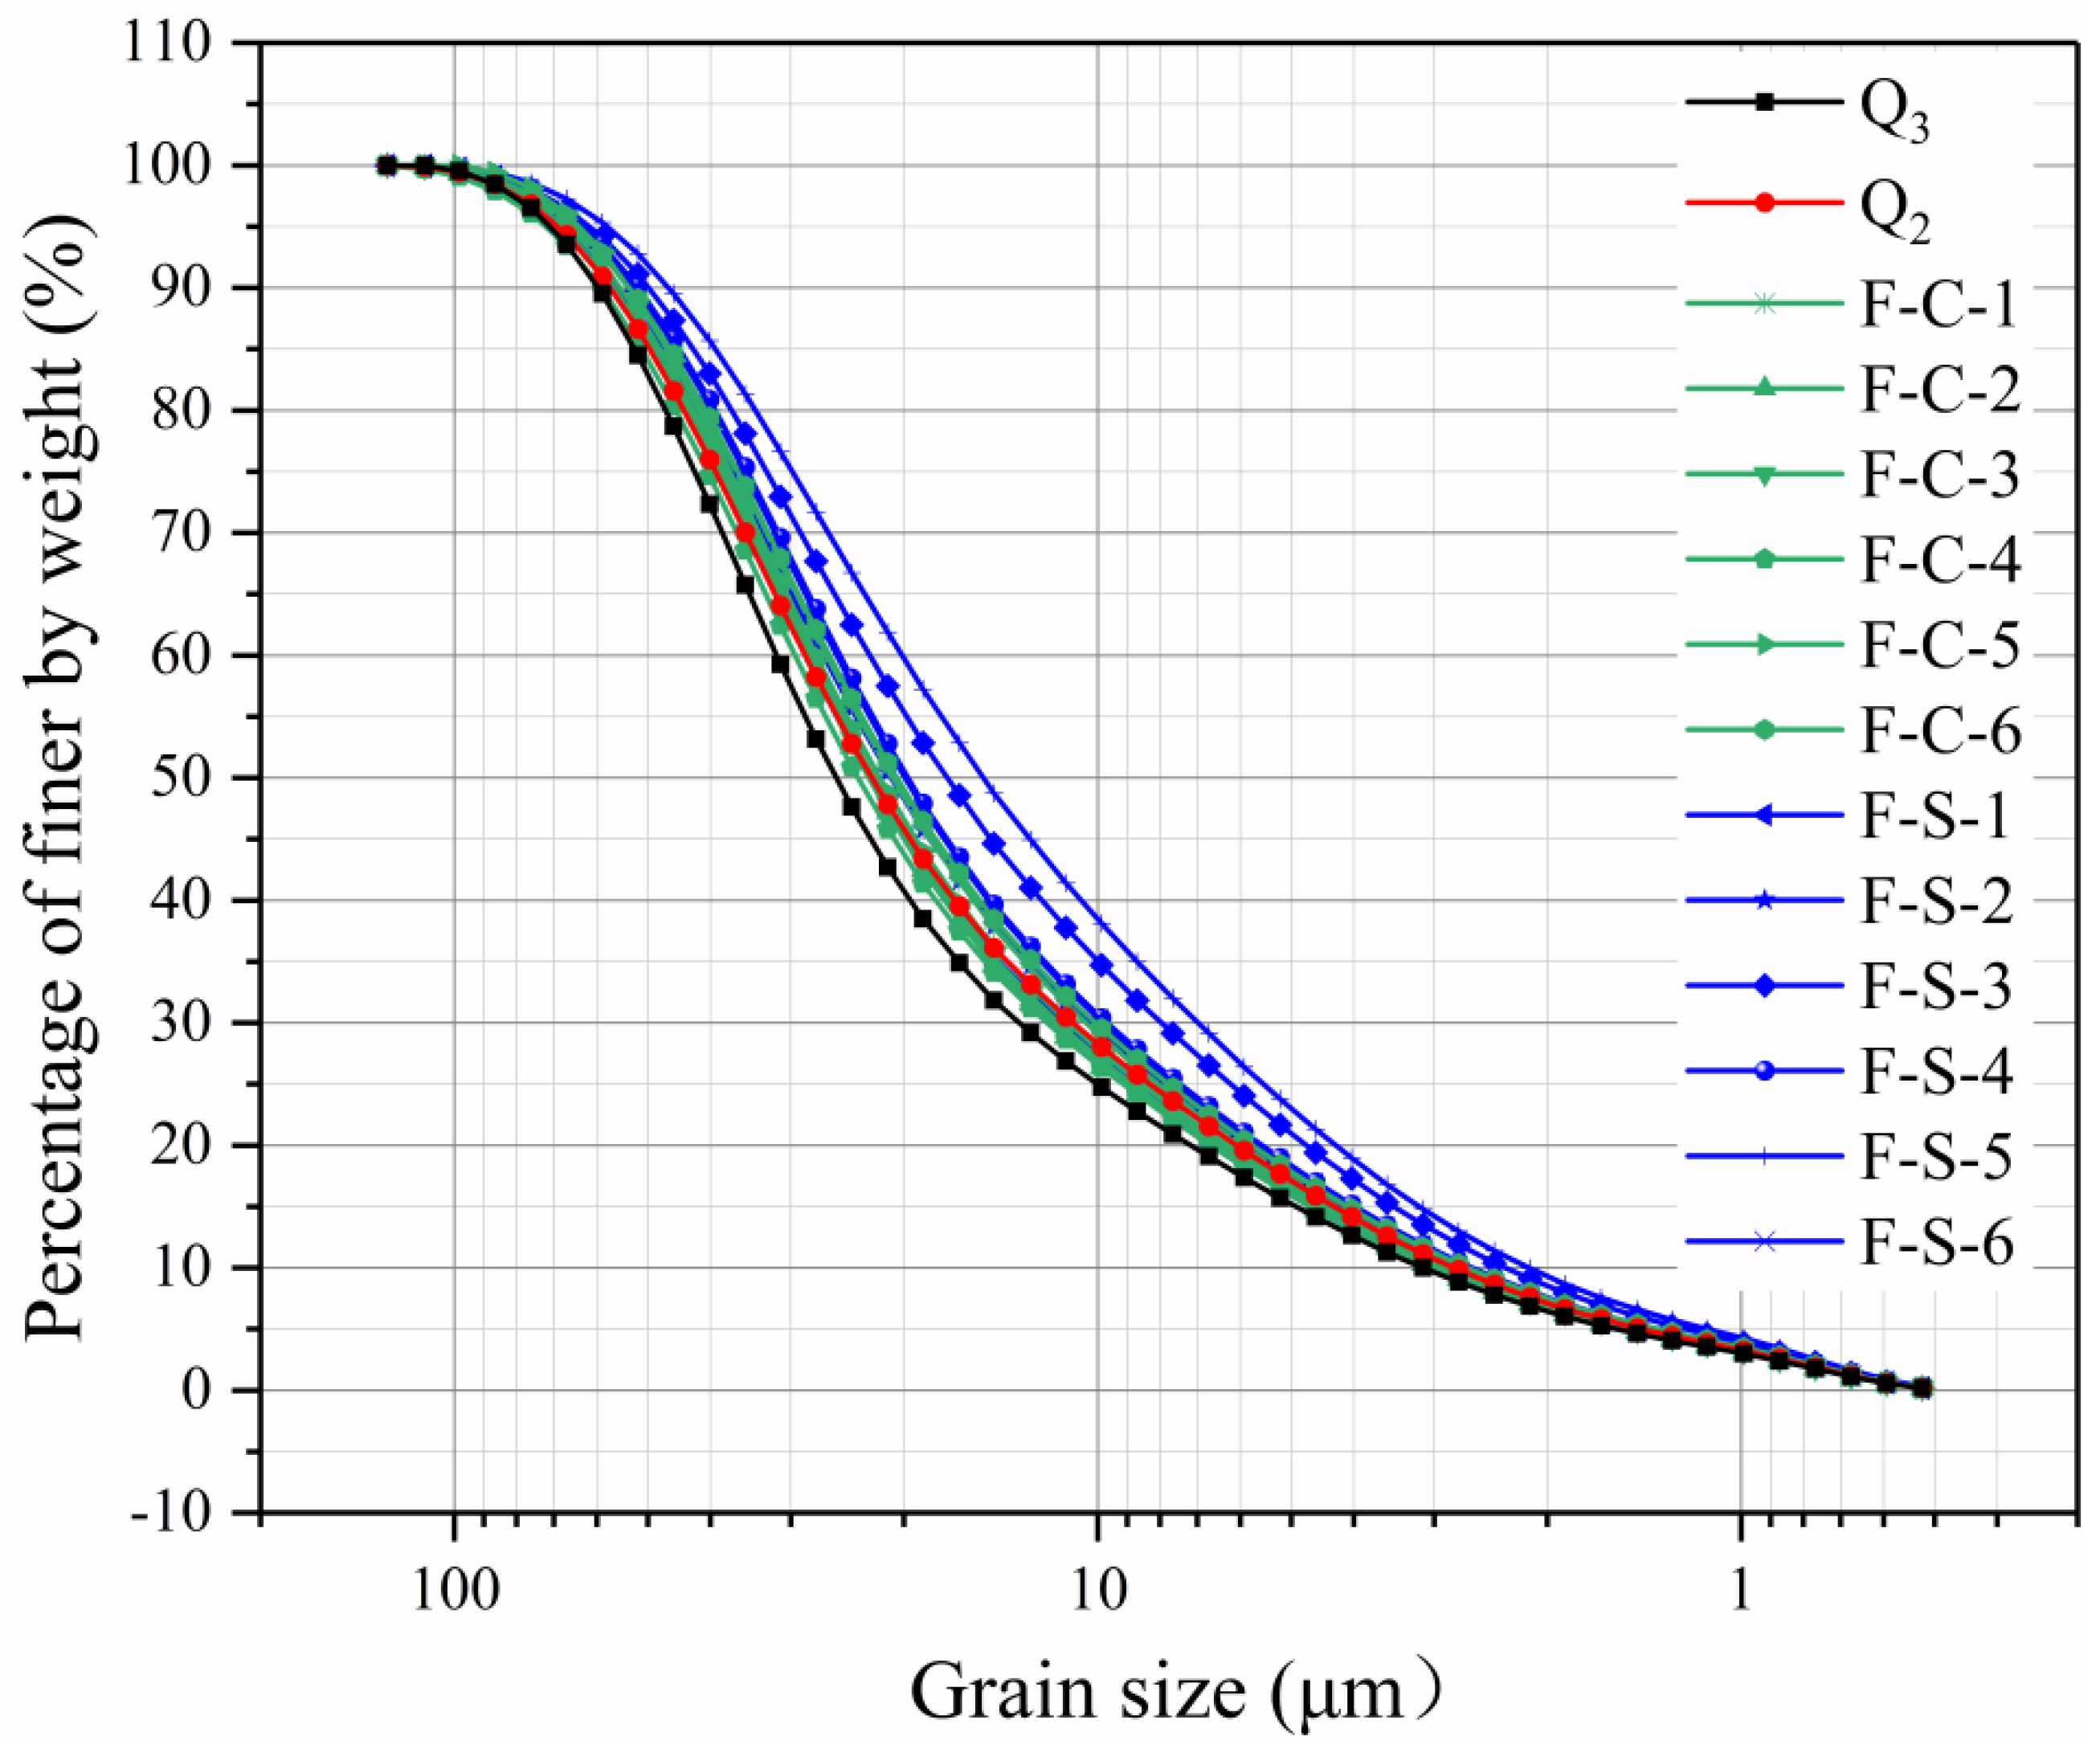
3.2. Grain Size Distribution
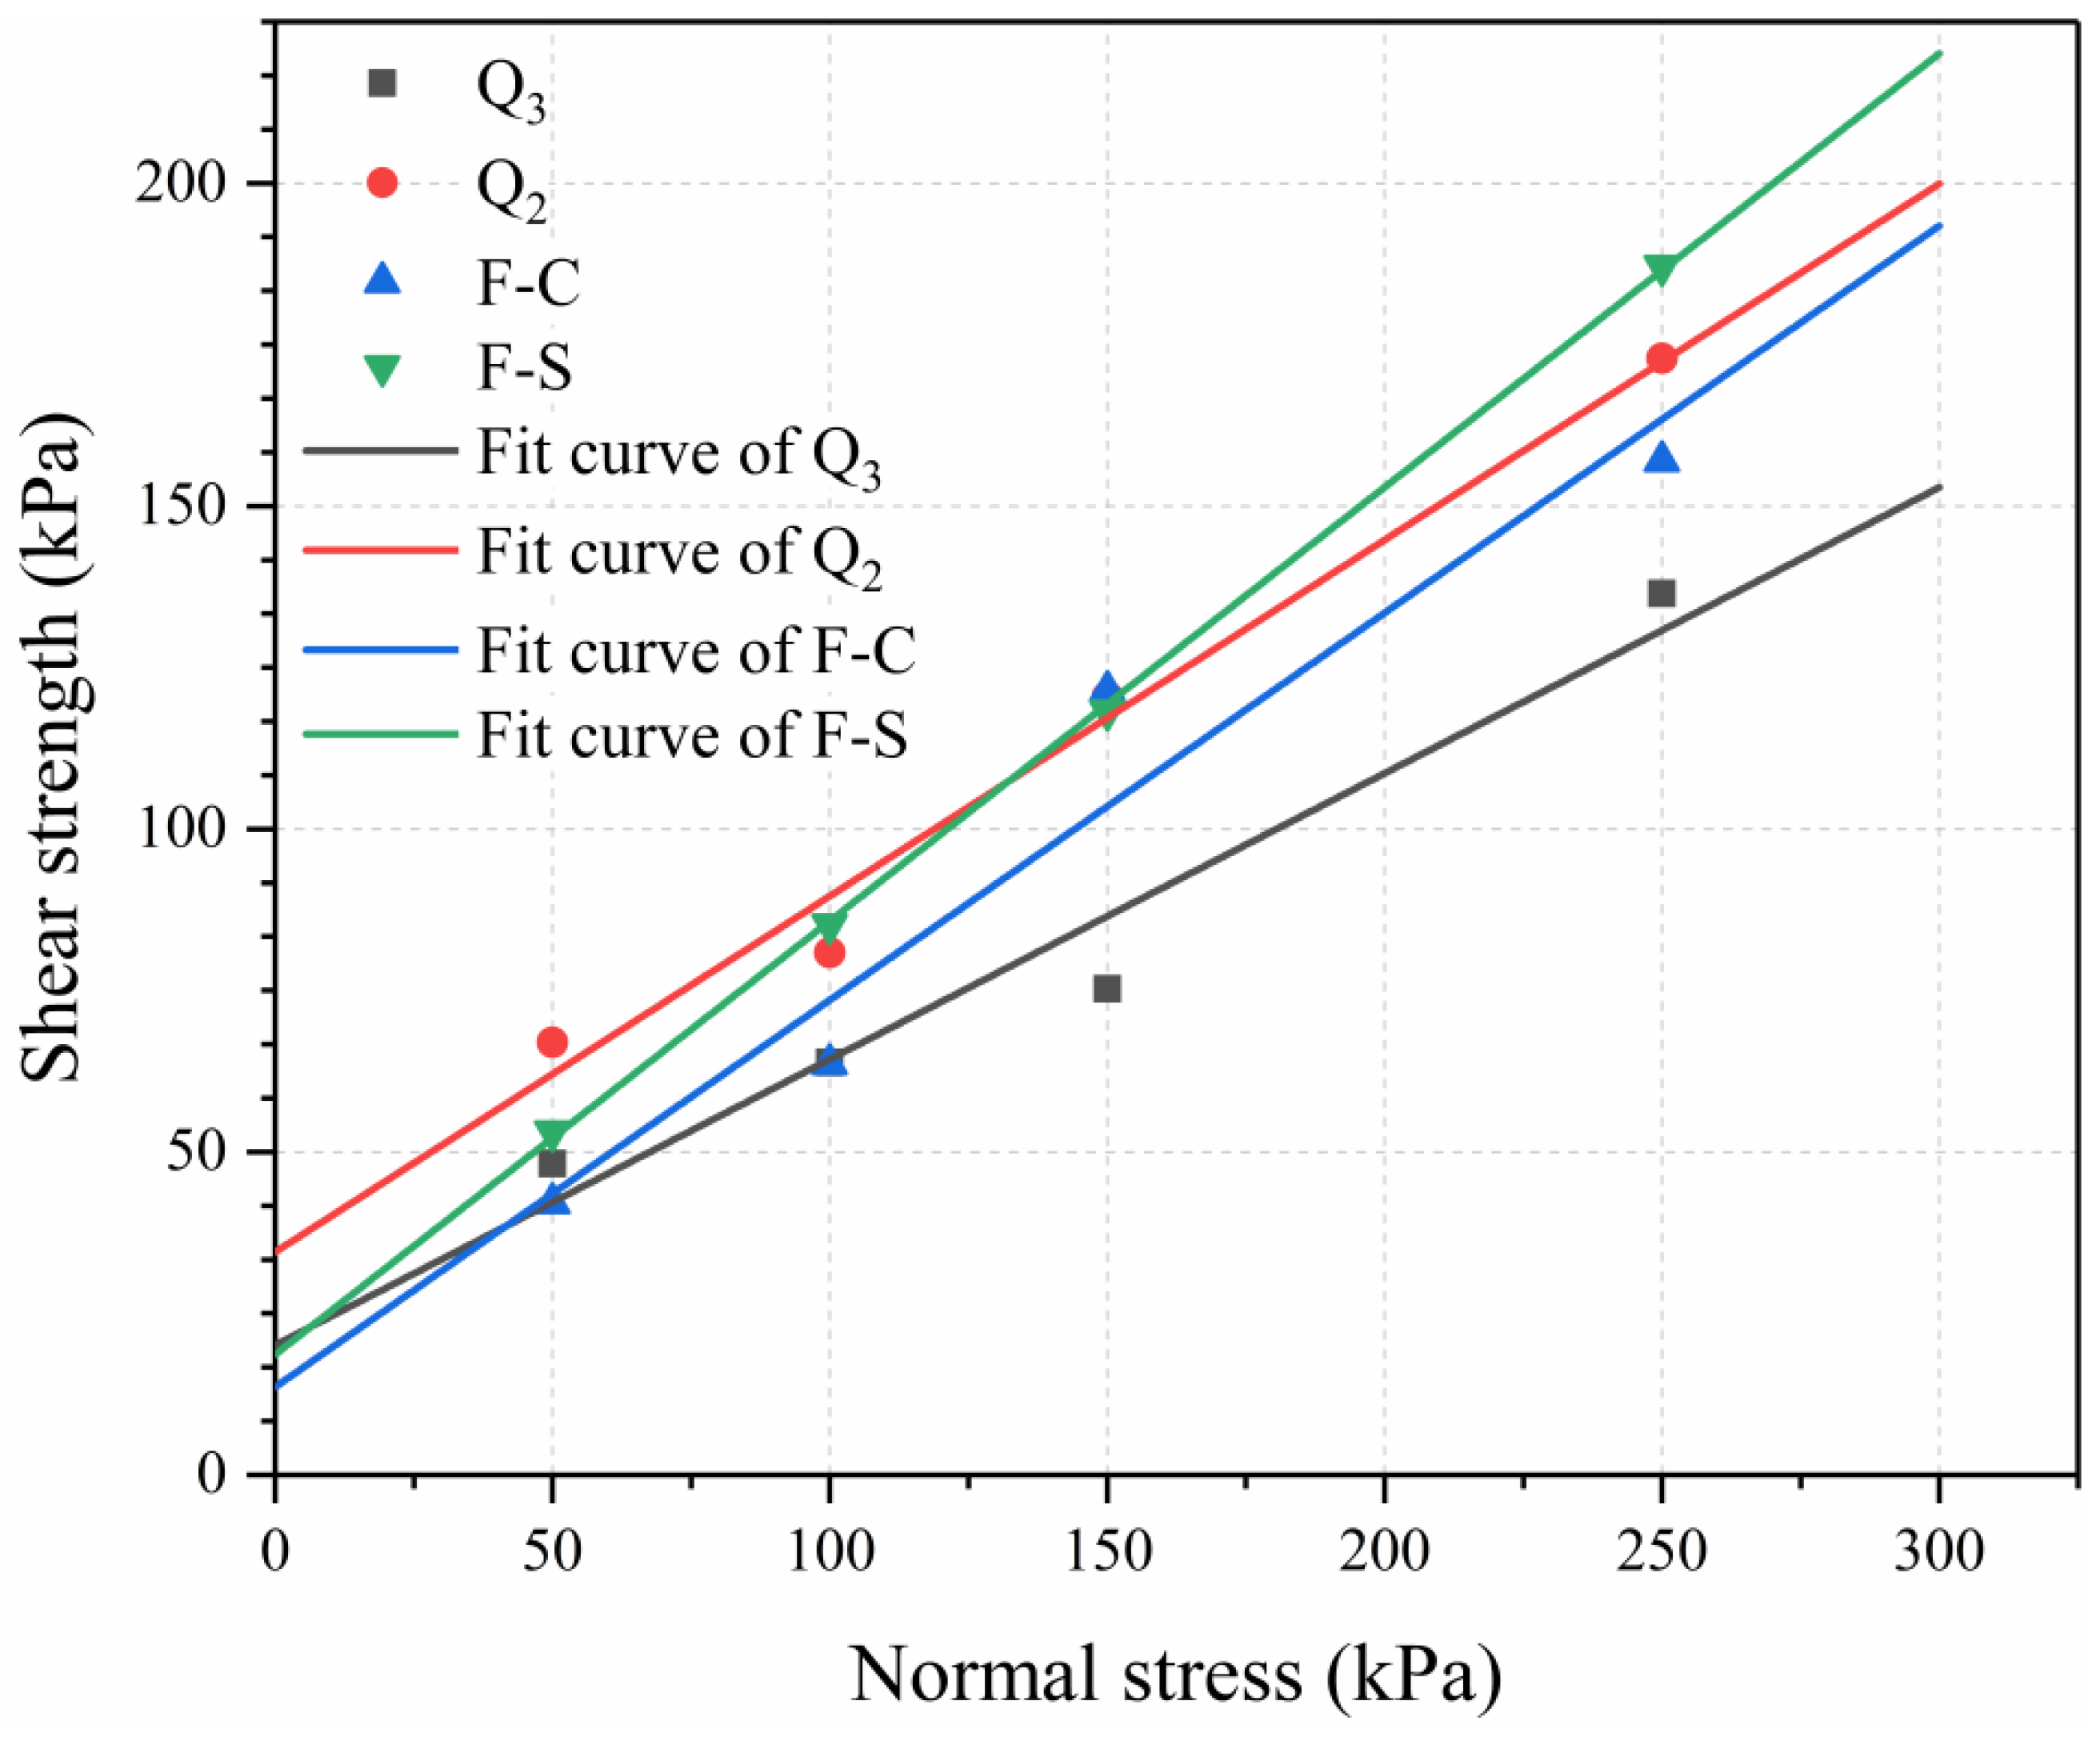
3.3. Direct Shear Tests
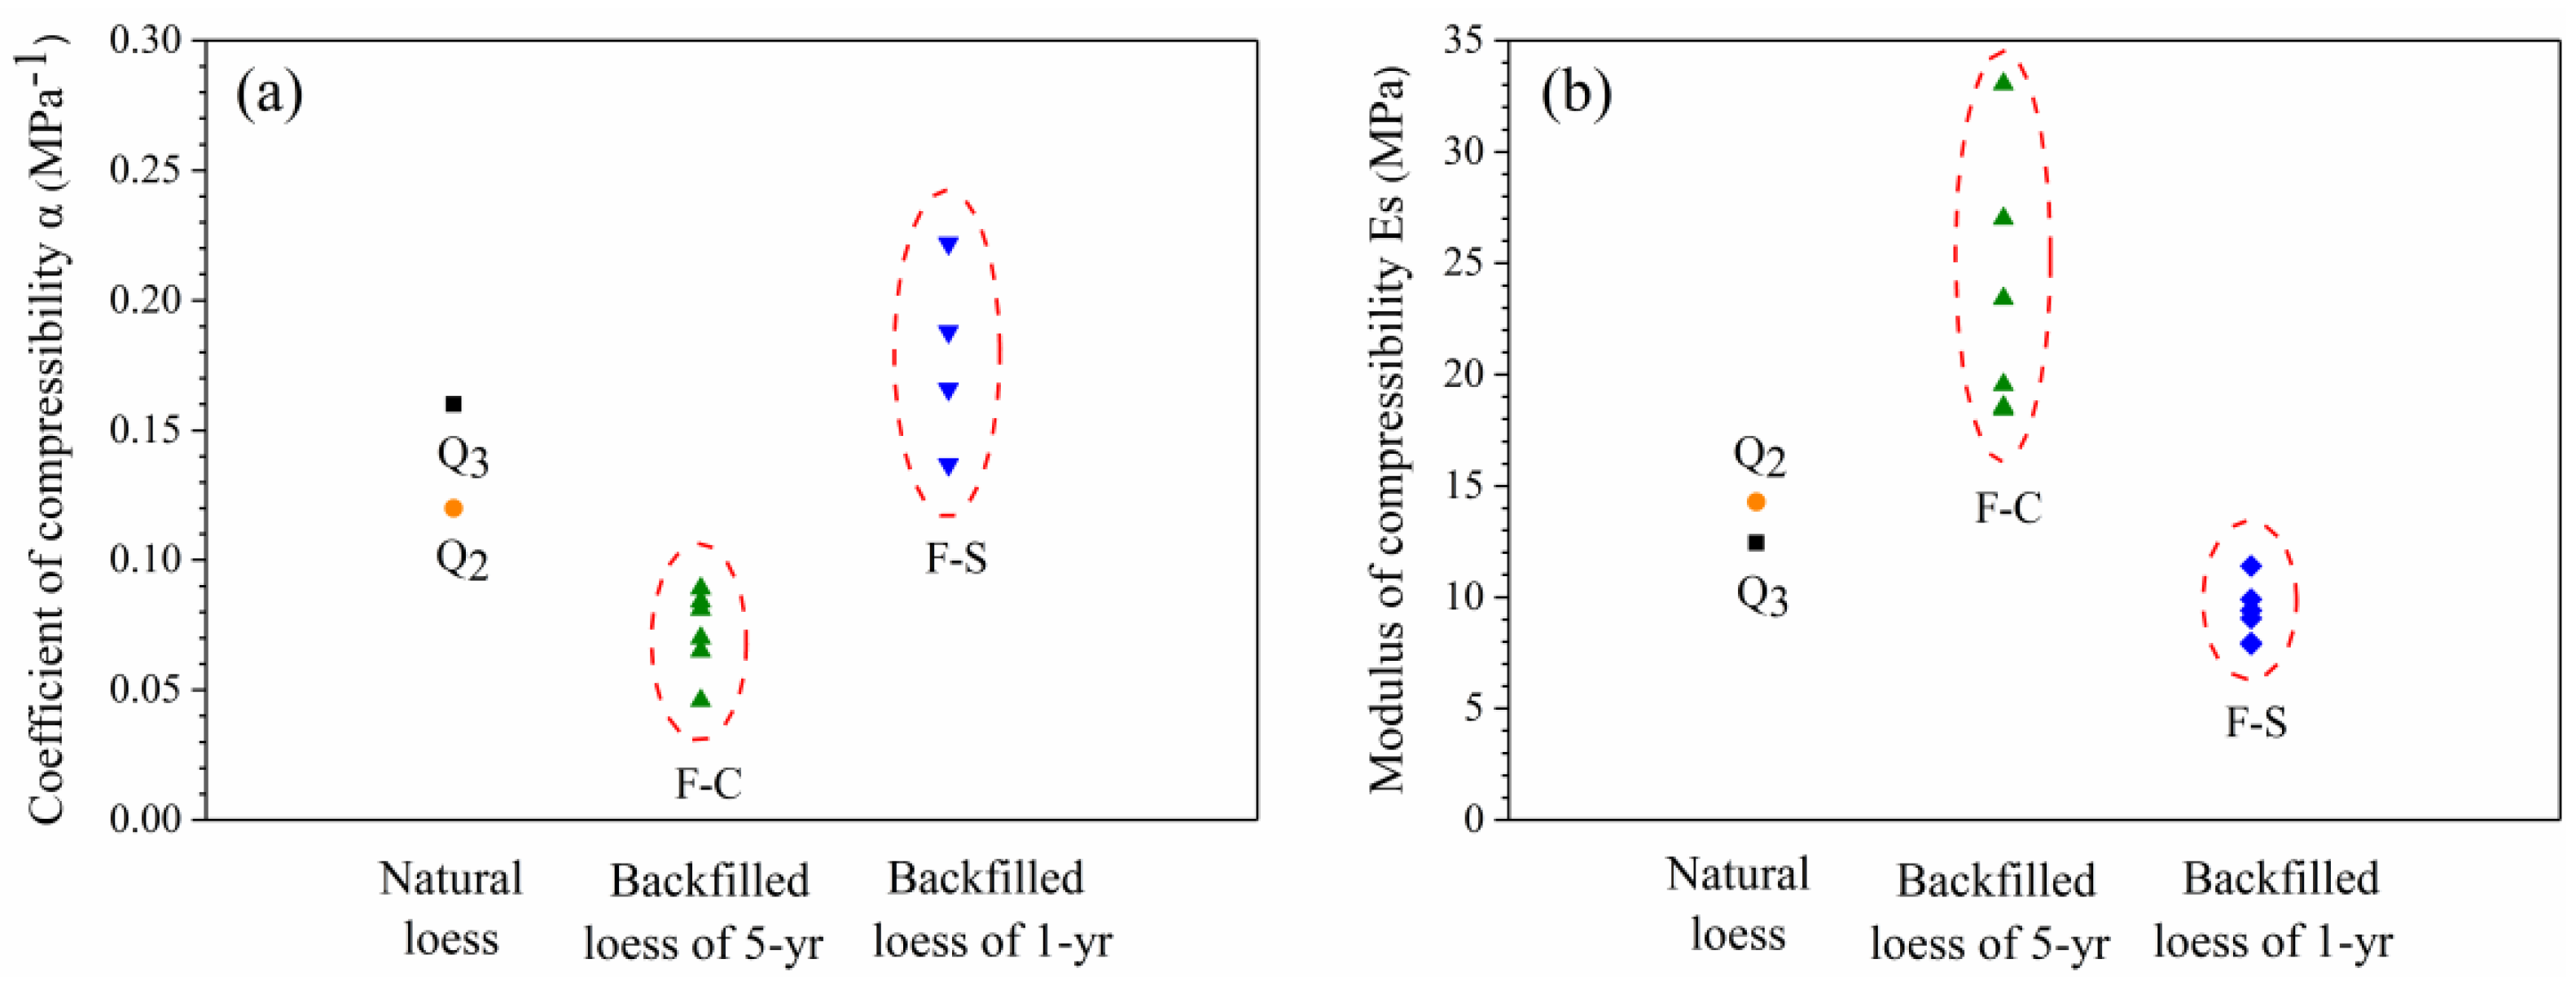
3.4. Compression Tests
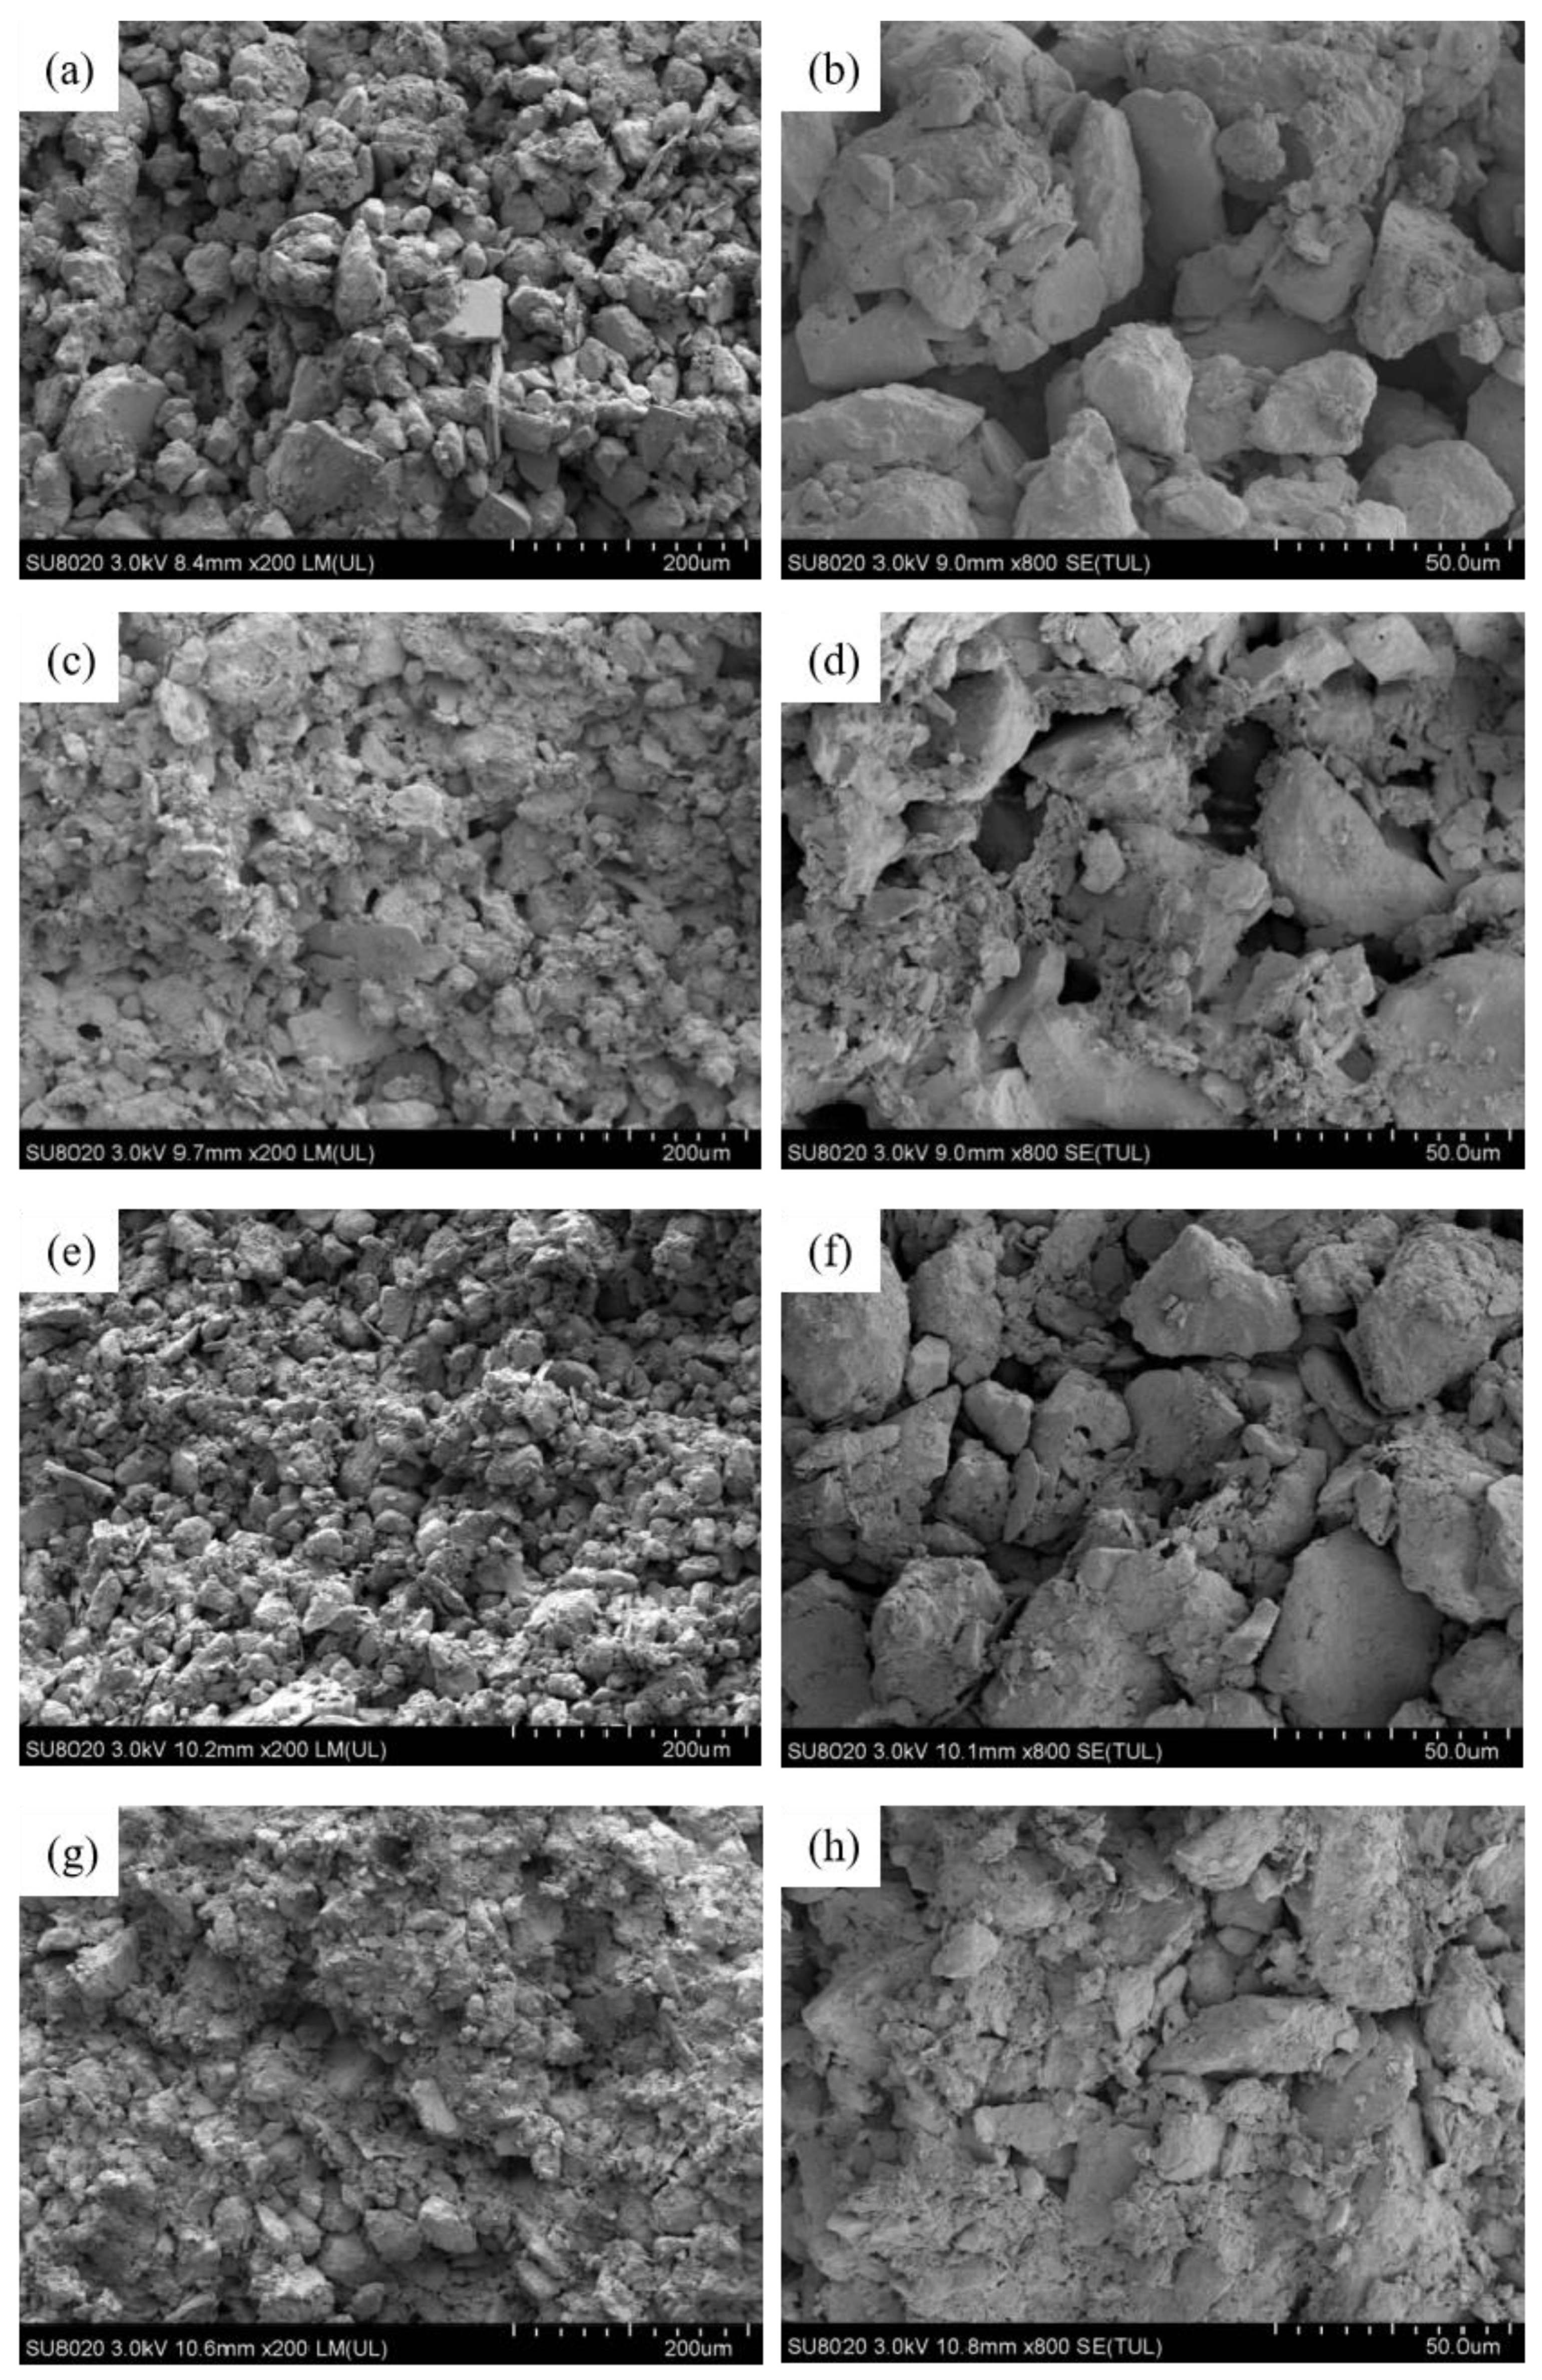
3.5. Scanning Electron Microscope Tests
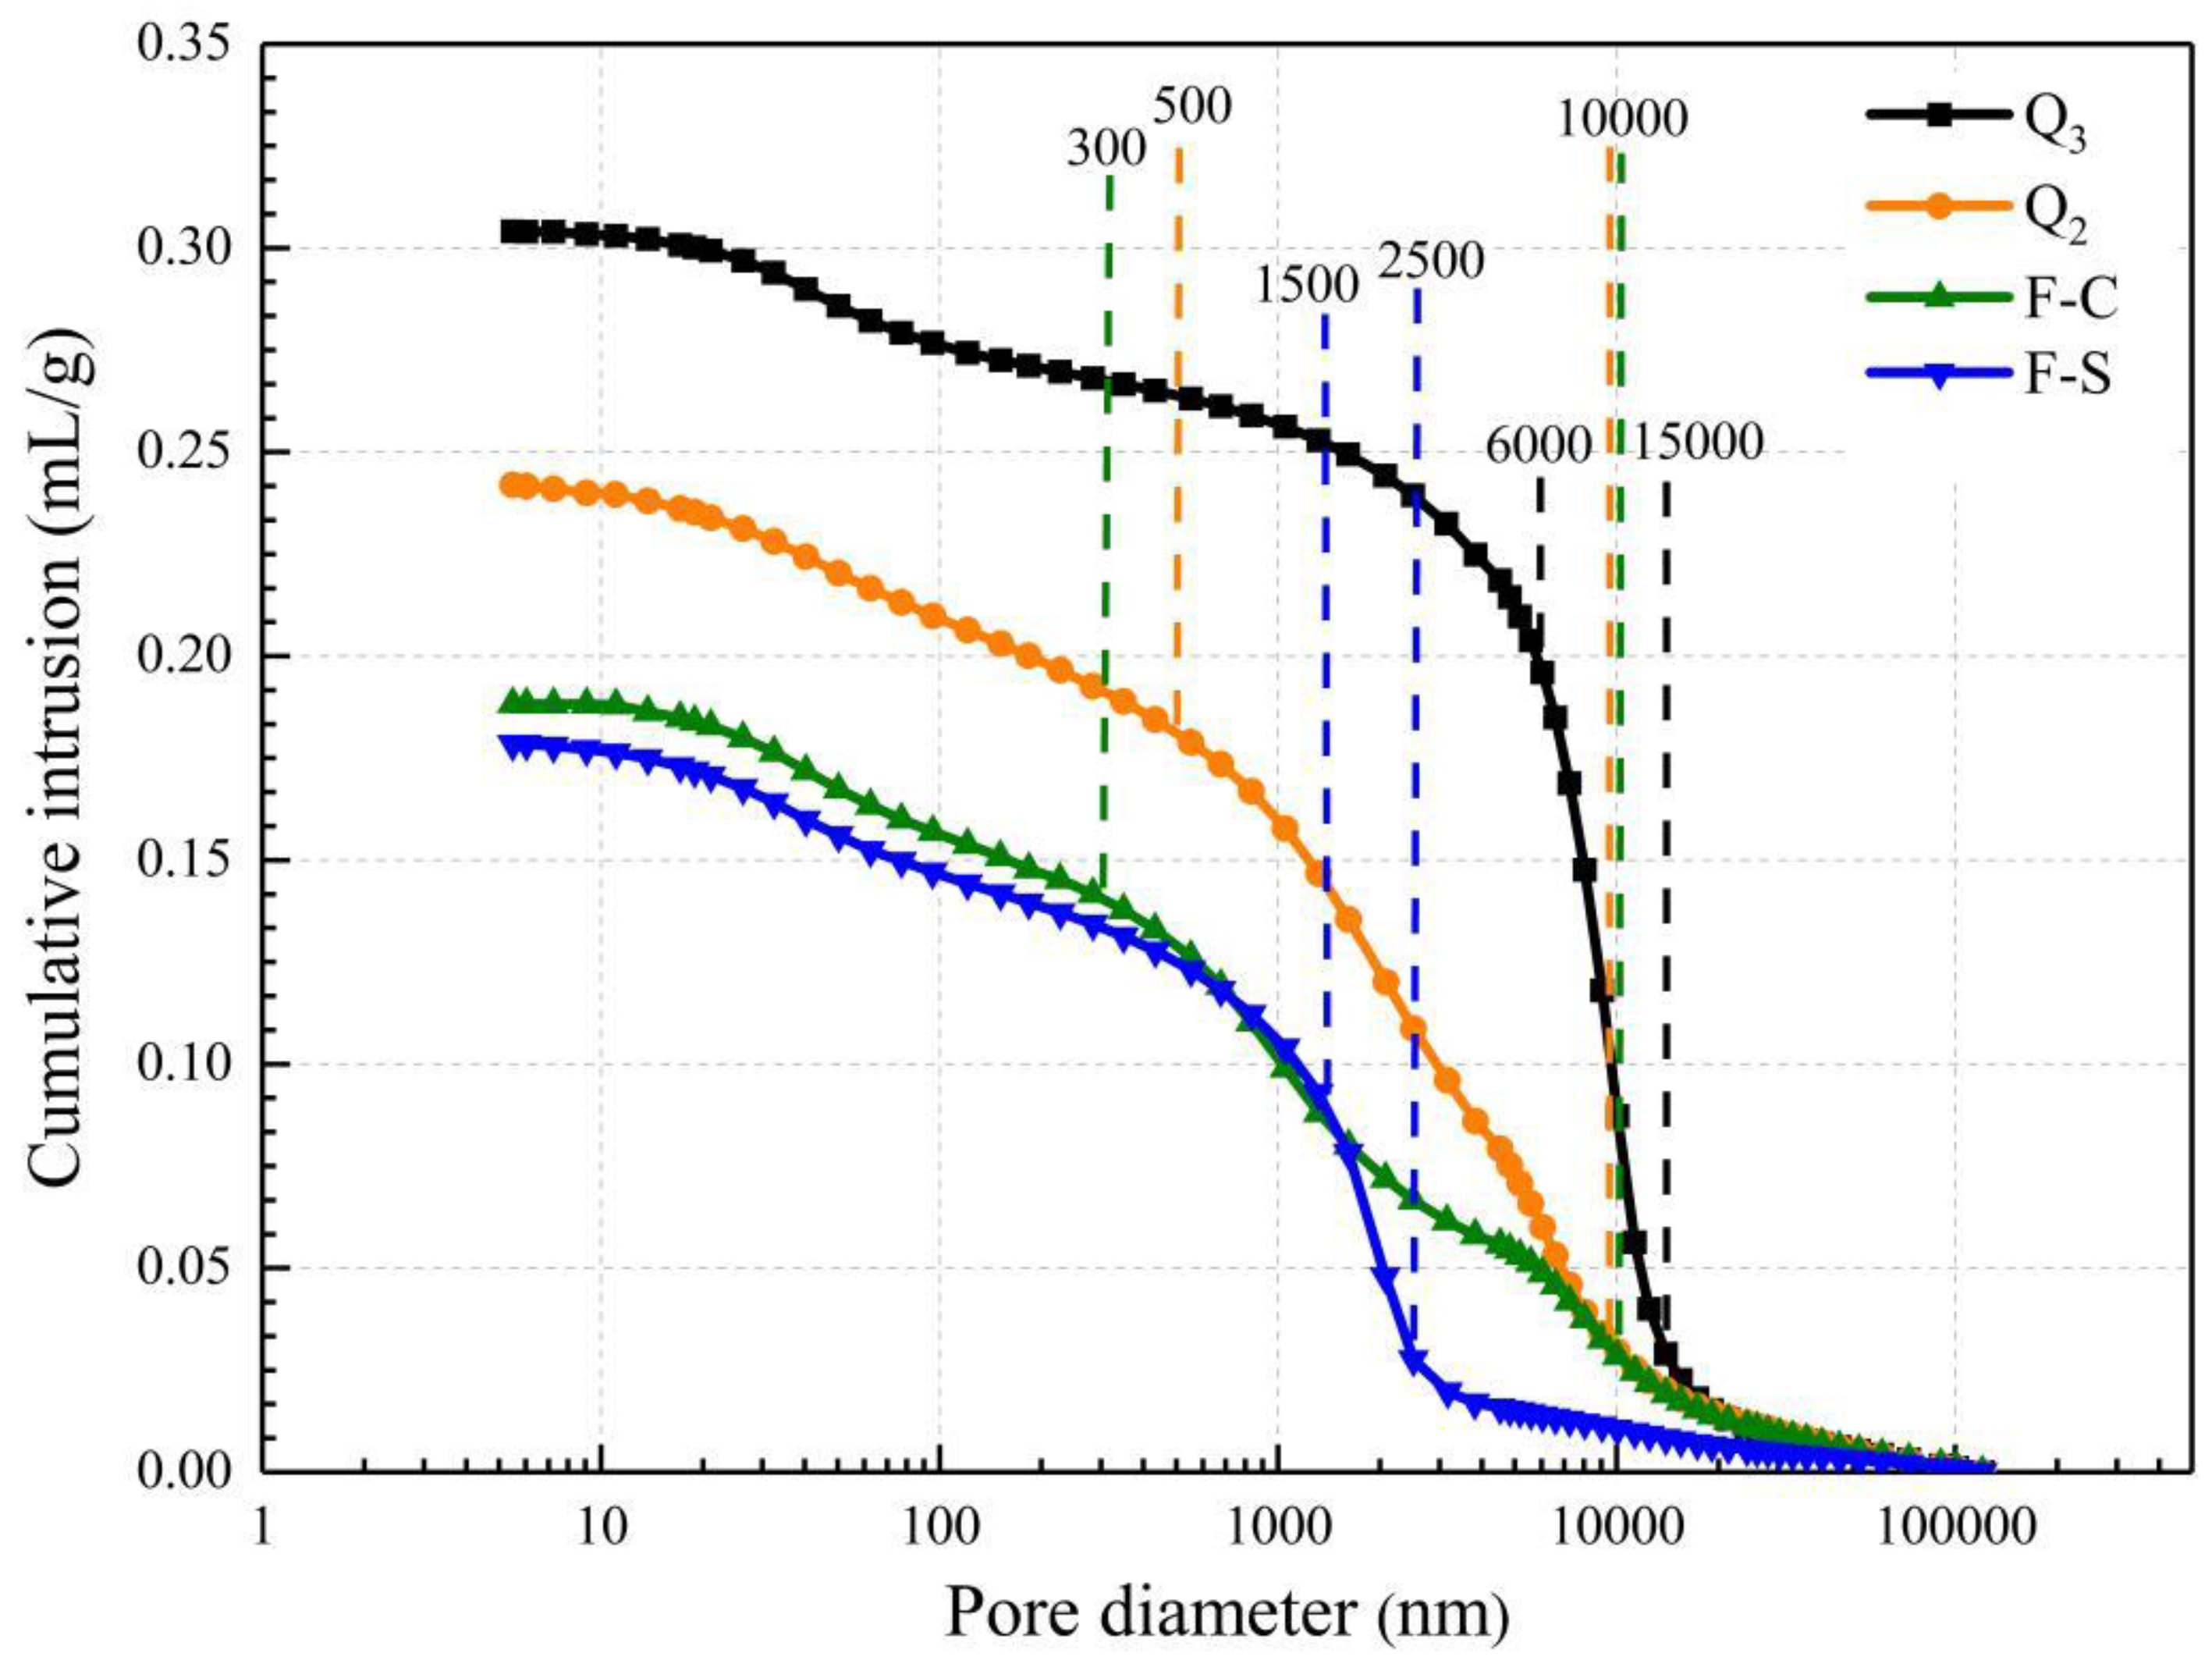
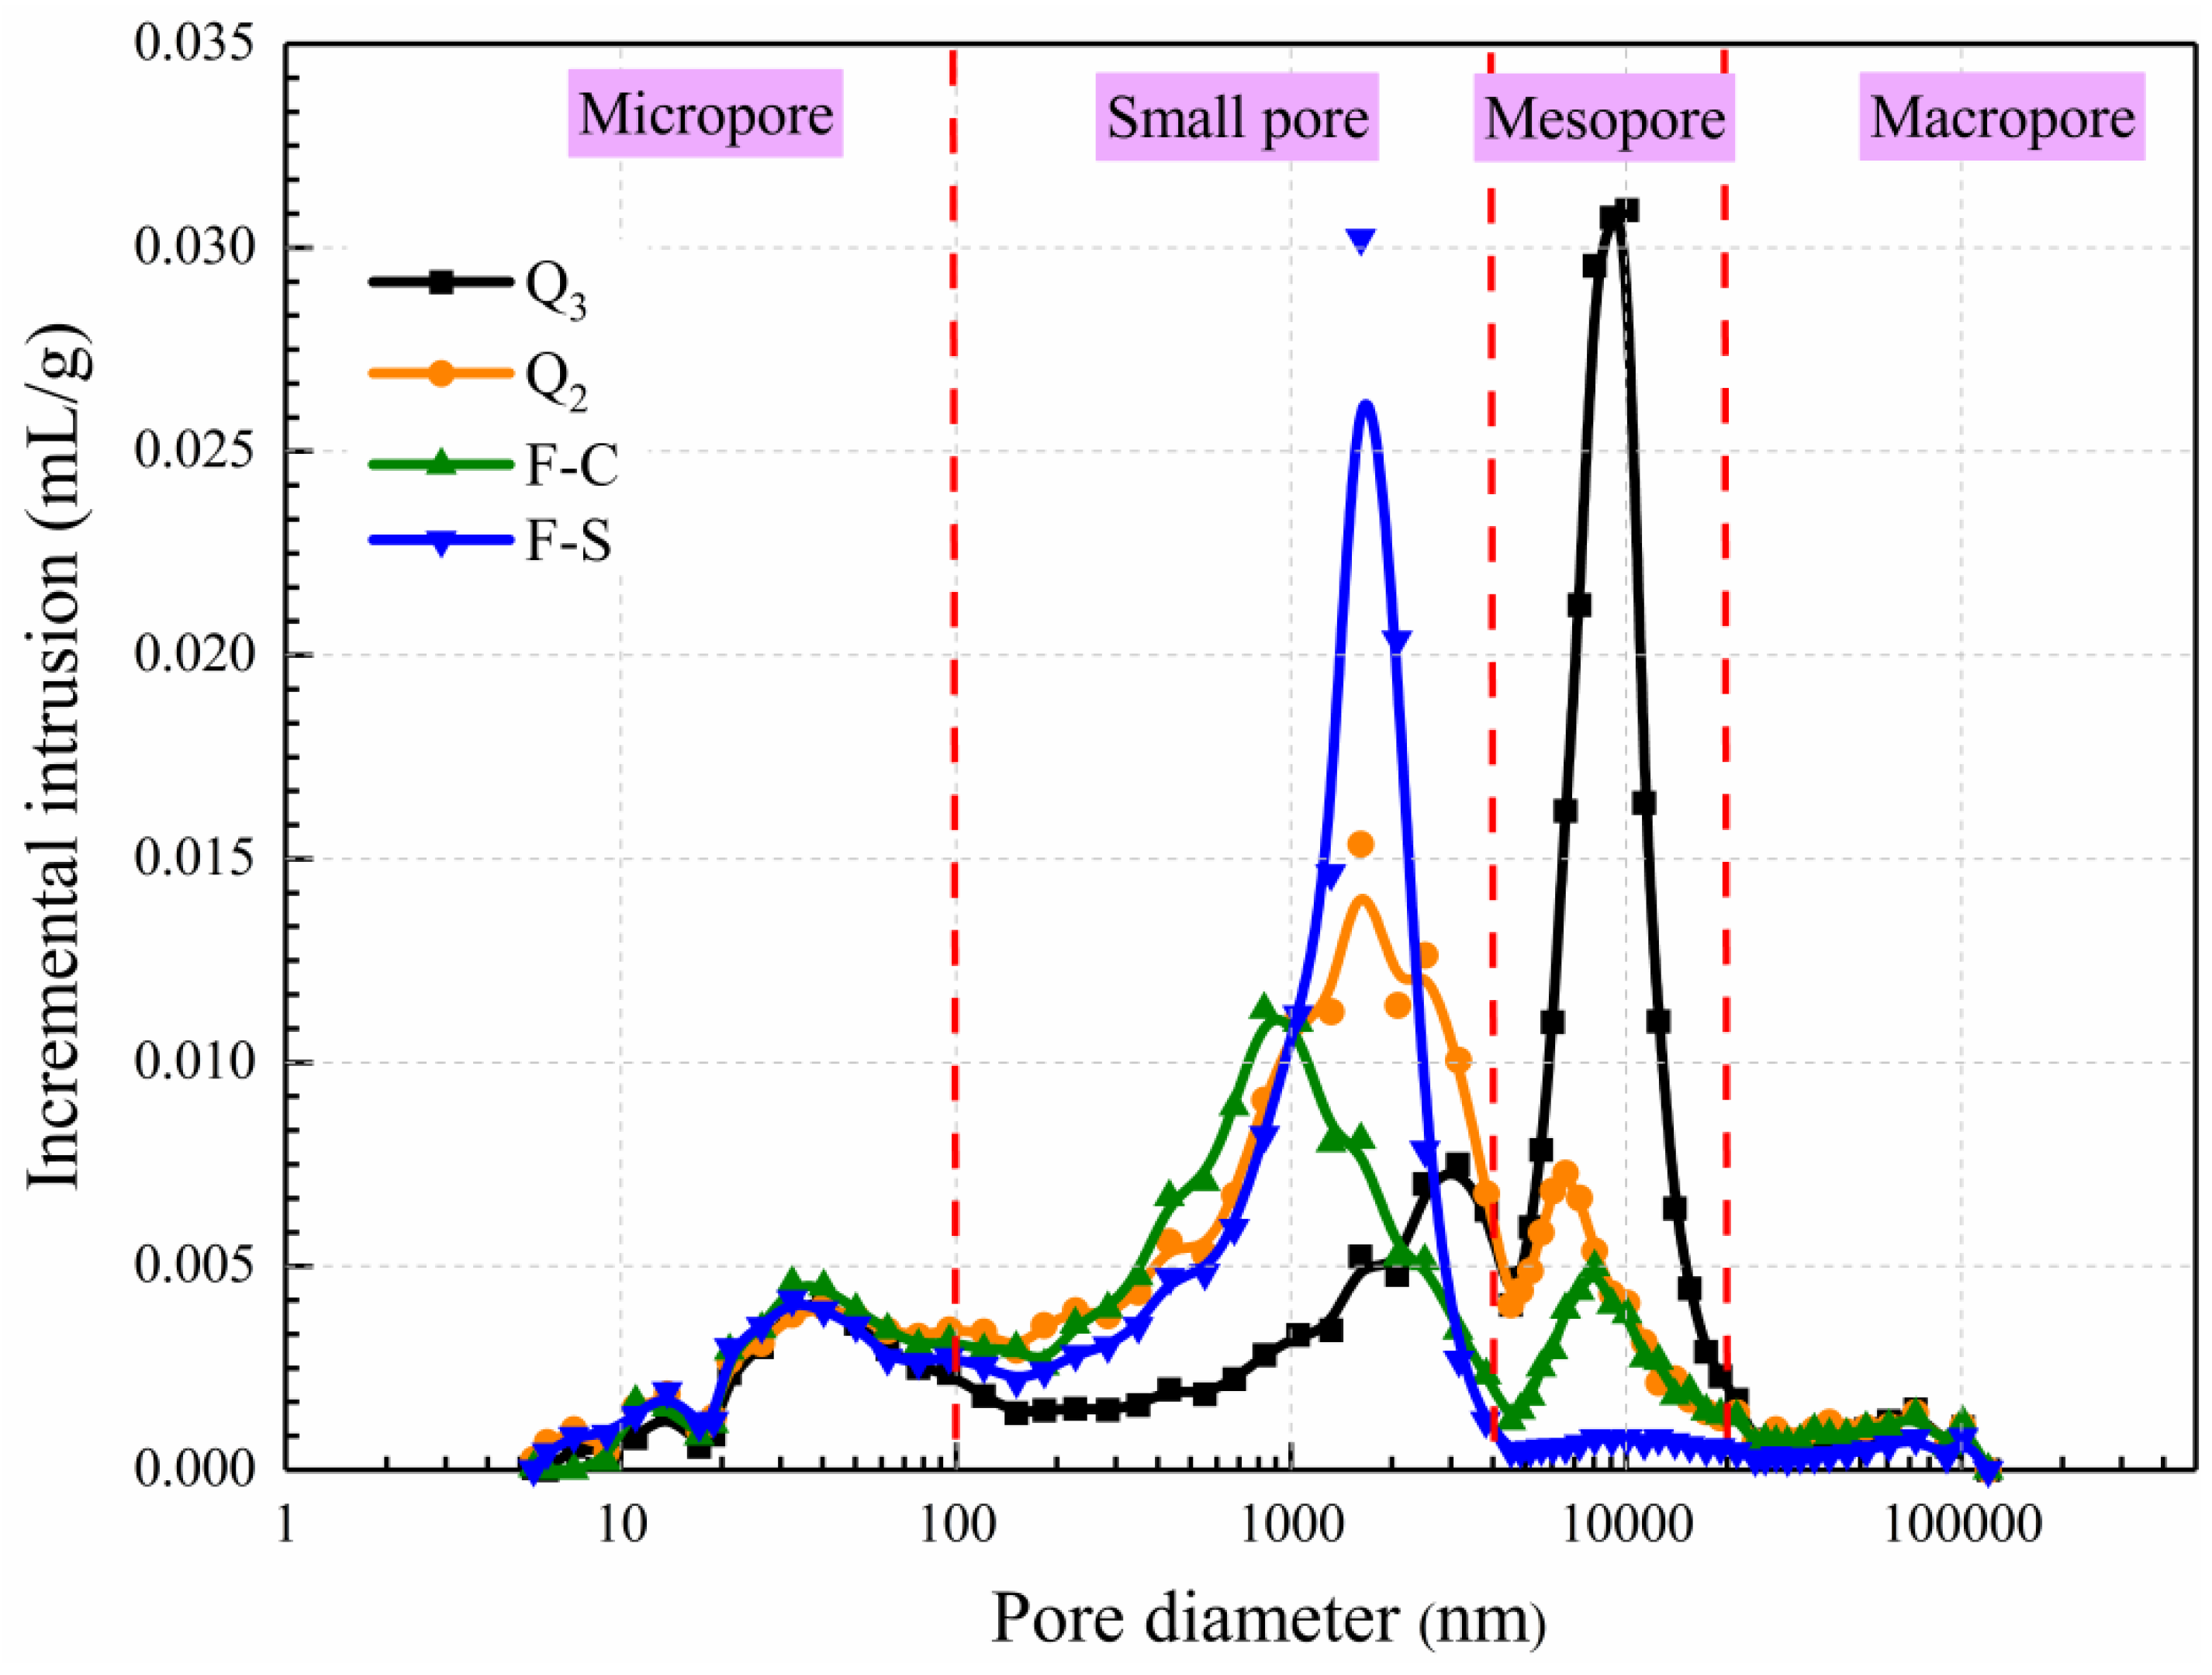
3.6. Mercury Intrusion Porosimetry Tests
4. Discussion
4.1. Analysis of Physical-Mechanical Properties
4.2. Analysis of Microstructural Characteristics
4.3. Suggestion for Gully Land Consolidation
5. Conclusions
Author Contributions
Funding
Acknowledgments
Conflicts of Interest
References
- Liu, T.S. Loess and Environment; Science Press: Beijing, China, 1985; pp. 5–10. [Google Scholar]
- Li, Y.H.; Du, G.M.; Liu, Y.S. Transforming the Loess Plateau of China. Front. Agric. Sci. Eng. 2016, 3, 181–185. [Google Scholar] [CrossRef] [Green Version]
- Fu, B.J. Soil erosion and its control in the loess plateau of China. Soil Use Manag. 1989, 5, 76–82. [Google Scholar] [CrossRef]
- Cai, Q.G. Soil erosion and management on the Loess Plateau. J. Geogr. Sci. 2001, 11, 53–70. [Google Scholar] [CrossRef]
- Liu, T.S. Loess Plateau & Agricultural Origin & Soil and Water Conservation; Seismological Press: Beijing, China, 2004; pp. 1–15. [Google Scholar]
- Su, Z.R.; Wang, J. Water conservation benefits’ analysis of eight key national rehabilitation areas. Soil Water Conserv. China 1992, 3, 1–4. [Google Scholar]
- Lü, Y.; Fu, B.; Feng, X.; Zeng, Y.; Liu, Y.; Chang, R.; Sun, G.; Wu, B. A policy-driven largescale ecological restoration: Quantifying ecosystem services changes in the Loess Plateau of China. PLoS ONE 2012, 7, e31782. [Google Scholar]
- Chen, Y.P.; Zhang, Y. Sustainable Model of Rural Vitalization in Hilly and Gully Region on Loess Plateau. Bull. Chin. Acad. Sci. 2019, 34, 708–716. [Google Scholar] [CrossRef]
- Xiao, J.F. Satellite evidence for significant biophysical consequences of the “Grain for Green” Program on the Loess Plateau in China. J. Geophys. Res. Biogeosci. 2014, 119, 2261–2275. [Google Scholar] [CrossRef] [Green Version]
- Li, S.; Yang, S.N.; Liu, X.F.; Liu, Y.X.; Shi, M. NDVI-based analysis on the influence of climate change and human activities on vegetation restoration in the Shaanxi-Gansu-Ningxia Region, Central China. Remote Sens. 2015, 7, 11163–11182. [Google Scholar] [CrossRef] [Green Version]
- He, C.X. How to develop modern agriculture in Yan ‘an on the basis of the Gully Reclamation Project. J. Yan’an Univ. (Soc. Sci.) 2013, 35, 3. [Google Scholar]
- Zhou, H.L.; Wang, W.Z.; Hao, Z.L. Gully Land Consolidation Benefits the People, Rebuild a Good South in North Shaanxi. Available online: http://www.igsnrr.ac.cn/xwzx/zhxw/201211/t20121116_3684668.html (accessed on 16 December 2015).
- He, C.X. The situation, characteristics and effect of the Gully Reclamation Project in Yan’an. J. Earth Environ. 2015, 6, 59–64. [Google Scholar]
- Liu, Q.; Wang, Y.; Zhang, J.; Chen, Y. Filling gullies to create farmland on the Loess Plateau. Environ. Sci. Technol. 2013, 47, 7589–7590. [Google Scholar] [CrossRef] [PubMed]
- Liu, Z.P.; Shao, M.A.; Wang, Y.Q. Large-scale spatial interpolation of soil pH across the Loess Plateau, China. Environ. Earth Sci. 2013, 69, 2731–2741. [Google Scholar] [CrossRef]
- Zhang, X.B.; Jin, Z. Gully land consolidation project in Yan’an is inheritance and development of wrap land dam project on the Loess Plateau. J. Earth Environ. 2015, 6, 261–264. [Google Scholar]
- Jin, Z. The creation of farmland by gully filling on the Loess Plateau: A double-edged sword. Environ. Sci. Technol. 2014, 48, 883–884. [Google Scholar] [CrossRef] [PubMed]
- Wei, H.A.; Wang, J.Y. Assessment of land consolidation suitability in Loess Hilly-gully Region in Yan’an City. Areal Res. Dev. 2013, 3, 129–132. [Google Scholar]
- Jin, Z.; Guo, L.; Wang, Y.; Yu, Y.; Lin, H.; Chen, Y.; Chu, G.; Zhang, J.; Zhang, N. Valley reshaping and damming induce water table rise and soil salinization on the Chinese loess plateau. Geoderma 2019, 339, 115–125. [Google Scholar] [CrossRef]
- Liu, Y.S.; Li, Y.R. Engineering philosophy and design scheme of gully land consolidation in Loess Plateau. Trans. Chin. Soc. Agric. Eng. 2017, 33, 1–9. [Google Scholar] [CrossRef]
- Gao, G.R. Study of the Microstructures and the Collapse Mechanism in Loess Soil from Lanzhou. J. Lanzhou Univ. 1979, 2, 123–134. [Google Scholar]
- Gao, G.R. Microstructure of loess soil in china relative to geologic environment. Acta Geol. Sin. 1984, 58, 265. [Google Scholar]
- Gao, G.R. The distribution and geotechnical properties of loess soils, lateritic soils and clayey soils in China. Eng. Geol. 1996, 42, 95–104. [Google Scholar] [CrossRef]
- Lei, X.Y.; Wang, S. Size of loess pores in relation to collapsibility. Hydrogeol. Eng. Geol. 1987, 31, 15–18. [Google Scholar]
- Zhao, J.B.; Chen, Y. Study on porosity and collapsibility of loess. J. Eng. Geol. 1994, 2, 76–83. [Google Scholar]
- Chen, Z.H.; Fang, X.W.; Zhu, Y.Q.; Qin, B.; Yao, Z.H. Research on meso-structures and their evolution laws of expansive soil and loess. Rock Soil Mech. 2009, 30, 1–11. [Google Scholar] [CrossRef]
- Jiang, M.J.; Hu, H.J.; Peng, J.B.; Leroueil, S. Experimental study of two saturated natural soils and their saturated remolded soils under three consolidated undrained stress paths. Front. Archit. Civ. Eng. China 2011, 5, 225–238. [Google Scholar] [CrossRef]
- Jiang, Z.K. Analysis of Stability and Slope Ratio Optimization of Excavated Slope of Gully Land Consolidation Project in the Loess Hilly Area: A Case Study of Nangou in Yan’an City. Master Thesis, Chang’an University, Xi’an, China, 2019. [Google Scholar]
- Ministry of Water Resources of the People’s Republic of China. Standard for Soil Test method GB/T 50123-1999; China Planning Press: Beijing, China, 1999. [Google Scholar]
- Washburn, E.W. Note on a method of determining the distribution of pore sizes in a porous material. Proc. Natl. Acad. Sci. USA 1921, 7, 115–116. [Google Scholar] [CrossRef] [PubMed] [Green Version]
- Li, T.L.; Fan, J.W.; Xi, Y.; Xie, X.; Hou, X.K. Analysis for effect of microstructure on SWCC of compacted loess. J. Eng. Geol. 2019, 27, 1019–1026. [Google Scholar] [CrossRef]
- Ehlers, W.; Wendroth, O.; De Mol, F. Characterizing pore organization by soil physical parameters. In Soil Struct; CRC: Boca Raton, FL, USA, 1995; p. 257. [Google Scholar]
- Gao, L.; Wang, B.; Li, S.; Wu, H.; Wu, X.; Liang, G.; Gong, D.; Zhang, X.; Cai, D. Degré, A. Soil wet aggregate distribution and pore size distribution under different tillage systems after 16 years in the Loess Plateau of China. CATENA 2019, 173, 38–47. [Google Scholar] [CrossRef]
- Venkatesh, B.; Lakshman, N.; Purandara, B.K.; Reddy, V.B. Analysis of observed soil moisture patterns under different land covers in Western Ghats, India. J. Hydrol. 2011, 397, 281–294. [Google Scholar] [CrossRef]
- Jia, Y.H.; Shao, M.A. Dynamics of deep soil moisture in response to vegetational restoration on the Loess Plateau of China. J. Hydrol. 2014, 519, 523–531. [Google Scholar] [CrossRef]
- Deng, L.; Yan, W.; Zhang, Y.; Shangguan, Z. Severe depletion of soil moisture following land-use changes for ecological restoration: Evidence from northern China. For. Ecol. Manag. 2016, 366, 1–10. [Google Scholar] [CrossRef]
- Frouz, J.; Livečková, M.; Albrechtová, J.; Chroňáková, A.; Cajthaml, T.; Pižl, V.; Háněl, L.; Starý, J.; Baldrian, P.; Lhotáková, Z.; et al. Is the effect of trees on soil properties mediated by soil fauna? A case study from post-mining sites. Ecol. Manag. 2013, 309, 87–95. [Google Scholar] [CrossRef]
- Kravchenko, A.N.; Guber, A.K. Soil pores and their contributions to soil carbon processes. Geoderma 2016, 287, 31–39. [Google Scholar] [CrossRef]
- Wang, H.; Yue, C.; Mao, Q.; Zhao, J.; Ciais, P.; Li, W.; Yu, Q.; Mu, X. Vegetation and species impacts on soil organic carbon sequestration following ecological restoration over the Loess Plateau, China. Geoderma 2020, 371, 114389. [Google Scholar] [CrossRef]
- Lei, X.Y. Pore classification and collapsibility of loess in China. Sci. China 1987, 12, 1309–1318. [Google Scholar]
- Osipov, V.I.; Sokolov, V.N. Factors and mechanism of loess collapsibility. In Genesis and Properties of Collapsible Soils; Derbyshire, E., Ed.; Proc. Workshop: Loughborough, UK, 1994; pp. 49–64. [Google Scholar]
- Yang, Y.L. Study on collapsible mechanism of loess. Sci. China 1988, 7, 756–766. [Google Scholar]
- Wei, Y.N.; Fan, W.; Yu, B.; Deng, L.S.; Wei, T.T. Characterization and evolution of three-dimensional microstructure of Malan loess. CATENA 2020, 192, 104585. [Google Scholar] [CrossRef]
- Zhou, J.Y.; Gu, B.J.; Schlesinger, W.H.; Ju, X.T. Significant accumulation of nitrate in Chinese semi-humid croplands. Sci. Rep. UK 2016, 6, 25088. [Google Scholar] [CrossRef] [PubMed] [Green Version]
- Song, X.L.; Gao, X.D.; Dyck, M.; Zhang, W.; Wu, P.T.; Yao, J.; Zhao, X.N. Soil water and root distribution of apple tree (Malus pumila mill) stands in relation to stand age and rainwater collection and infiltration system (RWCI) in a hilly region of the Loess Plateau, China. Catena 2018, 170, 324–334. [Google Scholar] [CrossRef]
- Liu, Z.; Ma, P.; Zhai, B.; Zhou, J. Soil moisture decline and residual nitrate accumulation after converting cropland to apple orchard in a semiarid region: Evidence from the Loess Plateau. Catena 2019, 181, 104080. [Google Scholar] [CrossRef]


| Soil Sample | Number | Moisture Content (%) | Density (g/cm3) | Specific Gravity | Dry Density (/cm3) | Porosity |
| Natural loess | Q3 | 9.7 | 1.50 | 2.70 | 1.37 | 0.97 |
| Q2 | 15.0 | 1.78 | 2.69 | 1.55 | 0.74 | |
| Backfilled loess of CSYZ | F-C-1 | 17.2 | 1.95 | 2.71 | 1.66 | 0.63 |
| F-C-2 | 18.4 | 1.77 | 2.71 | 1.49 | 0.81 | |
| F-C-3 | 16.8 | 1.85 | 2.71 | 1.58 | 0.71 | |
| F-C-4 | 17.1 | 1.84 | 2.71 | 1.57 | 0.72 | |
| F-C-5 | 17.2 | 1.94 | 2.71 | 1.66 | 0.64 | |
| F-C-6 | 16.5 | 1.87 | 2.71 | 1.61 | 0.69 | |
| Backfilled loess of SJG | F-S-1 | 20.4 | 2.08 | 2.73 | 1.73 | 0.58 |
| F-S-2 | 20.1 | 1.91 | 2.73 | 1.59 | 0.72 | |
| F-S-3 | 24.4 | 1.93 | 2.73 | 1.55 | 0.76 | |
| F-S-4 | 22.2 | 1.89 | 2.73 | 1.55 | 0.77 | |
| F-S-5 | 21.6 | 1.99 | 2.73 | 1.64 | 0.67 | |
| F-S-6 | 19.1 | 1.82 | 2.73 | 1.53 | 0.79 | |
| Soil Sample | Number | Saturation (%) | Liquid Limit | Plastic Limit | Plasticity Index | |
| Natural loess | Q3 | 26.87 | 17.8 | 27.6 | 9.8 | |
| Q2 | 54.68 | 17.1 | 28.0 | 10.9 | ||
| Backfilled loess of CSYZ | F-C-1 | 74.13 | 18.7 | 28.0 | 9.3 | |
| F-C-2 | 61.35 | 17.3 | 30.3 | 13.0 | ||
| F-C-3 | 64.04 | 18.0 | 27.8 | 9.8 | ||
| F-C-4 | 63.95 | 18.4 | 28.2 | 9.8 | ||
| F-C-5 | 73.15 | 17.4 | 25.8 | 8.4 | ||
| F-C-6 | 64.96 | 16.9 | 25.3 | 8.4 | ||
| Backfilled loess of SJG | F-S-1 | 95.98 | 17.6 | 26.0 | 8.4 | |
| F-S-2 | 76.57 | 16.4 | 24.8 | 8.4 | ||
| F-S-3 | 87.69 | 17.5 | 26.0 | 8.5 | ||
| F-S-4 | 79.21 | 17.6 | 26.1 | 8.5 | ||
| F-S-5 | 88.25 | 19.1 | 25.4 | 6.3 | ||
| F-S-6 | 66.30 | 19.5 | 25.8 | 6.3 |
| Soil Sample | Number | d60 μm | d50 μm | d30 μm | d10 μm | Cu | Cc |
|---|---|---|---|---|---|---|---|
| Natural loess | Q3 | 31.50 | 26.00 | 14.00 | 3.10 | 10.16 | 2.01 |
| Q2 | 28.00 | 23.00 | 11.00 | 2.90 | 9.66 | 1.49 | |
| Backfilled loess of CSYZ | F-C-1 | 27.50 | 21.50 | 10.00 | 2.70 | 10.19 | 1.35 |
| F-C-2 | 23.00 | 18.00 | 8.00 | 2.30 | 10.00 | 1.21 | |
| F-C-3 | 25.00 | 20.00 | 9.80 | 2.60 | 9.62 | 1.48 | |
| F-C-4 | 20.00 | 16.00 | 7.00 | 2.10 | 9.52 | 1.17 | |
| F-C-5 | 28.00 | 23.00 | 12.50 | 3.00 | 9.33 | 1.86 | |
| F-C-6 | 26.00 | 21.00 | 11.00 | 2.80 | 9.29 | 1.66 | |
| Backfilled loess of SJG | F-S-1 | 28.00 | 23.00 | 12.00 | 3.00 | 9.33 | 1.71 |
| F-S-2 | 28.00 | 23.00 | 12.00 | 3.00 | 9.33 | 1.71 | |
| F-S-3 | 29.50 | 24.00 | 13.00 | 3.00 | 9.83 | 1.91 | |
| F-S-4 | 26.00 | 20.00 | 10.00 | 2.70 | 9.63 | 1.42 | |
| F-S-5 | 28.00 | 22.00 | 12.00 | 2.90 | 9.66 | 1.77 | |
| F-S-6 | 27.00 | 21.00 | 10.00 | 2.70 | 10.00 | 1.37 |
| Soil Sample | Number | Normal Stress (kPa) | Shear Strength (kPa) | Cohesion (kPa) | Internal Friction Angle (°) |
|---|---|---|---|---|---|
| Natural loess | Q3 | 50 | 48.2 | 20.11 | 23.7 |
| 100 | 63.9 | ||||
| 150 | 75.3 | ||||
| 250 | 136.5 | ||||
| Q2 | 50 | 67.0 | 34.51 | 28.8 | |
| 100 | 80.9 | ||||
| 150 | 120.5 | ||||
| 250 | 172.9 | ||||
| Backfilled loess of CSYZ | F-C-4 | 50 | 40.2 | 13.61 | 31.0 |
| 100 | 63.6 | ||||
| 150 | 121.4 | ||||
| 250 | 157.0 | ||||
| Backfilled loess of SJG | F-S-2 | 50 | 53.2 | 18.64 | 33.8 |
| 100 | 85.19 | ||||
| 150 | 118.3 | ||||
| 250 | 187.2 |
| Number | Q3 | Q2 | F-C-1 | F-C-2 | F-C-3 | F-C-4 | F-C-5 | F-C-6 | |
| α | MPa−1 | 0.16 | 0.12 | 0.08 | 0.07 | 0.08 | 0.07 | 0.09 | 0.05 |
| ES | MPa | 12.45 | 14.30 | 19.55 | 27.00 | 18.45 | 23.40 | 18.55 | 33.05 |
| Number | F-S-1 | F-S-2 | F-S-3 | F-S-4 | F-S-5 | F-S-6 | |||
| α | MPa−1 | 0.14 | 0.19 | 0.38 | 0.22 | 0.17 | 0.22 | ||
| ES | MPa | 11.40 | 9.05 | 9.40 | 7.90 | 9.90 | 7.95 | ||
| Type of Loess | Volume Percentages (%) | |||
|---|---|---|---|---|
| Macropores (>20 μm) | Mesopores (4–20 μm) | Small Pores (0.1–4 μm) | Micropores (<0.1 μm) | |
| Q3 | 4.3 | 67.5 | 18.3 | 9.9 |
| Q2 | 6.1 | 26.6 | 52.5 | 14.8 |
| F-C | 6.7 | 22.8 | 51.7 | 19.9 |
| F-S | 3.4 | 5.5 | 71.7 | 19.5 |
© 2020 by the authors. Licensee MDPI, Basel, Switzerland. This article is an open access article distributed under the terms and conditions of the Creative Commons Attribution (CC BY) license (http://creativecommons.org/licenses/by/4.0/).
Share and Cite
Ma, L.; Qi, S.; Zheng, B.; Guo, S.; Huang, Q.; Yu, X. Farming Influence on Physical-Mechanical Properties and Microstructural Characteristics of Backfilled Loess Farmland in Yan’an, China. Sustainability 2020, 12, 5516. https://doi.org/10.3390/su12145516
Ma L, Qi S, Zheng B, Guo S, Huang Q, Yu X. Farming Influence on Physical-Mechanical Properties and Microstructural Characteristics of Backfilled Loess Farmland in Yan’an, China. Sustainability. 2020; 12(14):5516. https://doi.org/10.3390/su12145516
Chicago/Turabian StyleMa, Lina, Shengwen Qi, Bowen Zheng, Songfeng Guo, Qiangbing Huang, and Xinbao Yu. 2020. "Farming Influence on Physical-Mechanical Properties and Microstructural Characteristics of Backfilled Loess Farmland in Yan’an, China" Sustainability 12, no. 14: 5516. https://doi.org/10.3390/su12145516