Employment and Gross Value Added in Agriculture Versus Other Sectors of the European Union Economy


Department of Finance and Accounting, Faculty of Economics and Social Sciences, Poznan University of Life Sciences, Wojska Polskiego 28, 60-637 Poznan, Poland
Sustainability 2020, 12(14), 5518; https://doi.org/10.3390/su12145518
Submission received: 31 May 2020
/
Revised: 3 July 2020
/
Accepted: 4 July 2020
/
Published: 8 July 2020
(This article belongs to the Collection Sustainable Development of Rural Areas and Agriculture)
Abstract
:The aim of the paper is to recognize the level of employment and gross value added (GVA) in agriculture in relation to the other sectors of the European Union economy. The following research tasks were formulated: analysis of employment levels and GVA in the sectors of economy in 2000 and 2018 as well as the relationship between employment and GVA, assessment of GVA per 1 person employed in the investigated sectors and its changes in the analysed years, and assessment of the scale of surplus employment in agriculture assuming that GVA per 1 person employed in this sector would be equal to the average level reached in the industry and the services sectors. Comparative analysis and the deduction method were used in the study. Correlation coefficients between the level of employment in individual sectors and GVA per 1 person employed in the time series covering the years 2000–2008 were also calculated. A new measure of the “goal” of employment reduction in agriculture has been proposed, related to the measurement of the distance between agriculture and other sectors in terms of GVA generated per 1 employed—the Excess Employment Rate In The Agricultural Sector (EERAS). The research was based on EUROSTAT data from the years of 2000 and 2018. The process of changes in the sectoral structure of employment will probably be determined by the growth rate of demand for services, structural adjustment referring to matching the characteristics of the agricultural population to the demand for labour force in the services sector and the pace of structural transformations in rural areas. Rationalisation of employment levels in agriculture promotes improvement of its economic and social sustainability. Instruments based on financial transfers from nonagricultural sectors to agriculture should play a secondary role, since they are a burden to more efficient sectors, and in the long term, they may hinder reduction of employment in agriculture. However, due to the inevitable differences in productivity observed between agriculture and the nonagricultural sectors, at a technologically, economically, ecologically and socially justified level of employment in agriculture, transfers of the surplus generated in the secondary and tertiary sectors need at least to reduce, if not eliminate, economic consequences of these differences.
1. Introduction
Utilisation and allocation of inputs is a major problem in economics. Its essence was presented in a universal and comprehensive manner by Adam Smith [1]: “As every individual, therefore, endeavours as much as he can both to employ his capital in the support of domestic industry, and so to direct that industry that its produce may be of the greatest value; every individual necessarily labours to render the annual revenue of the society as great as he can. He generally, indeed, neither intends to promote the public interest, nor knows how much he is promoting it.” Without these words by Smith, it may be difficult to imagine not only the development of classical economics, but first of all, schools of thought constructed in opposition to it. Utilisation of inputs as associated with the public good is a fundamental issue in the generation of wealth of nations, with differences between the economic schools concerning not only this ultimate goal, i.e., the best possible utilisation of these inputs and general welfare, but also the paths and methods used to reach this goal. Also, the concept of sustainable development generally is in line with this approach, although it also comprises the concept of economic degrowth. Nevertheless, if we assume a justification to this concept to consist in the protection of natural resources and environmental governance on the global scale, it may be concluded that even the concept of economic degrowth does not contradict the line of thought presented by Adam Smith, provided the global point of reference and an adequately long period of analysis are adopted [2,3,4].
Among all inputs, land is the most constant and least adaptable to changing economic conditions. This is because land may not be transferred to another location, its productivity may not be rapidly increased and the manner of its utilisation may not be modified indefinitely. This is compounded by the fact that, apart from the primary function served in the food production process, it also serves natural and cultural functions [5]. The other inputs are much more flexible and mobile. At present, we observe rapid capital flows, not only within national economies, but also on the international scale, striving to reach the highest rate of return from investments [6,7,8]. Labour resources and the related human capital are less mobile than financial capital, but also are partly flexible in relation to changes in demand on the market (in this case, particularly the labour market), moving first towards employment and secondly towards maximisation of benefits (both financial and nonfinancial) from labour [9,10]. It needs to be stressed here that, in practice, nonfinancial (nonwage) benefits at the aggregate scale may not be attained without wage benefits. Financial safety of households, personal development, caring for personal health and welfare, personal education or education for one’s children, leisure and recreation are related with the disposable income of the worker’s household. If it is impossible to obtain a “fair” income from one’s productivity, the only solution would be to supplement this income through redistribution or to change jobs [11].
According to the three-sector model, within the national economy of every country, we may distinguish the primary sector including agriculture, the secondary sector such as industry and the tertiary sector (services) [12,13,14]. It is assumed that the contribution of each of these sectors to GDP and the employment structure indicates the level of economic development of a given country and has a significant impact on its modernity and competitiveness, and consequently to a considerable extent also affluence and the standard of living of the population. Economic development and human progress first lead to a decreased role of agriculture (as the primary sector), replaced by the increasing role of industry (the secondary sector), followed by a reduced role of agriculture and industry caused by the growing importance of the services sector, i.e., the tertiary sector [15]. This is justified, among other things, by the higher labour and capital productivity in industry and services, but it is also a consequence of changes in social attitudes [16,17] such as the evolution from homo oeconomicus to homo sustinens [18,19,20]. In the case of land, productivity increases at a slower rate than the productivity of labour and capital outside agriculture. Through an appropriate identification of the course of this process, the information gap between the supply and demand sides of the labour market may be reduced. This will facilitate rational decisions made by participants in the labour market but may also prove helpful for entities determining the economic policy, particularly the labour market and agricultural policies. It may prove useful, especially to estimate the scale of excess employment in the agricultural sector of individual countries, as well as differences between them in this respect.
Thus, it is advisable to provide a picture of the employment levels in individual sectors of the economy and the value added they generate, which, in the opinion of the author, should be the first (i.e., particularly before financial transfers) source of earnings for labour, especially in such a specific sector as agriculture. Thus, the aim of the paper is to recognize the level of employment and gross value added in agriculture in relation to the other sectors of the European Union economy. The following research tasks were formulated:
- analysis of employment levels and GVA in the sectors of the economy in 2000 and 2018 as well as the relationship between employment and GVA;
- assessment of GVA per 1 person employed in the investigated sectors and its changes in the analysed years;
- assessment of the scale of surplus employment in agriculture, assuming that GVA per 1 person employed in this sector would be equal to the average level reached in the secondary and tertiary sectors.
Analyses were conducted on aggregates composed of the EU-17 (Belgium, Denmark, Germany, Ireland, Greece, Spain, France, Italy, Cyprus, Luxembourg, Malta, Netherlands, Austria, Portugal, Finland, Sweden and the United Kingdom) and EU-11 (Bulgaria, Czechia, Estonia, Croatia, Latvia, Lithuania, Hungary, Poland, Romania, Slovenia and Slovakia) countries as well as individual countries belonging to these aggregates. The considerations presented in the paper are an expansion of the author’s works from 2016 and 2018 [21,22,23,24,25], regarding GVA in the sectors of the economy and excessive employment (hidden unemployment) in agriculture. The research falls into discussion on the development and territorial cohesion of rural areas of the European Union and promoting sustainable agriculture [26,27,28,29,30,31,32,33,34,35,36,37,38,39,40]. A new measure of the “goal” of employment reduction in agriculture has been proposed, related to the measurement of the distance between agriculture and other sectors in terms of GVA generated per 1 employed—the Excess Employment Rate In The Agricultural Sector (EERAS). In addition to the informative value, due to its synthetic form, it can be valuable for future analyses including econometric modelling of the phenomena described in the article.
2. Background and Literature Review
The research problem presented in the Introduction may be considered within three parallel aspects. Firstly, allocation of labour resources in sectors characterised by higher productivity contributes to economic growth and increased national wealth. Secondly, efficient allocation processes reduce imperfection of information for participants in the labour market, promote rational decisions on the labour supply and demand, reduce search costs related to labour supply and demand, while this may indirectly limit the intensity of adverse phenomena on this market (cf. 40). Thirdly, the intersectoral optimisation of employment facilitates social and economic convergence of agriculture [15]. If labour resources engaged in this sector are excessive from the technological point of view (some persons employed may cease working with no deterioration of the production volume and quality) or from the economic point of view (low income per 1 person employed, resulting from low productivity of the sector), then the “release” of this surplus outside agriculture will be beneficial in terms of both economic and social convergence.
Optimisation of the employment level ensuring the highest possible efficiency is beneficial to all participants in the labour market. According to the assumptions of the Pigou effect theory, workers aim to equalise the utility value of wages with marginal nuisance of work. In turn, employers aim at equalising the actual wage rate with marginal productivity of labour [41]. These assumptions determine changes in the supply of labour as an increasing function of actual wages and in the demand for labour as a decreasing function of actual wages [42]. The mutual impact of these opposing forces results in the establishment of the equilibrium wage at specific levels of employment and unemployment [43,44,45,46,47,48]. Processes leading to the establishment of this equilibrium may affect the entire economy, but they are specific also to its selected elements. They act on flows of labour between employment, unemployment and occupational inactivity [49], on flows within the employment level in individual countries or regions as well as international flows of labour towards greater efficiency and higher wages [50,51]. In this sense, labour resources behave similarly to capital resources. The described processes take place also between the sectors of the economy. Search for a better, more effective allocation has to lead to transfers of labour resources to sectors of higher efficiency than in the initial situation. In the case of intersectoral flows, we may hardly talk of losses for the sectors, in which employment is reduced. In contrast to international allocation, an increase in employment in more efficient sectors at the expense of less efficient sectors brings benefits to the entire national economy and, as a consequence, also sectors “releasing” labour force. More efficient sectors thanks to a growth in employment may increase the volume of generated GVA, while less efficient sectors thanks to a reduction in employment decrease labour costs and experience an incentive to implement technological and organisational rationalisation of their operations.
A greater productivity of the industry and services sectors means that labour and capital engaged there generate a greater value added than in agriculture, thus reduced employment in agriculture to benefit these sectors stimulates growth and development processes in the entire national economy [22]. If a part of labour resources is not efficiently utilised, from the point of view of production capacity of the economy, this part may be treated as unemployed, although this unemployment is not indicated in statistics (hidden unemployment) [25]. Allocation of labour resources towards more efficient sectors of the economy through a reduction of hidden unemployment leads to a rationalisation of both the employment rate and unemployment rate. Thanks to the generally beneficial impact on the economy, it also results (in the case of unemployment exceeding the natural level) in the approximation of the unemployment level to its natural rate, and this, in turn, according to the Okun law [52,53,54,55], reduces the gap between the actual and the potential product. The actual unemployment rate typically progresses to the level of equilibrium unemployment (natural unemployment), irrespective of the type of definition employed—in the case of the cited Okun law, the closest approximation will be provided by the Non-Accelerating Inflation Rate of Capacity Utilization (NAIRCU). However, over the long period, also the equilibrium unemployment rate may follow the actual unemployment rate [49,56,57]. Thus, if optimisation processes for the allocation of labour resources last sufficiently long to be considered the Keynesian “long period,” the level of natural unemployment will also decrease. This, in turn, will facilitate further optimisation in the utilisation of the labour input (as well as capital), an increase in GVA generated in the economy and a reduction of actual unemployment.
The intersectoral optimisation of allocation of labour resources is important also in view of the paradigm to strive towards sustainable development. The concept of sustainable development in relation to agriculture covers three aspects: economic, social and environmental [23,24,58]. Experiences of developing countries indicate that elimination of any of the sustainability aspects in the long run leads to the generation of excessive costs in all the three abovementioned spheres and to a deficiency of agriculture as a sector responsible for food production. Sustainability is observed only when agricultural production utilises capital, labour and environmental resources in a manner optimal from the point of both the present and the future [59]. Excessive employment prevents realisation of economic sustainability goals and hinders efforts to reach social objectives, while it fails to preserve undeteriorated environmental resources [23]. The relatively low efficiency in the utilisation of the labour input in relation to the secondary and tertiary sectors is reflected in the level of agricultural income in the EU countries. Studies conducted by Zawalińska et al. [60] indicated that, in the years 2000–2013, agricultural income was growing in absolute terms together with economic development, while it was decreasing in the GDP structure, whereas the increase in agricultural income in absolute terms resulted partly from Common Agricultural Policy (CAP) subsidies and direct payments. This means that, despite positive changes in productivity of agriculture, the productivity of inputs was increasing faster in industry and services [61]. Moreover, within agriculture this phenomenon was also diversified, with positive changes in employment and efficiency as well as agricultural income being slower in smaller farms [62,63,64]. This problem was also observed earlier, and its causes were different in the socialist and capitalist countries. Czyżewski [65] reported that the disparity in the socialist economy was caused by the efforts to ensure low costs of living for workers in the socialist economy, necessary to support industrialisation at low economic efficiency of labour in the socialist industry sector. Since it was impossible to provide adequate wages to workers, low and regulated food prices were enforced. It may be assumed that this was the case in all the former Council for Mutual Economic Assistance countries. In contrast, in capitalist countries, such a disparity resulted (similarly as it is at present) from the lower productivity of inputs in agriculture compared to the secondary and tertiary sectors (i.e., industry and services). Reduction of the income disparity for farmers is a necessary element in the attempts to reach the Pareto sustainable agriculture [24,58], since it constitutes an element in the economic dimension of this process, while indirectly (due to the effect of higher incomes on the quality and standard of living in rural areas) it also modifies its social aspect. However, sustainability in the economic sense may not be observed if the principle that (primarily) input productivity finances earnings is not respected [22]. Thus, in reference to agriculture, it seems justified to search for the potential to finance incomes of people employed in this sector first from its productivity, and only subsequently transfers of resources earned by the other sectors may be considered. In view of the limited potential described in literature to increase the surplus generated by agriculture, the method to minimise income disparity of farmers is first of all to reduce employment in the agricultural sector, particularly in the countries with the highest share of employment in agriculture in the total workforce employed in the national economy, and to further optimise the production structure as well as the utilisation of land and capital resources [21].
Excessive employment hinders an increase in labour productivity in agriculture [66], particularly in view of the limitations imposed by the natural environment, as well as market and institutional barriers, while it also prevents the attainment of economic sustainability in agriculture [23]. At the limited potential to reach an increase in agricultural production and its profitability, to a considerable extent this parameter determines the level of farmers’ income, since it determines the number of people, between whom the income from agricultural production will be divided. Excessive resources of labour in agriculture discourage any efforts to modernise the production process, since investments or use of services are frequently economically less attractive compared to the utilisation of the cheap (low-paid) labour resources, particularly if it is the labour of the farmers with the assistance of their family members, whereas increasing its input does not lead to changes in the actual costs incurred [15]. The number of individuals in the farmer’s household is relatively stable, and the actual participation of some or all the household members in the production process does not change the fact that the total income resources from the farm are divided between the household members, or the number of people, between which this income needs to be divided. Obviously, this is a conservative—and in the long run irrational—farm management strategy; its adoption may result from a lack of knowledge, qualifications, capital or no opportunities to gain employment outside the farm. Moreover, it may be assumed that, as it was described by Rembisz [67] and Góral and Rembisz [68], due to financial transfers within the CAP the overestimation of labour wages in agriculture in relation to its productivity slows down the release of excess employment resources from agriculture, and in the long run, preserves the structural foundations for the income disparity of farmers compared to the workforce employed outside agriculture (even if over a short time period it may reduce this disparity) [21]. As it was reported by Guth et al. [69] based on a study conducted on data from the years 2005–2015 concerning all the EU countries, thanks to the CAP support, the average income of farms became comparable to the average level of income outside agriculture, which indicates an advantageous effect of the CAP on the economic stability of the agricultural sector. At the same time, those authors observed that the distribution of this financial support promotes the greatest farms, thus increasing income differences within the agricultural sector. As a result, the CAP was not an effective instrument to equalise income levels within the agricultural sector and thus failed to equalise it in the social aspect. However, Czyżewski et al. [70] indicated a positive impact of the CAP on income and the level of sustainability in agriculture, consisting in the disappearance of the Agricultural Treadmill effect proposed by Cochrane [71] in the EU-15 since 1995. Those researchers explained it by the separation of subsidies from production in combination with the support for rural development and provision of public goods. They indicated that the value added for agriculture may be increased not only thanks to greater production, but also greater value added. Nevertheless, it needs to be stressed here that the deepening income inequality within the agricultural sector and the antimotivational effect of subsidies [21] is inconsistent with the paradigm of sustainability to be reached not only in social, but also economic terms.
What is the optimal level of employment in agriculture? From the technological point of view, it is the level which ensures the best utilisation of existing resources and inputs while respecting environmental governance and safety of produced food. From the economic point of view, it is the level which guarantees maximisation of surplus produced in enterprises of the agricultural sector, particularly farms. From the social point of view, it is the level which, after division of GVA generated by agriculture between all the employed in this sector, gives GVA per 1 person employed comparable to those employed in the industry and the services sector. Obviously, in view of the existing limitations, the level of employment ensuring parity income at the level of that in the industry and the services sector may be, at least in the medium and short time perspective, only an artefact. Its utility is similar to that of the full employment concept, i.e., the state to which we need to strive to attain, while being fully aware that probably it will not be reached. However, it is of great importance and value to establish an objective as well as monitor and stimulate the course of the processes which would let the economies approach this hypothetical state.
3. Materials and Methods
In order to attain the proposed aim, both comparative analysis and the deduction method were applied. For this purpose, EUROSTAT data [72] concerning employment and gross value added (GVA) generated by agriculture, industry and services in the EU countries and literature on the subject were used. Employment is given as the total number of people employed in individual sectors of the economy, while GVA was expressed in constant prices of 2018. In order to present changes in the situation within a possibly long period, the analysis was conducted based on data from 2000 and 2018. Based on the list and comparison of information concerning the share of agriculture in the employment structure and in the generation of GVA, the study will present the nature and causes of differences observed in this respect between individual EU countries as well as changes observed between the years of analyses. The analysis of GVA per 1 person employed in agriculture compared to GVA per 1 person employed in industry and services provides a certain image of the distance between the agricultural population and the nonagricultural population in terms of the economic productivity of labour, which, to a considerable extent, determines the potential to reduce income disparity between farmers and individuals working outside agriculture. Assuming that natural economic processes lead to the best use of labour resources, based on changes in the level of employment and GVA in the analysed period, the course of transformation processes in the employment structure in the future in the aspect of the division of labour outflow from agriculture to industry and services was considered. The Pearson correlation coefficients between the level of employment in individual sectors and GVA per 1 person employed in the time series covering the years 2000–2008 were also calculated. Moreover, the volume surplus employment in agriculture was also estimated for individual investigated countries assuming that GVA per 1 person employed in this sector needs to be equal to the value of GVA in the industry and the services sectors (jointly). For this purpose, a novel original measure developed by the author was proposed, i.e., Excess Employment Rate In The Agricultural Sector (EERAS), defined as the percentage of excess employment in agriculture in relation to the actual level:
where:
EERAS—Excess Employment Rate In The Agricultural Sector;
GVAa—GVA in agriculture in the national economy of the investigated country;
GVAp—GVA per 1 employed person in the industry and the services sectors (GVA parities);
Eai—number of persons employed in agriculture in the initial state in the national economy of the investigated country.
The suggested index can be used for comparisons between various countries and aggregates of countries. In the present study, depending on the reference point, the following variants of this index were adopted:
- Excess Employment Rate In The Agricultural Sector by country (EERASc),where: GVAp refers to GVA per 1 employed person in the industry and the services sectors in the national economy of the investigated country;
- Excess Employment Rate In The Agricultural Sector compared to EU-17 (EERAS-EU17), facilitating a comparison to the average GVA level per 1 person employed outside agriculture in the most developed EU countries,where: GVAp refers to GVA per 1 employed person in the industry and the services sectors in the EU-17 economy;
- Excess Employment Rate In The Agricultural Sector compared to EU-11 (EERAS-EU11), facilitating a comparison to the average GVA level per 1 person employed outside agriculture in the group of the former socialist countries currently being EU members,where: GVAp refers to GVA per 1 employed person in the industry and the services sectors in the EU-11 economy.
In order to illustrate the scale of intersectoral substitutions in employment for each of the investigated EERAS variants, the target share of agriculture in the sector structure of employment was also calculated. In order to provide a possible full picture of the analysed phenomena, the same time frame was adopted for all the investigated countries, despite the fact that some of the countries became EU members during the period of analysis, while the United Kingdom decided to leave the EU. In view of the limited availability of data for Croatia, Greece and the United Kingdom, the latest available data from the EUROSTAT database were used, i.e., data for 2017.
4. Results and Discussion
Table 1 presents the structure of employment in individual sectors of the economy in the EU countries in 2000 and 2018 and shows changes in the share of individual sectors between 2000 and 2018. It may be observed that, in all the investigated countries, the share of agriculture in the structure of employment was reduced in the analysed period, which was most evident among the countries with the highest share of employment in agriculture. Modernisation of agriculture and the aggregation of land resulting in a lower actual demand for labour, financed to a considerable extent by the CAP funds and structural EU programmes, additionally stimulated processes of releasing labour resources from private farms [14]. At the same time, two phenomena were observed: absorption of labour resources released from agriculture by nonagricultural sectors and—through capitalisation as well as technological change and organisational progress—the lack for justification for excessive employment in farms [21].
In the analysed years, the share of employment in industry also decreased markedly (except for Poland and Romania), while in all the investigated countries, the share of the tertiary (services) sector increased (Table 1). Thus, it may be assumed (excluding the effect of demographic factors) that the workforce released from agriculture was first of all absorbed by the services sector. Among the analysed countries, the highest share of employment in agriculture in the total number of employed in the national economy in 2018 was recorded in the group of former socialist countries: Romania, Bulgaria, Poland, Latvia, Lithuania and Croatia, while among the EU-15 countries in Greece and Portugal. The lowest share of people employed in agriculture was reported in countries of Western Europe with strong economies, i.e., Luxemburg, Belgium, Germany, Malta and Sweden. The countries with a low share of agriculture in the employment structure are represented by such Central and Eastern European Countries (CEECs) as Slovakia, Czechia and Estonia. Already,, this observation indicates that in the modification of the sectoral employment structure a role is played first of all by the level of economic development (which is consistent with the assumptions of the three-sector model), but it is also affected by historical factors. The abovementioned CEECs have a greater share of industry in the structure of employment than in the countries of Western Europe. To a considerable extent, this is caused by the drive to increase the share of industry in the socialist countries, and simultaneously the effectiveness of collectivisation and nationalisation of agriculture leading to the aggregation of agricultural land. The former socialist countries with a high share of agriculture in the sectoral employment structure, i.e., Romania, Bulgaria, Poland, Slovenia and Hungary, at the same time have a comparable share of employment in industry (higher than in Western European countries), while “surplus” of employment in agriculture observed in relation to the EU average roughly corresponds there to the “deficit” of employment in the services sector. In the group of the most developed EU-17 countries the average employment in agriculture in 2000 was 7.7%, while in 2018 it was 4.2% total number of employed, whereas in the group of former socialist states it was 22.2% and 10.6%, respectively (Table 1). GVA generated by this sector accounted for 2.0% and 1.5% in the EU-17 and 6.2% and 3.1% in the EU-11 (Table 2). The share of the industry sector in the employment structure in the EU-17 was 19.7% in 2000 and decreased to 15.4% in 2018, whereas in the EU-11 it amounted to 24.7% and decreased to 23.2%. At the same time, GVA generated by that sector in the EU-17 accounted for 26.1% total volume in 2000 and 18.4% in 2018, while in the EU-11 it was 26.1% and 25.2%, respectively. The share of the services sector in the employment structure in the EU-17 was 76.5% in 2000 and it increased to 81.9%, whereas in the EU-11 it was 53.1% and it increased to 66.2%. During that period, GVA in the EU-17 generated in the tertiary sector in the EU-17 increased from 76.3% to 80.1%, while in the EU-11 it was from 67.7% to 71.7%, respectively.
Interesting observations may be made also when analysing changes in the volume of employment and GVA in individual countries (Table 3). In the analysed years, total employment increased in the EU-17 by 13.1%, while in the EU-11—by 4.0%. GVA increased by 12.2% and 55.1%, respectively, which indicates a more rapid increase in the labour productivity in the EU-11 countries. This was the effect of primarily the much lower labour efficiency in the EU-11 at the initial state and a considerable burden for the EU-17 economic effects with the negative increase in GVA in the United Kingdom and Greece, which most dramatically suffered the consequences of the 2007–2008 economic crisis. Completion of the political and economic transformation processes in the former socialist countries, rationalisation of employment in agriculture and the industry, foreign investments and development of the services sector promoted economic development and modernisation of production, while they also stimulated an increase in GVA. It also needs to be remembered that it is a relative increment, which in the case of EU-11 has a much lower value basis than in the EU-17. Regularities observed between the EU-17 and EU-11 aggregates do not reflect the complexity of the situation within these aggregates. In the case of the EU-17, the effect of changes in GVA in agriculture on the total GVA volume in individual countries was negative, except for Austria, where GVA in agriculture increased slightly (2.3%). The industry sector also influenced a resulting decrease in GVA, except for Ireland, Portugal, Germany and Austria (increments in GVA of 201.4%, 34.7%, 19.1% and 3.0%). In the other countries (except for the UK, in which a reduction in GVA was recorded in all the sectors), the greatest positive effect on the overall increment in GVA was observed for the services sector. All the investigated EU-17 countries in the investigated period recorded an increase in employment in the tertiary sector (apart from the relatively small deviations from the point of view of the EU-17 aggregates in the case of agriculture in the United Kingdom and Malta), reduction of employment in agriculture and the industry sector. In the EU-11 countries, in the years of analysis, employment in agriculture decreased, and it was also reduced in the industry sector (apart from Czechia and Slovakia), whereas it increased in the tertiary sector. In contrast to the EU-17, in some EU-11 countries GVA in agriculture increased markedly. This increase was the greatest in Slovakia (286.5%), followed by Estonia (66.0%), Czechia (52.1%) and Lithuania (28.5%). A lower increase was also recorded in Poland (12.2%). Except for Romania, in all the EU-11 countries, GVA in the industry sector increased (from 6.0% to 153%). In the case of the services sector, no countries recorded a negative increase. The lowest growth was reported in Romania (16.3%), while it was highest in Lithuania (167.9%). The increase in GVA in agriculture recorded in some countries resulted mainly from its modernisation as well as opening of the Western European markets following their accession to the EU. Development of industry and an increase in the GVA generated by that sector resulted from the transformations in the 1990s. The increase in GVA in the tertiary sector in the EU-11 countries is consistent with the regularities typical of highly developed countries. On the one hand, it is related with increased affluence of their inhabitants, while on the other hand, it is an element of modernisation processes in their economies (also thanks to the participation of the services sector in manufacturing processes in the industry and in agriculture) [15].
The reduction of the share of agriculture in the total volume of GVA was most evident in the countries with the highest share of employment in agriculture, in which this employment decreased in the investigated period (particularly in Bulgaria and Romania). However, these two phenomena may not be linked directly. A decrease in the share of agriculture in the structure of gross value added primarily resulted from the increase in the GVA in the services and industry sectors. Thus, the foundations were of nonagricultural nature, similarly to more economically developed countries (Table 2). Indirectly, a certain role may have been played by increased employment outside agriculture; however, changes in the sectoral GVA generation structure were primarily modified by the differing growth rates for input productivities in individual sectors. It also needs to be stressed here that the countries with a high level of employment in agriculture were characterised by lower GVA levels for the entire economy than the other countries. Thus, it may be assumed that GVA not generated by “excess” employment in agriculture simply does not exist. From this point of view, the volume of employment in agriculture corresponding to the “lost” GVA is roughly equivalent to the level of the inefficient surplus employment in the agricultural sector, also referred to as hidden unemployment [73]. It may also be stated that except for Ireland, Greece, Poland and Bulgaria, in all the countries the share of industry in the GVA structure also decreased. This is consistent with the assumptions of the three-sector model and may indicate the services sector as the future source for an increase in the GVA volume in the economy.
If we assume that the processes of labour force allocation progress towards greater efficiency, the potential to increase GVA in agriculture is diminishing also in the EU-11 countries and the increase in GVA generated in the secondary sector in almost all the investigated countries is not accompanied by an increase in employment, then it may be expected that, similarly, as in the years 2000–2018 (Table 1), further changes in the sectoral employment structure will progress “neglecting” the classical three-sector model, while the population released from agriculture will be absorbed mainly by the services sector. According to the sector theory [15,74], this is characteristic and natural in developing and modern economies. This process will probably be determined by the growth rate in the demand for services, structural adaptation concerning adjustment of characteristics of the agricultural population to the demand for workforce [73] in the services sector (qualifications, mobility, wage-related factors in combination with costs of nonagricultural employment), as well as the rate of structural transformations in rural areas (modernisation of production processes and consolidation of the ownership structure and agricultural land use). Migration of labour force from the Eastern Bloc countries and Ukraine are also of great importance [75]. To date it may not be established how these processes will be affected by the economic slowdown after 2019, caused by the COVID-19 pandemic.
As it was mentioned earlier, among the many causes determining the direction of transformations in the sectoral employment structure, an important role is played by the efficiency of utilisation of inputs involved. Table 4 presents annual GVA per 1 person employed in 2018 and its changes in relation to 2000. The very large distance in terms of GVA values per 1 person employed in the industry and services sectors between the EU-17 countries and the former socialist countries is striking here. This advantage is particularly evident in the case of Ireland, which has based the development of industry on modern technologies [76], and Luxemburg with a high share of financial services (i.e., the quaternary sector) [77]. In the case of agriculture, the differences are smaller, although still noticeable. This may result from the abovementioned limitations connected with natural conditions, technologies and institutional aspects, in view of which the basis for this index, i.e., the number of persons employed, gains in importance. Countries with a high level of employment in agriculture, particularly Romania, Bulgaria and Poland, have the lowest GVA values per 1 person employed, despite the high share of agriculture in GVA (particularly in the case of Romania and Bulgaria). In 2018, the EU-17 countries were characterised by GVA per 1 person employed in the national economy amounting to 69.4 thousand Euro, compared to only 26.1 thousand Euro (i.e., 37.6% of the EU-17 level) for the EU-11 countries. Among the investigated sectors, the greatest differences in this respect were found in agriculture, in which this index for the EU-17 amounted to 38.4 thousand Euro, while for the EU-11 it was 7.6 thousand Euro (19.8% of the EU-17 level). In the case of the industry and the services, the values in the EU-17 were also much higher than in the EU-11 (82.9 thousand Euro and 28.3 thousand Euro, as well as 67.9 thousand Euro and 28.3 thousand Euro); however, the relationship between GVA per 1 person employed in the EU-17 and in the EU-11 was not as high as in the case of the services sector (GVA in the secondary sector in the EU-11 accounted for 34.1% GVA in the EU-17, while for the tertiary sector it was 41.7% GVA in the EU-17). In the years of the analyses, the differences between the EU-17 and the EU-11 in terms of this index were decreasing due to the much faster increase in its value in the EU-11. The increase in GVA per 1 person employed in agriculture was -0.8% in the EU-17 and 49.2% in the EU-11, while for the industry it was 4.5% and 55.6%, and for the services sector it was -2.6% and 26.8%, respectively. Values of the aggregates are modified by the previously described diverse situation in individual countries. In the case of agriculture, an important role is played first of all by the reduction of employment followed by the utilisation and then depletion of productivity reserves. In this respect, former socialist countries use the “catching-up advantage,” since, in their relatively inefficient economies, there is room for optimisation of input utilisation. In the countries of Western Europe attaining greater efficiency it is more difficult to increase it further. The situation within the EU-27 aggregate was also affected by the rapid decrease of GVA in the United Kingdom after 2007 [72].
Table 5 presents values of the Pearson correlation coefficients between the level of employment in individual sectors and GVA per 1 person employed in the time series covering the years 2000–2008. In the EU-11 group, all the countries except for Bulgaria and Romania were characterised by negative values of the correlation coefficients in agriculture—together with a decrease in employment an increase was observed for GVA per 1 person employed (with the correlation coefficient for Romania being statistically nonsignificant). A similar situation was observed in the case of the industry, except for Poland. In turn, in the services sector, an increase in employment was accompanied by an increase in GVA per 1 person employed (except for Hungary). In the EU-17 countries, these dependencies are not so evident; however, this is related with the previously attained relatively high labour efficient and the shock affecting particularly the financial sector in the years 2007–2008.
A comparison of the structure of employment in individual sectors and its changes in the investigated period (Table 1) also indicates that high employment in agriculture does not coincide with a high GVA level (Table 2). Figure 1 presents scatter graphs for the level of employment and GVA per 1 person employed in agriculture in the EU countries in 2000 and 2008. The dependence between the share of agriculture in the employment structure and GVA per 1 person employed in individual countries is evident. The countries having a high share of agriculture in the employment structure were characterised by low values of GVA per 1 person employed in both analysed years. In turn, countries with a relatively low share of employment in agriculture reached higher values of GVA per 1 person employed in agriculture. Nevertheless, in both cases, GVA per 1 person employed was much lower than GVA in the industry and the services sectors (Table 4).
Processes aiming at an increase in productivity concern all the investigated countries and sectors, although they progress in a different manner and at a different rate. In this respect, agriculture faces significant limitations, resulting from its character related with the natural environment, served social functions and institutional conditions (e.g., CAP regulations). Modernisation processes, biological progress, technical change and organisational transformations typically lead to increased productivity of land, labour and capital; however, it is to a certain degree limited by the productivity of land, animals and limitations in the admissible cropped area for individual crop species, herd or flock size, potential for application of fertilisers, pesticides, herbicides, genetically modified organisms (GMOs), admissible price levels or directly—production volume restrictions (e.g., milk quotas binding for many years). In such a situation, a method to noticeably increase profitability of agricultural production in the aggregate scale is connected with price increases, which, however, may face a strong barrier related to a lack of social acceptance. To a certain extent, this resembles the situation mentioned earlier, i.e., that in the socialist countries before 1989, described, e.g., by Czyżewski [65]. This also requires the application of transfer instruments in order to protect the interests of the nonagricultural population, similarly as it was the case then. Alternatively, we may consider other methods to increase profitability to avoid price increases [69]. While this is relatively simple in the case of some farms, for the entire sector it may be generally seen only as a certain potential solution. At the limited extent to which costs of land and capital use may be decreased and a lack of acceptance for price increases, the aggregated increase in the value added would require changes in the production structure. This may be executed only as a result of changes in the demand structure or involvement of agricultural farms in nonagricultural activity, such as, e.g., provision of services paid for by service recipients either directly (e.g., agritourism) or indirectly (e.g., environmental, landscape) supported by public funds [cf. 8]. This means that income of farms from agricultural production may not grow to a degree comparable to that for income of service or industrial enterprises and thus requires co-financing of this sector through transfers (which are also justified by the need to pay for environmental and landscape services). In such a reference system, it is crucial to reduce the number of people, between which this limited value added and income will be divided.
Value added per 1 person employed in the individual sectors to a considerable extent determines the potential for financing labour required for its generation. If the drive towards sustainable agriculture means a reduction of income disparity between farmers and those employed in the other sectors, two options are available: increasing labour productivity (in the case of agriculture it is equivalent to reduction of employment) and financial transfers of public funds. The greatest differences between income of farmers and income of workers in the other sectors are observed in small and medium-sized farms, with high labour inputs [20,23,24,58,60,62,63]. For this reason, a decrease of employment in agriculture should be the first method applied to reduce income disparity between the farming population and the population earning their living outside agriculture. Otherwise, it will be impossible to optimise the utilisation of labour, land and capital; it will also be more difficult to minimise the negative impact of agricultural production on the natural environment [58,59,63]. The situation is additionally compounded by the spatial diversification of employment levels in agriculture, even within individual countries or regions. At least an equally important differentiating factor is the type of agricultural production [78,79]. This hinders attempts to formulate a rational and universal policy in this respect and seems to require actions executed for the entire economy rather than solely the agricultural policy. It seems to be more effective to “pull” workforce to the nonagricultural sectors rather than potential efforts to “push” it out of agriculture, e.g., using instruments of the agricultural policy. Earlier studies indicate that the process of reducing employment in agriculture is determined mainly by the volume of demand for labour in the nonagricultural sectors; structural adaptation of this demand to the characteristics of the rural population, particularly related with agriculture as well as (in the long term) demographic changes [73].
It is rather difficult to determine what is the optimal employment level in agriculture. An important role is played here, not only by GVA per 1 person employed, but also by the standard of development in agriculture, the land use structure and the structure of agricultural production. In the case of GVA, we may observe inefficient employment (potential hidden employment) in agriculture of all the analysed countries. In the case of labour inefficiency in the technological sense (defining the volume of current hidden unemployment), the situation is ambiguous. In some countries there are—or appear seasonally—shortages of labour force (e.g., France, Germany, Czechia). There is also a group of countries in which surplus employment in agriculture is evident (e.g., Romania, Bulgaria, Poland). This is connected with the influence of natural conditions, production structure or the consequence of past conditions—as a result of fragmented farm structure, where many small, inefficient farms are owned by many private owners. These farms do not attain high values of the commercial production index, while they engage considerable labour resources without generating marked economic benefits. They frequently serve the social role “masking” unemployment, mainly structural unemployment [21]. Their production is typically not sustainable in the Pareto sense [16].
From the point of view of individuals employed in agriculture, the optimal level of employment is the one in which, after the division of GVA generated by agriculture between all the employed in this sector, provides GVA per 1 person employed comparable to the respective levels in the industry and the services sectors. The abovementioned limitations concerning productivity of the agricultural sector hinder or even prevent reaching such an income at the current employment level; however, technological, technical and organisational progress may facilitate the “release” of at least part of the employed from agriculture. Table 6 presents the values of EERAS (excess employment rate in the agricultural sector) and the share of agriculture in the sector employment structure in individual analysed countries in 2018, in a situation when GVA per 1 person employed in that sector would be equal to GVA per 1 person employed in the industry and the services sectors. A comparison within individual countries and aggregates (EERASc) indicates that, in order to reach the parity income in agriculture at the level of the income in the industry and the services sectors, 86.6% people employed in that sector would have to be “released” in the EU-11, while it would have to be 56.6% in the EU-17. Within the EU-17 aggregate, the greatest surplus employment in agriculture was found in Ireland (83.6%), Portugal (82.8%) and Greece (76.4%), while it was lowest in Malta (27.0%) and the Netherlands (27.0%). In the EU-11 group, the greatest excess employment in agriculture was recorded in Romania (93.0%), Poland (87.5%), Bulgaria (85%) and Lithuania (83.5%), whereas it was lowest in Czechia (47.7%) and Slovakia (49.2%). In the EU-17, compared to the mean GVA per 1 person employed in the industry and the services sectors in the EU-11 (EERAS-EU11), a relative shortage of employment in agriculture was observed, resulting from the value of GVA in that sector being comparable or higher than in the services and the industry sectors in the EU-11. However, also among countries belonging to the EU-17 group, there were some cases of excess employment: the greatest in Portugal (76.7%), followed by Greece (64.5%), Austria (32.6%), Cyprus (19.8%) and Ireland (17.3%). Among the EU-11 countries, the value of this index depended on the relationships between the domestic and aggregate (EU-11) GVA per 1 person employed in individual sectors. The highest values were recorded in Romania (93.5%), while they were lowest in Czechia (35.8%). Taking into consideration the drive towards convergence of income levels between the EU-17 and the EU-11, it is important to determine the distance in the gap between the countries belonging to these groups. A certain picture of that gap may be provided by the EERAS-EU17 measure. It also illustrates the internal heterogeneity of the EU-17 aggregate. This measure in 2018 for the EU-11 aggregate was 94.6%. This indicates very big differences between the EU-17 and the EU-11, both in the level of employment in agriculture and GVA generated in individual sectors of the economy. For the EU-17, the value of this index was 56.6%. Among the countries belonging to that group, relatively greatest surplus employment in agriculture was found in Portugal (90.6%), Greece (85.7%), Austria (72.9%) and Cyprus (67.7%), whereas it was smallest in Sweden (24.4%) and the United Kingdom (36.5%). In the EU-11, the highest values of EERAS-EU17 were recorded in Romania (97.4%), Bulgaria (96.6%), Poland (94.9%), Lithuania (92.8%) and Croatia (90.9%).
The scale of surplus employment in agriculture described by the EERAS values calculated for individual aggregates and countries indicates the share of agriculture in the sectoral structure of employment in each of the investigated variants. In the case of the EU-17 aggregate, the share of agriculture in the sectoral employment structure would have to decrease from 2.7% to 1.5%. This is difficult in view of both the technical demand for labour and the necessity to absorb surplus “released” from agriculture by the nonagricultural sectors. Moreover, similarly as in the case of EERAS, also here the situation within the group is complex. However, a much worse situation and a greater scale of changes are found in the EU-11. Reaching the level of EERAS-EU11 would require a 3.7-fold reduction in the share of agriculture in the employment structure (from 10.6 to 2.9%), whereas for the level of EERAS-EU17, it would have to be a 9.6-fold decrease. Also here, the situation within the group is complicated. The greatest scale of changes would be necessary in Romania (from 22.9% to 1.5%), Bulgaria (from 17.7% to 0.8%) and Poland (from 9.6% to 0.9%). In the case of these countries, it seems that such a reduction is impossible in the foreseeable future. Some former socialist countries require a much smaller reduction in the share of agriculture in their employment structure (e.g., Slovakia, Czechia and Estonia), although even in their case the “release” of excess employment from agriculture would be a difficult and long-lasting process.
The presented estimates for the surplus illustrate the scale of changes, which would be required in the sectoral employment structure to meet the postulate of equalisation of GVA per 1 person employed in agriculture and in the nonagricultural sectors. As it was shown above, in view of the technological limitations, labour intensity of production processes at the existing technological standard, the fragmented ownership and land use structure as well as environmental constraints, possible except for very few cases attaining such a state is impossible. Thus, it needs to be treated solely as a reference point for further considerations concerning the agricultural, social and labour market policies. Examples of countries in which agriculture accounts for a slight share in the sectoral employment structure indicate that a reduction of employment is not sufficient to eliminate income disparity of farmers. The most important barrier is related to differences in productivity and in the rate of increasing this productivity between agriculture and modern industry and services. This results from the specific nature of agriculture, and it may not be eliminated even in its industrialised form, particularly in the European model, in which economic and productive objectives are not considered to be superior in relation to environmental and social aims [75,79,80]. Thus, although the transfer instruments (particularly within the CAP) should not be treated as priorities compared to rationalisation of labour inputs, they may not be excluded, and, at a certain, technologically, economically, ecologically and socially justified level of employment in agriculture, they need to at least reduce if not eliminate the degree of this disparity. These instruments are necessary even in a situation of the previously described “overestimation” of farmers’ earnings in relation to their productivity. Nevertheless, the type and manner of their action is crucial here. They should not replace transformation processes in the employment structure, but rather supplement them so that they never hinder such transformations.
For obvious reasons, analyses at the level of countries and aggregates of countries do not reflect the entire complexity of the phenomena studied at the level of countries or regions. Indicators used in the research such as employment and gross value added (GVA) also make some simplifications necessary (e.g., part-time work, people working simultaneously in more than one sector, depreciation, etc. are not considered). However, at a fairly general level of analysis, they are useful and allow, above all, to compare the situation between individual countries and sectors of the economy. The estimation of employment surplus in agriculture and the attempt to determine the possible directions of outflow of labour from agriculture require further research at the level of individual countries and regions, taking into account their economic and social specificity, natural and technical conditions of agricultural production and the regional specificity of agricultural enterprises.
5. Conclusions
- The highest share of employment in agriculture in the total number of people employed in the national economy of the former socialist countries was recorded in Romania, Bulgaria, Poland, Latvia, Lithuania and Croatia, while among the EU-15 countries it was in Greece and Portugal. The lowest share of people employed in agriculture was found in the Western European countries with strong economies, i.e., Luxemburg, Belgium, Germany and Sweden. However, countries with a low share of agriculture in the employment structure include also representatives of CEECs such as Slovakia, Czechia and Estonia.
- The former socialist countries with a high share of agriculture in the sectoral employment structure have comparable levels of employment in industry (higher than in the Western European countries), while “excess” employment in agriculture in relation to the EU average in those countries roughly corresponds to the “deficit” of employment in the services sector. Thus, it may be expected that the workforce released from agriculture will be absorbed mainly by the services sector.
- In less affluent countries, the low value of GVA per 1 person employed in agriculture compared to the other sectors results to a considerable extent from the excessive number of people employed in agriculture. In richer countries, characterised by the relatively low level of employment in agriculture, the low value of this ratio results first of all from the high GVA generated by the secondary and tertiary sectors (industry and services).
- Assuming the principle that earnings of inputs should result first of all from their productivity and assuming that in the foreseeable future the potential to increase the value added generated by agriculture is limited, it needs to be stated that minimisation of income disparity for farmers is feasible through further evolution of the sectoral employment structure towards minimisation of the share of agriculture in this structure and increasing the share of the nonagricultural sectors, particularly services.
- The prepared estimates for the scale of surplus employment in the agricultural sector indicate a very large scale of such excess employment. In the countries generating a higher GVA at the scale of both entire economies and individual sectors, a reduction of employment levels in agriculture may be impossible due to depletion of reserves in the technical labour efficiency (most EU-17 countries). In the countries with a relatively low GVA (mainly the EU-11), reduction of employment in agriculture with no deterioration of the volume and quality of production may be easier thanks to the existing reserves in the technological and organisational progress. However, in this group the scale of reduction in employment in agriculture would have to be much greater.
- Existing limitations and the required scale of reduction in employment suggest that reaching the level of employment in agriculture guaranteeing GVA per 1 person employed in this sector comparable to that in the industry and the services sectors is not possible within a short time perspective. Nevertheless, any achieved progress in getting closer to that level of employment may reduce the volume of transfer funds directed to agriculture. As a consequence, this would reduce the fiscal burden for the nonagricultural sectors related with financing the CAP, while GVA generated in the secondary and tertiary sectors may be utilised more efficiently.
- Apart from limitation concerning the specific character of agriculture and its labour intensity, the process of changes in the sectoral employment structure will probably be determined by the growth rate in demand for services, structural adaptations of characteristics of the farming population to the demand for workforce in the tertiary sector, as well as the rate of structural transformations in rural areas, particularly modernisation of production and consolidation of the ownership structure as well as agricultural land use.
- Rationalisation of the employment level in agriculture is also a method to improve its economic and social sustainability. Only subsequently may instruments of financial transfers from the nonagricultural sectors to agriculture be considered, because they are a burden to more productive sectors and, in the long term, they may slow down the natural reduction of employment in agriculture. However, in view of the inevitable differences in productivity between agriculture and the nonagricultural sectors, at a certain technologically, economically, ecologically and socially justified level of employment in agriculture, transfers of the surplus generated in the secondary (industry) and tertiary (services) sectors need to at least reduce if not eliminate economic consequences of these differences.
Funding
This research was funded by the Faculty of Economics and Social Sciences, Poznań University of Life Sciences.
Conflicts of Interest
The author declares no conflict of interest.
References
- Smith, A. An Inquiry into the Nature and Causes of the Wealth of Nations, Introduction to Book IV.; Metalibri: Amsterdam, The Netherland; Lausanne, Switzerland; Melbourne, Australia; Milan, Italy; New York, NY, USA; Sao Paulo, Brasil, 2007; Available online: https://www.ibiblio.org/ml/libri/s/SmithA_WealthNations_p.pdf (accessed on 15 June 2020).
- Rijnhout, L.; Schauer, T. (Eds.) Socially Sustainable Economic. Degrowth. In Proceedings of the Workshop in the European Parliament, Vienna, Austriaon, 16 April 200; Available online: http://www.prisonplanet.pl/files/96577242/file/32862425clubofromedegrowth.pdf (accessed on 15 June 2020).
- Schneider, F.; Kallis, G.; Martinez-Alier, J. Crisis or Opportunity? Economic Degrowth for Social Equity and Ecological Sustainability. Introduction to This Special Issue. J. Clean. Prod. 2010, 18, 511–518. [Google Scholar] [CrossRef]
- Guercio, M.R. Sustainability and Economic De-Growth. Brief for GSDR, 2015. Available online: https://sustainabledevelopment.un.org/content/documents/6534116_Guercio_Sustainability%20and%20economic%20degrowth.pdf (accessed on 15 June 2020).
- Wilkin, J. Ziemia Rolnicza–Dobro wielofunkcyjne (Agricultural Land–A Multifunctional Good). Wieś Rol. 2014, 1, 113–121. [Google Scholar]
- International Capital Flows: Structural Reforms and Experience with the OECD Code of Liberalisation of Capital Movements. Report from the OECD to the G20 Sub-Group on Capital Flow Management: June 2011. Available online: https://www.oecd.org/economy/48972216.pdf (accessed on 15 June 2020).
- Reinhardt, D.; Ricci, L.A.; Tressel, T. International Capital Flows and Development: Financial Openness Matters. J. Int. Econ. 2013, 91, 235–251. [Google Scholar] [CrossRef] [Green Version]
- Van Wincoop, E.; Tille, C. International Capital Flows. NBER Working Paper 2007, No. 12856. Available online: https://www.nber.org/papers/w12856 (accessed on 15 June 2020).
- Kugler, M.; Rapoport, H. International Labor and Capital Flows: Complements or Substitutes? Econ. Lett. 2007, 94, 155–162. [Google Scholar] [CrossRef]
- Measuring International Labour Mobility. Prepared by the Task Force on Measuring Labour Mobility; UNECE: New York, NY, USA, 2018; Available online: https://www.unece.org/fileadmin/DAM/stats/publications/2018/ECECESSTAT20187_WEB.pdf (accessed on 15 June 2020).
- Clark, C. The Conditions of Economic Progress; MacMillan, St. Martin’s Press: London, UK; New York, NY, USA, 1957. [Google Scholar]
- Atkinson, A.B. Inequality: What Can Be Done? Harvard University Press: Cambridge, MA, USA, 2014. [Google Scholar]
- Fisher, A.G.B. Capital and the Growth of Knowledge. Econ. J. 1933, 43, 379–389.5. [Google Scholar] [CrossRef]
- List, F. Das nationale System der politischen Oekonomie; Gustav Fischer-Verlag: Jena, Germany, 1922. [Google Scholar]
- Flejterski, S.; Klóska, R.; Majchrzak, M. Usługi w teorii ekonomii (Services in the Theory of Economics). In Współczesna Ekonomika Usług (Contemporary Economics of Services), 2nd ed.; Flejterski, S., Panasiuk, A., Perenc, J., Rosa, G., Eds.; Polish Scientific Publishers: Warsaw, Poland, 2012. [Google Scholar]
- Kołodziejczak, M. Zmieniająca się Natura Usług. Studium Usług Produkcyjnych w Rolnictwie Krajów Unii Europejskiej (The Changing Nature of Services; a Case Study of Production Services in Agriculture in EU Member Countries); Wydawnictwo Uniwersytetu Przyrodniczego w Poznaniu: Poznań, Poland, 2019. [Google Scholar]
- Fisher, A.G.B. Economic Progress and Social Security; MacMillan & Company Limited: London, UK, 1945. [Google Scholar]
- Kwiatkowski, E. Teoria Trzech Sektorów Gospodarki. Prezentacja i Próba Oceny (Theory of Three Sectors of the Economy Presentation and an Attempt to Evaluate); Polish Scientific Publishers: Warsaw, Poland, 1980. [Google Scholar]
- Kraciuk, J. Paradygmat homo oeconomicus w aspekcie rozwoju ekonomii heterodoksyjnej (Homo Economicus Paradigm in Terms of Development of Heterodox Economics). Pr. Nauk. Uniw. Ekon. We Wrocławiu 2015, 401, 211–219. [Google Scholar]
- Kiełczewski, D. Racjonalność człowieka gospodarującego w ujęciu koncepcji homo sustinens (Rationality of Managing Man in the Concept of Homo Sustinens). Pr. Nauk. Uniw. Ekon. We Wrocławiu Ekon. 2016, 449, 269–276. [Google Scholar] [CrossRef]
- Komorowska, D. Prawidłowości rozwoju rolnictwa a rozwój współczesnego rolnictwa (Regularity of the Development of Agriculture and the Development of Modern Agriculture). Zesz. Nauk. SGGW Probl. Rol. Świat. 2014, 14, 98–110. [Google Scholar]
- Kołodziejczak, W. Nadwyżka zatrudnienia w polskim rolnictwie—Projekcja na tle państw Unii Europejskiej (The Surplus of Employment in Polish Agriculture—A Simulation Against the European Union Countries). Zesz. Nauk. SGGW Probl. Rol. Świat. 2016, 16, 121–149. [Google Scholar]
- Kołodziejczak, W. Zatrudnienie i wartość dodana brutto w sektorach gospodarki państw Unii Europejskiej w latach 2002 i 2016 (Employment and Gross Value Added in the Sectors of the European Union Economy in 2002 and 2016). Zesz. Nauk. SGGW Probl. Rol. Świat. 2018, 18, 270–283. [Google Scholar] [CrossRef]
- Kołodziejczak, W. Reduction of Employment as the Way to Balance Production Processes in the Polish Agriculture. In Agrarian Perspectives XXVII Food Safety—Food Security. In Proceedings of the 27th International Scientific Conference, Czech University of Life Sciences Prague, Faculty of Economics and Management, Prague, Czech Republic, 19–20 September 2018; Tomšík, K., Ed.; Czech University of Life Sciences Prague: Prague, Czech Republic, 2018; pp. 128–135. [Google Scholar]
- Czyżewski, B. Produktywność zasobów w rolnictwie w Polsce wobec paradygmatu zrównoważonego rozwoju (Resource Productivity in Polish Agriculture: Towards the Paradigm of Sustainable Development). Studia Ekon. 2012, 2, 165–188. [Google Scholar]
- Copus, A.K.; Dax, T.; de Lima, P. Epilogue: Rural Cohesion Policy as the Ap-propriate Response to Current Rural Trends. In Territorial Cohesion in Rural Europe: The Relational Turn in Rural Development; Copus, A.K., de Lima, P., Eds.; Routledge: Abingdon, UK, 2018; pp. 236–248. [Google Scholar]
- Nemes, G.; High, C.; Augustyn, A. Beyond the New Rural Paradigm: Project State and Collective Reflexive Agency. In Territorial Cohesion in Rural Europe: The Relational Turn in Rural Development; Copus, A.K., de Lima, P., Eds.; Routledge: Abingdon, UK, 2018; pp. 212–235. [Google Scholar]
- Matthews, A. Agriculture. In Industries in Europe. Competition, Trends and Policy Issues; Johnson, P., Ed.; Edward Elgar: Cheltenham, UK; Northampton, MA, USA, 2003; pp. 26–54. [Google Scholar]
- The Agricultural Income Situation in Less Favoured Areas of the EC. Document, FADN, Commission of the European Communities; Office for Official Publications of the European Communities: Luxembourg, 1991. [Google Scholar]
- Davidova, S.; Bauer, K.; Cuddy, M.P. Integrated Development of Agriculture and Rural Areas in Central European Countries; Lexington Books: London, UK, 2006. [Google Scholar]
- Bolcárová, P.; Kološta, S. Assessment of Sustainable Development in the EU 27 Using Aggregated SD Index. Ecol. Indic. 2015, 48, 699–705. Available online: https://www.sciencedirect.com/science/article/abs/pii/S1470160X14004099 (accessed on 26 June 2020). [CrossRef]
- Grzebyk, M.; Stec, M. Sustainable Development in EU Countries: Concept and Rating of Levels of Development. Sustain. Dev. 2015, 23, 110–123. [Google Scholar] [CrossRef]
- Sébastien, L.; Bauler, T. Use and Influence of Composite Indicators for Sustainable Development at the EU-level. Ecol. Indic. 2013, 35, 3–12. Available online: https://www.sciencedirect.com/science/article/abs/pii/S1470160X13001775 (accessed on 26 June 2020). [CrossRef] [Green Version]
- Burton, C.H.; Turner, C. Manure Management. Treatment Strategies for Sustainable Agriculture, 2nd ed.; Silsoe Research Institute: Bedford, UK, 2003. [Google Scholar]
- Wilson, M.J.; Maliszewska-Kordybach, B. Soil Quality, Sustainable Agriculture and Environmental Security in Central and Eastern Europe; Wilson, M.J., Maliszewska-Kordybach, B., Eds.; Kluwer Academic Publishers: Dordrecht, The Netherlands, 2000. [Google Scholar]
- Borch, K. Emerging Technologies in Favour of Sustainable Agriculture. Futures 2007, 39, 1045–1066. Available online: https://www.sciencedirect.com/science/article/abs/pii/S0016328707000675 (accessed on 26 June 2020). [CrossRef]
- Dwyer, J. Transformation for sustainable agriculture: What role for the second Pillar of CAP? Bio-Based Appl. Econ. 2013, 2, 29–47. [Google Scholar]
- Prager, K.; Posthumus, H. Socio-economic factors influencing farmers’ adoption of soil conservation practices in Europe. In Human Dimensions of Soil and Water Conservation; Napier, T.L., Ed.; Nova Science Publishers: New York, NY, USA, 2010. [Google Scholar]
- Čiegis, R. Sustainable agriculture: Economic aspects. Ekonomika 2004, 68, 7–23. Available online: https://etalpykla.lituanistikadb.lt/object/LT-LDB-0001:J.04~2004~1367179792589/ (accessed on 26 June 2020). [CrossRef]
- Kołodziejczak, W. Hidden Unemployment in Polish Agriculture in 2005-2018-a Simulation of the Scale of the Problem. Rocz. Nauk. Stowarzyszenia Ekon. Rol. Agrobiz. 2020, 22, 170–180. [Google Scholar] [CrossRef]
- Mortensen, D.T.; Pissarides, C.A. Job Matching, Wage Dispersion, and Unemployment; Tatsiramos, K., Zimmermann, K.F., Eds.; Oxford University Press: Oxford, UK, 2011. [Google Scholar]
- Pigou, A.C. Employment and Equilibrium; Macmillan: London, UK, 1949. [Google Scholar]
- Kwiatkowski, E. Mechanizm pełnego zatrudnienia w ujęciu A. C. Pigou—Analiza koncepcji i kierunki jej krytyki (Mechanism of Full Employment in A. C. Pigou’s Approach—Analysis of Concept and Trends in its Critique). Acta Univ. Lodz. Folia Oeconomica 1985, 056, 23–38. Available online: http://cejsh.icm.edu.pl/cejsh/element/bwmeta1.element.hdl_11089_6425?printView=true (accessed on 15 June 2020).
- Dickens, W.T.; Lang, K. Labor Market Segmentation Theory, Reconsidering the Evidence. NBER Working Papers 1992, No. 4087. Available online: www.nber.org/papers (accessed on 15 June 2020).
- Lindbeck, A.; Snower, D.J. The Insiders-Outsiders Theory of Emloyment oad Unemployment; MIT Press: Cambridge, MA, USA; Cambridge, UK, 1988. [Google Scholar]
- Weiss, A. Job Queues and Layoffs In Labor Markets with Flexible Wages. J. Political Econ. 1980, 88, 526–538. [Google Scholar] [CrossRef]
- Weiss, A. Efficiency Wages: Models of Unemployment, Layoffs, and Wage Dispersion; Princeton University Press: Princeton, NJ, USA, 1990. [Google Scholar]
- Pissarides, C. The Search Equilibrium Approach to Fluctuations in Employment. Am. Econ. Rev. 1988, 78, 363–368. [Google Scholar]
- Shapiro, C.; Stiglitz, J. Equilibrium Unemployment as a Worker Discipline Device. Am. Econ. Rev. 1984, 74, 433–444. [Google Scholar]
- Kołodziejczak, W.; Wysocki, F. Identyfikacja charakteru bezrobocia w Polsce w latach 2006-2009 (The Nature of Unemployment in Poland in 2006-2009). Gospod. Nar. 2013, 9, 29–52. [Google Scholar] [CrossRef]
- Górny, A.; Kaczmarczyk, P. Uwarunkowania i Mechanizmy Migracji Zarobkowych w Świetle Wybranych Koncepcji Teoretycznych (Conditions and Mechanisms of Labor Migration in Selected Theoretical Concepts); Prace migracyjne No 49; ISS Uniwersytetu Warszawskiego: Warszawa, Poland, 2003. [Google Scholar]
- Moszyński, M. Międzynarodowe przepływy pracy a procesy integracji europejskiej (International Movements of Labour and the Process of European Integration). Toruńskie Studia Międzynarodowe Międzynarodowe Stos. Ekon. 2010, 1, 113–129. [Google Scholar] [CrossRef]
- Okun, A.M. Potential GNP: Its Measurement and Significance. In Proceedings of the Business and Economic Statistics Section of the American Statistical Association; American Statistical Association: Alexandria, VA, USA, 1962; pp. 89–104. [Google Scholar]
- Kaufman, R.T. An International Comparison of Okun’s Law. J. Comp. Econ. 1988, 12, 182–203. [Google Scholar] [CrossRef]
- Moosa, I.A. A Cross-Country Comparison of Okun’s Coefficient. J. Comp. Econ. 1997, 24, 335–356. [Google Scholar] [CrossRef]
- Prachowny, M.F.J. Okun’s Law: Theoretical Foundations and Revised Estimates by Prachowny. Rev. Econ. Stat. 1993, 75, 331–336. [Google Scholar] [CrossRef]
- Rissman, E.R. What is the Natural Rate of Unemployment? Federal Reserve Bank of Chicago Econ. Perspect. 1986, 10, 3–17. [Google Scholar]
- Haltiwanger, J. The natural Rate of Unemployment. In The New Palgrave; A Dictionary of Economics, t. 3.; The Macmillan Press LTD: London, UK, 1991. [Google Scholar]
- Kołodziejczak, M.; Poczta, W. Changes in the Use of Production Services in Agriculture in the Context of Meeting the Targets of Sustainable Agricultural Development. In Proceedings of the 2018 VII International Scientific Conference Determinants of Regional Development No 1, Stanisław Staszic University of Applied Sciences, Piła, Poland, 12–13 April 2018; Polcyn, J., Ed.; Stanisław Staszic University of Applied Sciences: Piła, Poland, 2018. [Google Scholar]
- Matuszczak, A. Zróżnicowanie Rozwoju Rolnictwa w Regionach Unii Europejskiej w Aspekcie jego Zrównoważenia (Diversification of Agricultural Development in Regions of the European Union in the Aspect of its Sustainability); Polish Scientific Publishers: Warsaw, Poland, 2013. [Google Scholar]
- Zawalińska, K.; Majewski, E.; Wąs, A. Długookresowe zmiany w dochodach z polskiego rolnictwa na tle krajów Unii Europejskiej (Long-Term Changes in the Incomes of the Polish Agriculture Compared to the European Union Countries). Rocz. Nauk. SERiA 2015, 6, 354–364. [Google Scholar]
- Wąsowicz, J. Sektorowe zróżnicowanie wydajności pracy w polskiej gospodarce (Sectoral Disparities of Labour Productivity in the Polish Economy). Studia Ekon. 2013, 160, 190–198. [Google Scholar]
- Sadowski, A. Zrównoważony Rozwój Gospodarstw Rolnych z Uwzględnieniem Wpływu Wspólnej Polityki Rolnej Unii Europejskiej (Sustainable Development of Agricultural Holdings Considering The Influence of Common Agricultural Policy); Wydawnictwo Uniwersytetu Przyrodniczego w Poznaniu: Poznań, Poland, 2012. [Google Scholar]
- Baer-Nawrocka, A. Ewolucja Wspólnej Polityki Rolnej a kwestia parytetu dochodów rolniczych (Farmer’s Income Parity Issue in the Evolution of the Common Agricultural Policy). Pr. Nauk. Uniw. Ekon. We Wrocławiu Polityka Ekon. 2011, 166, 26–36. [Google Scholar]
- Polska wieś 2018. Raport o Stanie Wsi (Rural Poland 2018 The Report on the State of Rural Areas). Available online: https://www.fdpa.org.pl/rural-poland-2018 (accessed on 20 May 2020).
- Czyżewski, A. Systemowe uwarunkowania przełomu jakościowego w polityce rolnej (The System Conditions of a Qualitative Change in Agricultural Policy). Ruch Praw. Ekon. Socjol. 1989, 51, 155–169. [Google Scholar]
- Doward, A. Agricultural labour productivity, food prices and sustainable development impacts and indicators. Food Policy 2013, 39, 40–50. [Google Scholar] [CrossRef] [Green Version]
- Rembisz, W. Relacje wynagrodzenia i wydajności czynnika pracy w rolnictwie na tle gospodarki narodowej i jej sektorów w Polsce w okresie 2005−2012 (Relationship Between Labour Productivity and Its Remuneration in Agriculture in Comparison with National Economy and Its Sectors in Poland in the Period 2005-2012). Wieś Rol. 2016, 2, 41–58. [Google Scholar]
- Góral, J.; Rembisz, W. Remunerations and Labour Productivity in Agriculture Against a Background of other Economy Sectors. Acta Sci. Pol. Oeconomia 2018, 17, 49–58. [Google Scholar] [CrossRef]
- Guth, M.; Smędzik-Ambroży, K.; Czyżewski, B.; Stępień, S. The Economic Sustainability of Farms under Common Agricultural Policy in the European Union Countries. Agriculture 2020, 10, 34. [Google Scholar] [CrossRef] [Green Version]
- Czyżewski, B.; Czyżewski, A.; Kryszak, Ł. The Market Treadmill Against Sustainable Income of European Farmers: How the CAP Has Struggled with Cochrane’s Curse. Sustainability 2019, 11, 791. [Google Scholar] [CrossRef] [Green Version]
- Cochrane, W.W. Farm Prices: Myth and Reality; University of Minnesota Press: Minneapolis, MN, USA, 1958. [Google Scholar]
- EUROSTAT. Statistics Explained. Available online: www.europa.eu (accessed on 20 May 2020).
- Kołodziejczak, W.; Wysocki, F. Determinanty Aktywności Ekonomicznej Ludności Wiejskiej w Polsce (Determinants of Economic Activity of the Rural Population in Poland); Wydawnictwo Uniwersytetu Przyrodniczego w Poznaniu: Poznań, Poland, 2015. [Google Scholar]
- Fisher, A.G.B. Production, primary, secondary and tertiary. Econ. Rec. 1939, 15, 24–38. [Google Scholar] [CrossRef]
- Górny, A.; Kaczmarczyk, P. A Known But Uncertain Path: The Role of Freign Labour in Polish Agriculture. J. Rural Stud. 2018, 64, 177–188. [Google Scholar] [CrossRef]
- Jordan, D.; O’Leary, E. Is Irish Innovation Policy Working? Evidence from Irish High-Technology Businesses. Paper Presented to a Meeting of the Statistical and Social Inquiry Society of Ireland in Dublin, 25 October 2007, Dublin, Ireland, 2007. Available online: https://www.researchgate.net/publication/229047255_Is_Irish_innovation_policy_working_Evidence_from_Irish_high-technology_businesses (accessed on 20 May 2020).
- Statista. The Financial Sector in Luxembourg—Statistics & Factsh. Available online: https://www.statista.com/topics/4189/the-financial-sector-in-luxembourg/ (accessed on 20 May 2020).
- Czyżewski, B.; Kłodowska, M.; Matuszczak, A.; Matuszewska, A.; Śmidoda, D. Social Sustainability in Agricultural Farms with Selected Types of Production in European Union Countries. Ann. Pol. Assoc. Agric. Agribus. Econ. 2018, 20, 35–40. [Google Scholar] [CrossRef]
- Kowalczyk, S.; Sobiecki, R. Europejski model rolnictwa wobec wyzwań globalnych (The European Model of Agriculture In Relation to Global Challenges). Zagadnienia Ekon. Rolnej 2011, 4, 35–58. [Google Scholar]
Figure 1.
Scatter plots for the share of agriculture in the employment structure and GVA per 1 person employed in the agriculture in the EU countries in 2000 and 2008. Source: the author’s study based on [58].
Figure 1.
Scatter plots for the share of agriculture in the employment structure and GVA per 1 person employed in the agriculture in the EU countries in 2000 and 2008. Source: the author’s study based on [58].


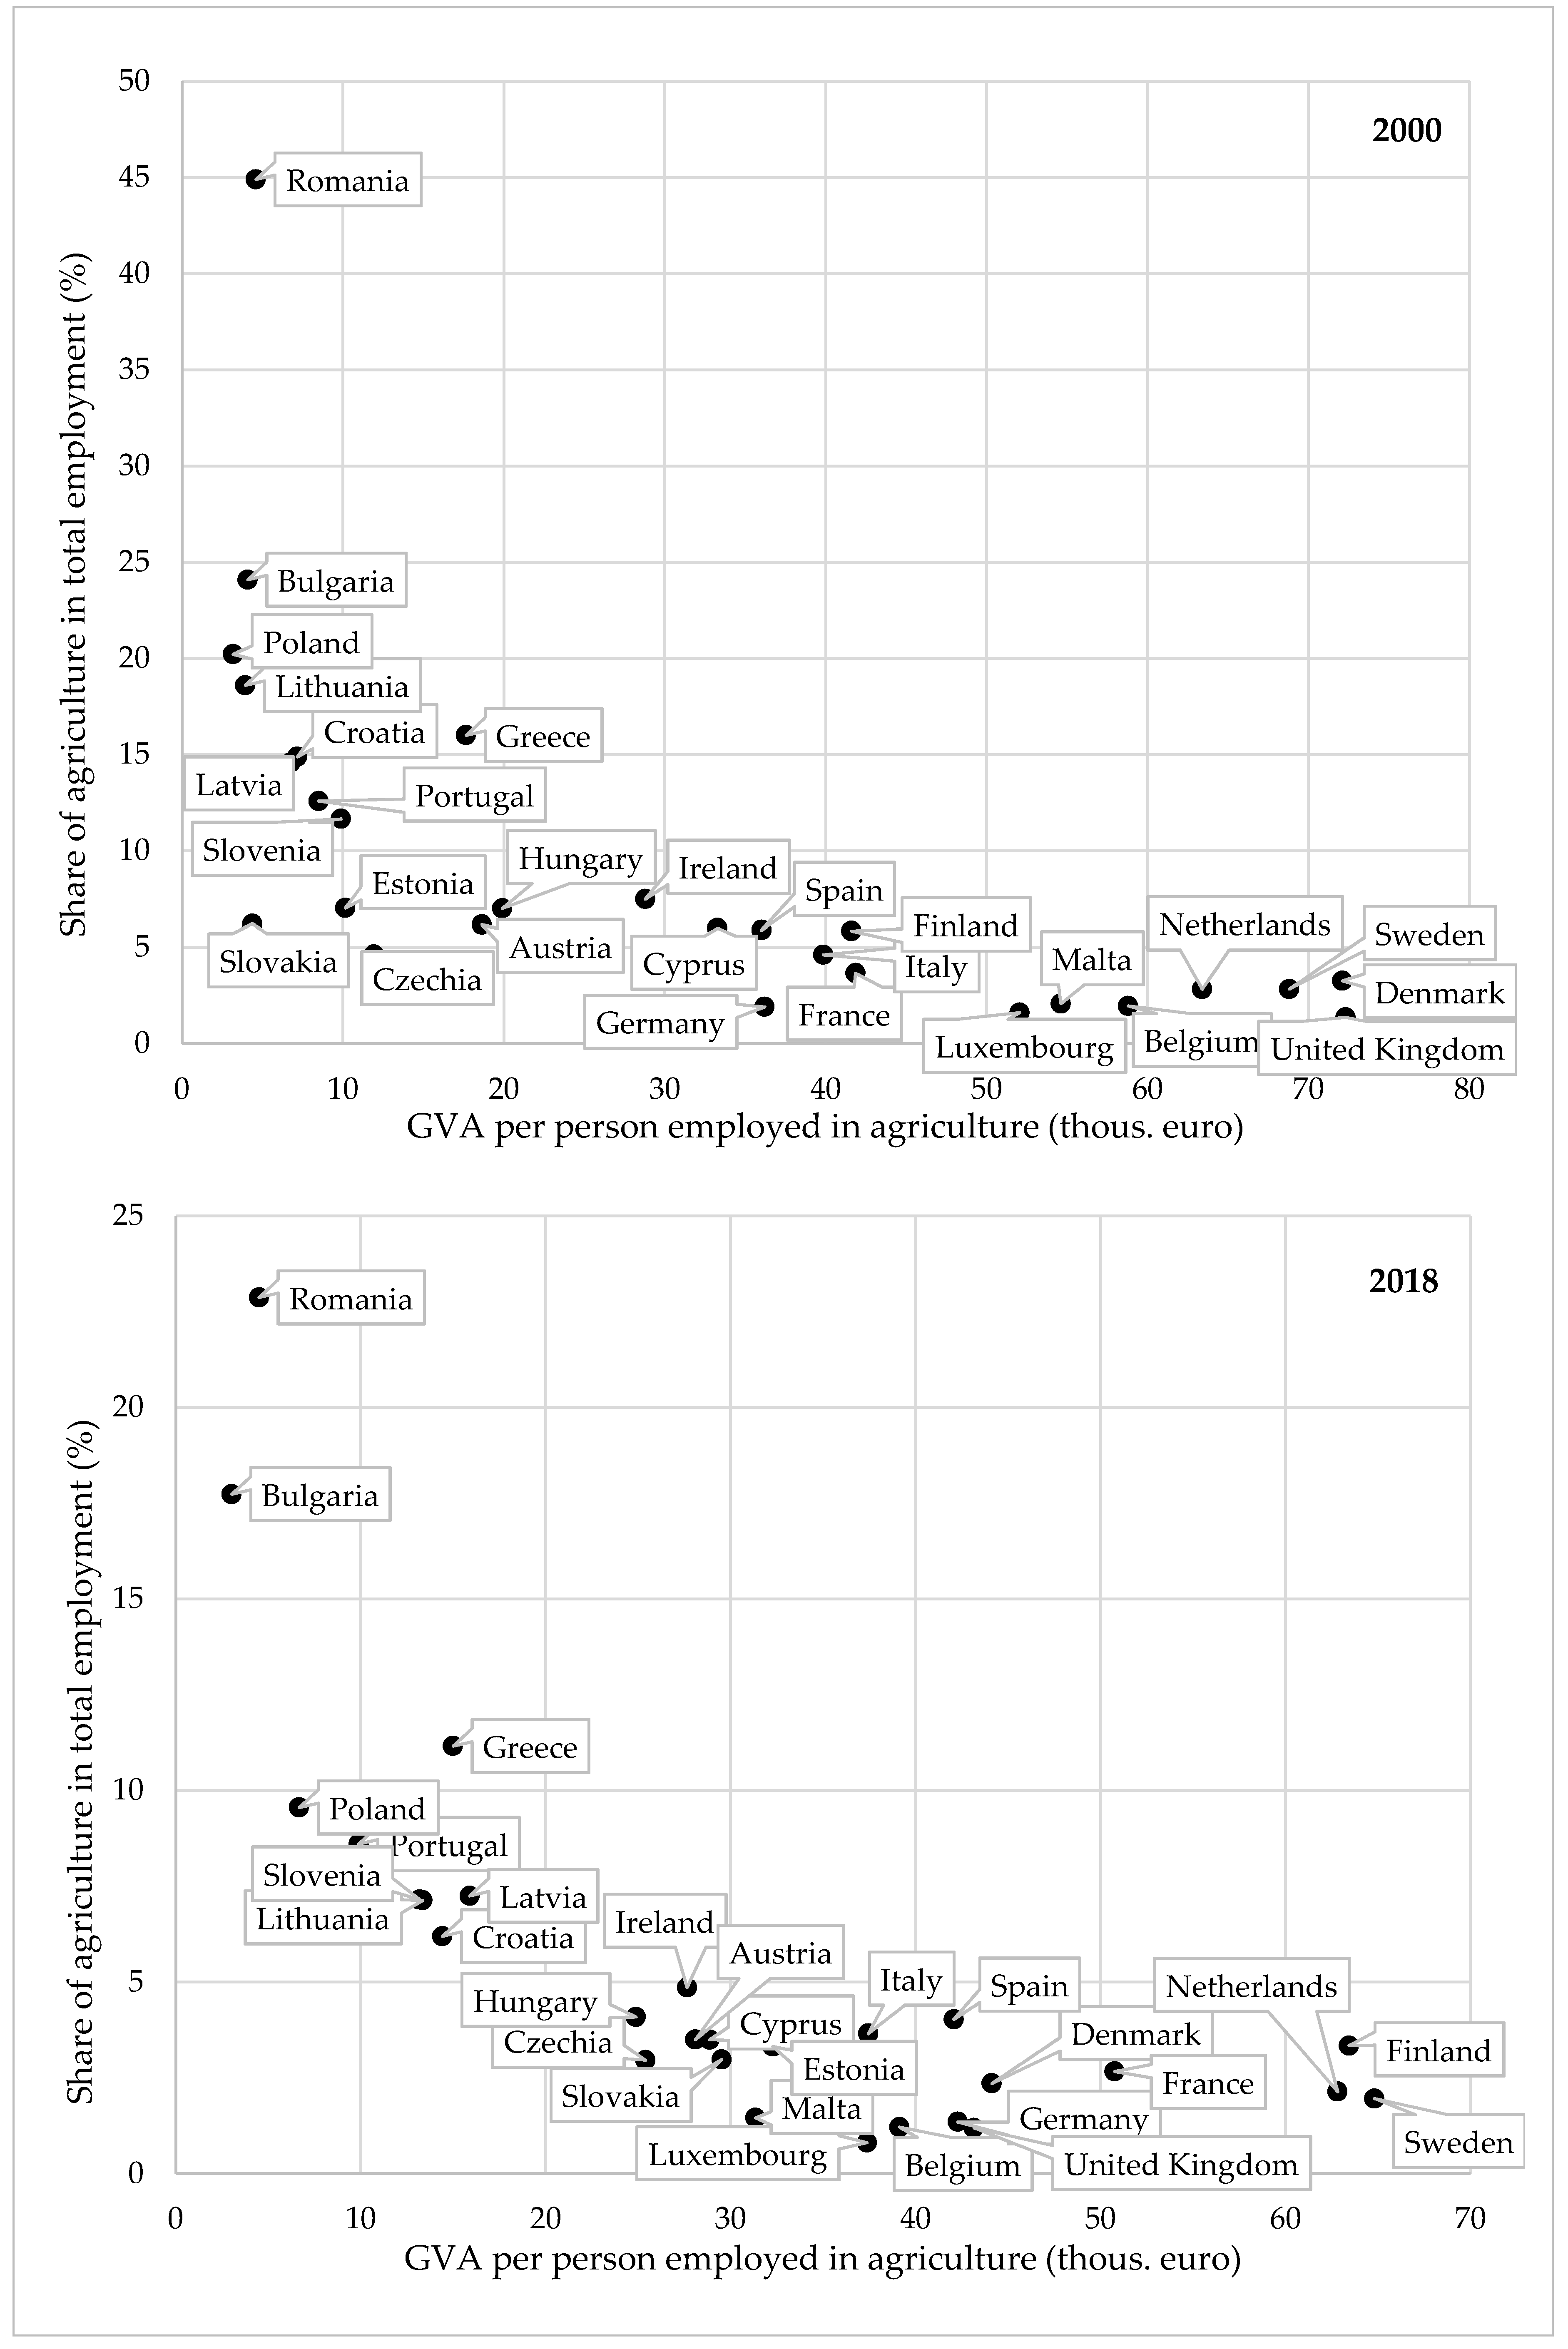
Table 1.
Total employment (thous.) and share of individual sectors in the employment structure (%) in 2000 and 2018.
Table 1.
Total employment (thous.) and share of individual sectors in the employment structure (%) in 2000 and 2018.
| Countries | Total | Agriculture | Industry | Services | ||||
|---|---|---|---|---|---|---|---|---|
| 2000 | 2018 | 2000 | 2018 | 2000 | 2018 | 2000 | 2018 | |
| EU-28 | 214,905.4 | 238,919.6 | 7.7 | 4.2 | 20.7 | 17.0 | 71.6 | 78.8 |
| EU-17 | 169,990.5 | 192,225.7 | 3.8 | 2.7 | 19.7 | 15.4 | 76.5 | 81.9 |
| Belgium | 4109.7 | 4817.1 | 2.0 | 1.2 | 17.0 | 11.7 | 81.1 | 87.1 |
| Denmark | 2755.0 | 2963.0 | 3.3 | 2.4 | 15.5 | 10.8 | 81.2 | 86.8 |
| Germany | 39,971.0 | 44,854.0 | 1.9 | 1.4 | 21.2 | 18.5 | 76.9 | 80.1 |
| Ireland | 1695.8 | 2212.0 | 7.5 | 4.9 | 18.7 | 11.1 | 73.8 | 84.0 |
| Greece | 4312.8 | 4146.1 | 16.0 | 11.2 | 12.2 | 9.4 | 71.8 | 79.5 |
| Spain | 16,706.5 | 19,816.7 | 5.9 | 4.0 | 18.4 | 11.3 | 75.7 | 84.7 |
| France | 25,602.0 | 28,114.0 | 3.7 | 2.7 | 14.6 | 10.3 | 81.8 | 87.1 |
| Italy | 23,028.6 | 25,342.3 | 4.6 | 3.7 | 21.1 | 16.9 | 74.2 | 79.5 |
| Cyprus | 314.8 | 423.6 | 6.0 | 3.5 | 12.7 | 9.3 | 81.3 | 87.2 |
| Luxembourg | 264.1 | 448.8 | 1.6 | 0.8 | 14.3 | 8.3 | 84.1 | 90.8 |
| Malta | 146.4 | 235.7 | 2.1 | 1.5 | 24.9 | 11.4 | 73.0 | 87.2 |
| Netherlands | 8203.0 | 9367.0 | 2.8 | 2.1 | 12.3 | 9.1 | 84.9 | 88.7 |
| Austria | 3755.0 | 4489.0 | 6.2 | 3.5 | 18.9 | 15.9 | 74.9 | 80.6 |
| Portugal | 5041.9 | 4914.5 | 12.6 | 8.6 | 21.7 | 17.1 | 65.7 | 74.3 |
| Finland | 2299.8 | 2626.1 | 5.8 | 3.3 | 20.4 | 14.3 | 73.7 | 82.3 |
| Sweden | 4301.0 | 5013.0 | 2.8 | 2.0 | 18.3 | 12.5 | 78.9 | 85.5 |
| UK | 27,483.3 | 32,443.0 | 1.4 | 1.2 | 26.0 | 21.3 | 72.7 | 77.5 |
| EU-11 | 44,914.8 | 46,693.9 | 22.2 | 10.6 | 24.7 | 23.2 | 53.1 | 66.2 |
| Bulgaria | 3239.2 | 3521.6 | 24.1 | 17.7 | 23.6 | 20.2 | 52.3 | 62.0 |
| Czechia | 4859.3 | 5418.1 | 4.6 | 3.0 | 30.4 | 29.0 | 64.9 | 68.1 |
| Estonia | 584.8 | 646.6 | 7.0 | 3.3 | 25.6 | 20.8 | 67.4 | 75.9 |
| Croatia | 1565.0 | 1664.4 | 14.9 | 6.2 | 24.3 | 20.4 | 60.9 | 73.4 |
| Latvia | 923.7 | 900.2 | 14.6 | 7.3 | 18.7 | 15.7 | 66.7 | 77.0 |
| Lithuania | 1399.2 | 1380.6 | 18.6 | 7.1 | 20.4 | 18.3 | 61.0 | 74.6 |
| Hungary | 4115.8 | 4666.6 | 7.0 | 4.1 | 27.6 | 21.4 | 65.4 | 74.5 |
| Poland | 14,516.6 | 16,403.7 | 20.2 | 9.6 | 24.4 | 24.2 | 55.4 | 66.3 |
| Romania | 10,771.6 | 8651.4 | 44.9 | 22.9 | 22.0 | 22.0 | 33.1 | 55.1 |
| Slovenia | 914.7 | 1020.7 | 11.7 | 7.2 | 29.5 | 23.1 | 58.9 | 69.7 |
| Slovakia | 2024.9 | 2419.9 | 6.2 | 3.0 | 28.2 | 24.2 | 65.6 | 72.8 |
Source: the author’s study based on [58].
Table 2.
Total GVA (thous. EUR) and share of individual sectors in the GVA structure (%) in 2000 and 2018.
Table 2.
Total GVA (thous. EUR) and share of individual sectors in the GVA structure (%) in 2000 and 2018.
| Countries | Total | Agriculture | Industry | Services | ||||
|---|---|---|---|---|---|---|---|---|
| 2000 | 2018 | 2000 | 2018 | 2000 | 2018 | 2000 | 2018 | |
| EU-28 | 12,675,657.4 | 14,560,680.1 | 2.3 | 1.6 | 22.0 | 19.0 | 75.7 | 79.4 |
| EU-17 | 11,890,079.9 | 13,342,320.5 | 2.0 | 1.5 | 21.7 | 18.4 | 76.3 | 80.1 |
| Belgium | 359,293.6 | 409,856.2 | 1.3 | 0.6 | 22.8 | 16.2 | 75.9 | 83.3 |
| Denmark | 259,774.3 | 261,417.5 | 2.5 | 1.2 | 22.0 | 18.2 | 75.5 | 80.6 |
| Germany | 2,513,936.3 | 3,012,310.0 | 1.1 | 0.9 | 25.6 | 25.4 | 73.3 | 73.7 |
| Ireland | 129,894.0 | 303,076.1 | 2.8 | 1.0 | 28.3 | 36.5 | 68.9 | 62.5 |
| Greece | 200,360.3 | 163,705.1 | 6.1 | 4.2 | 14.0 | 14.9 | 79.9 | 80.9 |
| Spain | 860,976.2 | 1,087,968.0 | 4.1 | 3.1 | 20.7 | 15.9 | 75.2 | 81.0 |
| France | 1,678,114.6 | 2,090,925.0 | 2.3 | 1.8 | 18.9 | 13.4 | 78.8 | 84.8 |
| Italy | 1,480,458.6 | 1,584,462.2 | 2.9 | 2.2 | 22.3 | 19.6 | 74.9 | 78.2 |
| Cyprus | 15,679.5 | 18,261.0 | 4.0 | 2.3 | 11.2 | 7.9 | 84.8 | 89.8 |
| Luxembourg | 31,871.7 | 54,377.7 | 0.7 | 0.3 | 12.6 | 7.0 | 86.7 | 92.7 |
| Malta | 7429.3 | 10,897.3 | 2.2 | 1.0 | 24.0 | 10.2 | 73.7 | 88.8 |
| Netherlands | 576,950.0 | 692,777.0 | 2.6 | 1.8 | 18.9 | 15.2 | 78.6 | 83.0 |
| Austria | 234,138.2 | 344,658.8 | 1.8 | 1.3 | 24.2 | 22.1 | 74.0 | 76.6 |
| Portugal | 151,879.7 | 176,705.2 | 3.5 | 2.4 | 20.3 | 17.9 | 76.2 | 79.7 |
| Finland | 165,759.7 | 201,583.0 | 3.4 | 2.8 | 30.0 | 20.5 | 66.7 | 76.8 |
| Sweden | 381,725.5 | 459,631.6 | 2.2 | 1.4 | 25.4 | 18.3 | 72.4 | 80.3 |
| UK | 2,841,838.6 | 2,469,708.9 | 1.0 | 0.7 | 19.8 | 13.6 | 79.2 | 85.7 |
| EU-11 | 785,577.5 | 1,218,359.6 | 6.2 | 3.1 | 26.1 | 25.2 | 67.7 | 71.7 |
| Bulgaria | 25,555.8 | 48,634.1 | 12.5 | 3.9 | 20.9 | 21.6 | 66.6 | 74.5 |
| Czechia | 78,515.3 | 186,727.8 | 3.4 | 2.2 | 30.8 | 30.2 | 65.8 | 67.6 |
| Estonia | 9607.5 | 22,661.9 | 4.3 | 3.1 | 21.9 | 20.5 | 73.8 | 76.5 |
| Croatia | 27,497.2 | 41,856.2 | 6.1 | 3.6 | 24.7 | 20.2 | 69.3 | 76.2 |
| Latvia | 18,669.7 | 25,310.7 | 4.9 | 4.1 | 19.5 | 15.8 | 75.6 | 80.1 |
| Lithuania | 16,311.5 | 40,678.3 | 6.3 | 3.2 | 23.6 | 21.4 | 70.1 | 75.3 |
| Hungary | 99,168.3 | 112,913.7 | 5.8 | 4.2 | 26.6 | 24.8 | 67.6 | 71.0 |
| Poland | 267,223.6 | 434,406.4 | 3.5 | 2.4 | 24.3 | 25.0 | 72.2 | 72.6 |
| Romania | 184,722.5 | 184,952.1 | 12.0 | 4.8 | 27.7 | 25.2 | 60.2 | 70.0 |
| Slovenia | 29,818.0 | 39,838.5 | 3.5 | 2.4 | 28.4 | 26.9 | 68.1 | 70.7 |
| Slovakia | 28,488.1 | 80,379.9 | 1.9 | 2.6 | 27.6 | 24.7 | 70.5 | 72.6 |
Source: the author’s study based on [58]. GVA: gross value added.
Table 3.
Change in the employment and GVA in 2000–2018 (%).
| Countries | Total | Agriculture | Industry | Services | ||||
|---|---|---|---|---|---|---|---|---|
| Employment | GVA | Employment | GVA | Employment | GVA | Employment | GVA | |
| EU-28 | 11.2 | 14.9 | −38.5 | −17.9 | −9.1 | −0.8 | 22.4 | 20.4 |
| EU-17 | 13.1 | 12.2 | −20.5 | −16.9 | −11.3 | −4.8 | 21.0 | 17.8 |
| Belgium | 17.2 | 14.1 | −27.2 | −51.5 | −19.4 | −19.2 | 26.0 | 25.2 |
| Denmark | 7.5 | 0.6 | −22.2 | −52.4 | −25.1 | −16.6 | 15.0 | 7.4 |
| Germany | 12.2 | 19.8 | −20.6 | −7.3 | −1.9 | 19.1 | 16.9 | 20.5 |
| Ireland | 30.4 | 133.3 | −15.4 | −18.8 | −22.7 | 201.4 | 48.6 | 111.6 |
| Greece | −3.9 | −18.3 | −33.0 | −43.1 | −25.9 | −13.2 | 6.4 | −17.3 |
| Spain | 18.6 | 26.4 | −18.9 | −5.2 | −27.1 | −2.9 | 32.7 | 36.1 |
| France | 9.8 | 24.6 | −19.8 | −2.8 | −22.5 | −11.6 | 16.9 | 34.1 |
| Italy | 10.0 | 7.0 | −12.7 | −18.0 | −12.2 | −5.8 | 17.8 | 11.8 |
| Cyprus | 34.6 | 16.5 | −21.4 | −31.8 | −1.5 | −17.6 | 44.3 | 23.2 |
| Luxembourg | 70.0 | 70.6 | −14.5 | −38.6 | −0.6 | −4.5 | 83.5 | 82.4 |
| Malta | 61.0 | 46.7 | 13.2 | −35.1 | −26.6 | −37.8 | 92.2 | 76.7 |
| Netherlands | 14.2 | 20.1 | −13.7 | −14.5 | −14.8 | −3.2 | 19.3 | 26.8 |
| Austria | 19.5 | 47.2 | −32.1 | 2.3 | 0.6 | 34.7 | 28.6 | 52.4 |
| Portugal | −2.5 | 16.3 | −33.4 | −22.4 | −23.5 | 3.0 | 10.3 | 21.7 |
| Finland | 14.2 | 21.6 | −34.7 | −0.5 | −19.9 | −16.8 | 27.5 | 40.0 |
| Sweden | 16.6 | 20.4 | −18.0 | −22.8 | −20.3 | −13.3 | 26.4 | 33.6 |
| UK | 18.0 | −13.1 | 3.5 | −38.3 | −3.2 | −40.2 | 25.9 | −6.0 |
| EU-11 | 4.0 | 55.1 | −50.3 | −22.6 | −2.4 | 49.6 | 29.6 | 64.3 |
| Bulgaria | 8.7 | 90.3 | −20.0 | −40.7 | −6.8 | 96.4 | 29.0 | 113.0 |
| Czechia | 11.5 | 137.8 | −28.5 | 52.1 | 6.1 | 133.0 | 16.9 | 144.6 |
| Estonia | 10.6 | 135.9 | −47.8 | 66.0 | −10.2 | 120.7 | 24.5 | 144.5 |
| Croatia | 6.3 | 52.2 | −55.7 | −10.8 | −10.5 | 24.7 | 28.3 | 67.5 |
| Latvia | −2.5 | 35.6 | −51.6 | 13.3 | −18.0 | 9.7 | 12.6 | 43.7 |
| Lithuania | −1.3 | 149.4 | −62.1 | 28.5 | −11.5 | 126.4 | 20.6 | 167.9 |
| Hungary | 13.4 | 13.9 | −33.8 | −17.2 | −12.0 | 6.0 | 29.1 | 19.6 |
| Poland | 13.0 | 62.6 | −46.6 | 12.2 | 12.0 | 67.1 | 35.2 | 63.5 |
| Romania | −19.7 | 0.1 | −59.1 | −59.8 | −19.4 | −9.0 | 33.5 | 16.3 |
| Slovenia | 11.6 | 33.6 | −31.5 | −8.6 | −12.6 | 26.8 | 32.2 | 38.6 |
| Slovakia | 19.5 | 182.2 | −42.7 | 286.2 | 2.7 | 153.1 | 32.6 | 190.7 |
Source: the author’s study based on [58].
Table 4.
Annual GVA per 1 person employed in 2018 (thous. EUR) and its change in 2000–2018 (%).
| Countries | Total | Agriculture | Industry | Services | ||||
|---|---|---|---|---|---|---|---|---|
| GVA | % | GVA | % | GVA | % | GVA | % | |
| EU-28 | 60.9 | 3.3 | 23.3 | 33.6 | 68.3 | 9.1 | 61.4 | −1.6 |
| EU-17 | 69.4 | −0.8 | 38.4 | 4.5 | 82.9 | 7.3 | 67.9 | −2.6 |
| Belgium | 85.1 | −2.7 | 39.1 | −33.4 | 117.8 | 0.2 | 81.3 | −0.6 |
| Denmark | 88.2 | −6.4 | 44.1 | −38.8 | 148.8 | 11.2 | 81.9 | −6.6 |
| Germany | 67.2 | 6.8 | 42.3 | 16.8 | 92.1 | 21.4 | 61.8 | 3.1 |
| Ireland | 137.0 | 78.9 | 27.6 | −4.0 | 451.1 | 289.7 | 101.9 | 42.4 |
| Greece | 39.5 | −15.0 | 15.0 | −15.1 | 62.6 | 17.2 | 40.2 | −22.2 |
| Spain | 54.9 | 6.5 | 42.1 | 16.8 | 77.0 | 33.2 | 52.6 | 2.6 |
| France | 74.4 | 13.5 | 50.8 | 21.3 | 97.1 | 14.2 | 72.4 | 14.7 |
| Italy | 62.5 | −2.7 | 37.4 | −6.0 | 72.7 | 7.3 | 61.5 | −5.1 |
| Cyprus | 43.1 | −13.4 | 28.9 | −13.3 | 36.7 | −16.3 | 44.4 | −14.6 |
| Luxembourg | 121.2 | 0.4 | 37.4 | −28.2 | 102.3 | −3.9 | 123.7 | −0.6 |
| Malta | 46.2 | −8.9 | 31.3 | −42.6 | 41.4 | −15.3 | 47.1 | −8.1 |
| Netherlands | 74.0 | 5.2 | 62.8 | −0.9 | 123.1 | 13.6 | 69.2 | 6.3 |
| Austria | 76.8 | 23.1 | 28.1 | 50.7 | 106.7 | 33.8 | 73.0 | 18.5 |
| Portugal | 36.0 | 19.4 | 9.9 | 16.5 | 37.8 | 34.6 | 38.5 | 10.3 |
| Finland | 76.8 | 6.5 | 63.4 | 52.5 | 109.7 | 3.8 | 71.6 | 9.8 |
| Sweden | 91.7 | 3.3 | 64.8 | −5.8 | 134.3 | 8.8 | 86.1 | 5.7 |
| UK | 76.1 | −26.4 | 43.2 | −40.3 | 48.7 | −38.2 | 84.2 | −25.4 |
| EU-11 | 26.1 | 49.2 | 7.6 | 55.6 | 28.3 | 53.3 | 28.3 | 26.8 |
| Bulgaria | 13.8 | 75.0 | 3.0 | −26.0 | 14.7 | 110.9 | 16.6 | 65.1 |
| Czechia | 34.5 | 113.3 | 25.4 | 112.7 | 35.9 | 119.5 | 34.2 | 109.3 |
| Estonia | 35.0 | 113.3 | 32.3 | 218.1 | 34.6 | 145.8 | 35.3 | 96.3 |
| Croatia | 25.1 | 43.1 | 14.4 | 101.3 | 24.9 | 39.4 | 26.1 | 30.6 |
| Latvia | 28.1 | 39.1 | 15.9 | 134.1 | 28.2 | 33.9 | 29.3 | 27.6 |
| Lithuania | 29.5 | 152.7 | 13.3 | 239.3 | 34.6 | 155.8 | 29.8 | 122.2 |
| Hungary | 24.2 | 0.4 | 24.9 | 25.0 | 28.0 | 20.4 | 23.1 | −7.4 |
| Poland | 26.5 | 43.9 | 6.7 | 110.2 | 27.4 | 49.2 | 29.0 | 20.9 |
| Romania | 21.4 | 24.7 | 4.5 | −1.8 | 24.5 | 12.9 | 27.1 | −12.9 |
| Slovenia | 39.0 | 19.7 | 13.2 | 33.4 | 45.5 | 45.0 | 39.5 | 4.8 |
| Slovakia | 33.2 | 136.1 | 29.5 | 573.6 | 33.9 | 146.4 | 33.1 | 119.2 |
Source: the author’s study based on [58].
Table 5.
Pearson correlation coefficients between the GVA per 1 person employed and the size of employment in individual sectors of the national economy in the EU countries in 2000–2018 *.
Table 5.
Pearson correlation coefficients between the GVA per 1 person employed and the size of employment in individual sectors of the national economy in the EU countries in 2000–2018 *.
| Countries | Total | p < 0.05 | Agriculture | p < 0.05 | Industry | p < 0.05 | Services | p < 0.05 |
|---|---|---|---|---|---|---|---|---|
| EU-28 | 0.20 | − | −0.31 | − | −0.02 | − | 0.27 | − |
| EU-17 | −0.06 | − | −0.21 | − | −0.20 | − | −0.02 | − |
| Belgium | −0.20 | − | 0.54 | + | −0.20 | −0.08 | + | |
| Denmark | −0.17 | − | 0.62 | + | −0.53 | − | −0.40 | + |
| Germany | 0.47 | − | −0.24 | − | 0.01 | − | 0.11 | − |
| Ireland | 0.67 | + | 0.56 | + | −0.45 | + | 0.76 | + |
| Greece | 0.84 | + | 0.64 | + | −0.12 | − | 0.59 | + |
| Spain | 0.39 | − | 0.04 | − | −0.90 | + | 0.11 | − |
| France | 0.79 | −0.39 | + | −0.70 | − | 0.79 | + | |
| Italy | −0.34 | − | 0.38 | − | −0.25 | − | −0.57 | + |
| Cyprus | −0.66 | − | 0.64 | + | 0.09 | − | −0.71 | + |
| Luxembourg | 0.04 | − | 0.06 | − | 0.43 | + | 0.05 | − |
| Malta | −0.21 | − | −0.37 | − | 0.76 | + | −0.31 | − |
| Netherlands | −0.12 | − | 0.03 | − | −0.75 | + | −0.09 | − |
| Austria | 0.73 | -0.85 | + | −0.01 | − | 0.63 | + | |
| Portugal | −0.32 | − | -0.37 | − | −0.70 | + | 0.42 | + |
| Finland | −0.19 | − | -0.85 | + | 0.43 | + | 0.17 | + |
| Sweden | 0.42 | + | 0.21 | − | −0.58 | + | 0.67 | + |
| UK | −0.64 | + | −0.79 | + | −0.19 | + | −0.58 | + |
| EU-11 | −0.22 | − | −0.49 | − | −0.11 | − | −0.06 | − |
| Bulgaria | 0.34 | − | 0.63 | + | −0.63 | + | 0.75 | + |
| Czechia | 0.92 | + | −0.76 | + | 0.25 | − | 0.97 | + |
| Estonia | 0.59 | + | −0.86 | + | −0.75 | + | 0.92 | + |
| Croatia | 0.69 | + | −0.82 | − | −0.58 | + | 0.59 | + |
| Latvia | −0.10 | − | −0.87 | − | −0.90 | + | 0.66 | + |
| Lithuania | −0.23 | − | −0.87 | + | −0.76 | + | 0.89 | + |
| Hungary | −0.07 | − | −0.40 | + | −0.29 | − | −0.52 | + |
| Poland | 0.87 | + | −0.92 | + | 0.67 | + | 0.59 | + |
| Romania | −0.40 | + | 0.37 | − | −0.80 | + | 0.40 | + |
| Slovenia | 0.75 | + | −0.51 | + | −0.76 | + | 0.54 | + |
| Slovakia | 0.92 | + | −0.84 | + | −0.37 | + | 0.98 | + |
* Panel correlation analysis of time series spanning from 2000 to 2018. Note: + refers to statistically significant parameters (p < 0.05); − refers to not statistically significant parameters. Source: the author’s study based on [58].
Table 6.
Employment surplus in agriculture in relation to the baseline (EERAS) and the share of agriculture in the employment structure, assuming that the GVA per 1 person employed in the agriculture needs to be equal to the value of GVA in the industry and the services sectors (jointly).
Table 6.
Employment surplus in agriculture in relation to the baseline (EERAS) and the share of agriculture in the employment structure, assuming that the GVA per 1 person employed in the agriculture needs to be equal to the value of GVA in the industry and the services sectors (jointly).
| Countries | Employment in Agriculture in Initial State Thousand. People | Surplus of Employment | The Share of Agriculture in the Employment Structure for: | |||||
|---|---|---|---|---|---|---|---|---|
| EERASc | EERAS-EU11 | EERAS- EU17 | Initial State | EERASc | EERAS-EU11 | EERAS- EU17 | ||
| EU-28 | 10,120.6 | 77.1 | 49.3 | 79.6 | 4.2 | 1.6 | 3.5 | 1.4 |
| EU-17 | 5164.8 | 56.6 | −7.8 | 56.6 | 2.7 | 1.5 | 3.6 | 1.5 |
| Belgium | 58.7 | 66.7 | −0.8 | 59.4 | 1.2 | 0.6 | 1.7 | 0.7 |
| Denmark | 70.0 | 61.6 | −21.3 | 51.2 | 2.4 | 1.2 | 3.7 | 1.5 |
| Germany | 608.0 | 50.3 | −18.6 | 52.2 | 1.4 | 0.8 | 2.0 | 0.8 |
| Ireland | 107.6 | 83.6 | 17.3 | 66.7 | 4.9 | 0.9 | 4.8 | 1.9 |
| Greece | 462.6 | 76.4 | 64.5 | 85.7 | 11.2 | 3.9 | 5.9 | 2.4 |
| Spain | 799.1 | 38.4 | −20.7 | 51.4 | 4.0 | 3.1 | 6.0 | 2.4 |
| France | 752.0 | 45.8 | −43.9 | 42.1 | 2.7 | 1.8 | 4.8 | 1.9 |
| Italy | 927.6 | 48.5 | −15.5 | 53.5 | 3.7 | 2.2 | 4.8 | 2.0 |
| Cyprus | 14.8 | 48.0 | 19.8 | 67.7 | 3.5 | 2.3 | 3.6 | 1.4 |
| Luxembourg | 3.7 | 73.8 | −12.9 | 54.5 | 0.8 | 0.2 | 1.1 | 0.4 |
| Malta | 3.4 | 23.7 | −25.4 | 49.5 | 1.5 | 1.0 | 1.6 | 0.7 |
| Netherlands | 201.0 | 27.0 | −91.6 | 22.9 | 2.1 | 1.8 | 4.8 | 1.9 |
| Austria | 157.4 | 75.7 | 32.6 | 72.9 | 3.5 | 1.3 | 3.5 | 1.4 |
| Portugal | 422.8 | 82.8 | 76.7 | 90.6 | 8.6 | 2.2 | 3.0 | 1.2 |
| Finland | 87.8 | 46.4 | −46.4 | 41.1 | 3.3 | 2.7 | 7.5 | 3.0 |
| Sweden | 100.0 | 42.4 | −87.8 | 24.4 | 2.0 | 1.4 | 4.6 | 1.8 |
| UK | 388.3 | 41.7 | −57.8 | 36.5 | 1.2 | 0.7 | 1.8 | 0.7 |
| EU-11 | 4955.8 | 86.6 | 86.6 | 94.6 | 10.6 | 2.9 | 2.9 | 1.1 |
| Bulgaria | 624.4 | 85.0 | 91.4 | 96.6 | 17.7 | 3.3 | 1.9 | 0.8 |
| Czechia | 160.9 | 47.7 | 35.8 | 74.2 | 3.0 | 2.2 | 2.7 | 1.1 |
| Estonia | 21.5 | 52.1 | 40.4 | 76.0 | 3.3 | 3.0 | 3.8 | 1.5 |
| Croatia | 103.2 | 75.3 | 77.4 | 90.9 | 6.2 | 3.5 | 3.2 | 1.3 |
| Latvia | 65.3 | 73.5 | 72.8 | 89.1 | 7.3 | 4.0 | 4.1 | 1.6 |
| Lithuania | 98.6 | 83.5 | 82.1 | 92.8 | 7.1 | 3.1 | 3.4 | 1.4 |
| Hungary | 191.1 | 31.8 | 41.8 | 76.6 | 4.1 | 4.2 | 3.6 | 1.4 |
| Poland | 1567.2 | 87.5 | 87.4 | 94.9 | 9.6 | 2.2 | 2.3 | 0.9 |
| Romania | 1978.4 | 93.0 | 93.5 | 97.4 | 22.9 | 3.9 | 3.6 | 1.5 |
| Slovenia | 73.1 | 78.0 | 68.1 | 87.1 | 7.2 | 2.3 | 3.3 | 1.3 |
| Slovakia | 72.2 | 49.2 | 40.2 | 75.9 | 3.0 | 2.6 | 3.1 | 1.3 |
Source: the author’s study based on [58].
© 2020 by the author. Licensee MDPI, Basel, Switzerland. This article is an open access article distributed under the terms and conditions of the Creative Commons Attribution (CC BY) license (http://creativecommons.org/licenses/by/4.0/).
Share and Cite
MDPI and ACS Style
Kołodziejczak, W. Employment and Gross Value Added in Agriculture Versus Other Sectors of the European Union Economy. Sustainability 2020, 12, 5518. https://doi.org/10.3390/su12145518
AMA Style
Kołodziejczak W. Employment and Gross Value Added in Agriculture Versus Other Sectors of the European Union Economy. Sustainability. 2020; 12(14):5518. https://doi.org/10.3390/su12145518
Chicago/Turabian StyleKołodziejczak, Włodzimierz. 2020. "Employment and Gross Value Added in Agriculture Versus Other Sectors of the European Union Economy" Sustainability 12, no. 14: 5518. https://doi.org/10.3390/su12145518
Note that from the first issue of 2016, this journal uses article numbers instead of page numbers. See further details here.