A Door-to-Door Waste Collection System Case Study: A Survey on its Sustainability and Effectiveness


Department of Mechanics, Mathematics and Management, Polytechnic University of Bari, 70125 Bari, Italy
*
Author to whom correspondence should be addressed.
Sustainability 2020, 12(14), 5520; https://doi.org/10.3390/su12145520
Submission received: 13 June 2020
/
Revised: 3 July 2020
/
Accepted: 7 July 2020
/
Published: 8 July 2020
(This article belongs to the Collection Smart Production Operations Management and Industry 4.0)
Abstract
:Municipal waste management is a relevant topic these days, in its relation to sustainable and environmental concerns. Sorting waste fractions at home for a door-to-door collection system proves to positively affect the environmental impacts of waste management strategies both by reducing the amounts of the waste landfilled and by originating new circular economies. However, the environmental impact caused by both waste collection and transport, together with waste quality, should be carefully evaluated to assess the sustainability of such a collection system. In order to evaluate the logistic and environmental effectiveness of a newly implemented door-to-door collection system in Altamura, a mid-sized town in Southern Italy, a survey was designed and submitted to a sample of citizens. The results obtained from the 385 completed surveys show that the door-to-door collection of glass waste is inefficient since most of the designated bins remain partially filled and less frequently delivered; citizens are more motivated to adequately collect sorted waste fractions upon receiving information about the subsequent environmental benefits and outcomes of the fractions collected; a high percentage of people still use disposable items in their daily life. Possible changes to the weekly bins collection schedule have been proposed in order to have a more proficient and environmentally sustainable waste collection service in the town. The survey is part of a project aiming at developing a smart device to support users in home waste management.
1. Introduction
Municipal waste management is currently a crucial topic related to a variety of processes, such as waste generation, storage, collection, transport, recovery and disposal in accordance with public health, sustainable development and economic policies [1,2]. The rapid growth of the global population and urbanization have increased the production of municipal solid waste (MSW) with critical socioeconomic and environmental consequences [3,4]. In order to find optimal solutions for both the problem of material resources and the effectiveness of MSW management systems, the concept of Circular Economy (CE) was introduced, based on five principles (Figure 1): waste prevention, reuse, recycling, energy recovery, and waste disposal [5,6].
The concept of Circular Economy (CE) has led to a paradigmatic shift from a linear model (take–make–dispose) generating large amounts of waste, to a circular system where materials and resources are reused throughout the production cycles [7]. In this perspective, the quantity of waste produced and its negative consequences have been reduced through reuse and recycling, and waste has then become a leading actor of this change and a new valuable resource [8]. Converting end-of-life waste allows the reintroduction of waste as a potential resource into new production cycles, so that waste can represent a new source of input material, as described by the CE theory [9,10,11]. The five principles have different economic and environmental costs: for instance, the prevention of waste production represents the best option because of its minimum impact in terms of energy costs and pollution generation; from the second principle through the fifth, the negative impacts on society and environment further increase (Figure 1). The separation of materials at the source and the promotion of recycling and reuse programmes have proven to ensure the sustainability of the employment of natural resources and the reduction of the burden of landfills [1].
In Italy, multiple organizations (such as companies, municipalities, foundations, associations, research centres and universities) have been involved in the transition to the CE policy, and among the five principles of CE (Figure 1), recycling has proven to be the most favourable practice to be adopted for more sustainable MSW management in terms of ecology and health safety [12,13]. On average, European countries produce about 482 kg of waste annually per capita; however, differences in MSW generation have been reported. The countries with the highest waste generation rates are Denmark, Cyprus, Malta and Germany, while the lowest rates are in Romania, Poland, Czech Republic and Slovakia [14]. The level of MSW generation has mainly been affected by the national economic development, so that the richer the country, the more waste that is generated [14].
The European Union has defined the recycling targets to be reached for each type of waste fraction (Directive 2018/851/EU) (Table 1); in actuality, the overall MSW management is addressed at different political levels: central national governments have to determine the national strategies to be adopted, while regional authorities and local communities have to outline the design and implementation of appropriate programmes and technical tools for MSW collection, treatment and disposal [5]. Measuring the effectiveness of MSW management programmes is important to increase general recycling efficiency [15].
A multi-layered structure is essential to better face critical issues related to MSW management. In order to optimize the decision-making process for municipal waste management, careful scenario analyses, optimisation of collection routes, as well as the identification of the best market solutions have been identified as key aspects to monitor the use of resources such as water, energy and materials [16]. Also, as the technologies adopted in MSW management have a direct impact on energy efficiency, using renewable resources such as geothermal energy, solar energy, hydropower and biomass is fundamental to minimise ecological impacts [17,18]. Greenhouse gas emissions and potential energy recovery have been studied as key factors to allow local authorities to draw up efficient MSW management plans [19]. For the implementation of the ‘Industry 4.0’ paradigms [20,21], different tools and technologies have been largely adopted to reduce greenhouse gases emissions and improve economic viability [22]. Moreover, the collection and transport of waste have been analysed in order to evaluate their consequences on public health, costs, depletion of resources, gas emissions and waste handling [23].
Nowadays, different types of MSW collection systems are being implemented in modern cities [24] (Table 2). Several steps have been defined as pivotal features to design a proficient and sustainable MSW collection system [25]: defining the waste fractions to be sorted and collected, selecting specific storage levels, locating MSW disposal points and defining their volume, choosing appropriate waste containers (in relation to the number of inhabitants per disposal point, daily waste generation rate, fractioning rate, collection frequency and waste density) and finally, mapping the distribution of disposal points for each fraction. In addition, other indicators, such as transport distances and the number of vehicles to be employed, have conventionally been used to evaluate the efficiency of a MSW collection system [26].
The door-to-door collection system has been shown to increase the participation of users in sorting and collecting solid waste [27,28]. In particular, the subsequent increase of collected recyclable waste has appeared to reduce its environmental impact in terms of human toxicity, global warming, photochemical oxidation, acidification and eutrophication [27,28]. Nevertheless, waste management policies should be appropriately accompanied by awareness-raising campaigns and programmes involving citizens more closely for a better outcome [27,29,30]. Behavioural surveys have shown that citizens practising separate waste collection using a door-to-door system were more aware of the recycling process and more satisfied with the system, as a result of the effectiveness of the information campaigns that have been locally implemented [28,31]. However, if municipal authorities did not provide appropriate schemes and programmes to facilitate waste collection operations, the correct involvement of citizens in recycling was shown to be very low [15].
As a door-to-door collection system was newly implemented in June 2018 in a mid-sized town in Southern Italy (Altamura, 70,775 inhabitants in December 2018), municipal authorities requested a preliminary academic research study to investigate citizens’ habits in producing and managing recyclable home waste and to evaluate the potential logistic and environmental impacts of the novel MSW management system adopted. An on-line survey was designed and distributed among the town’s citizens, and a statistical analysis of the answers received showed three major results: the domestic production of glass and unsorted refuses appeared to be lower compared to other waste fractions, which suggested a more proficient and sustainable rescheduling of the time planning for corresponding bin collection in terms of transport minimisation; additional social, educational and environmental programmes or information campaigns should be developed to further motivate citizens to properly separate domestic waste products; finally, more than half of the interviewed subjects frequently use plastic disposable items (mainly made of polyethylene terephthalate, PET) [32,33,34,35] for food packaging in daily life, which suggests that municipal authorities should evaluate the feasibility of separately collecting PET waste fractions.
2. Materials and Methods
2.1. Research Area
The municipal authorities of Altamura, a mid-sized town in Southern Italy (70,775 inhabitants in December 2018) adopted a door-to-door collection system in June 2018 to collect separate waste fractions from households.
Prior to that date, community bins were used for this purpose, and citizens had to bring their own garbage to community bins, which were placed at fixed points, such as near street sidewalks. Different containers were used to separately collect waste fractions. This method allowed citizens to deliver their own waste at any time and trucks could collect the waste from the community bins according to the weekly schedules planned by municipal authorities.
In the newly implemented door-to-door collection system, domestic users are required to leave their waste fractions directly outside their houses in a place clearly visible and reachable by collection operators, according to the garbage pick-up schedule set by the municipality (Table 3).
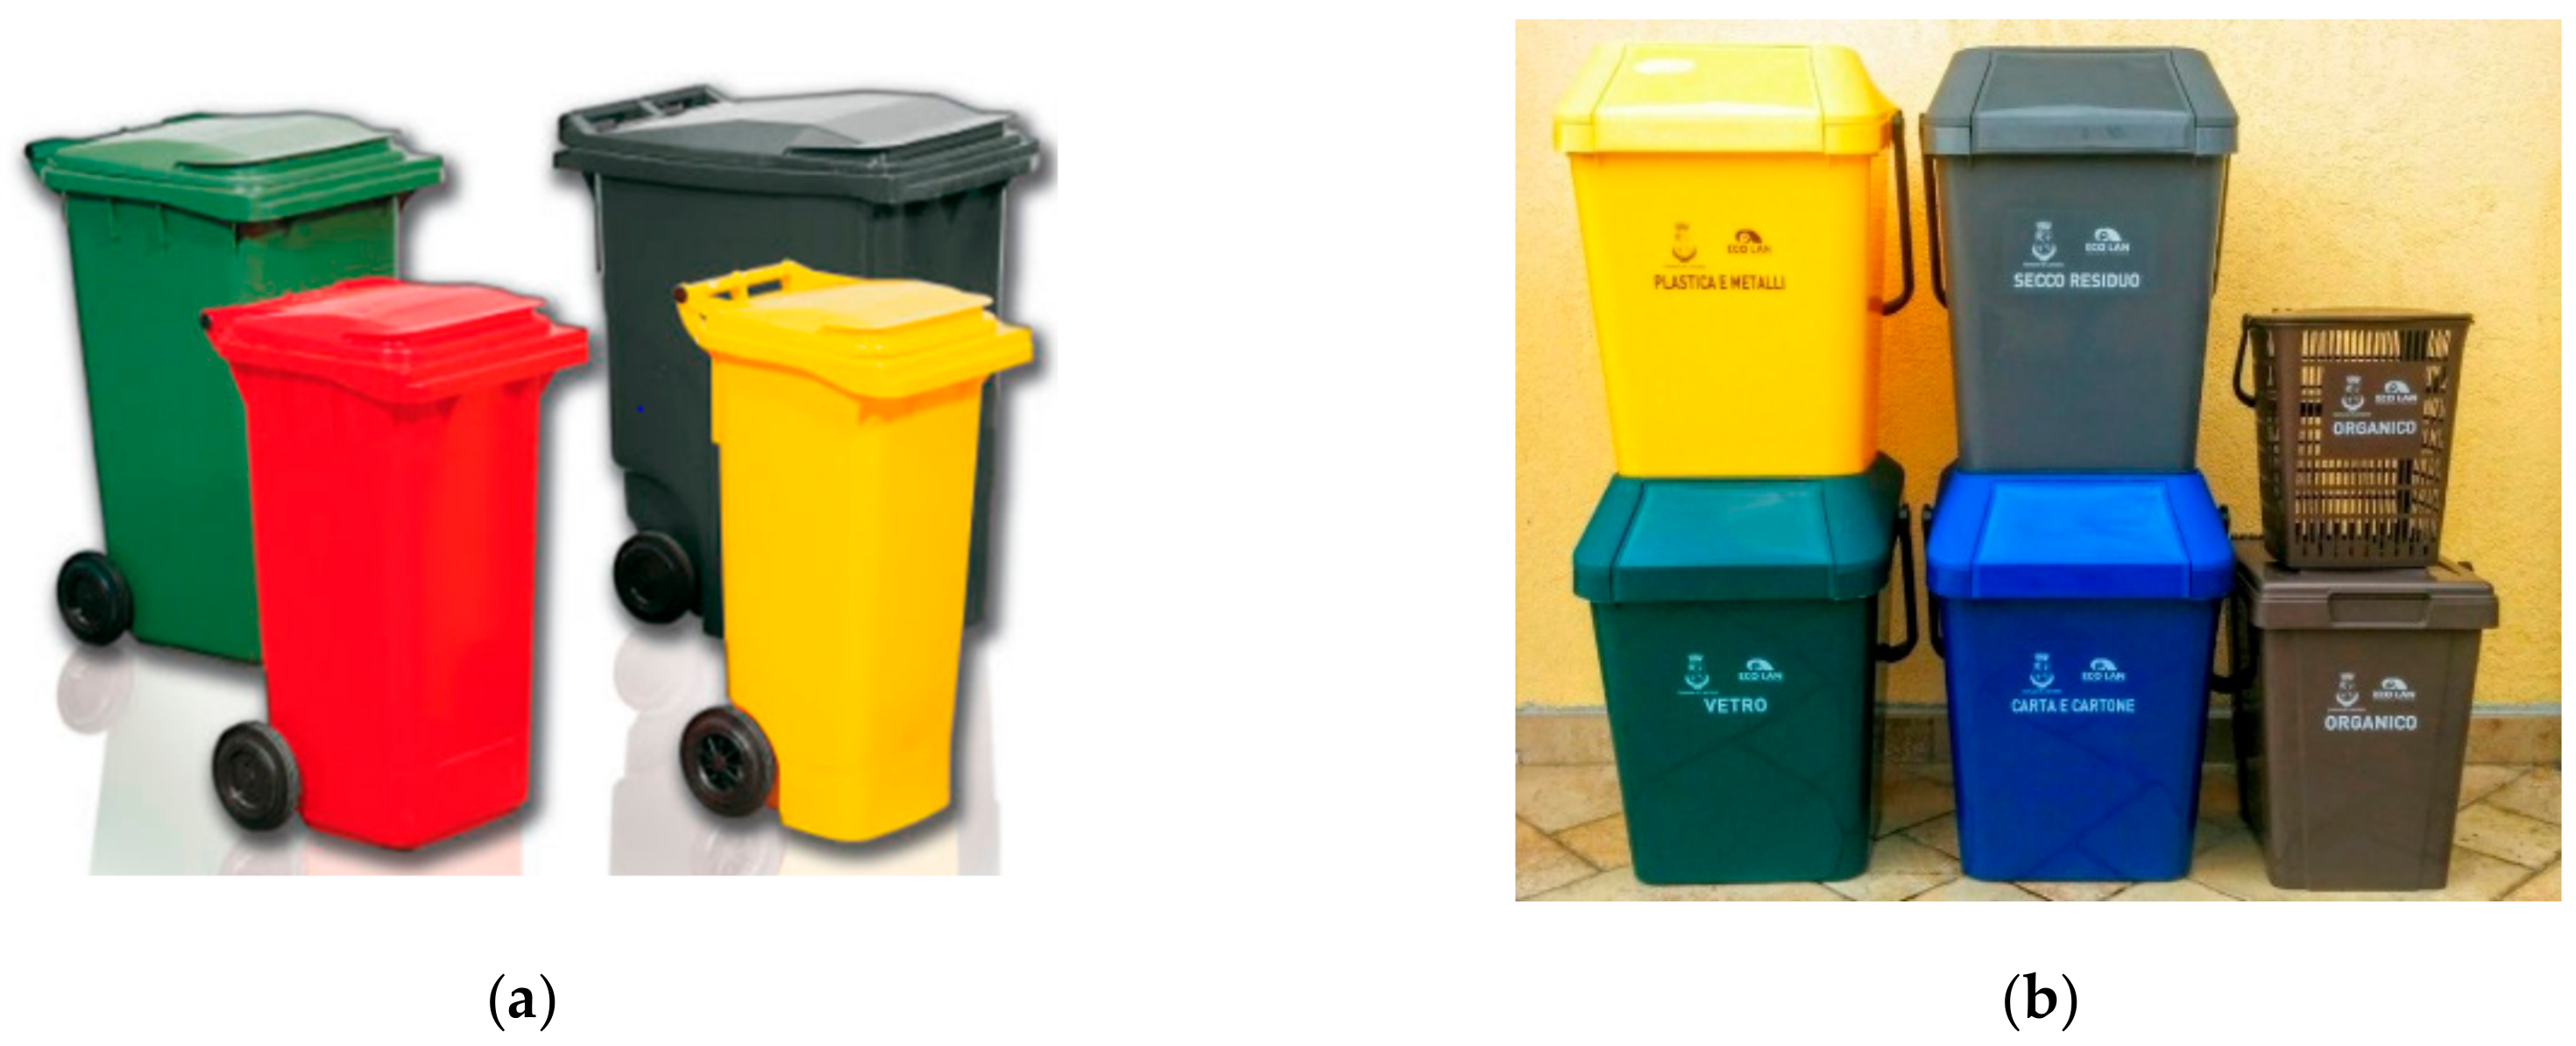
For this purpose, citizens have been provided with different coloured containers or bags, one for each type of waste fraction (Figure 2). It must be highlighted that according to the general disposition of waste collection in the town, blocks with at least 8 flats have been provided with communal big trolleyed bins (45 × 45 × 80 cm3), each one for a single type of waste fraction (paper/cardboard, plastic/metal, organic, glass and mixed waste) (Figure 2a), whereas all the other types of dwellings have been individually equipped with a plastic bag (110 dm3) to collect plastic/metal refuse and one small bin (30 × 25 × 40 cm3) for each other type of separate waste fraction (Figure 2b).
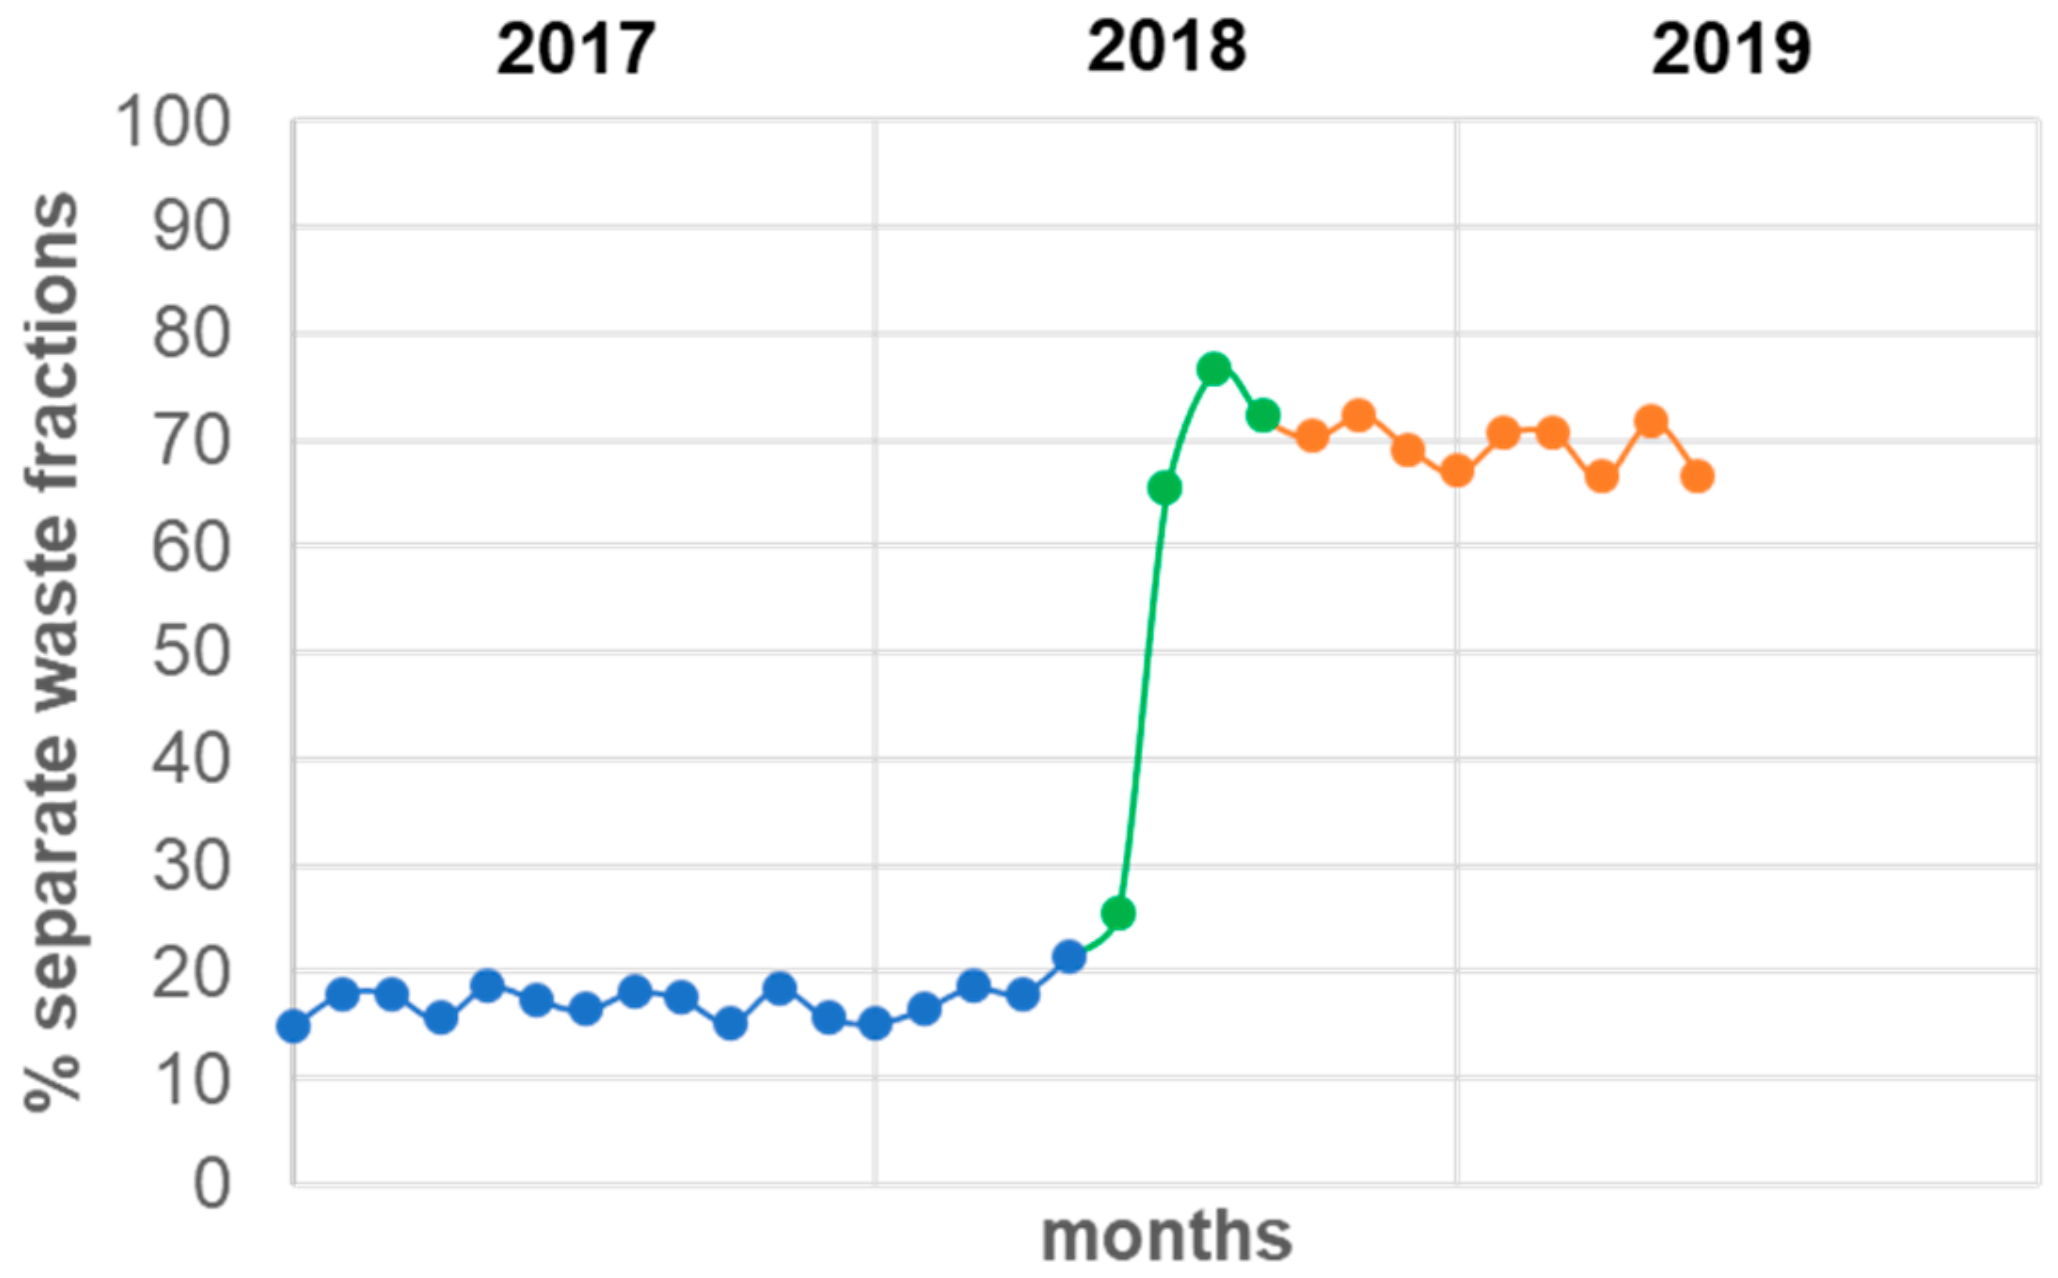
Since the adoption of the door-to-door system in the town in June 2018, but technically implemented in September 2018, the percentage of recyclable waste collected as separate fractions using specific containers rose from about 25% to roughly 70% in a span of just a couple of months [38] (Figure 3).
The municipal administration has expressed the need of making a public research study investigating two principal aspects related to the newly adopted door-to-door waste collection system:
- Whether room for improvement of service expenditures and environmental issues is possible in terms of weekly collection frequency and waste transports;
- Whether further educational programmes and/or digital logistic tools [39] can support citizens to favourably separate and collect waste fractions at home.
This research need has been one of the starting points of the research project ‘Domestic Smart Compactor’ (e-CoDom) developed by Polytechnic University of Bari in cooperation with the municipal authorities of the Altamura Town and a panel of different local companies. The project aims at designing and testing a smart waste compactor device to support domestic users in sorting and managing home waste fractions. For the project, a survey has been designed in order to obtain useful information to both respond to the authorities’ research needs and to design the compactor prototype.
2.2. Survey Design and Distribution
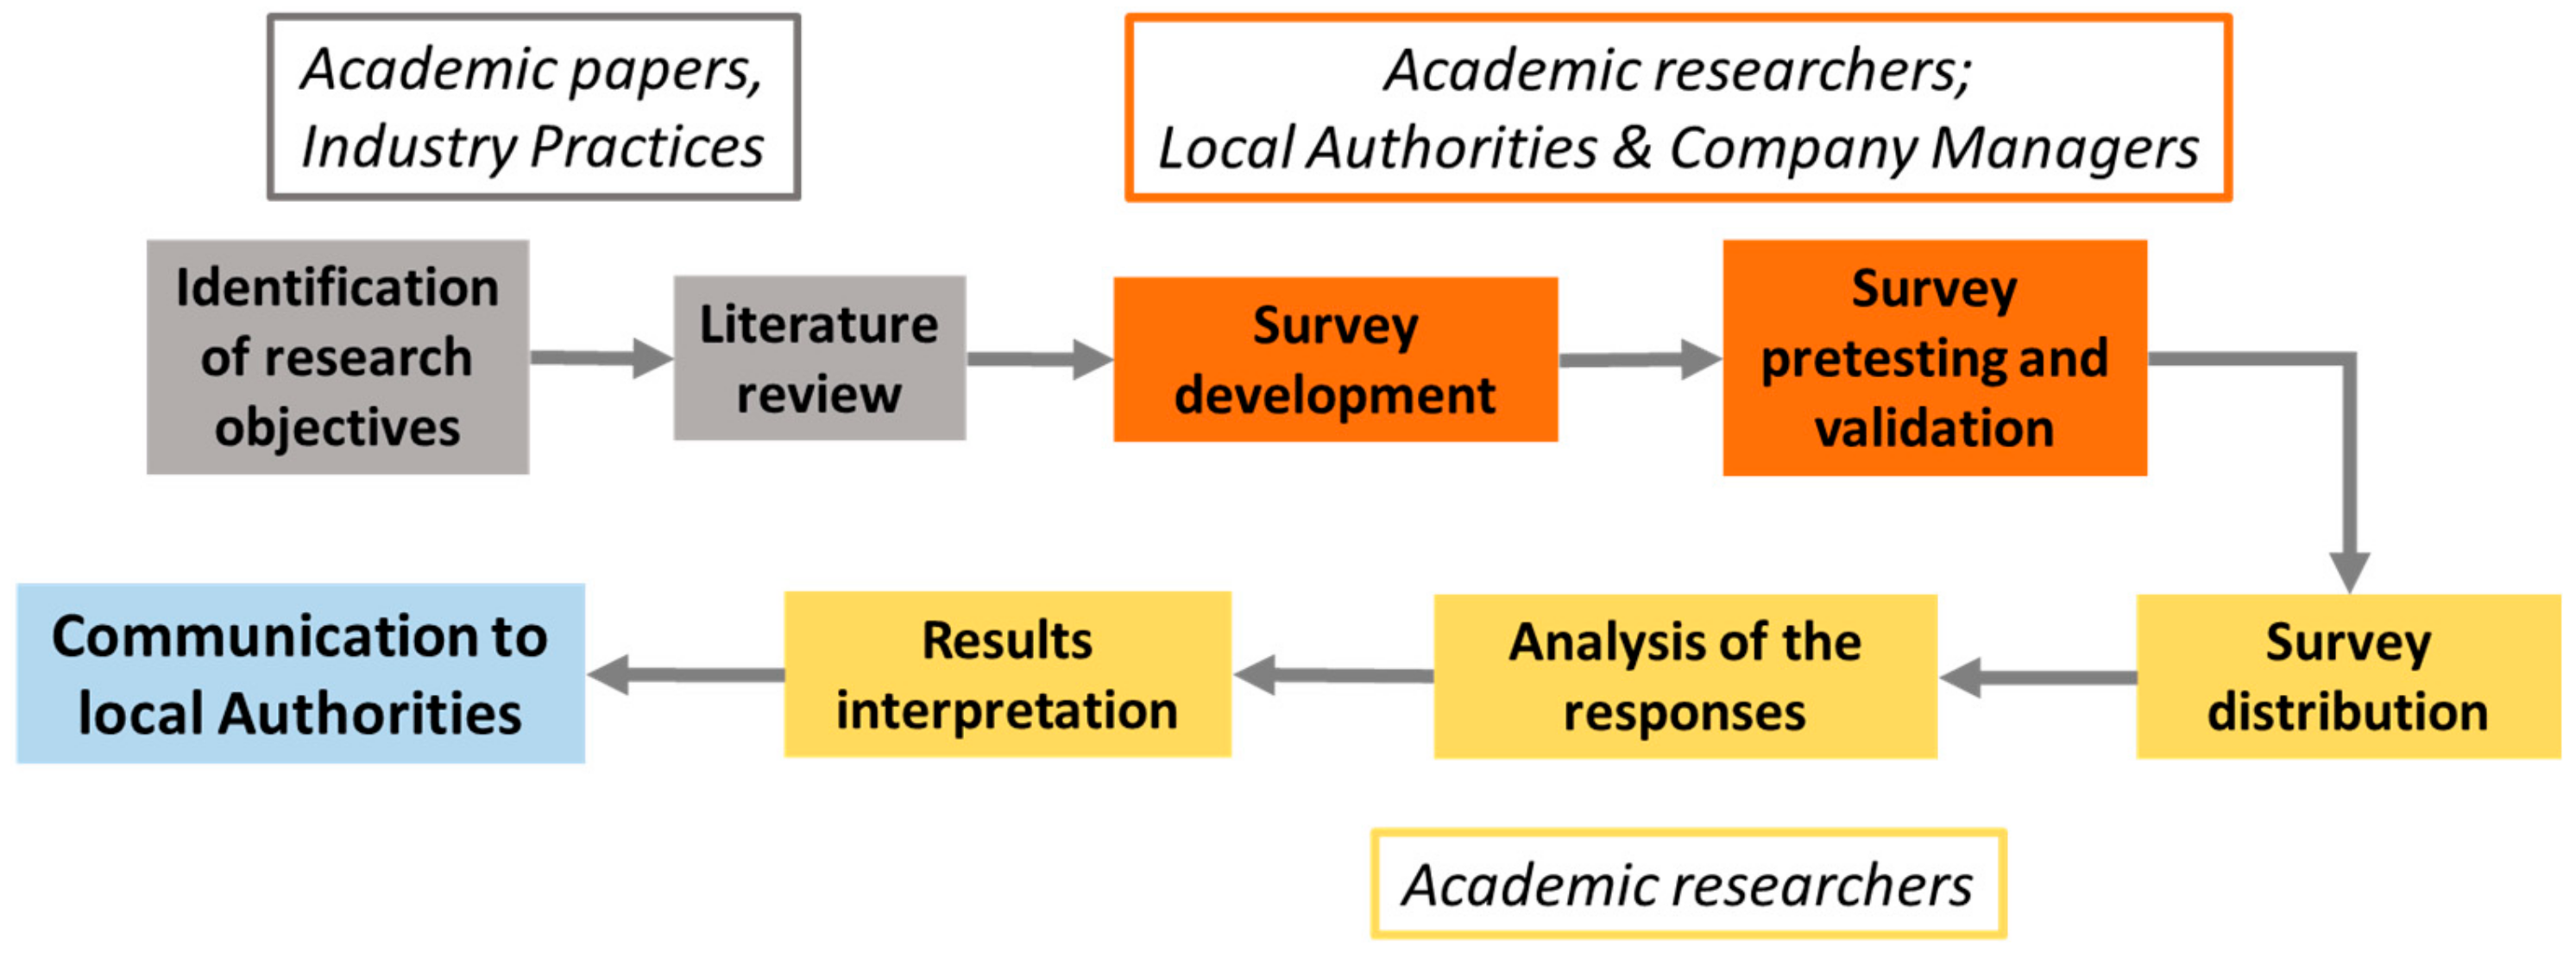
A survey composed of questions with pre-selected answers was used as the main tool for this research. The questionnaire was designed based on well consolidated literature regarding the survey structure, research questions creation and overall connections between the theories and the overall survey framework [40]. Figure 4 shows how the survey was outlined based on the different stages.
The questionnaire consisted of 4 different sections, with the first dealing with personal data and the other three sections dealing with personal habitudes in producing, separating and collecting waste fractions. The questions were developed on the basis of two elements: the current weekly planning of waste collection in the newly-implemented door-to-door system within the town (Table 3), and the state-of-the-art analysis on the local waste management systems implemented. Since 87% of the utilities producing MSW in Italy are domestic [41] (Table 4), the survey was specifically designed for citizens living in households.
A traditional survey approach was adopted as a theoretical and methodological research strategy [40]. In particular, the survey form was published online on the project website (www.e-codom.com) and advertised using several ad hoc posts on local pages of well-known social networks, in order to get a sample size large enough to detect statistically significant effects in the population.
In particular, Equation (1) was used to determine an optimal sample size (ss) of local family units to be interviewed in order to get results reflecting the population of the town:
where Z = Z value (1.96 for 95% confidence level), p = percentage of the target population estimated to have particular characteristics (0.5 was used since there is no reasonable estimate) and c = degree of accuracy expressed as decimal (0.05 for 95% accuracy) [40]. Thus, the ss value obtained was 384.
Then, Equation (2) was used to correct the sample size in relation to the finite population of domestic utilities in the town (23,828 in 2018 [40,41])
and the adjusted sample size obtained was 378.
Additionally, in order to evaluate the construct validity of the survey and establish the reliability of its pre-selected answers, pretesting and retesting was performed by a sample of 10 people (each of them answering for their own family unit) and gave consistent results.
With regards to the structure of the questionnaire, the first section consisted of 10 questions, which related to demographic and urbanistic information for statistic reference. In order to remove and eliminate legal issues about people’s privacy, the surveys were filled out anonymously.
In the second section, there were 11 questions designed to uncover citizens’ habitudes and behaviours in managing domestic waste fractions; the research question (RQ1) associated to them was as follows:
- RQ1: Can collection frequencies for each sorted waste fraction be better planned to improve the sustainability of the municipal service in terms of economical expenditures and environmental consequences?
The third section included 4 questions with the aim of investigating citizens’ personal involvement in separating home waste fractions; the research question (RQ2) associated to them was as follows:
- RQ2: Do citizens feel sufficiently aware and motivated in the daily task of proficiently separating domestic waste fractions?
The fourth and final section (4 questions) interrogated the respondents about their daily habitudes in using disposable objects for groceries, in order to underpin citizens’ effects in producing recyclable waste from disposable items (mainly made of PET); the research question (RQ3) associated was as follows:
- RQ3: How frequently do citizens use disposable items for food packaging in their daily life?
The research questions (RQs) have been defined with reference to the general framework of the Circular Economy concept, as discussed in Section 1 (Figure 1). Both RQ1 and RQ2 aim at investigating how it is possible to reduce environmental impacts of the sorting and collection phases of the differentiated waste fractions (preparing for reuse in Figure 1). In particular, a reduction/optimization of the pick-up frequencies would allow a reduction in the environmental impact of the collection phase. At the same time, the awareness of citizens in separating domestic fractions is directly connected to the final quality of them: an increase in the quality implies a reduction of scraps from the selection process (bad quality fractions to be landfilled), and hence a further reduction of environmental impact (due both to landfilling and extra-transport of scraps) could be achieved. Finally, RQ3 aims at evaluating if a particular plastic sub-fraction (PET for food/drink packaging) is eligible (in terms of relative quantity separated by citizens) to be separately collected from other plastic sub-fractions, due to its high commercial value as secondary raw material (recycling and reuse phases in Figure 1), in order to increase the incoming of the municipality authority deriving from selling the collected fractions.
The other 18 questions aimed at analysing citizens’ difficulties and desires to adequately manage domestic waste were used to depict key functional features in order to design an innovative home waste compactor device, but this section constitutes the object of a separate study [42].
During a timeframe of four months (June–September 2019), the survey containing all the 47 questions (q.) was available online on the website www.e-codom.com.
2.3. Survey Results and Statistical Analysis
A total of 385 usable questionnaires were sent out (one from each family unit), which was consistent with the sample size evaluated in Section 2.2. (ss′ = 378), and all the questionnaires received were entirely completed.
Prior to analysing the answers received, the independent variables were established, and dependent variables were defined as potentially having a direct or inverse relationship to the independent ones.
In particular, all the pieces of demographic and urbanistic information requested in the first survey section were designated as independent variables, while the dependent variables were identified in the other sections, as follows:
Following the scrutiny of the answers received, the answer frequencies for each question were represented on appropriate histograms or tables using the GraphPAD software programme (GraphPAD prism, version 6; GraphPad Software Inc., San Diego, CA, USA). Then, contingency tables were prepared, and chi-square and Fisher’s tests were performed using GraphPAD software to investigate the possible correlation between two nominal variables, each resulting from a single question with two or more possible values. In the case that the chi-square test was significant for contingency tables larger than 2 × 2, post-hoc tests were carried out either using pairwise comparisons or by testing each value of one nominal variable versus the sum of all the others; a Bonferroni-adjusted p-value was then applied to assess the significance of the test [43]. The results obtained from analysing the contingency tables are summarised in Appendix A. Finally, based on both the type of variables earlier defined and the results obtained from the contingency tables, a potential direct or inverse relationship between dependent and independent variables was then identified [40].
3. Results
3.1. Survey Population Analysis
The examination of the answers received about personal data (Table 5) revealed that people younger than 40 years (67.4%) mainly responded to the online survey (q. 2); the majority of the overall respondents are workers (56.5%) followed by students (29.0%) (q. 3), and the general educational level is mostly around A-level (41.7%), university degree (28.5%) and then lower-school level (19.7%) (q. 4). The analysis of the contingency tables obtained by crossing the answers to the questions about age (q. 2), daily activity (q. 3) and educational level (q. 4) has highlighted a close dependency among these nominal variables (p < 0.0001) (Table 5), thereby supporting the reliability of the answers received [40,43]: for instance, there are no students aged over 40 years, no person younger than 20 years with an academic degree or retired. Since the survey was conducted online, this format may have led to a difference in age distribution between the respondents and the general population of the town by attracting a slightly higher number of younger respondents.
In order to further characterize the sample of the respondents and possibly identify subgroups usable for further analyses, questions 5 to 9 were submitted (Table 6).
Most of the respondents belong to households with 4 to 6 members (63.0%) (q. 5). The family units involved in the survey mainly have their hearths in town districts (76.4%), while 14.8% live in out-of-town areas and the remaining 8.8% live in the town centre (q. 6). Going into more detail, 28.2% of the respondents live in blocks with at least 8 flats and 35.2% in blocks with less than 8 flats, while 24.4% live in single-family houses without a garden and the remaining 12.2% in small houses with a garden (q. 7). No blocks with more than 8 flats (p < 0.01) and less outdoor balcony (terrace/veranda, p < 0.01) are reported in the town centre compared to other town areas (Table A1 in Appendix A), which is consistent with the real estate situation in the town. In general, most of the dwellings in which the respondents live are large 90 to 120 m2 (42.9%), whereas the dwellings smaller than 90 m2 or larger than 120 m2 count for 29.1% and 28.1% respectively (q. 8).
3.2. Citizens’ Habits in Home Waste Management
In order to explore and characterize the personal habitudes of the respondents in producing, sorting and collecting separate waste fractions in their daily routine, another set of questions was proposed.
Nearly 90% of the respondents have declared to responsibly manage the separation of waste fractions at home (q. 10) (Table 7). In particular, cross analyses through chi-square tests have revealed that younger people seem to be less motivated in dealing with managing waste fractions home (p < 0.001), whereas daily students and workers are less involved in this task than the unemployed (p < 0.001) (Table A2 in Appendix A).
Considering the distinctive organisation in collecting separated waste fractions in blocks with at least 8 flats compared to all other types of dwellings (Section 2.1), it was crucial to know whether the respondents possess small bins to collect each waste fraction separately (Figure 2b). We found that 78.4% of the respondents use these small bins, while the remaining 21.6% do not have them (q. 11). This last datum is slightly lower than the percentage of the interviewed living in blocks with at least 8 flats (28.3%), thereby suggesting that part of the people living in bigger flat blocks possess small bins to separate and collect their domestic waste fractions, despite of the availability of communal bigger bins in their flat blocks. Moreover, all the interviewed living in the town centre possess domestic small bins (p < 0.05), which is consistent with the absence of bigger flat bocks in the town centre. Indeed, parallel chi-square tests confirm that the possession of these small bins depends on both the location (p < 0.05) and type (p < 0.0001) of dwellings in the town (Table 7).
Regarding the use of big communal trolleyed bins to collect separate waste fractions in blocks with at least 8 flats (Figure 2a), 107 respondents living in these complexes affirm that improvised or roughly arranged (47.7%) spaces are mainly adapted for these big containers or even external sidewalks or roads (20.6%) are occupied because no appropriate spaces are available inside their flat complexes; the remaining 31.8% claim to use appropriate outdoor spaces or rooms to accommodate communal waste bins (q. 12).
For those who have claimed to possess small bins home to separate waste fractions, questions 13 to 21 were allowed (Table 8, Table 9 and Table 10).
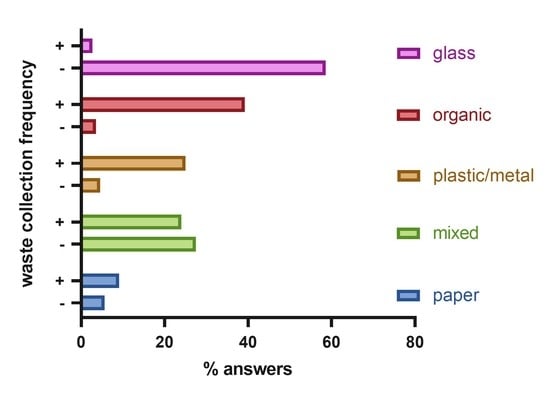
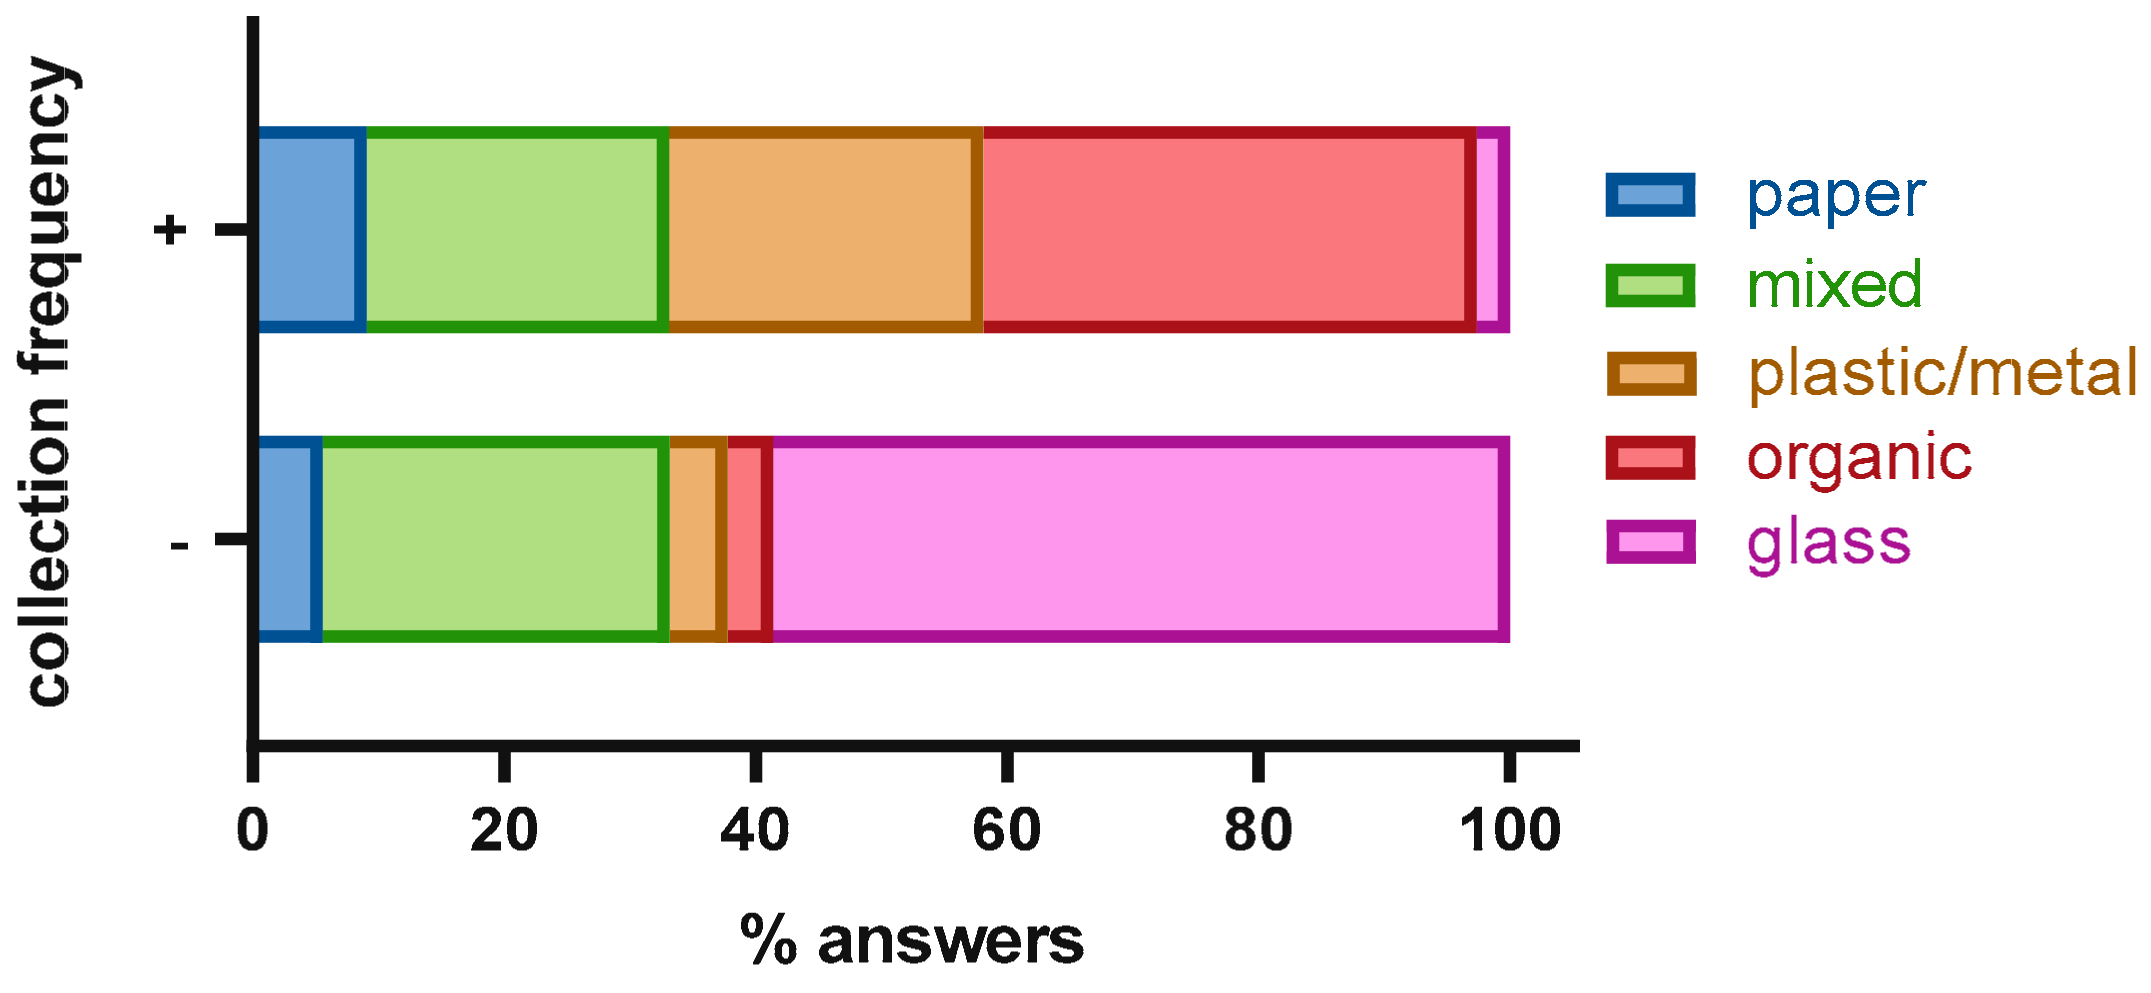
Among the 5 waste fractions examined in this study, glass waste is largely the fraction that is less regularly collected at home (58.6%), followed by mixed waste (27.5%) (q. 13, Table 8, Figure 5). Alternatively, organic waste is the most assiduously fraction collected at home (39.2%), followed by plastic/metal (25%) (q. 14, Table 8, Figure 5). The choice of the waste fraction less regularly collected at home seems to be related to citizens’ daily activity (p < 0.001) and household location within the town (p < 0.01); in particular, glass waste is the fraction that is less frequently collected in town districts. Nevertheless, no other significant correlations have been highlighted between the choice of the most frequently collected waste fraction and other variables.
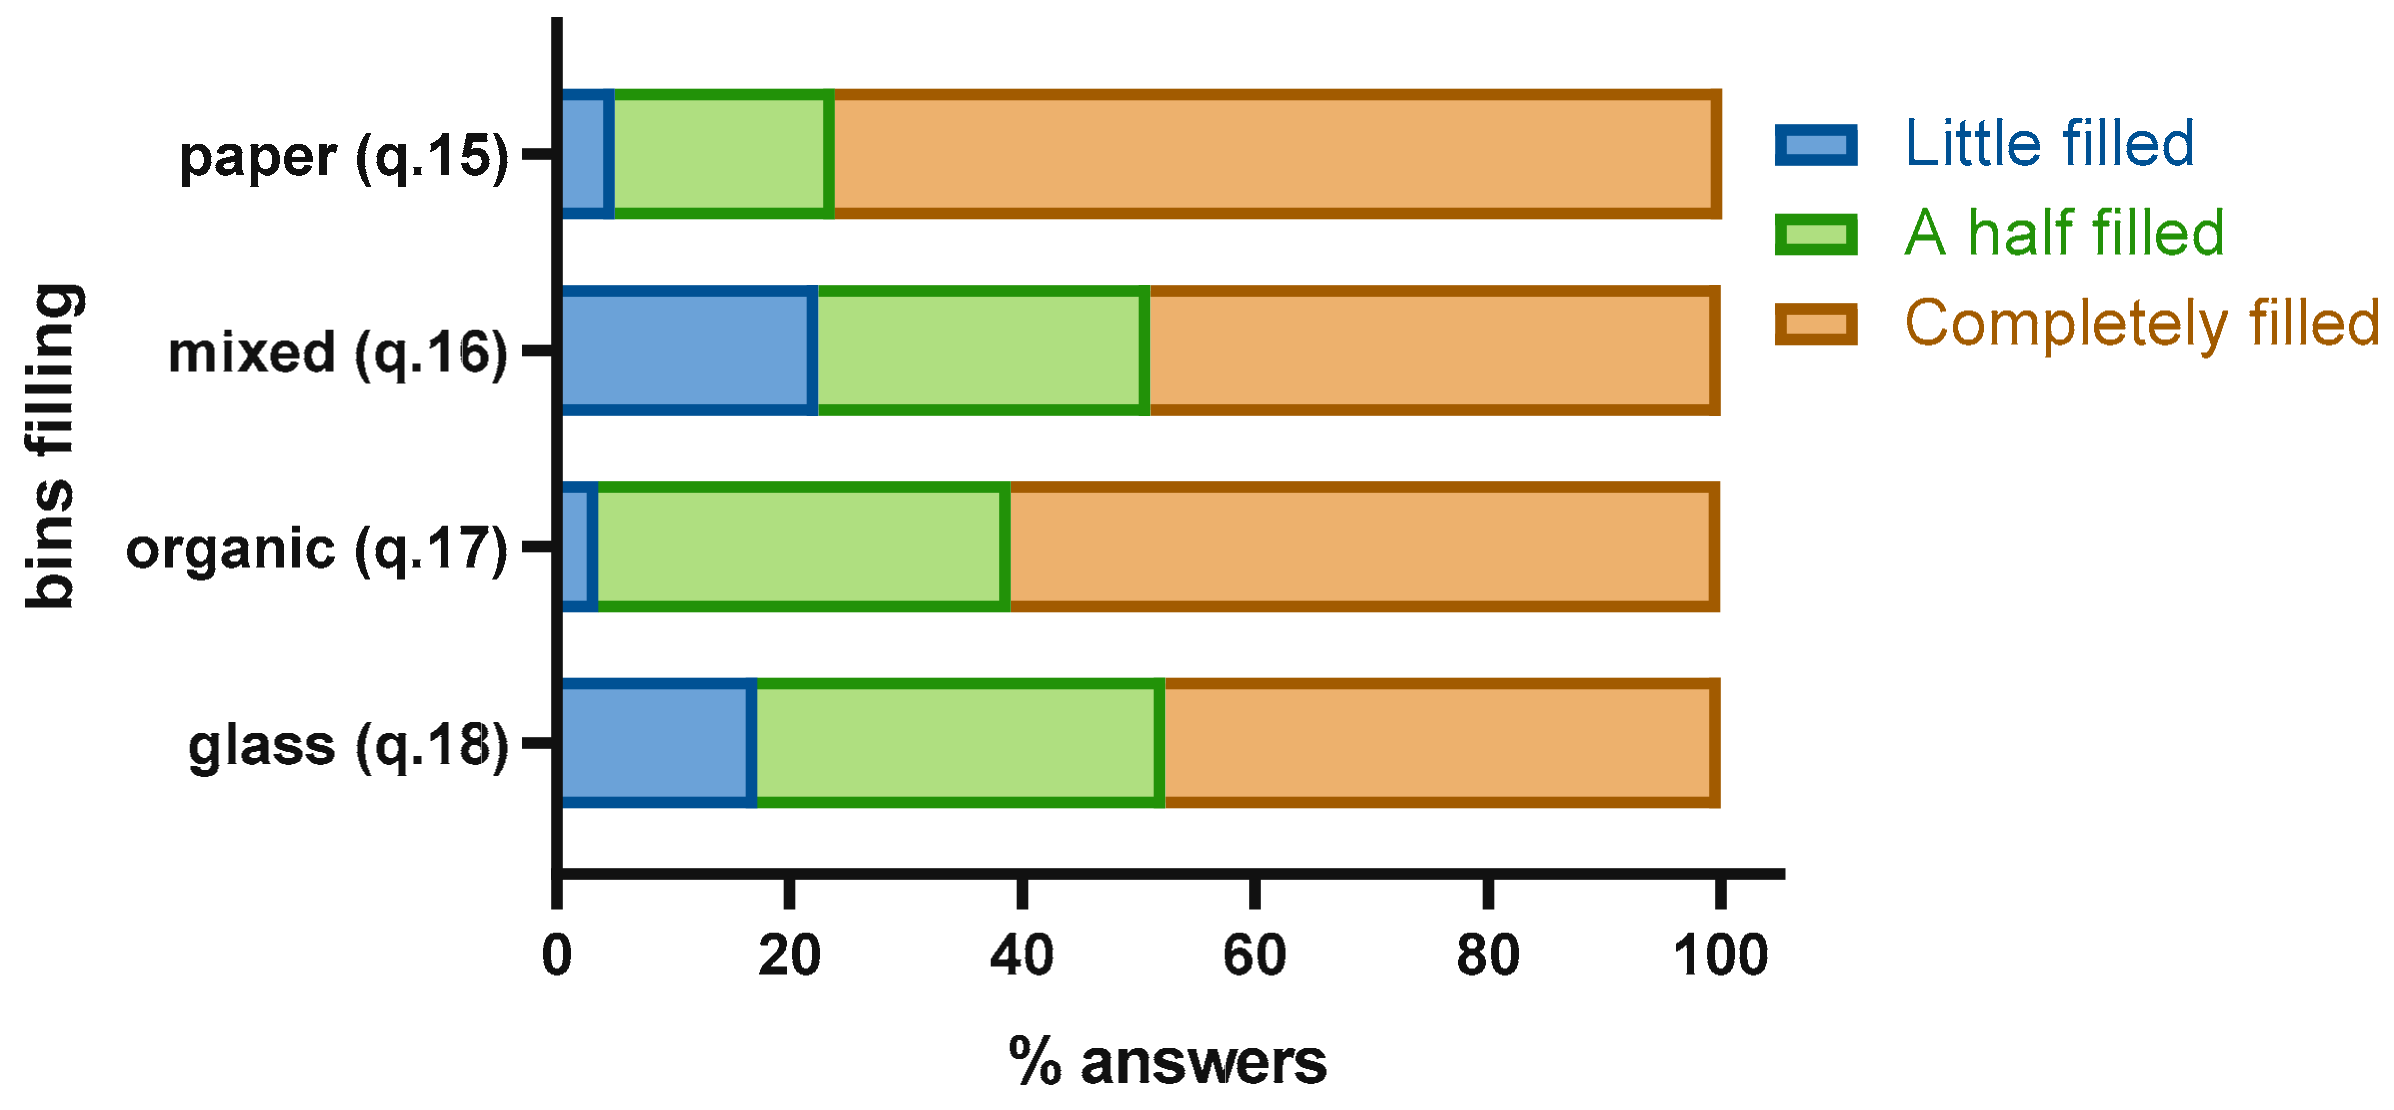
Concerning the filling level of the small bins upon drop-off and collection, almost three-quarters of the respondents claimed to completely fill paper bins upon delivery (76.2%), 18.9% fill them halfway and 5% fill them very little (q. 15) (Table 9, Figure 6). Families with higher number of members seem to completely fill them up (p < 0.05), while more cases of partial filling of the bins occur in the town districts than elsewhere (p < 0.01) (Table A2).
Residual unsorted waste bins are one of the most assiduously collected refuse items by 24% of the respondents (q. 14); they are mainly delivered completely filled (47.7%), but for 35.1% they are half filled and for the remaining 17.2%, filled very little (q. 26). Also, for these bins, more cases of partial filling are observed in town districts than elsewhere (p < 0.0001) (Table A2).
Bins for organic waste are generally dropped off more than halfway filled (96.3%) (q. 17), whereas the glass bins are delivered completely filled by only a half of the people interviewed (47.7%) (q. 18), with more cases of partial filling, in particular for those living in town districts (p < 0.001) (Table A2).
As a result, from the contingency tables, it turns out that only the filling of paper bins has a direct relationship with the number of family members, while all the small bins for dry fractions appear to be mainly delivered as partially filled in the town district.
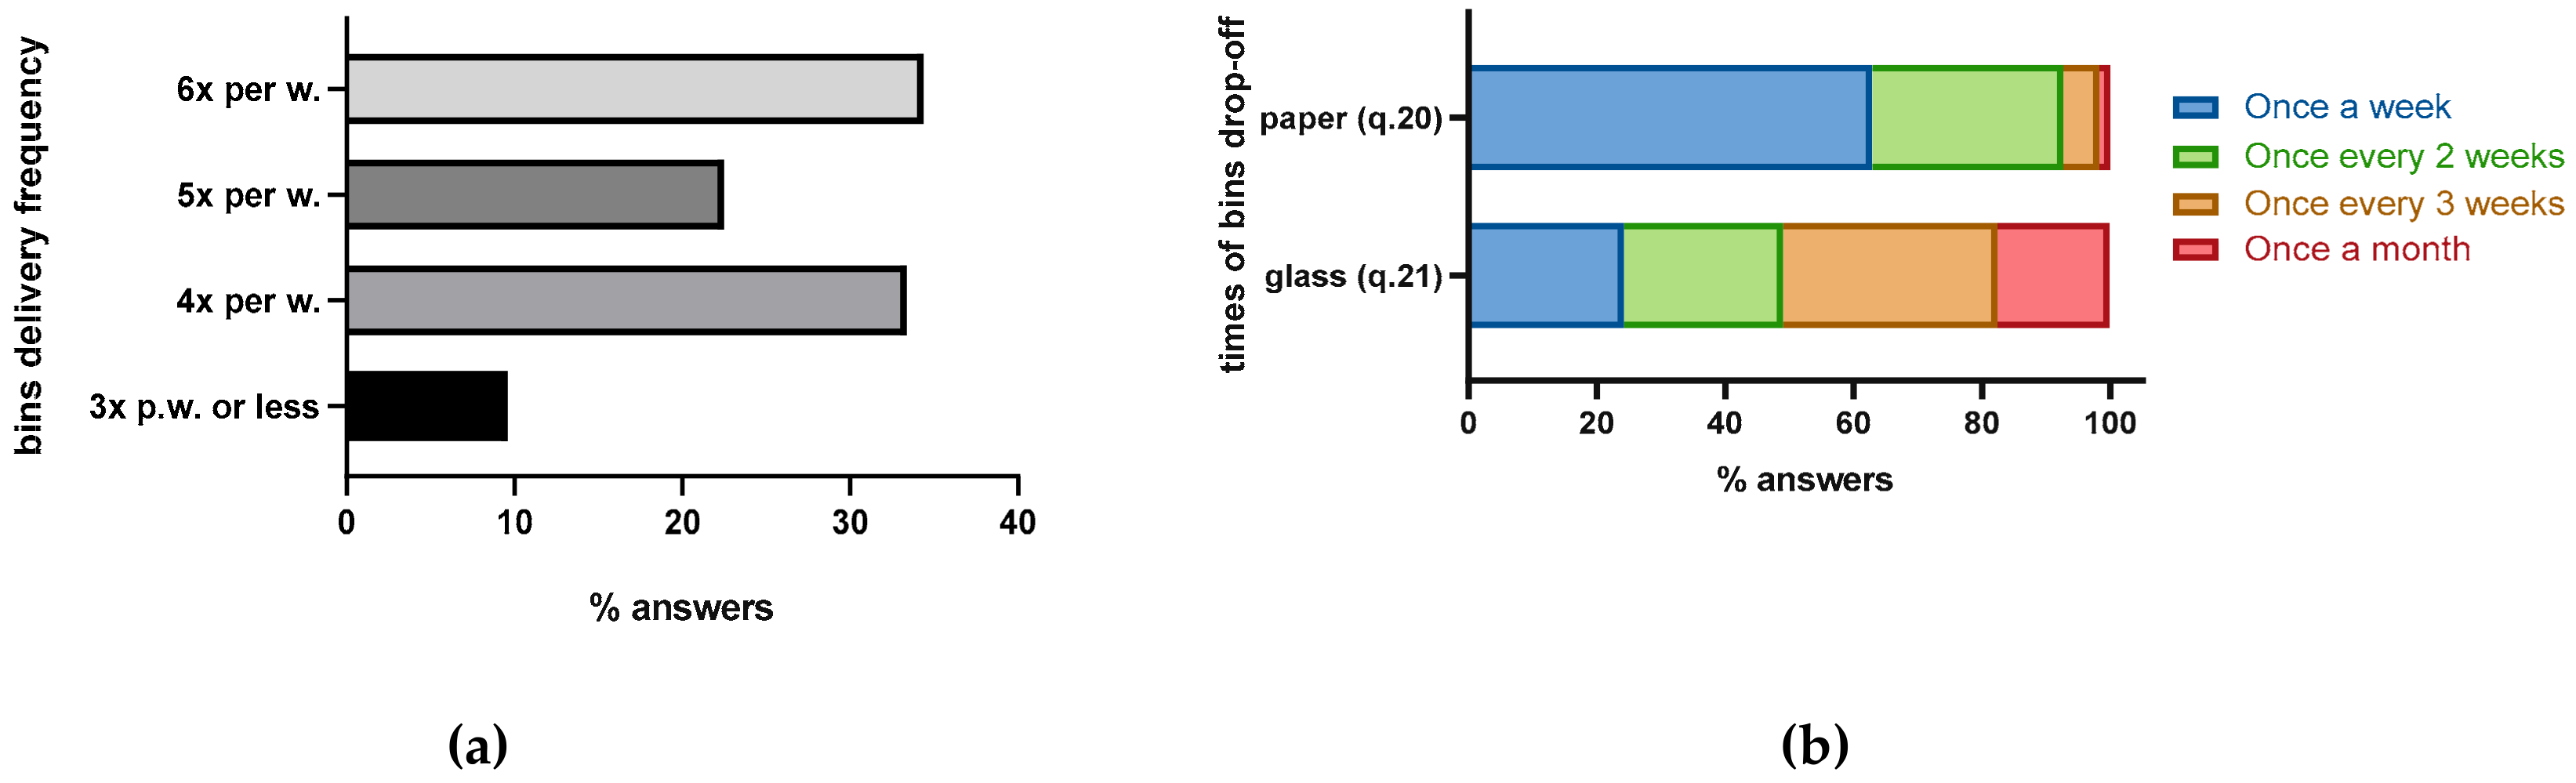
Regarding the practical management of home waste, the respondents differentially deliver their small bins outside their house during the week according to the pick-up planning scheduled by municipal authorities (Table 3), with only a very few people delivering their bins only 3 days a week or less (9.6%) (q. 19, Table 10, Figure 7). Subsequent multivariate analyses revealed a more frequent delivery in town districts compared to the town centre (p < 0.05) and out-of-town areas (p < 0.01), and a statistically significant correlation between weekly frequency of bins drop-off and the type of waste fraction that is less regularly collected at home (p < 0.0001) (Table A2). No other statistically significant correlations have been disclosed when the frequency of bin delivery has been related to either the number of family members, or to the type and size of lodgings (p > 0.05) (Table A2 in Appendix A).
In particular, regarding the disposal of paper/cardboard waste, 62.9% of the respondents possessing the corresponding small bins deliver them outside home once a week, 29.8% once every two weeks and the remaining 7.3% less frequently at about once a month (q. 20) (Table 10).
Only for a quarter of the interviewed (24.2%), the delivery of small bins for glass waste seems to occur weekly, as expected by municipal planning, while the remaining deliver the glass bin less frequently, i.e., once every two or more weeks (q. 21) (Table 10); in particular, in town districts the monthly frequency is higher than elsewhere (p < 0.001) (Table A2). More importantly, a direct relationship has been observed between filling level and drop-off frequency of glass bins (p < 0.001): the more the bins are filled, the more frequently are delivered for morning collection (Table A2).
Finally, comparing the frequency of delivering glass bins versus paper bins, the former is delivered less frequently than the latter, about once a month (p < 0.0001) (Table A2).
3.3. Citizens’ Awareness in Home Waste Management
In order to investigate citizens’ personal awareness in managing domestic waste fractions, a set of 4 questions were submitted.
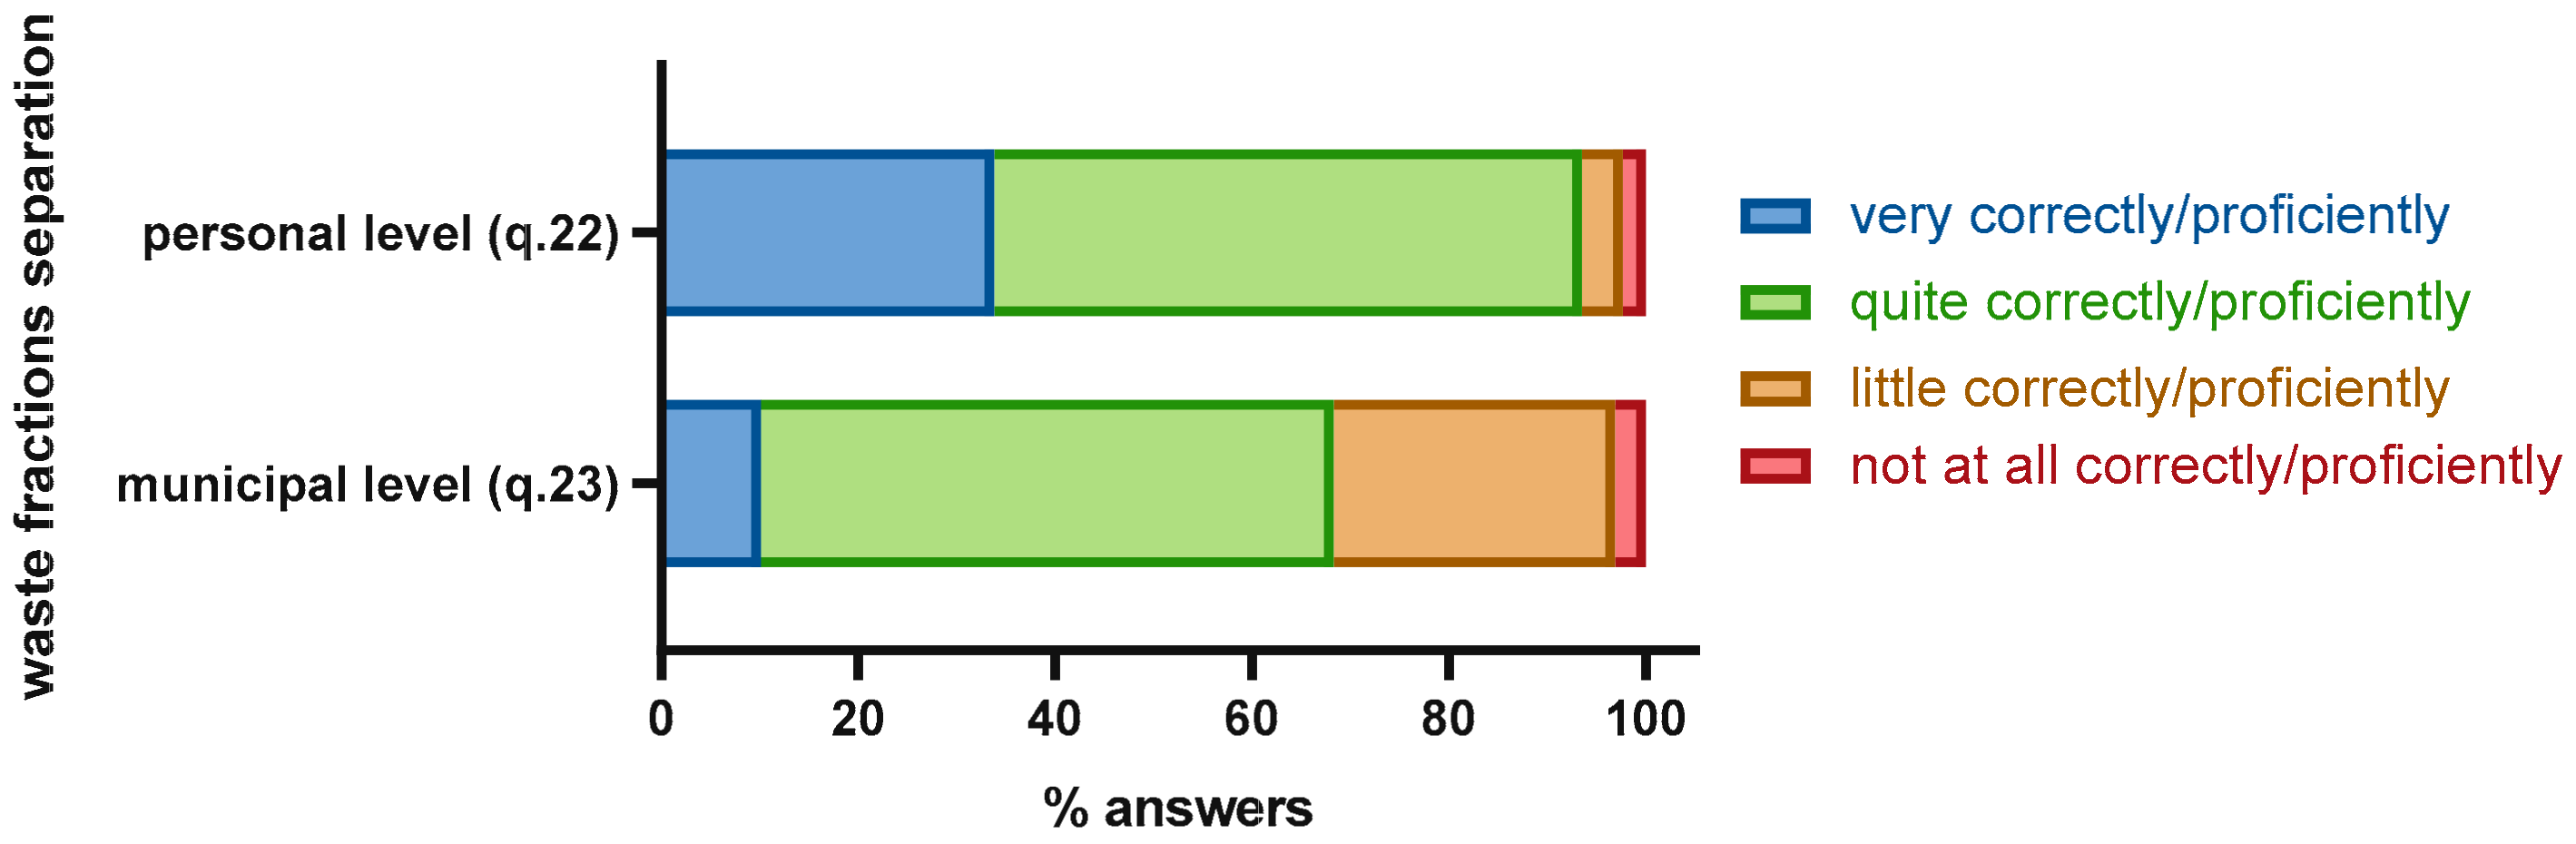
The majority of the respondents claim to separate waste fractions home quite correctly and efficiently (59.7%), whereas 33.8% carry out this task even very appropriately and proficiently; only a few people negatively perceive their duty in home waste collection (6.5%) (q. 22) (Table 11). Concerning the collection of waste fractions at municipal level, the general perception is almost quite positive (58.2%), and even highly optimistic for 10.1%, although a negative opinion is supported by 31.7% of the respondents (q. 23) (Table 11).
No statistical relationships were disclosed relating the perception of the respondents of both questions to their age, daily activity, educational level, type or location of dwellings (p > 0.05) (Table A3). When bins are delivered more often during the week, a higher personal perception of correctly managing waste fractions at home has been highlighted (p < 0.0001) (Table A3).
Generally, more than a half of the respondents think that the controls and fines for those who do not correctly separate and collect waste fractions are a little (43.3%) or at all (17.4%) efficient (q. 24) (Table 11). Additionally, the better the perception of how the collection of waste fractions is carried out in the municipality, the better the supposed efficacy of the controls and fines (p < 0.001) (Table A3).
The personal involvement in daily managing separate waste fractions is further motivated when the citizen receives adequate information (43.8%) about environmental benefits, outcomes of the fractions collected and methods of collection (q. 25) (Table 11, Figure 8). A greater control of the quality of the sorted waste fractions and a larger involvement of the citizens would additionally motivate them to perform appropriate home waste separation (32.6%), while a punctual rewarding based on the amount and quality of the waste fractions collected seems to be a slightly minor source of motivation (23.7%) (q. 25) (Table 11).
More notably, those who are the less interested in separating waste fractions home require more information about this service, whereas those with a greater motivation call for additional controls and personal rewarding (p < 0.0001) (Table A3).
3.4. Citizens’ Habits in Using Disposable Items for Food Packaging
The last section of the questionnaire was designed to further investigate citizens’ habits in producing domestic waste from disposable items used for daily food/drink packaging. Most of these types of items are made of PET [32,34,35], and the commercial value of PET as a secondary raw material is higher than the value of other recyclable plastic materials [33].
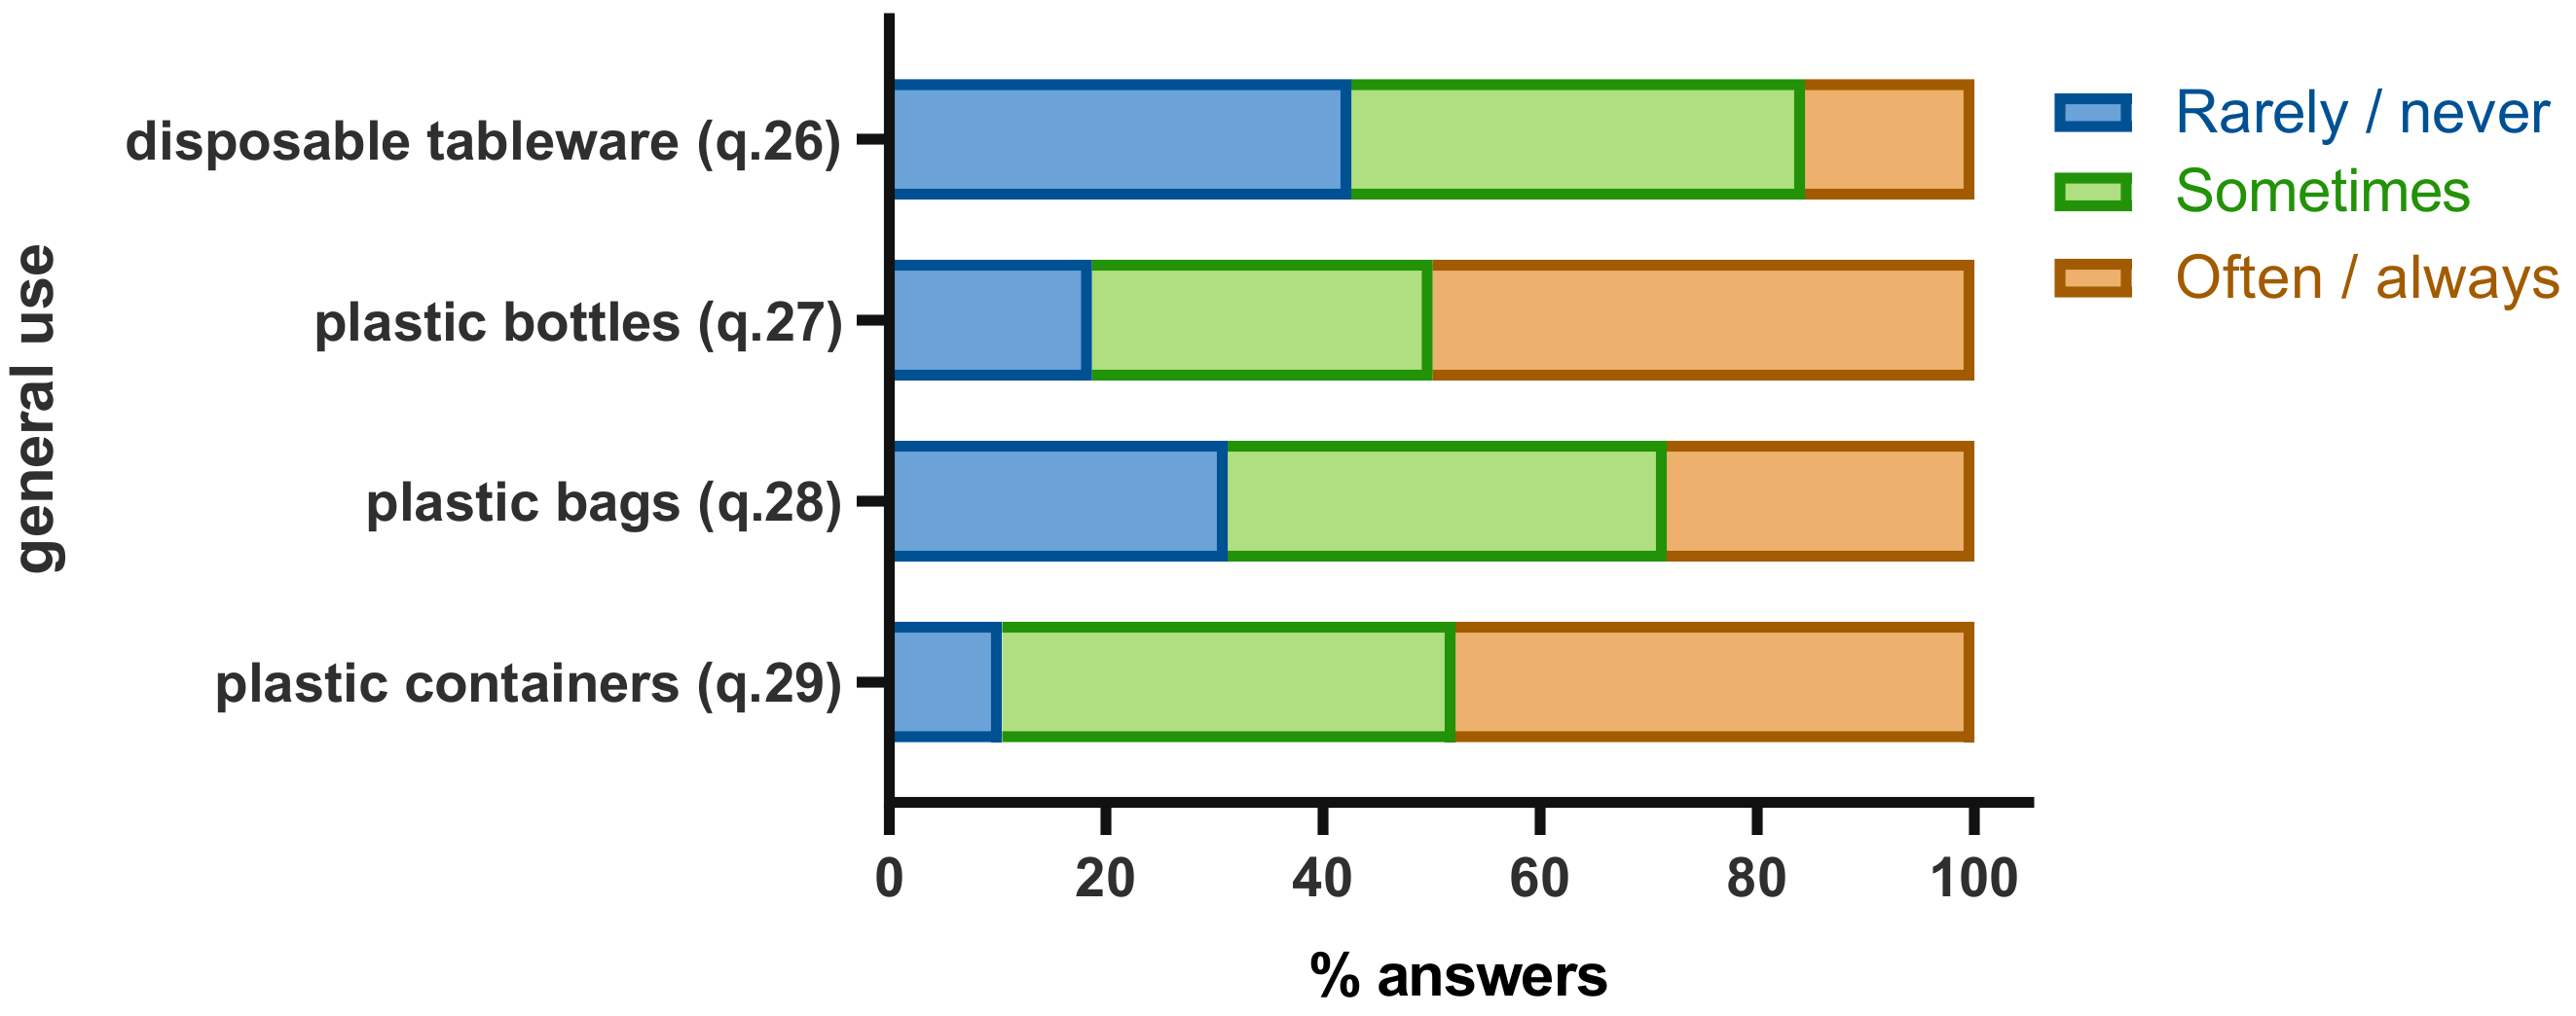
Thus, questions relating their personal behaviours in using plastic or single-use products were submitted. In particular, most of the interviewed claimed to rarely (42.6%) or sometimes (41.8%) use disposable tableware, while the remaining 15.6% often or always use it (q. 26) (Table 12). Conversely, the majority of the respondents affirm to often or always use plastic bottles (49.9%) for water or soft drinks (q. 27) (Table 12, Figure 9), and often or always buy food prepared in plastic containers (47.8%) (q. 28) (Table 12). Just about one fourth of the respondents (28.3%) routinely use biodegradable bags for their daily tasks (q. 29) (Table 12).
In addition, the general use of disposable plates, glasses and cutlery seems to be related to the independent variables of age and educational level: younger people use them more frequently (p < 0.05, direct relationship), while people with higher-level degrees use them less frequently than people with a lower level of education, (p < 0.05, inverse relationship) (Table A4). Also, people younger than 40 years of age prefer buying food assorted in plastic packages (p < 0.01) (Table A4), thereby suggesting an inverse relationship between people age and tendency of using plastic containers for food packaging.
4. Discussion
A door-to-door collection system for MSW was adopted in June 2018 in Altamura, a mid-sized town in Southern Italy, after several years of separate waste collection using community bins near sidewalks where users had to bring their own garbage. In order to perform a preliminary evaluation of the general effectiveness of this newly implemented waste collection system, a survey was requested by local authorities of the town and distributed online for the citizens to take. Investigating citizens’ habits and behaviours regarding home waste management and separate waste collection usually has constituted a useful tool to acquire important information about the efficiency of a municipal service [44], in addition to the economic and technical analyses carried out by the corresponding waste company.
The analysis of the results obtained has revealed that although the majority of the respondents are younger than 40 years old, they appear to be less motivated in dealing with waste separation and collection at home, in particular daily students and workers; this domestic duty definitely demands a supplementary effort in attracting their interest, despite their personal daily tasks. Other studies conducted in Scandian countries showed that some people were willing to pay an inconvenience cost for a third party to recycle their waste, as recycling appeared to demand additional time and effort in households [45,46].
Educational strategies should be defined to motivate citizens to correctly manage home waste fractions, since citizens are known to feel more encouraged to have a pro-environmental conduct when educational programmes are implemented on how to reduce waste and carry out an efficient recycling, as analysed in other investigations [47,48,49,50,51]. Indeed, the individual behaviour in home waste management is significantly affected by personal attitudes [14]; in particular, citizens’ willingness to accurately sort and dispose house refuses is affected by daily habits, self-image and social influences [52]. Moreover, a weekly schedule of waste bins pick-up should fit citizens’ habits, otherwise waste may be dumped into illicit places, such as streets, out-of-town areas or countryside zones [53,54]. Thus, establishing the five principles of circular economy (Figure 1) in current policies and adequately motivating citizens might help citizens in improving their personal attitude and habits in domestic waste management [52].
As a general answer to RQ2, citizens of the town seem to feel generally aware and optimistic in proficiently managing separate home waste fractions at an individual level, but they perceive a less positive conduct in town. This positive perception of the respondents seemed to be statistically independent from their age, daily activity, educational level and type and location of dwelling. The overall confident opinion is strengthened when small bins are individually used for home waste separation and are more frequently delivered for morning pick-up. Another analysis conducted in 2018 estimated that about 66% of Italian families were served by door-to-door waste collection system [41], and revealed that, on average, the level of satisfaction for this type of service was good, with 25.3% of families being ‘very satisfied’, which is consistent with the results of our study.
Additionally, the personal involvement in correctly sorting domestic waste fractions is shown to be further motivated when additional information on the overall waste management system is delivered to the citizenry in terms of efficiency, quality, recycling and sustainability, as shown in a plethora of different international studies and surveys [29,30,48,55,56,57]. From our analysis, economic incentives, proportional taxes or a household volume charging method can be proposed as fairy policies to vitalize the separation of potentially recyclable waste fractions at home. According to other contingent valuations, citizens appear to be more motivated to recycle when the perspective of an economic reward or economic incentives related to waste separation are available [58,59,60,61,62].
The current investigation has shown that keeping citizens informed about final outcomes of separate waste fractions, recycling results and subsequent environment advantages is important in order to further motivate them to appropriately manage home waste fractions. Also, a municipal system which includes both specific controls with related fine, and individual rewards for citizens proficiently managing domestic refuses, would sensibly improve the citizens’ involvement in such a MSW management system. Furthermore, if citizens’ recycling behaviours improved in their door-to-door domestic waste management, environmental ed economic costs could decrease due to a reduction of rejection rates of separate waste fractions, which corresponds to a lower percentage of bad-quality separate fractions to be landfilled [28].
Regarding the different domestic waste fractions sorted by the respondents, our investigation has shown that glass refuses are produced in smaller quantities at home, in particular in town districts. Accordingly, glass bins are frequently delivered as partially filled and the number of times that glass bins are filled and emptied in a month time is lower when compared to other fractions. In the same way, non-recyclable or mixed refuses appear to be less frequently produced and collected at home, and the corresponding bins mainly seem to be partially filled upon delivery. Apparently, frequency of dropping off small waste bins for morning collection is dependent on household location within the town, with people living in town districts more frequently delivering small bins than elsewhere in town, which is consistent with a higher population density in the districts.
These data allowed the formulation of a valuable answer to RQ1. In particular, it might be an important practice to advise citizens to fill these bins up at their maximum before delivery; this would also help possibly reduce the number of pick-up times for glass and mixed waste monthly. As a suggestion from the results of this survey section, the pick-up of glass bins could be reduced from weekly to once every two weeks and collection of unsorted waste bins from twice to once a week; this might locally generate more sustainable processes in terms of fuel and transport expenditure, pollution reduction, municipal costs and subsequent local taxes.
Indeed, the costs derived from waste collection and transport, fuel consumption and vehicle-associated expenditures have been established as key factors to be analysed for the design of an efficient sustainable MSW management system [16,63]. A set of default parameters has generally been used to estimate costs and greenhouse gases emissions from single-family MSW collection: fuel consumption (L per ton of waste) and number of collecting vehicles. Three levels for each parameter (low, middle and high) have been defined and three possible cases have then been envisaged (Table 13): the lower the number of vehicles employed and the lower the corresponding consumption of fuel, the lower the cost of waste collection and transport per ton of waste and the more sustainable the overall waste collection system [64].
Focusing on the specific costs per waste fractions, about 45% is due to the management of unsorted refuses, 27% is due to that of sorted waste and the remaining 28% is due to general management [41]. Additionally, according to the data published by the Higher Institute for Environmental Protection and Research (ISPRA), the amount of unsorted waste collected in Italy is about twice the amount of the sorted waste (see Table 14). Therefore, as a result of our survey, implementing only a single weekly collection of mixed waste in town districts rather than twice a week, may allow the costs due to the collection and transport of unsorted waste to decrease [27,63,64].
The optimisation of the logistics flow for the management of single sorted waste fractions and an accurate planning of transport operations has also been shown to help reducing service costs. For instance, a Polish study has highlighted that a better scheduling of the municipal collection system could lead to decrease shipping routes and optimise the vehicle fleet [65]. In our study, diminishing glass bins collection from once a week to once every two weeks in town districts can help decrease collection and transport costs. Alternatively, the collection of domestic glass bins can be proficiently substituted by implementing communal drop-off points exclusively for glass refuses, as it has already been observed in a well proficient and sustainable MSW management system in Spanish towns having between 5000 and 50,000 inhabitants [66].
Keeping in mind the results of our study, a novel weekly bin pick-up schedule could be proposed to the local administration authorities for a future experimental period (Table 15): mixed waste fractions could be collected only on Tuesday, thus freeing collectors from Saturday works; glass bins collection could be implemented once every two weeks and associated to unsorted bins collections, since they are both dry fractions, thereby allowing the single collection of organic waste bins on Monday.
The subsequent reduction of collection and transport of dry waste fractions might have beneficial effects on the sustainability of the overall service: in particular, for the administration by diminishing the average service cost per ton of waste [64] (Table 13), and for the local environment by decreasing the amounts of gas emissions, thereby minorly affecting public health and less depleting natural resources [1,19,23,27].
On the other hand, bins for paper refuses and bags for plastic/metal refuses are generally filled to their limit upon delivery; therefore, the availability of a domestic waste compactor to reduce such waste volumes would be helpful to decrease waste encumbrance at home and subsequently reduce the number of collection times monthly, as shown in another parallel study by our research team [42].
The results obtained from Section 4 of the survey have provided key elements to answer RQ3. In particular, although more than 80% of the interviewed claim to occasionally use disposable tableware, the use of plastic bottles for water, plastic containers for food and non-biodegradable bags is fairly regular, thereby still contributing to the production of a considerable amount of plastic refuses. Therefore, it seems crucial to develop additional educational programmes for citizens to beneficially reduce their daily use of disposable items for groceries and then correctly manage the collection of their corresponding refuses. In addition, since most of the disposable items for food packaging are made of PET [32], and PET as secondary raw material has a commercial value higher than other recyclable plastic materials [33], the separate collection of PET refuse can allow the production of valuable secondary raw material with subsequent profitable incomes for the local administration.
Although the results obtained from our study provide valuable conclusions with reference to the general objectives initially defined, some limitations should be highlighted. In addition to the bias in the sample towards people younger than 40 years (67.3%), which can be related to the online format of the survey, the anonymity of the respondents (due to privacy constraints) does not allow the possibility of following up this research study using the same sample of citizens in the event that appropriate municipal resolutions have been adopted to modify the local MSW management following our investigation.
Alternatively, an appropriate group of experts might be selected in future studies to undergo further survey-based investigations using, for instance, the Delphi method, which constitutes a popular tool in information systems research for identifying and prioritising issues for managerial decision-making [67]. This approach would also allow the researchers to both follow up the interviewed sample for subsequent clarifications, and further acquire qualitative data together with specific countable data for quantitative variables in order to carry out more powerful factor or regression analyses.
5. Conclusions
In this study, citizens’ habits in producing and managing recyclable home wastes and potential logistic and environmental impacts of a newly adopted door-to-door collection system in Altamura, Southern Italy, have been investigated. Research originated from a research need expressed by the municipal authorities in order to evaluate the effectiveness of this MSW collection system and identify potential improvement actions. The current investigation is part of a research project aiming at designing and testing a smart domestic waste compactor allowing the support of citizens to correctly identify and manage separate fractions of MSW (e-CODOM Project). An online survey was designed in order to both answer the original research need of the local authorities and indirectly collect recommendations for the design of the smart compactor device.
The results of the study have showed that citizens are more motivated to adequately collect separate waste fractions when they receive information about subsequent environmental benefits, outcomes of the fractions collected and when greater controls on the quality of the sorted waste fractions are adopted. However, a high percentage of people still use disposable items in daily life, thereby producing preventable domestic solid refuses which can be at least better collected to obtain recyclable PET waste fractions. Also, the door-to-door collection of glass waste in the town is inefficient and unsustainable as most of the corresponding bins are mainly partially filled and less frequently delivered. Thus, possible changes to the weekly bins collection schedule have been proposed in order to have a more proficient and environmentally sustainable waste collection service in the town. These results might be helpful to support the routine technical analyses conducted on monthly or yearly flows of waste production in order to underpin key features in local waste managing. The combination of all these studies might allow the development of a more proficient and environmentally sustainable waste collection service in the town. The overall results of the whole survey have also contributed to featuring the smart compactor of the project.
Author Contributions
All authors contributed equally to the manuscript, in particular as regards conceptualization, methodology, software, investigation, writing—original draft, and writing—review and editing. All authors have read and agree to the published version of the manuscript.
Funding
This research was funded by European Regional Development Fund and European Social Fund of Apulia Region (POR Puglia FESR FSE 2014-2020 - Sub-Azione 1.4.B ‘Bando INNOLABS’).
Conflicts of Interest
The authors declare no conflict of interest.
Appendix A

Table A1.
Results of dependency tests and multiple comparisons of questions 2–9.
| 2 | ||||||
|---|---|---|---|---|---|---|
| 3 | **** | 3 | 4 | |||
| 4 | **** | ** | 5 | |||
| 6 | - | - | o | 6 | ||
| 7 | - | - | o | ** | 7 | |
| 8 | - | - | - | o | *** | 8 |
| 9 | - | - | - | ** | **** | 9 |
| 2 | 3 | 5 | 6 | 7 |
Note: o stands for p > 0.05, * for p < 0.05, ** for p < 0.01, *** for p < 0.001, **** for p < 0.0001, - for ‘not available’.
Table A2.
Results of dependency tests and multiple comparisons of questions 10–21.
| 2 | 3 | 4 | 5 | 6 | 7 | 8 | 9 | ||||||||
|---|---|---|---|---|---|---|---|---|---|---|---|---|---|---|---|
| 10 | *** | *** | ** | - | 10 | ||||||||||
| 11 | - | - | - | o | * | **** | o | - | - | 11 | |||||
| 12 | - | - | - | - | o | o | - | - | - | 12 | |||||
| 13 | o | *** | - | o | ** | - | - | - | o | 13 | |||||
| 14 | o | o | - | o | o | - | - | - | o | - | 14 | ||||
| 15 | - | - | - | * | ** | - | - | - | - | - | - | 15 | |||
| 16 | - | - | - | o | **** | - | - | - | - | - | - | - | 16 | ||
| 17 | - | - | - | o | o | - | - | - | - | - | - | - | 17 | ||
| 18 | - | - | - | o | *** | - | - | - | - | - | - | - | 18 | ||
| 19 | - | - | - | o | *** | o | o | o | - | **** | o | - | - | 19 | |
| 20 | - | - | - | o | o | o | - | - | - | - | - | o | - | 20 | |
| 21 | - | - | - | o | *** | o | - | - | - | - | - | - | *** | **** | 21 |
| 2 | 3 | 4 | 5 | 6 | 7 | 8 | 9 | 10 | 13 | 14 | 15 | 18 | 20 |
Note: o stands for p > 0.05, * for p < 0.05, ** for p < 0.01, *** for p < 0.001, **** for p < 0.0001, - for ‘not available’.
Table A3.
Results of dependency tests and multiple comparisons of questions 22–25.
| 2 | 3 | 4 | 5 | 6 | 7 | 11 | 19 | |||||
|---|---|---|---|---|---|---|---|---|---|---|---|---|
| 22 | o | * | o | - | - | o | o | **** | 22 | |||
| 23 | o | o | o | - | o | - | - | o | o | 23 | ||
| 24 | o | o | **** | - | - | - | - | - | *** | 24 | ||
| 25 | o | ** | o | * | - | - | - | **** | - | **** | 25 | |
| 2 | 3 | 4 | 5 | 6 | 7 | 11 | 19 | 22 | 23 | 24 |
Note: o stands for p > 0.05, * for p < 0.05, ** for p < 0.01, *** for p < 0.001, **** for p < 0.0001, - for ‘not available’.
Table A4.
Results of dependency tests and multiple comparisons of questions 26–29.
| 2 | 3 | 4 | 5 | 22 | ||
|---|---|---|---|---|---|---|
| 26 | * | *** | * | O | *** | 26 |
| 27 | o | ** | o | O | o | 27 |
| 28 | o | O | - | O | o | 28 |
| 29 | ** | ** | - | O | o | 29 |
| 2 | 3 | 4 | 5 | 22 |
Note: o stands for p > 0.05, * for p < 0.05, ** for p < 0.01, *** for p < 0.001, **** for p < 0.0001, - for ‘not available’.
References
- Ramachandra, T.V.; Bharath, H.A.; Kulkarni, G.; Han, S.S. Municipal solid waste: Generation, composition and GHG emissions in Bangalore, India. Renew. Sustain. Energy Rev. 2018, 82, 1122–1136. [Google Scholar] [CrossRef]
- Rasmeni, Z.Z.; Madyira, D.M. A review of the current municipal solid waste management practices in Johannesburg city townships. Procedia Manuf. 2019, 35, 1025–1031. [Google Scholar] [CrossRef]
- Biswas, D.; Chandra Roy, N. Municipal Waste Management: Issues and challanges. Int. J. Res. Manag. Soc. Sci. 2018, 6, 69–76. [Google Scholar]
- Grazhdani, D. Assessing the variables affecting on the rate of solid waste generation and recycling: An empirical analysis in Prespa Park. Waste Manag. 2016, 48, 3–13. [Google Scholar] [CrossRef] [PubMed]
- Malinauskaite, J.; Jouhara, H.; Czajczyńska, D.; Stanchev, P.; Katsou, E.; Rostkowski, P.; Thorne, R.J.; Colón, J.; Ponsá, S.; Al-Mansour, F.; et al. Municipal solid waste management and waste-to-energy in the context of a circular economy and energy recycling in Europe. Energy 2017, 141, 2013–2044. [Google Scholar] [CrossRef]
- Franco-García, M.; Carpio-Aguilar, J.; Bressers, H. Towards Zero Waste, Circular Economy Boost: Waste to Resources. Towards Zero Waste. Green. Ind. Netw. Stud. 2019, 6, 1–8. [Google Scholar]
- Tisserant, A.; Pauliuk, S.; Merciai, S.; Schmidt, J.; Fry, J.; Wood, R.; Tukker, A. Solid Waste and the Circular Economy: A Global Analysis of Waste Treatment and Waste Footprints. J. Ind. Ecol. 2017, 21, 628–639. [Google Scholar] [CrossRef] [Green Version]
- Nelles, M.; Grünes, J.; Morscheck, G. Waste Management in Germany—Development to a Sustainable Circular Economy? Procedia Environ. Sci. 2016, 35, 6–14. [Google Scholar] [CrossRef]
- Rada, E.C.; Ragazzi, M.; Fedrizzi, P. Web-GIS oriented systems viability for municipal solid waste selective collection optimization in developed and transient economies. Waste Manag. 2013, 33, 785–792. [Google Scholar] [CrossRef]
- Paes, M.X.; de Medeiros, G.A.; Mancini, S.D.; Bortoleto, A.P.; Puppim de Oliveira, J.A.; Kulay, L.A. Municipal solid waste management: Integrated analysis of environmental and economic indicators based on life cycle assessment. J. Clean. Prod. 2020, 254, 119848. [Google Scholar] [CrossRef]
- Paes, M.X.; de Medeiros, G.A.; Mancini, S.D.; de Ribeiro, F.M.; de Oliveira, J.A.P. Transition to circular economy in Brazil: A look at the municipal solid waste management in the state of São Paulo. Manag. Decis. 2019. in print. [Google Scholar] [CrossRef]
- Ghisellini, P.; Ulgiati, S. Circular economy transition in Italy. Achievements, perspectives and constraints. J. Clean. Prod. 2020, 243, 118360. [Google Scholar] [CrossRef]
- Casazza, M.; Huisingh, D.; Ulgiati, S.; Severino, V.; Liu, G.; Lega, M. Product service system-based municipal solid waste circular management platform in campania region (Italy): A preliminary analysis. Procedia CIRP 2019, 83, 224–229. [Google Scholar] [CrossRef]
- Minelgaitė, A.; Liobikienė, G. Waste problem in European Union and its influence on waste management behaviours. Sci. Total Environ. 2019, 667, 86–93. [Google Scholar] [CrossRef] [PubMed]
- Stoeva, K.; Alriksson, S. Influence of recycling programmes on waste separation behaviour. Waste Manag. 2017, 68, 732–741. [Google Scholar] [CrossRef]
- Das, S.; Bhattacharyya, B.K. Optimization of municipal solid waste collection and transportation routes. Waste Manag. 2015, 43, 9–18. [Google Scholar] [CrossRef]
- Lee, C.T.; Mohammad Rozali, N.E.; Van Fan, Y.; Klemeš, J.J.; Towprayoon, S. Low-carbon emission development in Asia: Energy sector, waste management and environmental management system. Clean Technol. Environ. Policy 2018, 20, 443–449. [Google Scholar] [CrossRef]
- Rajaeifar, M.A.; Ghanavati, H.; Dashti, B.B.; Heijungs, R.; Aghbashlo, M.; Tabatabaei, M. Electricity generation and GHG emission reduction potentials through different municipal solid waste management technologies: A comparative review. Renew. Sustain. Energy Rev. 2017, 79, 414–439. [Google Scholar] [CrossRef]
- Yaman, C. Investigation of greenhouse gas emissions and energy recovery potential from municipal solid waste management practices. Environ. Dev. 2020, 33, 100484. [Google Scholar] [CrossRef]
- Lucato, W.C.; Pacchini, A.P.T.; Facchini, F.; Mummolo, G. Model to evaluate the Industry 4.0 readiness degree in Industrial Companies. IFAC-PapersOnLine 2019, 52, 1808–1813. [Google Scholar] [CrossRef]
- Pacchini, A.P.T.; Lucato, W.C.; Facchini, F.; Mummolo, G. The degree of readiness for the implementation of Industry 4.0. Comput. Ind. 2019, 113, 103125. [Google Scholar] [CrossRef]
- Kristanto, G.A.; Koven, W. Estimating greenhouse gas emissions from municipal solid waste management in Depok, Indonesia. City Environ. Interact. 2019, 4, 100027. [Google Scholar] [CrossRef]
- Rodrigues, S.; Martinho, G.; Pires, A. Waste collection systems. Part A: A taxonomy. J. Clean. Prod. 2016, 113, 374–387. [Google Scholar] [CrossRef]
- Yadav, V.; Karmakar, S. Sustainable collection and transportation of municipal solid waste in urban centers. Sustain. Cities Soc. 2020, 53, 101937. [Google Scholar] [CrossRef]
- Gallardo, A.; Carlos, M.; Peris, M.; Colomer, F.J. Methodology to design a municipal solid waste generation and composition map: A case study. Waste Manag. 2014, 34, 1920–1931. [Google Scholar] [CrossRef] [Green Version]
- SINTESI—Consulenza e Servizi per L’ambiente. Progettazione Di un Nuovo Sistema di Raccolta Differenziata Dei Rifiuti Urbani. Available online: http://www.sintesionline.eu/default.asp (accessed on 20 April 2020).
- Ibáñez-Forés, V.; Bovea, M.D.; Coutinho-Nóbrega, C.; de Medeiros-García, H.R.; Barreto-Lins, R. Temporal evolution of the environmental performance of implementing selective collection in municipal waste management systems in developing countries: A Brazilian case study. Waste Manag. 2018, 72, 65–77. [Google Scholar] [CrossRef] [PubMed]
- Seyring, N.; Dollhofer, M.; Weißenbacher, J.; Herczeg, M.; David, M. Assessment of separate collection schemes in the 28 capitals of the EU. Waste Manag. Res. 2015, 34, 947–956. [Google Scholar] [CrossRef]
- Xue, B.; Chen, X.P.; Geng, Y.; Guo, X.J.; Lu, C.P.; Zhang, Z.L.; Lu, C.Y. Survey of officials’ awareness on circular economy development in China: Based on municipal and county level. Resour. Conserv. Recycl. 2010, 54, 1296–1302. [Google Scholar] [CrossRef]
- Liu, Q.; Li, H.M.; Zuo, X.L.; Zhang, F.F.; Wang, L. A survey and analysis on public awareness and performance for promoting circular economy in China: A case study from Tianjin. J. Clean. Prod. 2009, 17, 265–270. [Google Scholar] [CrossRef]
- Calabrò, P.S.; Komilis, D. A standardized inspection methodology to evaluate municipal solid waste collection performance. J. Environ. Manag. 2019, 246, 184–191. [Google Scholar] [CrossRef]
- Coles, R.; McDowell, D.; Kirwan, M. Food Packaging Technology; Blackwell Publishing Ltd.: London, UK, 2003. [Google Scholar]
- Ragaert, K.; Delva, L.; Van Geem, K. Mechanical and chemical recycling of solid plastic waste. Waste Manag. 2017, 69, 24–58. [Google Scholar] [CrossRef] [PubMed]
- Triantafyllou, V.I.; Karamani, A.G.; Akrida-Demertzi, K.; Demertzis, P.G. Studies on the usability of recycled PET for food packaging applications. Eur. Food Res. Technol. 2002, 215, 243–248. [Google Scholar] [CrossRef]
- Malik, N.; Kumar, P.; Shrivastava, S.; Ghosh, S.B. An overview on PET waste recycling for application in packaging. Int. J. Plast. Technol. 2017, 21, 1–24. [Google Scholar] [CrossRef]
- Direct-Industry Contenitore per Rifiuti. Available online: https://www.directindustry.it/prod/denios/product-15559-1551997.html (accessed on 20 April 2020).
- Noci24.it. Contenitori per la Raccolta Differenziata di Rifiuti. Available online: https://www.noci24.it/politica/palazzo-di-citta/16518-epifania-con-regolare-servizio-di-raccolta-chiuso-invece-il-ccr (accessed on 20 April 2020).
- Regione-Puglia Dati Rifiuti Solidi Urbani per Comune—Anno 2018. Available online: http://ecologia.regione.puglia.it/portal/portale_orp/Osservatorio+Rifiuti/Osservatorio+Rifiuti+Cittadino/RSU+per+Comune/OrpCittadinoWindow?entity=rsucomune&action=e&windowstate=normal&action_com=comune&comune=072004&mode=view (accessed on 28 May 2020).
- Facchini, F.; Olésków-Szłapka, J.; Ranieri, L.; Urbinati, A. A maturity model for logistics 4.0: An empirical analysis and a roadmap for future research. Sustainability 2020, 12, 86. [Google Scholar] [CrossRef] [Green Version]
- Kothari, C. Research Methodology: Methods and Techniques, 2nd ed.; New Age International Publishers: Jaipur, India, 2004. [Google Scholar]
- ISPRA Rapporto Rifiuti Urbani—Edizione 2019. Available online: https://www.isprambiente.gov.it/it/archivio/eventi/2019/12/rapporto-rifiuti-urbani-edizione-2019 (accessed on 20 April 2020).
- Laurieri, N.; Facchini, F.; Lucchese, A.; Marino, A.; Piccininno, G. Domestic waste management: A survey for the design of an innovative compactor. In Proceedings of the XXV Summer School “Francesco Turco”—Industrial System Engineering, Bergamo, Italy, 9–11 September 2020. [Google Scholar]
- Cangur, S.; Ankarali, H.; Pasin, O. Comparing Performances of Multiple Comparison Methods in Commonly Used 2 × C Contingency Tables. Interdiscip. Sci. Comput. Life Sci. 2016, 8, 337–345. [Google Scholar] [CrossRef]
- Turcott Cervantes, D.E.; López Martínez, A.; Cuartas Hernández, M.; Lobo García de Cortázar, A. Using indicators as a tool to evaluate municipal solid waste management: A critical review. Waste Manag. 2018, 80, 51–63. [Google Scholar] [CrossRef]
- Sterner, T.; Bartelings, H. Household waste management in a Swedish municipality: Determinants of waste disposal, recycling and composting. Environ. Resour. Econ. 1999, 13, 473–491. [Google Scholar]
- Bruvoll, A.; Halvorsen, B.; Nyborg, K. Households’ recycling efforts. Resour. Conserv. Recycl. 2002, 36, 337–354. [Google Scholar] [CrossRef]
- Romano, G.; Rapposelli, A.; Marrucci, L. Improving waste production and recycling through zero-waste strategy and privatization: An empirical investigation. Resour. Conserv. Recycl. 2019, 146, 256–263. [Google Scholar] [CrossRef]
- Song, Q.; Zhao, S.; Lam, I.; Zhu, L.; Yuan, W.; Wang, C. Understanding residents and enterprises’ perceptions, behaviors, and their willing to pay for resources recycling in Macau. Waste Manag. 2019, 95, 129–138. [Google Scholar] [CrossRef]
- Czajkowski, M.; Kadziela, T.; Hanley, N. We want to sort! Assessing households’ preferences for sorting waste. Resour. Energy Econ. 2014, 36, 290–306. [Google Scholar] [CrossRef] [Green Version]
- Andersson, C.; Stage, J. Direct and indirect effects of waste management policies on household waste behaviour: The case of Sweden. Waste Manag. 2018, 76, 19–27. [Google Scholar] [CrossRef] [PubMed] [Green Version]
- Knickmeyer, D. Social factors influencing household waste separation: A literature review on good practices to improve the recycling performance of urban areas. J. Clean. Prod. 2020, 245, 118605. [Google Scholar] [CrossRef]
- Nainggolan, D.; Pedersen, A.B.; Smed, S.; Zemo, K.H.; Hasler, B.; Termansen, M. Consumers in a Circular Economy: Economic Analysis of Household Waste Sorting Behaviour. Ecol. Econ. 2019, 166, 106402. [Google Scholar] [CrossRef]
- Shahmoradi, B. Collection of municipal solid waste in developing countries. Int. J. Environ. Stud. 2013, 1013–1014. [Google Scholar] [CrossRef]
- Santos, A.C.; Mendes, P.; Ribau Teixeira, M. Social life cycle analysis as a tool for sustainable management of illegal waste dumping in municipal services. J. Clean. Prod. 2019, 210, 1141–1149. [Google Scholar] [CrossRef]
- Vining, J.; Ebreo, A. What makes a recycler? A Comparison of Recyclers and Nonrecyclers. Environ. Behav. 1990, 22, 55–73. [Google Scholar] [CrossRef]
- Lee, S.; Paik, H.S. Korean household waste management and recycling behavior. Build. Environ. 2011, 46, 1159–1166. [Google Scholar] [CrossRef]
- Xiao, L.; Zhang, G.; Zhu, Y.; Lin, T. Promoting public participation in household waste management: A survey based method and case study in Xiamen city, China. J. Clean. Prod. 2017, 144, 313–322. [Google Scholar] [CrossRef]
- ISTAT Raccolta Differenziata dei Rifiuti: Comportamenti e Soddisfazione dei Cittadini e Politiche Nelle Città. Available online: https://www.istat.it/it/archivio/234691 (accessed on 20 April 2020).
- Gilli, M.; Nicolli, F.; Farinelli, P. Behavioural attitudes towards waste prevention and recycling. Ecol. Econ. 2018, 154, 294–305. [Google Scholar] [CrossRef]
- Kristanto, G.A.; Gusniani, I.; Ratna, A. The performance of municipal solid waste recycling program in Depok, Indonesia. Int. J. Technol. 2015, 6, 264–272. [Google Scholar] [CrossRef] [Green Version]
- Meng, X.; Wen, Z.; Qian, Y. Multi-agent based simulation for household solid waste recycling behavior. Resour. Conserv. Recycl. 2018, 128, 535–545. [Google Scholar] [CrossRef]
- Chung, W.; Yeung, I.M.H. Analysis of residents’ choice of waste charge methods and willingness to pay amount for solid waste management in Hong Kong. Waste Manag. 2019, 96, 136–148. [Google Scholar] [CrossRef] [PubMed]
- Jaunich, M.K.; Levis, J.W.; DeCarolis, J.F.; Gaston, E.V.; Barlaz, M.A.; Bartelt-Hunt, S.L.; Jones, E.G.; Hauser, L.; Jaikumar, R. Characterization of municipal solid waste collection operations. Resour. Conserv. Recycl. 2016, 114, 92–102. [Google Scholar] [CrossRef] [Green Version]
- Jaunich, M.K.; Levis, J.W.; Barlaz, M.A.; Decarolis, J.F. Lifecycle Process Model for Municipal Solid Waste Collection. J. Environ. Eng. (US) 2016, 142, 04016037. [Google Scholar] [CrossRef]
- Starkowski, D.; Bardzinski, P. Road transport process analysis, of municipal waste, on the basis of a chosen service company. Classification and identification of waste. Econ. Environ. 2017, 4, 79–89. [Google Scholar]
- Gallardo, A.; Bovea, M.D.; Colomer, F.J.; Prades, M. Analysis of collection systems for sorted household waste in Spain. Waste Manag. 2012, 32, 1623–1633. [Google Scholar] [CrossRef]
- Okoli, C.; Pawlowski, S.D. The Delphi method as a research tool: An example, design considerations and applications. Inf. Manag. 2004, 42, 15–29. [Google Scholar] [CrossRef] [Green Version]
Figure 1.
The five principles of Circular Economy (CE). The five principles are were established by the European Commission, Directive 2008/98/CE, and are listed starting from those with a minor negative impact on society and environment to those with the most negative impact. The prevention (of waste production) has the minimum impact, whereas from ‘preparing for re-use’ to ‘landfill disposal’ the relative impact gradually increases upon waste production.

Figure 2.
Domestic bins used to collect waste fractions at home. (a) Communal big trolleyed bins (45 × 45 × 80 cm3) used in blocks with at least 8 flats [36]; (b) small bins (30 × 25 × 40 cm3) used for separate waste fraction collection in all the other dwellings [37].

Figure 3.
Percentage trend of the separate waste fractions collected in the town during the last three years. Available percentage values have been provided by the Regional Environment Internet Portal [38]. Months in which community bins were used for waste collection in the town are labelled using blue points; months in which door-to-door collection system was adopted are labelled using orange points; green points refer to the new system’s introduction phase (4 months).

Figure 4.
Survey framework. The different steps are shown in bold in plain boxes, whereas the tools used or the stakeholders involved are labelled in italics in empty boxes using the corresponding colour.
Figure 4.
Survey framework. The different steps are shown in bold in plain boxes, whereas the tools used or the stakeholders involved are labelled in italics in empty boxes using the corresponding colour.

Figure 5.
Comparison of domestic collection frequencies of five waste fractions. Abbreviations: + = more assiduously, - = less regularly.
Figure 5.
Comparison of domestic collection frequencies of five waste fractions. Abbreviations: + = more assiduously, - = less regularly.

Figure 6.
Comparison of domestic bins filling for four waste fractions.

Figure 7.
Frequency of bins delivery outside the house for collection (a) Comparison of weekly bin delivery by households. Average times that households leave their waste bins outside their home for morning pick-up in a week time. Abbreviations: x = times, w. = week; (b) Monthly frequency of dropping off paper and glass bins for collection.

Figure 8.
Correctness and proficiency of domestic waste sorting at personal and municipal levels.

Figure 9.
Use of disposable items for groceries by citizens in daily life.

Table 1.
Recycling targets defined by the European Union (EU), Directive 2018/851/EU. Percentage of recycled waste to be achieved by 2025 and by 2030.
Table 1.
Recycling targets defined by the European Union (EU), Directive 2018/851/EU. Percentage of recycled waste to be achieved by 2025 and by 2030.
| Year | General Target | Plastic | Aluminium | Glass | Paper/ Cardboard |
|---|---|---|---|---|---|
| 2025 | 55% | 50% | 50% | 70% | 75% |
| 2030 | 60% | 55% | 60% | 75% | 85% |
Table 2.
Main waste collection and transport systems used in municipal solid waste (MSW) management as described in Yadav and Karmakar [24].
Table 2.
Main waste collection and transport systems used in municipal solid waste (MSW) management as described in Yadav and Karmakar [24].
| MSW systems | Description | Characteristics |
|---|---|---|
| Door-to-Door | Vehicles visit specific collection points following a precise time schedule. | -Economical -Convenient for citizens -Necessity of a family member for handing-over the MSW to collectors |
| Curbside | Citizens drop off their MSW in containers at the curb following a time schedule and collectors empty the containers in the vehicles. | -Least time-demanding -Economical -No need of someone for the handover |
| Dumping at designed places | Municipalities identify places for the dumping of MSW. | -Least expensive -Less manual labour |
| Collectors step inside the property to collect MSW and transfer it to the vehicle. | -No need for bins on the streets -Expensive due to the intense manual labour -Problem of trespassing on property | |
| Pneumatic | MSW is collected and transported through pipelines with pressurized air. | -Skilled labour -High initial capital investment -Reduction of GHG emissions, air and noise pollution |
Note: MSW—Municipal Solid Waste; GHG—Green House Gasses.
Table 3.
Weekly garbage pick-up schedule in the town since September 2018.
| Waste Fractions | Town Centre | Town Districts | Out-of-Town Areas |
|---|---|---|---|
| Organic | Monday—Wednesday—Friday | Monday—Wednesday—Friday | Monday—Wednesday—Friday |
| Mixed | Tuesday—Saturday | Tuesday—Saturday | Tuesday—Thursday—Saturday |
| Plastic/Metal | Thursday | Thursday | Thursday |
| Glass | Monday | Monday | Monday |
| Paper/Cardboard | Friday | Friday | Friday |
Table 4.
Number and type of utilities in Italy and Apulia region, elaboration of data from ISPRA [41].
Table 4.
Number and type of utilities in Italy and Apulia region, elaboration of data from ISPRA [41].
| Geographic Reference | Measurement Unit | Total of Sample Utilities | Domestic Utilities | Non-Domestic Utilities |
|---|---|---|---|---|
| Italy | (#) | 19,837,199 | 17,185,649 | 2,651,550 |
| (%) | - | 86.63% | 13.37% | |
| Apulia | (#) | 502,092 | 445,414 | 56,678 |
| (%) | - | 88.71% | 11.29% |
Table 5.
Survey questions 1–4.
| Questions | Answers | Number | Percentage |
|---|---|---|---|
| 1. Gender | Male | 176 | 45.7% |
| Female | 209 | 54.3% | |
| 2. Age | Less than 20-year-old | 42 | 10.9% |
| 20- to 40-year-old | 217 | 56.4% | |
| 41- to 60-year-old | 107 | 27.8% | |
| More than 60-year-old | 19 | 4.9% | |
| 3. Daily activity | Student | 111 | 28.8% |
| Worker | 218 | 56.6% | |
| Formally unemployed 1 | 56 | 14.5% | |
| 4. Educational level | Primary school | 6 | 1.6% |
| Lower-school level | 76 | 19.7% | |
| A-level | 160 | 41.6% | |
| Bachelor degree | 110 | 28.6% | |
| Master or Doctoral degree | 28 | 7.3% | |
| None | 5 | 1.3% |
1 Unemployed, retired, housewife, etc.
Table 6.
Survey questions 5–9.
| Questions | Answers | Number | Percentage |
|---|---|---|---|
| 5. Number of family members | 1–3 | 126 | 32.7% |
| 4–6 | 242 | 62.9% | |
| 7 or more | 17 | 4.4% | |
| 6. Location of the family unit house | Town centre | 34 | 8.8% |
| Town district | 294 | 76.4% | |
| Out-of-town area | 44 | 11.4% | |
| Industrial area | 13 | 3.4% | |
| 7. Type of residential dwelling | Block of less than 8 flats | 136 | 35.3% |
| Block of at least 8 flats | 109 | 28.3% | |
| Single-family house without garden | 94 | 24.4% | |
| Small house with garden | 46 | 11.9% | |
| 8. Surface of house lodgings | Less than 60 m2 | 11 | 2.9% |
| Between 60 and 90 m2 | 101 | 26.2% | |
| Between 91 and 120 m2 | 108 | 28.1% | |
| More than 120 m2 | 165 | 42.9% | |
| 9. Does your home have at least one outdoor balcony (terrace/veranda)? | Yes | 353 | 91.7% |
| No | 32 | 8.3% |
Table 7.
Survey questions 10–12.
| Questions | Answers | Number | Percentage |
|---|---|---|---|
| 10. Do you usually manage the separation of waste fractions home? | No | 38 | 9.9% |
| Yes | 347 | 90.1% | |
| 11. Do you have any AroBA4 or similar personal sorted waste bins in your home? | Yes (you can answer questions from 15 to 23) | 302 | 78.4% |
| No, I don’t, because I live in a block with at least 8 flats (please, continue to answer question from 24a onwards) | 83 | 21.6% | |
| 12. If you live in a complex with at least 8 flats, what kind of spaces are used for the big communal trolleyed bins? | Sidewalks or roads | 22 | 20.6% |
| Totally improvised areas | 31 | 29.0% | |
| Roughly arranged areas | 20 | 18.7% | |
| Appropriate outdoor areas or rooms | 34 | 31.8% |
Table 8.
Survey questions 13–14.
| Questions | Answers | Number | Percentage |
|---|---|---|---|
| 13. Which waste fraction do you collect less regularly? | Paper waste (PW) | 17 | 5.6% |
| Residual unsorted waste (UW) | 83 | 27.5% | |
| Plastic or Metal waste (PM) | 14 | 4.6% | |
| Organic waste (OW) | 11 | 3.6% | |
| Glass waste (GW) | 177 | 58.7% | |
| 14. Which waste fraction do you collect more assiduously? (two answers are possible) | Paper waste (PW) | 48 | 9.1% |
| Residual unsorted waste (UW) | 126 | 24.0% | |
| Plastic or Metal waste (PM) | 131 | 25.0% | |
| Organic waste (OW) | 206 | 39.2% | |
| Glass waste (GW) | 14 | 2.7% |
Table 9.
Survey questions 15–18.
| Questions | Answers | Number | Percentage |
|---|---|---|---|
| 15. How much is your paper waste (PW) bin usually filled before delivering outside the house for morning collection? | Little filled | 15 | 5.0% |
| A half filled | 57 | 18.9% | |
| Completely filled | 230 | 76.2% | |
| 16. How much is your unsorted waste (UW) bin usually filled before delivering outside the house for morning collection? | Little filled | 68 | 22.5% |
| A half filled | 86 | 28.5% | |
| Completely filled | 148 | 49.0% | |
| 17. How much is your organic waste (OW) bin usually filled before delivering outside the house for morning collection? | Little filled | 11 | 3.6% |
| A half filled | 107 | 35.4% | |
| Completely filled | 184 | 60.9% | |
| 18. How much is your glass waste (GW) bin usually filled before delivering outside the house for morning collection? | Little filled | 52 | 17.2% |
| A half filled | 106 | 35.1% | |
| Completely filled | 144 | 47.7% |
Table 10.
Survey questions 19–21.
| Questions | Answers | Number | Percentage |
|---|---|---|---|
| 19. On average how many times a week do you deliver your waste bins outside your house for morning collection, whatever the type of waste fraction as planned by the municipal schedule planning? | 3 days a week or less | 29 | 9.6% |
| 4 days a week | 101 | 33.4% | |
| 5 days a week | 68 | 22.5% | |
| 6 days a week | 104 | 34.4% | |
| 20. How often do you deliver your paper waste (PW) bin on average? | Once a week | 190 | 62.9% |
| Once every two weeks | 90 | 29.8% | |
| Once every three weeks | 17 | 5.6% | |
| Once a month | 5 | 1.7% | |
| 21. How often do you deliver your glass waste (GW) bin on average? | Once a week | 73 | 24.2% |
| Once every two weeks | 75 | 24.8% | |
| Once every three weeks | 101 | 33.4% | |
| Once a month | 53 | 17.5% |
Table 11.
Survey questions 22–25.
| Questions | Answers | Number | Percentage |
|---|---|---|---|
| 22. How much correctly and proficiently do you usually separate waste fractions? | Very correctly/proficiently | 130 | 33.8% |
| Quite correctly/proficiently | 230 | 59.7% | |
| Little correctly/proficiently | 16 | 4.2% | |
| Not at All correctly/proficiently | 9 | 2.3% | |
| 23. How much correctly and efficiently is the collection of separated waste fractions carried out in your town? | Very correctly/efficiently | 39 | 10.1% |
| Quite correctly/efficiently | 224 | 58.2% | |
| Little correctly/efficiently | 110 | 28.6% | |
| Not at All correctly/efficiently | 12 | 3.1% | |
| 24. In your opinion, how efficient are the controls and fines for those who do not carry out a correct separate waste collection? | Very efficient | 40 | 10.4% |
| Quite efficient | 111 | 28.8% | |
| Little efficient | 167 | 43.4% | |
| Not at All efficient | 67 | 17.4% | |
| 25. What motivates you to enhance your engagement in sorting waste fractions home? (2 answers are possible) | More information on the outcomes of the fractions | 116 | 16.4% |
| More information on the overall environmental benefits | 139 | 19.7% | |
| More information on the methods of collection | 54 | 7.6% | |
| Greater citizenry involvement | 85 | 12.0% | |
| Additional controls on the quality of the waste fractions sorted | 145 | 20.5% | |
| Individual rewards proportionate to the amount of the sorted refuses collected home | 167 | 23.7% |
Table 12.
Survey questions 26–29.
| Questions | Answers | Number | Percentage |
|---|---|---|---|
| 26. How often do you use disposable tableware (plates, glasses, etc.)? | Rarely/never | 164 | 42.6% |
| Sometimes | 161 | 41.8% | |
| Often/always | 60 | 15.6% | |
| 27. How often do you use water / soft drinks in plastic bottles? | Rarely/never | 72 | 18.7% |
| Sometimes | 121 | 31.4% | |
| Often/always | 192 | 49.9% | |
| 28. How often do you use non-biodegradable plastic bags (example: fruit bags, etc.)? | Rarely/never | 120 | 31.2% |
| Sometimes | 156 | 40.5% | |
| Often/always | 109 | 28.3% | |
| 29. How often do you buy food assorted within plastic containers/trays? | Rarely/never | 40 | 10.4% |
| Sometimes | 161 | 41.8% | |
| Often/always | 184 | 47.8% |
Table 13.
Illustrative results for better, moderate, and worse cases of waste collection and transport, as modified from Jaunich et al. [63].
Table 13.
Illustrative results for better, moderate, and worse cases of waste collection and transport, as modified from Jaunich et al. [63].
| Case | Fuel (L/ton) | Number Collection Vehicles | Cost ($/ton of Waste) 1 |
|---|---|---|---|
| Better case | 16.6 | 15.9 | 76.8 |
| Moderate case | 28.7 | 28.0 | 142.5 |
| Worse case | 64.9 | 43.8 | 231.4 |
1 Estimated diesel fuel price $0.66/L.
Table 14.
Yearly amounts of unsorted and sorted wastes per inhabitant, adapted from ISPRA [41].
Table 14.
Yearly amounts of unsorted and sorted wastes per inhabitant, adapted from ISPRA [41].
| Geographic Reference | Unsorted Waste Collected Per Capita (kg/Inhabitant × year) | Sorted Waste Collected Per Capita (kg/Inhabitant × year) |
|---|---|---|
| Italy | 499.75 | 290.73 |
| Apulia | 470.93 | 213.78 |
| Altamura | 370.13 | 156.77 |
Table 15.
Survey-based weekly garbage pick-up schedule in the town.
| Waste Fractions | Town Centre | Town Districts | Out-of-Town Areas |
|---|---|---|---|
| Organic | Monday—Wednesday—Friday | Monday—Wednesday—Friday | Monday—Wednesday—Friday |
| Mixed 1 | Tuesday | Tuesday | Tuesday—Thursday |
| Plastic/metal | Thursday | Thursday | Thursday |
| Glass 1 | Tuesday | Tuesday | Tuesday |
| Paper/cardboard | Friday | Friday | Friday |
1 Waste fractions whose collection frequencies are proposed to be modified, are highlighted in grey.
© 2020 by the authors. Licensee MDPI, Basel, Switzerland. This article is an open access article distributed under the terms and conditions of the Creative Commons Attribution (CC BY) license (http://creativecommons.org/licenses/by/4.0/).
Share and Cite
MDPI and ACS Style
Laurieri, N.; Lucchese, A.; Marino, A.; Digiesi, S. A Door-to-Door Waste Collection System Case Study: A Survey on its Sustainability and Effectiveness. Sustainability 2020, 12, 5520. https://doi.org/10.3390/su12145520
AMA Style
Laurieri N, Lucchese A, Marino A, Digiesi S. A Door-to-Door Waste Collection System Case Study: A Survey on its Sustainability and Effectiveness. Sustainability. 2020; 12(14):5520. https://doi.org/10.3390/su12145520
Chicago/Turabian StyleLaurieri, Nicola, Andrea Lucchese, Antonella Marino, and Salvatore Digiesi. 2020. "A Door-to-Door Waste Collection System Case Study: A Survey on its Sustainability and Effectiveness" Sustainability 12, no. 14: 5520. https://doi.org/10.3390/su12145520
Note that from the first issue of 2016, this journal uses article numbers instead of page numbers. See further details here.