Article

Developing a Methodological Framework for Estimating Temporary Drainage Capacity to Inform Land Requirements for a Highway Construction Project in Scotland

1
People and Places Solutions, Transportation, Jacobs UK Ltd., Glasgow G2 7HX, UK
2
Department of Civil Engineering and Environment, School of Computing, Engineering and Built Environment, Glasgow Caledonian University, Glasgow G4 0BA, UK
3
Formerly Jacobs UK Ltd., Glasgow G2 7HX, UK
*
Author to whom correspondence should be addressed.
Sustainability 2020, 12(14), 5522; https://doi.org/10.3390/su12145522
Submission received: 26 May 2020 / Revised: 26 June 2020 / Accepted: 29 June 2020 / Published: 8 July 2020
(This article belongs to the Special Issue Sustainable Geotechnics—Theory, Practice, and Applications)

Abstract

:
Silt pollution generated during major highway construction projects can prove detrimental to the water environment and the aquatic species that depend on it. Construction activities can leave many kilometers of exposed soil susceptible to erosion from surface water runoff, which can result in silt pollution and degradation of ecologically sensitive watercourses if appropriate mitigation is not in place. In Scotland, assurances need to be provided during scheme development to demonstrate that there is sufficient space to accommodate temporary drainage. In response, a methodological framework has been developed that can be applied before construction commences to estimate the required capacity of settlement ponds including runoff and soil loss volume estimation, which are estimated using the Rational Method and Revised Universal Soil Loss Equation (RUSLE). The application of the framework as a case-study has demonstrated the potential applicability of the approach and highlighted where further refinements can be made to increase the robustness for future applications by improving the accuracy of input parameters to address site-specific conditions. Furthermore, it demonstrates how adopting erosion control measures can reduce the land required to accommodate temporary settlement ponds.

1. Introduction

Highways construction can be detrimental to the environment due to the level of ground disturbance, which can span many kilometers. Once vegetated surfaces are stripped and topsoil is removed, areas of exposed soil are left susceptible to water and wind erosion. When exposed surfaces are eroded, without adequate water management in place, suspended eroded materials can enter the water environment. Once in the water environment, they can be damaging to downstream receptors [1]. Providing suitable mitigation against elevated rates of suspended solids in the water environment prevents a number of ecologically detrimental effects. This can include reduced light penetration in the water column for aquatic plants and smothering of salmonid spawning areas [2].
When considering water and pollution control in a construction context, it is necessary to consider both erosion and sediment control [1]. Soil erosion is a natural process where the soil surface is eroded by water, wind, ice and gravity. The issue is exacerbated during construction through the removal of vegetation, which leaves the underlying bare surface exposed and increases the rate of erosion [3]. Controlling runoff and soil stabilization are both forms of erosion control [4] that should be considered as preventative measures. Incorporating suitable preventative measures should be considered as a vital first step as they are the most effective at preventing the mobilization of clay and silt particles [5] and help reduce the rate of soil erosion [2].
Sediment control is required once eroded soil particles are suspended in runoff. The aim of sediment control measures is to facilitate the settlement of eroded material, or removal by filtration before the eroded material discharges from site [4]. Examples of sediment control include buffer strips, temporary sediment basins and tanks, silt fences and biodegradable fiber rolls [2]. As recommended, sediment control should be considered as the second step, as reliance upon sediment controls will be reduced through effective erosion control [5]. When using temporary settlement ponds, the surface area should be 1.5% of the catchment it serves to achieve in the region of 90% total solid reduction although solids reduction in a highway construction environment can be in the region of 15% [5,6]. Even with results as effective as 90% total solid reduction, if fine particles are present, then sufficient settlement may never be achieved [1,7,8]. Therefore, temporary settlement ponds should be used in conjunction with other control measures [5,8], including erosion controls such as vegetation, geotextiles and mulch [5]. In addition to the variable treatment efficiency and relatively large footprint needed for effective settlement, relying solely on sediment control can prove to be more costly compared to minimizing soil loss as a priority [1].
The Design Manual for Roads and Bridges (DMRB) [9] sets out three stages of assessment reporting. Design organizations follow this staged process to provide statutory and public bodies with the necessary information in relation to the environmental, economic and traffic effects of the proposed scheme and alternative proposals under consideration. The Stage 3 assessment clearly identifies the advantages and disadvantages of the preferred route and includes an assessment of the likely significant environmental effects [9]. During the Stage 3 assessment for a linear highway construction project in Scotland [10], the environmental regulator, a statutory consultee, requested confirmation that there was sufficient available land to accommodate temporary drainage to effectively manage runoff from the site prior to discharge into the water environment. From this request, it became apparent that there was a need to agree an effective framework approach to calculate the required capacity of temporary drainage during construction. Developing a framework allows stakeholders to establish that there is sufficient available land to accommodate the temporary drainage measures and deliver the necessary environmental mitigation to protect the water environment.
Methodological frameworks provide an approach to reach a desired outcome whilst incorporating necessary parameters needed to meet regulatory requirements. Within an environmental context, methodological frameworks have been developed for a range of purposes including: protecting wetlands from negative effects associated with linear development projects [11]; soil erosion risk assessment [12]; developing a sustainability assessment for eco-engineering measures [13]; combining digital and environmental data to identify catchment boundaries [14]; and predicting soil loss using the Revised Universal Soil Loss Equation (RUSLE) [15]. To be effective, the developed framework needs to include the parameters required for temporary drainage. It was decided that the methodological approach would incorporate the design considerations provided in [1]. This is an industry-wide source of information for protecting the water environment during highway construction and is regarded by the environmental regulator as a source of best-practice measures [16]. This includes using runoff volume estimation and the RUSLE [17] to calculate sediment input into control options, which include temporary settlement ponds.
To the best of our knowledge, there are no standardized approaches to calculate the capacity of temporary drainage features when compared to drainage systems that will serve the operational phase of a highway. The flood risk policy in Scotland [18] requires that all new infrastructure and buildings should be designed to avoid surface water flooding from 1:200-year (0.5% annual exceedance probability (AEP)) rainfall events. However, sizing temporary drainage systems to accommodate the 1:200-year event is an overly conservative approach due to the length of time that temporary drainage would be in operation, which would generally be less than five years. Designing temporary drainage to accommodate a 1:10-year rainfall event has been the accepted design standard based on the recommendation set out in industry guidance because the duration of construction is generally less than 10 years [1]. However, it should be noted that in Scotland, the environmental regulator would expect to see a minimum of a 1:10-year event used for temporary drainage depending on the anticipated timescale for construction [19].
The Universal Soil Loss Equation (USLE) [20] was developed to provide a prediction tool. It is used to calculate long-time average soil losses due to surface water runoff, in a specific area under specific field crop and management scenarios. The potential application of (R)USLE in the construction industry was introduced when the authors presented the concept that the USLE could be diversified for use in the construction industry [20]. A number of states in the USA currently apply the RUSLE to calculate sediment yield [4,21]. Several studies have applied the (R)USLE in a highway construction setting in various global locations [22,23,24]. Other studies have also used RUSLE to estimate soil loss rates at the continental scale [25], including consideration of seasonal variability [26]. However, outside the USA, difficulties can arise in the selection of the most representative input data [27]. Furthermore, exposed subsoils can have different characteristics than the topsoil which further complicates the selection of representative input values [20] without site specific geotechnical data.
The importance of developing a framework for estimating temporary drainage capacity has been further highlighted with the release of guidance by the environmental regulator to assist responsible parties in the preparation of Pollution Prevention Plans (PPPs). PPPs are required to obtain a Construction Site License (CSL) from the environmental regulator before major construction projects can commence [28]. There is now an urgent need for those responsible for the construction and delivery of major infrastructure schemes to address the high risk of pollution to avoid potential enforcement action. In this context, high risk of pollution associated with highway construction is linked with silted water runoff from exposed soils, material stockpiles and road runoff, where the absence or inadequacies of mitigation measures adopted during the construction phase can lead to environmental pollution.
The aim of this study is to set out the methodological framework used by Jacobs [29] for estimating the capacity of temporary drainage, to inform land requirements. This includes the application of the framework on a current highway construction project as a case-study.

2. Materials and Methods

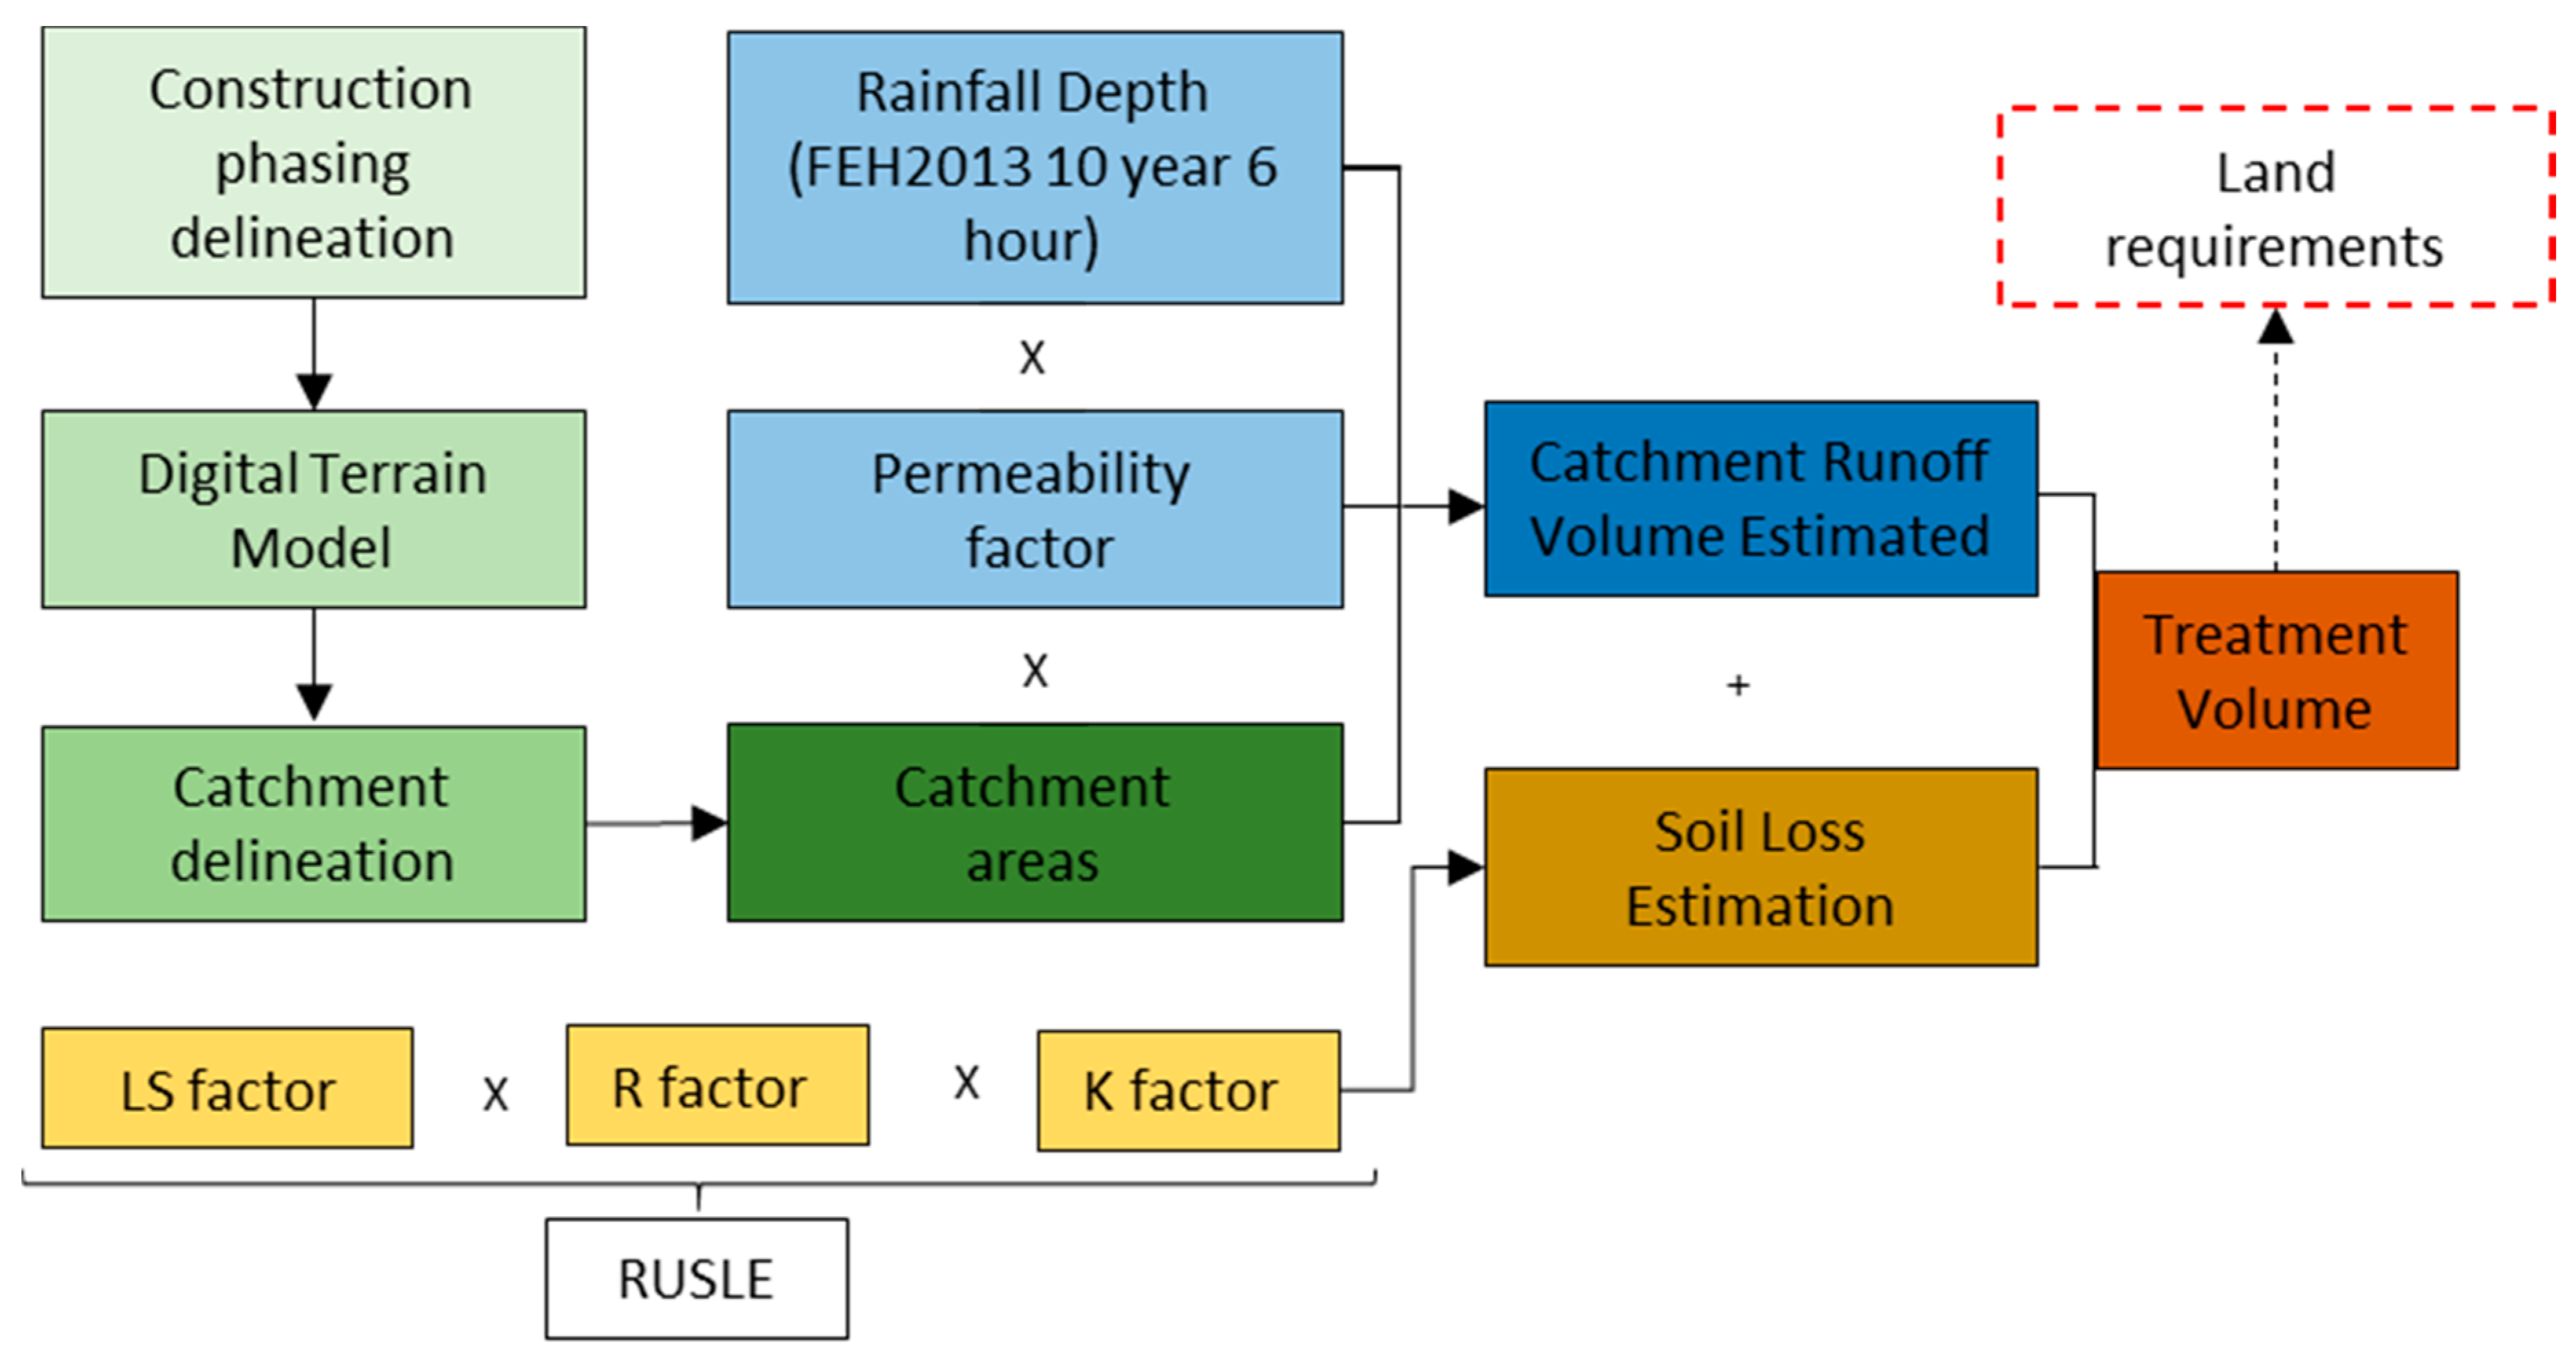
2.1. Methodological Framework Development

Providing assurance during scheme development that sufficient space will be available for temporary drainage is a relatively new concept, as this would have been the responsibility of the appointed contractor. This was on the assumed basis that permanent sustainable drainage system (SuDS) basin locations would be used during construction to accommodate temporary settlement ponds due to the available land to accommodate a 1 in 200-year rainfall event.
Across the industry in Scotland, consultants are using various approaches to assess if sufficient land is available for temporary drainage. The approaches include treatment volume estimation [30] and a combination of estimated runoff and soil loss volume using USLE [1]. Jacobs [29] have proceeded with the approach using runoff volume estimation and estimated soil loss using the USLE. This would be achieved by using a combination of geographic information systems (GIS) [31] and calculations. The outputs of this approach will provide a method for calculating the size of temporary drainage features (settlement ponds).

2.1.1. Construction Phasing and Catchment Delineation

Large linear construction projects are typically constructed in phases, which can minimise disruptive impacts for road users and neighboring communities [32]. Constructing in phases creates temporary drainage catchments dependent on topography and suitable discharge locations. Five-meter airborne-derived LiDAR survey data was obtained during early scheme preparation stages. LiDAR data has been used in other studies to produce a Digital Terrain Model (DTM) at a 1 m resolution to identify landscape features and surface flow pathways [33] and at a 5 m resolution (DTMs) for catchment delineation [34]. However, as construction works commence, the land profile is changed, and the level of detail captured in the DTM can be lost. In addition, inaccuracies can exist in the vertical and horizontal resolution [34]. To mitigate against the risk of DTM inaccuracies, the DTM would be compared to total station topographical survey data (1:500) obtained as part of the highway construction project preparation, as well as 1:10,000 Ordnance Survey mapping.

2.1.2. Soil Loss Estimation

To estimate soil loss, the Revised Universal Soil Loss Equation (RUSLE) [17] has been incorporated into the methodological framework, which is a suggested approach in UK industry guidance [1].
A   =   R × K × ( LS ) × C × P
where: A = soil loss per annum (t ha−1 yr−1); R = rainfall factor (MJ mm ha−1 h−1 yr−1); K = soil erodibility factor (t ha h ha−1 MJ−1 mm−1); and LS = slope factor (horizontal slope and gradient, unitless]; C = cover factor (unitless) and P = erosion control practice (unitless).
The R factor (average annual rainfall–runoff erosivity) is an assimilation of energy and intensity factors. The energy component reflects raindrop size, and intensity is the maximum intensity over a 30-min time-period [4]. The erodibility factor (K), is a numerical approximation of the commonly adopted nomograph [20], which incorporates soil parameters including particle size distribution and organic matter content, permeability and structure [20]. These include soil texture, organic matter content and soil structure and permeability to provide an annual soil loss volume. The LS factor is the topographical representation in the RUSLE that captures the slope length and gradient [17]. The calculation of this factor is achievable using GIS [31]. This approach calculates a LS factor for each cell within a GIS raster and the mean value for each drainage catchment can then be obtained using the zonal statistics produced.
The cover (C) and practice (P) factors can be used to identify effects that different cropping and mechanical management options will have on soil loss [17]; have been omitted for the purposes of this study. This decision was made based on the C and P factor values provided in [1], which are 1 for bare soils. These factors were deemed to be representative of conditions following site clearance on a highway construction site. In reference to Equation 1, the inclusion of C and P factors of 1 would not alter the estimated soil loss volume (A). However, as C and P factors can strongly influence soil loss, their inclusion and refinement warrant further consideration for future framework refinements.

2.1.3. Runoff Volume Estimation

Runoff volume estimation was carried out by using the Rational Method [35,36] which can be used to calculate the peak discharge rate from a catchment [37]. This approach requires input parameters, which include the contributing area (catchment size), rainfall depth and a dimensionless runoff coefficient, which reflects the proportion of peak discharge in relation to direct storm runoff [37]. The selection of the runoff coefficient is dependent on catchment surface characteristics [37,38] and failing to select appropriate coefficient(s) that represent catchment characteristics can limit the accuracy of the Rational Method [38]. Examples of published runoff coefficients [37] include 0.25–0.95 for urban and suburban developed areas and 0.05–0.35 for grassed areas, depending on slope gradient and soil. This approach allows for the volume of water that needs to be attenuated in a temporary drainage feature (i.e., a settlement pond), to be estimated.
This approach can be applied to individual catchments, such as those reflecting phased construction, to calculate the runoff volumes requiring attenuation. In addition, applying this approach on a linear construction site allows selection of different rainfall and permeability coefficients dependent upon the geographic reach of the project and location of each catchment.

2.1.4. Temporary Drainage Sizing

To be effective, temporary drainage must have adequate capacity to accommodate the runoff volume generated in the contributing area served by the drainage feature. In addition, there must be sufficient capacity to account for the loss of storage volume from eroded soil transported to the drainage feature in runoff. To achieve this, the runoff volume calculated per drainage catchment using the Rational Method and soil loss using USLE have been incorporated into Equation (2).
Vt   =   Qp   +   K
where: Vt = treatment volume (m3); Qp = runoff volume (m3); K = soil loss (m3/3 months).
The RUSLE calculates soil loss per annum. However, in reality, construction sites are dynamic, and it is not uncommon for frequent changes to construction layouts to meet the demands on site. Based on this, it is unlikely that a temporary drainage feature would remain in operation for a year. Therefore, soil loss (K, Equation (2)) has been amended to provide a soil loss estimate for a three-month period and converted to provide a soil loss volume in m3.

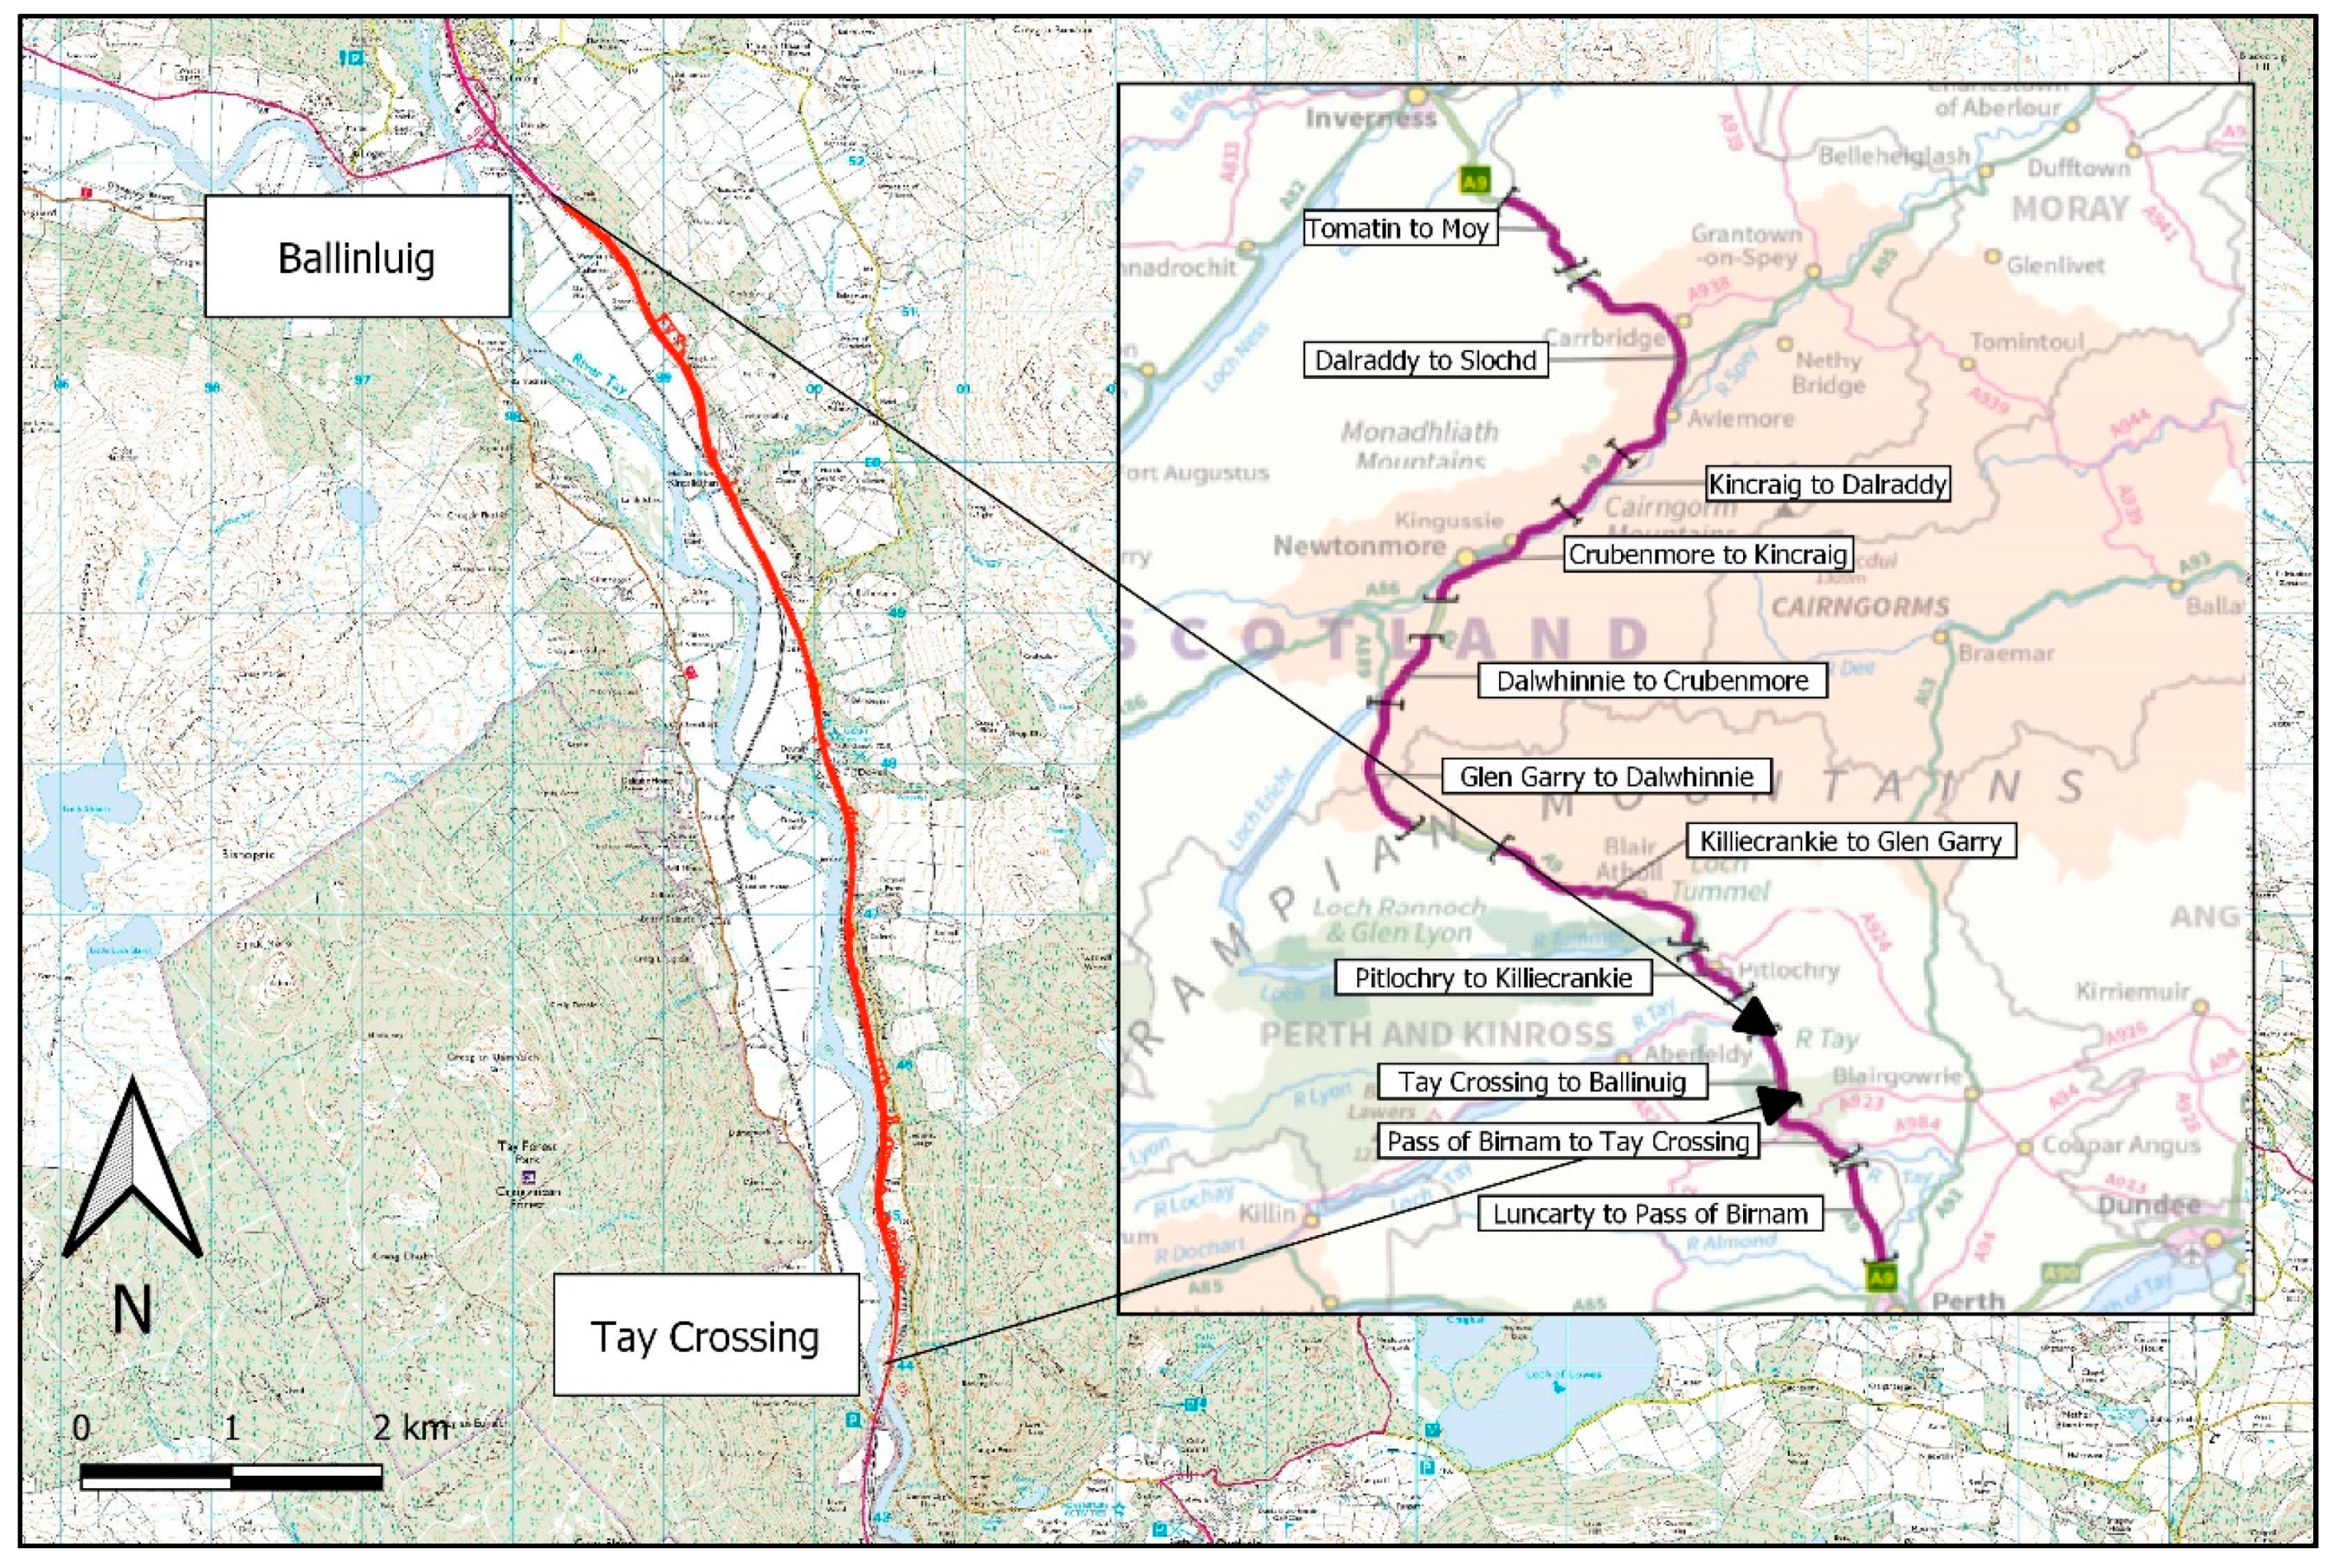
2.2. Methodological Framework Application to Study Site

2.2.1. Site Information

The methodological framework has been applied to a proposed 8.2 km section of the A9 Dualling scheme between Tay Crossing and Ballinluig, Perthshire, Scotland (Figure 1). The scheme is located primarily within the extent of the River Tay floodplain. The River Tay Catchment includes the River Tay and several tributaries, which are included in the River Tay Special Area of Conservation (SAC). The SAC designation is based on the presence of species including Atlantic salmon, Lamprey (brook, river and sea) and otter [39].
Available site information [32] indicates that the site is underlain with humus iron podzols derived from glaciofluvial sand and gravel. Superficial deposits primarily consist of alluvium (clay, silt, sand and gravel) and glaciofluvial deposits of gravel, sand, silt and clay, with isolated areas of river terrace deposits along the existing A9.
The proposed construction project will include the widening of the existing single carriageway over 7.7 km with a 0.5 km single carriageway section at the southern extent, which will tie in with the existing single carriageway to form a dual carriageway. The design includes earthworks comprising ten sections of cutting and four sections of embankment. Anticipated slope gradients range from 1V:2H to 1V:3H with the exception of a soil-nailed steepened slope, at an angle of 70 degrees [32].

2.2.2. Construction Phasing and Catchment Delineation

For this case-study, the construction project has been split into three phases [32]. Using available LiDAR data obtained during earlier scheme preparations, a Digital Terrain Model (DTM) was produced using GIS. Individual drainage catchments were identified based on the topography and categorised based on the anticipated phasing of the construction works. Catchments have been represented by a polygon feature shapefile and the corresponding catchment area has been extracted to calculate runoff and soil loss volumes for each catchment. This approach allows for a bespoke approach to sizing construction drainage features that will be required to attenuate and treat runoff generated within each catchment.

2.2.3. Soil Loss Estimation

The input parameters for the R, K and LS factors have been derived from literature sources and GIS software (Table 1). A uniform R factor value has been applied based on [1], which was derived from an isoderant map [20]. In this instance, the R factor is a multi-annual average index which has been calculated using 22-year rainfall records where any rainfall events < 12.7 mm are omitted unless > 6.35 mm of rain was recorded in 15 min. It is worth noting that the R factor does not include the erosive-force-associated runoff generated during thawing, snow melt, or irrigation [20]. A uniform K factor has been applied to each catchment based on engineering judgement (Table 1). The K factor selected was based on factors published in [40], which represented a material with a silt loam texture with 2% organic matter content. As the site is located primarily within the River Tay floodplain, the decision was made to uniformly apply the K factor to provide a conservative assumption of erodibility, based on the presence of alluvium.
LS factors have been calculated using each individual temporary drainage catchment (Section 2.2.2). A slope grid was created from the 5 m DTM, then the approach set out by [31] was used to calculate mean LS factors for each catchment.

2.2.4. Runoff Volume Estimation

Runoff volume estimation has been calculated using several contributing factors, including catchment size, rainfall and the runoff coefficient. The input parameters used in this study are provided in Table 1. The rainfall depth used is for a 10-year, 6-h event from Guay (NGR 299800, 749100), which is approximately at the mid-point of the scheme. The rainfall depth was obtained from the Flood Estimation Handbook web service using FEH13 peaks over threshold values [41].
The permeability factors provided in [1] range between 1 (impermeable surface with complete conversion of rainfall to runoff) and 0.4–0.75, which would be typical of a stripped construction site and dependent upon the infiltration capacity of the underlying soil. Owing to the sites location in the River Tay floodplain, a permeability factor of 0.6 was applied across all catchments, based on engineering judgement. This assumes that each catchment area would be entirely stripped, leaving the ground surface exposed so other catchment land use and runoff coefficient(s) [37] would not be required.

2.2.5. Treatment Volume Estimation

To provide the necessary capacity to accommodate the 1 in 10-year design rainfall event, the settlement ponds must have sufficient capacity to accommodate the runoff volume and sediment accumulations. On this basis, the capacity is determined using Equation (2), which is applied to each delineated drainage catchment with pond depths assumed to be 1 m. This provides a conservative approach by incorporating the soil loss estimation for a 3-month period. However, to maintain this capacity, it will be necessary to routinely maintain the settlement ponds, with sediment accumulations removed, as a minimum, every 3 months. Failure to do so would increase the risk that the settlement ponds would not have sufficient capacity to attenuate runoff volumes for rainfall events below the 1 in 10-year design standard. At this stage, pond depths have been assumed to be a maximum of 1 m to avoid overly deep ponds that would not facilitate settlement.

2.2.6. Land Requirements
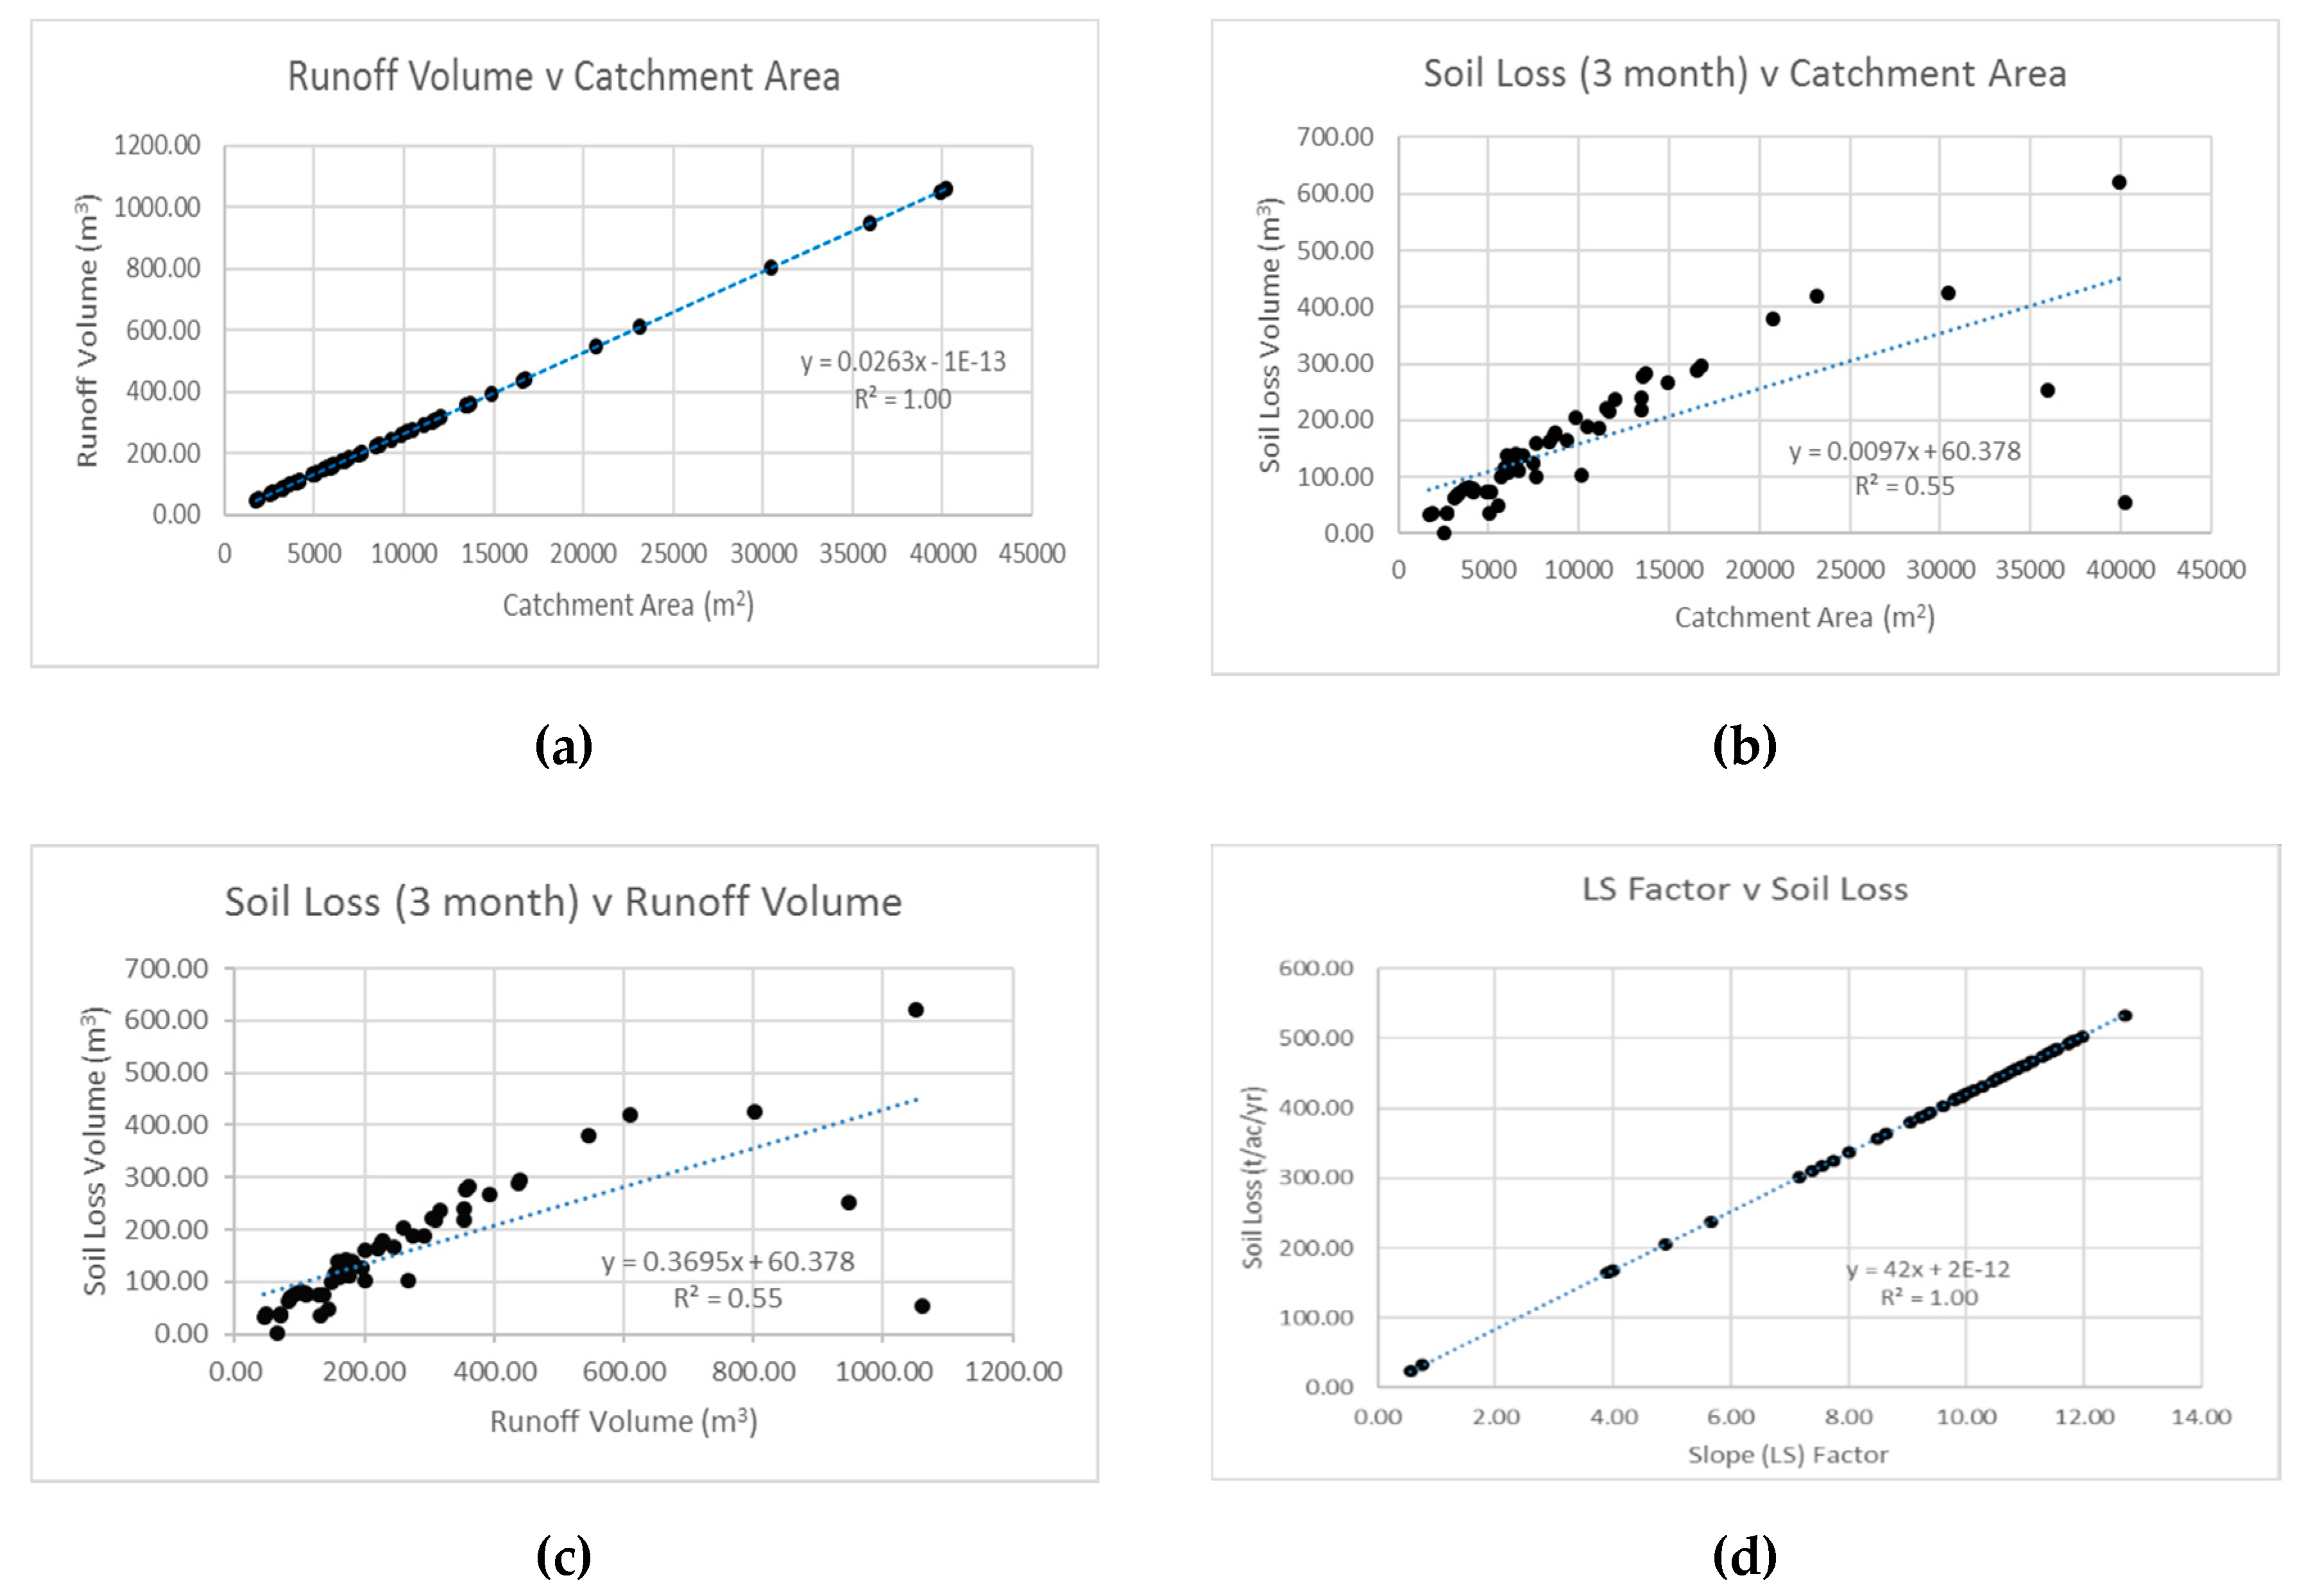
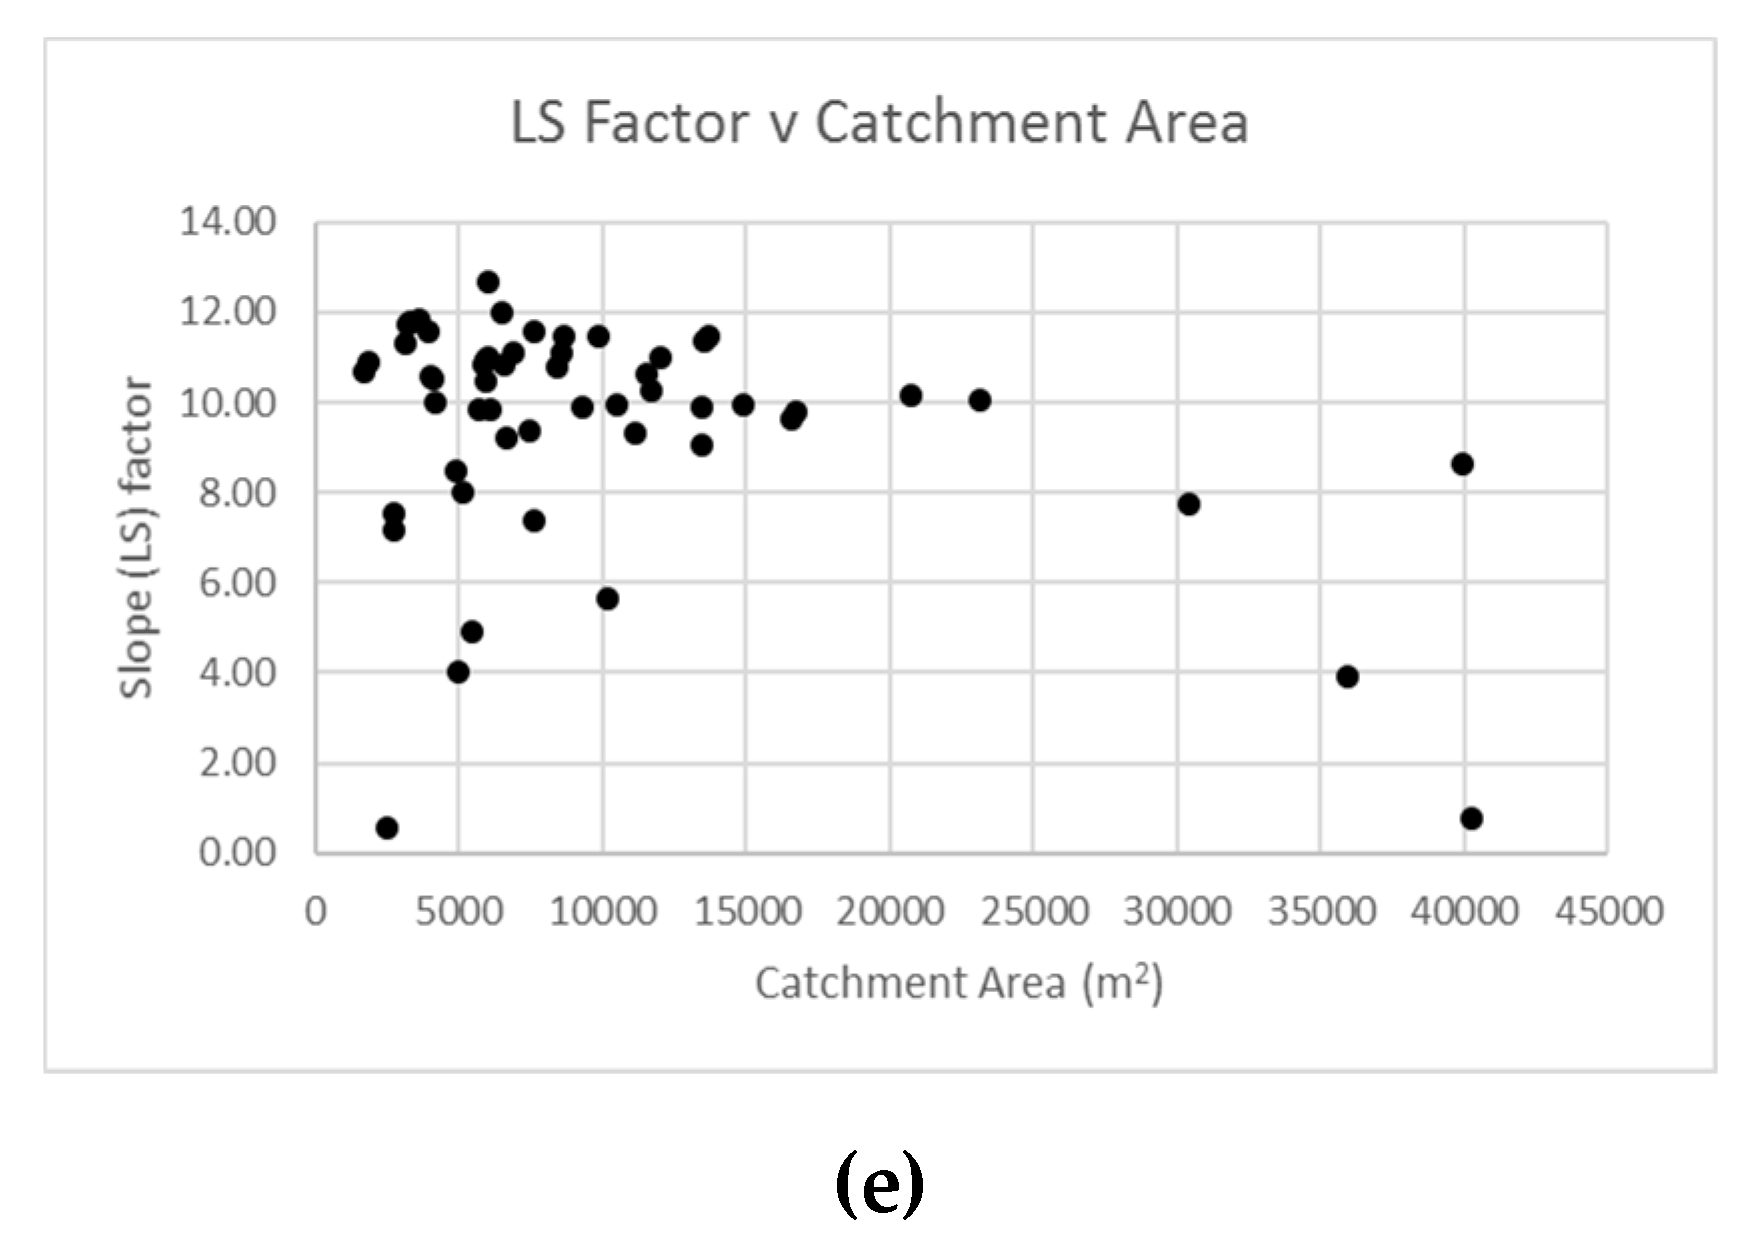
The required land within each drainage catchment to accommodate construction drainage has been estimated using treatment volume (Equations (2) and (3)).
LR   =   Vt   ÷ catchment   area × 100
where: LR = land requirements (% of total catchment area, assuming 1 m pond depth); Vt = treatment volume (m3) and catchment area (m2).

3. Results

3.1. Methodological Framework Development

A methodological framework (Figure 2) has been developed to meet the requirements of the environmental regulator. The framework has been used to estimate the required capacity of construction drainage features, to inform the allocation of space required during construction. Owing to the processes underpinning the development of the LS factor, the methodological process used is illustrated separately (Figure 3).

3.2. Application to Study Site

The methodological framework has been applied to a proposed highway construction project. A summary of the results generated following the application of the methodological framework is provided in Table 2. This includes catchment size, runoff volume, soil loss volume per 3-month period, and the corresponding treatment volume for each anticipated construction phase. Also included is the percentage of treatment volume to accommodate the estimated soil loss and the percentage of catchment area required to accommodate the total treatment volume, assuming 1 m pond depths.
Basic statistical analysis has been undertaken to determine the relationship between inputs of the methodological framework and to identify potential areas of weakness in the methodological process (Figure 4). This indicates that runoff volume is positively correlated with catchment area (r2 = 1) (Figure 4a) which is to be expected considering a universal runoff coefficient has been applied across all catchments. This linear relationship does not exist when comparing soil loss and catchment area and runoff volume (Figure 4b,c). When catchment area exceeds 25,000 m2, the corresponding soil loss volumes are lower than expected for three catchments. As the RULSE input parameters were universal, with the exception of the LS factor, this suggests that the discrepancy may be attributed to the catchment specific LS factor or another contributing factor. Examination of the LS factor indicates a positive correlation (Figure 4d) (r2 = 1) with annual soil loss increasing with higher LS factors, which has been reported in other studies [24]. However, this does not account for the unexpected results shown in Figure 4b,c. A possible explanation for this could be the relatively lower LS factors for the catchments with areas exceeding 25,000 m2, which could account for the below expected soil loss volumes in the larger catchments. For example, the LS factors for the catchments exceeding 25,000 m2, which do not follow the linear relationship, are 7.74, 3.9 and 0.76 are below the mean LS value for all catchments, which is 9.5. When comparing the LS factor and catchment area (Figure 4e), it has been demonstrated that the LS factors within comparable catchment areas vary with the higher LS factors generally attributed to smaller catchments.

3.3. Sensitivity Analysis

As mentioned previously, the modelling approach used has included assumed input parameters. A sensitivity anaysis has been undertaken to assess what impacts different K factor and permeability input parameters (Table 3) have on the calculated runoff and soil loss volumes compared to the original input values (Table 1), which for the purposes of this excercise are considered the baseline. The input factors used for the sensitivity analysis represent the ranges provided in [1].
The amended input parameters have been applied to all catchments (n = 57) to assess how runoff and soil loss volumes respond (Table 4). The summary results highlight the sensitivity of estimated soil loss in response to variations in the K factor with percentage changes in mean soil loss ranging between −53% and +43%. Simarly, permeability factor (scenarios 4 and 5) can result in marked differences in estimated runoff volumes. Given the differences in soil loss and runoff volumes presented, the results underline the importance of accurately representing site-specific conditions when adopting this approach for estimating the capacity of construction drainage. An additional sensitivity analysis has been included to test the potential impact the addition of the C factor could have (scenario 6). The C factor (0.05) has been used to provide an indication of the potential maximum soil loss reduction based on published C factor ranges [5], which show that a 95% reduction is soil loss could be achieved.
Likewise, the results presented in Table 5 show that treatment volume, percentage of treatment volume required to accommodate soil loss and percentage of catchment areas required to accommodate treatment volume are responsive to input parameter changes. Scenarios 2 and 4 included reduced K factor and permeability coefficients, respectively.
For treatment volume (Table 5), the results show that the treatment volume was more responsive to a reduction in the permeability coefficient based on the percentage decreases compared to scenario 1. Increased input parameters (scenarios 3 and 5) show similar increases in treatment volume (m3) with the exception of the minimum values, where more variability exists. The response of treatment volume to accommodate soil loss reflects the input parameter changes. The increase in treatment volume for soil loss (scenario 3) can be attributed to reduced runoff in reponse to a lower permeability factor. Considering the variability compared to scenario 1, the percentage of catchment area required to provide treatment in the form of settlement ponds, further emphasizes how important it is to represent site-specific conditions to avoid inaccuracies in capacity estimations. However, it should be noted that values presented exceed the required 1.5% of catchment area to accommodate settlement ponds as suggested [5]. This is based on the assumed depth of 1 m used in the case-study application. It is evident from the results presented in Table 5 that applying preventative stabilization measures (scenario 6) can result in relatively large reductions in treatment volume and the area within drainage catchments to accommodate treatment.

4. Discussion

The aim of this study was achieved through the development of a methodological framework to estimate the capacity of construction drainage to provide the volume to accommodate runoff and soil loss on an upcoming highway construction project.
The potential to apply RUSLE in the context of roads has previously been questioned [42]. Two reported areas of potential weakness in their application of the RUSLE on forest road plots include RUSLE developed for natural soils, and the scale of application in the study was smaller than RUSLE was originally intended for. When considering highway construction projects, topsoil is stripped and stored for re-application ahead of re-vegetation. Subsoils are then handled and relocated to form embanked fill areas. These fill areas can include fill materials from different source locations, all of which can have different characteristics and would be expected to have low organic matter content when compared with natural soils in an agricultural setting. Based on this, the robustness of RUSLE in a highway construction environment may be limited without refining how it is applied. However, through the scheme development process prior to construction, there can be several site visits for Ground Investigation surveys, which provides an opportunity to ground truth data to improve the robustness of the approach by providing more accurate input parameters.
Depending upon the design of the road, relatively discrete elevation changes due to cutting and embankment formations would lead to temporary drainage catchments with complex topographical features, which would need to be represented in the LS factor to estimate soil loss. The methodological framework includes the mean LS factor derived from an algorithm [31], using GIS software that uses pre-construction elevation data, which represents the land surface profile prior to construction activities commencing. Although this approach provides an indication of potential soil loss following site clearance, it does not reflect the topographical changes that would develop as construction progresses and slopes are formed. To resolve this issue, the model would need to consider each pre-constructed slope feature separately, which would be further removed from the original field application that RUSLE was intended for [42]. Alternatively, it may be possible to create a DTM using proposed design elevations that are developed during the highway design process rather than existing ground levels. This could potentially improve the accuracy of the model as previous studies [22] found that slope gradient was a significant factor affecting sediment yield from a cut slope.
A source of uncertainty also exists in deriving the input parameters used in the methodological framework. A broad range of K factors from 0.2 (gravelly sand) to 0.6 for silty clay are provided in [1]. The selected K factor (0.42), is based on a silty loam soil with 2% organic matter content [40]. K factors for silty loam soils range from 0.43–0.64, with 0.64 being attributed to a range of soils with a silty loam texture of lacustrine or stream terrace deposit origins. This could be a better representation of soils on site based on the superficial deposits underlying the site, which consist of alluvium and glaciofluvial deposits. When applying the K factor in a construction setting, it is important to consider those activities on site which could affect the selection of the most appropriate K factor(s). For example, the K factors [1] provide representative K factors for topsoil, which, when applied to a highway construction setting, will not necessarily correspond to the exposed surface after topsoil stripping. It was reported that exposed subsoils can be considerably different from the topsoil, which could lead to under-representation of erodibility if topsoil-derived K factor(s) are applied [20]. The K factor includes multiple parameters, including Particle Size Distribution (PSD). Ground investigation data collected during various stages leading up to highway construction, could prove beneficial for future applications of the methodological framework by providing representative PSD data from underlying soil profile layers. This could improve the robustness of the methodology by adding site-specific parameters. Furthermore, the authors suggest that this approach can be applied to cuttings to assess how soil erosion can vary depending upon cut depth. K factors relating to cuttings could also in theory be used to estimate erosion from embankments that are formed from material excavated from cut areas. However, due to re-working and subsequent compaction to meet engineered slope design specifications, it is doubtful that the fill material will retain its original in situ characteristics.
An additional potential benefit of utilizing ground investigation data is its application to refine the sizing of the temporary settlement ponds. Currently, the approach does not consider the retention time that would be required to facilitate settlement of suspended materials. Since the retention time required to achieve settlement is dependent on particle size and settlement velocity [1], PSD data obtained during ground investigations could be used to provide a site-specific approach for settlement pond design. Applying this approach could further improve the robustness of the methodological framework, as currently settlement rate is not considered.
An additional assumption includes the universal application of the annual average R factor (Table 1). Published annual R factor values [26] for the site location exceed 200, which is considerably higher than the selected input factor, which could result in soil loss underestimation. In addition, the universal application does not account for the seasonal variations reported which include R values below 40 for spring and up to 160 for autumn months [26]. Based on this, due to the dynamic nature of construction activities, applying an annual R factor does not necessarily reflect the time period where construction activities would be underway and applying seasonal values may prove more accurate. To reduce any bias from manipulating the annual estimated soil loss. It has been highlighted that the reliance on sediment controls including settlement ponds or treatment solutions can be reduced through the implementation of preventative erosion control [5]. These can include woodchips, coir matting and seeding, which have all be shown to have potentially significant benefits in reducing soil loss which is evident from the sensitivity analysis (Table 4; Table 5). Given the proportion of treatment volume required to accommodate soil loss and the percentage of catchment areas required to provide treatment (Table 5), there is scope to reduce losses, through the application of erosion control measures. As previously mentioned, C and P factors were not included at this stage, however, incorporating these factors provides a valuable opportunity to add further accuracy in the RUSLE application through the representation on on-site practices. As shown in [4], the management practice used can either reduce, or increase soil loss. A P factor of 1.2 (20% soil loss increase) should be applied to compact slope areas that have been smoothed across the slope by machinery would be a better representation of on-site conditions in these areas, which could include filled embankments. Similar to the RUSLE application [4,21], incorporating C factors would allow designers to identify what cover practices should be adopted to reduce soil loss. For example, the application of woodchips (C = 0.08) [4] can reduce soil loss by approximately 90%. Biodegradable textiles (coir matting), can result in 80–90% reduction in soil loss on slopes > 15% [7], which reflect representative highway construction engineered slopes with gradients 1:2.5 and 1:3 (40% and 33%, respectively). The effectiveness of re-vegetation, either temporary seeding or permanent, is dependent upon the stage of development. For example, soil loss after seedbed preparation may be negligible; however, as the vegetation crop matures and the crop canopy increases, soil loss may be reduced by approximately 95% [4]. Therefore, adopting this approach would prove to be most beneficial if seeding (temporary or permanent) was undertaken soon after final construction had ceased in an area, or if exposed areas would be left dormant for a period of time before construction continues [7]. Little or no soil loss reduction can be expected after initial seed bed preparation, with soil loss reductions nearing 95% as the cover crop matures [4].
An important consideration when estimating the size of construction drainage features is the calculation of runoff volume. Temporary drainage features will need to accommodate the volume of water and it is therefore necessary to design to a specific rainfall event. The application of a single rainfall depth (Table 1) to the study site was deemed appropriate as any variations in depths are likely to be relatively minimal, given the relatively small geographic extent of the highway construction project. As catchment area and runoff volume were positively correlated (Figure 4a), variations in rainfall depth would have a direct impact on the treatment volume required within each drainage catchment, which would impact the land area required to provide the treatment presented in Table 2, which may be over- or underestimated.
The Rational Method [35,36] has known weaknesses in determining the runoff or permeability coefficient, which changes depending upon storm duration and the conservative estimation of runoff. It could be argued that for the purposes of this study, a conservative estimation provides a level of security by preventing the underestimation of runoff volume, which is used to size construction drainage. However, it is recommended that alternative methods are considered when applied to rural areas [38].

5. Conclusions

The methodological framework provides temporary drainage designers with a useful tool to estimate the size of construction drainage to ensure that sufficient land is available to accommodate construction drainage features. However, this study has highlighted where improvements could be made to increase the robustness of the modelling approach used. The framework incorporates the RULSE, which was originally developed for application on natural soils in an agricultural setting and uses assumed input parameters to represent site-specific conditions. The use of assumed input parameters adds an element of uncertainty to the model outputs, which could be improved by incorporating site-specific data that would provide a more accurate representation of the subsoils exposed during construction. Furthermore, the LS factor that has been applied to each temporary drainage catchment is based on existing topography and therefore does not account for any ground profile changes during construction. During highway construction, the creation of engineered slopes (cuttings and embankments) are created, which, if left exposed, are prone to water erosion. If slope features were included in the model, this could identify areas where additional controls could be deployed to protect the receiving environment. A universal rainfall depth has been applied to the study area to estimate runoff volume. Given the relatively constrained geographic reach of the construction project, it would be unlikely that any discrete rainfall depth variations would be encountered. However, to reduce any uncertainty that this approach brings, rainfall depths could be obtained from various other locations along the study area extent. The sensitivity analysis has shown the potential benefits that can be achieved through the implementation of effective erosion control. As the industry relies heavily on the use of temporary settlement ponds, which can have limited effectiveness, effective erosion control could reduce soil loss and help protect the water environment.

Author Contributions

Conceptualization, S.M. and M.W.; methodology, M.W., D.L. and S.F.; validation, M.W., D.L. and S.F.; formal analysis, M.W.; investigation, M.W.; resources, M.W. and S.M.; data curation, M.W., D.L. and S.F.; writing—original draft preparation, M.W., S.M., A.M. and I.M.; writing—review and editing, M.W., S.M., A.M. and and I.M.; visualization, M.W. and S.F.; supervision, S.M., A.M. and I.M.; project administration, M.W. and S.M.; funding acquisition, S.M., A.M. All authors have read and agreed to the published version of the manuscript.

Funding

This research was funded by Innovate UK, grant number KTP010752.

Acknowledgments

The authors wish to thank the generous support of Jacobs UK Ltd., without whom, this research would not have been possible.

Conflicts of Interest

The authors declare no conflict of interest.

References and Notes

  1. Murnane, E.; Heap, A.; Swain, A. Control of Water Pollution from Linear Construction Projects: Technical Guidance; CIRIA: London, UK, 2006. [Google Scholar]
  2. European Commission Best Environmental Management Practice for the Building and Construction Sector. 2012. 29136. Available online: https://data.europa.eu/doi/10.2760/50247 (accessed on 12 October 2019).
  3. Woods-Ballard, B. The Suds Manual; CIRIA: London, England, 2015. [Google Scholar]
  4. Lake, D.W. New York State Standards and Specifications for Erosion and Sediment Control; Empire State Chapter Soil and Water Conservation Society: Albany, NY, USA, 2016. [Google Scholar]
  5. Pitt, R.; Clark, S.E.; Lake, D. Construction Site Erosion and Sediment Controls: Planning, Design and Performance; DEStech Publications: Lancaster, PA, USA, 2007; pp. 52–54. [Google Scholar]
  6. Kalainesan, S.; Neufeld, R.D.; Quimpo, R.; Yodnane, P. Sedimentation basin performance at highway construction sites. J. Environ. Manag. 2009, 90, 838–849. [Google Scholar] [CrossRef] [PubMed]
  7. United States Environmental Protection Agency. Developing your Stormwater Pollution Prevention Plan: A Guide for Construction Sites; United States Environmental Protection Agency: Albany, NY, USA, 2007.
  8. Anonymous. The Limits of Settling. Watershed Prot. Tech. 1997, 2, 30. Available online: https://search.proquest.com/docview/196797102 (accessed on 26 June 2020).
  9. Highways Agency; The Scottish Office Development Department; The Welsh Office; The Department of the Environment for Northern Ireland. Design Manual for Roads and Bridges. Available online: https://www.standardsforhighways.co.uk/dmrb/ (accessed on 10 November 2019).
  10. (Jacobs UK Ltd.). Personal communication, 2019. (Note)
  11. Noble, B.; Hill, M.; Nielsen, J. Environmental assessment framework for identifying and mitigating the effects of linear development to wetlands. Landsc. Urban Plan. 2011, 99, 133–140. [Google Scholar] [CrossRef]
  12. Volk, M.; Möller, M.; Wurbs, D. A pragmatic approach for soil erosion risk assessment within policy hierarchies. Land Use Policy 2010, 27, 997–1009. [Google Scholar] [CrossRef]
  13. Mickovski, S.B.; Thomson, C.S. Developing a framework for the sustainability assessment of eco-engineering measures. Ecol. Eng. 2017, 109, 145–160. Available online: https://browzine.com/articles/159482471 (accessed on 5 February 2020). [CrossRef] [Green Version]
  14. Vogt, J.V.; Colombo, R.; Bertolo, F. Deriving drainage networks and catchment boundaries: A new methodology combining digital elevation data and environmental characteristics. Geomorphology 2003, 53, 281–298. [Google Scholar] [CrossRef]
  15. Kouli, M.; Soupios, P.; Vallianatos, F. Soil erosion prediction using the Revised Universal Soil Loss Equation (RUSLE) in a GIS framework, Chania, Northwestern Crete, Greece. Environ. Geol. 2009, 57, 483–497. Available online: https://search.proquest.com/docview/210843828 (accessed on 18 January 2020). [CrossRef]
  16. SEPA. Personal communication, 2019. (Note)
  17. Renard, K.G.; Foster, G.R.; Weesies, G.A.; McCool, D.K.; Yoder, D.C. Predicting Soil Erosion by Water: A Guide to Conservation Planning with the Revised Universal Soil Loss Equation (RUSLE); Agricultural Handbook No. 703, Agricultural Research Service USDA: Washington, DC, USA, 1997. [Google Scholar]
  18. Scottish Government. Scottish Planning Policy. Available online: https://www.gov.scot/publications/scottish-planning-policy/ (accessed on 17 November 2019).
  19. SEPA. Personal communication II, 2020. (Note)
  20. Wischmeier, W.H.; Smith, D.D. Predicting Rainfall Erosion Losses: A Guide to Conservation Planning; Department of Agriculture, Science and Education Administration: Washington, DC, USA, 1978.
  21. Greenville County. Stormwater Management Design Manual. Available online: https://www.greenvillecounty.org/LandDevelopment/DesignManual.aspx (accessed on 19 October 2018).
  22. Megahan, W.F.; Wilson, M.; Monsen, S.B. Sediment production from granitic cutslopes on forest roads in Idaho, USA. Earth Surf. Process. Landf. 2001, 26, 153–163. [Google Scholar] [CrossRef]
  23. Yoon, K.S.; Kim, C.W.; Woo, H. Application of RUSLE for Erosion Estimation of Construction Sites in Coastal Catchments. J. Coast. Res. 2009, SI, 1696–1700. Available online: https://www.jstor.org/stable/25738079 (accessed on 17 November 2019).
  24. Chehlafi, A.; Kchikach, A.; Derradji, A.; Mequedade, N. Highway cutting slopes with high rainfall erosion in Morocco: Evaluation of soil losses and erosion control using concrete arches. Eng. Geol. 2019, 260, 105200. [Google Scholar] [CrossRef]
  25. Panagos, P.; Borrelli, P.; Poesen, J.; Ballabio, C.; Lugato, E.; Meusburger, K.; Montanarella, L.; Alewell, C. The new assessment of soil loss by water erosion in Europe. Environ. Sci. Policy 2015, 54, 438–447. [Google Scholar] [CrossRef]
  26. Panagos, P.; Ballabio, C.; Borrelli, P.; Meusburger, K.; Klik, A.; Rousseva, S.; Tadić, M.P.; Michaelides, S.; Hrabalíková, M.; Olsen, P.; et al. Rainfall erosivity in Europe. Sci. Total Environ. 2015, 511, 801–814. [Google Scholar] [CrossRef] [PubMed] [Green Version]
  27. Benavidez, R.; Jackson, B.; Maxwell, D.; Norton, K. A review of the (Revised) Universal Soil Loss Equation ((R)USLE): With a view to increasing its global applicability and improving soil loss estimates. Hydrol. Earth Syst. Sci. 2018, 22, 6059–6086. Available online: https://search.proquest.com/docview/2137760130 (accessed on 10 June 2020). [CrossRef] [Green Version]
  28. Scottish Environment Protection Agency. Supporting Guidance (WAT-SG-75) Sector Specific Guidance: Construction Sites. Available online: https://www.sepa.org.uk/regulations/water/pollution-control/construction-site-licences/ (accessed on 20 November 2018).
  29. Jacobs UK Ltd. A9 Dualling Programme Tay Crossing to Ballinluig Constructability Report Appendix G Land Requirements for Construction SuDS; Jacobs UK Ltd: Glasgow, Scotland, 2018; (Note). [Google Scholar]
  30. Pittner, C.; Allerton, G. SUDS for roads; WSP UK Ltd.: Edinburgh, Scotland, 2009. [Google Scholar]
  31. Desmet, P.J.; Govers, G. A GIS procedure for automatically calculating the USLE LS factor on topographically complex landscape units. J. Soil Water Conserv. 1996, 51, 427–433. [Google Scholar]
  32. Transport Scotland. A9 Dualling Programme: Tay Crossing to Ballinluig DMRB Stage 3 Environmental Statement. Available online: https://www.transport.gov.scot/publication/draft-orders-and-environmental-statement-a9-tay-crossing-to-ballinluig/ (accessed on 7 September 2019).
  33. Dąbrowska, J.; Dąbek, P.B.; Lejcuś, I. A GIS based approach for the mitigation of surface runoff to a shallow lowland reservoir. Ecohydrol. Hydrobiol. 2018, 18, 420–430. [Google Scholar] [CrossRef]
  34. Graf, L.; Moreno-de-las-Heras, M.; Ruiz, M.; Calsamiglia, A.; García-Comendador, J.; Fortesa, J.; López-Tarazón, J.; Estrany, J. Accuracy Assessment of Digital Terrain Model Dataset Sources for Hydrogeomorphological Modelling in Small Mediterranean Catchments. Remote Sens. 2018, 10, 2014. Available online: https://search.proquest.com/docview/2303929457 (accessed on 19 February 2020). [CrossRef] [Green Version]
  35. Mulvany, T. On the use of self registering rain and flood gauges in making observations of the relation of rainfall and flood discharges in given catchment. Trans. Inst. Civ. Eng. Irel. 1851, 4, 18–33. [Google Scholar]
  36. Kuichling, E. The relation between the rainfall and the discharge of sewers in populous districts. Trans. Am. Soc. Civ. Eng. 1889, 20, 1–56. [Google Scholar]
  37. Brutsaert, W. Hydrology: An introduction; Cambridge University Press: Cambridge, UK, 2005; pp. 346–477. [Google Scholar]
  38. Kellagher, R. Storage Requirements for Rainfall Runoff from Greenfield Development Sites; Report SR 580; HR Wallingford: Wallingford, England, 2002. [Google Scholar]
  39. Scottish Natural Heritage. Sitelink. Available online: https://sitelink.nature.scot/site/8366 (accessed on 16 January 2020).
  40. Stewart, B.A.; Woolhiser, D.A.; Wischmeier, W.H.; Caro, J.H.; Freere, M.H. Control of Water Pollution from Cropland; Report EPA-600; Department of Agriculture, Agricultural Research Service: Washington, DC, USA, 1975; Volume I. [Google Scholar]
  41. UK Centre for Ecology and Hydrology. Flood Estimation Handbook Web Service. Available online: https://fehweb.ceh.ac.uk/ (accessed on 6 October 2018).
  42. Riedel, M.S. Collaborative Research and Watershed Management for Optimization of Forest Road Best Management Practices; International Conference on Ecology and Transportation, Centre for Transportation and the Environment; North Carolina State University: Raleigh, NC, USA, 2003; pp. 148–158. [Google Scholar]
Figure 1. Study site for methodological framework application with extract of the A9 dualling project extent.
Sustainability 12 05522 g001
Figure 2. Methodological framework for calculating the required capacity of construction drainage ponds, which includes runoff volume and soil loss estimation.
Sustainability 12 05522 g002
Figure 3. Methodological process for deriving the LS factor for estimating soil loss using RUSLE.
Sustainability 12 05522 g003
Figure 4. Relationships between elements of the methodological framework. (a) Runoff Volume v Catchment Area, (b) Soil Loss (3 Month) v Catchment Area, (c) Soil Loss (3 Month) v Runoff Volume, (d) LS factor v Soil Loss, (e) LS Factor v Catchment Area.
Sustainability 12 05522 g004aSustainability 12 05522 g004b
Table 1. Input parameters for runoff and soil loss estimation.
ParameterInput ValueUnitSource
RUSLE
R factor100-[20]
K factor0.42-[40]
LS factorCatchment specific-[31]
C & P--Not included
Catchment Runoff Volume Estimation
Rainfall depth (10-year 6 h)43.9mm[41]
Permeability factor0.6-[1]
Catchment areaCatchment specificha-
Note: Where R factor, rainfall factor; K factor, soil erodibility factor; LS factor, slope factor; C factor, cover factor, and P factor, erosion control factor.
Table 2. Summary of the outputs generated through the application of the methodological framework for each construction phase. The number of individual catchments in each phase is denoted by ‘n’.
Construction Phase
Phase 1Phase 2Phase 3
n = 10n = 22n = 22
Catchment Size
Minm2173118742724
Maxm240,23635,93216,578
Meanm212,43012,3117101
Runoff Volume
Minm345.649.471.8
Maxm31059.8946.4436.7
Meanm3327.4324.3187
Soil Loss per 3 Months
Minm32.536.335.1
Maxm3621.7424.7286.9
Meanm3140.7195.135.1
Treatment Volume
Minm368.986.1106.8
Maxm31673.21226.4723.6
Meanm3468.01195.1320.1
Treatment Volume to Accommodate Soil Loss
Min%3.721.132.9
Max%4546.544.8
Mean%31.738.241.7
Catchment Area to Accommodate Treatment Volume (1 m Pond Depth)
Min%2.73.33.9
Max%4.84.94.8
Mean%44.34.5
Table 3. Factor amendments applied for sensitivity analysis.
ScenarioRUSLE K FactorPermeability FactorC FactorRationale
1 (baseline)0.420.6 -
20.2- Representative of gravelly sand
30.6- Representative of silty-clay
4-0.4 Range for stripped construction sites
5-0.75
6--0.05Representative factor for woodchips, coir matting and mature crop cover
Table 4. Summary results of effect of input parameter amendments on soil loss volume and runoff volume. The results in () denote the percentage change compared to the baseline scenario.
ScenarioSoil Loss Volume (m3/3-Month)Runoff Volume (m3)
MinMaxMeanMinMaxMean
1 (baseline)2.5621.715945.61059.8266.9
21.2
(−52)
296.1
(−53)
75.7
(−52)
45.6
(0)
1059.8
(0)
266.9
(0)
33.6
(+44)
888.2
(+43)
227.2
(+43)
45.6
(0)
1059.8
(0)
266.9
(0)
42.5
(0)
621.7
(0)
159
(0)
30.4
(−33)
706.5
(−33)
178
(−33)
52.5
(0)
621.7
(0)
159
(0)
57
(+25)
1324.8
(+25)
333.7
(+25)
60.13
(−95)
31.1
(−95)
8
(−95)
45.6
(0)
1059.8
(0)
266.9
(0)
Table 5. Sensitvity analysis of changes to treatment volume (Vt), treatment volume percentage required to accommodate soil loss and the percentage of catchment area required to accommodate treatment volume. Values in () represent percentage change in relation to baseline scenario.
ScenarioTreatment Volume (Vt) (m3)Treatment Volume for Soil Loss (%)% Catchment Area Required for Vt.
MinMaxMeanMinMaxMeanMinMaxMean
16916734263.746.538.52.74.94.3
261
(−11.6)
1348
(−19.4)
343
(−19.5)
1.8
(−51.4)
29.2
(−37.2)
23.3
(−39.5)
2.7
(0)
3.7
(−24.5)
3.4
(−20.9)
370
(+1.4)
1940
(+16)
494
(+16)
5.2
(+40.5)
55.4
(+19.1)
46.9
(+21.8)
2.8
(+3.7)
5.9
(+20.4)
5.1
(+16.6)
447
(−32.9)
1323
(−21)
337
(−20.9)
5.4
(+45.9)
56.6
(+21.7)
48.1
(+24.9)
1.9
(−29.6)
4.0
(−18.4)
3.5
(−18.6)
585
(+23.2)
1936
(+15.7)
493
(+15.7)
3
(−18.9)
41
(−11.8)
33.5
(−13)
3.4
(−30)
5.6
(+14.3)
5.0
(+16.3)
647
(−31.9)
1083
(−35.3)
275
(−35.4)
0.2
(−94.6)
4.2
(−91)
3.1
(−91.9)
2.6
(−3.7)
2.7
(−44.9)
2.7
(−37.2)

