


Abstract
The regulation of multiple filaments during an intense femtosecond laser propagation in a transparent optical medium is still challenging. In this study, by tracing the phase variation of the laser pulse during the propagation, the effect of the beam ellipticity on the generation of multiple filaments was investigated using the efficient π-phase plate. The spatial distribution of the generated multiple filaments did not follow the predesigned pattern of the phase plate when the laser beam was elliptic owing to the asymmetric change of the laser phase by the linear diffraction and nonlinear Kerr effect.
Export citation and abstract BibTeX RIS
1. Introduction
The large distance self-guided propagation of ultra-short pulses, namely in the atmosphere, referred to as laser filamentation, was realized for the first time in 1995 using a high-power Ti:sapphire laser [1]. It has attracted considerable interest considering its various potential applications [2–6]. A major challenge in the filamentation in the atmosphere is the control of multiple filaments [7–9]. One of the main origins of the generation of multiple filaments is the inevitable phase distortion originated from the air turbulence. The proposed control techniques could be categorized into two main types, total suppression and regularization of multiple filaments. The control of the spatial distribution of the multiple filaments can be beneficial for the optimization of the white light generation [10], terahertz wave radiation [11, 12], conductivity inside a filament [13], microwave guiding [14, 15], etc.
Various methods have been analyzed to control the regular arrangement of multiple filaments, including the implementation of axicon [16, 17], slit [18, 19], pinhole [20], mesh [21], specific light modulation [22, 23], and phase plate [24, 25], etc. A π-phase plate could be used to efficiently increase the length of a single filament and produce multiple filaments according to the predesigned phase plate pattern [24]. A π-phase plate is a step-phase plate with a phase lag of π, i.e. parts of the phase plate are thinned by wet etching to produce a phase shift of π at the pumping laser wavelength [25]. Recently, the effect of the beam ellipticity on the filamentation dynamics with a π-phase plate has been reported [26]. Generally, the filament diameter is on the order of 100 μm, corresponding to a diffraction length scale 2πa2/λ, where a is the filament diameter, λ is the 800 nm central wavelength in our simulations. Therefore the diffraction length scale is calculated to be 7.85 cm in our cases. For a femtosecond laser pulse duration τ of 35 fs, the dispersion length scale τ2/k'' is about 61.25 m, where k'' refers to the second order group-velocity dispersion coefficient and is about 0.2 fs2 cm−1 for air. Therefore, the temporal effect is much smaller than the spatial effect, and the spatial effect dominates the spatial evolution of the laser filament. Since the effect of temporal terms can be neglected, we use the simplified (2D+ 1)-dimensional model instead of the (3D+ 1)-dimensional model in [26] to simulate the dominant spatial characteristics of laser filamentation dynamics. The (2D+ 1) model greatly improves the calculation speed while maintaining the required accuracy. In [26], only the case where the pulse peak power is much higher than the critical power for self-focusing is analyzed, and the influence of the diffraction effect under linear conditions is not analyzed. In this letter, by analyzing the linear propagation of the femtosecond laser beams with different ellipticities, the effect of linear diffraction on the phase change during propagation is explored. Different from [26] that only several transverse intensity distributions of the femtosecond laser at discrete propagation distances are investigated, this letter investigates the continuous evolutions of the intensity and phase profiles along the laser propagation direction, which reveals the complete filamentation dynamics induced by a π-phase plate. Detailed studies on the evolution of the laser beam profile and plasma density distribution have been carried by both experiment and numerical simulations.
In this study, the underlying mechanism of the effect of the beam ellipticity on the femtosecond laser filamentation regulated by a π-phase plate is elucidated. Using a π-phase plate, zero-intensity zones (ZIZs) are produced along the borders of two adjacent sectors of the laser beam having a phase difference of π. The appearance of the ZIZ is attributed to the destructive interference between two sectors. However, if the laser beam is elliptic, the ZIZ could be broken depending on the laser power and ellipticity. According to the spatial phase distributions retrieved from numerical simulations, the ellipticity of the laser beam profile induces a spatially asymmetric nonlinear refractive index, leading to an uneven phase variation among different sectors of the laser, initially divided by the π-phase plate. Therefore, the phase difference between two adjacent beam sectors may not remain π and the destructive interference could fade away. The ZIZ disappears along the borders of two adjacent laser sectors. New filaments could also emerge at the original ZIZ.
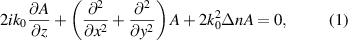
2. Experiment and results
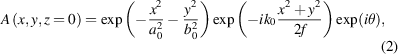
A schematic of the experimental setup is shown in figure 1(a). The femtosecond laser pulse with a width of 35 fs and repetition rate of 1 kHz is transmitted through a quarter-circle phase plate (QCPP) and focused by a lens with a focal length of 100 cm. A burn paper is used to monitor the laser beam profile at the focus. The initial profile of the incident laser beam is shown in figure 1(b). The ellipticity of the laser is estimated to be approximately 0.7; the beam diameter is larger along the vertical direction. Figure 1(c) shows the phase distribution of the QCPP used in the experiment. The white zone represents the etched area. The laser profiles at incident laser peak powers of 30 and 40GW are shown in figures 1(d) and (e), respectively. Multiple filaments are observed in figure 1(e). However, unlike in the case of a symmetric laser beam incidence, the locations of the filaments do not coincide with the four anticipated foci considering the linear propagation. Although four filaments are observed in figure 1(e), a high-intensity zone is also observed at the center of the laser beam, where a ZIZ should be presented in the case of an ideal symmetric Gaussian beam input.
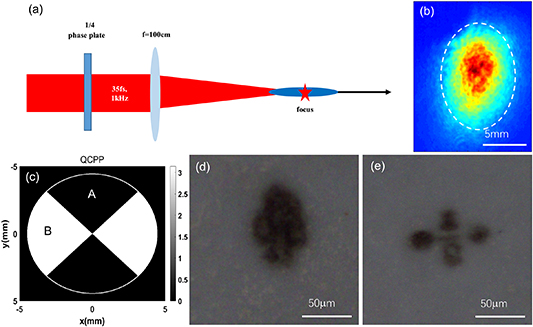
Figure 1. (a) Schematic of the experiment setup. (b) Initial incident beam shape. (c) Schematic of the QCPP. (d, e) Filament distributions at the focus at incident powers of 30 and 40GW, respectively.
Download figure:
Standard image High-resolution image3. Simulation results and discussion
The corresponding numerical simulation model is based on a (2D + 1)-dimensional nonlinear wave equation:
where A is the amplitude of the light field and  is the nonlinear refractive index attributed to the optical Kerr effect and plasma defocusing [27–29]. The validity of equation (1) for the analysis of the dominant spatial characteristics of laser filamentation dynamics has been confirmed [25]. The parameters used in the simulation are also presented [25].
The initial elliptical beam can be expressed as:
where a0 and b0 are the radii of the initial elliptical beam in the short- and the long- axis directions, respectively, f is the focal length of the lens, and θ is the phase of the phase plate. The ellipticity of the initial elliptical beam is determined by  . When
  , the initial beam has a symmetric Gaussian shape. When the beam cross section's ellipticity e is not equal to 1, the asymmetry between the π-phase plate and the femtosecond laser beam appears.
3.1. Linear simulation
The linear propagation of a laser beam passed through a QCPP (figure 1(c)) is investigated. The input laser beam radius along the y axis is fixed at b0 = 2 mm in the numerical simulations, while the radius along the x axis is varied in the range of 2 to 1.4 mm. Figure 2 shows the beam profiles at the focus at e = 1, 0.8, and 0.7. The distances between two focal points along the x axis are 140, 60, and 0 μm. The corresponding values along the y axis are 140, 200, and 230 μm. Notably, as shown in figure 2, the laser intensity at the center increases as a function of the ellipticity e.

Figure 2. Intensity distributions at the focus at different beam ellipticities for linear propagation.
Download figure:
Standard image High-resolution imageTo interpret the origin of the non-zero-intensity center in figures 2(b) and (c), the phase distribution is obtained using the simulation results. Figure 3 shows the laser phase evolutions along the axes corresponding to x = 0, y = 0.25 mm (ϕA, located in sector A in figures 1(c)) and (x) = 0.25 mm, y = 0 (ϕB, located in sector B in figure 1(c)) for e = 1 (panel a) and e = 0.7 (panel b). In figure 3(a), ϕA and ϕB well follow each other except for a phase shift of Δϕ =ϕA—ϕB =π blue line. However, in figure 3(b), Δϕ gradually increases before reaching the focus. In the vicinity of the focus, Δϕ changes its sign, which reflects the Gouy phase shift [30].
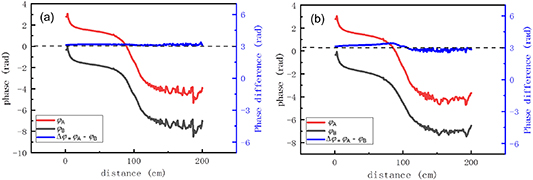
Figure 3. Phase and phase difference as functions of the linear propagation distance at the same paraxial position (0.25 mm). (a) e = 1, (b) e = 0.7.
Download figure:
Standard image High-resolution imageAccording to equation (1), when the linear propagation of a Gaussian beam is considered, its phase after the focusing by a lens can be expressed as:
where  ,
,  and
and  . According to equation (3), a larger beam radius w corresponds to a smaller phase change during the laser propagation, which implies a slower phase change along the y axis than that along x axis as the beam diameter is larger along the y direction. Therefore, the difference between figures 3(a) and (b) can be explained.
3.2. Nonlinear simulation
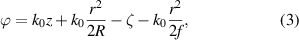
Further, nonlinear propagation is considered. Figure 4 shows representative simulated laser profiles at the focus at various ellipticities and peak powers of the input laser.
Figure 4. Distributions at the focus for nonlinear propagation at different ellipticities and powers, (intensity unit: W/cm2).
Download figure:
Standard image High-resolution imageAs shown in figure 4, when the input laser beam is elliptic and the power exceeds the critical power for self-focusing in air (∼ 5 GW) [31], the locations of the multiple filaments significantly deviate from the intensity maxima shown in figure 2(a), though the axial symmetry defined by the shape of the phase plate (figure 1(c)) is preserved. Moreover, figure 4 shows complex distribution of the multiple filaments. A smaller ellipticity and higher power lead to larger distortions of the filament locations. Figure 5 shows intensity contours (I = 2 × 10¹³ W cm−2) for P = 40 GW and, e = 1 (panel a) and e = 0.7 (panel b). Multiple refocusing is observed in both panels (a) and (b) of figure 5 [32]. Particularly, four filaments merge together to form a single filament (figure 5(b)) when the propagation distances exceeds the geometric focus.

Figure 5. Transmission of filaments in space (nonlinear propagation). (a) e = 1, (b) e = 0.7.
Download figure:
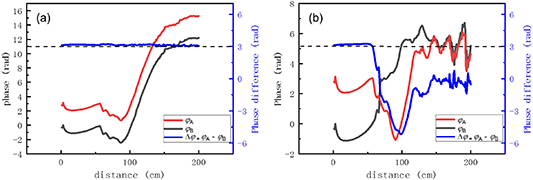
Standard image High-resolution imageSimilar to the case in figure 3, the phase distributions as functions of the propagation distance are retrieved using the results in figures 5(a) and (b) for x = 0, y = 0.25 mm (ϕA) and x = 0.25 mm, y = 0 (ϕB). The results are presented in figure 6. In figure 6(a), as the input laser beam has a cylindrical symmetry, the phase difference Δϕ remains π, imposed by the phase plate. However, a considerable difference is observed in figure 6(b). According to equation (1), if only the nonlinear refractive index is considered:
the laser phase would be proportional to the laser intensity. Considering the larger diameter along the x axis (y = 0) than that along the y axis (x = 0), the laser intensity x = 0, y = 0.25 mm not only is higher than that at x = 0.25 mm, y = 0, but also exhibits a faster increase. In addition to the effect of linear phase variation (equation (3)), the nonlinear refractive index induced by the optical Kerr effect also leads to an increase in Δϕ after the transmission through the phase plate. However, the behavior is completely different when the laser beam approaches the stating position of the filament around z = 50 cm. The displacements of points A and B from the generated filaments in the individual sectors are approximately 180 and 260 μm, respectively. Point A is completely within the energy reservoir of the filament while point B is beyond the energy reservoir. The energy at point A is strongly contracted into the filament, which reduces its intensity more than at point B. Consequently, Δϕ largely decreases around the geometric focus. The initial phase difference of π between zones A and B is completely destroyed by the nonlinear propagation depending on the laser power and beam ellipticity. In some cases, zones A and B are even in phase (Δϕ ≈ 0) and multiple filaments merge into a single filament [33].
Figure 6. Phase and phase difference as functions of the nonlinear propagation distance at the same paraxial position (0.25 mm). (a) e = 1, (b) e = 0.7.
Download figure:
Standard image High-resolution image
4. Conclusions
In conclusion, this study elucidates the effect of the beam ellipticity on the spatial distribution of multiple laser filaments when a π-phase plate is used. The phase variation associated with the diffraction was determined by the spatial gradient of the laser intensity. The nonlinear phase originated from the optical Kerr effect was proportional to the laser intensity. Hence, owing to the asymmetric intensity distribution of the incident laser beam, different partitions of the laser beam exhibited distinct phase increase rates. Consequently, the phase lag of π as well as the intensity barrier between two adjacent parts initially defined by the phase plate were destroyed, which led to a significant reduction in multi-filamentation regulation ability of the π-phase plate.
Funding
This work is financially supported by the National Key R&D Program of China (2018YFB0504400), the Tianjin Research Program of Application Foundation and Advanced Technology of China (19JCYBJC16800), and the Fundamental Research Funds for the Central Universities. W.L. acknowledges the support of the open research funds of the State Key Laboratory of High Field Laser Physics, Shanghai Institute of Optics and Fine Mechanics (SIOM).