Atmospheric Bridge Connecting the Barents Sea Ice and Snow Depth in the Mid-West Tibetan Plateau
 Yuhang Chen
 Anmin Duan
 Dongliang Li
- 1College of Atmospheric Science, Collaborative Innovation Center on Forecast and Evaluation of Meteorological Disasters, Nanjing University of Information Science and Technology, Nanjing, China
- 2State Key Laboratory of Numerical Modeling for Atmospheric Sciences and Geophysical Fluid Dynamics, Institute of Atmospheric Physics, Chinese Academy of Sciences, Beijing, China
In contrast to the rapid warming of the climate, there is growing evidence to indicate that no significant trend exists in the snow cover/depth over the western Tibetan Plateau in recent decades. Here, by analyzing multiple sources of observational and reanalysis data, we address the possible interannual connection between the mid-west Tibetan Plateau (MWTP) snow depth and Arctic sea ice. Results indicate that a robust and coherent variation exists between the winter Barents Sea ice concentration and the MWTP snow depth; that is, a positive anomaly of the former can enhance the meridional air temperature gradient to the south and hence accelerate the polar-front westerly jet. As a result, an anomalous Rossby wave propagating upward and equatorward generates, resulting in a dipole pattern of the atmospheric circulation anomaly over the polar region and the Eurasian continent. The anticyclonic circulation anomaly, corresponding to the south center of the dipole pattern, weakens the subtropical westerly jet and forms a southeast wind climbing the MWTP, which enhances the zonal advection and meridional convergence of the atmospheric moisture flux over the MWTP, and hence facilitates the MWTP snowfall. The interannual variation of the Barents Sea ice and the MWTP snow depth are therefore closely connected through the atmospheric bridge effect of the westerly jet and Rossby wave.
Introduction
The Tibetan Plateau is often referred to as the “third pole of the world” owing to its high-altitude terrain in the mid-latitudes (Yao et al., 2012). Driven by orographic effects, a freshwater resource exists on the Tibetan Plateau in the form of glaciers, snow cover, lakes, and permafrost (Lu et al., 2005; Bookhagen and Burbank, 2010; Yao et al., 2012; Zhang et al., 2017; Li et al., 2018), the surface runoff of which is sufficient to form major rivers such as the Yellow, Yangtze, Brahmaputra, Mekong, and Indus, which is sufficient to provide water for Asia’s agricultural activities and ecosystems (Bookhagen and Burbank, 2010; Immerzeel et al., 2010; Singh et al., 2014; Li et al., 2018). In particular, the snow cover serves as the foundation for the glacial mass balance (Kumar et al., 2019), and snowmelt can supply the runoff of Asian rivers (Bookhagen and Burbank, 2010; Singh et al., 2014; Li et al., 2018). The increased soil moisture from the melting of snow cover during the spring can induce localized thermal anomalies over the Tibetan Plateau and increase the precipitation in summer over the middle and lower reaches of the Yangtze River basin through snow-related hydrological effects (Chow et al., 2008; Xiao and Duan, 2016). Moreover, the snow-related albedo effect enables the Tibetan Plateau snow cover to give an indication of the onset of the Indian summer monsoon and the occurrence of the autumn Indian Ocean Dipole pattern (Senan et al., 2016; Yuan et al., 2019).
Recently, the snow cover and glaciers distributed in the western part of the Tibetan Plateau have shown different characteristics of climate change compared with the eastern part (Kapnick et al., 2014; Guo et al., 2020). Model projections under all greenhouse gas emission scenarios suggest a continuous reduction in low-elevation mountain snow cover by the end of the 21st century (Hock et al., 2019). However, at high elevation, the climate trend of winter snow cover tends to be generally less clear, and snowfall is projected to increase over the western Tibetan Plateau in particular (Kapnick et al., 2014; Song and Liu, 2017; Guo et al., 2019; Hock et al., 2019). The glaciers and snow cover of the whole Tibetan Plateau are retreating and declining (Yao et al., 2012; Zhang et al., 2017; Li et al., 2018). However, there is no significant declining trend of snow depth in the western Tibetan Plateau (Kapnick et al., 2014; Guo et al., 2019), and the Karakoram glaciers even show an increasing trend (albeit a statistically non-significant one) (Gardelle et al., 2012; Yao et al., 2012). All these results suggest unique characteristics of the snow cover/depth over the west Tibetan Plateau, which might be related to the different atmospheric influences on snowfall from those of the eastern Tibetan Plateau.
As one of the most important components of the cryosphere, the Arctic sea ice is also undergoing tremendous changes. The sea ice loss in summer mainly happens over the perennial ice-covered area, with the East Siberian Sea ice holding the largest fraction of loss (22%) in September. Meanwhile, the decline of ice in wintertime mostly occurs in the seasonally dependent sea ice area, with the Barents Sea ice contributing the largest fraction of loss (27%) in March (Onarheim et al., 2018). Recently, it was found that the decline of the Arctic sea ice contributes greatly to wintertime snowfall change in the high latitudes, as bare seas with reduced sea ice are capable of providing rich sources of water vapor. The reduction in sea ice strengthens the atmospheric circulation meridionally and promotes the transport of water vapor to Eurasia, resulting in more winter snowfall over that region (Cohen et al., 2012; Ghatak et al., 2012; Liu et al., 2012; Wegmann et al., 2015). As simulated by multi-model ensemble mean results, a significant role of the decline in autumn Arctic sea ice in the growing climate change of Eurasian winter snowfall and snow cover has been proposed during the 21st century (Song and Liu, 2017).
In addition, the feedback effect of the autumn and winter Arctic sea ice on the large-scale circulation has been verified by statistical analysis and model simulations (Honda et al., 2009; Mori et al., 2014; Sun et al., 2016; Zuo et al., 2016; Blackport and Screen, 2019). The reduction in Arctic sea ice can stimulate an upward stationary Rossby wave, amplifying the Siberian high and transferring the westerly wind equatorward (Honda et al., 2009; Kim et al., 2014; Cohen et al., 2018, 2020; Blackport and Screen, 2019, imposing an influence on the climate of East Asia (Sun et al., 2016; Zuo et al., 2016). In fact, the mid-latitude westerly winds are considered as a critical factor for TP snow because they serve as a Rossby waveguide transmission medium, along which small troughs can propagate and guide water vapor north to cause TP snowfall (Bao and You, 2019; Song et al., 2019; Zhang et al., 2019b). Although the long-term change and climate impact of the Arctic sea ice and snow cover over the Tibetan Plateau has quite rightly been a primary focus among scientists, the potential connection between them on the interannual time scale and the underlying mechanisms involved remain unclear.
In the above context, the aim of this work is to investigate the possibility that the winter Barents Sea ice regulates the mid-west Tibetan Plateau (MWTP) snow depth on the interannual timescale by considering the non-significant trend in the west Tibetan Plateau snow cover and significant trend in the Arctic sea ice. The mechanism involved will be elucidated through emphasizing the feedback effect of the Arctic sea ice on the Asian westerly jet and Rossby wave. The data and methods are introduced in Section “Materials and Methods.” The interannual relationship between the Barents Sea ice and western TP snow and the role played by the atmospheric bridge in this relationship are analyzed in Section “Results.” Finally, a summary and some further discussion are presented in Section “Discussion and Conclusion.”
Materials and Methods
The datasets utilized in this study include:
1. Snow depth, from 1979 to 2015, derived from passive microwave data with a spatial resolution of 0.25° × 0.25°, which can be downloaded from the Big Earth Data Platform for Three Poles (available at http://poles.tpdc.ac.cn/zh-hans/). The dataset has been corrected based on in situ station snow depth and the optimized Chang algorithm according to TP vegetation and snow characteristics. More details regarding the improved temporal consistency of different satellite sensors and the suitability of the algorithm for the derivation of snow depth across the whole of China can be found in Che et al. (2008). These data have been widely used to investigate snow-related climate characteristics (Xiao and Duan, 2016; Zhang et al., 2017; Bao and You, 2019). The monthly sea-ice concentration data are provided by the Hadley Center (Rayner et al., 2003).
2. ERA-Interim reanalysis data with a spatial resolution of 0.5° × 0.5° are utilized in this study (Dee et al., 2011), which include the spatial geopotential height, winds, specific humidity, and temperature. Surface sensible and latent heat fluxes and pressure are also from ERA-Interim. The monthly means of daily forecast accumulated snowfall are used to analyze the snow depth contributed by the snowfall.
All data were calculated for the average of December, January, and February (DJF) as the winter mean from 1978/1979 to 2014/2015, and the linear trend was removed. To filter the low frequency of the MWTP snow depth and Barents Sea ice, Lanczos bandpass filtering was used to extract the 3–9-year interannual signal in all data (Duchon, 1979). Pearson correlation analysis and regression analysis were used to investigate the relationship between the Arctic sea ice and MWTP snow depth. The level of statistical significance was estimated using the two-sided Student’s t-test.
To diagnose the moisture transport, we calculated the water vapor flux following Banacos and Schultz (2005). The precipitation can be estimated by the water vapor flux divergence D as follows:
where Pre is the estimated precipitation, (u, v,ω) present the three dimensions of the atmospheric wind component, and q is the specific humidity. Parameter g represents gravitational acceleration, while ps refers to the surface pressure. The 300-hPa level is used to represent the tropopause because the specific humidity above it is negligible. The horizontal and vertical components of D are Dxy and Dp. The six terms on the right-hand side of Eq. 2 stand for the contributions from the zonal advection, meridional advection, vertical advection, zonal convergence, meridional convergence, and vertical convergence, respectively. With the complexity of the MWTP topography, the D at 400 hPa was calculated and used to estimate the MWTP winter precipitation.
The atmospheric Rossby wave activity involved in the effect of sea ice on the atmosphere was diagnosed by the TN Rossby wave activity flux (Takaya and Nakamura, 2001):
where ψ is the quasi-geostrophic stream function, is the zonally inhomogeneous basic flow, P and T are the pressure and temperature of the atmosphere, (u′,v′,T′) is a perturbation from the basic flow, the subscript of the parameter indicates the partial derivatives, fis the Coriolis parameter, Ra is the gas constant of dry air, N is the buoyancy frequency, and H0 is a constant scale height.
Results
In winter, the west Tibetan Plateau snow maintains an extensive coverage in the mountain area, where snow covers throughout the whole year. The largest amount of snow mainly covers the mountain ranges including the Karakoram, Pamir, and western Himalayan mountains (Figure 1A). The variance in the snow depth displays two centers. One center presents considerable variation of snow depth in the Pamirs, while the other exists in the MWTP (black box in Figure 1B), which is a transition zone from high to low snow values (Figure 1A). As for the spatial pattern of the winter climatology of Arctic sea ice, there are large quantities of stable sea ice in the polar region (Figure 2A). At the fringes of the Arctic sea ice, the marginal sea ice exhibits a large interannual fluctuation, especially in the Barents Sea (Figure 2B). Taking the region (29°–36°N, 76°–88°E) as the snow depth study area, the areal mean snow depth was calculated and the time series shows a distinct interannual variation (Figure 2C). Taking the region (65°–80°N, 35°–65°E) of the Arctic sea ice as the Barents Sea ice, the regional-averaged Barents Sea ice was calculated. It is worth noting that the time series of areal mean snow depth over the MWTP and the Barents Sea ice present a robust and coherent interannual variation, with a correlation coefficient of 0.64 (p < 0.01) (Figure 2C). This correlation illustrates a significantly correlated cryosphere between the Arctic and Tibetan Plateau. Therefore, we selected (65°–80°N, 35°–65°E) as the key study region of the Arctic, and the domain-averaged sea-ice concentration defined the Barents Sea Ice Concentration Index (BSICI) that is used in the following parts. The cause for this prominent link on the interannual time scale will be the main point of discussion below.
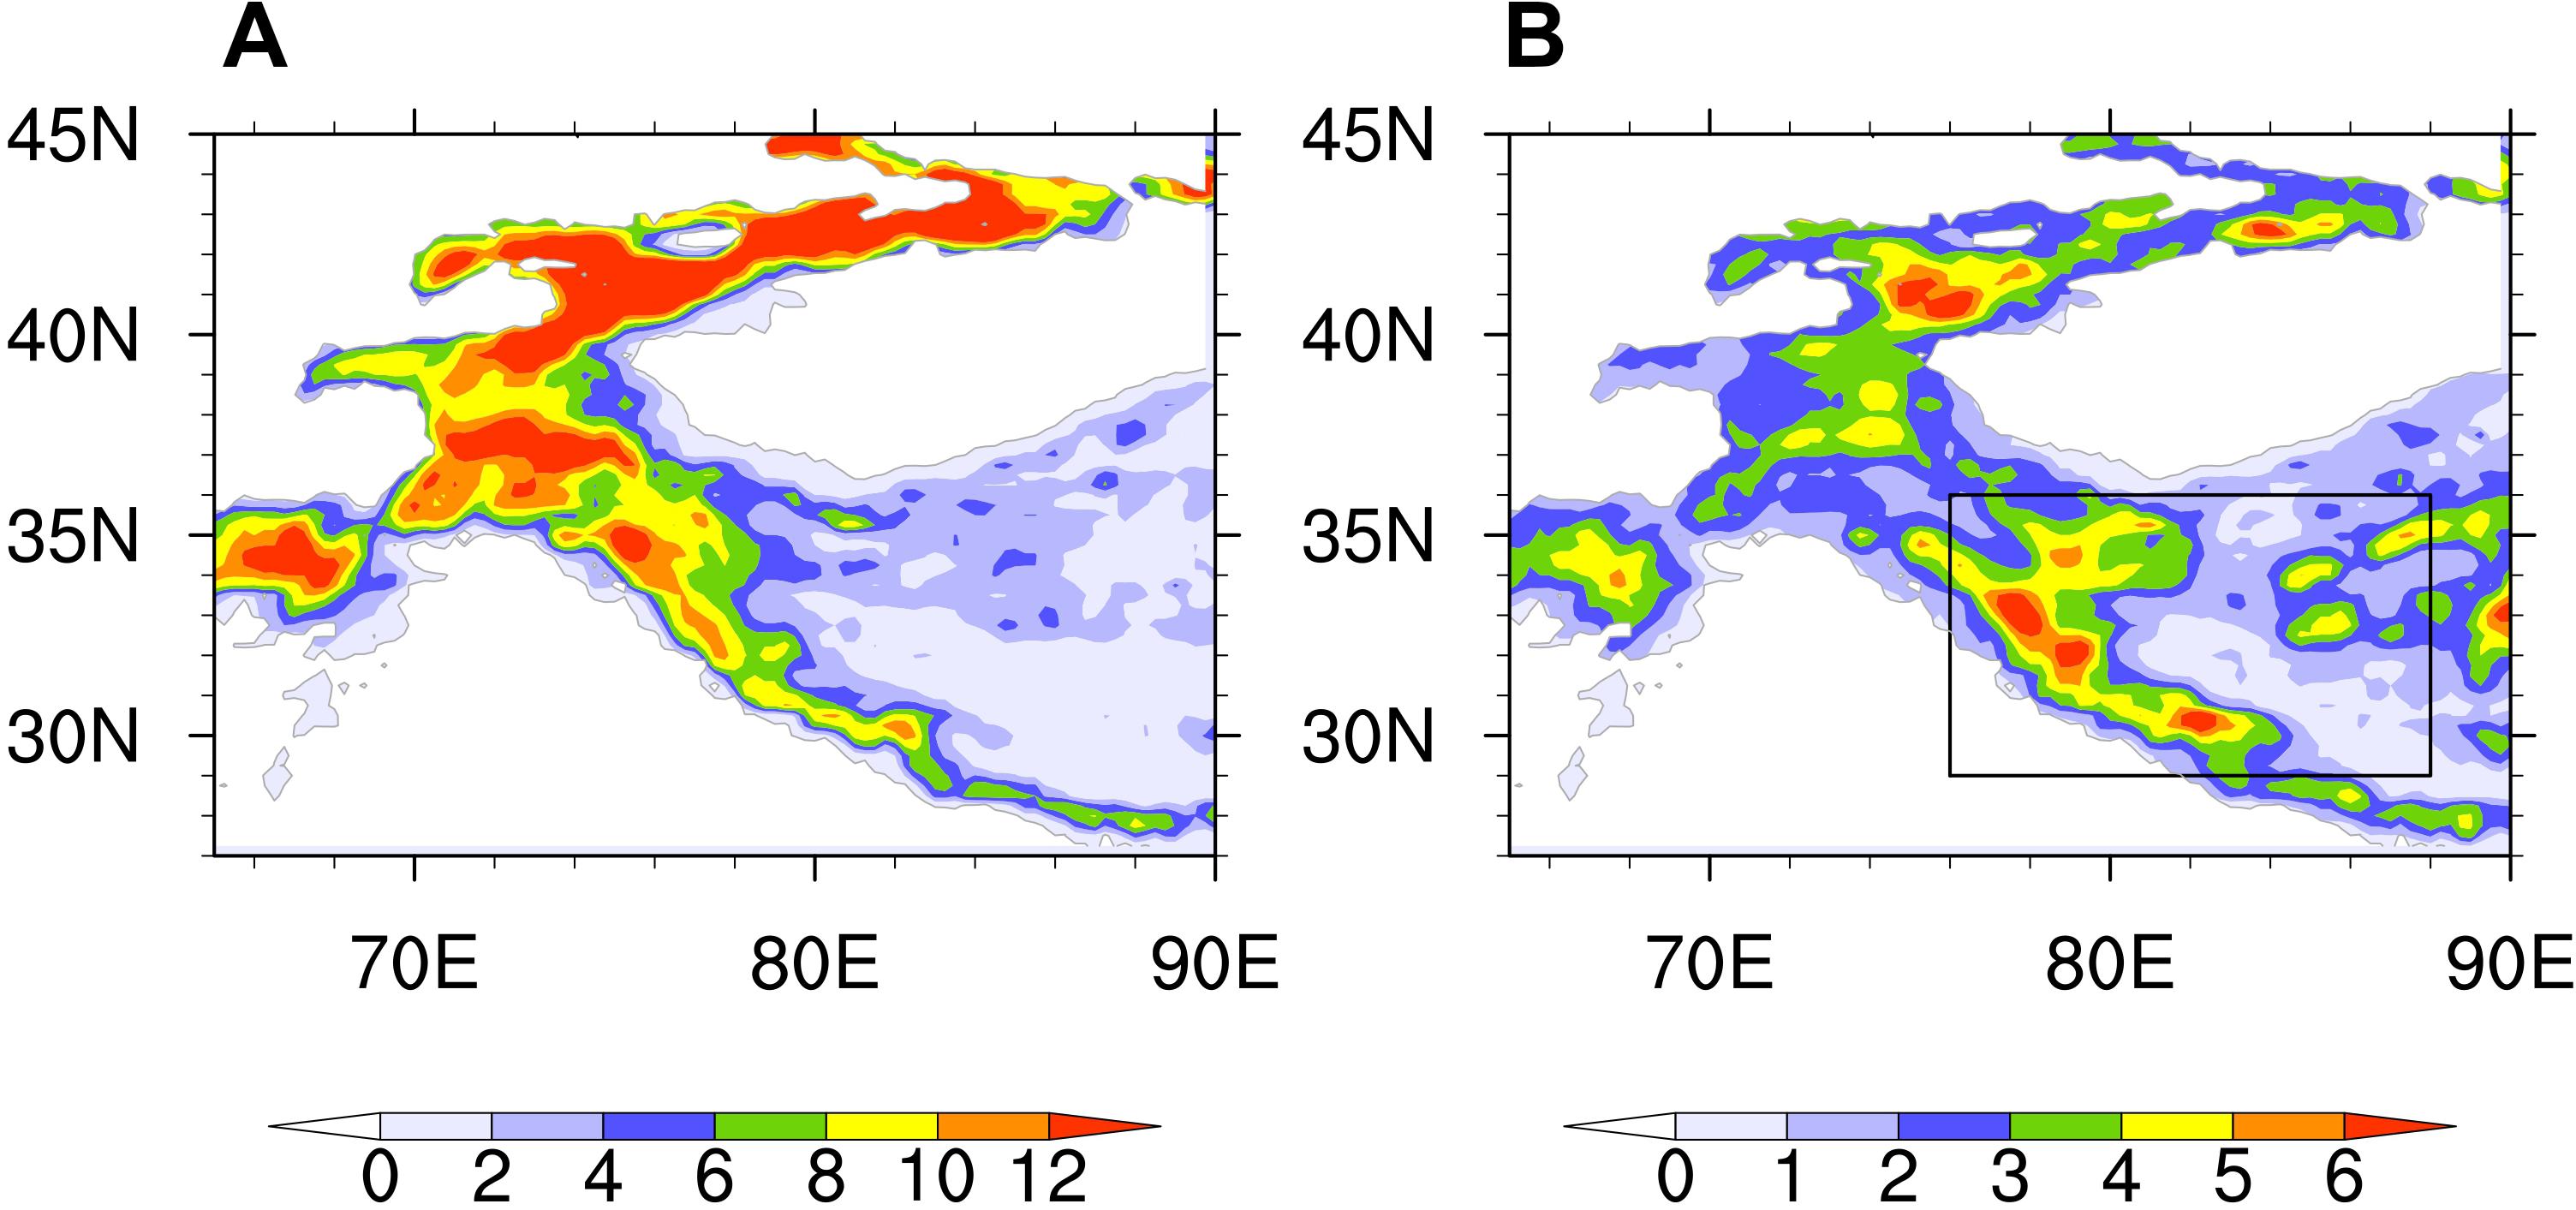
Figure 1. (A) Boreal winter (DJF) mean snow depth over the western Tibetan Plateau and (B) its standard deviation during the period 1979–2015 (units: cm). The gray line outlines the 2-km topography of the Tibetan Plateau.
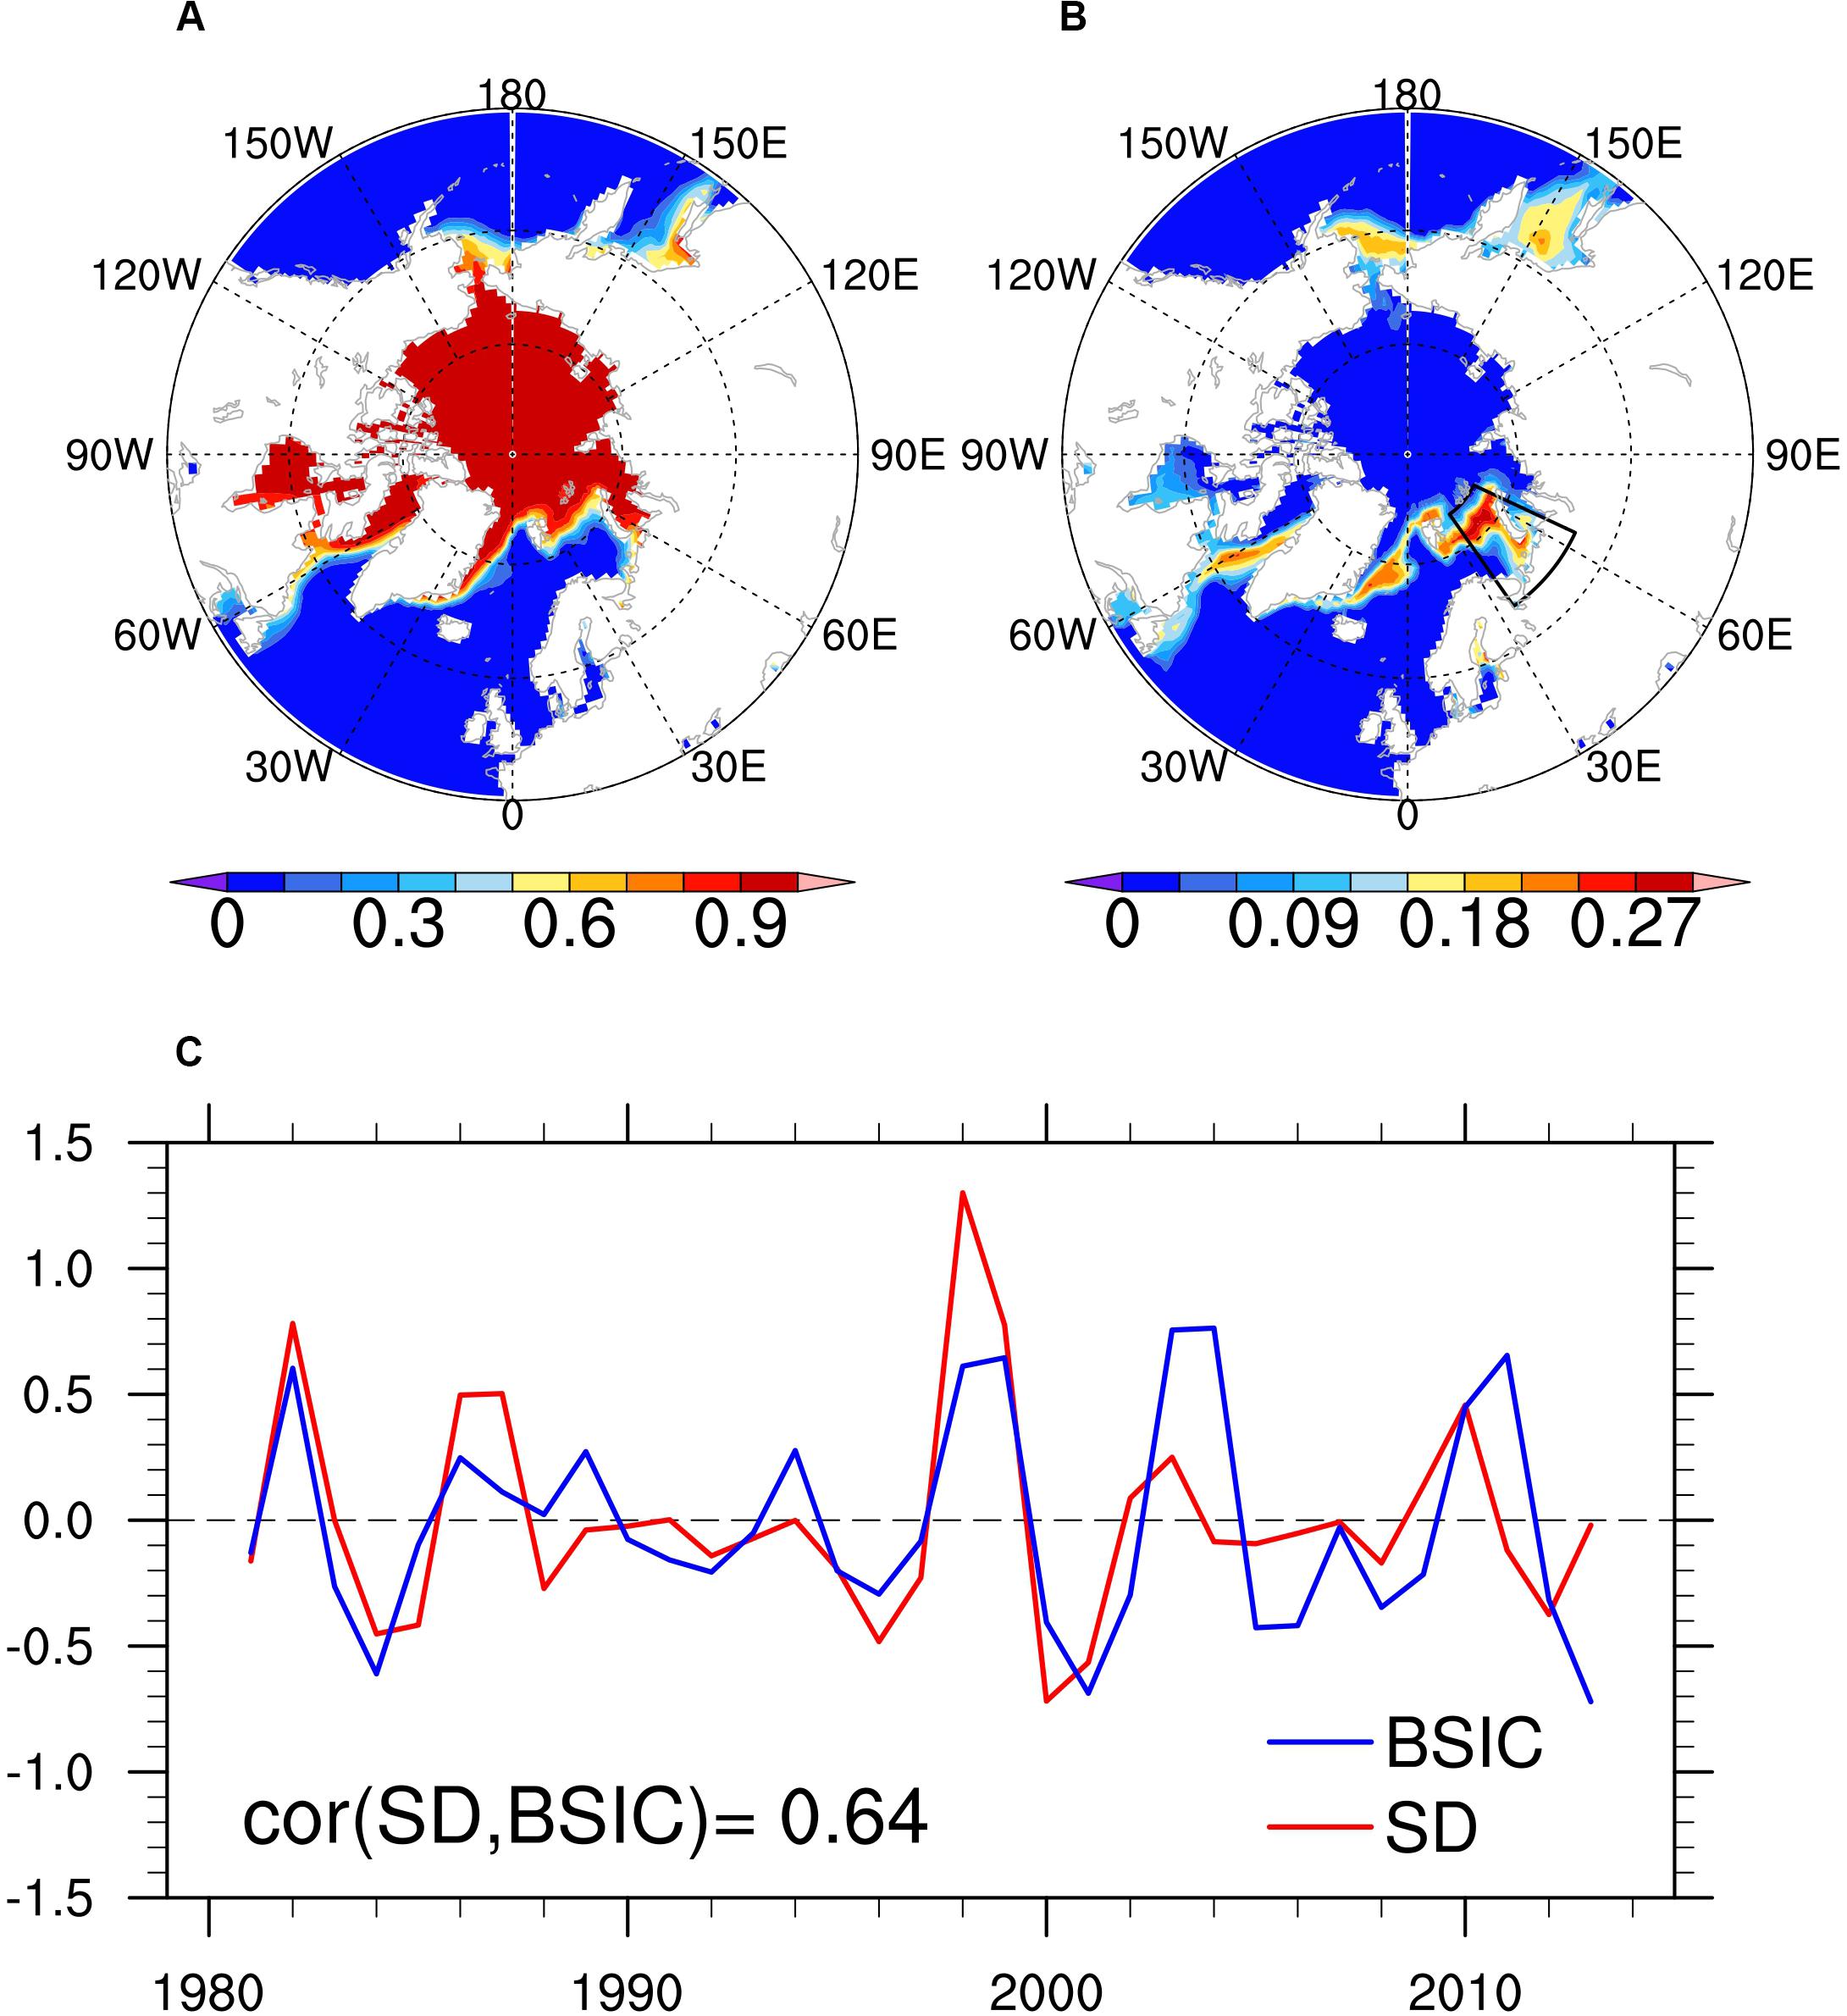
Figure 2. (A) Boreal winter mean Arctic sea ice concentration; (B) the corresponding standard deviation during the period 1979–2015; and (C) the normalized time series of the domain-averaged snow depth (SD, red) over the MWTP (29°–36°N, 76°–88°E) and the Barents Sea ice concentration (BSIC, blue) in the area of (65°–80°N, 35°–65°E) as marked by the black box in B.
As the main source of cold air in the Northern Hemisphere, Arctic sea ice can form large-scale Eurasian cold events, which are closely related to the survival of human beings both directly and indirectly through their effects on agricultural production (Cohen et al., 2014; Kim and Son, 2016; Shi et al., 2018). As demonstrated by simulation of the feedback effect of the Arctic sea ice, the decline of the Barents Sea ice can produce the upward propagation of planetary wave energy because of the anomalous meridional heat flux transition, and stimulate a Rossby wave that spreads horizontally from the Arctic to Eurasia, by which the westerly winds may attain some influence (Honda et al., 2009; Mori et al., 2014; Cohen et al., 2018, 2020; Kim and Kim, 2018; Blackport and Screen, 2019). When the BSICI is above normal, the presence of more sea ice will prevent the transmission of heat from ocean to atmosphere, and weaken the planetary wave activity (Cohen et al., 2020). This point can be verified by the negative upward surface turbulent heat flux in the Barents Sea (Figures 3A,B). When the Barents Sea ice extends, the surface sensible and latent heat flux are reduced. The weakened surface heat source reduces temperatures in the lower atmosphere, leading to a cold center over the Barents Sea (Figure 3C). A vertical profile averaged from 50°E to 120°E of the boreal winter mean air temperature and the corresponding regressed field against the BSICI is shown in Figure 3D. Clearly, the lower tropospheric atmosphere from 70°N to 80°N becomes colder because of the reduced oceanic heat. As a result, the temperature gradient from south to north over the Eurasian continent turns to be increased (shaded in Figure 4A).
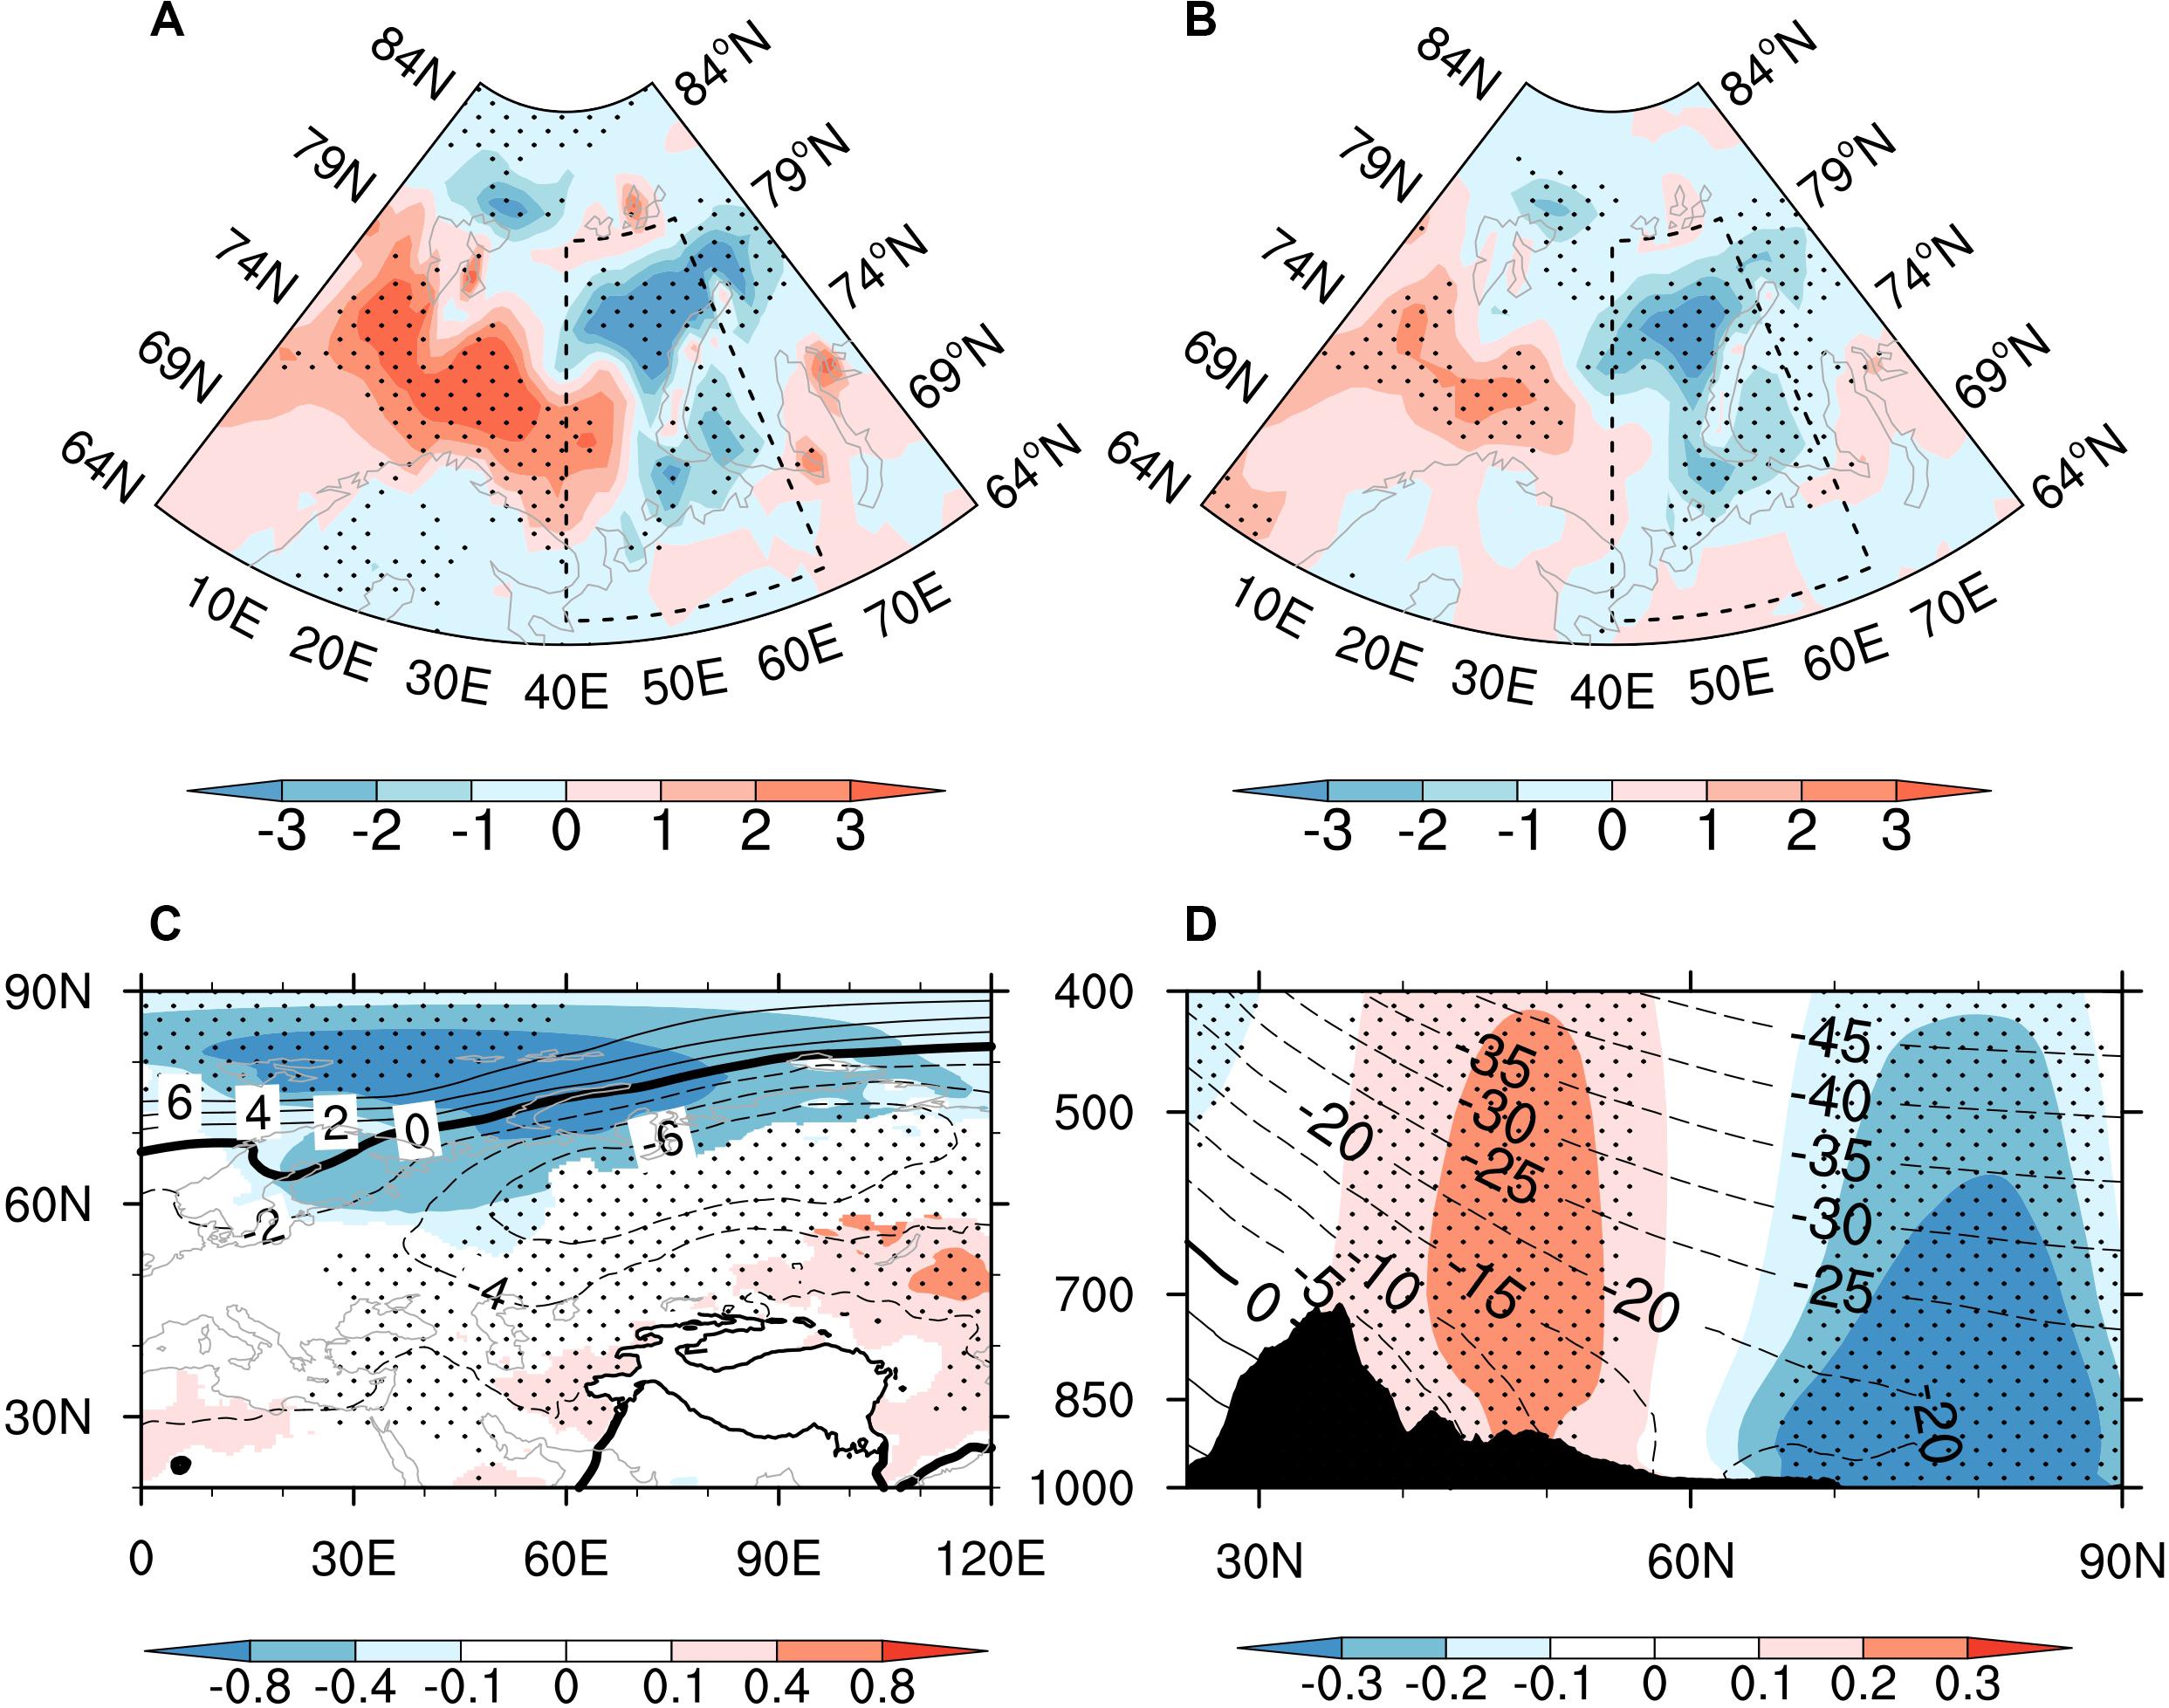
Figure 3. Regression fields of (A) the winter surface sensible heat flux (units: W/m2), (B) the winter surface latent heat flux (units: W/m2), (C) the 1000-hPa air temperature (shaded; units: °C) and surface pressure (contours; units: Pa), and (D) the 50°–120°E-averaged air temperature (shaded; units: °C; contours are the climate mean air temperature) against the BSICI. The shading and contour values of the stippled areas in A, B, D, and C exceed the p = 0.1 confidence level. The shaded values in C exceed the p = 0.1 confidence level. The dashed box in A and B denotes the Barents Sea region (65°–80°N, 35°–65°E). The black line over the region (25°–45°N, 60°–110°E) in C outlines the 2-km topography of the Tibetan Plateau.
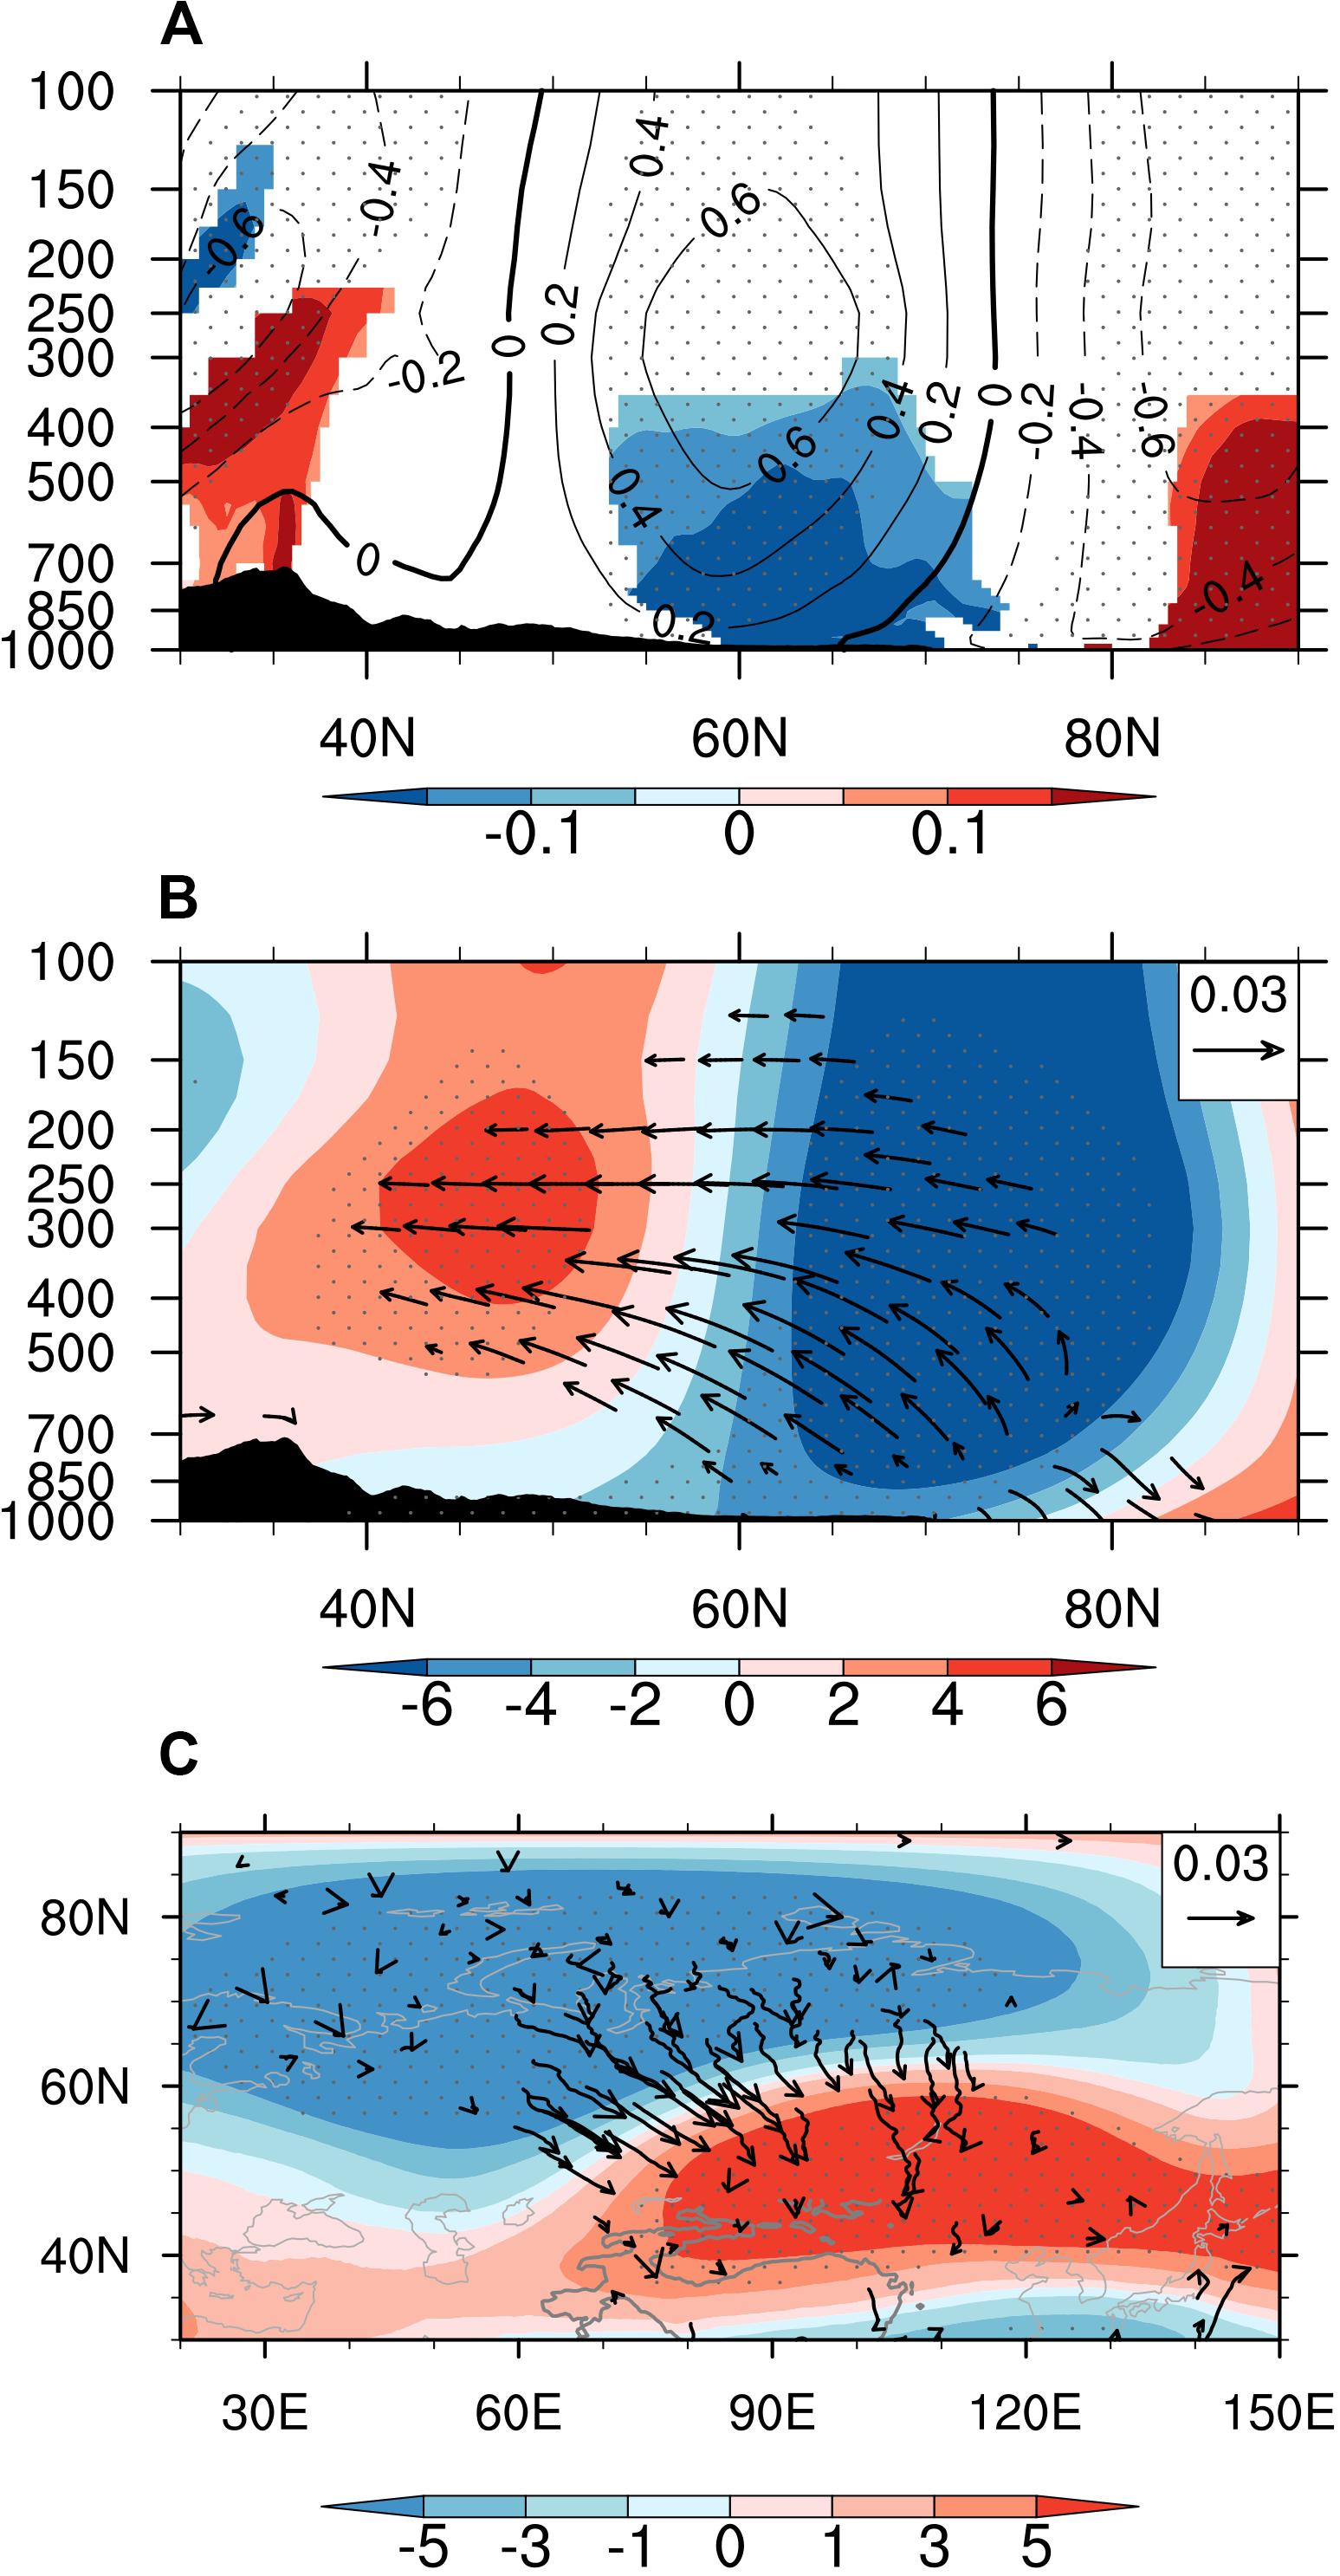
Figure 4. Regression fields of the (A) winter 50°–120°E-averaged temperature gradient (shaded; units: 10–6 K/m) and zonal wind (contours; units: m/s), (B) 50°–120°E-averaged geopotential height (shaded; units: m) and the TN Rossby wave activity flux in the vertical (vectors; units: m2/s2), and (C) 250-hPa geopotential height (shaded; units: m) and the TN Rossby wave activity flux (black vectors; units: m2/s2) in the horizontal, against the BSICI. The contour and shaded values of the stippled area in A and B, C exceed the p = 0.1 confidence level. The shaded value in A exceeds the p = 0.1 confidence level. The gray line over the (25°–45°N, 60°–110°E) in C outline the 2-km topography of the Tibetan Plateau.
As in the model simulation, the change of the Barents Sea ice is partially responsible for the shift of the eddy-driven westerly jet, forming a meridional dipole circulation pattern in the mid-troposphere (Mori et al., 2014; Sorokina et al., 2016; Blackport and Screen, 2019). According to thermal wind theory, the increased meridional temperature gradient (shaded in Figure 4A) strengthens the zonal wind as height increases (contours in Figure 4A), which enhances the intensity of the polar-front jet. Such zonal wind anomalies contribute to the baroclinicity of the lower troposphere and trigger an upward propagation of the Rossby waves from 850 to 200 hPa (Figure 4B). These Rossby waves propagate from north to south in the horizontal direction, forming a dipole circulation distributed over the Eurasian continent in winter (Figure 4C). To the north of the anomalous polar-front jet, the height is reduced and a convergence forms from 1000 to 250 hPa (Figures 5A–C), which can weaken the Siberian high and reduce the delivery of Arctic cold air to Eurasia (Figure 3C). Therefore, in contrast to the colder temperatures over the Barents Sea, a positive air temperature anomaly is evident over the mid-latitudes (Figure 3D), which might be due to the weakened Siberian high linked with the abnormal Barents Sea ice (Honda et al., 2009; Overland et al., 2015; Sorokina et al., 2016; Cohen et al., 2018, 2020; Kim and Kim, 2018).
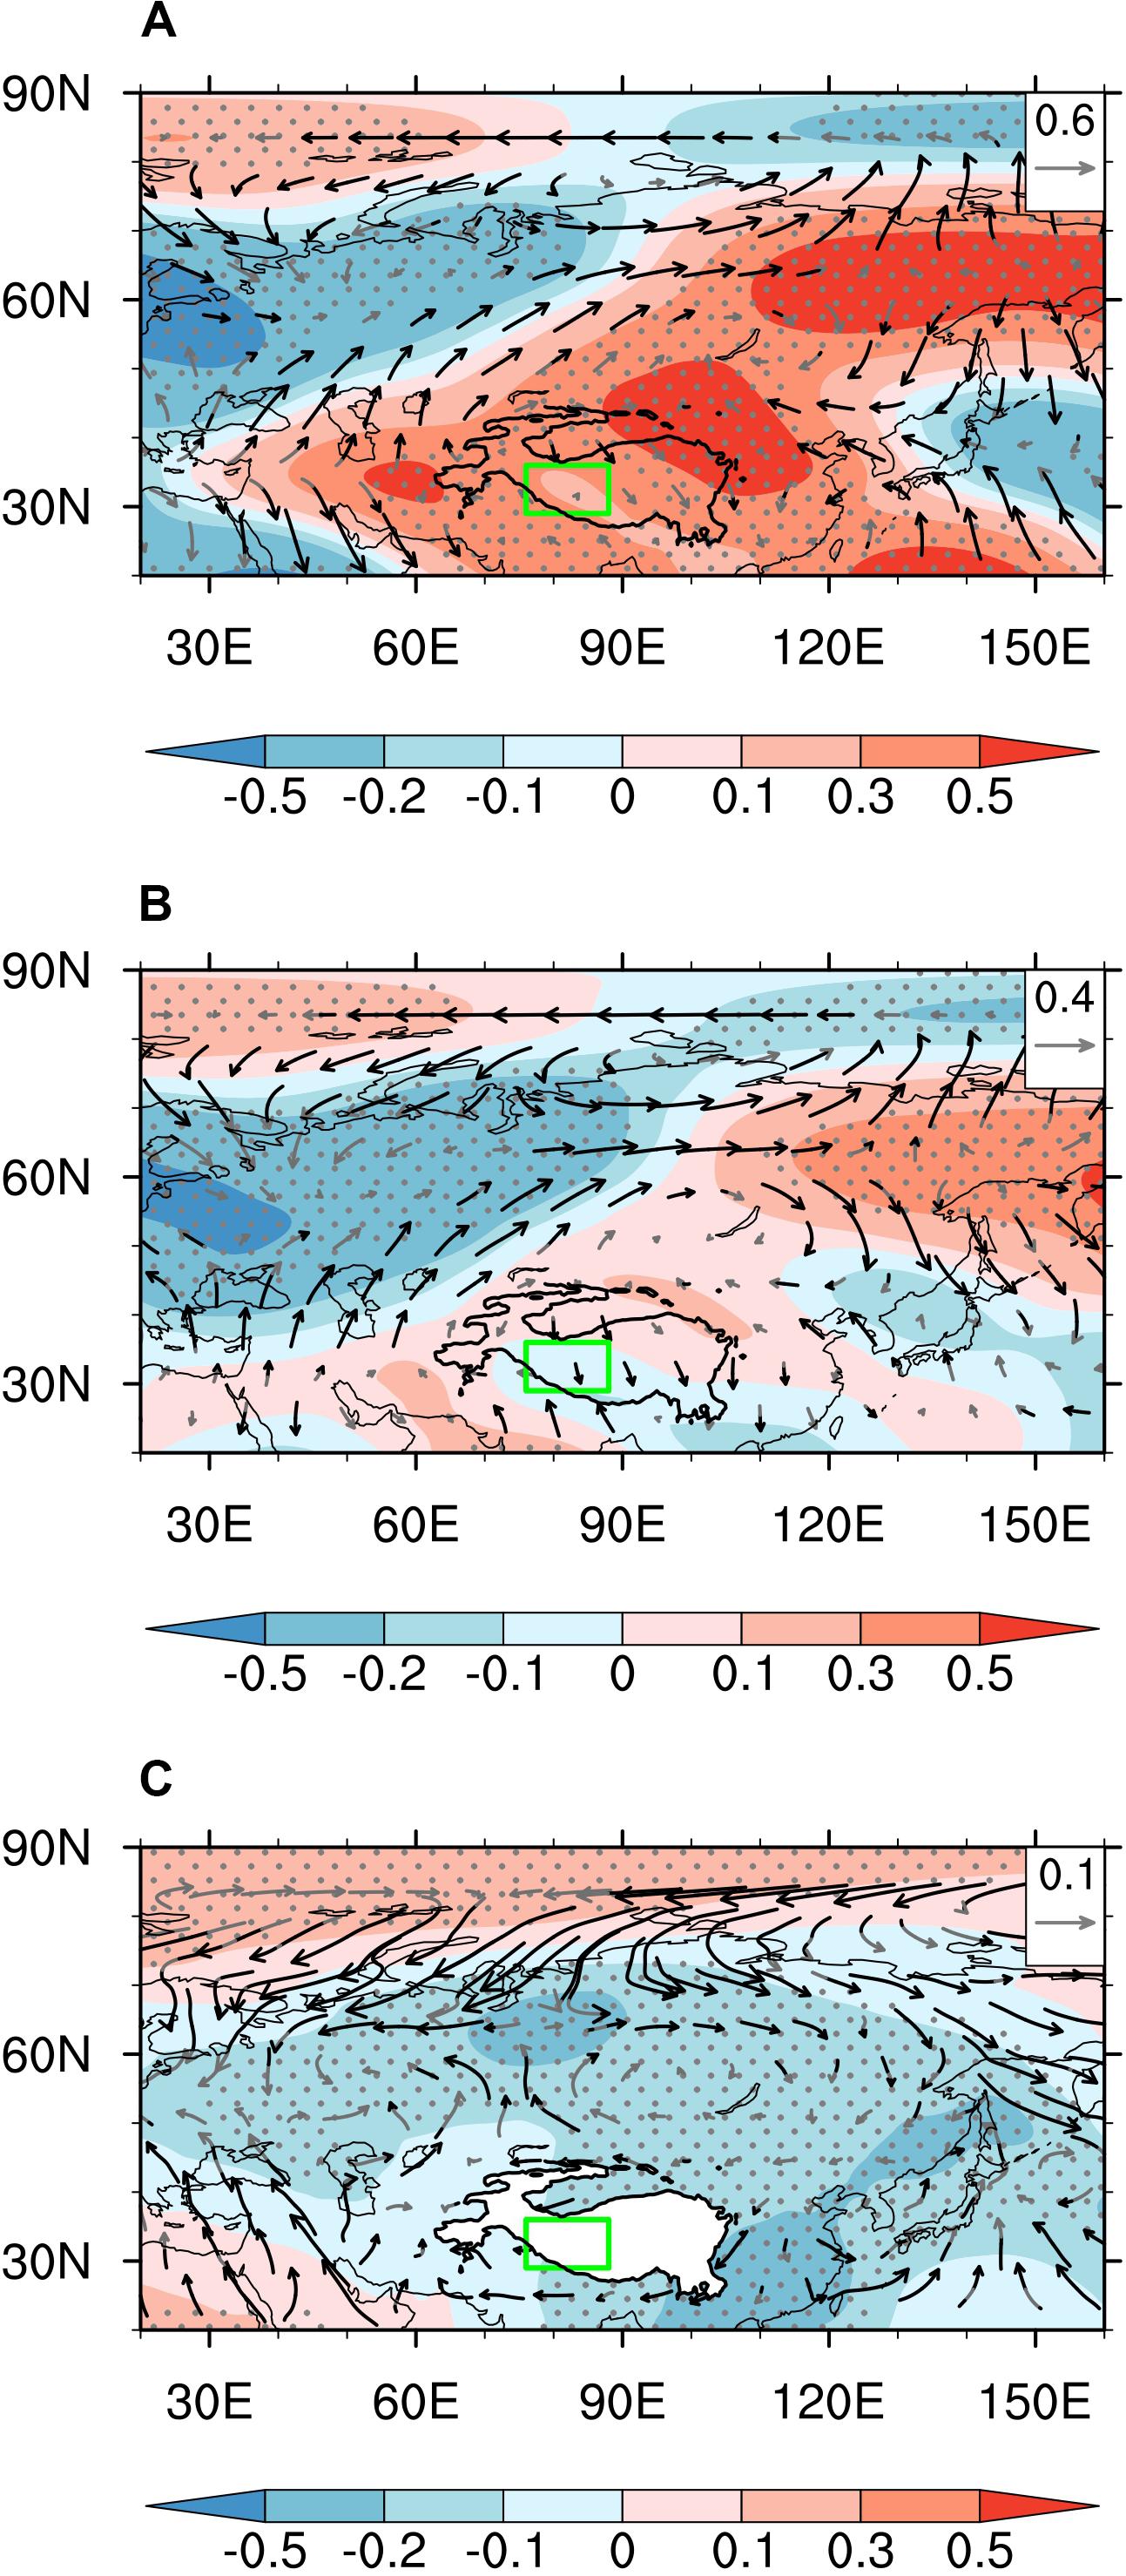
Figure 5. Regression fields of the divergent wind (vectors; units: m/s) and velocity potential (shaded; units: 106 m2/s) at (A) 250, (B) 500, and (C) 1000 hPa, against the BSICI. Black arrows indicate vector values above the p = 0.1 confidence level. The shaded values of the stippled areas exceed the p = 0.1 confidence level. The green box represents the MWTP region. The black line over the region (25°–45°N, 60°–110°E) outlines the 2-km topography of the Tibetan Plateau.
The MWTP experiences frequent snowfall in the cold season (Lu et al., 2005; Bookhagen and Burbank, 2010). This abundant snowfall is often modulated by the subtropical westerly jet, which may provide moisture transport toward the Tibetan Plateau (Norris et al., 2015; Bao and You, 2019). Considering the high topography of the MWTP, the regression fields of 500 hPa (near the surface over the TP) atmospheric circulation and zonal wind against the winter BSICI are exhibited in Figure 6. One can see a salient meridional dipole pattern in the geopotential height anomaly over the Eurasian continent because of the horizontal propagation of the Rossby wave in Figures 4B,C. The low center occupies the north part of the Eurasian continent and another high center in the belly of Eurasia with the Tibetan Plateau included (Figure 6A). The south center of the dipole pattern can generate anticyclonic circulation near the Tibetan Plateau, which can directly influence the subtropical westerly jet that is concerned as the regulator of the Tibetan Plateau snow depth.
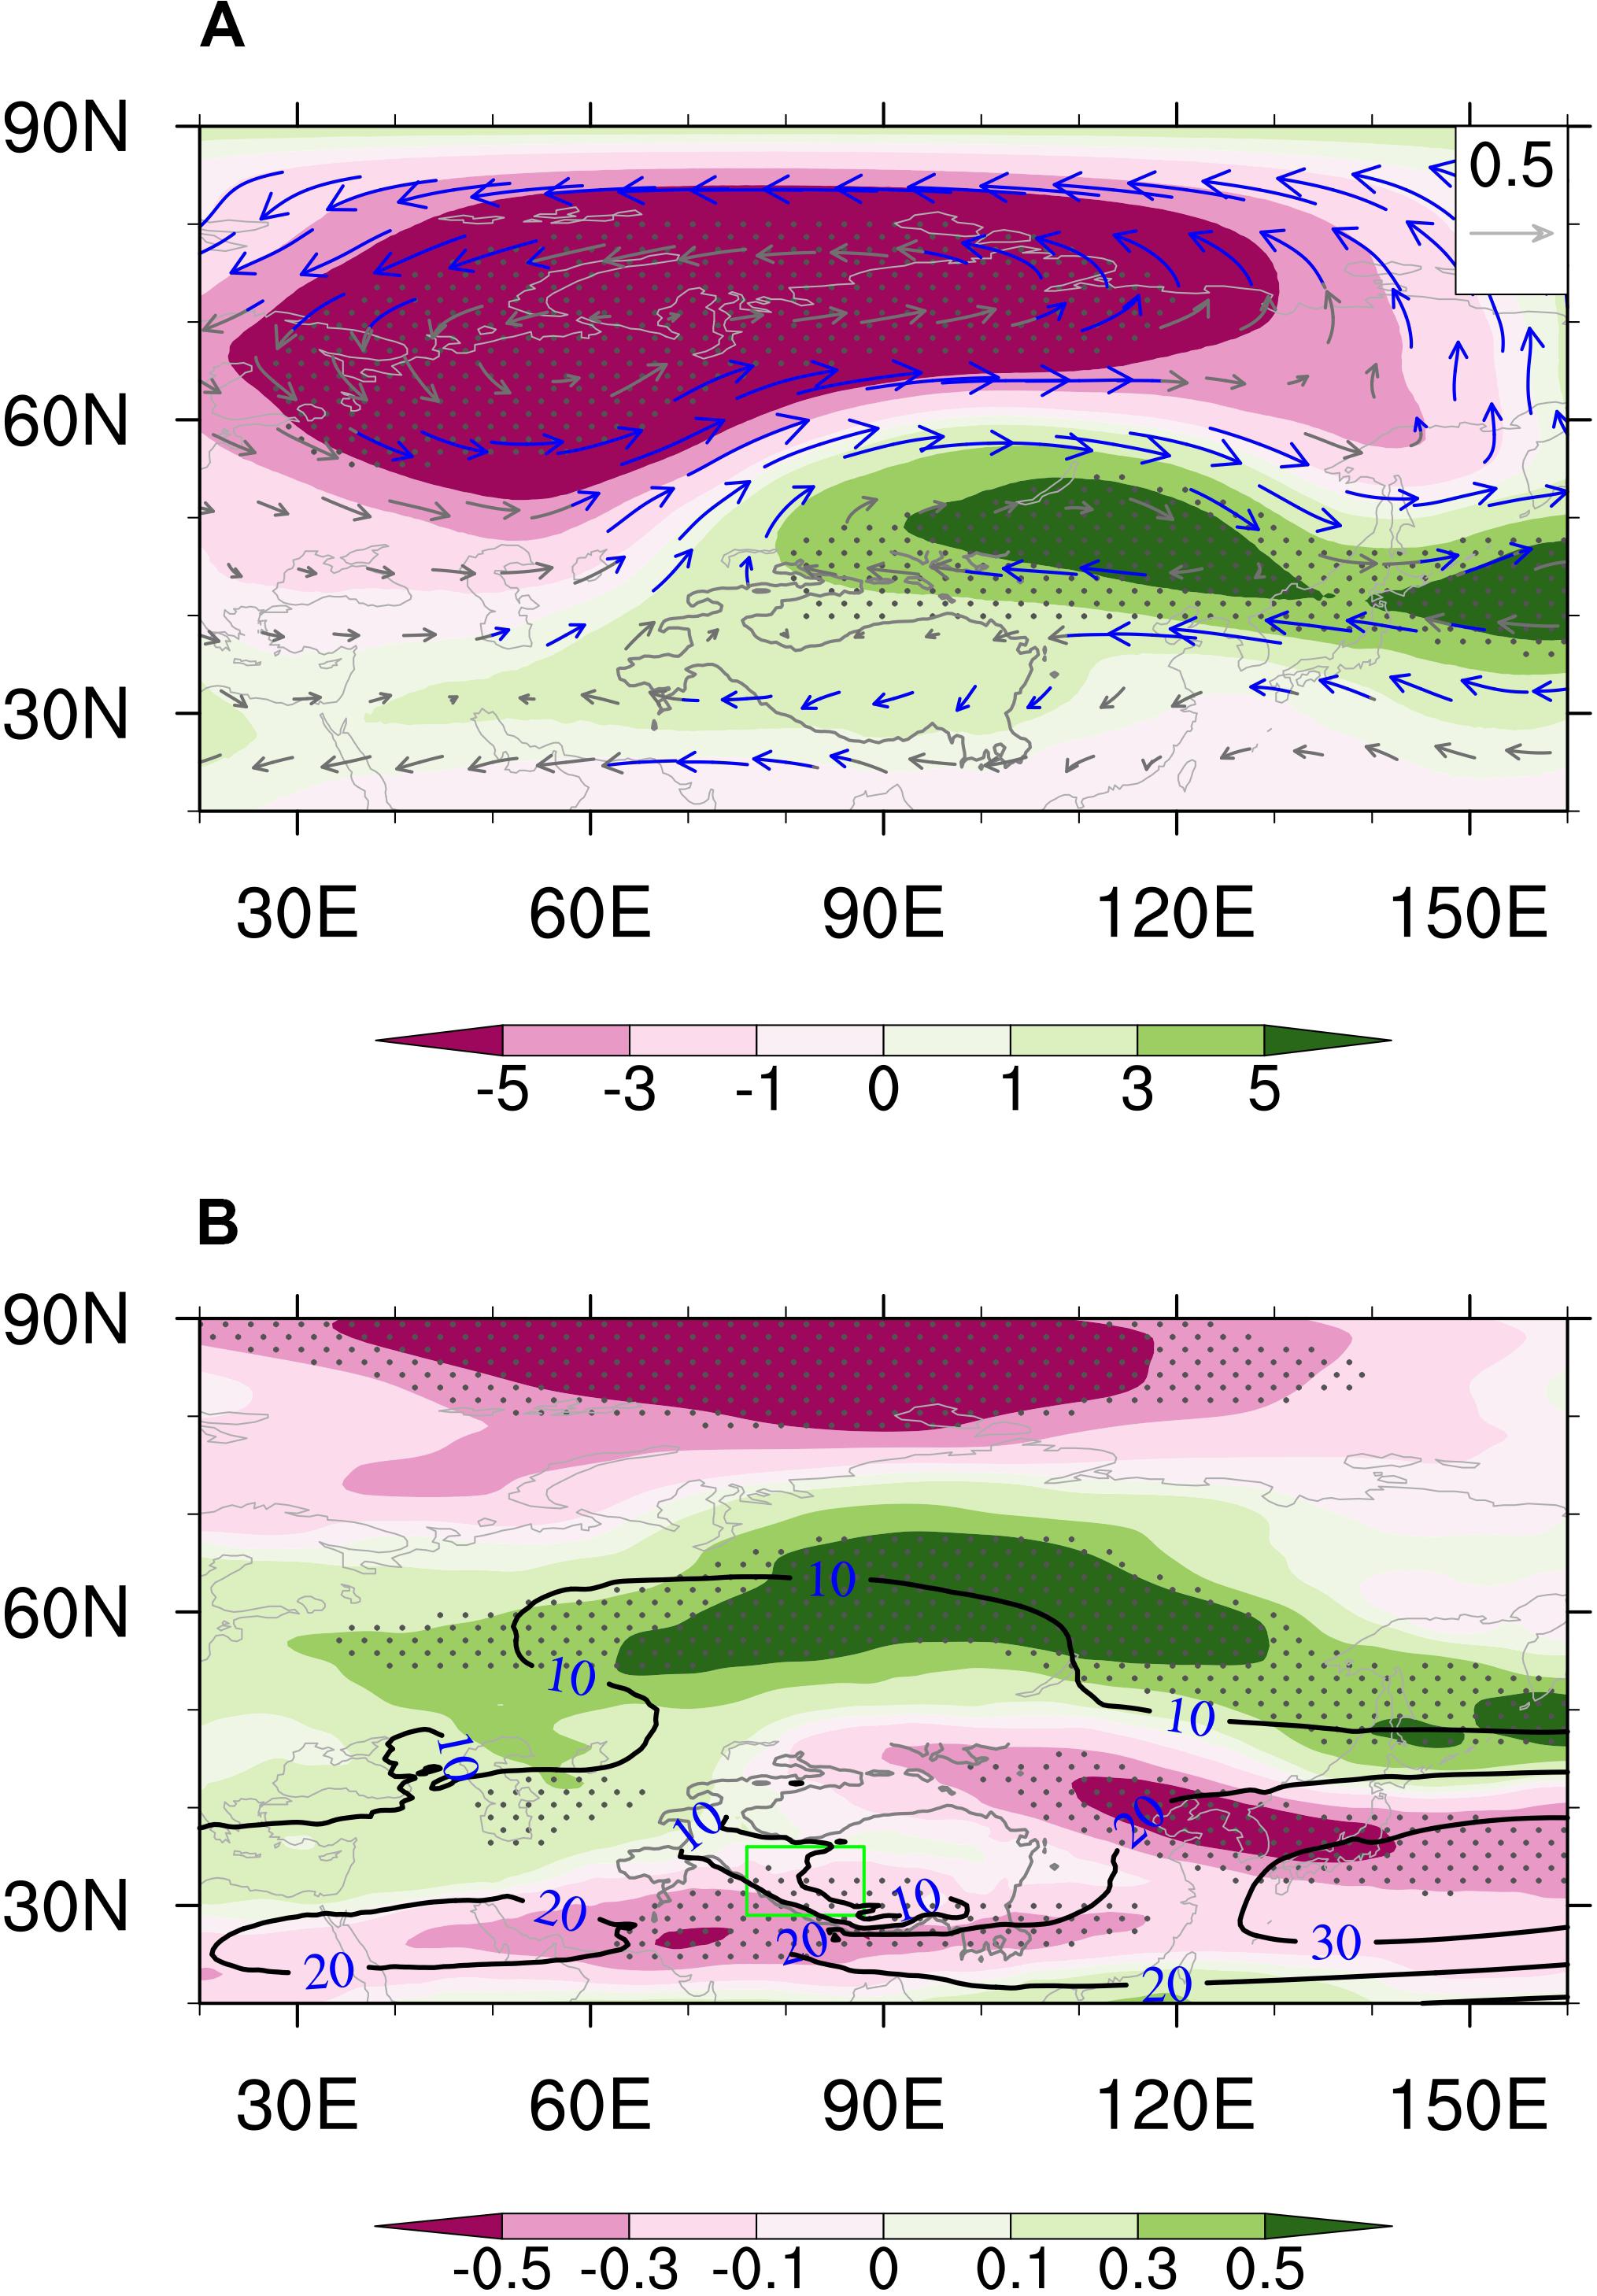
Figure 6. Regression fields of (A) the winter geopotential height (shaded; units: m) and horizontal wind vector (units: m/s), and (B) zonal wind speed (shaded; units: m/s) at 500 hPa, against the BSICI. Blue arrows in A indicate vector values above the p = 0.1 confidence level. The black contours in B represent the climatology of the zonal wind speed with intensity larger than 10 m/s. The shaded values of the stippled areas exceed the p = 0.1 confidence level. The black box in B represents the MWTP region. The gray line over the region (25°–45°N, 60°–110°E) outlines the 2-km topography of the Tibetan Plateau.
Generally, the subtropical westerly jet and polar-front westerly jet coexist in the mid-troposphere over the Eurasian continent, with the larger intensity in the former, and these two jets converge into one in the east of East Asia. Synergistic changes in the north–south jet often induce the Tibetan Plateau and Eurasian climate change (Zhang et al., 2019b). With above-normal BSICI, the zonal wind is strengthened around 60°N and weakened around the polar region and Tibetan Plateau (Figure 6B). The south center of the dipole pattern, i.e., the anticyclonic circulation anomaly, leads to the decelerated subtropical westerly jet, especially over the southwestern MWTP (Figure 6B). These changes imposed on the westerly wind may have some influence on the moisture transport associated with the snowfall over the MWTP. The anticyclonic circulation can cause anomalous southeasterly wind to climb the MWTP, and the regression fields of the wind and specific humidity show that the anomalous southeasterly winds at the south part of the anticyclonic circulation facilitate the moisture convergence in the mid-high troposphere over the MWTP (Figures 7A,B). As indicated by the divergent wind, there is a large-scale atmospheric divergence at 250 hPa and convergence at 1000 hPa around the TP region (Figures 5A–C). At 500 hPa, the surface circulation converges to the TP, especially in the MWTP. Considering the steep terrain of the MWTP, the 400-hPa horizontal water vapor flux and divergence Dxy were estimated. The water vapor flux converges and forms a negative center over the MWTP (Figure 7C), which is conducive to the MWTP snowfall.
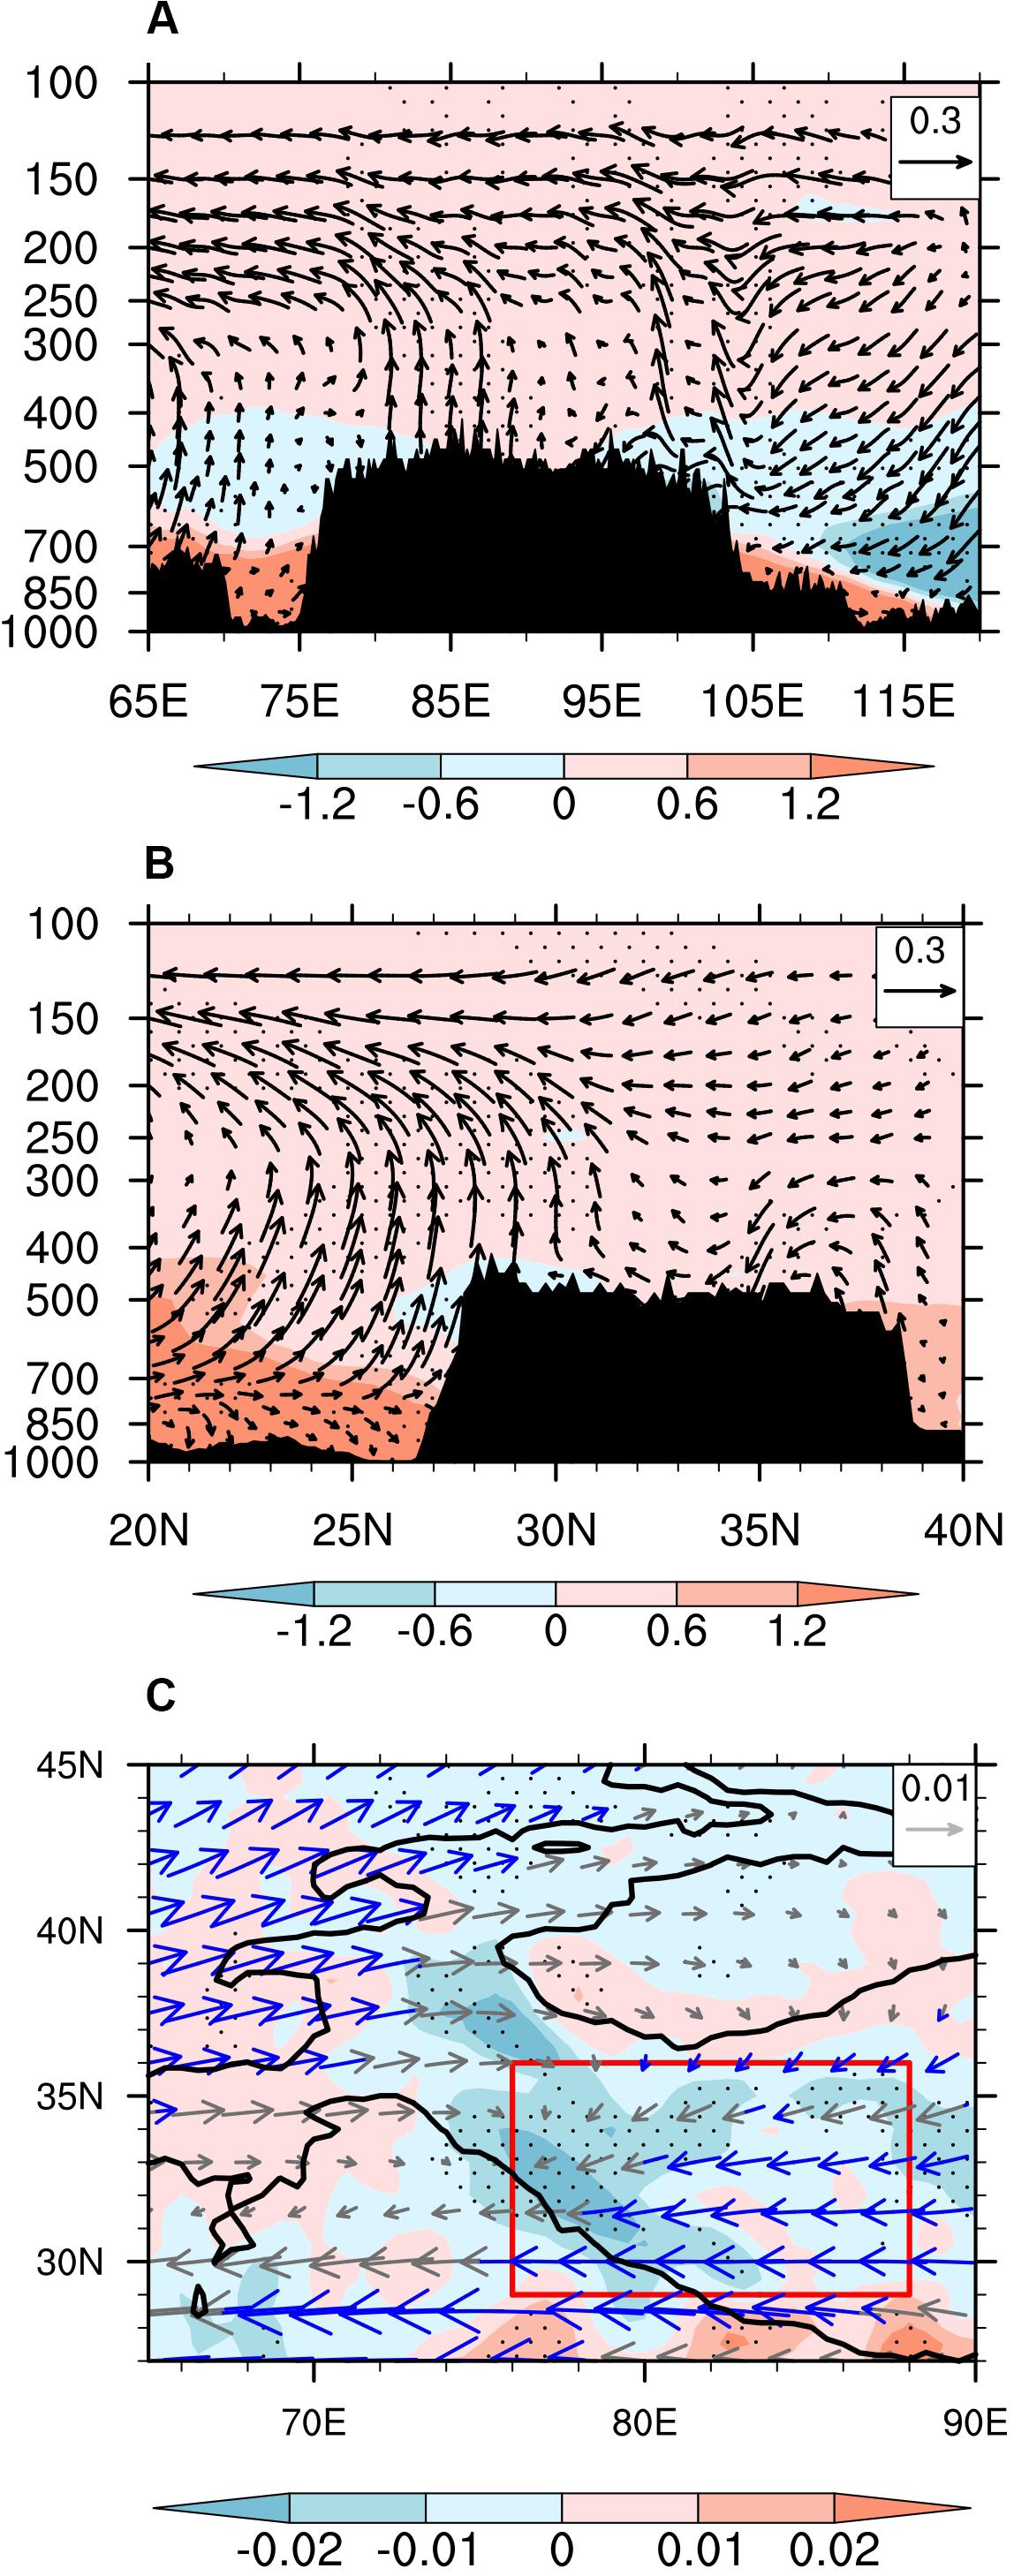
Figure 7. Regression fields of the (A) cross sections of zonal-vertical circulation (vectors; zonal wind speed in m/s, and vertical velocity in Pa/s, multiplied by −57) and specific humidity (shaded; units: 10–2 g/kg) averaged over 25°–32°N, and (B) cross sections of meridional-vertical circulation (vectors; zonal wind speed in m/s, and vertical velocity in Pa/s, multiplied by −71) and specific humidity (shaded; units: 10–2 g/kg) averaged over 80°–88°E, and (C) water vapor flux (vectors; units: g/cm•s•hPa) and convergence at 400 hPa (shaded; units: 10–8 g/cm2•s•hPa), against the BSICI. The vectors of the stippled areas in A and B exceed the p = 0.1 confidence level. Blue arrows in C indicate vector values above the p = 0.1 confidence level. The red box in C represents the MWTP region. The black line over the region (25°–45°N, 60°–110°E) in C outlines the 2-km topography of the Tibetan Plateau.
To reveal the respective contributions of the moisture transport to the MWTP snowfall related to the Barents Sea ice concentration anomaly, in Figure 8, we plot the regression fields of the winter precipitation, snow depth, the 400-hPa moisture convergence indicated on the left-hand side of Eq. 2, and the six terms of the water vapor convergence indicated on the right-hand side of Eq. 2. It is clear that, with the favorable circulation as shown in Figures 6, 7, more winter precipitation appears over the MWTP (Figure 8A) when the BSICI has a positive anomaly, bringing about more snowfall and greater snow depth over the MWTP (Figure 8B), which are largely contributed by the moisture convergence (Figure 8C). The diagnosis of the six terms of water vapor transport indicates that the moisture convergence anomaly over the MWTP is contributed mainly by the zonal advection (Figure 8D), which should be directly related to the weakened westerly in the downstream regions as shown in Figure 6B, and the vertical advection and meridional convergence of moisture flux (Figures 8F,H) as a result of the anomalous southeasterly winds climbing the MWTP. The meridional advection has relatively less influence on the snowfall (Figure 8E), and the contribution from the zonal (Figure 8G) and vertical (Figure 8I) convergence terms are not conducive to the snowfall.
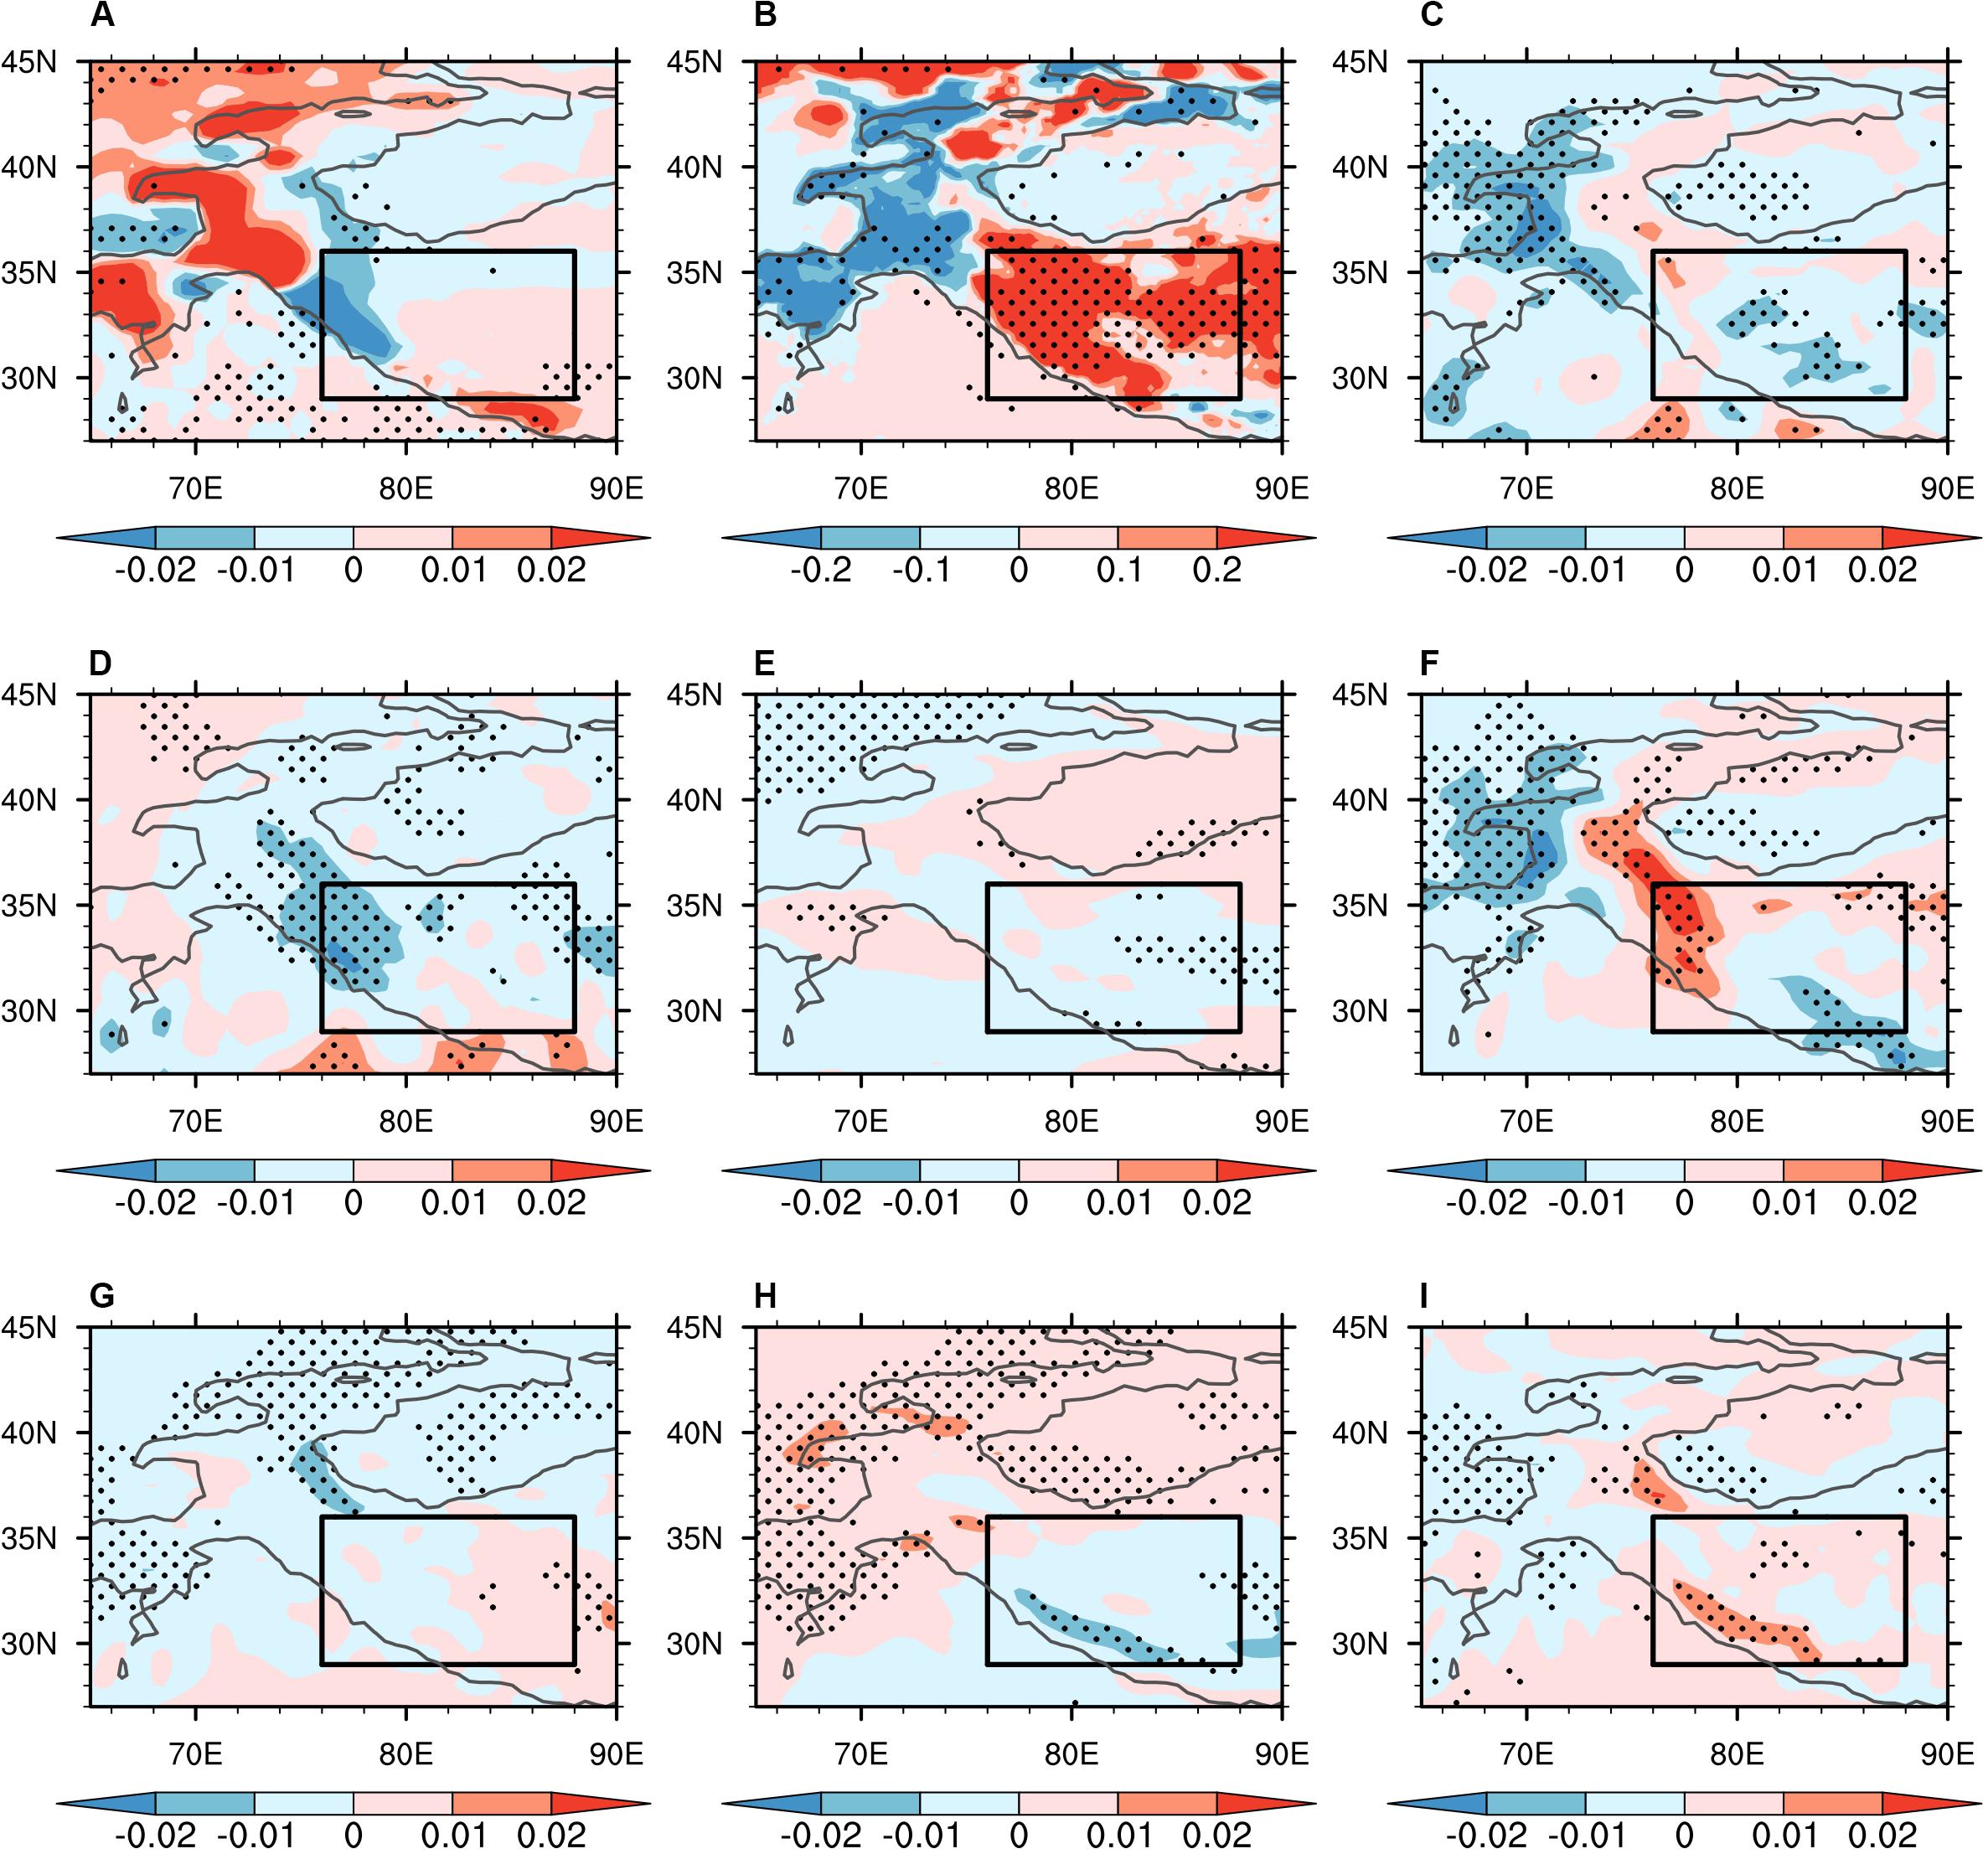
Figure 8. Regression fields of (A) the winter snowfall (units: mm/day), (B) snow depth (units: cm), and (C) the moisture divergence D at 400 hPa (units: 10–8 g/cm2•s•hPa); and the (D) zonal advection, (E) meridional advection, (F) vertical advection, (G) zonal convergence, (H) meridional convergence, and (I) vertical convergence (units: 10–8 g/cm2•s•hPa) of moisture flux at 400 hPa, against the BSICI. The stippled areas exceed the p = 0.1 confidence level. The black box (29°–36°N, 76°–88°E) represents the MWTP region. The gray line over the region (25°–45°N, 60°–110°E) outlines the 2-km topography of the Tibetan Plateau.
Discussion and Conclusion
As the world’s highest topography, the snow depth over the MWTP shows an inconspicuous trend but strong interannual variation during recent decades, which inspired us to study the possible driving force behind its interannual variation. Satellite snow and sea ice data and ERA-Interim reanalysis data were utilized to address this issue. The main conclusions can be summarized as follows:
1) A coherent interannual variation between MWTP snow depth and the Barents Sea ice concentration is robust in the observations. Above-normal Barents Sea ice cools the air temperature aloft by reducing the transmission of heat between ocean and atmosphere, thus enhancing the temperature gradient between the polar region and mid-latitudes over the Eurasian continent.
2) With the increased temperature gradient, the polar-front westerly jet is enhanced, which increases the atmospheric baroclinicity and stimulates a Rossby wave propagating upward and equatorward, producing an anomalous anticyclone in the mid-troposphere of the subtropics with the Tibetan Plateau included to influence the subtropical westerly jet.
3) As a result, the zonal advection of moisture flux and the meridional convergence of moisture flux over the MWTP are intensified significantly, bringing about more moisture from surrounding areas and a resultant above-normal snowfall and snow depth in the MWTP. Therefore, the westerly jet and anomalous Rossby wave serve as an efficient atmospheric bridge in connecting the winter Arctic sea ice and snow depth over the MWTP.
This paper emphasizes the role of the westerly jet and Rossby wave in connecting the interannual variation between the Barents Sea ice and MWTP snow depth, but some other processes might also be important. The westerly wind anomalies can also be influenced by El Niño–Southern Oscillation (Matsumura and Kosaka, 2019) and Atlantic sea surface temperature (Jung et al., 2017; Sung et al., 2018). The Arctic sea ice aside from that in the Barents Sea also vary greatly and can impose some influence on the mid-latitude climate (Screen, 2017; Cohen et al., 2020); plus, the lagged impact of the autumn Arctic sea ice and continental snow cover also play a role in the winter atmospheric circulation (Cohen et al., 2012; Furtado et al., 2015; Handorf et al., 2015). In addition, the combination effect of internal variability and external forcing on the relationship between sea ice change and Eurasia continent climate is still under debate (Overland et al., 2015; Park et al., 2015; Kim and Son, 2016; Cohen et al., 2018, 2020; Ye et al., 2018; Ye and Jung, 2019). Therefore, a comprehensive picture of the relationship between Arctic sea ice and snow depth over the Tibetan Plateau needs to be further explored in future. Moreover, owing to the imperfect physical schemes and coarse resolutions (Rahimi et al., 2019), existing climate models fail to simulate the observed spatiotemporal variation of snowfall and snow depth over the mid-west Tibetan Plateau, meaning a more complete model is therefore needed in future work to understand the mechanism involved in the variation of Tibetan Plateau snow depth.
Data Availability Statement
The datasets presented in this study can be found in online repositories. The names of the repository/repositories and accession number(s) can be found below: http://poles.tpdc.ac.cn/zh-hans/, https://www.metoffice.gov.uk/hadobs/index.html, and https://www.ecmwf.int/en/forecasts/datasets/reanalysis-datasets/era-interim.
Author Contributions
YC wrote the initial manuscript and calculated the data analysis. AD designed the structure of the manuscript and revised the manuscript. DL checked the manuscript and proposed comments. All authors contributed to the article and approved the submitted version.
Funding
This work was supported by the Strategic Priority Research Program of the Chinese Academy of Sciences (Grant No. XDA19070404) and the National Natural Science Foundation of China (Grant Nos. 41725018 and 91637312).
Conflict of Interest
The authors declare that the research was conducted in the absence of any commercial or financial relationships that could be construed as a potential conflict of interest.
References
Banacos, P. C., and Schultz, D. M. (2005). The use of moisture flux convergence in forecasting convective initiation: historical and operational perspectives. Weather Forecast. 20, 351–366. doi: 10.1175/waf858.1
Bao, Y., and You, Q. (2019). How do westerly jet streams regulate the winter snow depth over the Tibetan Plateau? Clim. Dyn. 53, 353–370. doi: 10.1007/s00382-018-4589-1
Blackport, R., and Screen, J. A. (2019). Influence of Arctic sea ice loss in autumn compared to that in winter on the atmospheric circulation. Geophys. Res. Lett. 46, 2213–2221. doi: 10.1029/2018GL081469
Bookhagen, B., and Burbank, D. W. (2010). Toward a complete Himalayan hydrological budget: spatiotemporal distribution of snowmelt and rainfall and their impact on river discharge. J. Geophys. Res. Earth Surf. 115:F03019. doi: 10.1029/2009JF001426
Che, T., Li, X., Jin, R., Armstrong, R., and Zhang, T. J. (2008). Snow depth derived from passive microwave remote-sensing data in China. Ann. Glaciol. 49, 145–154. doi: 10.3189/172756408787814690
Chow, K. C., Chan, J. C., Shi, X., Liu, Y., and Ding, Y. (2008). Time-lagged effects of spring Tibetan Plateau soil moisture on the monsoon over China in early summer. Int. J. Climatol. 28, 55–67. doi: 10.1002/joc.1511
Cohen, J., Screen, J. A., Furtado, J. C., Barlow, M., Whittleston, D., Coumou, D., et al. (2014). Recent Arctic amplification and extreme mid-latitude weather. Nat. Geosci. 7, 627–637. doi: 10.1038/ngeo2234
Cohen, J., Zhang, X., Francis, J., Jung, T., Kwok, R., Overland, J., et al. (2018). “Arctic change and possible influence on mid-latitude climate and weather,” in A US CLIVAR white paper (No. 2018-1), ed. K. Uhlenbrock (Washington, DC: U.S. CLIVAR Project Office), 41. doi: 10.5065/D6TH8KGW
Cohen, J., Zhang, X., Francis, J., Jung, T., Kwok, R., Overland, J., et al. (2020). Divergent consensuses on Arctic amplification influence on midlatitude severe winter weather. Nat. Clim. Chang. 10, 20–29. doi: 10.1038/s41558-019-0662-y
Cohen, J. L., Furtado, J. C., Barlow, M. A., Alexeev, V. A., and Cherry, J. E. (2012). Arctic warming, increasing snow cover and widespread boreal winter cooling. Environ. Res. Lett. 7, 14007–14014. doi: 10.1088/1748-9326/7/1/014007
Dee, D. P., Uppala, S. M., Simmons, A. J., Berrisford, P., Poli, P., Kobayashi, S., et al. (2011). The ERA-Interim reanalysis: configuration and performance of the data assimilation system. Q. J. R. Meteorol. Soc. 137, 553–597. doi: 10.1002/qj.828
Duchon, C. E. (1979). Lanczos filtering in one and two dimensions. J. Appl. Meteor. 18, 1016–1022. doi: 10.1175/1520-045019790182.0.CO;2
Furtado, J. C., Cohen, J. L., Butler, A. H., Riddle, E. E., and Kumar, A. (2015). Eurasian snow cover variability and links to winter climate in the cmip5 models. Clim. Dyn. 45, 2591–2605. doi: 10.1007/s00382-015-2494-4
Gardelle, J., Berthier, E., and Arnaud, Y. (2012). Slight mass gain of Karakoram glaciers in the early twenty-first century. Nat. Geosci. 5, 322–325. doi: 10.1038/ngeo1450
Ghatak, D., Deser, C., Frei, A., Gong, G., Phillips, A., Robinson, D. A., et al. (2012). Simulated Siberian snow cover response to observed Arctic sea ice loss, 1979–2008. J. Geophys. Res. 117:D23108. doi: 10.1029/2012jd018047
Guo, D., Sun, J., Yang, K., Pepin, N., Xu, Y., Xu, Z., et al. (2019). Satellite data reveal southwestern Tibetan Plateau cooling since 2001 due to snow-albedo feedback. Int. J. Climatol. 40, 1644–1655. doi: 10.1002/joc.6292
Guo, H., Li, X., and Qiu, Y. (2020). Comparison of global change at earth’s “three poles” using spaceborne earth observation. Sci. Bull. doi: 10.1016/j.scib.2020.04.031
Handorf, D., Jaiser, R., Dethloff, K., Rinke, A., and Cohen, J. (2015). Impacts of Arctic sea ice and continental snow cover changes on atmospheric winter teleconnections. Geophys. Res. Lett. 42, 2367–2377. doi: 10.1002/2015GL063203
Hock, R., Rasul, G., Adler, C., Cáceres, B., Gruber, S., Hirabayashi, Y., et al. (2019). “High mountain areas,” in IPCC Special Report on the Ocean and Cryosphere in a Changing Climate, eds H.-O. Pörtner, D. C. Roberts, V. Masson-Delmotte, P. Zhai, M. Tignor, E. Poloczanska, et al. (Geneva: IPCC).
Honda, M., Inoue, J., and Yamane, S. (2009). Influence of low Arctic sea ice minima on anomalously cold Eurasian winters. Geophys. Res. Lett. 36, 262–275. doi: 10.1029/2008GL037079
Immerzeel, W. W., Van Beek, L. P., and Bierkens, M. F. (2010). Climate change will affect the Asian water towers. Science 328, 1382–1385. doi: 10.1126/science.1183188
Jung, O., Sung, M. K., Sato, K., Lim, Y. K., Kim, S. J., Baek, E. H., et al. (2017). How does the sst variability over the western North Atlantic ocean control arctic warming over the barents-kara seas? Environ. Res. Lett. 12:034021. doi: 10.1088/1748-9326/aa5f3b
Kapnick, S. B., Delworth, T. L., Ashfaq, M., Malyshev, S., and Milly, P. C. (2014). Snowfall less sensitive to warming in Karakoram than in Himalayas due to a unique seasonal cycle. Nat. Geosci. 7, 834–840. doi: 10.1038/ngeo2269
Kim, B. M., Son, S. W., Min, S. K., Jeong, J. H., Kim, S. J., Zhang, X., et al. (2014). Weakening of the stratospheric polar vortex by Arctic sea ice loss. Nat. Commun. 5:4646. doi: 10.1038/ncomms5646
Kim, K. Y., and Son, S. W. (2016). Physical characteristics of eurasian winter temperature variability. Environ. Res. Lett. 11:044009. doi: 10.1088/1748-9326/11/4/044009
Kim, S. J., and Kim, B. M. (2018). Arctic warming and its influence on east Asian winter cold events: a brief recap. Adv. Polar Sci. 29, 3–12. doi: 10.13679/j.advps.2018.1.00003
Kumar, P., Saharwardi, M. S., Banerjee, A., Azam, M. F., Dubey, A. K., and Murtugudde, R. (2019). Snowfall variability dictates glacier mass balance variability in himalaya-karakoram. Sci. Rep. 9:18192. doi: 10.1038/s41598-019-54553-9
Li, C., Su, F., Yang, D., Tong, K., Meng, F., and Kan, B. (2018). Spatiotemporal variation of snow cover over the Tibetan Plateau based on MODIS snow product, 2001–2014. Int. J. Climatol. 38, 708–728. doi: 10.1002/joc.5204
Liu, J., Curry, J. A., Wang, H., Song, M., and Horton, R. M. (2012). Impact of declining Arctic sea ice on winter snowfall. PNAS 109, 4074–4079. doi: 10.1073/pnas.1114910109
Lu, C., Ge, Y., and Xie, G. (2005). “Tibetan plateau serves as a water tower,” in Proceedings 2005 IEEE International Geoscience and Remote Sensing Symposium, 2005, Seoul, 3120–3123.
Matsumura, S., and Kosaka, Y. (2019). Arctic–Eurasian climate linkage induced by tropical ocean variability. Nat. Commun. 10:3441. doi: 10.1038/s41467-019-11359-7
Mori, M., Watanabe, M., Shiogama, H., Inoue, J., and Kimoto, M. (2014). Robust Arctic sea ice influence on the frequent Eurasian cold winters in past decades. Nat. Geosci. 7, 869–873. doi: 10.1038/ngeo2277
Norris, J., Carvalho, L. M., Jones, C., and Cannon, F. (2015). WRF simulations of two extreme snowfall events associated with contrasting extratropical cyclones over the western and central Himalaya. J. Geophys. Res. Atmos. 120, 3114–3138. doi: 10.1002/2014JD022592
Onarheim, I. H., Eldevik, T., Smedsrud, L. H., and Stroeve, J. C. (2018). Seasonal and regional manifestation of Arctic sea ice loss. J. Clim. 31, 4917–4932. doi: 10.1175/JCLI-D-17-0427.1
Overland, J., Francis, J. A., Hall, R., Hanna, E., Kim, S. J., and Vihma, T. (2015). The melting arctic and midlatitude weather patterns: are they connected? J. Clim. 28, 7917–7932. doi: 10.1175/JCLI-D-14-00822.1
Park, H. S., Lee, S., Son, S. W., Feldstein, S. B., and Kosaka, Y. (2015). The impact of poleward moisture and sensible heat flux on arctic winter sea ice variability. J. Clim. 28, 5030–5040. doi: 10.1175/JCLI-D-15-0074.1
Rahimi, S. R., Wu, C., Liu, X., and Brown, H. (2019). Exploring a variable-resolution approach for simulating regional climate over the Tibetan Plateau using VR-CESM. J. Geophys. Res. Atmos. 124, 4490–4513. doi: 10.1029/2018JD028925
Rayner, N., Parker, D. E., Horton, E., Folland, C. K., Alexander, L. V., Rowell, D., et al. (2003). Global analyses of sea surface temperature, sea ice, and night marine air temperature since the late nineteenth century. J. Geophys. Res. Atmos. 108:D14. doi: 10.1029/2002jd002670
Screen, J. A. (2017). Simulated atmospheric response to regional and pan-Arctic sea ice loss. J. Clim. 30, 3945–3962. doi: 10.1175/jcli-d-16-0197.1
Senan, R., Orsolini, Y. J., Weisheimer, A., Vitart, F., Balsamo, G., Stockdale, T. N., et al. (2016). Impact of springtime Himalayan–Tibetan Plateau snowpack on the onset of the Indian summer monsoon in coupled seasonal forecasts. Clim. Dyn. 47, 2709–2725. doi: 10.1007/s00382-016-2993-y
Shi, N., Wang, X., and Tian, P. (2018). Interdecadal variations in persistent anomalous cold events over Asian mid-latitudes. Clim. Dyn. 52, 3729–3739. doi: 10.1007/s00382-018-4353-6
Singh, S. K., Rathore, B. P., and Bahuguna, I. M. (2014). Snow cover variability in the Himalayan–Tibetan region. Int. J. Climatol. 34, 446–452. doi: 10.1002/joc.3697
Song, L., Wu, R., and An, L. (2019). Different sources of 10 to 30 day intraseasonal variations of autumn snow over Western and Eastern Tibetan Plateau. Geophys. Res. Lett. 46, 9118–9125. doi: 10.1029/2019GL083852
Song, M., and Liu, J. (2017). The role of diminishing Arctic sea ice in increased winter snowfall over northern high-latitude continents in a warming environment. Acta Oceanol. Sin. 36, 34–41. doi: 10.1007/s13131-017-1021-3
Sorokina, S. A., Li, C., Wettstein, J. J., and Kvamstø, N. G. (2016). Observed atmospheric coupling between Barents Sea ice and the warm-Arctic cold-Siberian anomaly pattern. J. Clim. 29, 495–511. doi: 10.1175/JCLI-D-15-0046.1
Sun, C., Yang, S., Li, W., Zhang, R., and Wu, R. (2016). Interannual variations of the dominant modes of East Asian winter monsoon and possible links to Arctic sea ice. Clim. Dyn. 47, 481–496. doi: 10.1007/s00382-015-2851-3
Sung, M. K., Kim, S. H., Kim, B. M., and Choi, Y. S. (2018). Interdecadal variability of the warm Arctic and cold Eurasia pattern and its North Atlantic origin. J. Clim. 31, 5793–5810. doi: 10.1175/JCLI-D-17-0562.1
Takaya, K., and Nakamura, H. (2001). A formulation of a phase-independent wave-activity flux for stationary and migratory quasigeostrophic eddies on a zonally varying basic flow. J. Atmos. Sci. 58, 608–627. doi: 10.1175/1520-0469(2001)058<0608:afoapi>2.0.co;2
Wegmann, M., Orsolini, Y., Vázquez, M., Gimeno, L., Nieto, R., Bulygina, O., et al. (2015). Arctic moisture source for Eurasian snow cover variations in autumn. Environ. Res. Lett. 10:054015. doi: 10.1088/1748-9326/10/5/054015
Xiao, Z., and Duan, A. (2016). Impacts of Tibetan Plateau snow cover on the Interannual variability of the east asian summer monsoon. J. Clim. 29, 8495–8514. doi: 10.1175/JCLI-D-16-0029.1
Yao, T., Thompson, L., Yang, W., Yu, W., Gao, Y., Guo, X., et al. (2012). Different glacier status with atmospheric circulations in Tibetan Plateau and surroundings. Nat. Clim. Change 2, 663–667. doi: 10.1038/nclimate1580
Ye, K., and Jung, T. (2019). How strong is influence of the tropics and midlatitudes on the Arctic atmospheric circulation and climate change? Geophys. Res. Lett. 46, 4942–4952. doi: 10.1029/2019GL082391
Ye, K., Jung, T., and Semmler, T. (2018). The influences of the Arctic troposphere on the midlatitude climate variability and the recent Eurasian cooling. J. Geophys. Res. Atmos. 123, 162–184. doi: 10.1029/2018JD028980
Yuan, C., Li, W., Guan, Z., and Yamagata, T. (2019). Impacts of april snow cover extent over Tibetan Plateau and the central Eurasia on Indian Ocean Dipole. Int. J. Climatol. 39, 1756–1767. doi: 10.1002/joc.5888
Zhang, G., Yao, T., Shum, C. K., Yi, S., Yang, K., Xie, H., et al. (2017). Lake volume and groundwater storage variations in Tibetan Plateau’s endorheic basin. Geophys. Res. Lett. 44, 5550–5560. doi: 10.1002/2017GL073773
Zhang, Y., Yan, P., Liao, Z., Huang, D., and Zhang, Y. (2019a). The winter concurrent meridional shift of the East Asian Jet streams and the associated thermal conditions. J. Clim. 32, 2075–2088. doi: 10.1175/JCLI-D-18-0085.1
Zhang, Y., Zou, T., and Xue, Y. (2019b). An Arctic-Tibetan connection on subseasonal to seasonal time scale. Geophys. Res. Lett. 46, 2790–2799. doi: 10.1029/2018GL081476
Keywords: Arctic sea ice, Barents Sea, Rossby wave, Tibetan Plateau, snow depth
Citation: Chen Y, Duan A and Li D (2020) Atmospheric Bridge Connecting the Barents Sea Ice and Snow Depth in the Mid-West Tibetan Plateau. Front. Earth Sci. 8:265. doi: 10.3389/feart.2020.00265
Received: 01 May 2020; Accepted: 12 June 2020;
Published: 07 July 2020.
Edited by:
Lei Wang, Institute of Tibetan Plateau Research (CAS), ChinaReviewed by:
Seong-Joong Kim, Korea Polar Research Institute, South KoreaJiping Liu, University at Albany, United States
Copyright © 2020 Chen, Duan and Li. This is an open-access article distributed under the terms of the Creative Commons Attribution License (CC BY). The use, distribution or reproduction in other forums is permitted, provided the original author(s) and the copyright owner(s) are credited and that the original publication in this journal is cited, in accordance with accepted academic practice. No use, distribution or reproduction is permitted which does not comply with these terms.
*Correspondence: Anmin Duan, amduan@lasg.iap.ac.cn; Dongliang Li, lidl@nuist.edu.cn