

Abstract
Heatwave events are expected to become more frequent and intense in the mid-latitudes of the Northern Hemisphere in the future. However, our knowledge of the impacts of these extreme temperature events on ecosystem functions is still limited. We investigated the responses of ecosystem gross primary productivity (GPP) to heatwaves for nine sites encompassing a wide variety of ecosystem types with long-term (i.e., >7 years) flux and meteorological observations at northern mid-latitudes. Our results showed that GPP was depressed during heatwaves for most ecosystems except the C4 sites. The evaporative stress index (ESI) was the primary variable responsible for the changes in GPP during heatwaves across the nine ecosystems. Furthermore, forest ecosystems were more resistant and resilient to heatwaves than other ecosystems. Additionally, the asymmetric diurnal pattern of GPP in forest ecosystems was attributed to xylem refilling and high water storage capacity, indicating that GPP was more sensitive to heatwaves in the afternoon. Interestingly, C4 herbaceous ecosystems could promote canopy stomatal conductance (Gc) for avoiding leaf burn and tissue damage during heatwaves. The herbaceous ecosystems had weaker stomatal control on water loss during heatwaves and were more vulnerable to heatwaves owing to the water stress afterwards. This research highlighted the importance of ecosystem type and plant functional type in determining the responses of photosynthesis to heatwaves. Understanding the post-effect after heatwaves is also vital for comprehensively assessing the impacts of heatwaves on ecosystem functions.
Export citation and abstract BibTeX RIS

Original content from this work may be used under the terms of the Creative Commons Attribution 4.0 license. Any further distribution of this work must maintain attribution to the author(s) and the title of the work, journal citation and DOI.
1. Introduction
Heatwaves, defined as extreme high-temperature events lasting several days, have affected more than 73% of the global terrestrial area since the mid-20th century (IPCC 2013, Coumou and Robinson 2013, Perkins-Kirkpatrick et al 2016). Furthermore, the frequency, intensity, and extent of heatwaves are expected to increase throughout the 21st century, especially in the mid-latitude regions (Ganguly et al 2009, Perkins et al 2012, Russo et al 2015, Sippel et al 2018). The sudden rise of air temperature can bring about more severe impacts on ecosystem functions than the gradual global warming and has received widespread scientific attention (Miralles et al 2014, Guha et al 2018, Otkin et al 2018, Lee et al 2018). Heatwaves not only impact plant photosynthesis by affecting the metabolism and stomatal aperture but also may lead to water stress subsequently (Crafts-Brandner and Salvucci 2002, Lin et al 2012, Bauweraerts et al 2014, Qu et al 2018). Nevertheless, it remains unclear how ecosystem gross primary production (GPP) responds to heatwaves during and after the events and how the responses vary among terrestrial ecosystems. Ecosystem resistance and resilience are widely used to reflect the ability of an ecosystem to remain and to recover from a disturbance to its normal state, respectively (Isbell et al 2015, Gazol et al 2017), and to evaluate the ecosystem function stability to climate extremes (Allen et al 2010, Gazol et al 2018). However, the resistance and resilience of different ecosystems to heatwaves are not well understood despite their vital roles in predicting ecosystem stability and adaptability in the context of global climate change.
The effects of extremely high temperatures on terrestrial photosynthesis have been observed from the plant level to the regional scale (Ciais et al 2005, Taiz et al 2010, Allen et al 2010, Teskey et al 2015). Heatwaves can dramatically influence plant physiological processes (e.g., stomatal aperture, photosynthetic carbon metabolism, and enzyme activity) (Taiz et al 2010, Siebers et al 2015), community structure (e.g., leaf area development and tree mortality) (Teskey et al 2015) and ecosystem functions (e.g., photosynthesis, respiration, transpiration) (Reichstein et al 2007, Zhang et al 2016), thereby severely affecting regional productivity and carbon uptake (Ciais et al 2005, Bastos et al 2014, Yuan et al 2016). For example, a 30% decrease in GPP over Europe has been reported during the summer heatwave of 2003 (Ciais et al 2005). The 2010 Russian heatwave with record-breaking extreme temperatures led to a 50% reduction in GPP (Bastos et al 2014). In southern China, a severe heatwave event reduced carbon sink by 46% within 2 months (Yuan et al 2016). Compared with the photosynthesis of individual plants and regional carbon budget, ecosystem-level GPP exhibits more complex responses to heatwaves due to plant adaptation and ecological traits (e.g., root distribution, canopy structure and species composition) (Jentsch et al 2007, Lloret et al 2012, Oliver et al 2015). Although there is general agreement that large-scale heatwave events pose serious threats to plant growth and survival worldwide (Allen et al 2010), the differences in the response mechanisms to heatwaves between different terrestrial ecosystems are still unclear.
Furthermore, few studies have separated and compared the interactions of multiple biophysical factors (i.e., canopy stomatal conductance and environmental factors) among different ecosystems under extremely high temperatures. The occurrence of a heatwave is usually accompanied by the variations in other environmental variables (e.g., soil water content, vapor pressure deficit, and solar radiation), which can affect ecosystem photosynthesis, directly and indirectly, owing to the complex and coupled biophysical regulations (Frank et al 2015). Specifically, high temperature directly influences the activity of Rubisco activase and photosystem II (PSII) (Crafts-Brandner and Salvucci 2004, Hozain et al 2010) and increase the photorespiration rate of C3 plants (Siebers et al 2015). Indirectly, interactive environmental elements during heatwaves affect ecosystem photosynthesis by regulating canopy stomatal conductance (Gc) (De Boeck et al 2010). Many observational studies have documented that water stress instead of extreme heat was the primary reason for the reduction of ecosystem productivity during heatwave events (Reichstein et al 2007, De Boeck et al 2011, Qu et al 2018). However, most studies only focused on the impacts of changing temperature and soil water, and the direct and indirect effects of multiple biophysical factors on ecosystem GPP under high-temperature conditions remain a knowledge gap (Frank et al 2015).
The responses of ecosystem functions to heatwaves for different ecosystems are not well understood partly because of the lack of long-term and consistent observations (Barnett et al 2012, Schubert et al 2014). Several laboratory experiments were performed to investigate the plant responses to the changing air temperature (Ta) (Ameye et al 2012, Bauweraerts et al 2014, De Boeck et al 2016), which could not comprehensively reflect the impacts of natural heatwaves on ecosystem GPP (Ballester et al 2010, Qu et al 2018). Moreover, modeling approaches could not capture the responses of ecosystem GPP to short-term heatwave events in a realistic way (Vetter et al 2008, Zhang et al 2016, Otkin et al 2018). Therefore, better understanding the changes in ecosystem functions and underlying mechanisms in heatwaves can inform the future improvement of process-based ecosystem models. Fortunately, the global ecosystem CO2 observation network (i.e., FLUXNET) based on the eddy covariance technique records high-quality and standardized data of mass fluxes and meteorological variables for a large number of sites (Baldocchi et al 2001). The FLUXNET2015 dataset consists of long-term observations encompassing a range of ecosystem types, which provides an excellent opportunity for studying the effects of heatwaves on ecosystem-level photosynthesis.
Here, we selected nine sites representing different ecosystems with long-term (i.e., >7 years) flux and meteorological observations from the FLUXNET2015 dataset to examine the responses of ecosystem GPP to heatwaves. The specific objectives of this study were to (1) probe into the responses of GPP during heatwaves across a wide variety of ecosystem types and plant functional types, (2) quantify and compare the biophysical regulations on GPP in different ecosystems under high-temperature conditions, and (3) explore the ecosystem water use strategy during heatwaves.
2. Materials and methods
2.1. Heatwave definition
Although heatwaves can be defined in multiple ways at present given the different criteria and study objectives, there are two prevailing approaches to estimate the temperature thresholds for meteorological heatwaves as follows: (1) A meteorological heatwave is defined by the World Meteorological Organization (WMO) as a sequence of at least five consecutive days during which the daily maximum temperature (Tmax) exceeds the average Tmax by 5 °C (WMO 2003, Teuling et al 2010); (2) A heatwave event is defined as the period when the daily Tmax exceeds its 90th percentile for several days (De Boeck et al 2010, Qu et al 2016, Wang et al 2019). In this study, we combined these two definitions to define meteorological heatwaves and to identify truly extreme events. We selected the 'hot days' when the daily Tmax belonged to the top 10% of historic daily Tmax values and exceeded multi-year average Tmax by 5 °C throughout the summer (i.e., mid-growing season) at each site and considered a period with at least seven consecutive 'hot days' as a heatwave event. If a 'non-hot day' fell in an 8 d or longer period of 'hot days', this period was also regarded as a heatwave event.
2.2. Study sites
In this study, the sites were selected from the FLUXNET2015 Tier-1 sites (http://fluxnet.fluxdata.org/data/fluxnet2015-dataset/) with an open-access policy in the mid-latitudes of the Northern Hemisphere (30–60ºN) using the following criteria: (1) each site has more than seven years of meteorological observations, (2) each site experienced at least three heatwave events in summer, (3) the selected sites encompass a variety of ecosystem types and plant functional types, (4) no irrigation was conducted during the study period. According to the heatwave definition and site selection criteria above, we chose nine eddy covariance flux sites consisting of three forest sites (a deciduous broadleaved forest (DBF), an evergreen needle-leaved forest (ENF), an evergreen broadleaved forest (EBF)), two shrubland sites (SH), two grassland sites (GRA, a C3 GRA and a C4 GRA), and two cropland sites (CRO, a C3 CRO and a C4 CRO) (table 1).
Table 1. Descriptions of the eddy covariance flux sites used in this study.
| VT | Code | Site name | Lat | Lon | Ys | Ye | PFT | MAT (°C) | MAP (mm) | Reference |
|---|---|---|---|---|---|---|---|---|---|---|
| DBF | DK-Sor | Soroe | 47.12 | 11.32 | 1997 | 2014 | 8.2 | 660 | Pilegaard et al 2011 | |
| ENF | RU-Fyo | Fyodorovskoye | 56.46 | 32.92 | 1998 | 2014 | 3.9 | 711 | Kurbatova et al 2008 | |
| EBF | IT-Cpz | Castelporziano | 41.71 | 12.38 | 1997 | 2009 | 15.6 | 780 | Garbulsky et al 2008 | |
| SH | US-Whs | Walnut Gulch Lucky Hills Shrub | 31.74 | –110.05 | 2007 | 2014 | 17.6 | 320 | Scott et al 2010 | |
| SH | IT-Noe | Arca di Noe—Le Prigionette | 40.61 | 8.15 | 2004 | 2014 | 15.9 | 588 | Marras et al 2011 | |
| GRA | AT-Neu | Neustift | 47.12 | 11.32 | 2002 | 2012 | C3 | 6.3 | 852 | Wohlfahrt et al 2008 |
| GRA | US-SRG | Santa Rita Grassland | 31.79 | –110.80 | 2008 | 2014 | C4 | 17.0 | 420 | Scott et al 2015 |
| CRO | CH-Oe2 | Oensingen crop | 47.29 | 7.73 | 2004 | 2014 | C3 | 9.8 | 1155 | Dietiker et al 2010 |
| CRO | US-Ne3 | Mead-rainfed maize-soybean rotation site | 41.18 | –96.44 | 2001 | 2011 | C4 | 10.1 | 784 | Nguy-Robertson et al 2015 |
Note: The vegetation type (VT) is classified according to the International Global Biosphere Program vegetation classification scheme (DBF, deciduous broadleaved forest; ENF, evergreen needle-leaved forest; EBF, evergreen broadleaved forest; CSH, closed shrubland; GRA, grasslands; CRO, cropland). Latitude (Lat) and longitude (Lon) are in decimal degrees. Start year (Ys) and end year (Ye) are the first and last year, respectively, in which data are available for each site. The MAT and MAP indicate the mean annual temperature (°C) and mean annual precipitation (mm), respectively. For the US-Ne3 site with soybean and maize rotations, only the data for the years with maize cultivated were used.
Flux data were filtered following the standardized protocol that includes spike detection and friction velocity filtering (Papale et al 2006). The gaps were filled by the average value under similar meteorological conditions within a 7 d or 14 d window based on the widely adopted marginal distribution sampling (MDS) approach(http://www.bgC-jena.mpg.de/∼MDIwork/eddyproc/) (Papale et al 2006, Moffat et al 2007). The measured net ecosystem exchange (NEE) was partitioned into GPP and ecosystem respiration (ER) for each half-hourly timestep. An exponential regression was applied to calculate ER by the nighttime approach, and then GPP was calculated as the difference between ER and NEE as follows (Reichstein et al 2005):

where Rref is the ER under the reference temperature, E0,short is the activation energy parameter that reflects the short-term temperature sensitivity (4 d), Tref is the reference temperature set to 15 °C, T0 is kept constant at −46.02 °C, and Tsoil is the soil temperature.
2.3. Biophysical parameters
Canopy conductance (Gc, mm s–1), considered as a typical biological variable, represents the canopy-integrated stomatal conductance at the ecosystem level when ET is dominated by plant transpiration during the mid-growing season (Jia et al 2016, Xu et al 2018). It was calculated by the inversion of the Penman–Monteith equation (Monteith 1965) as follows:
where pa is the air density (kg m−1), Cp is the specific heat capacity of air (J kg K−1), VPD is the atmospheric vapor pressure deficit (Pa), γ is the psychrometric constant (Pa K−1), Δ is the slope of the saturation vapor pressure curve (Pa K−1), β is the Bowen ratio, and ga is the aerodynamic conductance (mm s−1) between the canopy and the flux measurement height. ga was estimated as follows (Monteith and Unsworth 2013):
where µ is the wind speed (m s−1), and µ* is the friction velocity (m s−1).
Evaporative stress index (ESI), representing standardized anomalies in the ratio of actual evapotranspiration (ET) to potential evapotranspiration (PET), has been extensively used to measure the degree of soil water stress for plants or ecosystems and minimize the impacts of non-moisture-related environmental drivers (e.g., radiation and atmospheric demand) on ecosystem functions (Otkin et al 2015, 2018, Anderson et al 2016). In this study, we regarded ESI as an index of soil water condition, and negative ESI values generally indicate that soil water supply is not sustained for ecosystem health (Otkin et al 2015, 2016). ESI was applied in our study for the following reasons: (1) there were no measured soil moisture data available for some sites while for those sites with soil moisture data available the measurement depth varies with site, (2) more importantly, ESI can better capture and compare soil water conditions across various ecosystems compared with the measured soil water parameters in each site, and (3) this index can be calculated with site-level data and had higher temporal-spatial resolutions than remote sensing data. We calculated ET by dividing latent heat flux (LE) obtained from the FLUXNET dataset by the latent heat of vaporization λ (∼2.5 MJ kg–1). Half-hourly PET was computed by the modified Penman–Monteith formulation by the Food and Agriculture Organization (FAO) (Allen et al 1998, Monteith and Unsworth 2013) as follows:
where Ta is the air temperature (°C), and H and LE are the sensible heat and latent heat flux (MJ m−2), respectively. To avoid the energy non-closure issue, we replaced the difference between net radiation (Rn) and surface heat flux (G) with the sum of LE and H as the available energy flux (Barr et al 2001).
ESI was estimated as follows (Otkin et al 2015):
where the first term in the numerator represents the ratio of actual ET to potential ET (i.e., ET/PET) for a given timestep (w) and year (y) at each site, the second term is the average value of V for w across all years, and σ(w) is the standard deviation of V. In this study, the anomalies for GPP and Gc were expressed as z-scores (i.e., standardized anomalies), normalized to a mean of 0 and a standard deviation of 1. All biophysical parameters were calculated only in the non-rainy periods.
2.4. Statistical analysis
We used the path analysis to examine the relative importance of biophysical variables in regulating GPP during the 'hot days'. The path analysis is a general diagram of multiple regression that allows consideration of complicated causal relationships (Jeon 2015) and has been widely applied to quantify the direct and indirect effects of interactive biophysical factors on ecosystem functions (Shao et al 2016, Xu et al 2018). The path analysis can decompose the correlation into a direct effect (i.e., a direct path from one to another) and indirect effects (i.e., the paths through intermediate variables) through carrying out repeated multiple regression analyses on appropriate subsets of variables (Jeon 2015). We built the initial path network using AMOS (version 21.0, IBM SPSS, Chicago, Illinois), which included all potential paths based on the following well-accepted relationships: (1) three environmental variables, including solar shortwave radiation (Rg), Ta and ESI, can affect GPP directly (Niu et al 2012, Wang et al 2014); (2) Ta, VPD, ESI and Rg may indirectly affect GPP by regulating Gc (Zhang et al 2016); (3) the biological element (i.e., Gc) is closely related to GPP by directly regulating intracellular CO2 (Rambal et al 2003); and (4) Ta is linked with atmospheric transpiration demand (i.e., VPD) and ecosystem soil water condition (i.e., ESI). The maximum likelihood method and standardized daily data were used for estimating the standardized path coefficients (ρ) that are the standardized regression weights from the multiple regressions (Shipley 2016). To simplify the final model structure, we only retained the statistically significant paths with the absolute value of ρ on a given path > 0.1. The total ρ from one variable to another was the sum of the direct path coefficient and the indirect path coefficient. All regression curves were fitted within the SigmaPlot (version 12.5, Systat Software, Inc., San Jose, California) and statistically assessed at a significance level of 0.05.
3. Results
3.1. Effects of heatwaves on GPP across ecosystems
Although heatwave events significantly affected GPP for all ecosystems, the direction and magnitude of the effects varied with ecosystem type and plant functional type (figures 1 and 2). For the forests, the daily average GPP anomalies (i.e., the z-scores of GPP) caused by heatwaves ranged from −0.30 ± 0.15 (± standard error) to −0.45 ± 0.17 (figure 1). The daily mean z score of GPP was −1.16 ± 0.09 and −0.84 ± 0.15 during heatwaves for IT-Noe and US-Whs, respectively. Interestingly, heatwaves posed the opposite effect in the herbaceous ecosystems (i.e., grasslands and croplands) (figure 1). Specifically, the photosynthesis for C3 herbaceous ecosystems was depressed during heatwaves, while the extremely high temperatures could enhance GPP of C4 ecosystems (i.e., US-Ne3 and US-SRG), with an averaged z score of 0.20 ± 0.11 and 0.11 ± 0.10, respectively. It is worth noting that GPP was reduced after heatwaves for all ecosystems (figure 2). Even though the changes in daily GPP anomalies after the occurrence of heatwaves showed parabolic patterns in all ecosystems, the magnitude of the drop in GPP anomaly (i.e., resistance) and the time of recovering to the normal state (i.e., resilience) were different among ecosystems. Daily GPP anomalies for the forests represented smaller fluctuations than that of other ecosystems and returned to normal in about 20 d (figure 2(a)). A more notable decrease in daily GPP was found during heatwaves for the shrublands despite a rapid recovery (figure 2(b)). For the grasslands and croplands, the GPP anomaly dramatically declined after 10 d since the occurrence of heatwaves and a longer recovery time (i.e., >30 d) was required (figure 2(c)).
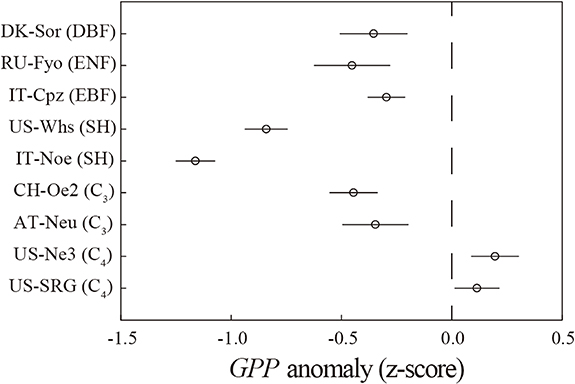
Figure 1. Averaged daily GPP anomaly (z-score) during heatwaves in the nine ecosystems. The error bars stand for standard errors.
Download figure:
Standard image High-resolution image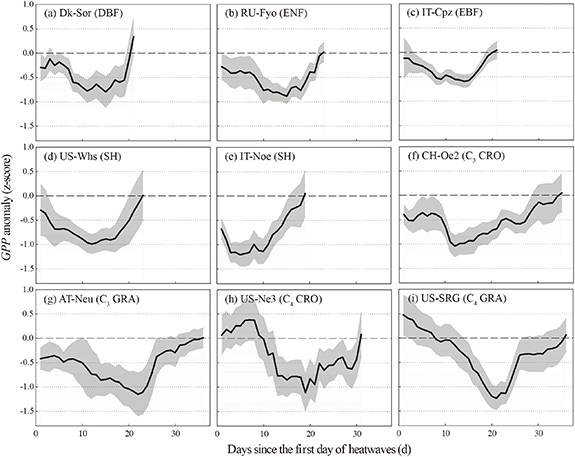
Figure 2. The variations (5 d moving average) of daily GPP anomaly (z-score) since the first day of heatwaves in the nine ecosystems. The gray shades are the 5 d moving averages of standard errors. The duration of all heatwave events ranged from 7 d to 13 d.
Download figure:
Standard image High-resolution image3.2. Direct and indirect biophysical effects on GPP in 'hot-days'
The direct and indirect regulations of biophysical factors on ecosystem photosynthesis in 'hot-days' were also different among different ecosystems (figure 3). Rg was the most important controlling factor of forest GPP (ρ = 0.38–0.49), while Gc was the dominant one in the shrublands. For the forests and shrublands, the rise of Ta significantly depressed GPP primarily by decreasing Gc rather than affecting photosynthetic carbon metabolism processes (i.e.,, direct effect) and soil water condition (i.e., ESI) during the high-temperature conditions. Besides, a significant and negative relationship between GPP and Ta was found in the two shrublands. There was a positive relationship between GPP and ESI (i.e., ρ > 0) for all ecosystems. On one hand, ecosystem photosynthesis was directly inhibited by the reduction of soil water content. On the other hand, decreasing ESI depressed GPP by restraining Gc (ρ = 0.09–0.55) indirectly. ESI was the most significant variable for GPP at the C3 grassland and C3 cropland sites, with a total effect (i.e., the sum of direct effect and indirect effect) of 0.50 and 0.40, respectively. In contrast, Gc was a chief regulatory factor for the photosynthesis of the C4 ecosystems. The direct and positive effect of Ta on Gc was only observed for the C4 ecosystems, with a standardized path coefficient of 0.31 and 0.27 for the C4 grassland and C4 cropland, respectively.
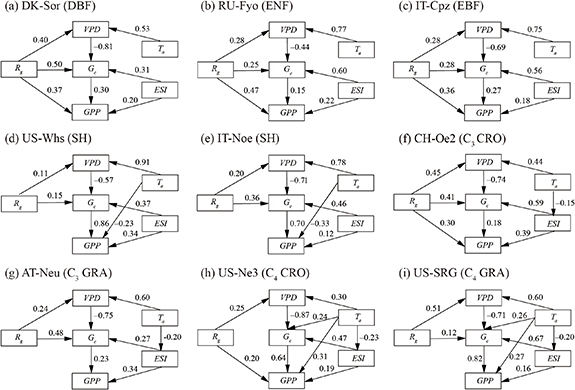
Figure 3. The direct and indirect effects of biophysical variables on gross primary production (GPP) in 'hot-days' for the different ecosystems. Standardized path coefficients (ρ:−1 to 1) were presented along with the path arrows, where ρ < 0 and ρ > 0 denote negative and positive correlation, respectively. The goodness of fit index (GFI) and root mean square error of approximation (RMSEA) were > 0.80 and < 0.06 for all path models, respectively. VPD, vapor pressure deficit; Ta, air temperature; Rg, solar shortwave radiation; ESI, evaporative stress index; Gc, canopy stomatal conductance.
Download figure:
Standard image High-resolution image3.3. Ecosystem water use strategy during heatwaves
The discrepancy in the z-scores of GPP during heatwaves across the nine ecosystems was significantly regulated by ESI, which indicated that soil water condition was crucial for the ecosystem function under the extreme temperature events (figure 4). The decrease in diurnal GPP was observed for the forest sites, and a larger decrease occurred in the afternoon than in the morning. Correspondingly, the diurnal variations of ET and Gc anomaly in the forests also showed the asymmetric trends, indicating that forests might be more sensitive to heatwaves in the afternoon (figures 5 and S1 (stacks.iop.org/ERL/15/074027/mmedia)). These asymmetric variations were not found in other ecosystems. Notably, the woody ecosystems (i.e., forest and shrubland) showed a reduction of ET during heatwaves, while an increase was found in the herbaceous ecosystems. The Gc anomalies remarkably declined and maintained the negative values during the daytime (i.e., Rg > 100 W m−2) for the woody ecosystems (figures 5 and S1). However, the Gc anomalies of the herbaceous ecosystems exhibited a relatively small range during heatwaves.
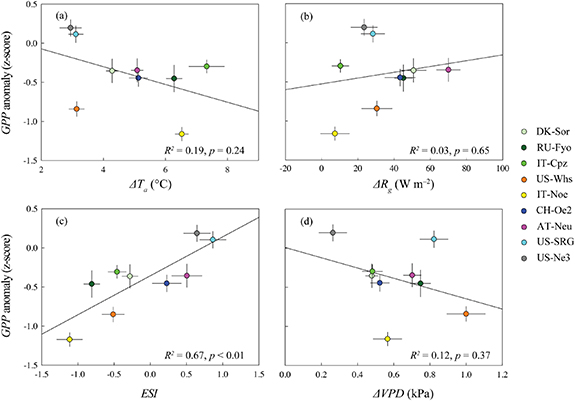
Figure 4. Correlations between the mean daily GPP anomaly (z-score) and the changes in air temperature (ΔTa) (a), solar radiation (ΔRg) (b), soil water content (ESI), and vapor pressure deficit (ΔVPD) during heatwaves compared with the multi-year averages across the nine ecosystems. The horizontal and vertical bars stand for standard errors.
Download figure:
Standard image High-resolution image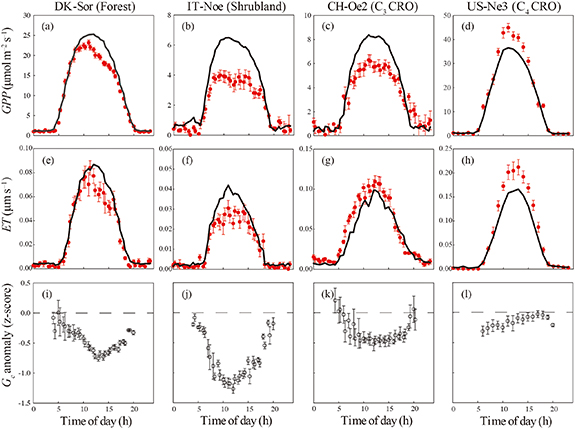
Figure 5. Diurnal course of average gross primary production (GPP), evapotranspiration (ET), and canopy stomatal conductance (Gc) anomaly (z-score) for the four ecosystems (DK-Sor, IT-Noe, CH-Oe2, and US-Ne3) during the selected heatwaves. The black lines indicated the multi-year mean diurnal variation of GPP and ET during the same periods. For Gc anomaly (z-score), only the daytime (Rg > 100 W m−2) values are plotted, and the error bars represent standard errors.
Download figure:
Standard image High-resolution image4. Discussion
4.1. Effects of heatwaves on GPP
Heatwaves place plants into the high-temperature stress and high evaporative demand (i.e., VPD) conditions; subsequently, plant evaporative demand exceeds water supply, and vegetation water stress may occur even though the heatwaves have passed (Allen et al 2010, Bauweraerts et al 2014, Herold et al 2016, De Boeck et al 2016). Therefore, the impacts of heatwaves on GPP include the effects during heatwaves and after heatwaves (i.e., post-effect). The effects of heatwave events on ecosystem GPP varied by ecosystem type and plant functional type. During the heatwave periods, GPP depressed for the forests and shrublands. On one hand, plants tended to close the stomata owing to the increased VPD and deprived soil water during heatwaves, which decreased the photosynthetic materials (e.g., water and intracellular CO2) (De Boeck et al 2010, Teskey et al 2015). On the other hand, heatwaves could directly decrease GPP through depressing photosynthetic carbon metabolism (Ciais et al 2005, Mazdiyasni and Aghakouchak 2015). Compared with C3 herbaceous ecosystems, the photosynthesis of the C4 herbaceous ecosystems was enhanced during the heatwaves, while Gc did not show a significant decline. C4 plants could efficiently photosynthesize at high-temperature conditions on account of the phosphoenolpyruvate carboxylase (PEP-C) system that is insensitive to the rise in temperature (Dwyer et al 2007, Sage and Kubien 2007). Besides, high temperatures can boost the catalytic rate of C4 plants, which benefits ecosystem GPP (Kubien 2003, Dwyer et al 2007).
Moreover, the post-effects are also vital to evaluate the impacts of heatwaves on ecosystem GPP comprehensively (Frank et al 2015, Qu et al 2018). GPP anomaly significantly dropped to the negative values and then gradually recovered after heatwaves for all ecosystems, which indicated that the effects of heatwaves on GPP were not limited to the duration of the heatwaves. Although the ecosystems showed different resistance and resilience to heatwaves, GPP eventually recovered to the normal state, which suggested that irreversible damage associated with the heatwave events did not happen. Natural forests with deep and strong roots, in general, can obtain more groundwater from the deeper soil and are likely less strongly affected by heatwaves and short-term drought stress (Teuling et al 2010). Besides, photosynthesis may not significantly decline under short-term extreme high temperatures owing to increasing electron transport capacity and synthesizing heat-stable Rubisco activase (Sage and Kubien 2007, Sage et al 2008, Teskey et al 2015). Compared with forest ecosystems, the shrublands showed a larger decrease in GPP despite a fast recovery, indicating that shrublands had a weak resistance to heatwaves. Although the resistance of the herbaceous ecosystems to heatwaves was similar to that of shrublands, the herbaceous ecosystems had a longer recovery. A similar finding was also reported in central-western Europe and a meadow steppe in northeastern China (Reichstein et al 2007, Qu et al 2016). The lagged impacts of heatwaves on GPP did not last to the next year for the nine ecosystems. A rational explanation is that the growth of below-ground biomass (e.g., roots) is less sensitive to the short-term extreme temperatures compared with the above-ground production (Kahmen et al 2005, De Boeck et al 2011).
4.2. Biophysical regulations on GPP under high-temperature conditions
Understanding the biophysical regulatory mechanisms and underlying processes of different ecosystems exposed to extremely high temperatures is essential for accurately assessing terrestrial carbon dynamics and informing ecosystem management in the context of climate change (Allen et al 2010, Teskey et al 2015). Heatwaves induce the sudden rise of temperature and the variations of other biophysical factors that impose direct and indirect effects on ecosystem GPP (Siebers et al 2015, Frank et al 2015). Our path analysis results showed that the rise of Ta reduced photosynthesis for forests mainly through inducing stomatal closure (i.e., indirect effect). By contrast, Ta not only indirectly regulated GPP via stomatal aperture but also directly influenced other physiological processes (e.g., photosynthetic carbon metabolism and enzyme activity) for the shrublands (Taiz et al 2010, Siebers et al 2015). Moreover, for the three forest ecosystems, Rg played a decisive positive role in regulating GPP by directly providing the photosynthetic energy and indirectly increasing intercellular CO2 concentrations by stimulating stomatal openness (Farquhar and Sharkey 1982). However, GPP was primarily regulated by Gc for the shrublands with a relatively weak relationship between Rg and GPP. In this study, we found that heatwaves were typically accompanied by the increase in Rg which was consistent with the previous results (Reichstein et al 2007, De Boeck et al 2010). The increasing Rg during heatwaves could alleviate the negative role of heatwaves in regulating GPP, especially for forest ecosystems. Consequently, the shrublands exhibited a larger decrease in GPP than the forest ecosystems during heatwaves.
The distinct responses of plant photosynthesis to extreme climate events between different plant functional types (e.g., C3 and C4) have been documented (Diaz and Cabido 1997, Nayyar and Gupta 2006). We found that ESI was the dominant controlling factor of GPP for the C3 herbaceous ecosystems, while the C4 ecosystem GPP was mainly regulated by Gc during the high-temperature conditions. Typically, the photosynthetic efficiency of C4 plants was strikingly promoted owing to the increase in Rubisco activity under high-temperature conditions, which resulted in the higher sensitivity of GPP to the amount of photosynthetic material (i.e., intracellular CO2) that was tightly regulated by the variations in Gc (Berry and Bjorkman 1980, Dwyer et al 2007, Morison and Gifford 1983). Furthermore, photosynthesis for C4 plants is less sensitive to environmental variations than C3 species owing to the characteristics of additional biochemical processes, two cell types, and the chloroplast position within bundle sheath cells (Kubien 2003, Sage and Mckown 2006). Moreover, the increase in Ta, significantly and directly, increased Gc merely for the C4 ecosystems. In most cases, plants experiencing high temperatures tend to reduce water loss and protect the hydraulic system by closing stoma (Xu and Baldocchi 2003); however, the extremely high temperatures may cause leaf tissue injury (Berry and Bjorkman 1980). An adaptive mechanism that plants can increase the stomatal aperture and transpiration for cooling leaf surface temperature and avoiding leaf burn during heat stress has been reported for several species (Ameye et al 2012, Urban et al 2017, Drake et al 2018). Likewise, we found this regulatory mechanism in two C4 ecosystems because C4 plants have evolved to adapt to high light intensities and moderately high temperatures (Crafts-Brandner and Salvucci 2002, Gowik and Westhoff 2010).
4.3. Implications
Water use strategy is crucial for conserving soil water and maintaining ecosystem functions when an ecosystem suffers from a heatwave (Novick et al 2016, Hochberg et al 2018). ESI was the primary variable responsible for GPP anomaly across the nine ecosystems. Many studies also proved that drought accompanied by the high temperatures was the main reason for the decline in plant production (Reichstein et al 2007, Allen et al 2010, Bauweraerts et al 2014). However, it is important to consider not only the changes in ecosystem functions during heatwaves but also the more severe lasting impacts caused by water stress after heatwaves (Teskey et al 2015, Qu et al 2018). During heatwaves, ET was greater than the multi-year average in the herbaceous ecosystems. Correspondingly, the decrease in Gc anomaly was larger in the woody ecosystems than in the herbaceous ecosystems during heatwaves. Herbaceous ecosystems could consume more water via soil evaporation and plant transpiration due to weak canopy stomatal regulation on the water loss during heatwaves, resulting in more severe water stress afterwards (figure 6). Although increased ET and the weak stomatal control can maintain ecosystem photosynthesis during heatwaves to some extent, the insensitive change in Gc might put plants at the risk of hydraulic failure after a heatwave or during a heatwave event with a longer duration (Teskey et al 2015, Drake et al 2018). In this study, a significant decrease in the z-scores of GPP was found after heatwaves (i.e., around 10 d since the occurrence of heatwaves) in herbaceous ecosystems, especially in C4 ecosystems, which confirmed that excessive water consumption during heatwaves could lead to more severe post-effects on the ecosystem function. Therefore, herbaceous ecosystems are more vulnerable to heatwaves owing to the water stress afterwards. Moreover, the asymmetric diurnal variations of GPP and ET during heatwaves were observed at forest sites, and there was no noticeable decline in the morning due to the xylem refilling and high water storage capacity (Hacke 2002, Laur and Hacke 2014). Forests initially utilized water stored in the xylem for maintaining stomatal openness and photosynthesis during a day, which accounts for 10%–25% of the total daily transpiration (Schulze et al 1985, Loustau et al 1996). Many studies have presented the evidence for the dynamic change in xylem hydraulic conductivity of tall woody plants, which can lift soil water and replenish internal water via xylem refilling, particularly at night (Goldstein et al 1998, Brodribb and Holbrook 2004, Westhoff et al 2009).

Figure 6. The mean evaporative stress index (ESI) during heatwaves and post-periods (i.e., 5 d after heatwaves) in the nine ecosystems. The error bars are standard errors.
Download figure:
Standard image High-resolution image
5. Conclusions
The impacts of heatwaves on ecosystem GPP varied by ecosystem type and plant functional type. GPP was depressed for most ecosystems during heatwaves while it was enhanced for C4 ecosystems. ESI was the primary variable for the discrepancy in GPP anomaly during heatwaves across the nine ecosystems. Furthermore, the decline in GPP of forest ecosystems caused by heatwaves was smaller than that of other ecosystems, and the forests recovered rapidly afterwards, which indicated that forests had higher stability than other ecosystems. In addition, the diurnal pattern of GPP was asymmetric during heatwaves in forest ecosystems, and GPP was limited mainly in the afternoon. We found intriguingly that the promoted Gc might be the biological regulating mechanism for C4 ecosystems to avoid leaf burn and tissue damage under the extremely high-temperature events. Although herbaceous ecosystems could maintain GPP and ET during heatwaves to some extent, a larger decrease in GPP was caused by water stress after heatwaves.
Acknowledgments
This study was supported by the National Natural Science Foundation of China (Grant No. 31872711), the Beijing Municipal Commission of Education (Innovative Transdisciplinary Program of Ecological Restoration Engineering), University of New Hampshire, and the China Scholarship Council. We greatly appreciate the two reviewers for their constructive and insightful comments and Zuosinan Chen for providing valuable suggestions.Special thanks to the data providers of the study sites from the FLUXNET community.
Author contributions
J. Xiao, H. Xu, and Z. Zhang designed the research. H. Xu and J. Xiao conducted the analysis. H. Xu, J. Xiao, and Z. Zhang interpreted the results and wrote the paper.
Data availability statement
The data that support the findings of this study are available from the authors upon reasonable request.