Impacts of Regional Groundwater Flow and River Fluctuation on Floodplain Wetlands in the Middle Reach of the Yellow River

1
Key Laboratory of Shale Gas and Geoengineering, Institute of Geology and Geophysics, Chinese Academy of Sciences, Beijing 100029, China
2
College of Earth and Planetary Sciences, University of Chinese Academy of Sciences, Beijing 100049, China
3
Innovation Academy for Earth Science, Chinese Academy of Sciences, Beijing 100029, China
4
School of Earth Sciences and Engineering, Nanjing University, Nanjing 210023, China
5
Key Laboratory of Cenozoic Geology and Environment, Institute of Geology and Geophysics, Chinese Academy of Sciences, Beijing 100029, China
*
Author to whom correspondence should be addressed.
Water 2020, 12(7), 1922; https://doi.org/10.3390/w12071922
Submission received: 27 May 2020
/
Revised: 26 June 2020
/
Accepted: 28 June 2020
/
Published: 6 July 2020
(This article belongs to the Section Hydrology)
Abstract
:Floodplain wetlands are of great importance in the entire river and floodplain ecosystems. Understanding the hydrological processes of floodplain wetlands is fundamental to study the changes in wetlands caused by climate change and human activities. In this study, floodplain wetlands along the middle reach of the Yellow River were selected as a study area. The hydrological processes and the interactions between the river and the underlying aquifer were investigated by combining remote sensing, hydraulic monitoring, and numerical modeling. Wetland areas from 2014 to 2019 were extracted from Landsat 8 remote sensing images, and their correlation with the river runoff was analyzed. The results indicate that the river flow had a limited impact on the wetland size and so did groundwater levels, due to the strong reliance of wetland vegetation on water levels. Based on hydrological and hydrogeological conditions, a surface water–groundwater coupled numerical model was established. The comparison and correlation analysis between the monitored groundwater head and the simulated river stage also show that river flow did not play a first-order role in controlling the groundwater levels of wetlands in the study area. The simulation results also suggest that it is the regional groundwater flow that mainly sustains shallow groundwater of floodplain wetlands in the study area. The floodplain wetland of the study area was dynamic zones between the regional groundwater and river, the contrasting pattern of hydrological regimes on both banks of the Yellow River was due to a combination of regional groundwater flow and topography.
1. Introduction
Wetlands play a vital role in sustaining global ecosystems for their significant contribution to biodiversity support, water quality improvement, flood abatement and carbon sequestrations [1,2]. Over the last decade, wetland coverage has continued to shrink [3,4], leading to widespread concern about changes in the wetland area, vegetation, and water quantity [5,6,7,8]. Understanding hydrological processes is of great importance to study mechanisms driving wetland changes, which is essential for protecting such fragile ecosystems. Floodplain wetlands, as one type of wetlands, occupy nearly one third of the global wetland area and provide far more ecosystem services than the relatively small area [4]. The floodplain wetlands have been regarded as one of the most concerned wetland types for its unique and highly complex hydrological process.
The high complexity of the hydrological process for floodplain wetlands is mainly due to complicated and heterogeneous hydraulic connectivity with adjacent water bodies such as rivers and underlying aquifers [9,10]. Previous studies have proposed the flood pulse concept and pointed out that periodic river flooding is a fundamental force driving the changes in floodplain wetland systems [11,12]. Since then, the majority of published papers have focused on the hydraulic connectivity between rivers and wetlands, including the river’s response to flood pulse and its important influence on water as well as the nutrient cycle of floodplain wetland [13,14]. For example, extensive studies have revealed that rivers are the main factor in promoting the exchange of sediments and nutrients, and a major source of water for floodplain wetland [15,16,17,18,19].
Groundwater also plays a significant role in maintaining the health of floodplain wetlands [20]. Shallow aquifer is of great importance for its direct interaction with rivers, and has been found to contribute significant water to wetlands by storing water from rivers in flood seasons [21,22,23,24,25,26,27]. Moreover, evidence accumulated from monitoring data, as well as numerical models, suggest that regional groundwater flow may also exert strong control upon the hydrological process of floodplain wetlands, particularly when the wetlands are underlain by highly permeable aquifers, such as chalk [28,29], or located in groundwater discharge zones [30]. Thus, regional groundwater flow plays a significant role in wetland nutrient status and vegetation distribution [28,29,30,31,32,33,34,35]. Despite the existing studies, how regional groundwater flow affects floodplain wetlands is far from clear. Research is warranted to assess how regional groundwater flow affects floodplain wetlands where the underlying shallow aquifer and the adjacent river interact frequently.
Due to the complexity of hydrological processes in floodplain wetlands, investigating the interactions of river, wetland, and groundwater through field observations alone is often difficult. Therefore, extensive wetland studies have employed numerical simulations instead. Simulations of hydrological processes within fully integrated or coupled groundwater–surface water models have been applied to explore hydrological regimes in wetlands [29,36,37,38]. However, the studies that simply relied on models are less capable of relating model results to varied patterns of wetlands. In this regard, remote sensing images were introduced by studies to analyze the hydrological regimes in floodplains for their direct display of changes in wetlands [6,7]. Therefore, a more comprehensive understanding of the site’s hydrological functioning may be obtained through the combined application of multiple methods.
In this paper, we attempted to examine how regional groundwater flow and river stage changes affect floodplain wetlands. Wetlands along the middle reach of the Yellow River, typical of floodplain wetlands, were selected as the study area. Multiple methods, including remote sensing, hydrological observation and numerical modeling were used to perform this study. Wetland area was first extracted from remote sensing images between 2014 and 2019, then changes in the wetland area with river fluctuation were discussed to understand the connectivity between the wetlands and the adjacent river. Moreover, the measured groundwater heads and river stages at three transects were compared and their correlations were analyzed to infer the connectivity between the shallow groundwater underlying the wetlands and the river. Afterward, a coupled river–groundwater numerical model was established to examine the hydrological processes in relation to the wetlands at three transects.
2. Study Area
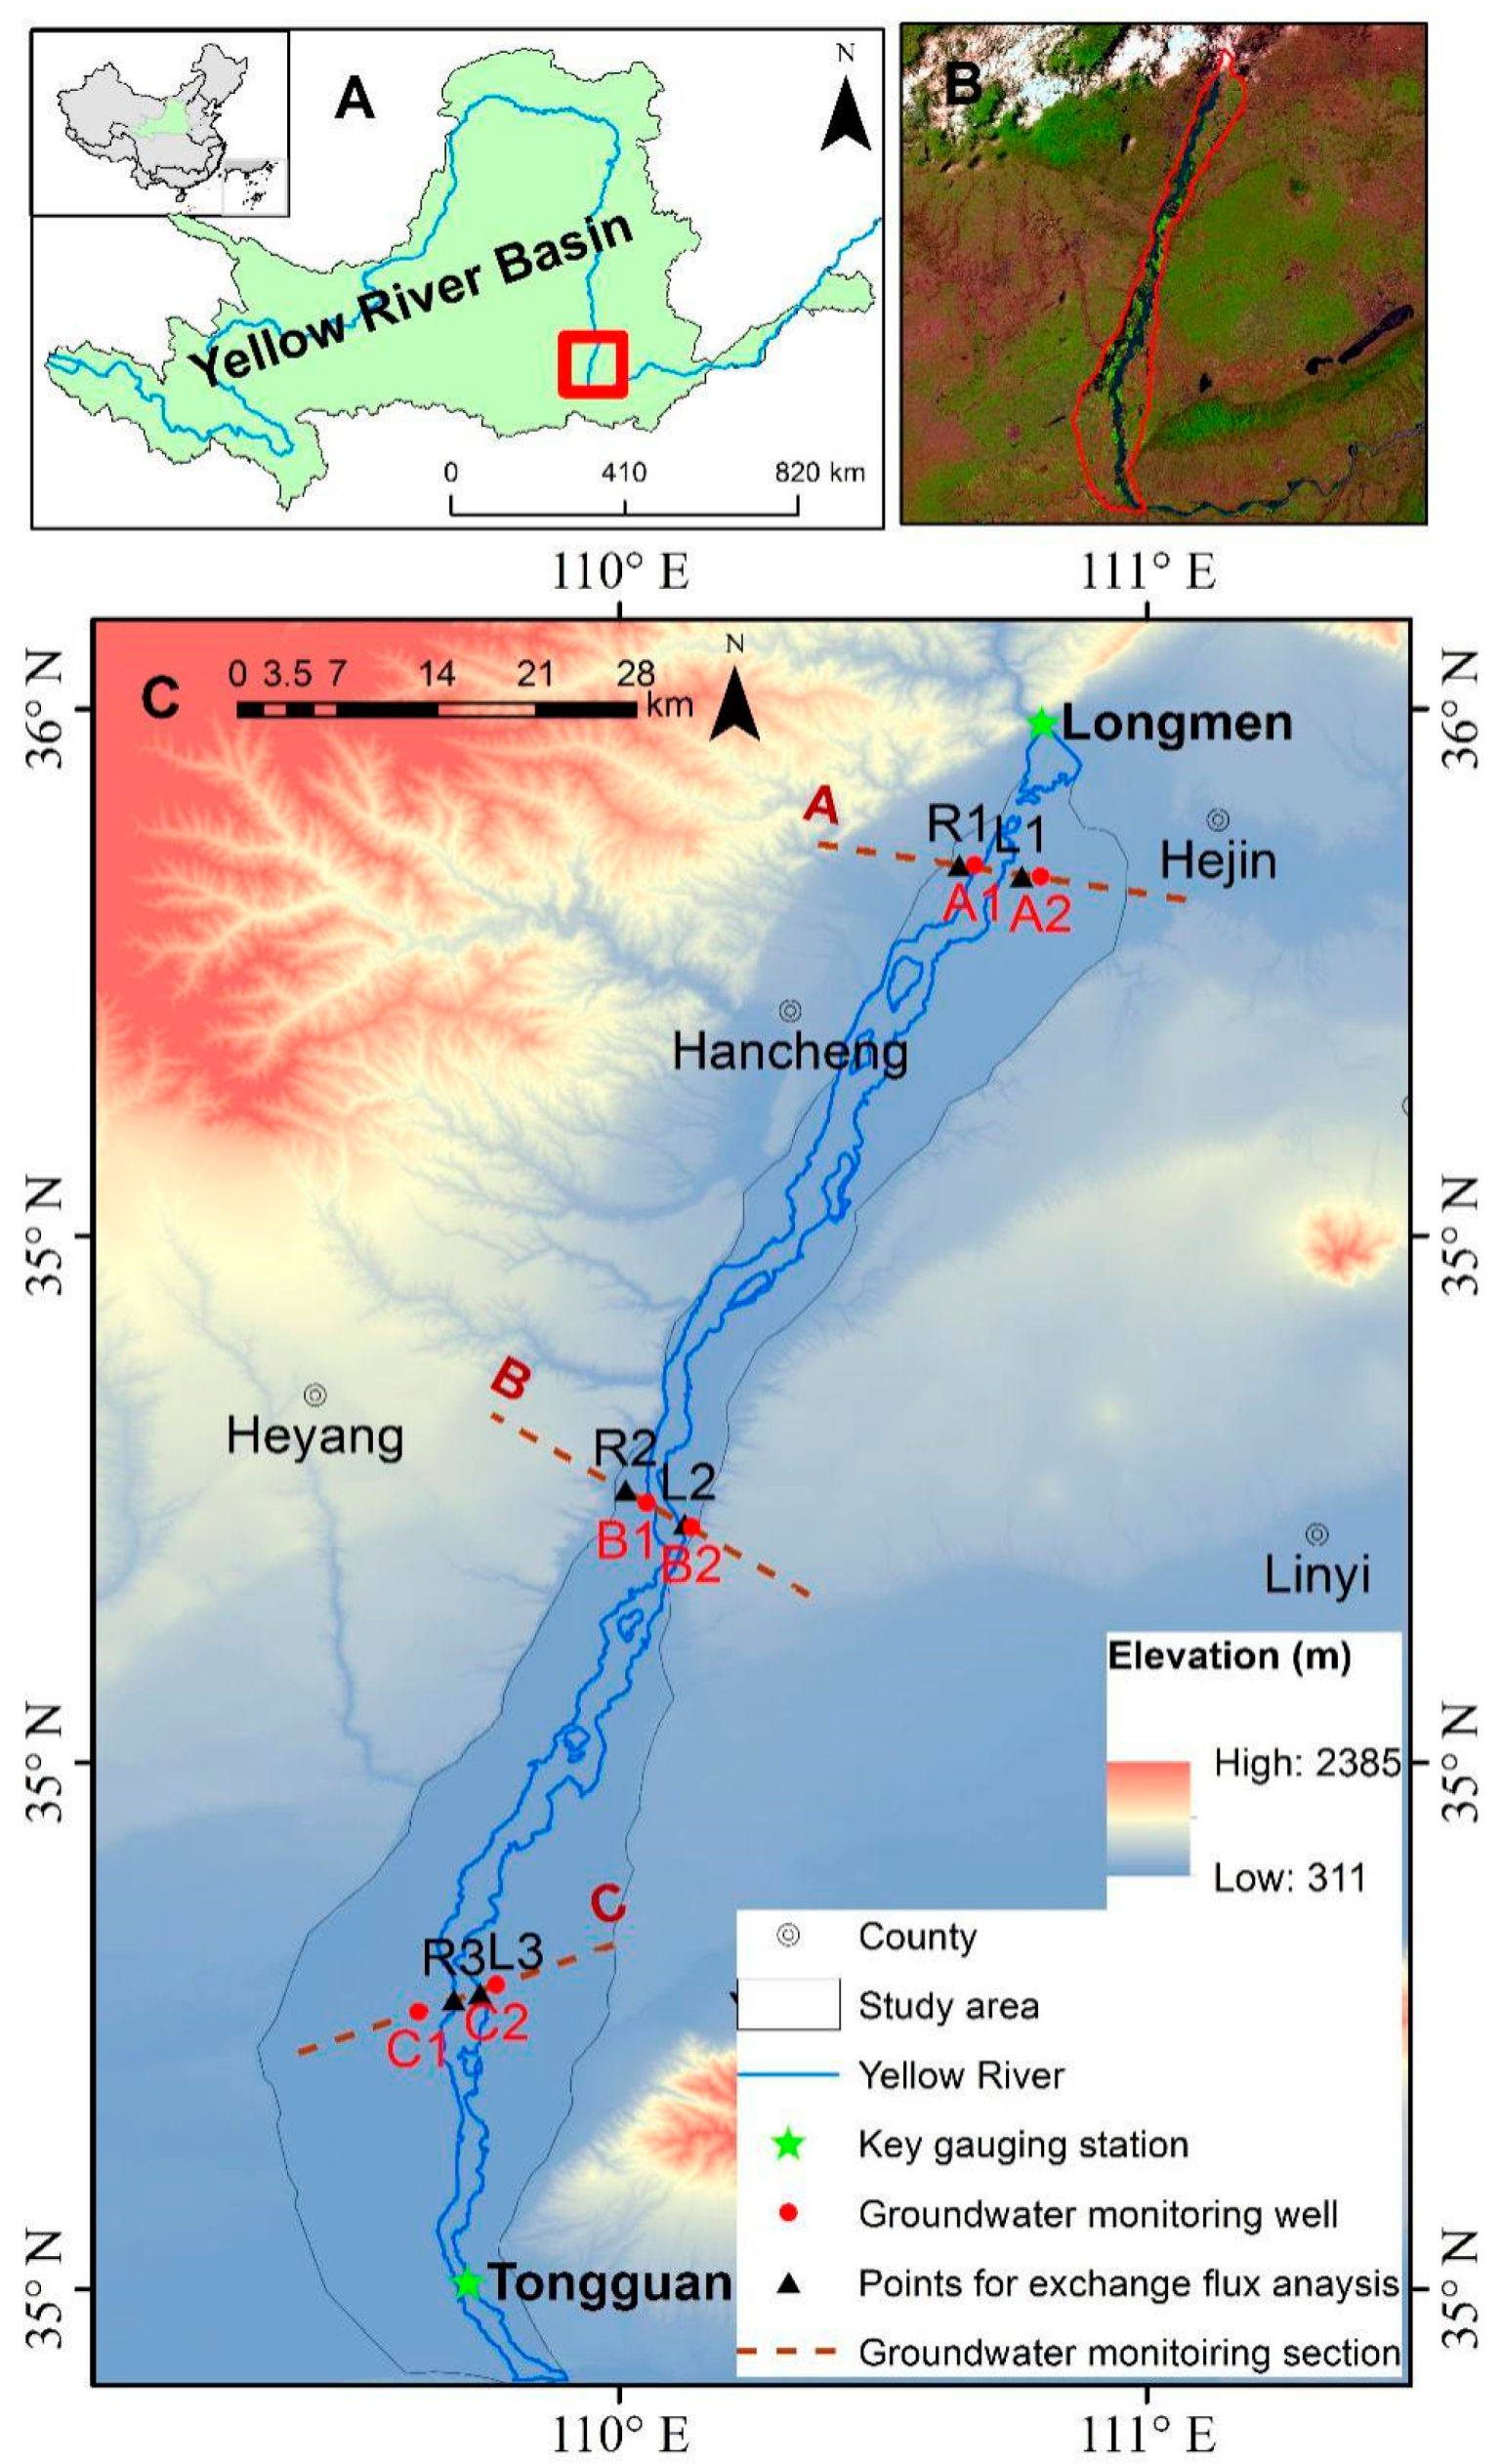
Wetlands along the middle reach of the Yellow River were chosen as our study area (Figure 1). These wetlands are protected and identified as nature reserves, which cover an area of about 1442 km2 [39]. The river that runs through the reserves is about 384.5 km in length, with the Longmen and Tongguan gauging stations as the upstream and downstream ends, respectively. Approximately 40% of the wetlands are located on the right bank of the river and belong to the Shaanxi Yellow River Wetland Provincial Natural Reserve (SWPNR), whereas the others are situated on the left and regulated by the Shanxi Yuncheng Wetland Provincial Natural Reserve (YWPNR). These two reserves serve as important habitats for migratory birds in the central and western regions of China. These wetlands consist of mainly permanent river wetlands and floodplain wetlands (riverine wetlands cover 74.78% of the total area). However, these wetlands are not connected to the river directly due to constructed dikes.
2.1. Hydrology and Meteorology
According to historical records, the mean annual runoff of the Yellow River at the Longmen gauging station is 1060 m3/s, with the maximum runoff at 21,000 m3/s and the minimum runoff at 53.2 m3/s. There have been 25 floods (≥10,000 m3/s) since 1950, most of which occurred in July or September [40,41]. The river width increased from several hundred meters to several kilometers during these floods. However, the wetlands were not widely inundated by floods due to the constructed dikes.
The mean annual precipitation for the SWPNR on the right bank is around 545 mm, and approximately 51.6% of the precipitation occurs during summer. In comparison, the mean annual precipitation for the YWPNR is around 635 mm. The mean annual potential evapotranspiration of the entire study area is estimated at 1200 mm.
2.2. Geology and Hydrogeology
Quaternary strata cover the entire study area near the land surface. The Quaternary stratum is mainly composed of fine sand, a mixture of fine and medium sand to a mixture of fine sand and clay. On the right bank of the Yellow River, the Quaternary stratum is underlain by the Cambrian–Ordovician carbonate rocks [42]. On the left bank of the Yellow River, the Quaternary stratum overlies the Cambrian–Ordovician carbonate rocks in the north and Archaean metamorphic rocks in the south [43,44].
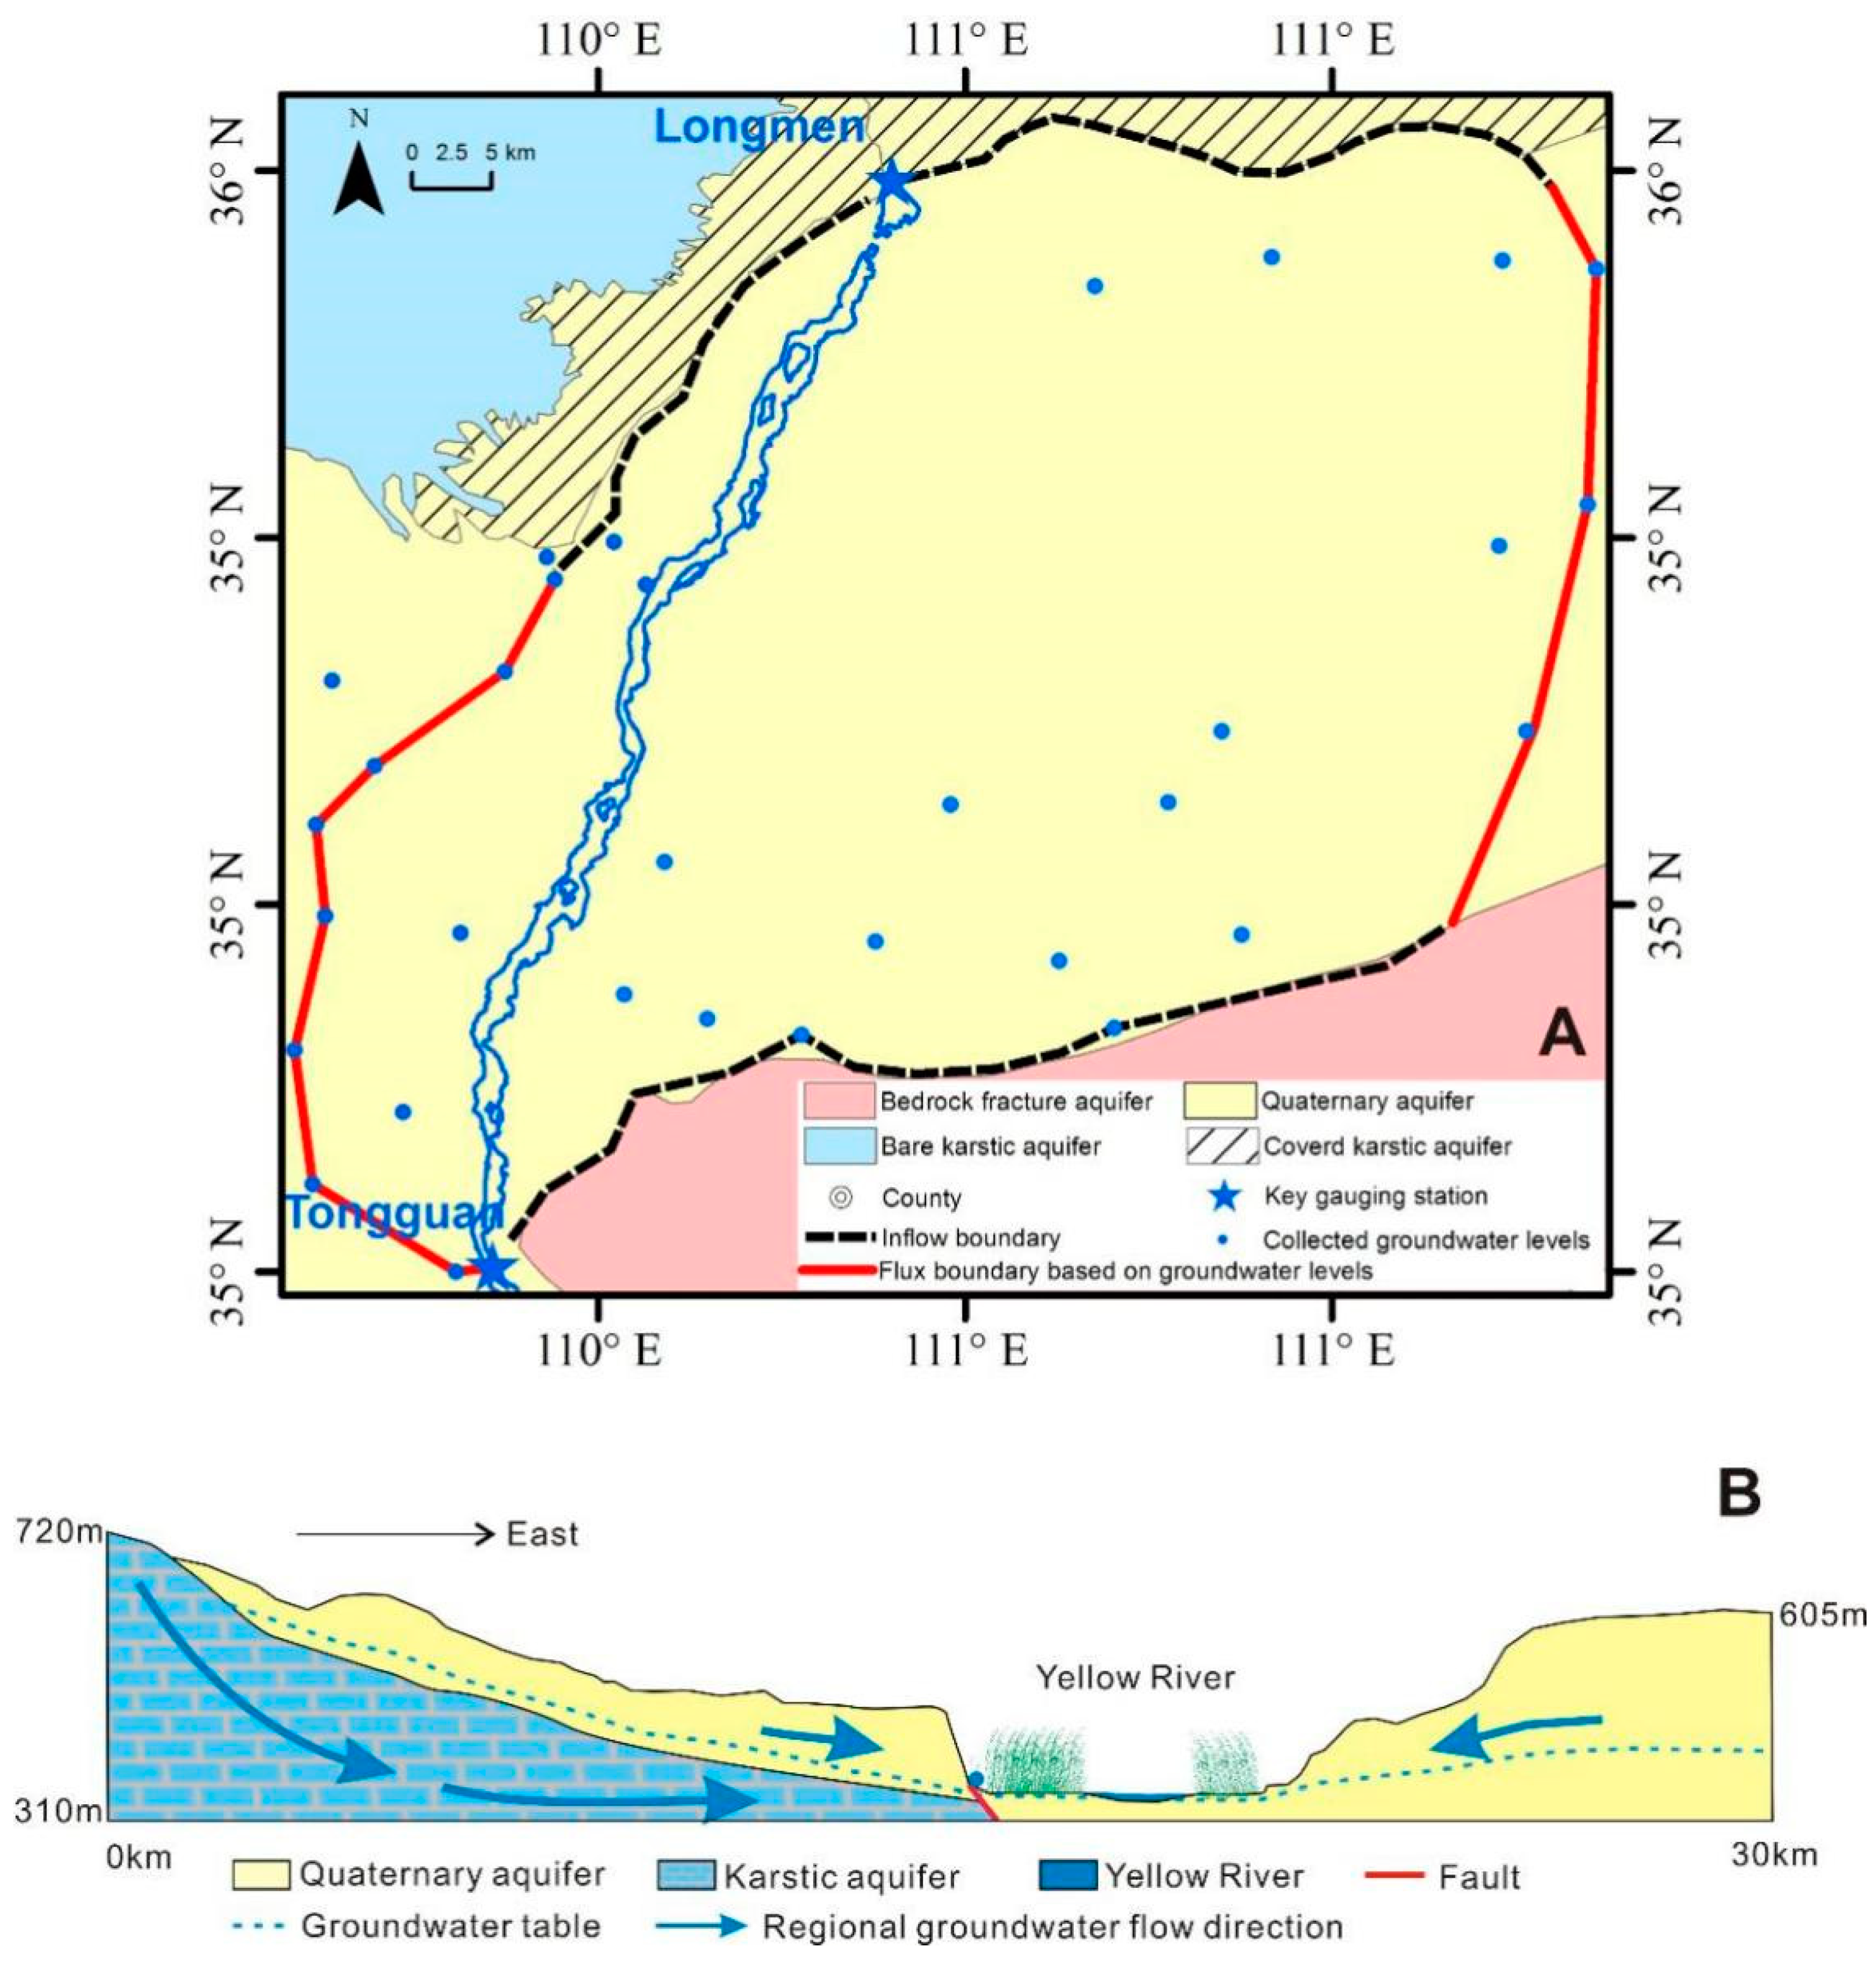
Groundwater in the study area can be divided into two types: Quaternary pore water that is mainly distributed in the loose deposits near the surface, and karstic water within the underlying Cambrian–Ordovician carbonate rocks. The Quaternary aquifer has a thickness from 60 m to 150 m for the right bank [42,45] and a thickness from 300 to 500 m for the left bank of Yellow River [43,46,47], respectively. Regional groundwater flow in the Quaternary aquifer is directed from northwest to southeast on the right bank and from northeast to southwest on the left, respectively, primarily driven by the topography. The Quaternary aquifer is recharged mainly by precipitation infiltration, lateral flow or upward leakage from the underlying aquifers, and episodic recharge from the Yellow River during flooding. Groundwater discharge occurs in the form of evaporation, springs, and lateral outflow to the Yellow River.
Karstic water exists within structural and corrosive fissures of the Ordovician carbonate rocks with a thickness of up to 1000 m [42,48]. In the northwest of the study area, the karstic stratum is outcropped at the ground surface due to high elevation and receives precipitation directly as groundwater recharge through sinkholes. In other parts of the study area, the karstic aquifer is mostly covered by the Quaternary sediments. For the right bank of the Yellow River, the regional groundwater flow in the karstic aquifer is from northwest to southeast. The discharge of the karstic groundwater is thought to be springs (upward flow) in the Shaanxi Yellow River wetlands (e.g., the Virgin Spring or the Fen Spring).
3. Method
3.1. Remote Sensing and In-Situ Monitoring
In this study, 12 periods (a total of 24 images) of Landsat 8 images from 2014 to 2019 were collected from the websites of the United States Geological Survey (USGS) (http://glovis.usgs.gov/). Two periods of each year were selected to analyze the change of wetlands area: February or March representing dry seasons, and July representing wet seasons. Pre-processing steps (including Geometric correction and radiance calibration) were conducted in ENVI 5.3 to acquire the atmospherically corrected data. After three-band red-green-blue images were stacked in each image, two sensed images in each period were mosaicked to obtain specific images of the study area. Then, each period’s wetland area was extracted from the images by classification combining the field investigation and maximum likelihood classifier. In the field investigation, 94 samples were collected, which were used as training data to perform the classification. The overall classification accuracy was greater than 90%.
In order to obtain groundwater head underneath the wetlands, three transects (A, B, C) were set up with a total of six monitoring wells. Each transect has two monitoring wells, which were separately located on the different bank of the river. The groundwater head was monitored daily and the monitoring time started on the 16 July 2018 and finished on the 09 August 2019. The data obtained from these wells were used in numerical modeling as well as data analysis. It should be noted that the monitored data in B2 and C1 only lasted until the 14 March 2018, when these two wells were damaged. In addition, the measured hydrological data, including river stages and flow rates at Longmen and Tongguan, were collected for the following analysis and simulation.
3.2. Numerical Modeling
In this study, we established a physically-based numerical model that coupled surface water and groundwater flow to examine river–aquifer interactions and regional groundwater flow. The numerical model was built with an integrated hydrological modelling system MIKE by DHI (Danish Hydraulic Institute, 2014). The numerical code MIKE SHE in the modeling system was used to describe the groundwater flow, and another code, Mike 11, was adapted to describe the river flow. Then, the two models were integrated with the coupling module within MIKE SHE.
3.2.1. Model Setup
The modelled area covered the entire wetlands as shown in Figure 2. A digital elevation map with a spatial resolution of 90 m was obtained from SRTM (Shuttle Radar Topography Mission) to describe the surface topography.
The subsurface component was characterized as a saturated zone, and the 3D finite-difference Darcy flow method was adapted to calculate the groundwater flow. The hydrogeologic units were determined according to the model conceptualization as described in Section 2.2. The northern and southern sides of the model were specified with inflow boundary conditions due to high elevation. The inflow rates were defined based on hydrogeological investigation reports [47,48,49,50], with a uniform value of 0.006 m3/s for the northern boundary and 0.002 m3/s for the southern boundary. The western and eastern boundaries were defined as inflow boundaries varying with time, whereby the inflow rates were calculated using 90 groundwater level data in 33 monitor wells in the study area and the surrounding region collected from the National Groundwater Monitoring Project of China Geological Survey. The western inflow boundary had a mean flow rate of 0.08 m3/s, a maximum value of 1.2 m3/s and a minimum of 0.003 m3/s. The eastern inflow boundary had a mean flow rate of 0.054 m3/s, a maximum value of 0.7 m3/s and a minimum of 0.001 m3/s. The model surface representing the maximum wetland was specified with the drainage boundary condition, which allows groundwater to discharge when water table depth is less than the drainage level from the land surface. The drainage level and the drainage time constant were determined during model calibration.
Daily rainfall data in Yuncheng (60 km away from the Yellow River) were obtained from NOAA(National Oceanic and Atmospheric Administration), with a maximum value of 53.6 mm/d, and a mean value of 1.2 mm/d. The extraction was uniformly defined as 160 mm/a and directly subtracted from the precipitation. The Net Rainfall Fraction in MIKE SHE, which represents the proportion of rainfall that infiltrated the aquifer after evapotranspiration, was defined as 0.14~0.32 according to previous work [46,47,51]. Other initial hydrogeological parameters (including the hydraulic conductivity, specific yield and specific storage) were also obtained from the hydrogeological reports [48,50,51,52]. The initial hydraulic conductivity of the Quaternary aquifer ranged from 6 to 25 m/d and the specific yield was approximately between 0.02 and 0.28, the initial hydraulic conductivity of karstic aquifer was 5.6 m/d and the specific storage was 0.035. Hydraulic conductivities and the specific storages of the Quaternary aquifer and karstic aquifer were varied during the model calibration.
The surface component included the overland flow and river. The overland flow was uniformly distributed, with Manning’s roughness coefficient defined as a calibration parameter. The Yellow River was digitized in MIKE 11, which extends from the Longmen gauging station at the upstream end to the Tongguan gauging station at the downstream end. The fully dynamic one-dimensional Saint-Venant equations were employed to describe the channel flow. The measured daily average flow rates at the Longmen gauging station were specified to the upstream end of the surface model as an inflow boundary condition. The measured daily average river stages at the Tongguan gauging station were specified to the downstream end of the model with a water level boundary condition. In addition, the river shape within study area and the distribution of river bed resistance were interpolated based on the measured data from 9 hydrologic cross-sections.
In this paper, all MIKE 11 branches were specified to be coupled to MIKE SHE. Considering the complex interaction between the river and the aquifer (the river could possibly be both recharge and discharge), the channel bed was specified to be in full contact with the saturated zone, so that the exchange between the river and aquifer was controlled by both the hydraulic conductivity of the aquifer and the river bed material.
The numerical model was discretized into 400 rows and 435 columns with an elemental size of 362 m × 362 m. The simulation period was from January 2014 to July 2019. Given that the exact initial condition was unknown, the period between January 2014 and June 2018 was used as the model warm-up period. The period between July 2018 and July 2019, when the groundwater heads were monitored, was then utilized for model calibration. The initial time step was 6 h, and the following time steps were adjusted automatically by MIKE SHE.
3.2.2. Model Calibration
In this paper, the model calibration target was the groundwater heads from monitoring wells, measured river stages at the Longmen gauging stations, and the measured flow rates at the Tongguan gauging stations. Therefore, two objective functions, including the Nash–Sutcliffe coefficient () [53] and the correlation coefficient (R) for the heads were implemented to optimize the numerical model. The and R are given as follows:
where and represent the observed and simulated heads, respectively, at a location and at time . is the number of observations at the location . An efficiency of 1 () implies a perfect match between the modelled and observed heads, while an efficiency of less than 0 () suggests that the model is not reliable because its prediction is not as accurate as the mean of the observed heads. Moreover, an efficiency of 0 () indicates that the model yields prediction as accurate as the mean of the observed heads is. Model performance criteria were adapted from Henriksen et al. (2008) [54] and House et al. (2016) [29] (see Table 1 in this paper).
4. Results and Discussion
4.1. Remote Sensing and In-Situ Monitoring
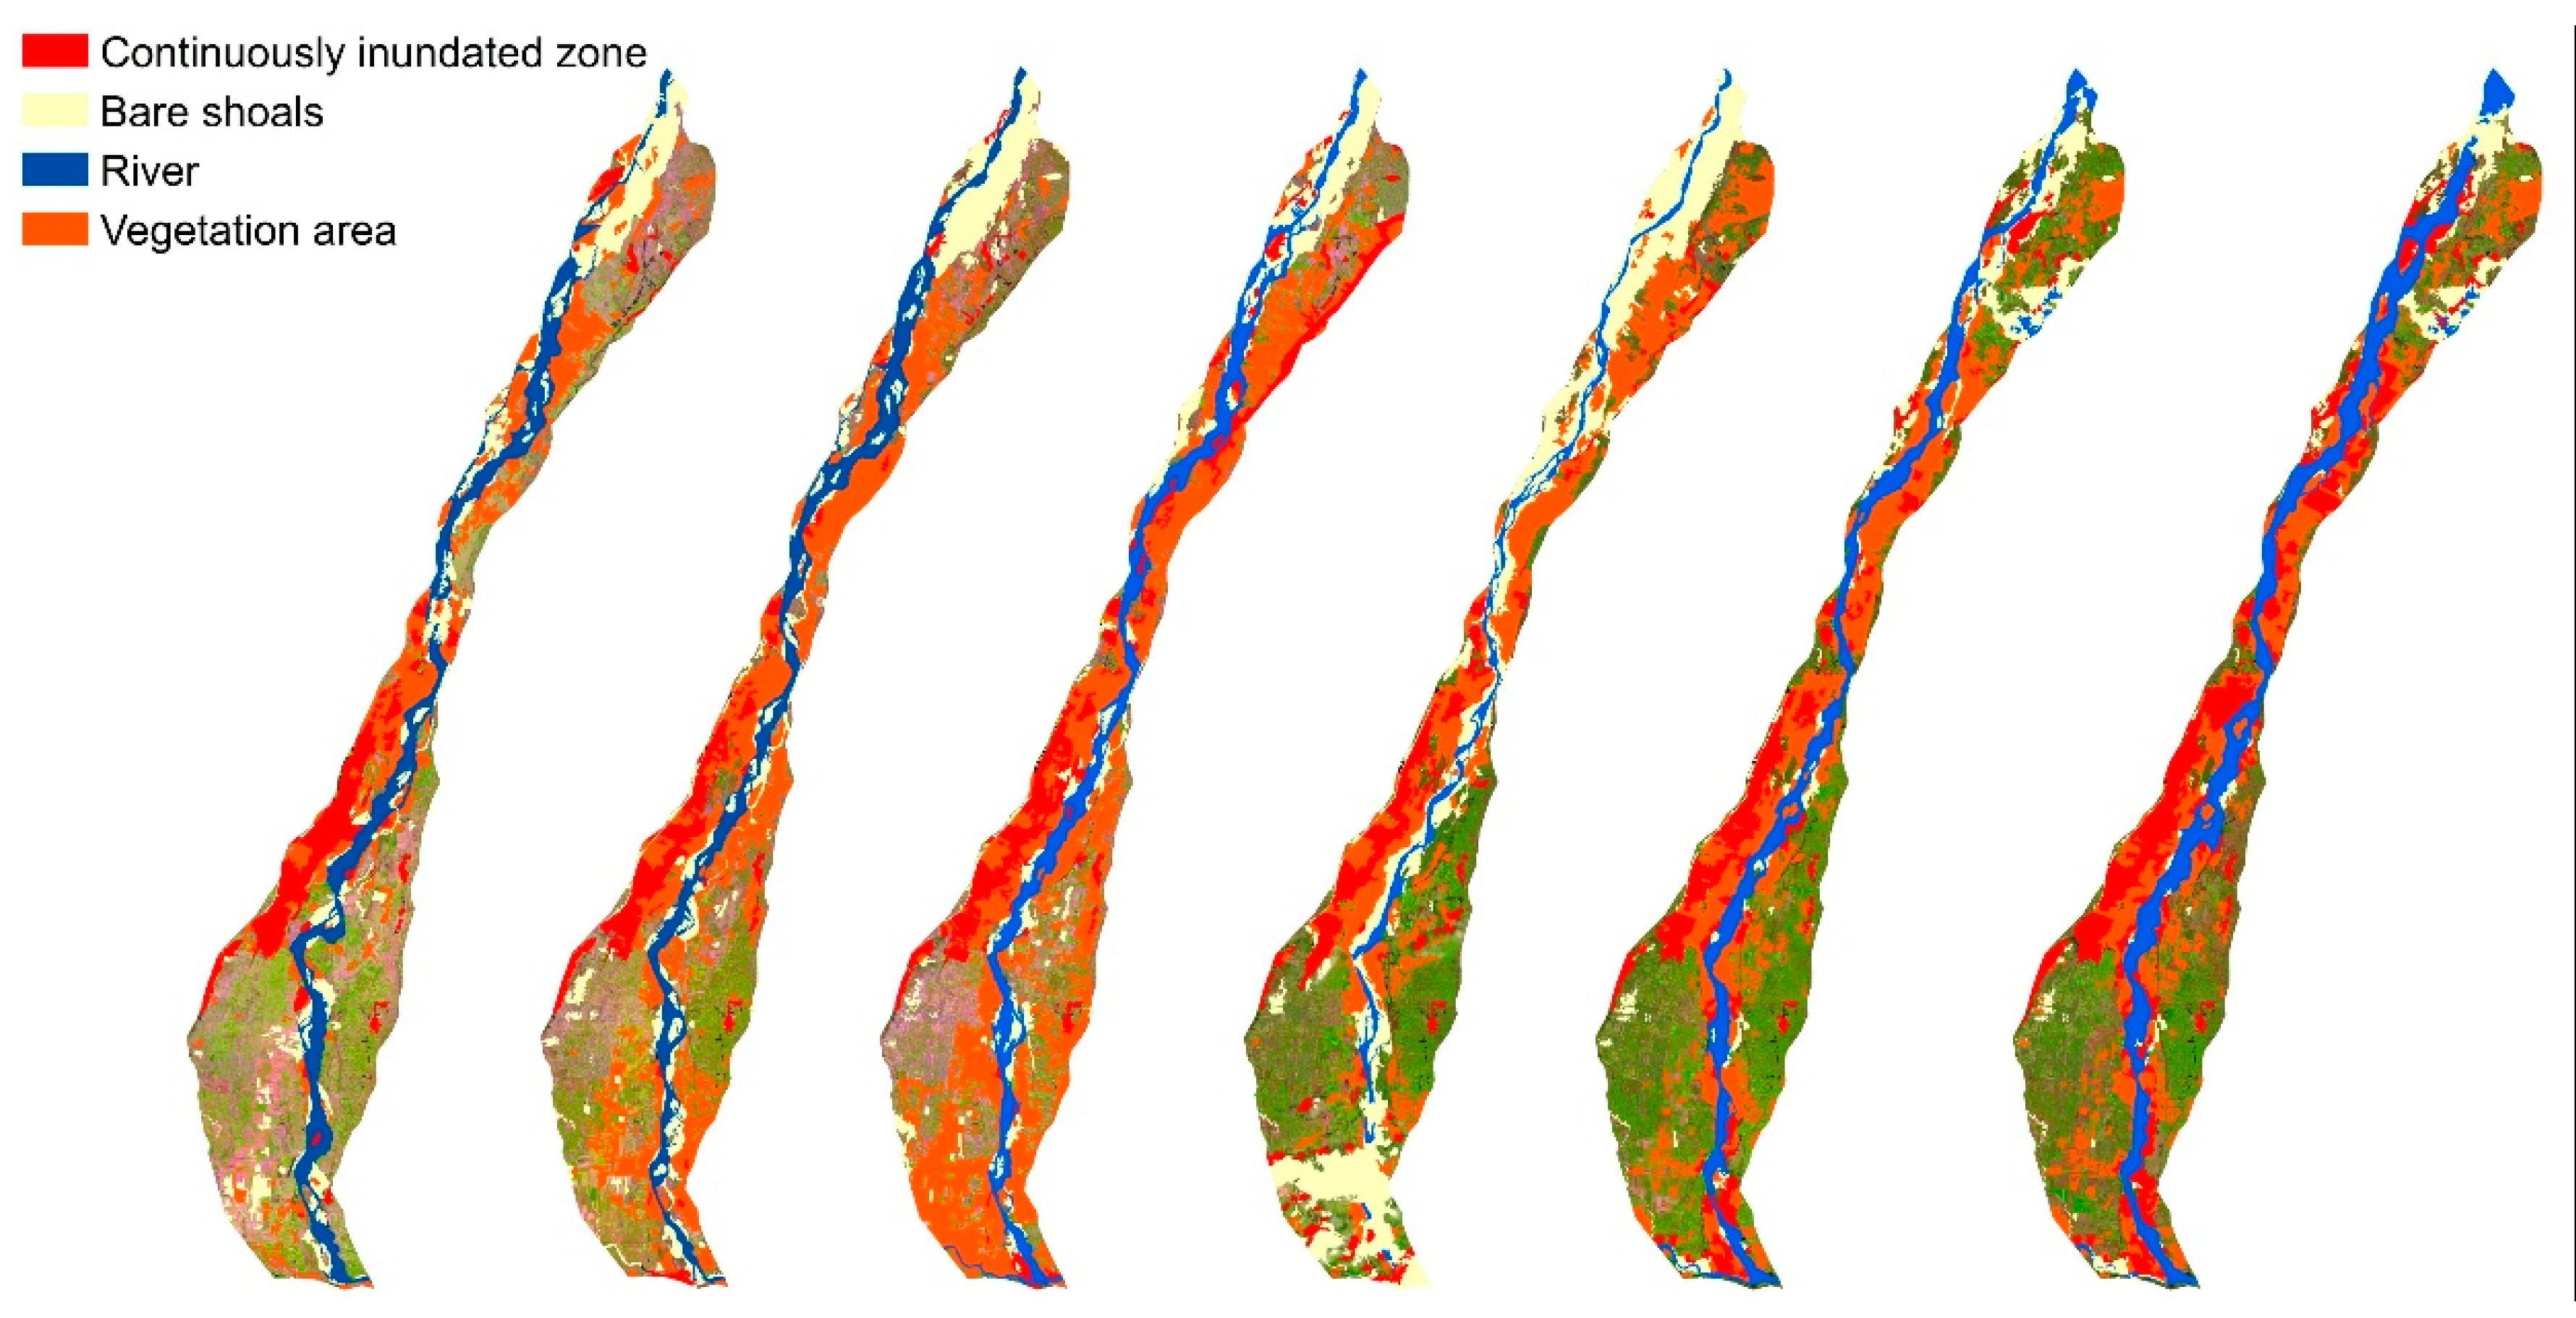
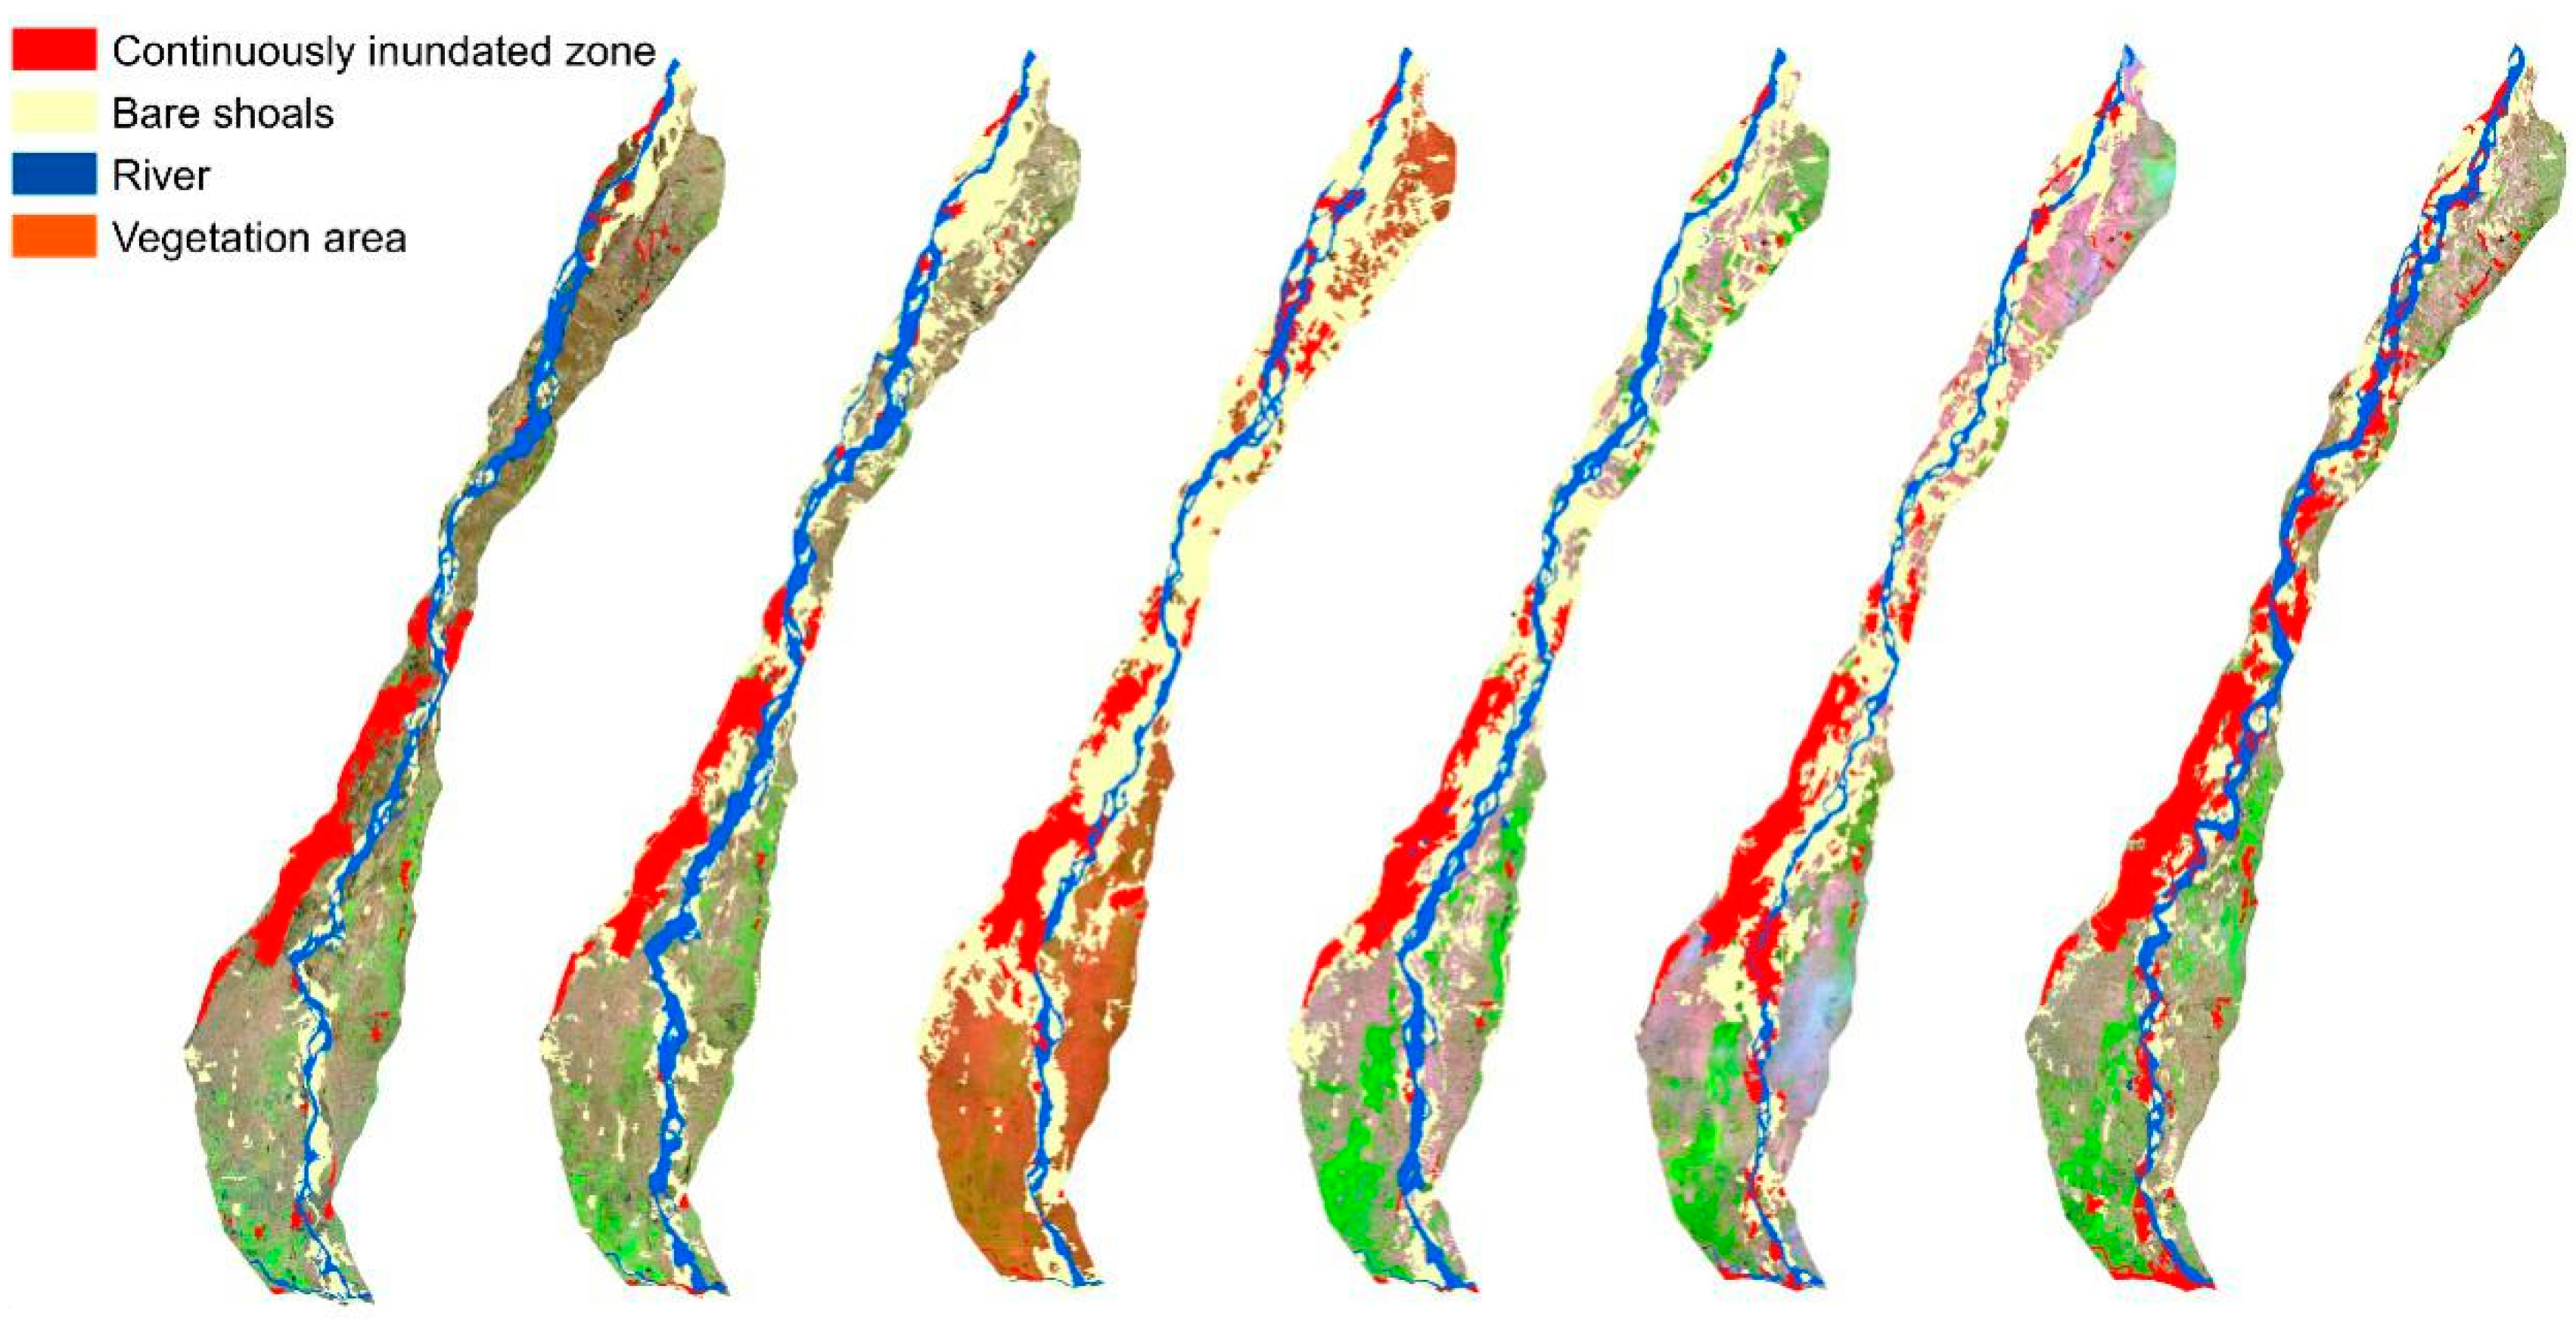
The remote sensing images between 2014 and 2019 were processed to extract important features that reflect on the changes in the wetland area. In wet seasons, the wetland area was defined as the sum of the continuously inundated area and the vegetated area dominated by reeds (Figure 3). As the growth of reeds is highly sensitive to water levels [55], the changes of the area covered by the reeds can also reflect on groundwater heads in the shallow aquifer. In dry seasons, the wetland area was extracted from the continuously inundated area only (Figure 4). This is because the reeds have withered by the dry season of a year and cannot be used to reflect on water depth anymore.
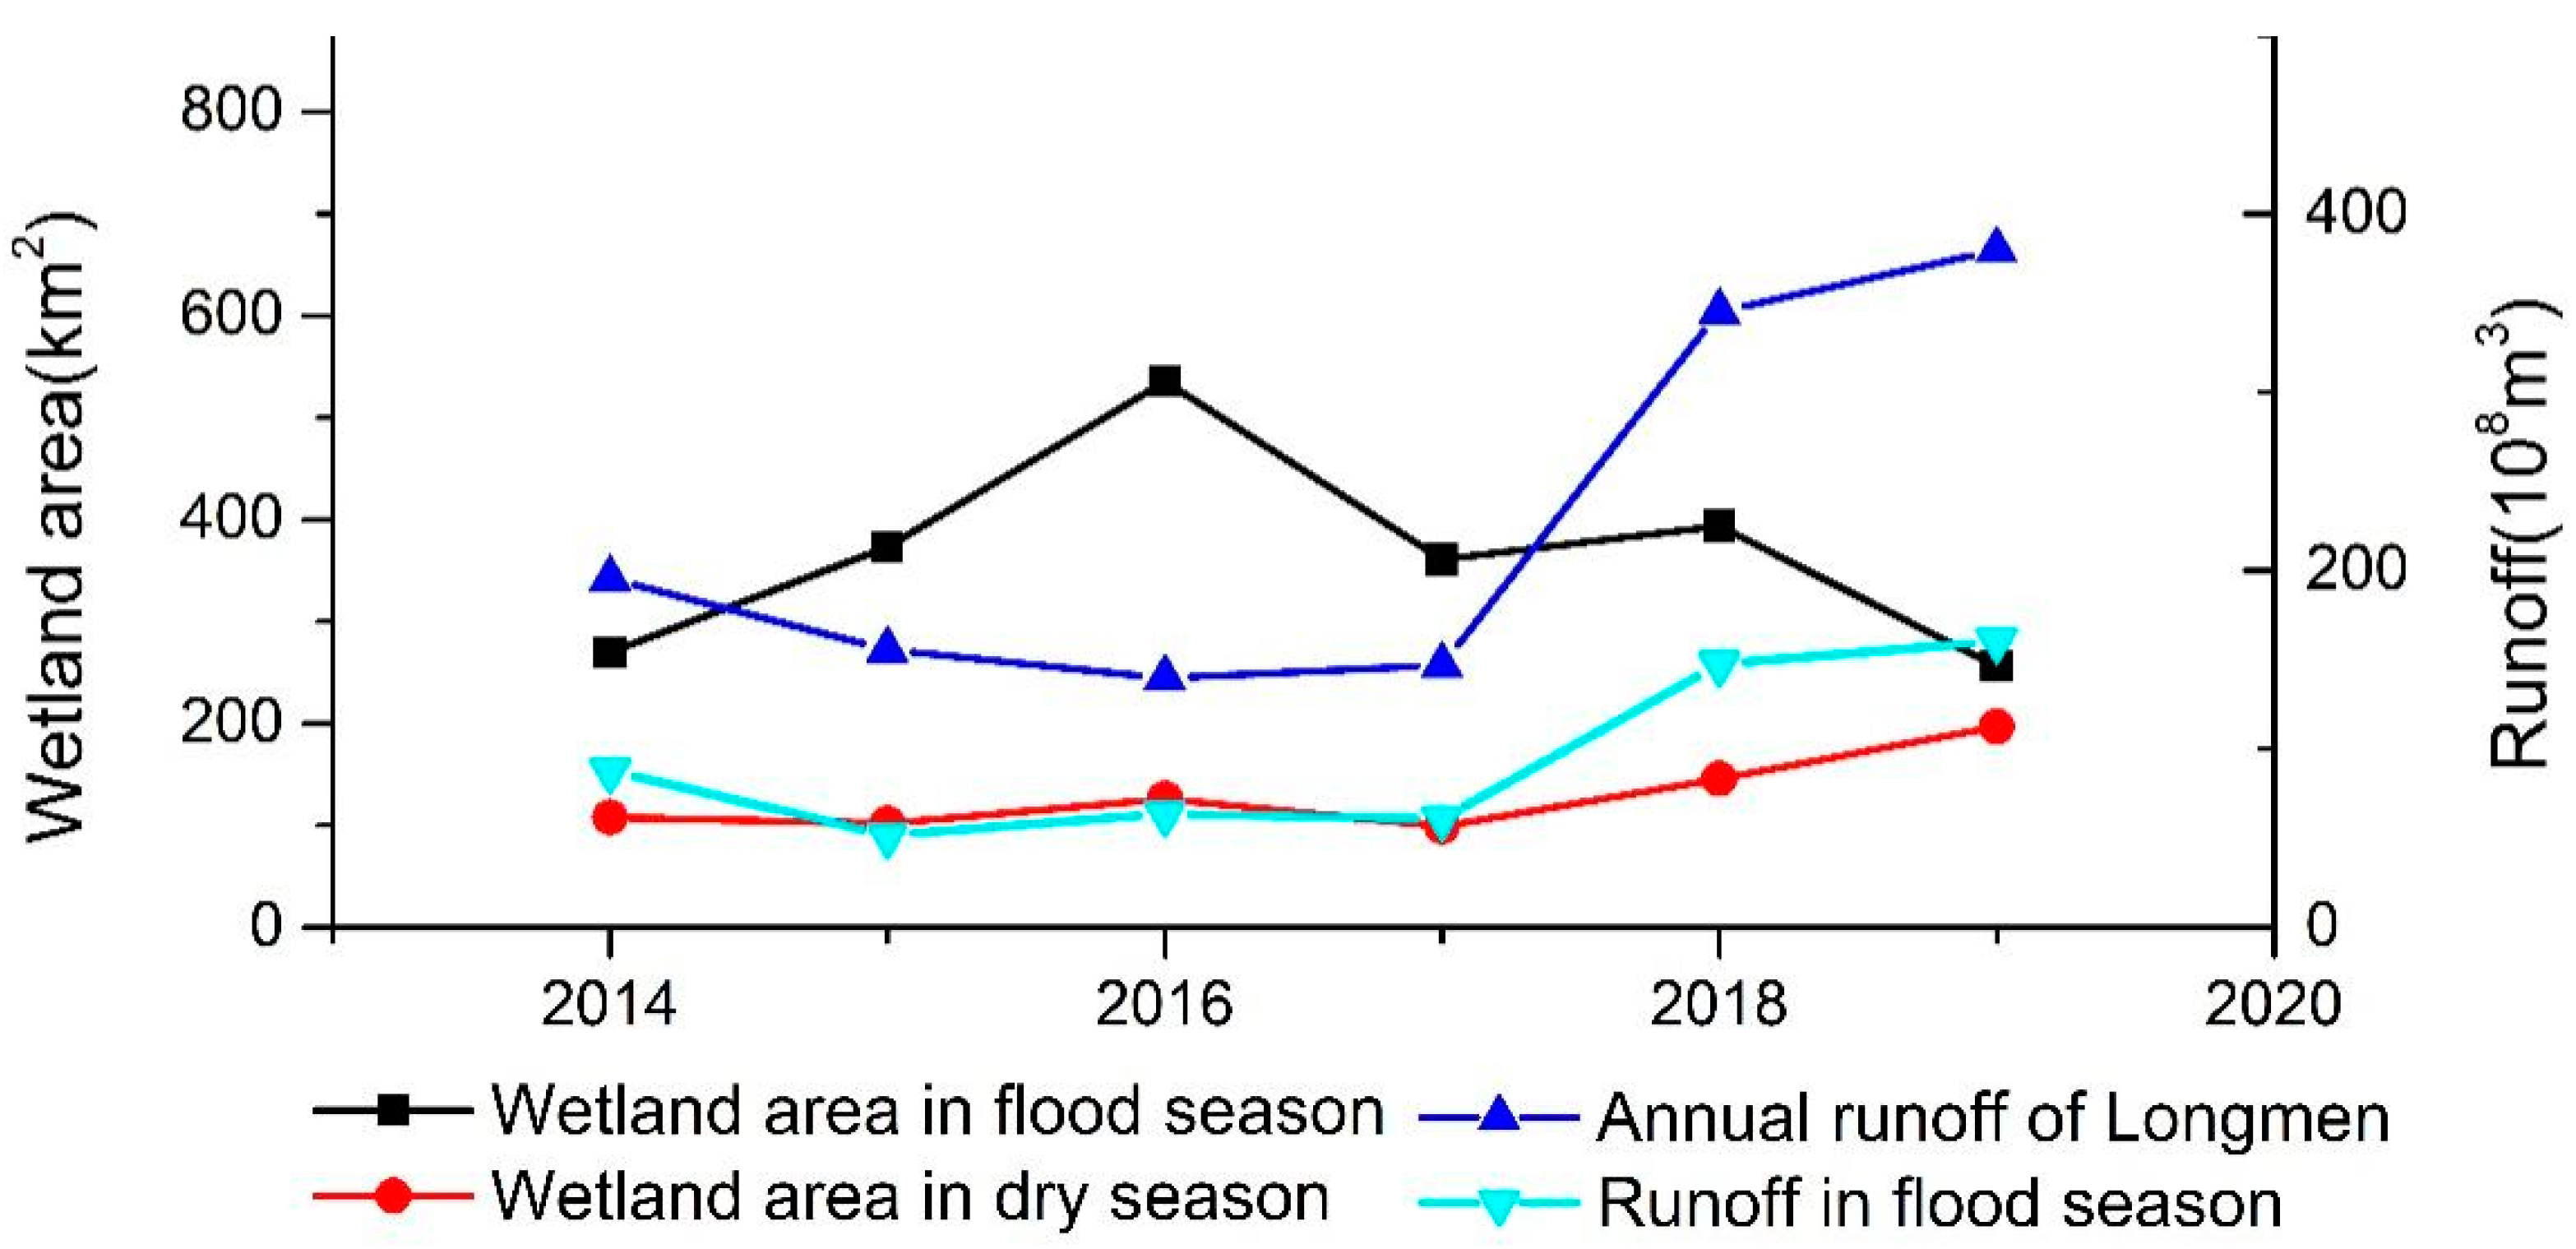
According to Figure 5, the annual runoff declined from 2014 to 2016, but the wetland area increased instead. The wetland area reached the maximum value in 2016, whereas the annual runoff at Longmen dropped to its lowest value. Moreover, the annual runoff at Longmen was quite stable in 2016–2017. On the contrary, the wetland area decreased, suggesting a decrease in the wetland water level. In 2017–2018, the annual runoff, as well as the runoff in the wet season rose significantly, but the wetland area only increased lightly. In 2019, the continuous increase in the annual runoff may result in an increase in the wetland area during dry season. However, the wetland area in the wet season fell dramatically. Overall, it can be concluded that the river runoff and the wetland area in wet season are weakly correlated. This weak correlation indicates that the regional groundwater flow may play a more critical role.
Observed groundwater heads were presented together with simulated heads in Section 4.2 below.
4.2. Model Calibration
The numerical model was calibrated by comparing the simulated groundwater heads, river flow rates and river stages to the observed ones using R and . A sensitivity analysis was also implemented in the calibration process. The MIKE Zero automatic calibration procedure was used with individually varied parameters. The model performance was most affected by the river bed resistance and hydraulic conductivities of the Quaternary aquifer. These sensitive parameters were then listed in Table 2. The calibrated model reproduced the observed surface water and groundwater data reasonably well (Figure 6 and Figure 7).
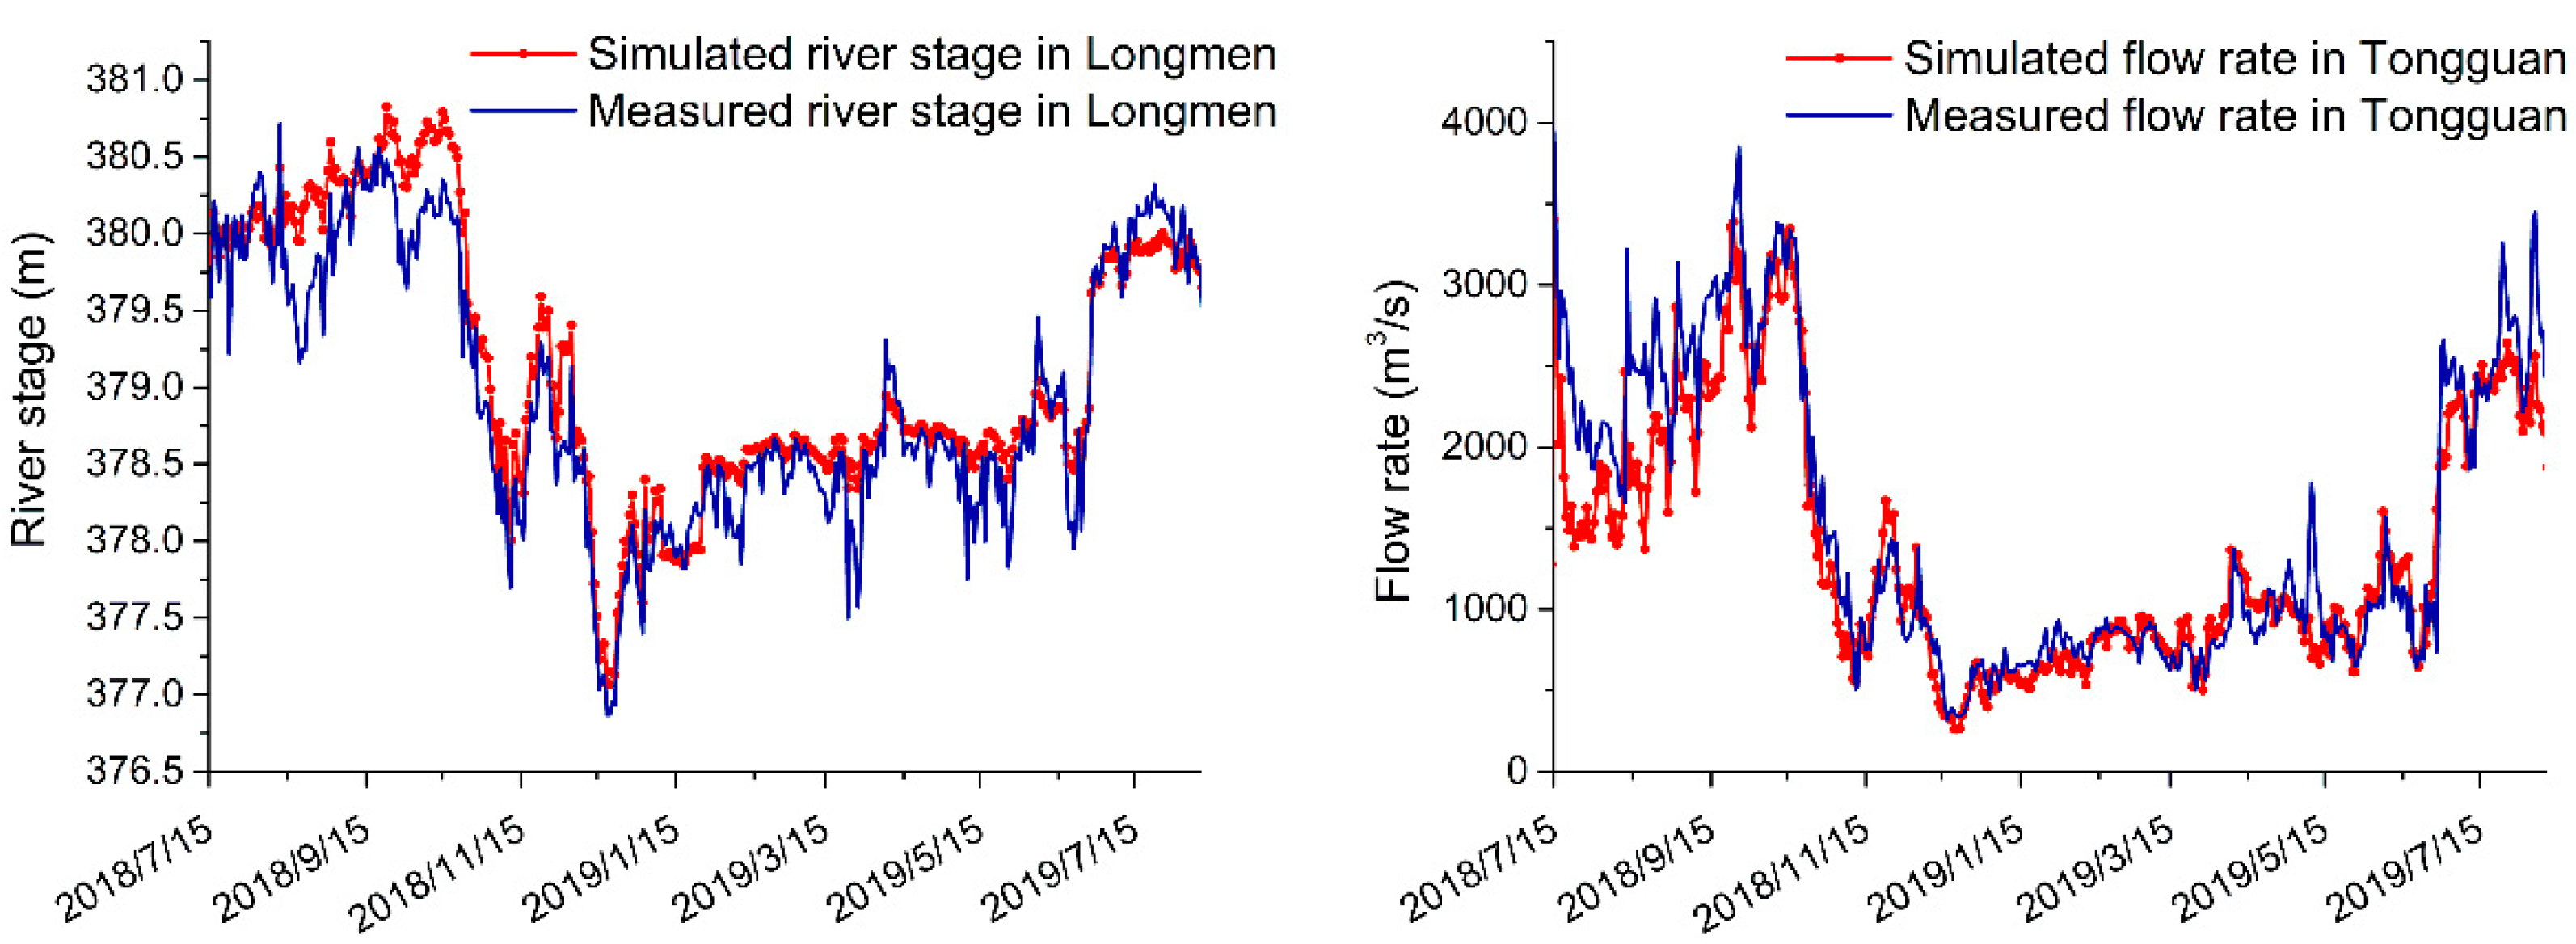
As demonstrated in Figure 6, the changes in the river flow rate and the river stage during the calibrated period was well captured by the model. According to the performance criteria (Table 1), both and R suggested that the model performed well in simulating the Yellow River. The R and for the river stage at the Longmen station were 0.96 and 0.87, respectively, indicating excellent model performance. The R for the flow rates at the Tongguan station represented excellent performance, and the suggested a very good performance. Despite the model’s satisfied performance for the river, we found the model’s ability to match peak flows in the flood season was not as good as that in the rest of the year. At the Longmen station, the river stages were slightly overestimated in 07.2018–09.2018, then underestimated during 07.2019. At the Tongguan station, the flow rates were slightly underestimated during the same period. The discrepancies between the simulated and observed channel flow values may be in part due to the river bed resistance varied with time. The river bed resistance is affected by many factors, amongst which the in-stream vegetation contributed most. Besides the channel morphology, bed material and adjacent conditions, the varied seasons is the most important factor for the growth and distribution of in-stream vegetation. The seasonal effects of vegetation growth on river bed resistance were not accounted for within the model; instead, a time constant resistance factor was applied throughout the MIKE 11.
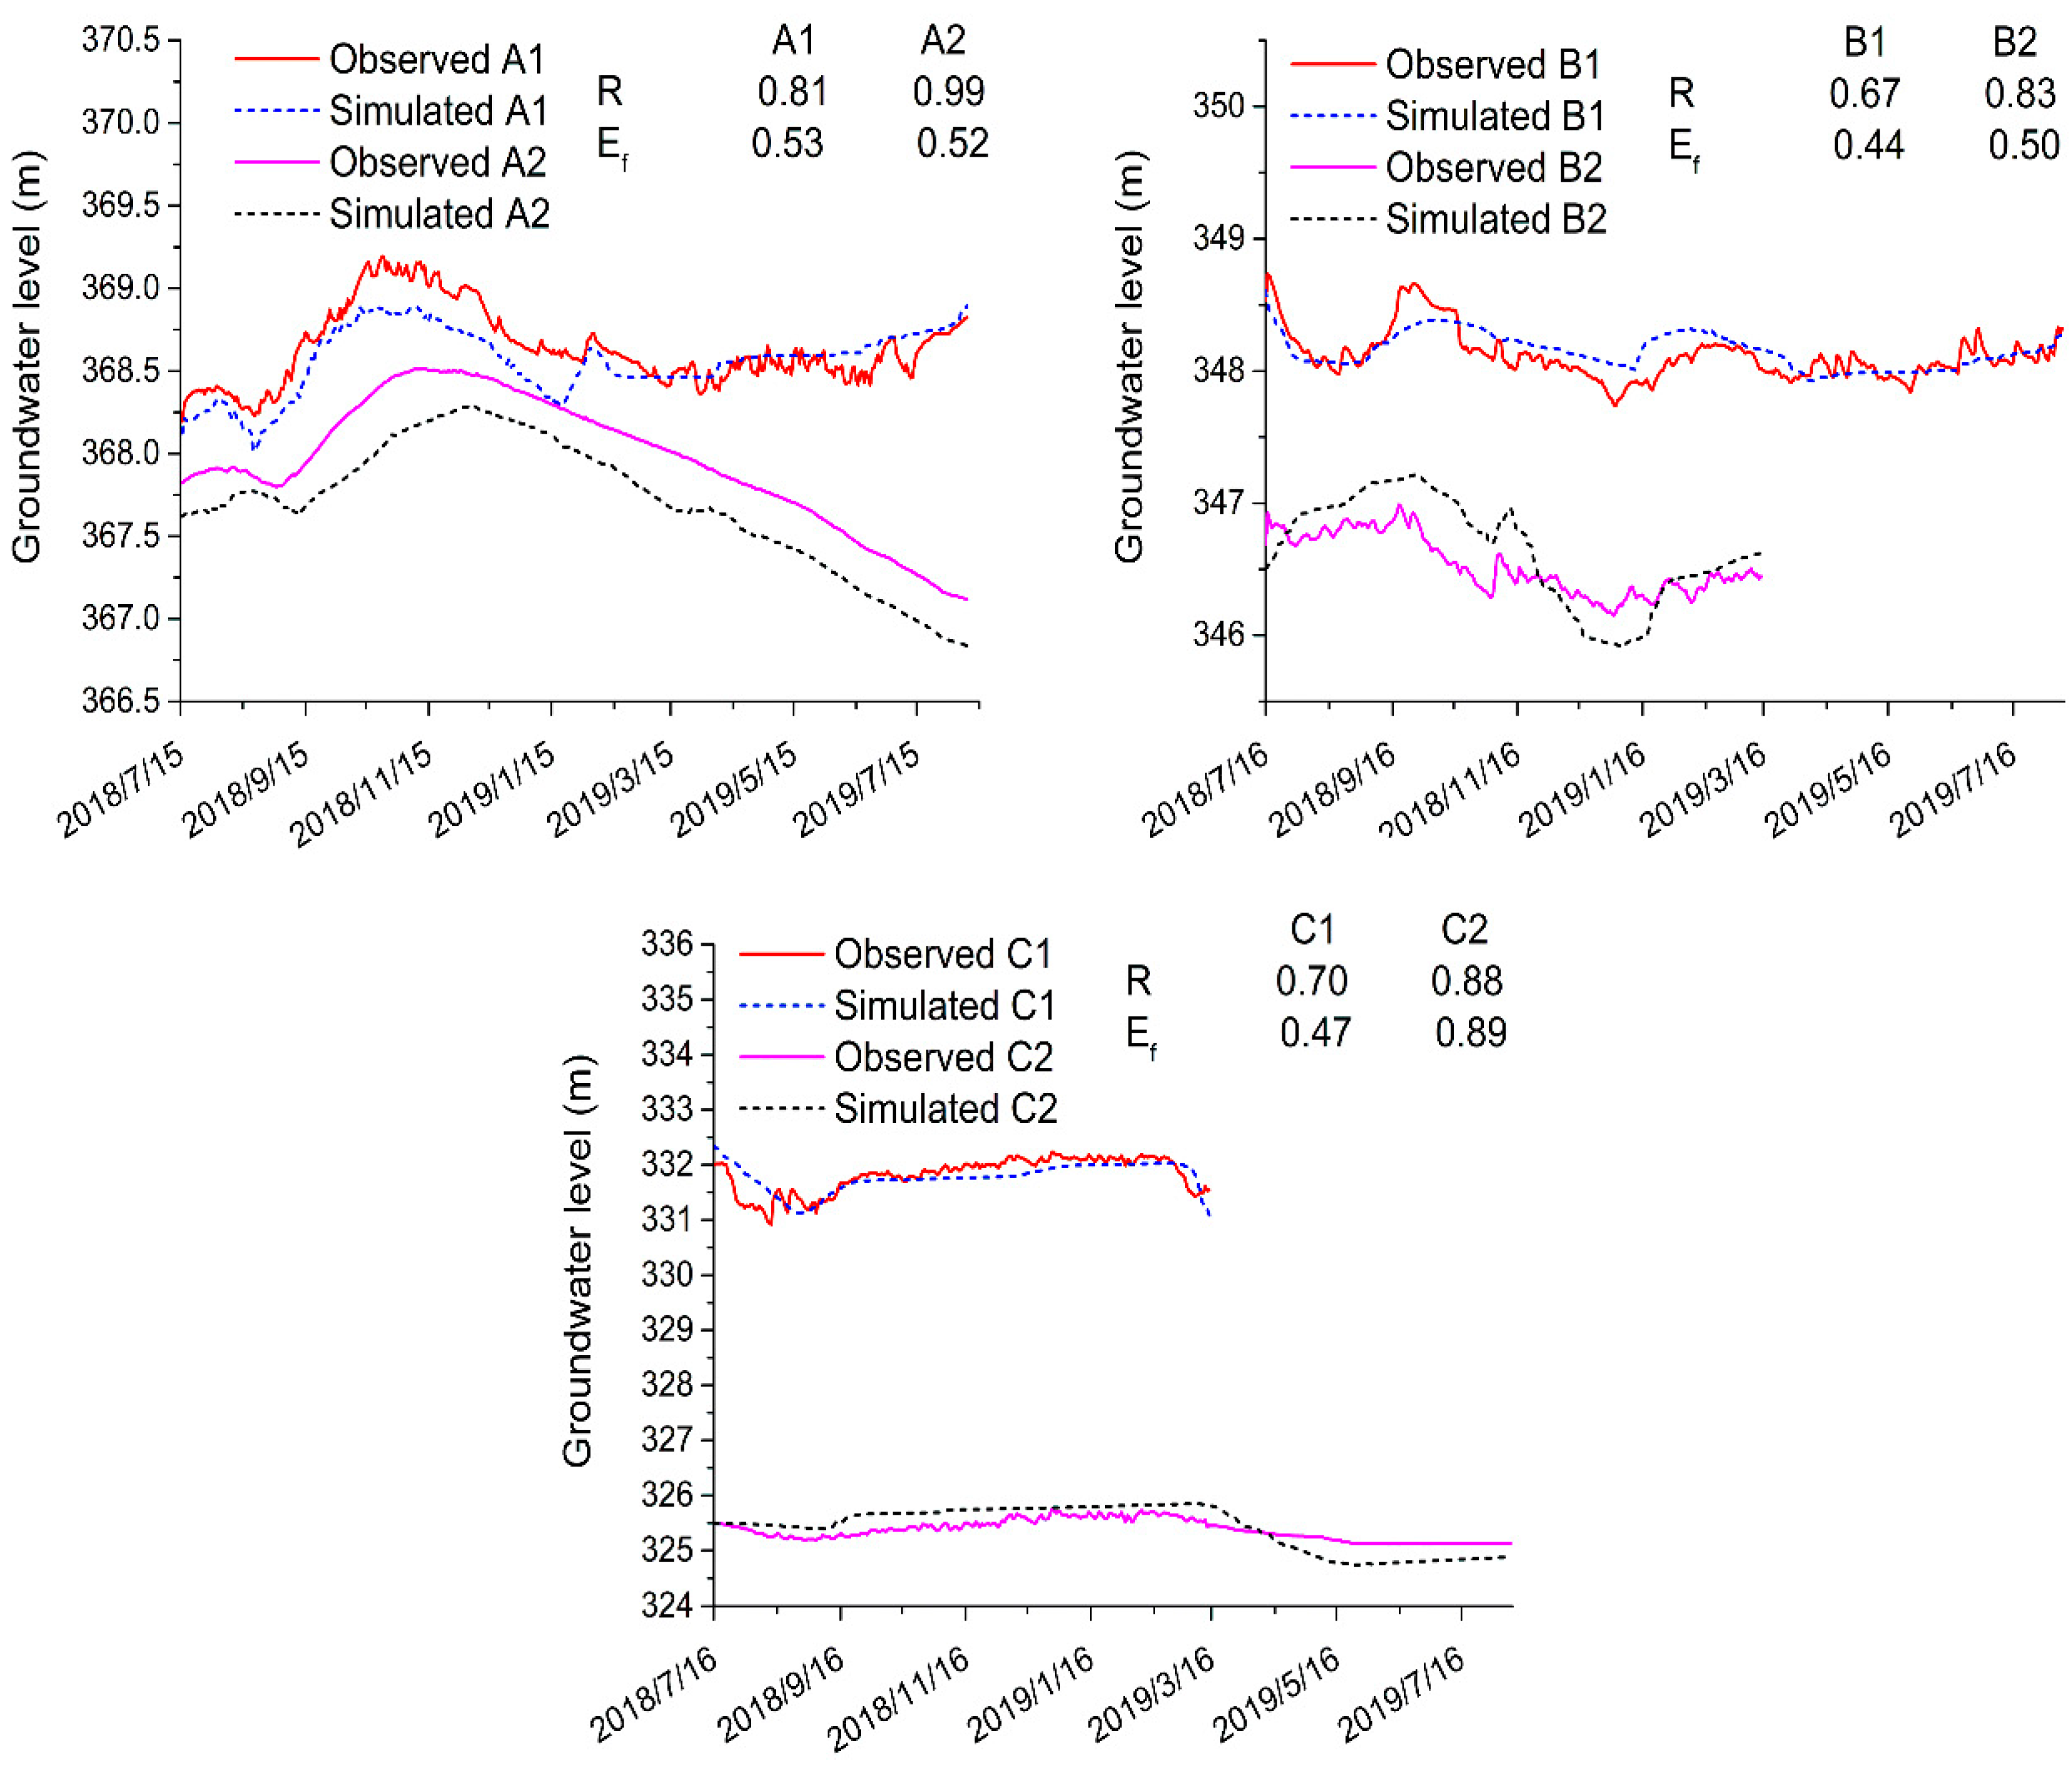
The simulated groundwater heads also fitted reasonably well with the observed ones (Figure 7). Overall, the simulated data reproduced the trend that groundwater heads decline along with the river downstream. For the , the values were between 0.44 and 0.89. Except for B1 and C1, the model performance in other the wells was fair to good. The R for the groundwater heads averaged 0.81, suggesting that the model performance was very good. The model parameters obtained for the best fit are shown in Table 2.
As illustrated in Figure 7, the model results were better for monitoring wells at transect A and C compared with those at transect B. The mean value of R and for transect A were 0.90 and 0.53, for transect C were 0.79 and 0.68, while the mean value of R and for transect B were 0.75 and 0.47. The locations of three monitoring transects may contribute to the difference in model performance. The transect B was sited in the middle of the simulated river reach, where the hydrological data (river stage and flow rate) were calculated based on the measured data at gauging stations. By the contrast, transect A and C sited near the Longmen station and the Tongguan station, respectively. The measured hydrological data at these gauging stations restrained the interaction between the groundwater and the river at transects A and C, obtaining better fitted groundwater heads.
Generally, the localized and time-varying effect stems from the parameters of channel flow (river bed resistance, river stage and flow rate at cross-sections), which could therefore undermine the model’s performance.
For transect A, the river stage rose from July to October, then came down in the next months. The maximum river stage in the monitored period was 375.82 m (on 23 September 2018), and the minimum was 372.93 m (on December 2018). The maximum head of Well A1 was 369.19 m (on 23 October 2018), the minimum value was 368.19 m (on 16 July 2018), with a difference of less than 1 m. This small difference suggests that the groundwater at Well A1 was rather stable within a year. The groundwater head at A2 varied in a similar fashion to that at A1 from July 2018 to March 2019. However, the groundwater head at A2 did not rise along with the river stage after April 2019, unlike A1.
For transect B, the groundwater head exhibited a similar temporal trend with the river stage, but the variation range was smaller: 3.17 m for the river stage, 0.99 m for Well B1, and 0.84 m for Well B2. Moreover, the river stage was lower than the groundwater head of Well B1 during 15–24 December 2018.
The river stage at transect C was more stable than transects A and B, with a seasonal fluctuation of less than 2 m. The highest groundwater heads were observed in winter (December) and the lowest in summer (August for C1 and June for C2), opposite to the river stage. It should be noted that C2 had the most stable groundwater head among all the monitoring wells, with a variation range of 0.63 m.
4.3. Connectivity between the River and the Wetland Groundwater
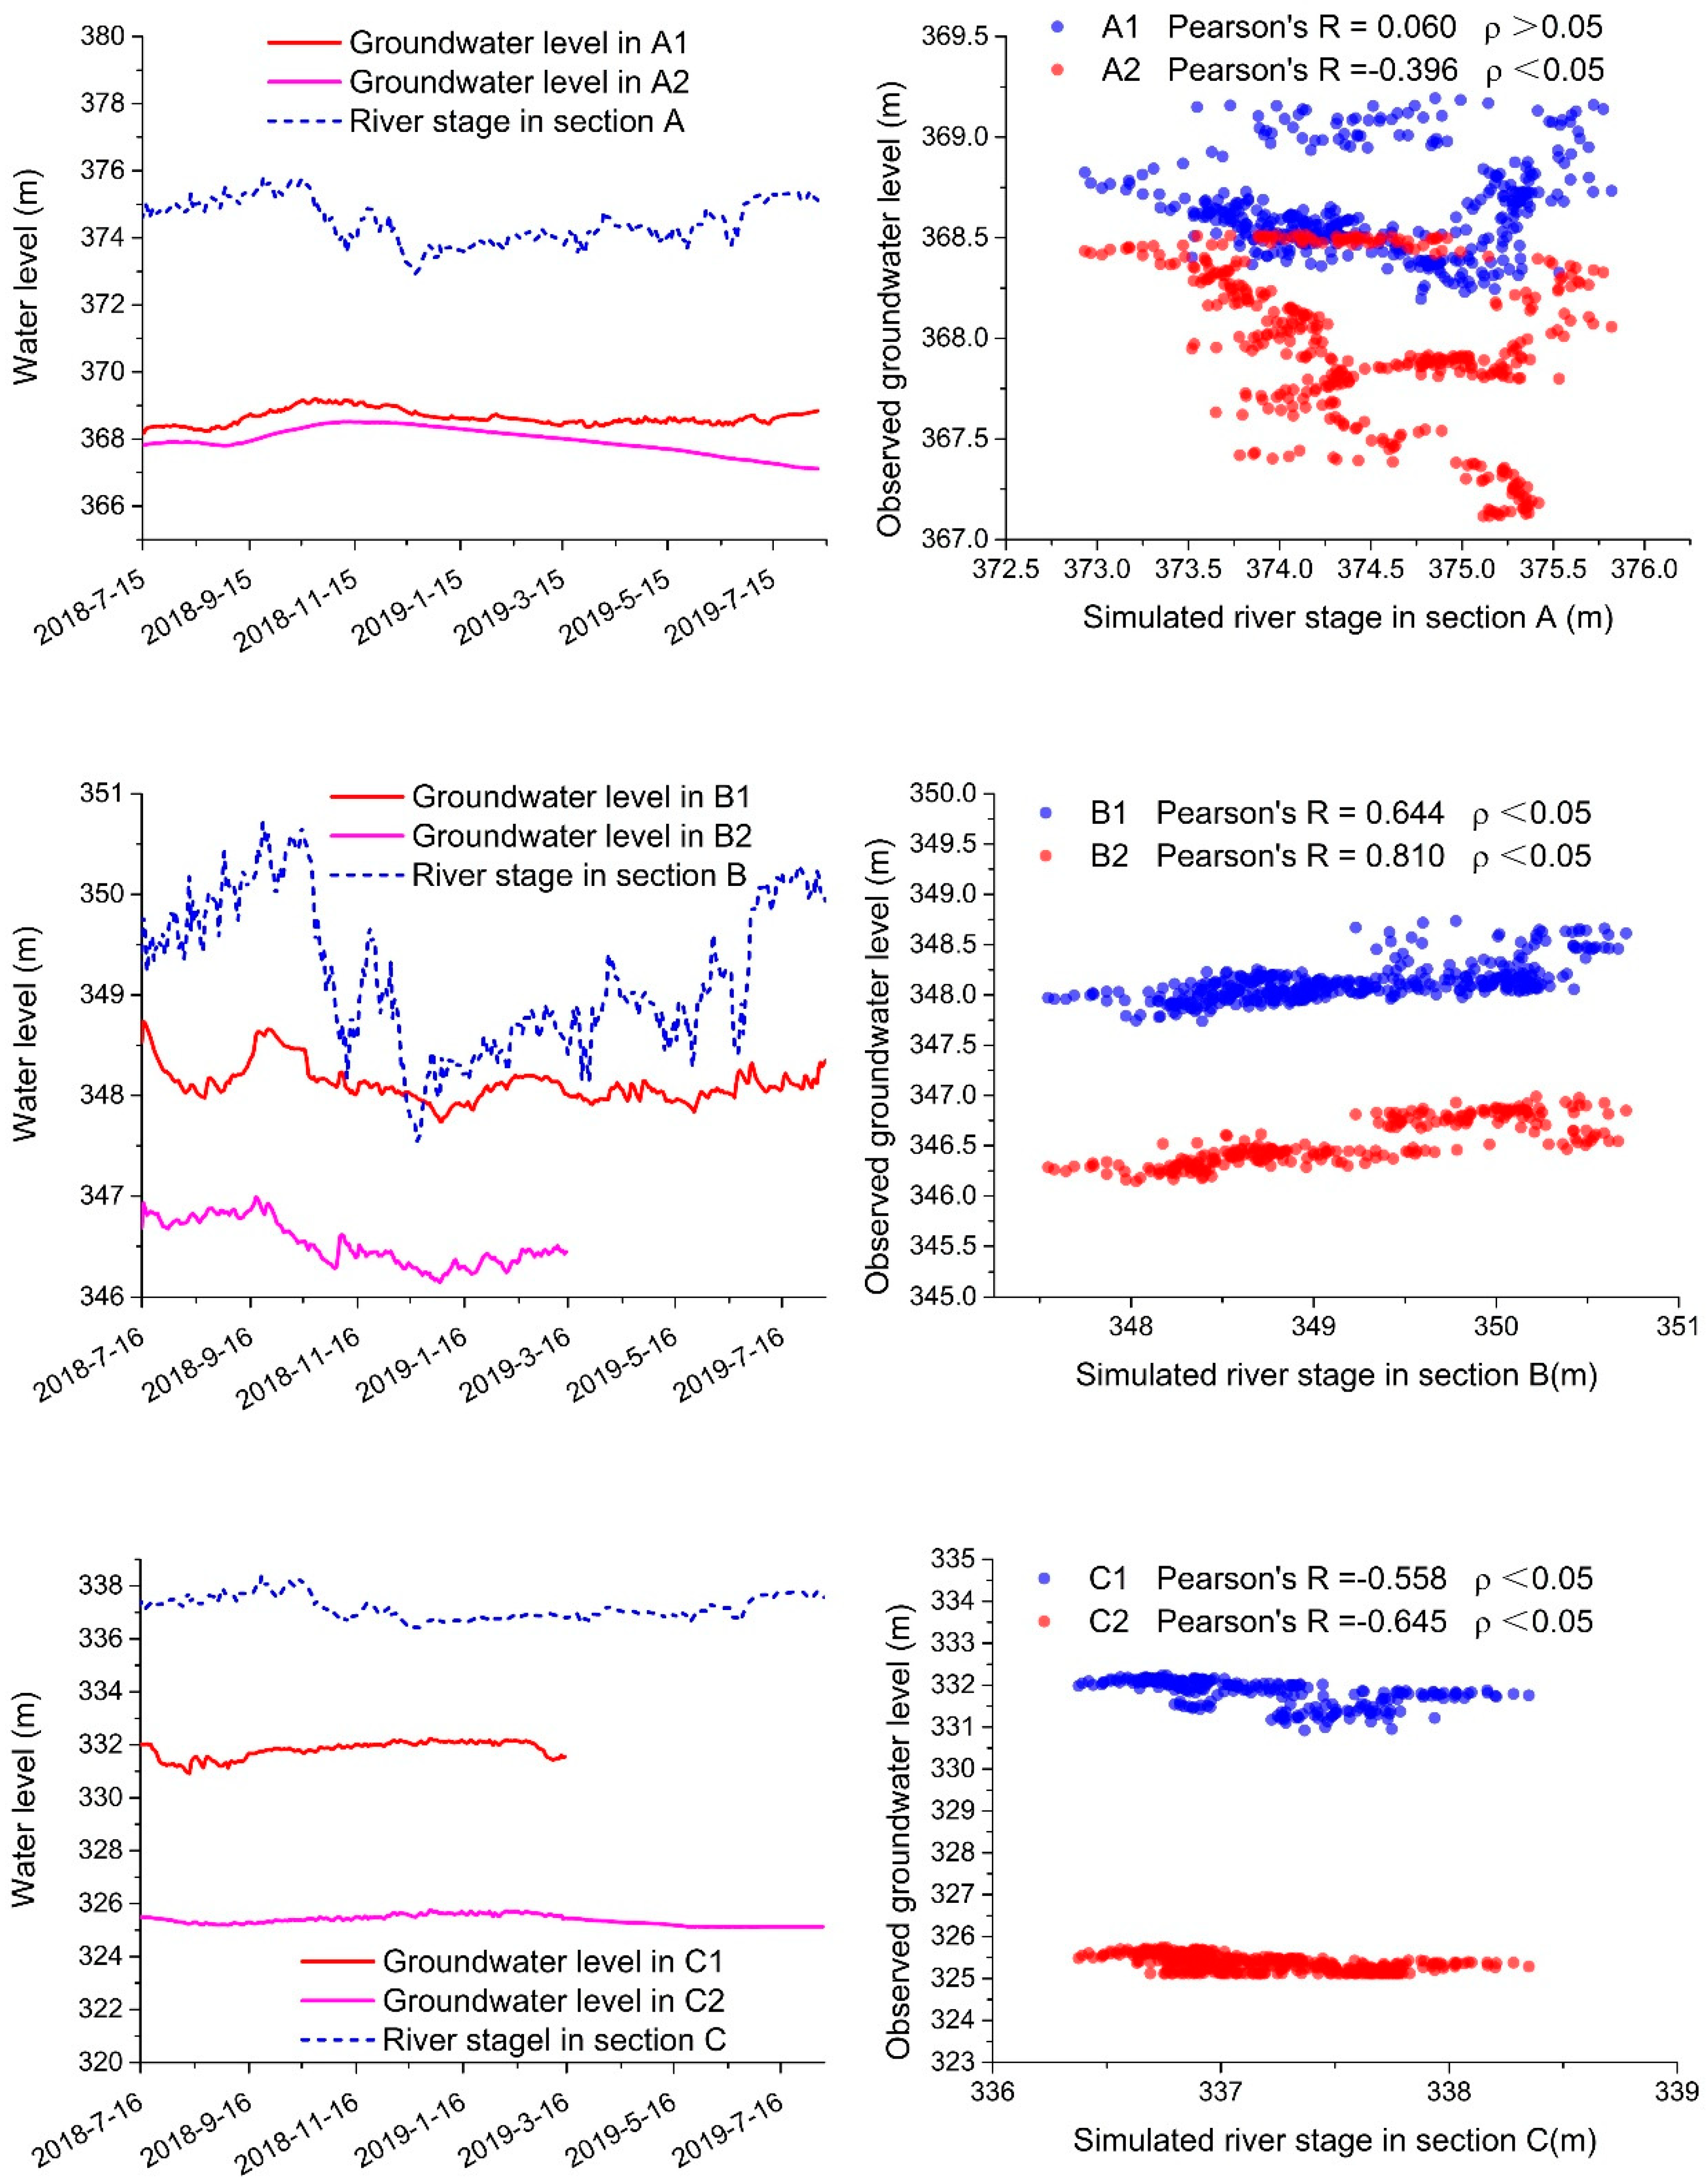
A linear correlation analysis was conducted with the Pearson correlation coefficient (Pearson’s R) to investigate the relationship between the groundwater heads and the Yellow River (Figure 8). The results showed that the groundwater heads at transect B were most correlated with the river stage among three transects. The groundwater heads for all the monitoring wells were largely correlated with the corresponding river stage except A1. In addition, the groundwater heads of the left bank had a higher correlation coefficient than the right.
The river stage was correlated with the groundwater head in the wetlands according to the linear correlation analysis results in Figure 8. Combined with a comparison of water levels, it could be concluded that there was supposed to be some recharge from the river to groundwater in the wetlands as the direction of the hydraulic gradient showed most of the time. What should be noted is that the correlations did not suggest that the groundwater head in the wetlands was controlled, or severely affected by river flow. The apparent differences in the temporal patterns of groundwater head and river stage indicated that the groundwater head in the wetland was probably not mainly controlled by river flow. The correlation analysis results also showed a difference in the river-wetland connections for both banks, which implies that the hydrological processes may differ for wetlands on both banks.
The connectivity between wetland groundwater and river was also explored based on the simulation results. Based on the water balance results from the simulation, the proportional contribution of the river to the Quaternary aquifer within the wetland area was discussed. Because of the possible difference of river-wetland connection implied by correlation analysis, simulation results for both banks were calculated, respectively.
For the wetlands on the right bank, the rainfall and recharge from the regional groundwater flow (including the lateral inflow and the upward flow) took up most of the recharge of the target aquifer (21.8% and 67.7%, respectively). Water from the river only accounted for 10.4% of the total recharge. For the left bank, the river seepage took about 26% of the total recharge, followed by precipitation (about 24.1%). Recharge from the groundwater flow was approximately 49.9%. These data suggested that instead of the river, it is the regional groundwater flow that played as the most crucial source of water for the wetlands on both banks, sustaining the groundwater of the wetland.
4.4. Difference in the Hydrological Process on Both Banks
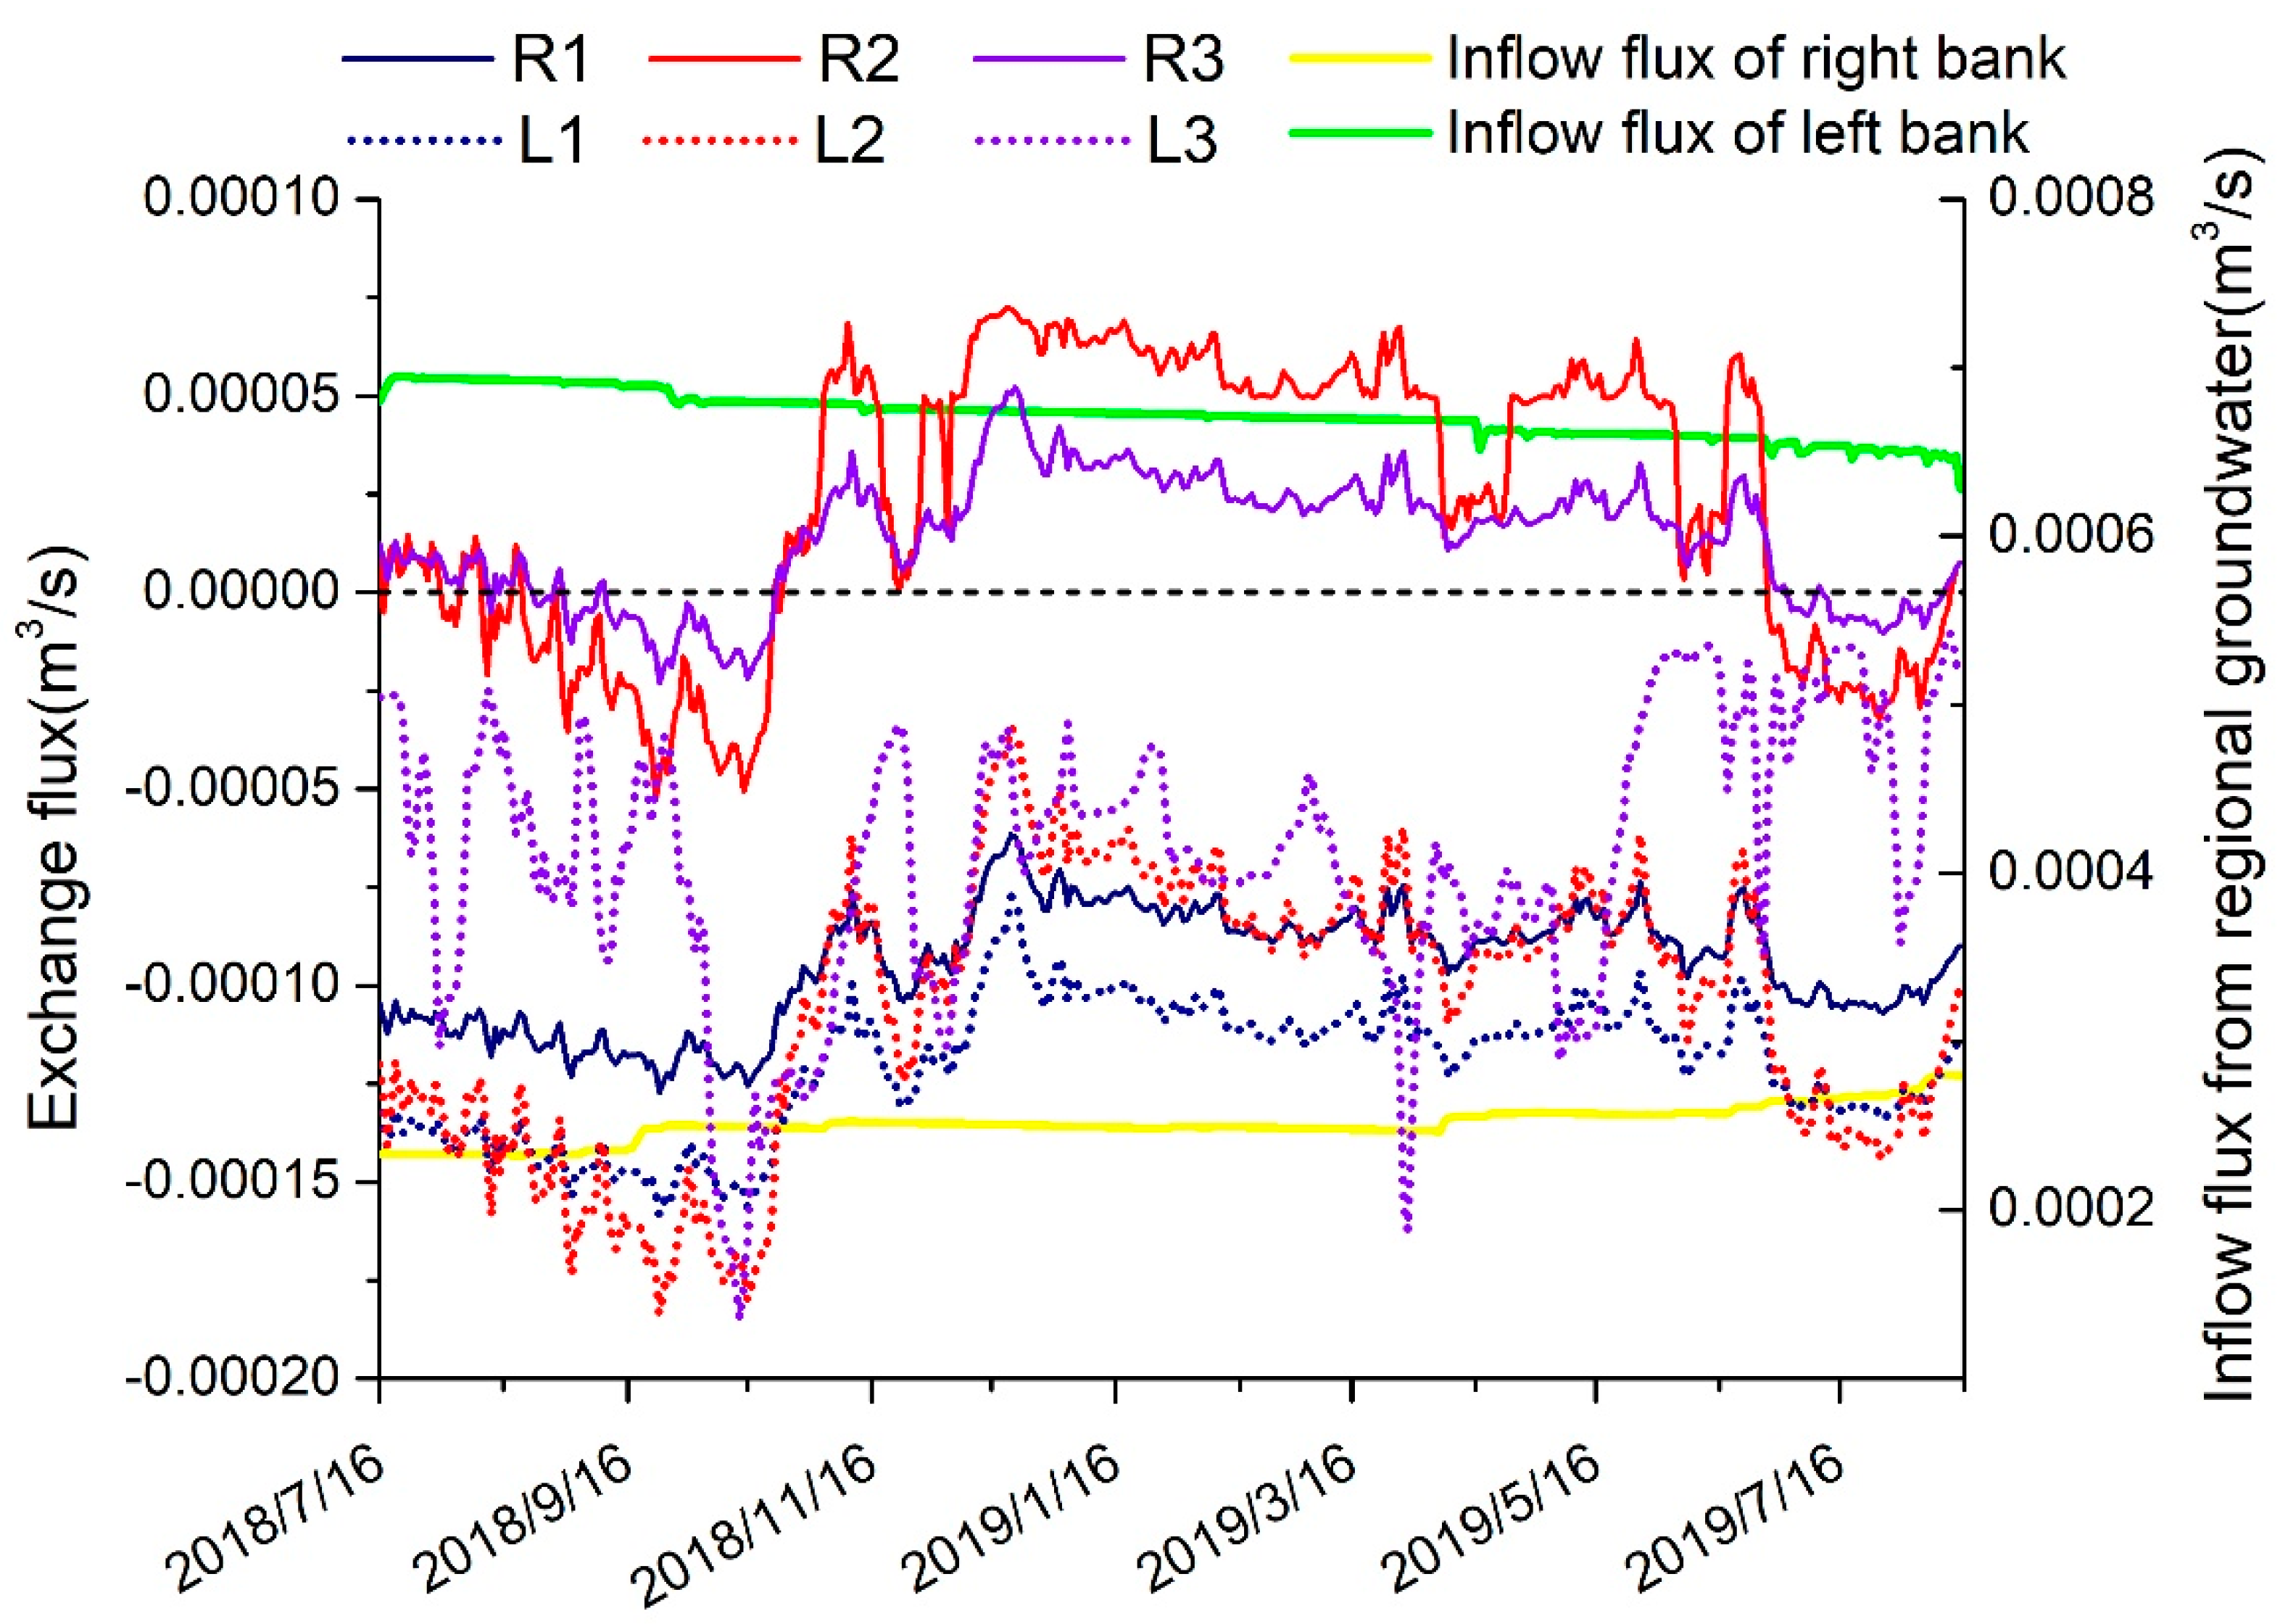
Results from the remote sensing data, observed data, and the numerical simulation suggested that the Yellow River had a limited impact on groundwater heads within the shallow aquifer and that the regional groundwater flow plays a more important role. These results also indicated the difference in the hydrological processes of wetlands on both banks. Groundwater on the left was more correlated with the river than on the right bank (Figure 8). The river–aquifer exchange flux at three transects was plotted in Figure 9.
According to the simulation results for the right bank, the river recharge only accounted for 10.4% of the total recharge for the shallow aquifer. The primary discharge of the wetlands was evaporation and extraction (79.2%), whereas drainage to the river occupied the second place (around 16%), and the lateral outflow only accounted for about 4.8%. This indicated that the floodplain wetlands in the right bank was a dynamic environment where drainage to the river and recharge from the river both occurred. The spatial and temporal variation in the exchange flux of the right bank (R1, R2 and R3 shown in Figure 9) also supported this conclusion. The exchange flux of R1 suggested that the groundwater was gaining water from the river at all times, while R2 and R3 implied that the groundwater was losing water to the river most of the year. A temporal variation could be observed in R2 and R3: the wetland groundwater heads were generally higher than the river stage and drained to river, but the hydraulic gradient was reversed during the wet season, and instead, the river stage rose rapidly and thus supplied water for the wetlands.
For the left bank, river seepage made up over 1/4 of the total recharge (about 26%). Major discharge occurred in the form of evaporation and extraction. The rest drained to the river (about 3.4%). The recharge from the river was far more than the amount drained to the river, implying that although the shallow groundwater in the wetland was mostly supported by rainfall and regional groundwater flow, the river also acted as one of the main sources for the left bank. Negative values of L1, L2 and L3 located on the left bank further demonstrated that the wetland was continuously gaining water from the river during the whole simulation period. The inflow flux from the regional groundwater flow into the wetlands for both banks was also shown in Figure 9, which was generally one order magnitude larger than the exchange flux between the groundwater and the river.
Generally, the floodplain wetland groundwater in the middle reach of Yellow River was the dynamic zones between the regional groundwater and the river. Moreover, as already speculated above, it was the regional groundwater flow that maintained the groundwater quantity of the wetlands. This reflected the larger-scale catchment processes and the position of the Yellow River as well as its floodplain wetland in the discharge zones of regional groundwater flow systems. Regional groundwater flow perhaps also resulted in spatial variations of the interaction between the wetland groundwater and the river. The underlying karstic aquifer in the right bank not only discharged to the river, but probably also generally interconnected with the wetland groundwater by numerous fractures and faults. Especially, the faults-induced karstic springs around Heyang (near groundwater monitoring transect B) continuously supplied water for the wetland, which probably caused the groundwater–river exchange flux difference between transect A and B (see R1 and R2 in Figure 8). By contrast, the wetland groundwater in the left bank has a much larger aquifer thickness than the right bank, so it did not get as much water support from the underlying karstic aquifer. As a result, the wetland on the left bank has lower groundwater heads and thus relies on river recharge more. As the regional groundwater flow direction is majorly controlled by topography in the study area, this contrasting pattern of hydrological regimes on both banks of the Yellow River is probably due to a combination of hydrogeological conditions and topography.
5. Summary and Conclusions
The hydrological and ecological response mechanism of the floodplain wetland systems to the changed flow regimes of surface water caused by human activity and climate change has long been the research focus worldwide in recent decades. The results are considered uncertain, mainly due to the complex hydrological process of floodplain wetlands, which has not yet been adequately addressed. This study takes regional groundwater flow into account, employing remote sensing images, field data and a coupled surface water–groundwater numerical model to investigate the hydrological process of wetlands distributed along the middle Yellow River (the Shaanxi Yellow River Wetland Provincial Natural Reserve and Shanxi Yuncheng Wetland Provincial Natural Reserve). The wetland areas were extracted from the remote sensing images of 12 periods from 2014–2019 (in the wet season and dry season, respectively), the changes were then compared with a river runoff to explore the possible relationship between water quantity and river flow variety. As a result, the river flow was found not to be the main factor controlling the water quantity of the wetland, and its impact is limited. The in situ monitoring data, including the groundwater heads in wetland monitored by six wells on three monitoring sections cross the river, and the measured hydrological data collected from two key gauging stations (Longmen and Tongguan) were used to establish and calibrate a coupled surface water–groundwater numerical model. The outcomes of the simulation, combined with hydrogeological conditions, were used to investigate the hydrological process in the wetland. The results indicated that the regional groundwater flow is likely to be the most important source to support groundwater quantity in floodplain wetlands in the study area. In addition, the river functions as a discharge for the right bank of Yellow River and a recharge source for the left bank. Thus, the wetland in the left bank relies more on river recharge than the right. These contrasting patterns of the hydrological process in the study area are probably due to a combination of hydrogeological conditions and topography.
The understandings of the hydrological process of wetlands along the middle reach of the Yellow River obtained from this study are critical for following researches in this area, and more monitoring work is required for further detailed research. This study also highlights the importance of taking regional groundwater flow into account when managing floodplain wetlands in groundwater discharge zones.
Author Contributions
Conceptualization, Y.F. and Y.D.; methodology, Y.D.; validation, Y.F., Y.D. and Z.X.; formal analysis, Y.F., Y.X.; investigation, Y.F., L.W.; resources, Y.F., Y.D.; data curation, Y.F., L.W.; writing—original draft preparation, Y.F.; writing—review and editing, Y.F., Y.D., Y.X.; visualization, Y.F.; supervision, Y.D.; project administration, Y.D., Z.X.; funding acquisition, Y.X. All authors have read and agreed to the published version of the manuscript.
Funding
The research is financially supported by the Science Foundation of Key Laboratory of Shale Gas and Geoengineering, Institute of Geology and Geophysics, Chinese Academy of Sciences (No. KLSG201704). Partial support was also provided by the National Science and Technology Major Project of China (Grant 2017ZX05008-003-021).
Acknowledgments
The research is financially supported by the Science Foundation of Key Laboratory of Shale Gas and Geoengineering, Institute of Geology and Geophysics, Chinese Academy of Sciences (No. KLSG201704). Partial support was also provided by the National Science and Technology Major Project of China (Grant 2017ZX05008-003-021). The authors thank the editors and anonymous reviewers for their helpful and insightful comments, which have significantly improved this work.
Conflicts of Interest
The authors declare no conflict of interest.
References
- Zedler, J.B.; Kercher, S. Wetland resources: Status, trends, ecosystem services, and restorability. Annu. Rev. Environ. Resour. 2005, 30, 39–74. [Google Scholar] [CrossRef] [Green Version]
- Bullock, A.; Acreman, M. The role of wetlands in the hydrological cycle. Hydrol. Earth Syst. Sci. 2003, 7, 358–389. [Google Scholar] [CrossRef] [Green Version]
- Opperman, J.J.; Luster, R.; McKenney, B.A.; Roberts, M.; Meadows, A.W. Ecologically Functional Floodplains: Connectivity, Flow Regime, and Scale. J. Am. Water Resour. Assoc. 2010, 46, 211–226. [Google Scholar] [CrossRef]
- Costanza, R.; de Groot, R.; Sutton, P.; van der Ploeg, S.; Anderson, S.J.; Kubiszewski, I.; Farber, S.; Turner, R.K. Changes in the global value of ecosystem services. Global. Environ. Chang. 2014, 26, 152–158. [Google Scholar] [CrossRef]
- Verhoeven, J.T.A.; Arheimer, B.; Yin, C.; Hefting, M.M. Regional and global concerns over wetlands and water quality. Trends Ecol. Evol. 2006, 21, 96–103. [Google Scholar] [CrossRef] [PubMed]
- Wan, L.; Zhang, Y.; Zhang, X.; Qi, S.; Na, X. Comparison of land use/land cover change and landscape patterns in Honghe National Nature Reserve and the surrounding Jiansanjiang Region, China. Ecol. Indic. 2015, 51, 205–214. [Google Scholar] [CrossRef]
- Wu, X.; Dong, W.; Lin, X.; Liang, Y.; Meng, Y.; Xie, W. Evolution of wetland in Honghe National Nature Reserve from the view of hydrogeology. Sci. Total. Environ. 2017, 609, 1370–1380. [Google Scholar] [CrossRef]
- Mendoza-Sanchez, I.; Phanikumar, M.S.; Niu, J.; Masoner, J.R.; Cozzarelli, I.M.; McGuire, J.T. Quantifying wetland–aquifer interactions in a humid subtropical climate region: An integrated approach. J. Hydrol. 2013, 498, 237–253. [Google Scholar] [CrossRef]
- Winter, T.C. Relation of streams, lakes, and wetlands to groundwater flow systems. Hydrogeol. J. 1999, 7, 28–45. [Google Scholar] [CrossRef]
- Wolski, P.; Savenije, H.H.G. Dynamics of floodplain-island groundwater flow in the Okavango Delta, Botswana. J. Hydrol. 2006, 320, 283–301. [Google Scholar] [CrossRef]
- Junk, W.J. Structure and Function of the Large Central Amazonian River Floodplains: Synthesis and Discussion. In The Central Amazon Floodplain: Ecology of a Pulsing System; Junk, W.J., Ed.; Springer: Berlin/Heidelberg, Germany, 1997; pp. 455–472. [Google Scholar]
- Junk, W.J.; Bayley, P.; Sparks, R. The Flood Pulse Concept in River-Floodplain Systems. Can. Spec. Publ. Fish. Aquat. Sci. 1989, 106, 110–127. [Google Scholar]
- Kingsford, R.T. Ecological impacts of dams, water diversions and river management on floodplain wetlands in Australia. Austral. Ecol. 2000, 25, 109–127. [Google Scholar] [CrossRef]
- Du Laing, G.; Rinklebe, J.; Vandecasteele, B.; Meers, E.; Tack, F.M.G. Trace metal behaviour in estuarine and riverine floodplain soils and sediments: A review. Sci. Total. Environ. 2009, 407, 3972–3985. [Google Scholar] [CrossRef]
- Hattermann, F.F.; Krysanova, V.; Habeck, A.; Bronstert, A. Integrating wetlands and riparian zones in river basin modelling. Ecol. Model. 2006, 199, 379–392. [Google Scholar] [CrossRef]
- Heimann, D.C.; Krempa, H.M. Cumulative Effects of Impoundments on the Hydrology of Riparian Wetlands al ong the Marmaton River, West-Central Missouri, USA. Wetlands 2011, 31, 135–146. [Google Scholar] [CrossRef]
- Javaheri, A.; Babbar-Sebens, M. On comparison of peak flow reductions, flood inundation maps, and velocity maps in evaluating effects of restored wetlands on channel flooding. Ecol. Eng. 2014, 73, 132–145. [Google Scholar] [CrossRef]
- Karim, F.; Kinsey-Henderson, A.; Wallace, J.; Arthington, A.H.; Pearson, R.G. Modelling wetland connectivity during overbank flooding in a tropical floodplain in north Queensland, Australia. Hydrol. Process. 2012, 26, 2710–2723. [Google Scholar] [CrossRef] [Green Version]
- Liu, Y.; Yang, W.; Wang, X. Development of a SWAT extension module to simulate riparian wetland hydrologic processes at a watershed scale. Hydrol. Process. 2008, 22, 2901–2915. [Google Scholar] [CrossRef]
- Jolly, I.D.; McEwan, K.L.; Holland, K.L. A review of groundwater-surface water interactions in arid/semi-arid wetlands and the consequences of salinity for wetland ecology. Ecohydrology 2008, 1, 43–58. [Google Scholar] [CrossRef]
- Ludwig, A.L.; Hession, W.C. Groundwater influence on water budget of a small constructed floodplain wetland in the Ridge and Valley of Virginia, USA. J. Hydrol. Reg. Stud. 2015, 4, 699–712. [Google Scholar] [CrossRef] [Green Version]
- Rahman, M.M.; Thompson, J.R.; Flower, R.J. An enhanced SWAT wetland module to quantify hydraulic interactions between riparian depressional wetlands, rivers and aquifers. Environ. Modell. Softw. 2016, 84, 263–289. [Google Scholar] [CrossRef] [Green Version]
- Guida, R.J.; Swanson, T.L.; Remo, J.W.F.; Kiss, T. Strategic floodplain reconnection for the Lower Tisza River, Hungary: Opportunities for flood-height reduction and floodplain-wetland reconnection. J. Hydrol. 2015, 521, 274–285. [Google Scholar] [CrossRef]
- Burnett, W.C.; Wattayakorn, G.; Supcharoen, R.; Sioudom, K.; Kum, V.; Chanyotha, S.; Kritsananuwat, R. Groundwater discharge and phosphorus dynamics in a flood-pulse system: Tonle Sap Lake, Cambodia. J. Hydrol. 2017, 549, 79–91. [Google Scholar] [CrossRef]
- McCarthy, T.S. Groundwater in the wetlands of the Okavango Delta, Botswana, and its contribution to the structure and function of the ecosystem. J. Hydrol. 2006, 320, 264–282. [Google Scholar] [CrossRef]
- Clay, A.; Bradley, C.; Gerrard, A.J.; Leng, M.J. Using stable isotopes of water to infer wetland hydrological dynamics. Hydrol. Earth Syst. Sci. 2004, 8, 1164–1173. [Google Scholar] [CrossRef]
- Krause, S.; Bronstert, A.; Zehe, E. Groundwater—surface water interactions in a North German lowland floodplain—Implications for the river discharge dynamics and riparian water balance. J. Hydrol. 2007, 347, 404–417. [Google Scholar] [CrossRef]
- House, A.R.; Thompson, J.R.; Acreman, M.C. Projecting impacts of climate change on hydrological conditions and biotic responses in a chalk valley riparian wetland. J. Hydrol. 2016, 534, 178–192. [Google Scholar] [CrossRef] [Green Version]
- House, A.R.; Thompson, J.R.; Sorensen, J.P.R.; Roberts, C.; Acreman, M.C. Modelling groundwater/surface water interaction in a managed riparian chalk valley wetland. Hydrol. Process. 2016, 30, 447–462. [Google Scholar] [CrossRef] [Green Version]
- Cartwright, I.; Werner, A.D.; Woods, J.A. Using geochemistry to discern the patterns and timescales of groundwater recharge and mixing on floodplains in semi-arid regions. J. Hydrol. 2019, 570, 612–622. [Google Scholar] [CrossRef]
- Cartwright, I.; Weaver, T.R.; Simmons, C.T.; Fifield, L.K.; Lawrence, C.R.; Chisari, R.; Varley, S. Physical hydrogeology and environmental isotopes to constrain the age, origins, and stability of a low-salinity groundwater lens formed by periodic river recharge: Murray Basin, Australia. J. Hydrol. 2010, 380, 203–221. [Google Scholar] [CrossRef]
- Cartwright, I.; Hofmann, H.; Sirianos, M.A.; Weaver, T.R.; Simmons, C.T. Geochemical and 222Rn constraints on baseflow to the Murray River, Australia, and timescales for the decay of low-salinity groundwater lenses. J. Hydrol. 2011, 405, 333–343. [Google Scholar] [CrossRef]
- Cendón, D.I.; Larsen, J.R.; Jones, B.G.; Nanson, G.C.; Rickleman, D.; Hankin, S.I.; Pueyo, J.J.; Maroulis, J. Freshwater recharge into a shallow saline groundwater system, Cooper Creek floodplain, Queensland, Australia. J. Hydrol. 2010, 392, 150–163. [Google Scholar] [CrossRef]
- Ladouche, B.; Weng, P. Hydrochemical assessment of the Rochefort marsh: Role of surface and groundwater in the hydrological functioning of the wetland. J. Hydrol. 2005, 314, 22–42. [Google Scholar] [CrossRef]
- Grapes, T.R.; Bradley, C.; Petts, G.E. Hydrodynamics of floodplain wetlands in a chalk catchment: The River Lambourn, UK. J. Hydrol. 2006, 320, 324–341. [Google Scholar] [CrossRef]
- Thompson, J.R.; Gavin, H.; Refsgaard, A.; Sorenson, H.R.; Gowing, D.J. Modelling the hydrological impacts of climate change on UK lowland wet grassland. Wetl. Ecol. Manag. 2009, 17, 503–523. [Google Scholar] [CrossRef] [Green Version]
- Frei, S.; Lischeid, G.; Fleckenstein, J.H. Effects of micro-topography on surface-subsurface exchange and runoff generation in a virtual riparian wetland—A modeling study. Adv. Water Resour. 2010, 33, 1388–1401. [Google Scholar] [CrossRef]
- Krause, S.; Bronstert, A. An advanced approach for catchment delineation and water balance modelling within wetlands and floodplains. Adv. Geosci. 2005, 5, 1–5. [Google Scholar] [CrossRef] [Green Version]
- Jiang, M. The Influence and Countermeasure Research of High-Speed Railway to the Yellow River. Master’s Thesis, Northwest A&F University, Shanxi, China, 2011. [Google Scholar]
- Li, E.; Mu, X.; Zhao, G. Temporal changes in annual runoff and influential factors in the upper and middle reaches of Yellow River from 1919–2010. Adv. Water Sci. 2014, 25, 155–163. [Google Scholar]
- Yan, M.; Li, F.; He, L.; Lu, M.; Chen, D. Effects of Summer Monsoon and Other Atmospheric Circulation Factors on Periodicities of Runoff in the Middle Huanghe River During 1919–2010. Sci. Geogr. Sin. 2016, 36, 917–925. [Google Scholar]
- Hou, G.; Liang, Y.; Su, X.; Zhao, Z.; Tao, Z.; Yin, L.; Yang, Y.; Wang, X. Groundwater Systems and Resources in the Ordos Basin, China. Acta Geol. Sin. Engl. Ed. 2008, 82, 1061–1069. [Google Scholar]
- Currell, M.J.; Cartwright, I.; Bradley, D.C.; Han, D. Recharge history and controls on groundwater quality in the Yuncheng Basin, north China. J. Hydrol. 2010, 385, 216–229. [Google Scholar] [CrossRef]
- Survey, C.G. Geological Atlas of China; Beijing Geological Publishing House: Beijing, China, 2002; p. 348. [Google Scholar]
- Yin, L.; Hou, G.; Su, X.; Wang, D.; Dong, J.; Hao, Y.; Wang, X. Isotopes (delta D and delta O-18) in precipitation, groundwater and surface water in the Ordos Plateau, China: Implications with respect to groundwater recharge and circulation. Hydrogeol. J. 2011, 19, 429–443. [Google Scholar] [CrossRef]
- Han, Y.; Yan, S.; Ma, H.; Zhang, H.; Wu, J.; Wang, Y.; Liang, X.; Xu, H.; Ma, T.; Tang, Z. Groundwater Resources and Environmental Issues Assessment in the Six Major Basin of Shanxi; Geological Publishing House: Beijing, China, 2008; p. 498. [Google Scholar]
- Zhou, Y.; Wang, Y.; Du, S.; Zhang, P.; Zhang, H.; Zhang, H. Division and characteristics of groundwater system in Guanzhong basin. Geol. Surv. China 2018, 5, 67–75. [Google Scholar]
- Wang, X.; Wang, S. Karst Water in the North of Weihe River and Its Environmental Geological Effect; Shaanxi Science and Technology Press: Xi’an, China, 2017. [Google Scholar]
- Zhang, M.; Zhu, L.; Wang, X. Groundwater systems and sustainable development countermeasures of groundwater resources in the Guanzhong. Quat. Sci. 2005, 1, 15–22. [Google Scholar]
- Zhou, Y.; Guo, X.; Zhao, X. Study on the Development and Utilization of Groundwater Resources in Shanxi Province; Shanxi Science and Technology Press: Taiyuan, China, 2013; p. 826. [Google Scholar]
- Qiao, G.; Du, L.; Zhu, Y.; Yang, B.; Zhao, A.; Xu, D. Evaluation and continual using counter measures of groundwater resources in Dali county. J. Arid Land Resour. Environ. 2010, 24, 72–76. [Google Scholar]
- Li, X. Study on the Risk of Groundwater Pollution in Yuncheng Basin, Shanxi Province. Master’s Thesis, China University of Geosciences (Beijing), Beijing, China, 2018. [Google Scholar]
- Nash, J.E.; Sutcliffe, J.V. River flow forecasting through conceptual models part I—A discussion of principles. J. Hydrol. 1970, 10, 282–290. [Google Scholar] [CrossRef]
- Henriksen, H.J.; Troldborg, L.; Hojberg, A.L.; Refsgaard, J.C. Assessment of exploitable groundwater resources of Denmark by use of ensemble resource indicators and a numerical groundwater-surface water model. J. Hydrol. 2008, 348, 224–240. [Google Scholar] [CrossRef]
- Xie, T.; Liu, X.; Sun, T. The effects of groundwater table and flood irrigation strategies on soil water and salt dynamics and reed water use in the Yellow River Delta, China. Ecol. Model. 2011, 222, 241–252. [Google Scholar] [CrossRef]
Figure 1.
Location of the study area: (A) shows the geographic location of the study area within the Yellow River (marked in the red square); (B) is the close-up of the study area; and (C) shows the three groundwater monitoring transects that this study focused on.
Figure 1.
Location of the study area: (A) shows the geographic location of the study area within the Yellow River (marked in the red square); (B) is the close-up of the study area; and (C) shows the three groundwater monitoring transects that this study focused on.

Figure 2.
Hydrogeological units in study area (A), and the generalized cross-section across the Yellow River (B), showing the distribution of the main units and the generalized regional groundwater flow paths.
Figure 2.
Hydrogeological units in study area (A), and the generalized cross-section across the Yellow River (B), showing the distribution of the main units and the generalized regional groundwater flow paths.

Figure 3.
Wetland areas in the wet seasons of 2014–2019: the bare shoals are referred to as exposed areas in a river without vegetation, but flooded by water from time to time. The continuously inundated area was identified as areas covered by water for most of the year. The vegetation area was the zone covered by plants, primarily by reeds.

Figure 4.
Wetland areas in the dry seasons of 2014–2019: the bare shoals are referred to as exposed areas in a river without vegetation, but flooded by water from time to time. The continuously inundated area was identified as the areas covered by water for most of the year. The vegetation area was the zone covered by plants, primarily by reeds.

Figure 5.
Changes in the wetland area and the river runoff from 2014 to 2019.

Figure 6.
Comparison of the simulated and the measured data for the river stage at the Longmen gauging station on the left panel and the river flow rate at the Tongguan gauging station on the right panel.
Figure 6.
Comparison of the simulated and the measured data for the river stage at the Longmen gauging station on the left panel and the river flow rate at the Tongguan gauging station on the right panel.

Figure 7.
Comparison of the simulated with the observed groundwater levels.

Figure 8.
Observed groundwater heads, simulated river stages and their correlations at three transects. River stages on the groundwater monitoring transects were acquired from the numerical model.
Figure 8.
Observed groundwater heads, simulated river stages and their correlations at three transects. River stages on the groundwater monitoring transects were acquired from the numerical model.

Figure 9.
Exchange flux between the river and the wetland at points during the simulation period (positive value represented that the groundwater is recharging the river, negative value indicated that the river supplies groundwater); inflow flux of both banks from the regional groundwater flow.
Figure 9.
Exchange flux between the river and the wetland at points during the simulation period (positive value represented that the groundwater is recharging the river, negative value indicated that the river supplies groundwater); inflow flux of both banks from the regional groundwater flow.


Table 1.
Performance criteria for the model evaluation.
| Performance Indicator | Excellent | Good | Fair | Poor |
|---|---|---|---|---|
| >0.85 | 0.65–0.85 | 0.50–0.65 | <0.50 | |
| R | >0.85 | 0.65–0.85 | 0.50–0.65 | <0.50 |
Table 2.
Parameters obtained for the best fit simulation and ranges for the sensitivity analysis. Type of parameters are separated into the measured/literature value and calibrated values.
Table 2.
Parameters obtained for the best fit simulation and ranges for the sensitivity analysis. Type of parameters are separated into the measured/literature value and calibrated values.
| Component | Parameter | Unit | Type of Data | Value |
|---|---|---|---|---|
| Climate | Precipitation rate | mm/d | Literature (NOAA) | 1.20–53.60 |
| Net rainfall fraction | - | literature | 0.14–0.32 | |
| Overland flow | Manning’s coefficient | sm−1/3 | calibrated | 0.08 |
| Saturated zone | Hydraulic conductivity for Quaternary aquifer (vertical and horizontal) | m/s | calibrated | 1.4 × 10⁶ |
| Specific yield for Quaternary aquifer | - | literature | 0.02 | |
| Specific storage for Quaternary aquifer | 1/m | calibrated | 1.0 × 10⁴ | |
| Hydraulic conductivity for karstic aquifer (vertical and horizontal) | m/s | calibrated | 4.8 × 10⁵ | |
| Specific yield for karstic aquifer | - | literature | 0.035 | |
| Specific storage for karstic aquifer | 1/m | calibrated | 1.0 × 10⁵ | |
| Drainage level (values relative to ground) | m | calibrated | 0.5 | |
| Drainage time constant | s−1 | calibrated | 5.6 × 10⁶ | |
| River and lakes | River bed resistance | sm−1/3 | measured | 0.058–0.150 |
© 2020 by the authors. Licensee MDPI, Basel, Switzerland. This article is an open access article distributed under the terms and conditions of the Creative Commons Attribution (CC BY) license (http://creativecommons.org/licenses/by/4.0/).
Share and Cite
MDPI and ACS Style
Fu, Y.; Dong, Y.; Xie, Y.; Xu, Z.; Wang, L. Impacts of Regional Groundwater Flow and River Fluctuation on Floodplain Wetlands in the Middle Reach of the Yellow River. Water 2020, 12, 1922. https://doi.org/10.3390/w12071922
AMA Style
Fu Y, Dong Y, Xie Y, Xu Z, Wang L. Impacts of Regional Groundwater Flow and River Fluctuation on Floodplain Wetlands in the Middle Reach of the Yellow River. Water. 2020; 12(7):1922. https://doi.org/10.3390/w12071922
Chicago/Turabian StyleFu, Yunmei, Yanhui Dong, Yueqing Xie, Zhifang Xu, and Liheng Wang. 2020. "Impacts of Regional Groundwater Flow and River Fluctuation on Floodplain Wetlands in the Middle Reach of the Yellow River" Water 12, no. 7: 1922. https://doi.org/10.3390/w12071922
Note that from the first issue of 2016, this journal uses article numbers instead of page numbers. See further details here.