Multi-Source Data Modeling of the Spatial Distribution of Winter Wheat Yield in China from 2000 to 2015


1
State Key Laboratory of Resources and Environmental Information System, Institute of Geographic Sciences and Natural Resources Research, Chinese Academy of Sciences, Beijing 100101, China
2
University of Chinese Academy of Sciences, Beijing 100049, China
*
Author to whom correspondence should be addressed.
Sustainability 2020, 12(13), 5436; https://doi.org/10.3390/su12135436
Submission received: 14 May 2020
/
Revised: 23 June 2020
/
Accepted: 5 July 2020
/
Published: 6 July 2020
(This article belongs to the Special Issue Effects of Climate Change on Sustainable Agriculture)
Abstract
:Yield gridded datasets are essential for agricultural land management, food security and harmonious human–land relationships. Many studies have developed yield spatialization models that are based on cropland areas. However, crop planting areas, phenological dates, and net primary production (NPP) have received minimal attention. This study proposes a novel method to simulate winter wheat yields in China from 2000 to 2015 using crop phenological datasets, phenological observations, and NPP. The results showed that the NPP in the growing season and statistical yield showed a significant positive correlation (R2 = 0.93, p < 0.01). The mean prediction error of the gridded yield dataset was 12.01%. The relative errors of the gridded yield dataset for approximately half of the samples were between −10% and 10%. Furthermore, the yield distribution was high in the east and low in the west. The high yield was primarily concentrated in the North China Plain, while low yield was observed in eastern Gansu, central Shanxi, southern Hebei, and eastern Sichuan. From 2000 to 2015, the yield mainly showed an increasing trend in the study area, with the average rate of 0.17 t ha−1 yr−1, especially in the North China Plain. This study suggests that NPP is a key indicator to evaluate the yield of winter wheat. Furthermore, this method can be used to generate gridded yield maps along with providing credible and fundamental data for climate change and sustainable agricultural development.
1. Introduction
The yield spatial distribution refers to the distribution of the yield in a certain region within a certain time. According to differences in data sources, the methods of estimating the spatial distribution of crop yield can be classified into two categories. The first category can estimate the spatial distribution of yields that are based on yield spatialization [1,2]. Yield statistical data, which are compiled according to political or administrative units, are the reliable data source of spatialization model. The second category usually estimates yield based on remote sensing images. Generally, the relationship between remote sensing products and harvest yield can be established for estimating yield [3,4]. These remote sensing products, including net primary production (NPP), normalized difference vegetation index (NDVI), and enhanced vegetation index (EVI), have been used for estimating yield [3,5,6,7]. They have the characteristics of real time, rapidity, and wide cover range, which provide the fundamental data for yield estimation [4,8]. Furthermore, statistical and remote sensing data are instrumental in yield gridded data estimation, and can be auxiliary to one another. However, yield spatialization using remote sensing data is lacking. Therefore, developing yield spatialization that is based on multi-source data is essential for yield estimation that is based on statistical and remote sensing data.
Socioeconomic data spatialization has become a focus area of geography and social science since the concept of spatialization was proposed in the 1990s [9]. Currently, research on the spatialization of socioeconomic data mainly focuses on population and GDP. Several methodologies, which include partition density, multiple regression, and multi-agent, have been applied to spatialization. A series of gridded datasets have been developed, which includes the Gridded Population of the World (GPW) [10], the China 1 km-grid population dataset [11], and the China 1 km-grid GDP dataset [12]. These gridded datasets are extensively used for urbanization, regional planning, and disaster management [13,14,15]. However, the spatialization of yield is different from population and GDP because yield is influenced by natural conditions and human management. This causes difficulties in yield spatialization.
Croplands, which included paddy land and dry land, were widely used in yield spatialization. For example, Liu and Li (2012) proposed a yield spatialization model that was based on croplands and population density data, and simulated the spatial distribution of 1 km-grid grain yields in China [2]. Liao et al. (2015), Ji (2016) and He et al. (2017) simulated the grain yield based on croplands and statistical yield [1,16,17]. However, existing studies have the following shortcomings. These studies established the relationship between cropland areas and statistical yields that resulted in consistent yield within the modeling unit, but could not demonstrate the spatial differences in a modeling unit. Furthermore, yields are difficult to generate because of the complicated cultivated system and phenology. Therefore, an appropriate indicator is critical to yield spatialization.
High-resolution spatially explicit information on crop phenology enables the distinction between crop planting areas. Recently, Luo et al. (2020) retrieved a 1 km-grid crop phenological dataset for three main crops (wheat, maize, and rice) from 2000 to 2015 that were based on Global Land Surface Satellite (GLASS) Leaf Area Index (LAI) products [18]. This dataset had a high accuracy in the retrieved phenological date, with a retrieved phenological date error of fewer than 10 days. The different phenological dates of crops allowed the planting area, such as spring wheat and winter wheat, to be distinguished from one another.
Remote sensing data have advantages in regional yield estimation [3,5,6,7]. In particular, NPP, which is the amount of energy or organic matter produced through photosynthesis minus respiration of vegetation per unit of area and time, was widely used in yield estimation [19,20,21]. It can represent the above biomass, and have the advantage of monitoring and evaluating crop growth conditions [3]. Studies have reported out that there is a conversion relationship between NPP and yield [7,22,23,24]. Therefore, NPP can be a feasible indicator of yield.
The aim of this study is to develop a novel yield spatialization method that is based on multi-source data, which includes planting area, phenological dates, and NPP. This method makes full use of the advantages of statistical and remote sensing data. The relationship between NPP in the growing season and statistical yield is also assessed. Winter wheat is used as an example to showcase that this method provides an effective approach to generate a gridded yield dataset.
2. Materials and Methods
2.1. Study Area
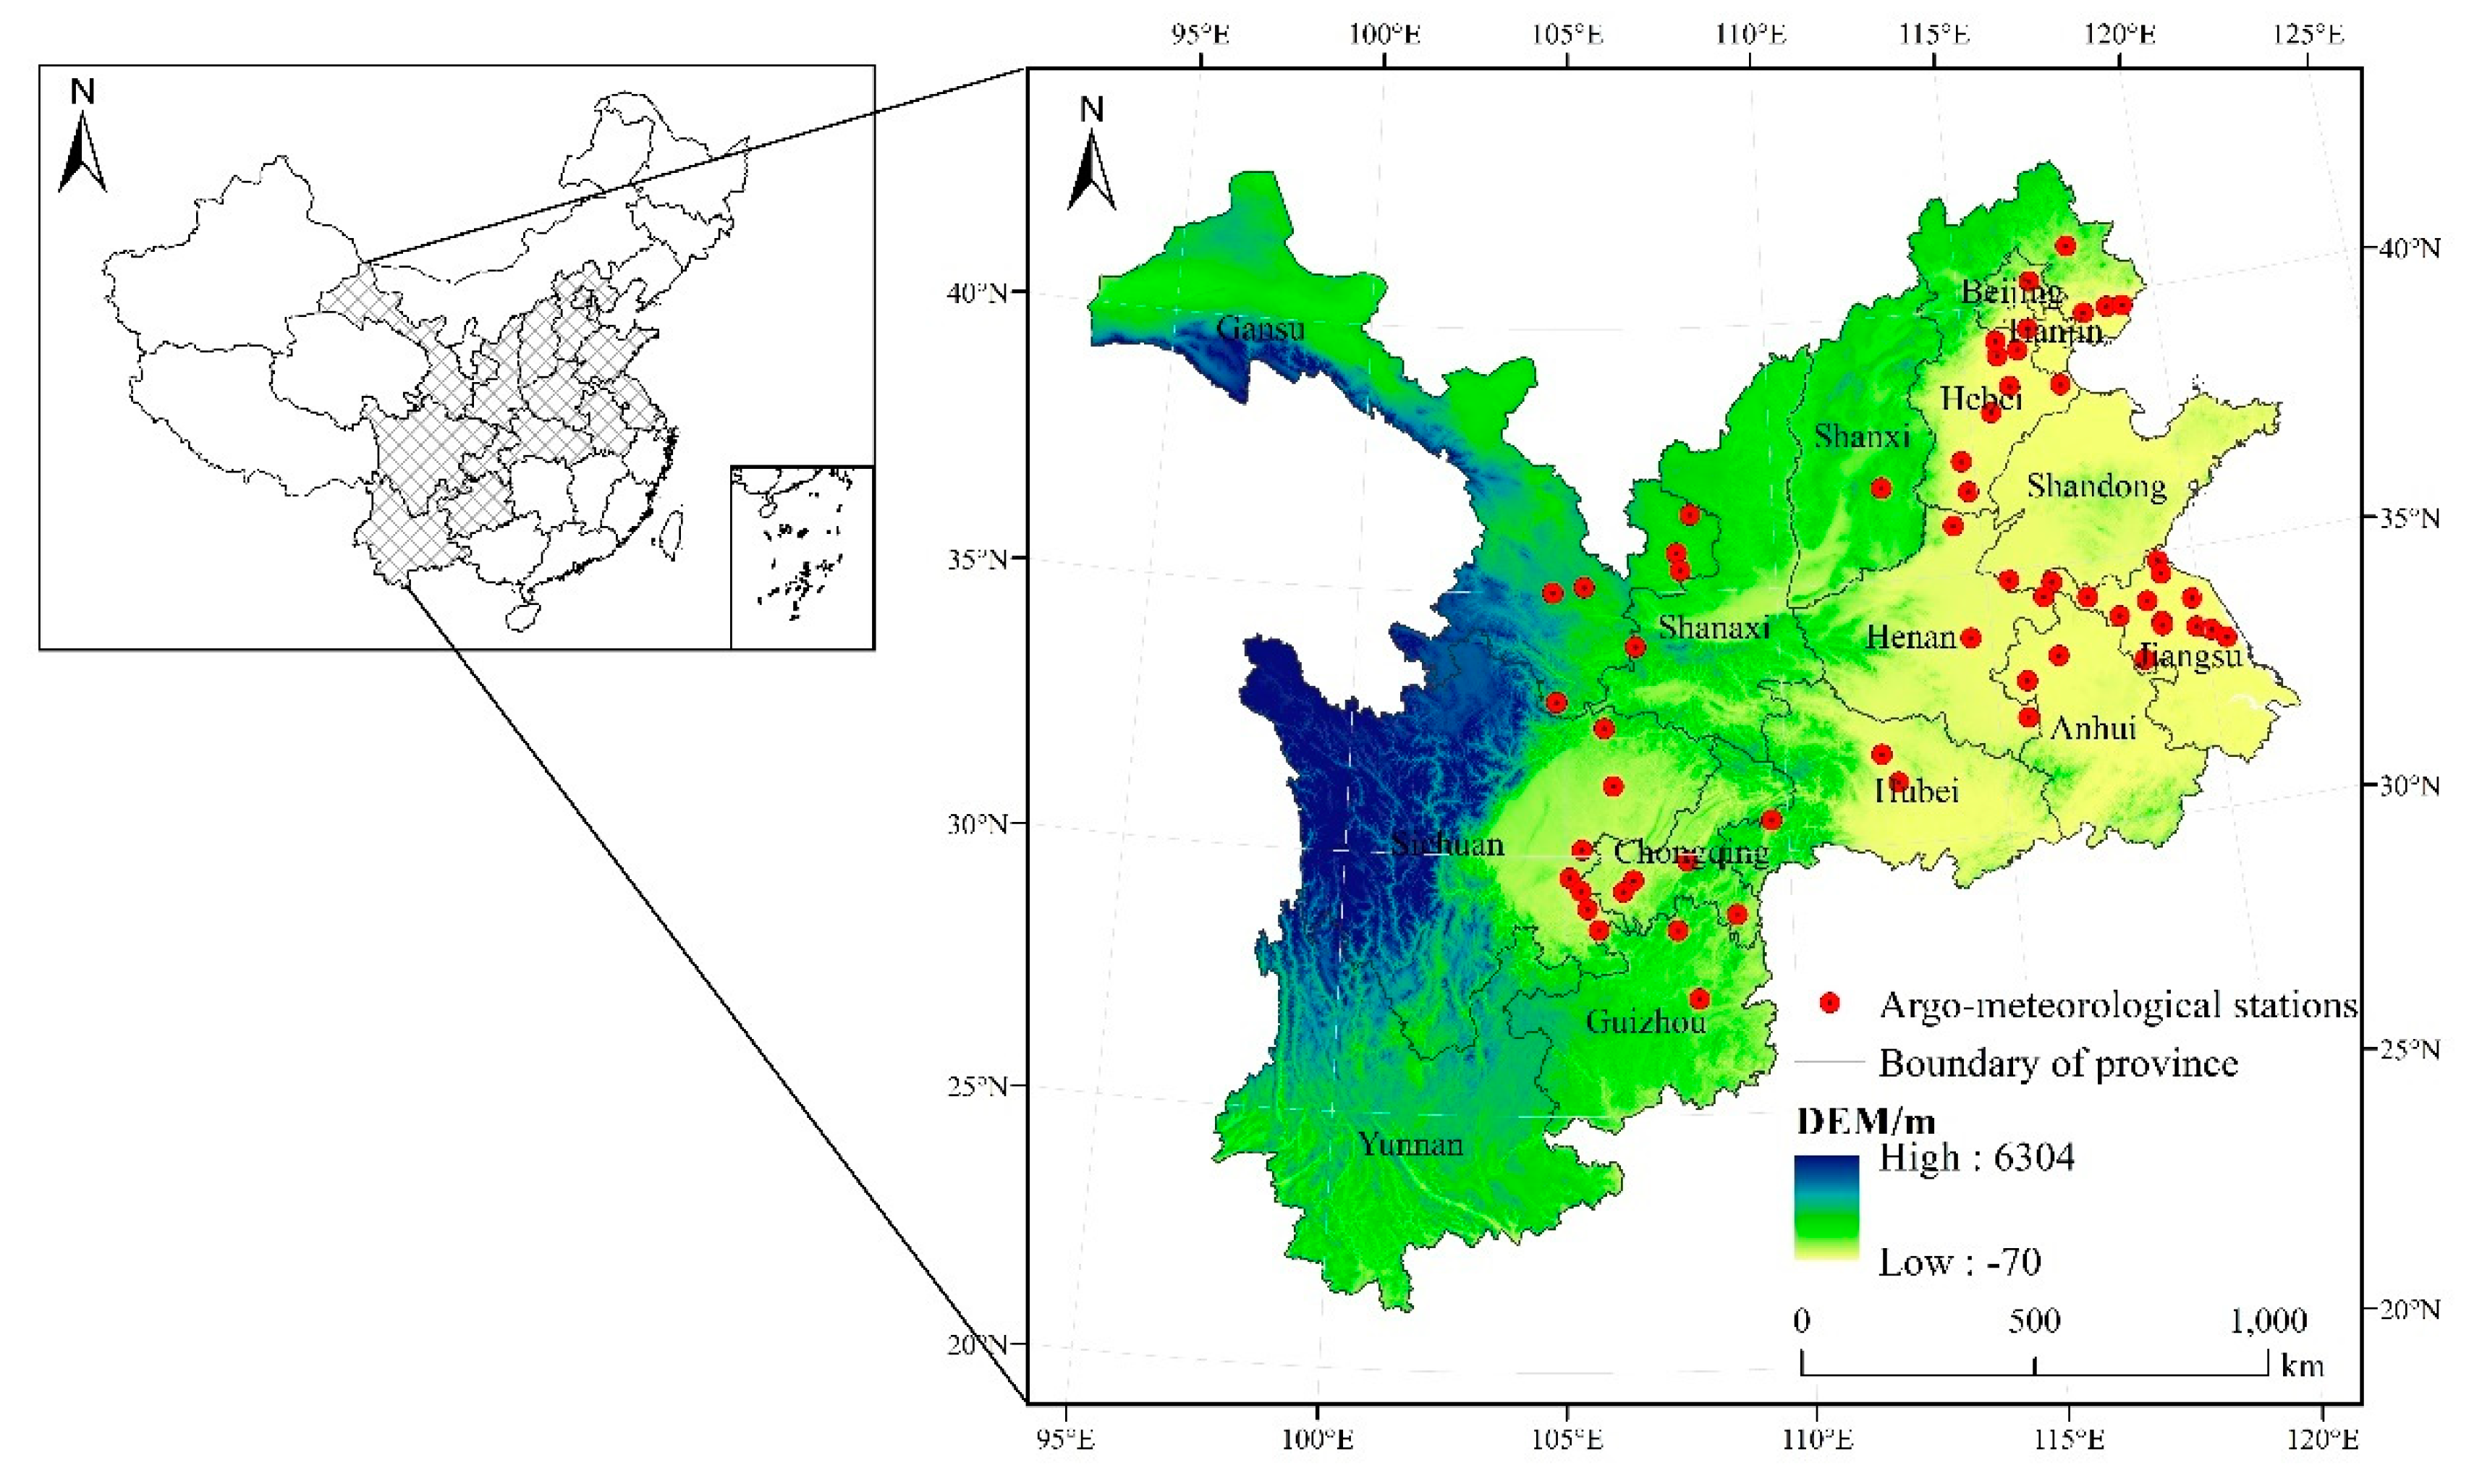
Wheat, one of the major food crops in China, is planted in most regions of the country [25]. The country could be divided into three production areas of wheat: the spring wheat region, the northern winter wheat region, and the southern winter wheat region. The cultivation areas of wheat are mainly distributed in northern China, the northern region of Northeast China and the north-eastern area of Southwest China [26]. According to the Chinese National Bureau of Statistics, the planting area of wheat in China in 2018 was 24.51 million hectares, of which winter wheat accounted for 93% [27]. This study was performed in the main planting area of winter wheat in China (Figure 1). This region has an area of 2.86 million km2 and is located at 92°44′~122°41′ E and 21°07′~42°48′ N. It is mainly located in temperate and subtropical monsoon climate zones of China, characterized by a synchronization of high temperature and ample precipitation. The average annual temperature and precipitation are approximately 10.4 °C and 800 mm, respectively.
2.2. Data Sources
A 1 km-grid crop phenological dataset, phenological observations from argo-meteorological stations, a 1 km-grid NPP dataset, statistical yields, and administrative data were used in this study, as shown in Table 1.
The 1 km-grid crop phenological dataset, which was derived from figshare, was used to determine the planting area of winter wheat [28]. This included the key phenological date for three main crops (rice, wheat, and maize) of China from 2000 to 2015. The Day of Year (DOY) of green-up/emergence date, heading date, and the maturity date was recorded for wheat. Accuracy verification shows that the root mean square error (RMSE) averages of wheat phenological dates were 5.5 days, which met the requirements of planting area extraction [18].
The months of sowing and maturity of winter wheat were determined using phenological observations from argo-meteorological stations from 1994 to 2013, which were derived from the China Integrated Meteorological Information Service System (CIMISS). These data included crop phenological information, such as crop growth period and dates of phenological stages. This information was observed and recorded by well-trained agricultural technicians in the experimental field. This study extracted the average annual DOYs of sowing and maturity stages. A total of 58 stations were used in this study.
The 1 km-grid NPP dataset was derived from the Global Change Research Data Publishing and Repository. This dataset was collected to calculate the cumulative NPP during the growing season of winter wheat [29]. This dataset was calculated using the Carnegie Ames Stanford approach (CASA) model, which has been widely used to estimate NPP, with a monthly temporal resolution [30].
Statistical yield data included winter wheat yield at the provincial and city scale from 2000 to 2015. The provincial yield data were derived from the Nation Bureau of Statistics of China. The data accuracy was verified using yield data collected at the city scale. These data were derived from the locality statistical yearbook.
2.3. Methods
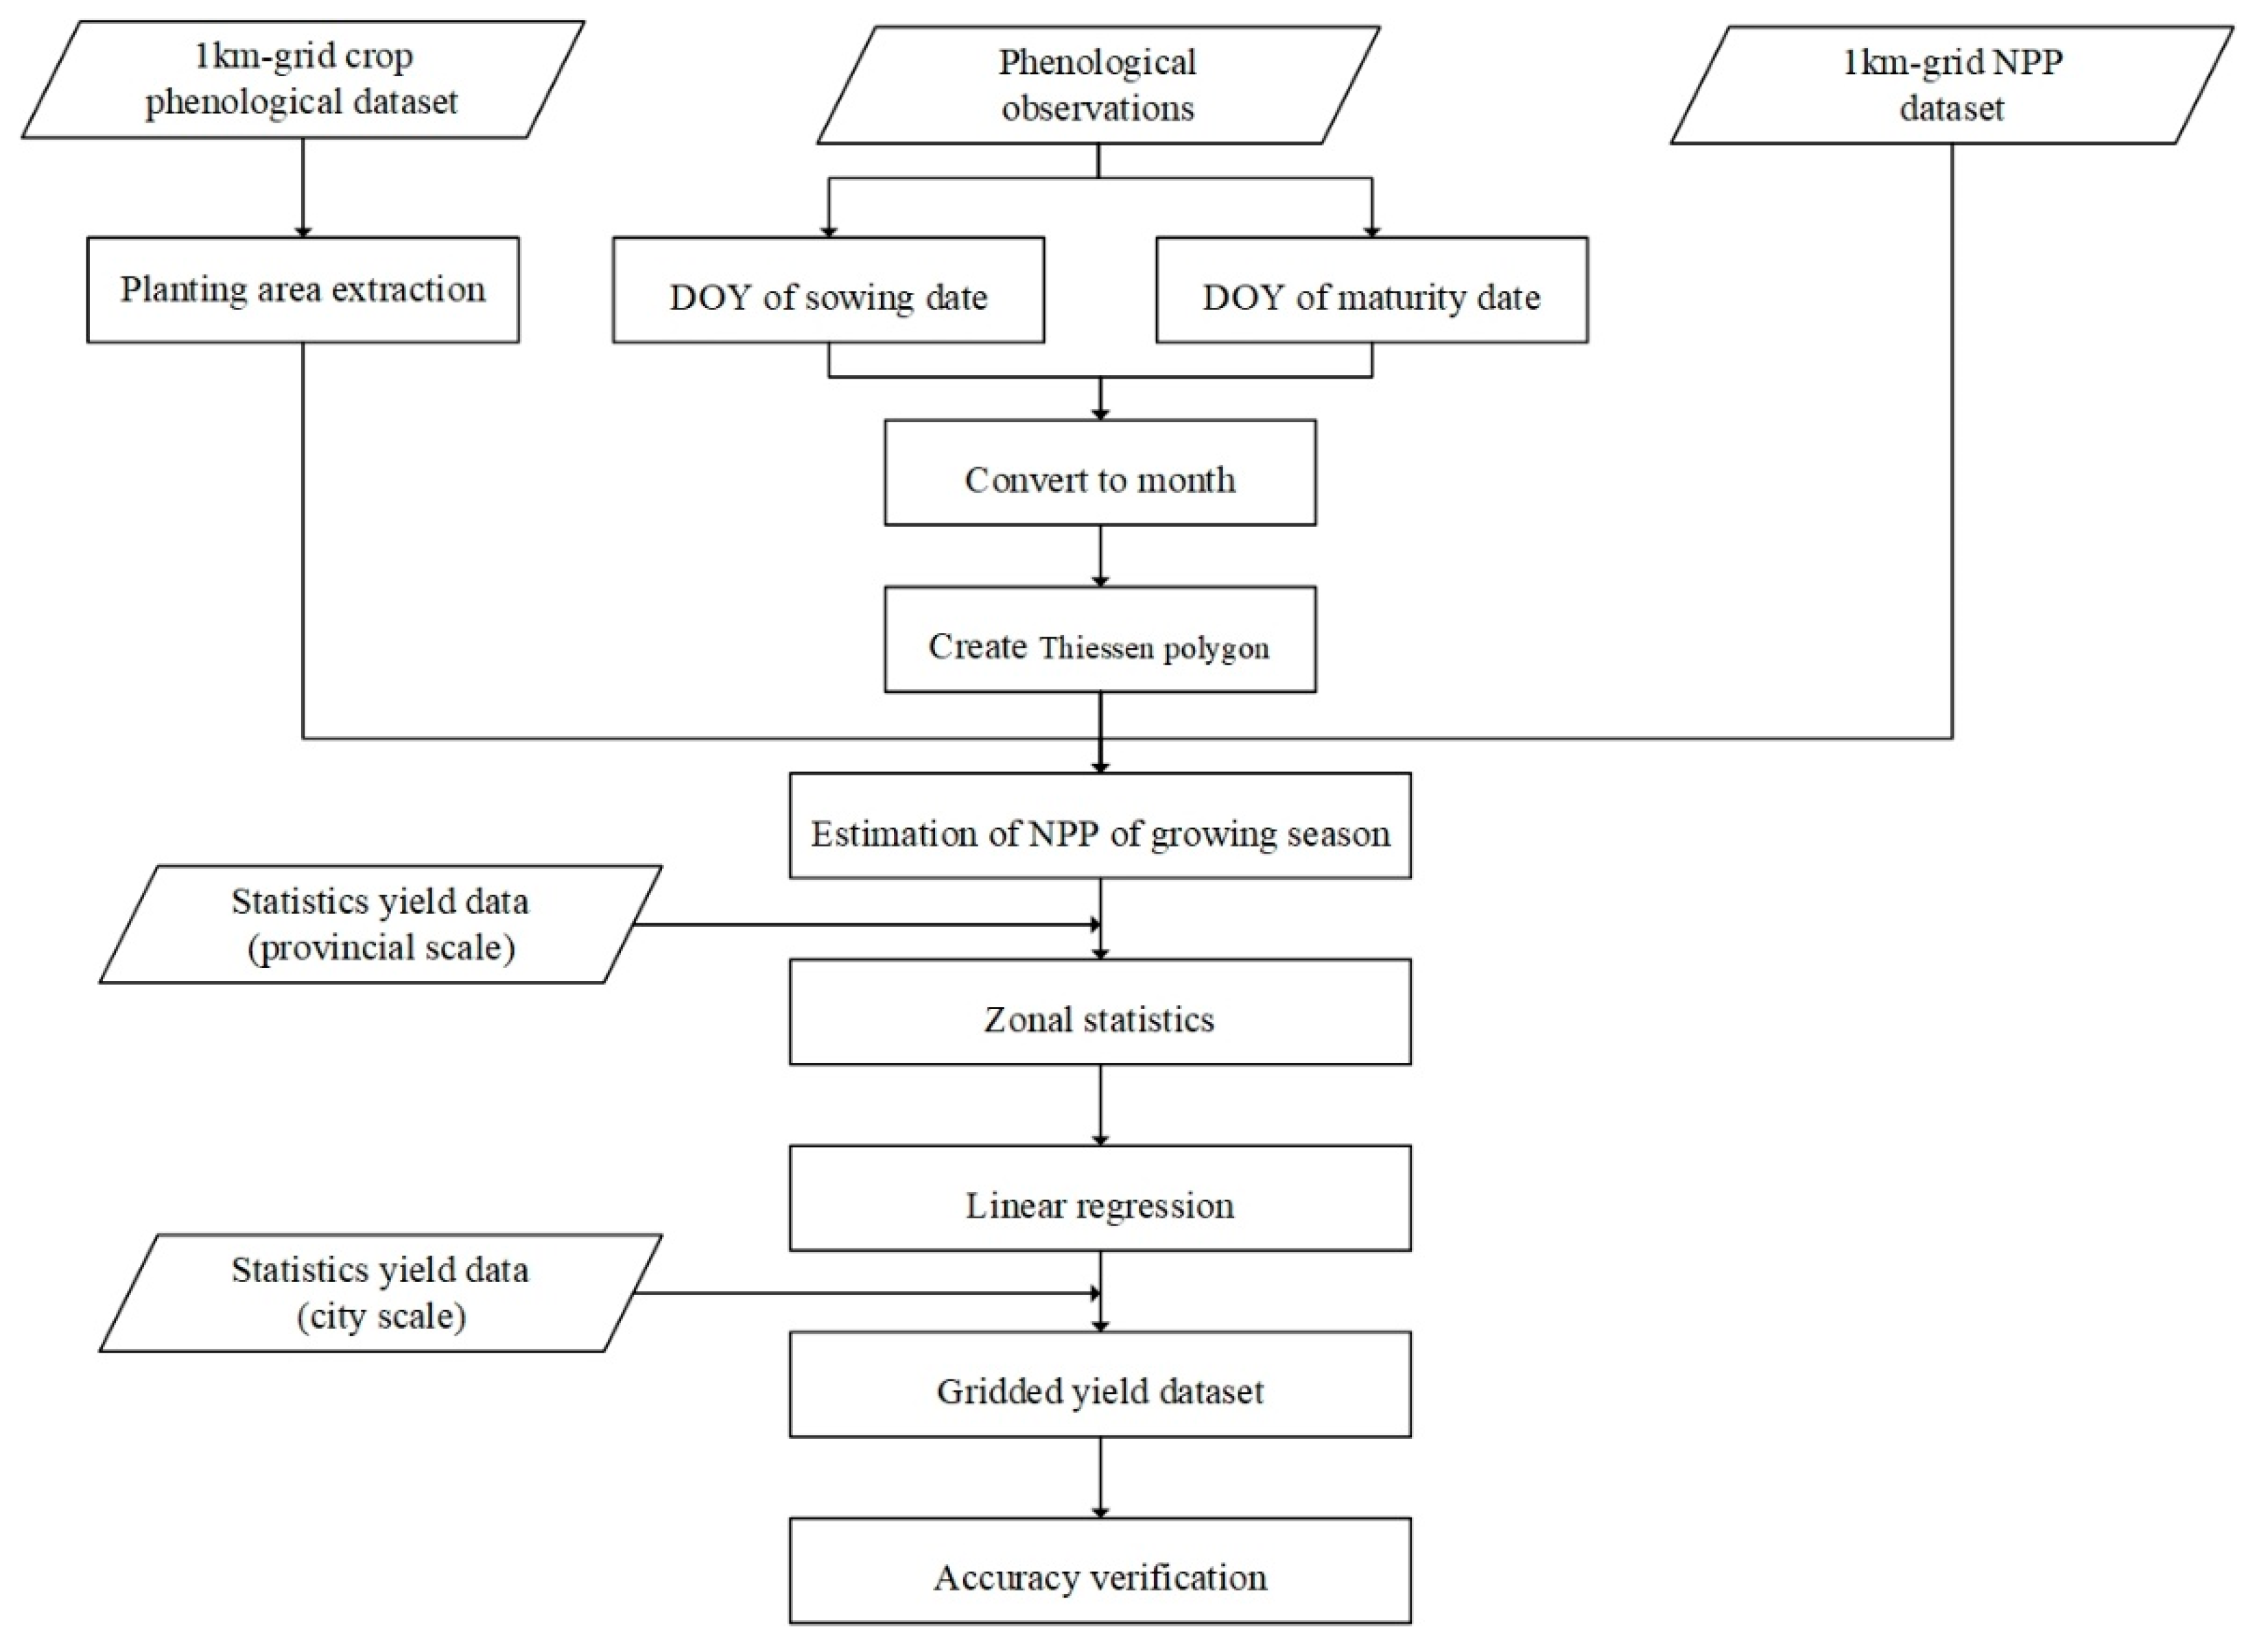
The flowchart of this study is shown in Figure 2. First, the planting areas were extracted based on a 1 km-grid crop phenological dataset along with the months of sowing and maturity that were determined using phenological observations. Second, the cumulative NPP during the growing season of winter wheat was calculated based on the planting area, the months of sowing and maturity, and the 1 km-grid NPP dataset. Third, the yield spatialization model was established using the NPP of the growing season, along with the yield gridded dataset generated from 2000 to 2015. Finally, the accuracy of the yield gridded dataset was verified.
2.3.1. Extraction of Winter Wheat Planting Area
The 1 km-grid crop phenological dataset can be used to determine the planting area owing to different phenological dates, such as spring wheat and winter wheat. Luo et al. (2020) reported that green-up dates of winter wheat are earlier than the emergence dates of spring wheat [18]. Therefore, the winter planting area could be extracted by setting a threshold of green-up dates. The green-up dates of winter wheat in China usually start in February to late March. Additionally, the annual average of green-up dates in the study area is recorded using phenological observations. The green-up dates ranged from 44 (DOY) in Jianhu station to 89 (DOY) in Qinxian station. The histogram of green-up dates was established using the 1 km-grid crop phenological dataset. Approximately 90% of the values were lower than 90. As a result, 90 was selected as the threshold of green-up dates to extract the planting area of winter wheat in this study.
2.3.2. Determination of the Months of Sowing and Maturity
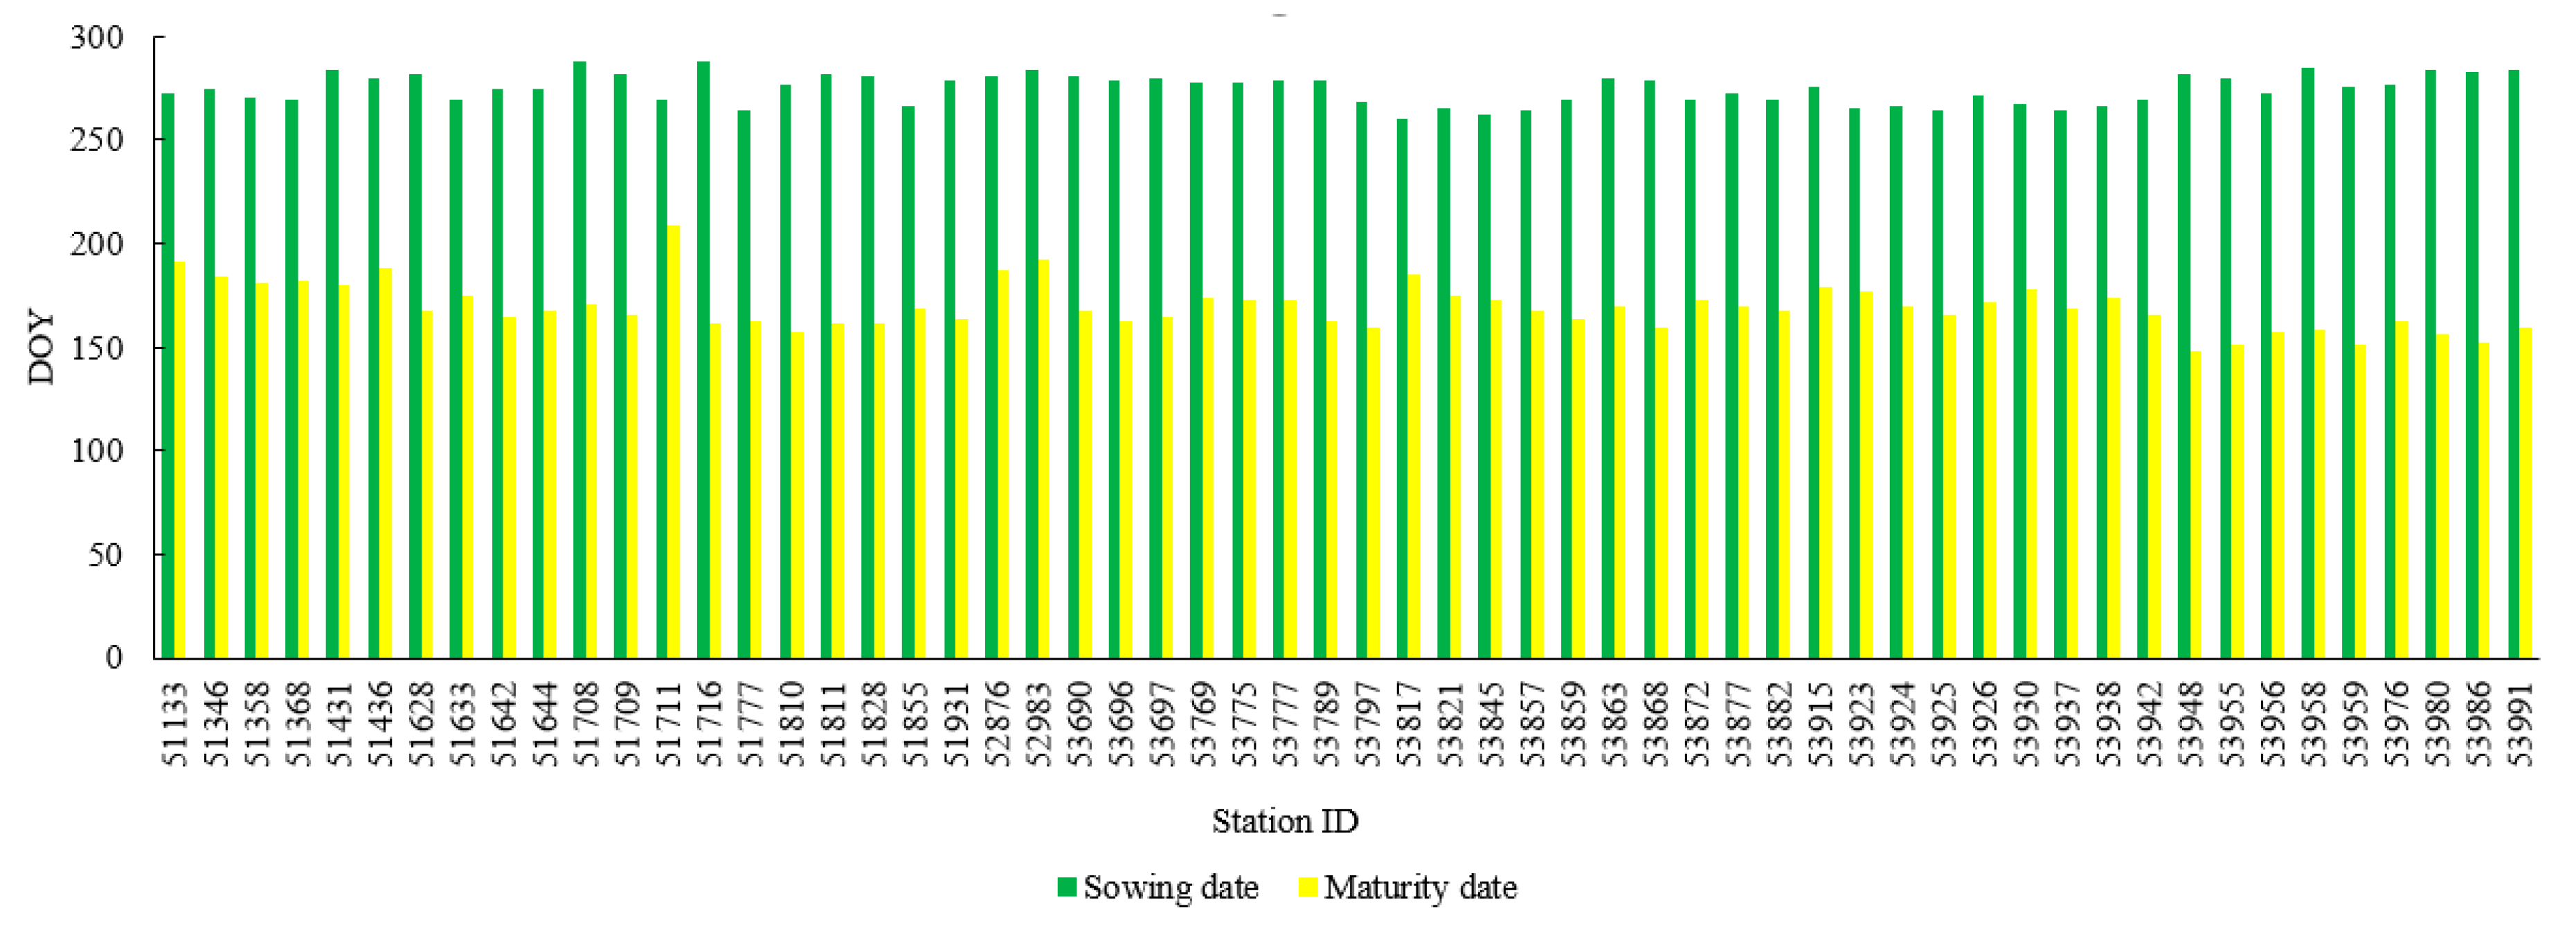
The months of sowing and maturity were determined using phenological observations from Argo-meteorological stations from 1994 to 2013. First, the DOYs of sowing and maturity stages in each station were extracted every year. This was followed by calculating the annual averages of sowing and maturity stages that are shown in Figure 3. Third, the DOYs of sowing and maturity were converted to months. Finally, the Thiessen polygon method was used to obtain the spatial distribution of the sowing and maturity months.
2.3.3. Estimation of NPP during the Growing Season
The sowing and maturity months were identified in Section 2.3.2. Subsequently, NPP during the growing season was estimated using Equation (1):
where NPPG is the NPP during the growing season, ms and mm are the months of sowing and maturity, and NPPi is the ith pixel of the NPP.
2.3.4. Yield Spatialization Model
A linear regression model was used to simulate the spatial distribution of the yields. The model used the NPP to evaluate the yield of winter wheat. The model was calculated using Equation (2):
where Yi is the statistical yield in the ith province, (NPPG)i,j is the jth pixel of NPPG in the ith province, is the yield distribution coefficient, and b is a constant. According to the principle of “no land, no yield”, b equals to 0.
2.3.5. Methods of Accuracy Verification
The gridded yield dataset was simulated at the provincial scale. The most credible method to verify the accuracy of the results was to choose the lower level of the province. Therefore, statistical yields at the city scale were selected. This study randomly selected 10 cities each year to verify the accuracy because of data availability. Mean prediction error (MPE) in Equation (3) and relative error (RE) in Equation (4) were used for accuracy verification:
where Ys and Yc are the simulated yield and statistical yield, respectively, i represents the ith city, and m is the number of cities.
2.3.6. Trend Analysis
Trend analysis was used to analyze the annual change rate for winter yields from 2000 to 2015:
where slope is the change rate and yieldi represents the yield in the ith year. n is the number of years, which equals 16 in this case. An F test was used to test the significance.
3. Results
3.1. Spatial Distribution of NPP during the Growing Season of Winter Wheat from 2000 to 2015
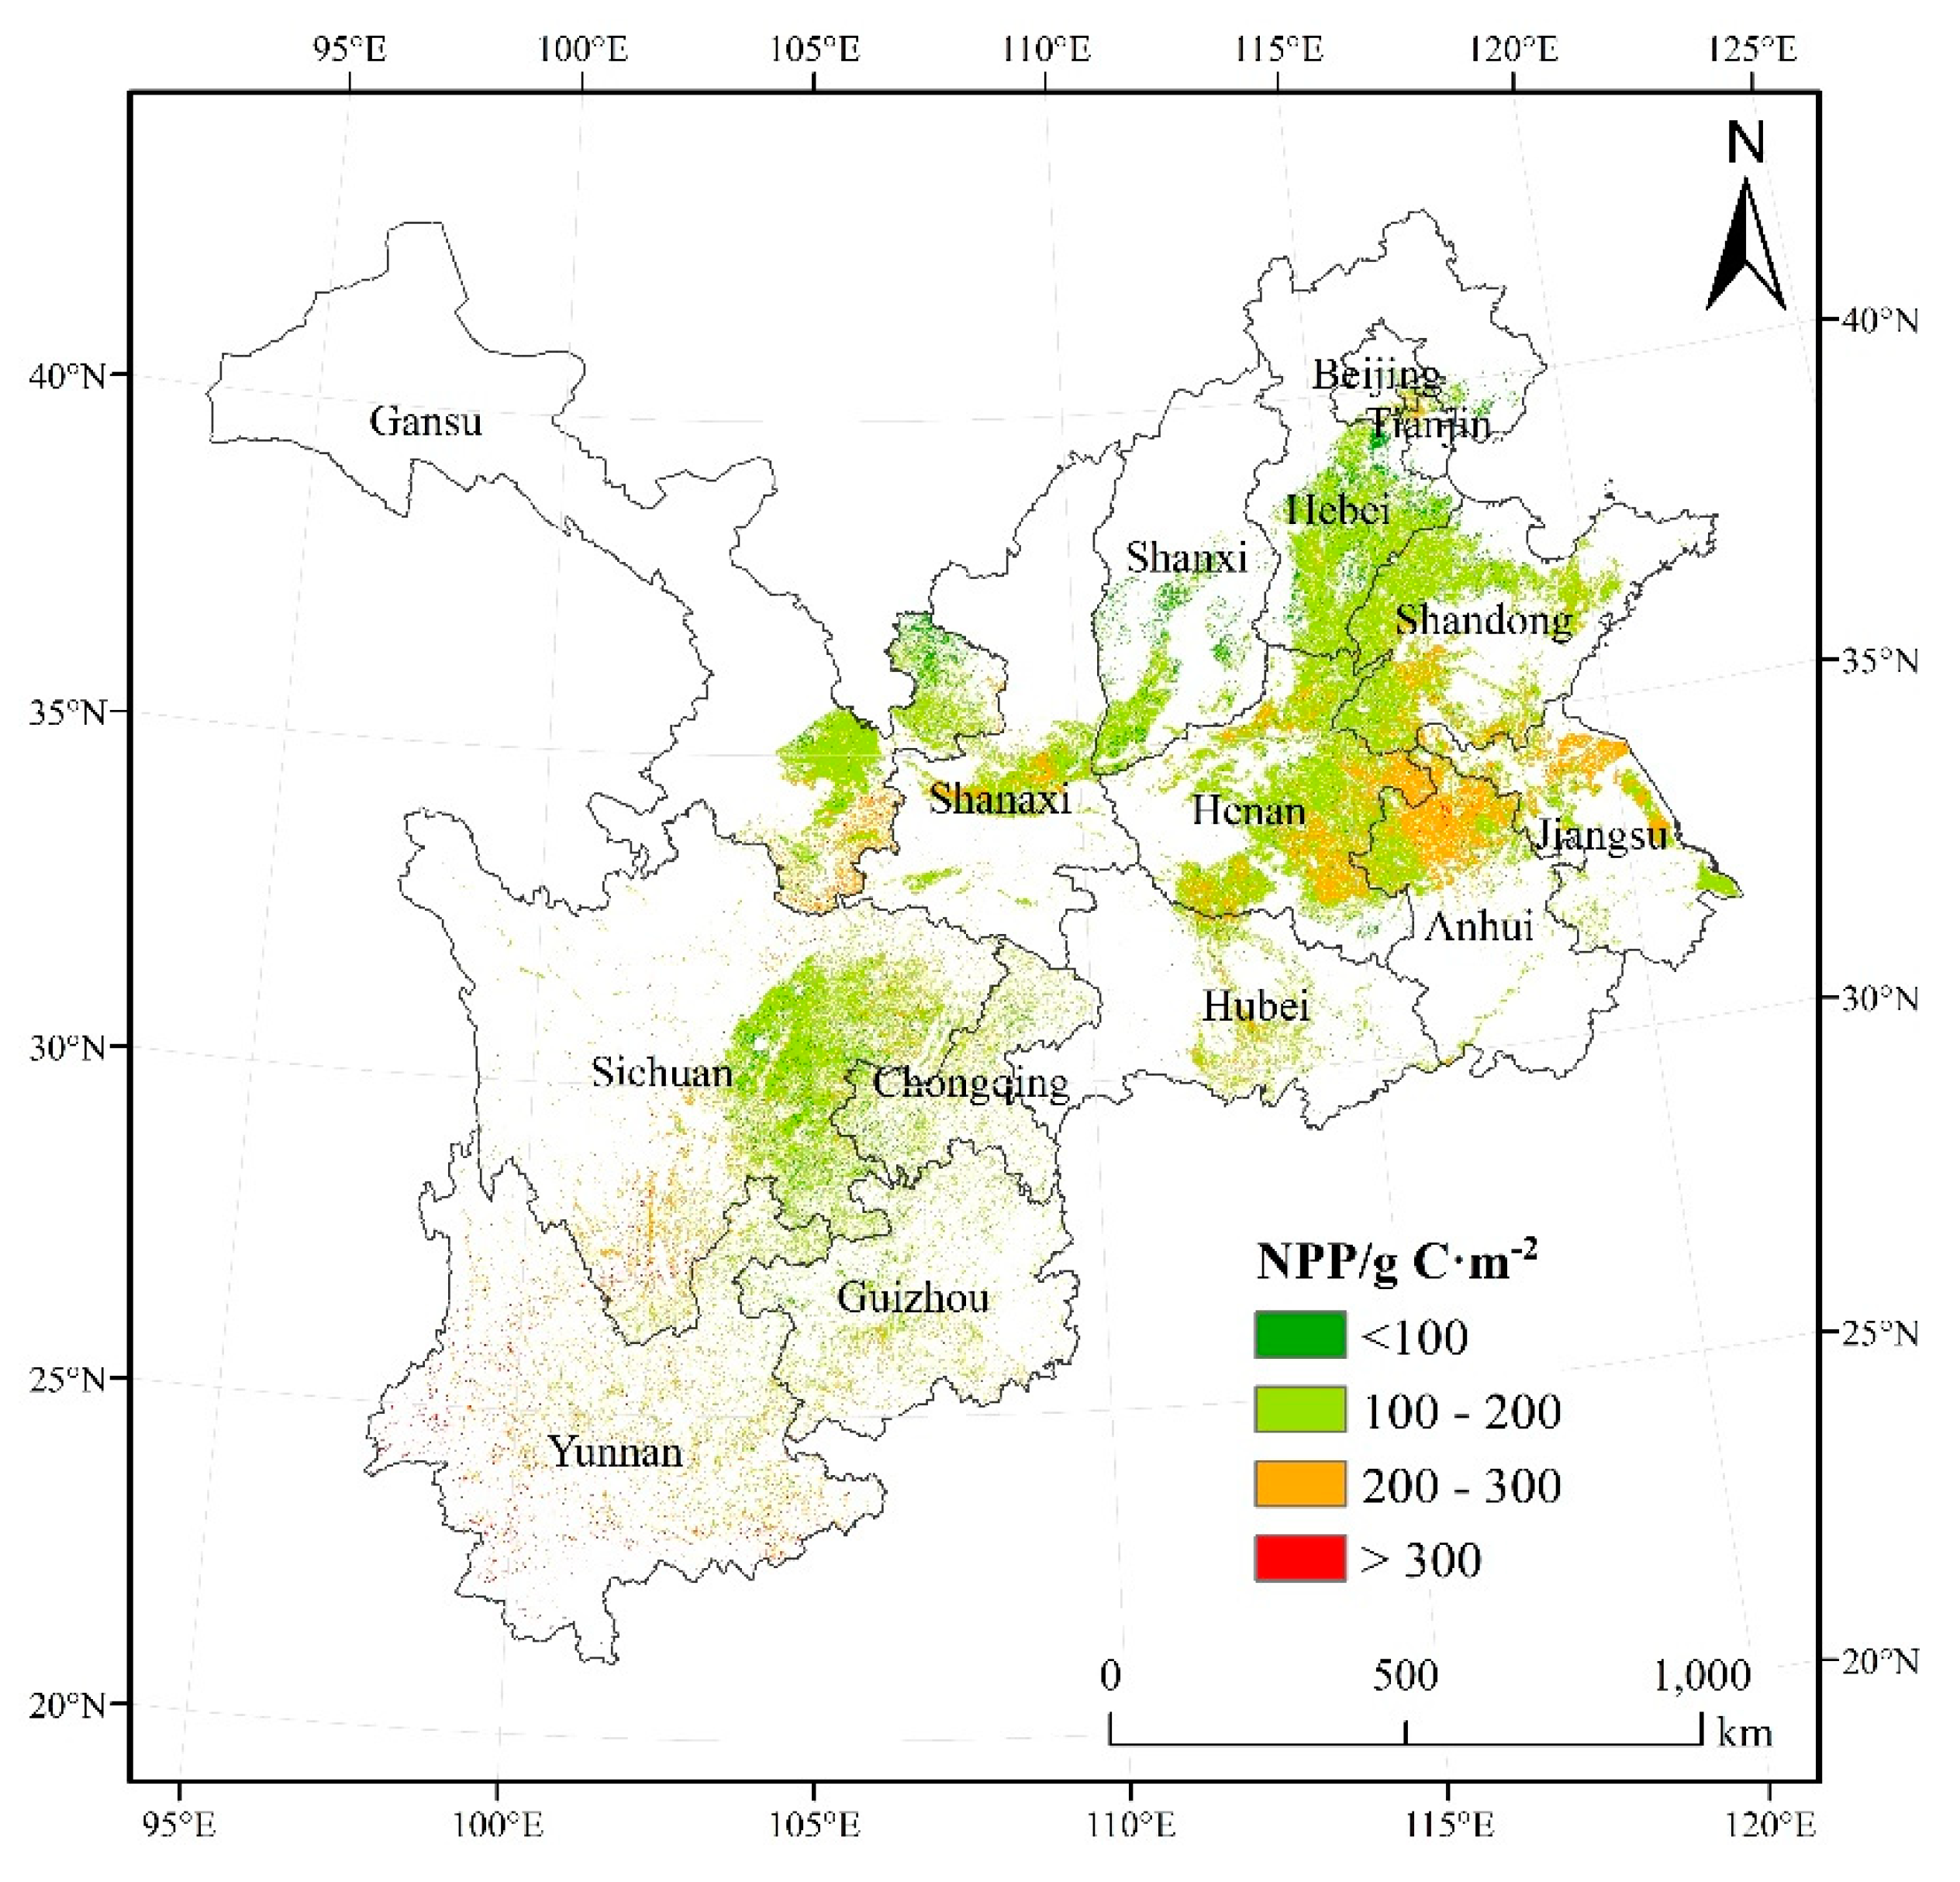
The spatial distribution characteristics of the NPP during the growing season of winter wheat from 2000 to 2015 were demonstrated by calculating the annual averages of NPP (Figure 4). The results showed significant differences in NPP for different regions. The NPP during the growing season of winter wheat from 2000 to 2015 was concentrated between 0.06 and 640 gC·m−2, with an average of 165.39 gC·m−2. The high NPP was mainly concentrated in the North China Plain, especially in southwestern Shandong, southeastern Henan, northern Anhui, and northern Jiangsu, where the NPP was more than 200 gC·m−2. Additionally, the distribution of areas with high NPP (more than 200 gC·m−2) was relatively scattered over some areas, such as Yunnan, Guizhou and Sichuan. The low NPP was mainly distributed in eastern Gansu, central Shanxi, southern Hebei, and eastern Sichuan, where the NPP was below 100 gC·m−2. Consequently, the NPP during the growing season could reflect the spatial heterogeneity of winter wheat.
3.2. Relationship between NPP and Yield
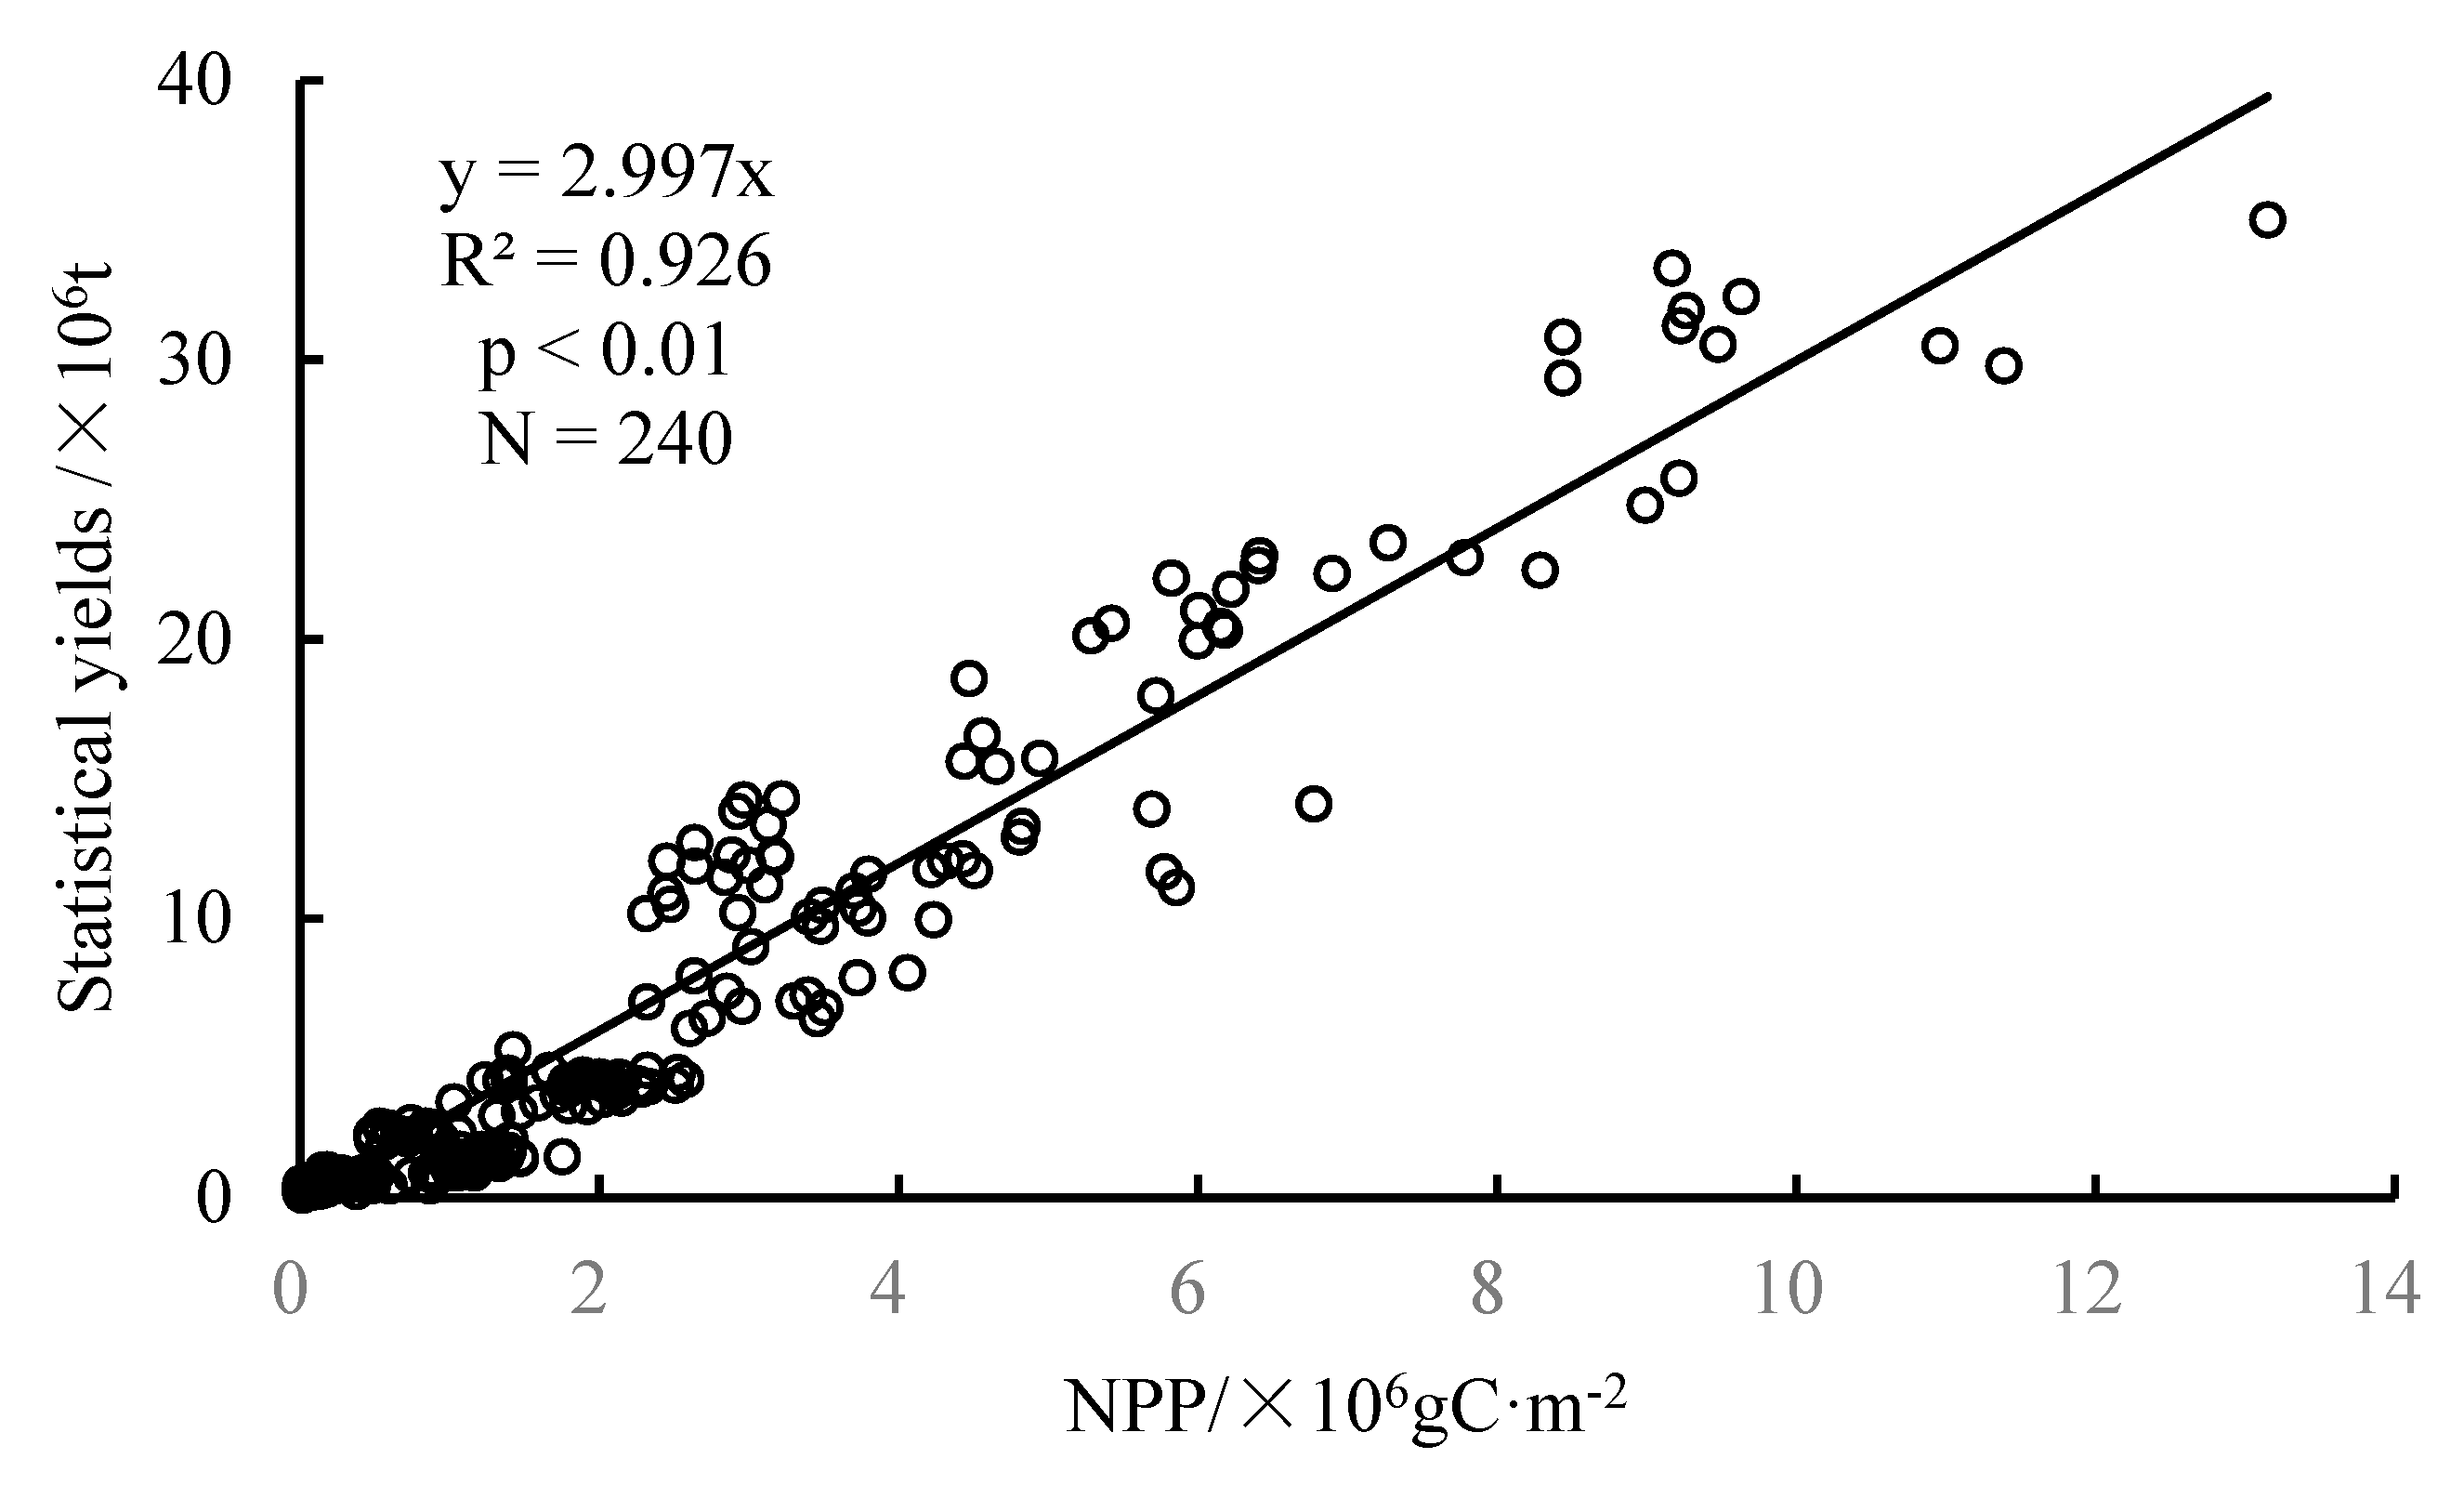
The indicator for the winter wheat yield was identified by selecting the cumulative NPP and statistical yield at the provincial scale to analyze the relationship (Figure 5). The cumulative NPP and statistical yield were positively related with an R2 of 0.926, and passed the 0.01 significance test. The Cook’s distance ranged from 0 to 0.283 (less than 1), with an average value of 0.10, indicating that there are no outliers in the samples. Regression standardized residuals showed that the sample values corresponded naturally with the normal distribution and the sample observations are approximately in line with the assumption. Consequently, NPP is a beneficial indicator when evaluating the winter wheat yield. Furthermore, these results are also consistent with previous research [4,31,32]. NPP was selected to simulate the spatial distribution of the yield in this study.
3.3. Comparison of Regression Parameters from 2000 to 2015
The regression parameters were calculated using cumulative NPP and statistical yields at the provincial scale from 2000 to 2015 (Table 2). The results showed that the coefficient of the model ranged from 2.610 to 3.429. The R2 of the model was higher than 0.92 from 2000 to 2015, which indicated that the fitting effects of the model in each year were good. Additionally, both models passed the significance test (p < 0.001), which suggested that the equations were reliable. Therefore, the fitting parameters were used to simulate winter wheat yields from 2000 to 2015.
3.4. Accuracy Verification
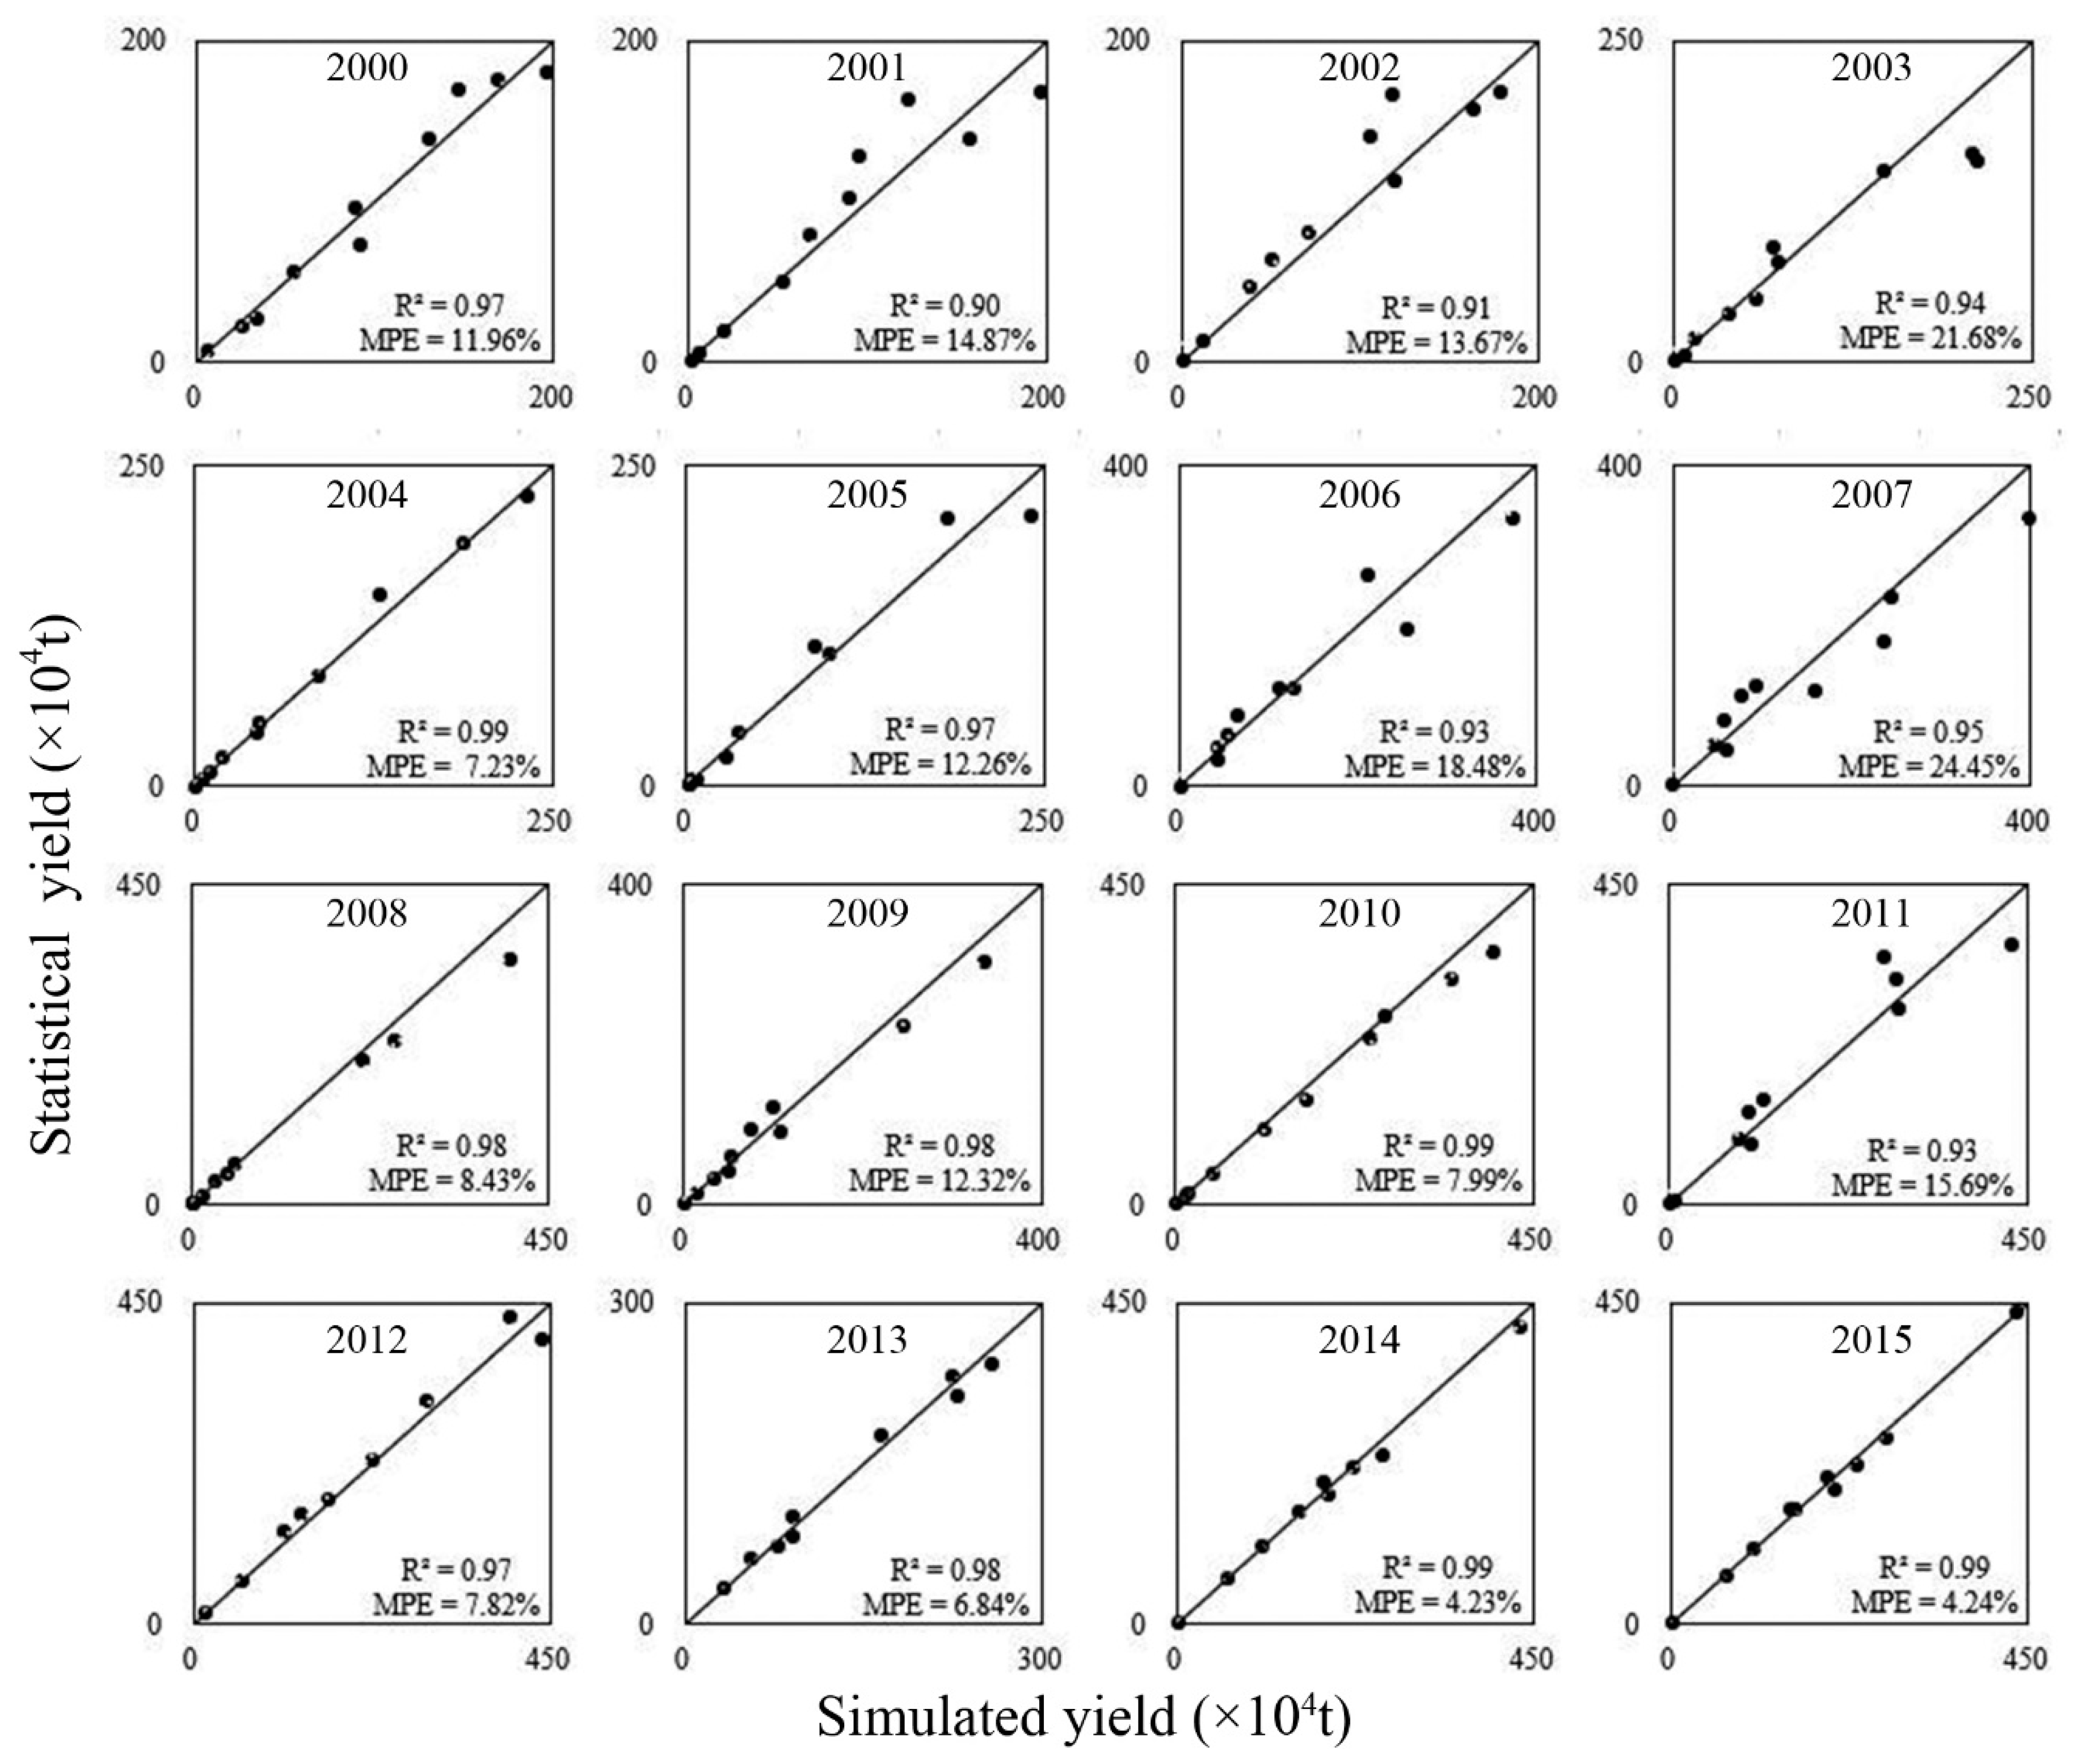
Due to data availability, it is difficult to obtain verification data at the pixel scale. In this study, statistical yield at the city scale were collected. To verify the accuracy of the gridded yield dataset, a total of 160 cities (10 cities per year) were randomly selected as samples. Total production of each city was calculated based on the gridded yield dataset. Figure 6 shows comparisons between the gridded yield dataset and statistical yields at the city scale from 2000 to 2015.
The results showed that the simulated and statistical yields are linearly correlated (Figure 6). R2 values ranged from 0.90 to 0.99, indicating that simulated and statistical yields had high consistency at the city scale. In addition, MPE values ranged from 4.23% in 2014 to 24.45% in 2007, with an average MPE of 12.01%, indicating that the gridded yield dataset simulated by this method had high precision at the city scale. Furthermore, the REs of the gridded yield dataset for approximately half of the samples were between −10% and 10%. The number of cities with absolute RE values below 10%, from 10 to 20%, and above 20% were 78, 53, and 29, respectively. It is also indicated that the accuracy satisfied the requirements for simulating regional winter wheat yield. Thus, these results can be assumed as credible.
3.5. Spatio-Temporal Patterns of Winter Wheat Yields from 2000 to 2015
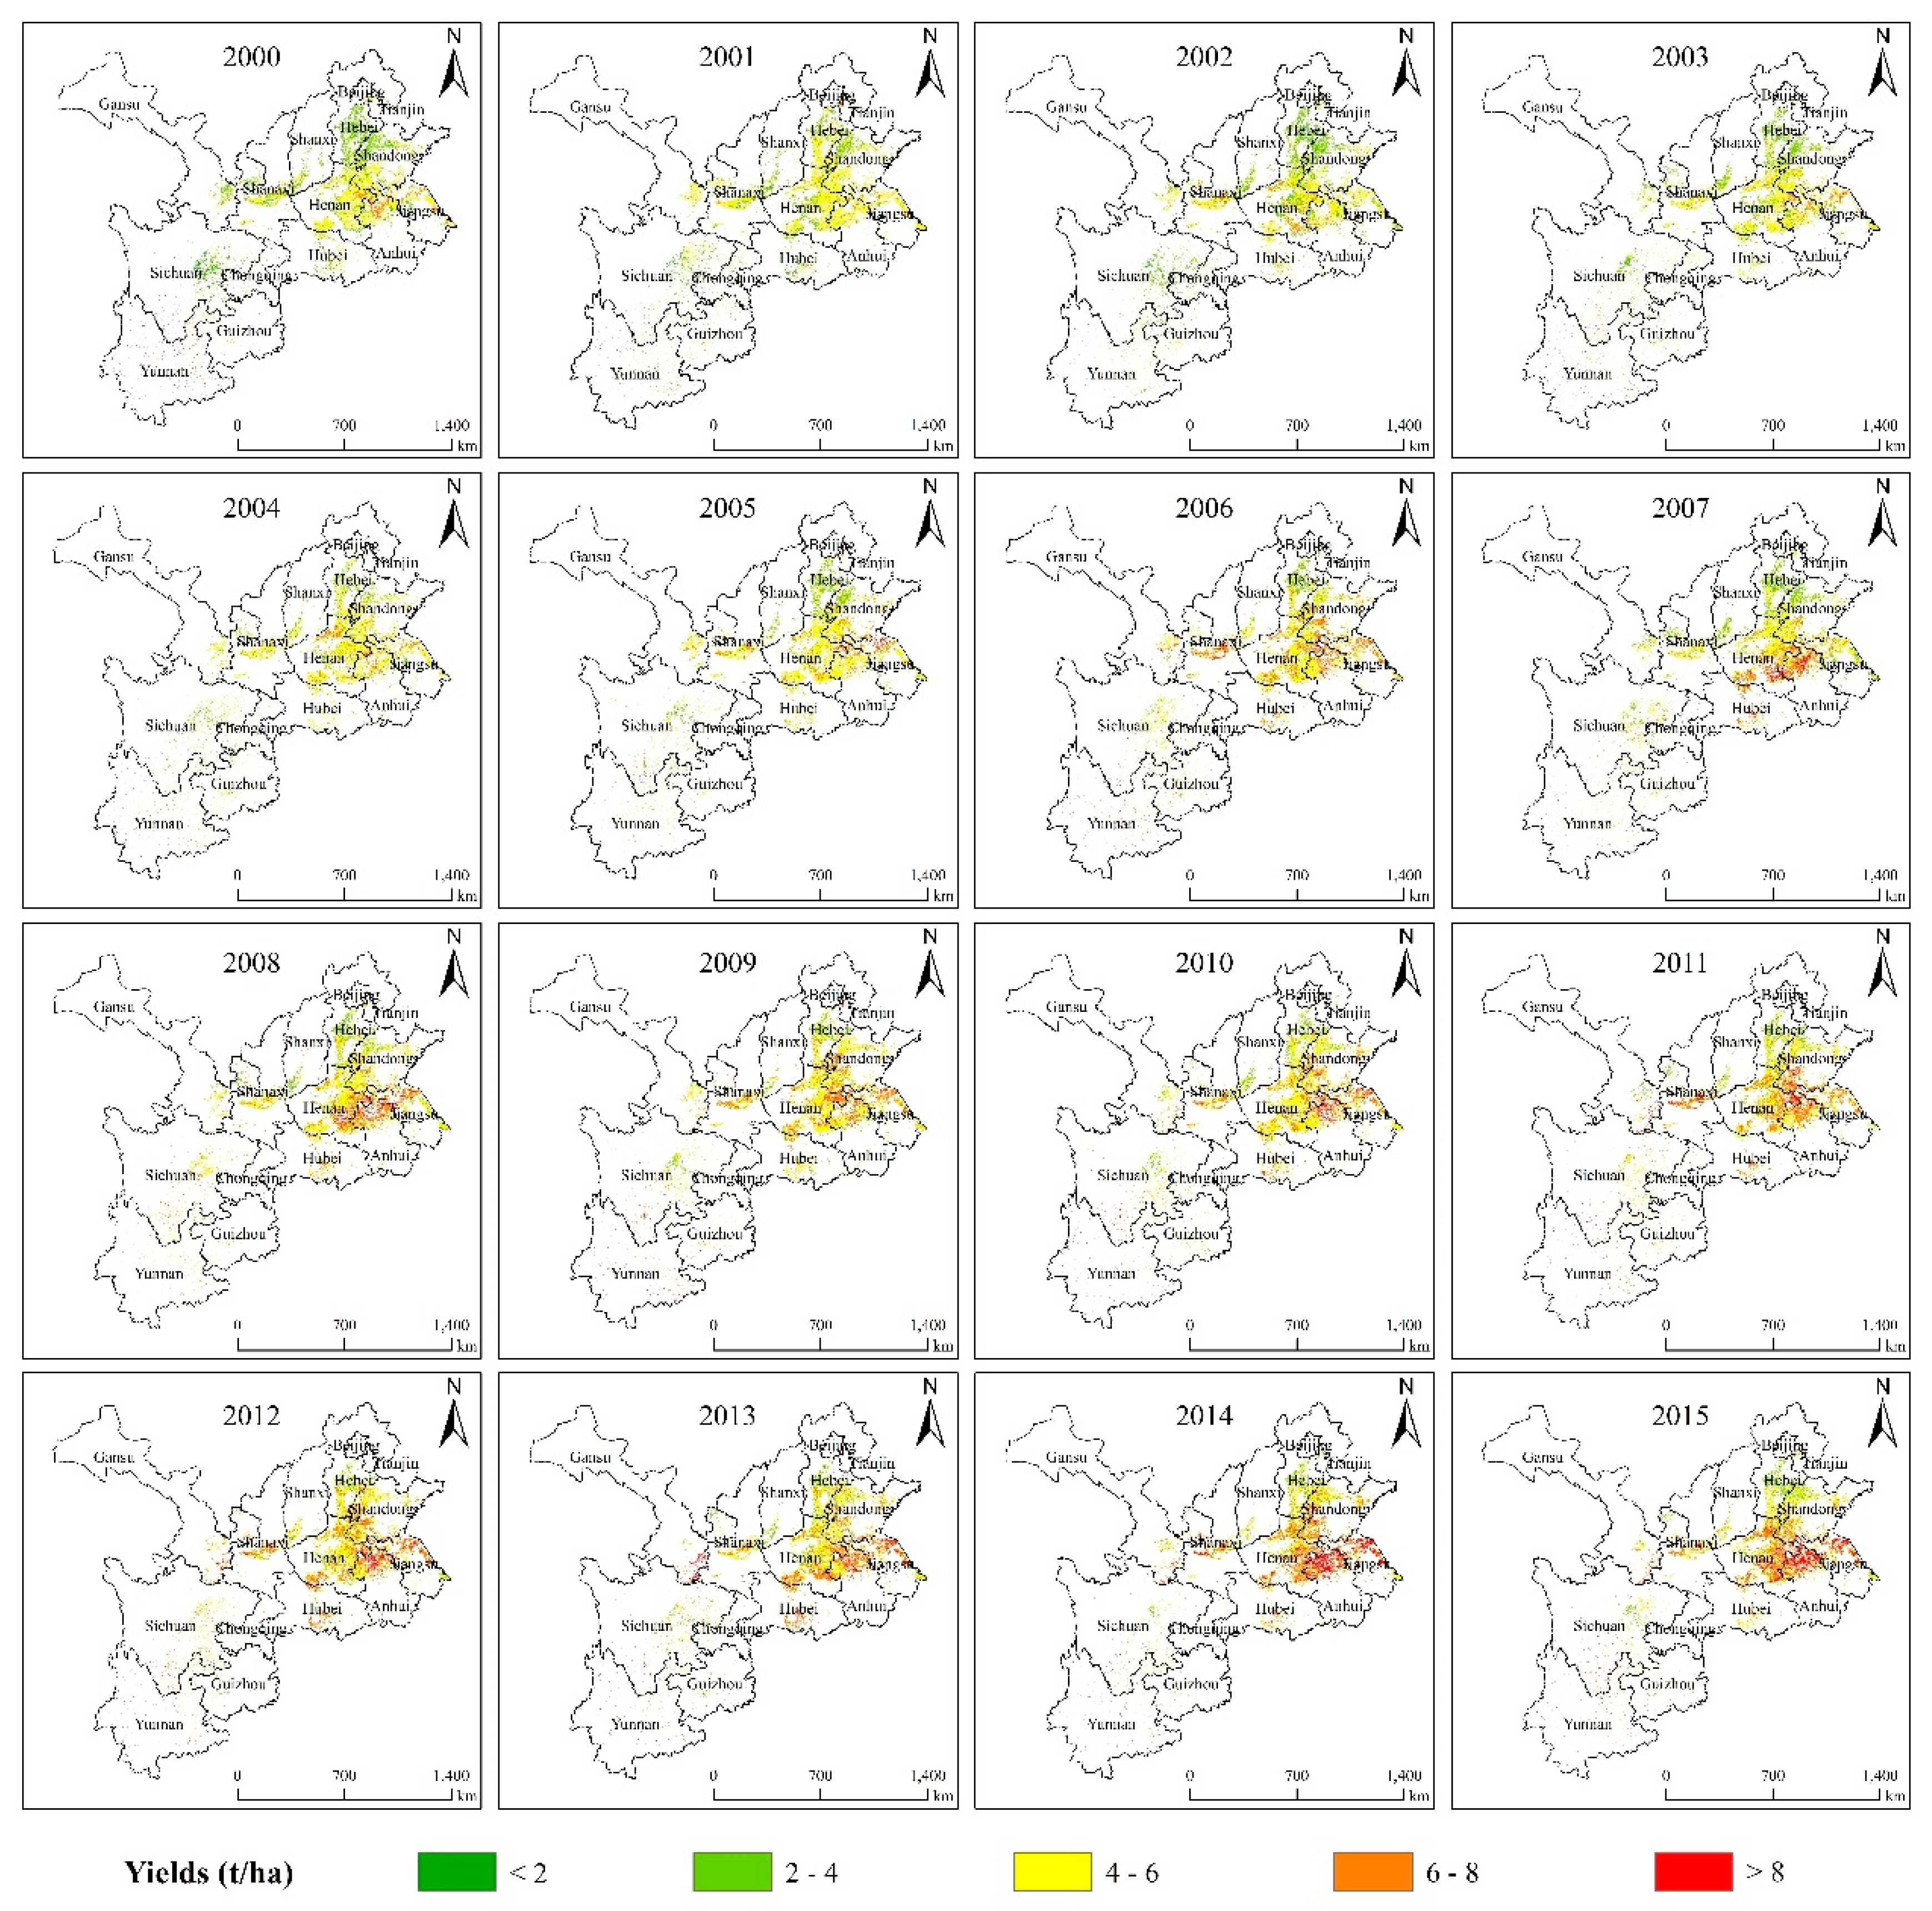
Figure 7 shows the spatial distribution of winter wheat yields from 2000 to 2015. The results showed that the distribution of yields has apparent spatial differences. The yield had a pattern that indicated a high yield in the east and a low yield in the west. Similar to NPP, the high yield was mainly concentrated in the North China Plain, especially in southwestern Shandong, southeastern Henan, northern Anhui, and northern Jiangsu, where the yield was more than 6 t/ha. This region is the main winter wheat production area of China. Abundant light, heat, and water resources are the favorable factors for crop production [33,34]. The low yield was mainly distributed in eastern Gansu, central Shanxi, southern Hebei, and eastern Sichuan, where the yield was below 4 t/ha. Complicated topography and light deficiency are the major factors restricting yields from increasing in these regions.
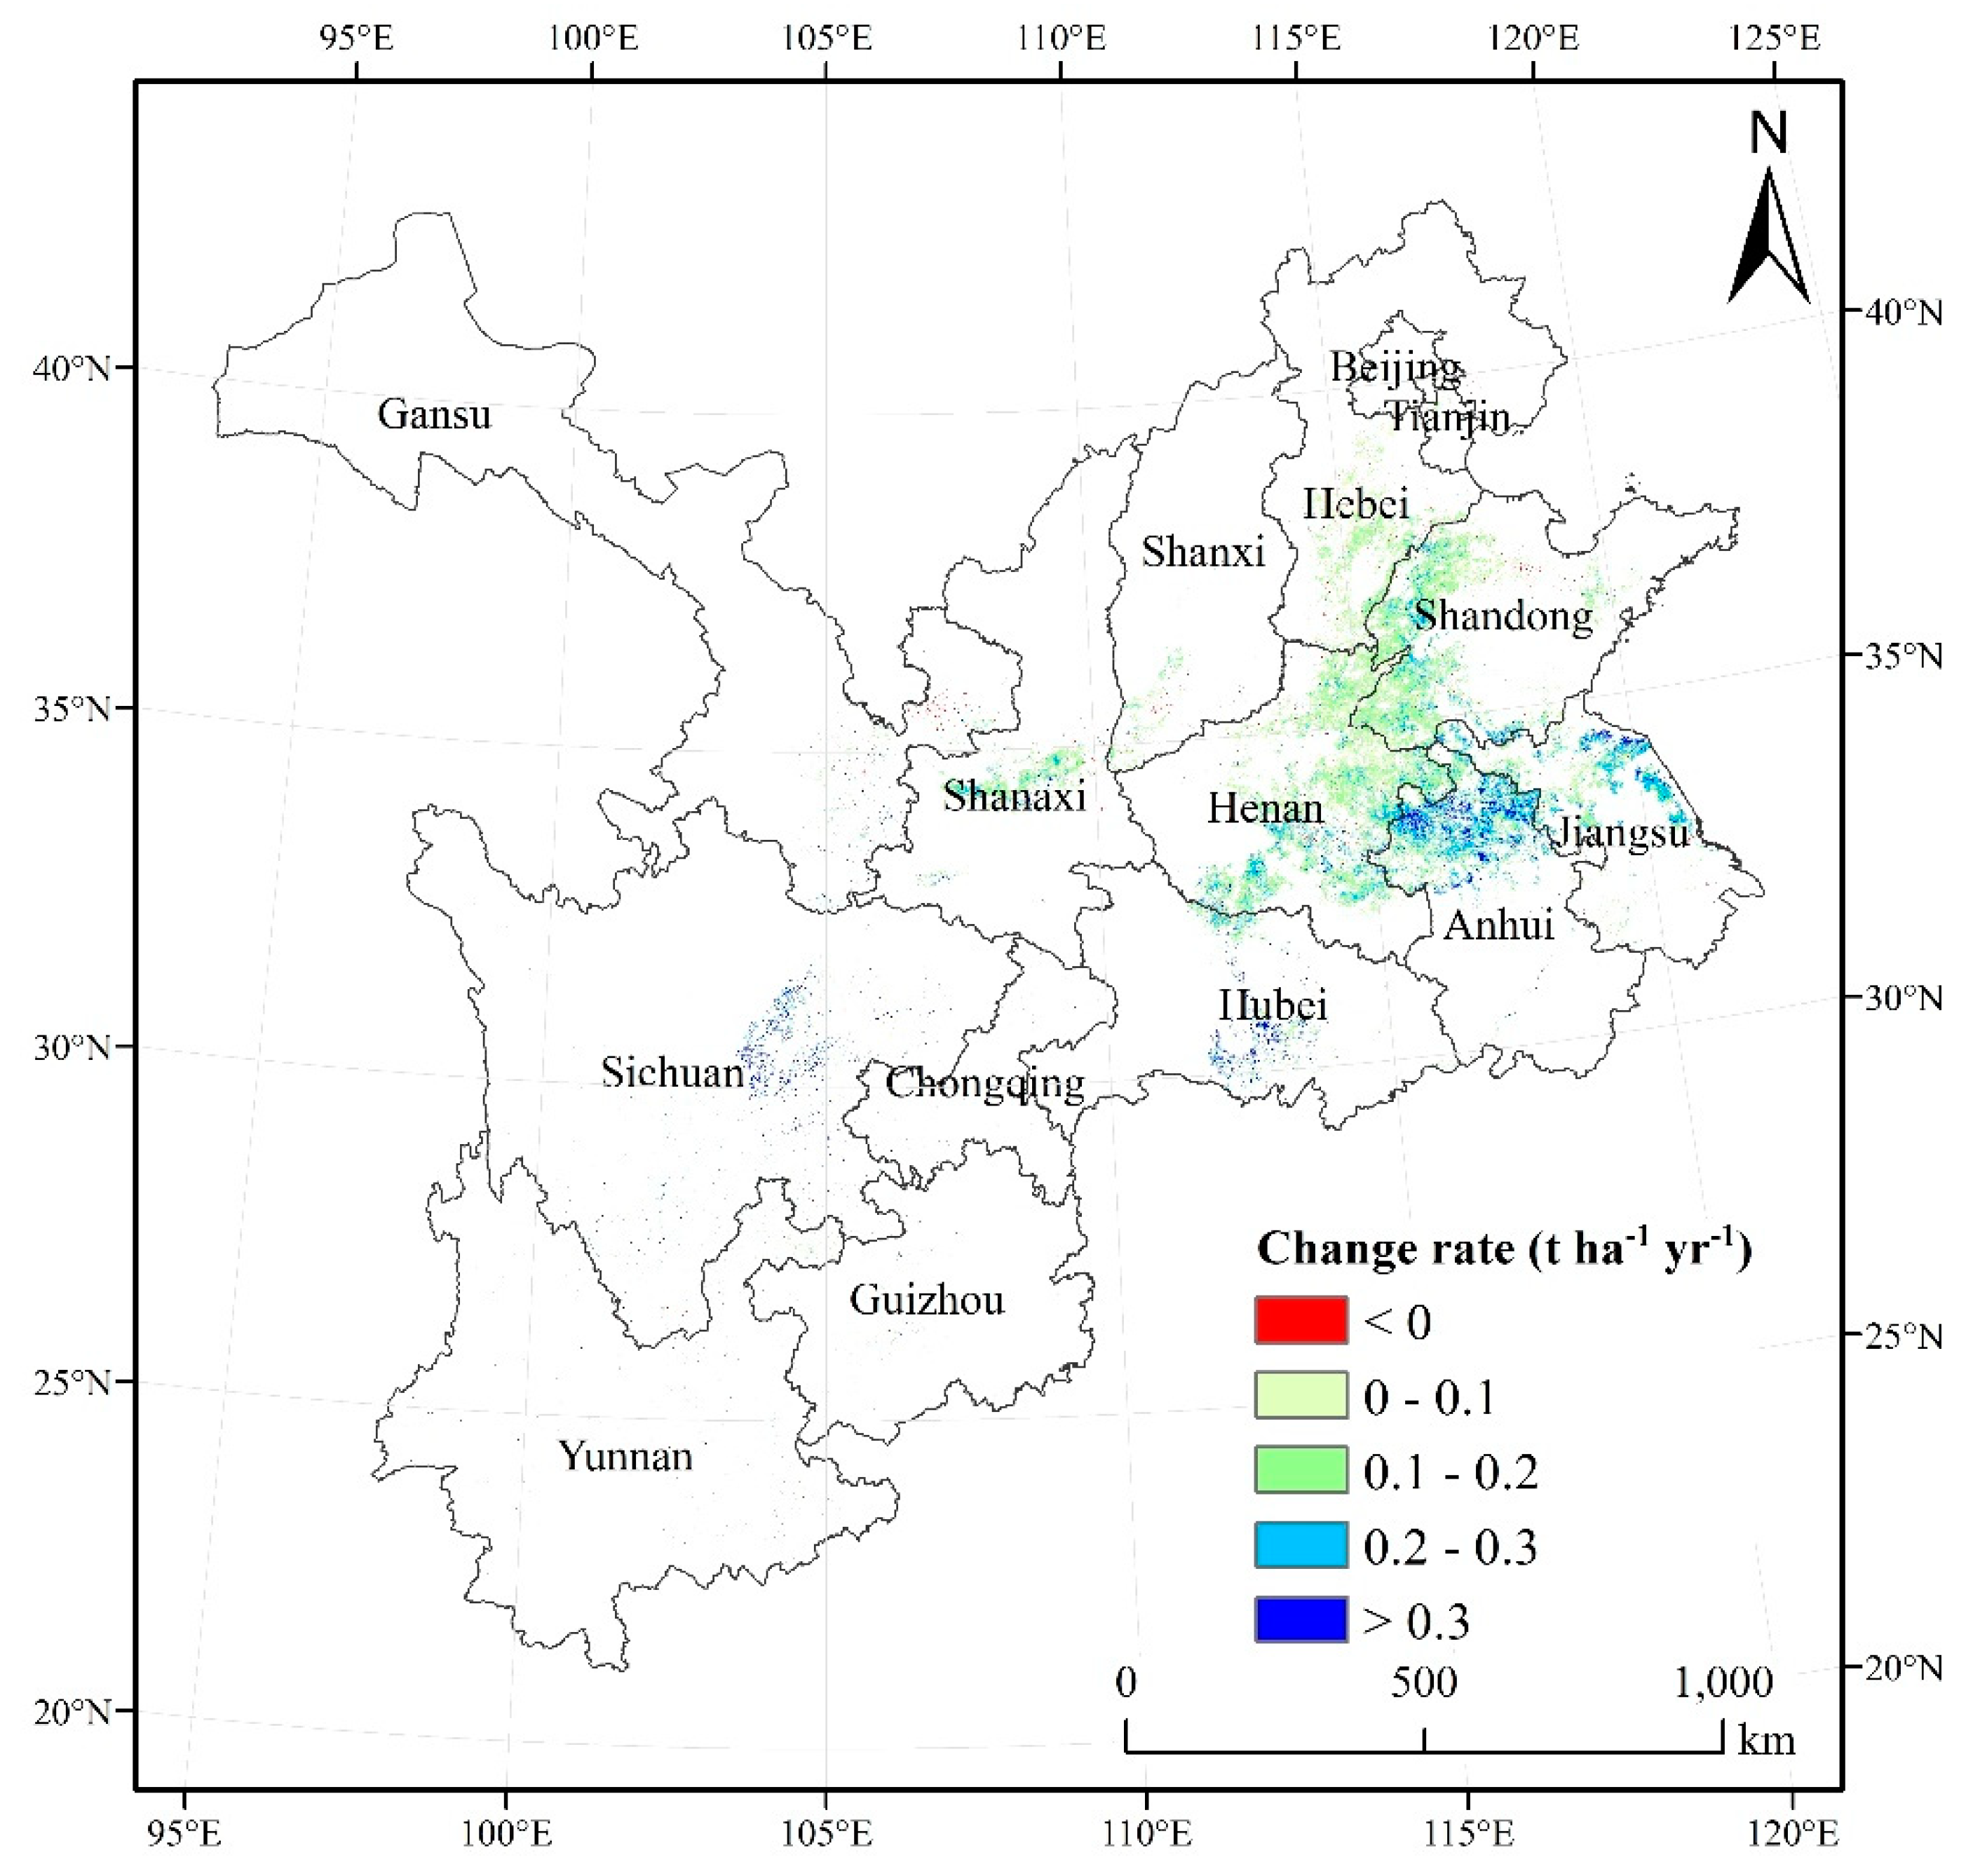
The spatial distribution of the annual change rate of winter yields from 2000 to 2015 is shown in Figure 8. Notably, areas that passed the significance test (p < 0.05) participated in the analysis. The trends mainly showed an increase of an average rate of 0.17 t ha−1 yr−1 from 2000 to 2015 in the study area. There was also significant spatial heterogeneity in the trends of winter wheat yield in different regions. The region that increased was mainly concentrated in the North China Plain, while the distribution of the region that decreased was relatively dispersed. The difference in the North China Plain between the north and the south is apparent. Additionally, the increase rate is larger in the south (mainly > 0.2 t ha−1 yr−1) than that in the north (mainly < 0.2 t ha−1 yr−1). The yield benefited from many factors, such as climate warming, cultivars shift, and fertilization [33,35,36].
4. Discussion
4.1. Comparisons with Other Studies
This study proposed a novel yield spatialization method based on a crop phenological dataset, phenological observations, and NPP. Generally, yield estimation methods can be divided into two categories that include yield spatialization and remote sensing estimation.
The yield spatialization method uses statistical yield, which is an important data source obtained by governments. Compared with the studies of Liao et al. (2015), Ji (2016), and He et al. (2017), both methods deliver sufficient results [1,16,17]. Although the study object of these studies was not winter wheat, it still provides a spatialization method to this study. Additionally, this novel method has obvious advantages. This method extensively uses remote sensing images that include 1 km-grid crop phenological and NPP datasets. The yield gridded dataset can reflect the spatial heterogeneity of winter wheat very well and has a high temporal resolution.
Remote sensing estimation is another yield estimation solution. The relationship between NPP and actual crop yield is established, and the harvest index (HI) is critical to estimate yield accurately. For example, Wang et al. (2011) estimated winter yield based on NPP and HI in the North China Plain [24]. Wang et al. (2019) also established an NPP–yield conversion model to estimate winter wheat yield [4]. HIs were assigned to constant values in these studies. However, this parameter varies considerably because of regional differences, a variety of crops, environmental conditions, and management [7,37]. It could affect the accuracy of yield estimation on a regional scale. Although there are a few uncertainties in HI, NPP is a critical indicator to estimate yield on a regional scale [4,32]. The statistical yield was selected to establish the relationship between NPP and yield in this study, which can reduce a few of the uncertainties.
Furthermore, the yield gridded dataset with statistical yields at the city level shows that the accuracy satisfies the requirements for simulating regional winter wheat yield. Therefore, regardless of the current method, this is a flexible approach for future research.
4.2. Limitations
The planting area of winter wheat might affect the accuracy of the simulation of the yield. This study extracted the planting area based on a 1 km-grid crop phenological dataset. However, it is complicated for the cultivated system in China [24,38]. There are often multiple objects in a 1 km-grid, such as crops, trees, and roads. It is inevitable to extract the planting area of winter wheat with mixed pixels. This dataset has a sufficient quality for China because of data availability. Therefore, this dataset can be used to identify the planting area of winter wheat with high spatial and temporal resolution in China. Although this may have mixed pixel effects, a feasible and flexible approach for planting area extraction at the regional scale is provided.
NPP is a key parameter of this novel method, and the accuracy of the method depends on the precision of NPP during the growing season, which was calculated using planting area, phenological data, and an NPP dataset. This study considers the monthly temporal resolution of the NPP dataset. The sowing and maturity months were determined using the average annual DOYs. This can lead to a few uncertainties in this study. Studies have shown that the phenology of winter wheat has changed under climate change [39,40]. Xiao et al. (2013) found that the date of sowing was delayed (by 1.5 days per decade), whereas the date of maturity advanced (by 1.4 days per decade) in the North China Plain from 1981 to 2009 [41]. Liu et al. (2018) reported that the dates of sowing and maturity for wheat showed a similar trend in China from 1981 to 2010 [42]. Additionally, human management, such as sowing adjustment, irrigation, and fertilization, can affect the phenology of crops [42,43,44]. Earlier sowing for crops could extend the growing season, and result in a higher production [44]. Irrigation could increase soil water content, and a suitable irrigation method could promote crop growth and yield [45,46]. Li et al. (2018) pointed out that warming could decreased the wheat yield in dry years, while irrigation nullified the warming effect [47]. Reasonable fertilization could improve soil fertility and increase crop yield [48,49,50]. Although phenological dates of winter wheat may change at different times and locations, there is minimal change in NPP products. Therefore, the average annual DOYs were selected.
Furthermore, the method was only tested in the winter wheat of China in this study. Therefore, the application of this method to other crops should be further investigated. Due to data availability, accuracy verification was carried out at the city scale. Fine-scale gridded yield or field data should be employed in accuracy verification in the future. The model accuracy can be improved using fine-scale statistical yields (i.e., city and county level data) in this model. Additionally, the distribution of phenological dates and NPP with high spatial and temporal resolution should be considered in the future.
4.3. Potential Applications
Regional yield estimation is critical for many applications, such as agricultural lands management, food security warning systems, agricultural trade policy, and carbon cycle research [22,51,52]. Generally, crop yield is influenced by the interaction of climate resources and human activities [53]. Climate resources that include temperature, precipitation, and light have changed significantly in China because of climate change. The impact of climate change on crop yield has been of considerable attention [32,54,55,56]. Furthermore, human activities that include technological progress, irrigation, and fertilization, can promote crop yield [57,58]. However, crop production can cause a series of challenges, which include irrational utilization of land, resource consumption, and environmental deterioration [59,60,61,62]. Therefore, coordinating the relationship between population, resources, environment, and crop production is essential for ensuring sustainable agricultural development [59,62]. Gridded yield datasets can show the spatial characteristics of distributions and facilitate applications using spatial analysis when compared with statistical yield. This can provide credible and fundamental data that increase the understanding of the relationship between climate change and yield. Furthermore, human–land relationships can be coordinated to promote sustainable agricultural development at the pixel scale.
5. Conclusions
Many studies have developed yield spatialization models that are based on cropland areas. However, minimal attention has been received by planting areas, phenological dates, and the NPP of crops. Therefore, this study proposed a novel yield spatialization method that is based on planting area, phenological data, and NPP.
The average annual NPP during the growing season of winter wheat was 165.39 gC·m−2. The NPP and yield were positively related, with an R2 of 0.926 (p < 0.01). This indicates that NPP is an advantageous indicator to evaluate the yield of winter wheat. A gridded yield dataset was generated by the novel method that has high precision (MPE = 12.01%) at the city scale. The number of cities with absolute RE values below 10%, from 10 to 20%, and above 20% were 78, 53, and 29, respectively. The distribution of yields has apparent spatial differences, and the yield indicated a high yield in the east and a low yield in the west. The high yield was mainly concentrated in the North China Plain (more than 6 t/ha), whereas the low yield was mainly distributed in eastern Gansu, central Shanxi, southern Hebei, and eastern Sichuan (lower than 4 t/ha). The yield trend increased with an average rate of 0.17 t ha−1 yr−1 in the study area from 2000 to 2015. The region that increased was mainly concentrated in the North China Plain. Therefore, this study suggested that NPP is a key indicator of the yield spatialization model. Additionally, the method can generate gridded yield datasets with higher accuracy, which could show the spatial and temporal variation of yields.
Author Contributions
All of the authors have contributed to the manuscript. D.H. analyzed the results and wrote the manuscript. X.Y. conceived and designed the study. H.C. and X.Y. contributed to editing the manuscript and provided many suggestions. X.X. assisted with data processing. All authors have read and agreed to the published version of the manuscript.
Funding
This research was supported and funded by the Strategic Priority Research Program of Chinese Academy of Sciences (Grant No. XDA20010203 and XDA20010302), the National Natural Science Foundation of China (Grant No. 41771460), and the National Key Research and Development Program of China (Grant No. 2017YFC0503803). We also thank Zhi Qiao for his comments on this study.
Conflicts of Interest
The authors declare no conflicts of interest.
References
- Liao, S.; Guangxing, J.I.; Hou, P.; Yue, Y.; Yang, X. Discussion on Two Key Problems of Multivariable Linear Regression Models for Spatialization of Grain Yield. J. Nat. Resour. 2015, 30, 1922–1932. [Google Scholar]
- Liu, Z.; Li, B. Spatial distribution of China grain output based on land use and population density. Trans. Chin. Soc. Agric. Eng. 2012, 28, 8–15. [Google Scholar]
- Wang, P.J.; Zhou, Y.Y.; Huo, Z.G.; Han, L.J.; Qiu, J.X.; Tan, Y.; Liu, D. Monitoring growth condition of spring maize in Northeast China using a process-based model. Int. J. Appl. Earth Obs. 2018, 66, 27–36. [Google Scholar] [CrossRef]
- Wang, Y.L.; Xu, X.G.; Huang, L.S.; Yang, G.J.; Fan, L.L.; Wei, P.F.; Chen, G. An Improved CASA Model for Estimating Winter Wheat Yield from Remote Sensing Images. Remote Sens. 2019, 11, 1088. [Google Scholar] [CrossRef] [Green Version]
- Kowalik, W.; Dabrowska-Zielinska, K.; Meroni, M.; Raczka, T.U.; De Wit, A. Yield estimation using SPOT-VEGETATION products: A case study of wheat in European countries. Int. J. Appl. Earth Obs. Geoinf. 2014, 32, 228–239. [Google Scholar] [CrossRef]
- Bolton, D.K.; Friedl, M.A. Forecasting crop yield using remotely sensed vegetation indices and crop phenology metrics. Agric. Forest Meteorol. 2013, 173, 74–84. [Google Scholar] [CrossRef]
- Yao, F.M.; Tang, Y.J.; Wang, P.J.; Zhang, J.H. Estimation of maize yield by using a process-based model and remote sensing data in the Northeast China Plain. Phys. Chem. Earth 2015, 87–88, 142–152. [Google Scholar] [CrossRef]
- Feng, C.; Guo, J.N.; Min, X.J.; Xing-Chao, L.I.; Qiao-Yan, F.U. New Progress in Land Use/Land Cover Change Detection by Remote Sensing. Remote Sens. Inf. 2006, 3, 81–85. [Google Scholar]
- Geoghegan, J.L., Jr.; Ogneva-Himmelberger, Y.; Roy Chowdhury, R.; Sanderson, S.; Turner Ii, B.L. Socializing the Pixel and Pixelizing the Social in Land-Use and Land-Cover Change; National Academy Press: Washington, DC, USA, 1998. [Google Scholar]
- CIESIN. Gridded Population of the World, Version 3 (GPWv3); Columbia University: New York, NY, USA, 2005. [Google Scholar]
- Fu, J.; Jiang, D.; Huang, Y. 1 km grid population dataset of China (2005, 2010). Glob. Chang. Res. Data Publ. Repos. 2014. [CrossRef]
- Huang, Y.; Jiang, D.; Fu, J. 1 km grid GDP dataset of China (2005, 2010). Glob. Chang. Res. Data Publ. Repos. 2014. [CrossRef]
- Tenerelli, P.; Gallego Pinilla, F.J.; Ehrlich, D. Population density modelling in support of disaster risk assessment. Int. J. Disaster Risk Reduct. 2015, 13. [Google Scholar] [CrossRef]
- Qizhi, M.; Long, Y.; Wu, K. Spatio-Temporal Changes of Population Density and Urbanization Pattern in China (2000–2010). China City Plan. Rev. 2016, 24. [Google Scholar] [CrossRef]
- Peng, J.; Tian, L.; Liu, Y.; Zhao, M.; Hu, Y.n.; Wu, J. Ecosystem services response to urbanization in metropolitan areas: Thresholds identification. Sci. Total Environ. 2017, 607–608, 706–714. [Google Scholar] [CrossRef] [PubMed]
- Ji, G. Research on Spatialization of Grain Yield and Error Analysis; Henan University: Kaifeng, China, 2016. [Google Scholar]
- He, P.; Lin, Z.; Jing, X.; Li, X. Spatial distribution of grain yield of Sichuan based on different sample scales and partitioning schemes. Chin. J. Agric. Resour. Reg. Plan. 2017, 38, 23–31. [Google Scholar] [CrossRef]
- Luo, Y.; Zhang, Z.; Chen, Y.; Li, Z.; Tao, F. ChinaCropPhen1km: A high-resolution crop phenological dataset for three staple crops in China during 2000–2015 based on leaf area index (LAI) products. Earth Syst. Sci. Data 2020, 12, 197–214. [Google Scholar] [CrossRef] [Green Version]
- Field, C.; Behrenfeld, M.; Randerson, J.; Falkowski, P. Primary production of the biosphere: Integrating terrestrial and oceanic components. Science 1998, 281, 237–240. [Google Scholar] [CrossRef] [Green Version]
- Potter, C.; Klooster, S.; Myneni, R.; Genovese, V.; Tan, P.-N.; Kumar, V. Continental-scale comparisons of terrestrial carbon sinks estimated from satellite data and ecosystem modeling 1982–1998. Glob. Planet. Chang. 2003, 39, 201–213. [Google Scholar] [CrossRef]
- Shang, E.; Xu, E.; Zhang, H.; Liu, F. Analysis of Spatiotemporal Dynamics of the Chinese Vegetation Net Primary Productivity from the 1960s to the 2000s. Remote Sens. 2018, 10, 860. [Google Scholar] [CrossRef] [Green Version]
- Tao, F.; Yokozawa, M.; Zhang, Z.; Xu, Y.; Hayashi, Y. Remote sensing of crop production in China by production efficiency models: Models comparisons, estimates and uncertainties. Ecol. Model 2005, 183, 385–396. [Google Scholar] [CrossRef]
- Jin, X.L.; Xu, X.G. Estimation of Cotton Yield Based on Net Primary Production Model in Xinjiang, China. In Proceedings of the 2012 First International Conference on Agro-Geoinformatics (Agro-Geoinformatics), Shanghai, China, 2 August 2012; pp. 416–419. [Google Scholar]
- Wang, P.J.; Sun, R.; Zhang, J.H.; Zhou, Y.Y.; Xie, D.H.; Zhu, Q.J. Yield estimation of winter wheat in the North China Plain using the remote-sensing-photosynthesis-yield estimation for crops (RS-P-YEC) model. Int. J. Remote Sens. 2011, 32, 6335–6348. [Google Scholar] [CrossRef]
- Jiang, Q.; Yue, Y.; Gao, L. The spatial-temporal patterns of heatwave hazard impacts on wheat in northern China under extreme climate scenarios. Geomat. Nat. Hazards Risk 2019, 10, 2346–2367. [Google Scholar] [CrossRef] [Green Version]
- Zhao, Z.; Pin, W.; Yi, C.; Shuai, Z.; Fulu, T.; Xiaofei, L. Spatio-temporal changes of agrometrorological disasters for wheat production across China since 1990. J. Geogr. Sci. 2013, 068, 1453–1460. [Google Scholar]
- National Bureau of Statistics of China. China Statistical Yearbook; China Statistics Press: Beijing, China, 2019.
- Luo, Y.; Zhang, Z.; Chen, Y.; Li, Z.; Tao, F. ChinaCropPhen1km: A high-resolution crop phenological dataset for three staple crops in China during 2000–2015 based on LAI products. Figshare 2019. [Google Scholar] [CrossRef]
- Chen, P. Monthly NPP 1 km Raster Dataset of China’s Terrestrial Ecosystems (1985–2015). Glob. Chang. Res. Data Publ. Repos. 2019. [CrossRef]
- Chen, P.; Shang, J.; Qian, B.; Jing, Q.; Liu, J. A New Regionalization Scheme for Effective Ecological Restoration on the Loess Plateau in China. Remote Sens. 2017, 9, 1323. [Google Scholar] [CrossRef] [Green Version]
- Wang, J.; Zhang, J.-H.; Yun, B.; Zhang, S.; Yang, S.; Yao, F. Integrating remote sensing-based process model with environmental onation scheme to estimate rice yield gap in Northeast China. Field Crop Res. 2019, 246. [Google Scholar] [CrossRef]
- Qader, S.H.; Dash, J.; Atkinson, P.M. Forecasting wheat and barley crop production in arid and semi-arid regions using remotely sensed primary productivity and crop phenology: A case study in Iraq. Sci. Total Environ. 2018, 613, 250–262. [Google Scholar] [CrossRef] [Green Version]
- Tao, F.; Xiao, D.; Zhang, S.; Zhang, Z.; Rötter, R.P. Wheat yield benefited from increases in minimum temperature in the Huang-Huai-Hai Plain of China in the past three decades. Agric. Forest Meteorol. 2017, 239, 1–14. [Google Scholar] [CrossRef] [Green Version]
- Hu, Q.; Ma, X.; He, H.; Pan, F.; He, Q.; Huang, B.; Pan, X. Warming and Dimming: Interactive Impacts on Potential Summer Maize Yield in North China Plain. Sustainability 2019, 11, 2588. [Google Scholar] [CrossRef] [Green Version]
- Li, K.; Yang, X.; Tian, H.; Pan, S.; Liu, Z.; Lu, S. Effects of changing climate and cultivar on the phenology and yield of winter wheat in the North China Plain. Int. J. Biometeorol. 2016, 60, 21–32. [Google Scholar] [CrossRef]
- Ren, S.; Zhang, Q.; Li, T.; Zhang, F. Spatiotemporal Variation of Winter Wheat Yield and Nitrogen Management in Five Provinces of North China Plain. Scientia Argic. Sin. 2019, 52, 4527–4539. [Google Scholar]
- Ju, W.M.; Gao, P.; Zhou, Y.L.; Chen, J.M.; Chen, S.; Li, X.F. Prediction of summer grain crop yield with a process-based ecosystem model and remote sensing data for the northern area of the Jiangsu Province, China. Int. J. Remote Sens. 2010, 31, 1573–1587. [Google Scholar] [CrossRef]
- Yang, B.; Pei, Z.; Zhou, Q.; Liu, H. Key Technologies of Crop Monitoring Using Remote Sensing at a National Scale: Progress and Problems. Trans. Chin. Soc. Agric. Eng. 2002, 18, 191–194. [Google Scholar]
- He, Z.; Du, J.; Zhao, W.; Yang, J.; Chen, L.-F.; Zhu, X.; Chang, X.; Liu, H. Assessing temperature sensitivity of subalpine shrub phenology in semi-arid mountain regions of China. Agric. Forest Meteorol. 2015, 213, 42–52. [Google Scholar] [CrossRef]
- Hu, Q.; Weiss, A.; Feng, S.; Baenziger, P.S. Earlier winter wheat heading dates and warmer spring in the U.S. Great Plains. Agric. Forest Meteorol. 2005, 135, 284–290. [Google Scholar] [CrossRef]
- Xiao, D.; Tao, F.; Liu, Y.; Shi, W. Observed changes in winter wheat phenology in the North China Plain for 1981–2009. Int. J. Biometeorol. 2013, 57, 275–285. [Google Scholar] [CrossRef]
- Liu, Y.; Chen, Q.; Ge, Q.; Dai, J. Spatiotemporal differentiation of changes in wheat phenology in China under climate change from 1981 to 2010. Sci. China Earth Sci. 2018, 61, 1088–1097. [Google Scholar] [CrossRef]
- Mo, F.; Sun, M.; Liu, X.Y.; Wang, J.Y.; Zhang, X.C.; Ma, B.L.; Xiong, Y.C. Phenological responses of spring wheat and maize to changes in crop management and rising temperatures from 1992 to 2013 across the Loess Plateau. Field Crop Res. 2016, S0378429016302106. [Google Scholar] [CrossRef]
- Eyshi Rezaei, E.; Siebert, S.; Ewert, F. Climate and management interaction cause diverse crop phenology trends. Agric. Forest Meteorol. 2017, 233, 55–70. [Google Scholar] [CrossRef]
- Kumar Jha, S.; Ramatshaba, T.S.; Wang, G.; Liang, Y.; Liu, H.; Gao, Y.; Duan, A. Response of growth, yield and water use efficiency of winter wheat to different irrigation methods and scheduling in North China Plain. Agric. Water Manag. 2019, 217, 292–302. [Google Scholar] [CrossRef]
- Soothar, R.K.; Zhang, W.; Liu, B.; Tankari, M.; Wang, Y. Sustaining Yield of Winter Wheat under Alternate Irrigation Using Saline Water at Different Growth Stages: A Case Study in the North China Plain. Sustainability 2019, 11, 4564. [Google Scholar] [CrossRef] [Green Version]
- Li, J.; Dong, W.; Oenema, O.; Tuo, C.; Hu, C.; Yuan, H.; Zhao, L. Irrigation reduces the negative effect of global warming on winter wheat yield and greenhouse gas intensity. Sci. Total Environ. 2018, 646. [Google Scholar] [CrossRef]
- Jin, Z.; Chen, C.; Chen, X.; Hopkins, I.; Zhang, X.; Han, Z.; Jiang, F.; Billy, G. The crucial factors of soil fertility and rapeseed yield - A five year field trial with biochar addition in upland red soil, China. Sci. Total Environ. 2019, 649, 1467–1480. [Google Scholar] [CrossRef]
- Sun, L.; Wang, R.; Li, J.; Wang, Q.; Zhang, X. Reasonable fertilization improves the conservation tillage benefit for soil water use and yield of rain-fed winter wheat: A case study from the Loess Plateau, China. Field Crop Res. 2019, 242, 107589. [Google Scholar] [CrossRef]
- Xu, A.; Li, L.; Xie, J.; Wang, X.; Wang, L. Effect of Long-Term Nitrogen Addition on Wheat Yield, Nitrogen Use Efficiency, and Residual Soil Nitrate in a Semiarid Area of the Loess Plateau of China. Sustainability 2020, 12, 1735. [Google Scholar] [CrossRef] [Green Version]
- Rae, A.; Pardey, P. Global Food Security—Introduction. Aust. J. Agric. Resour. Econ. 2014, 58. [Google Scholar] [CrossRef] [Green Version]
- Lipper, L.; Thornton, P.; Campbell, B.M.; Baedeker, T.; Braimoh, A.; Bwalya, M.; Caron, P.; Cattaneo, A.; Garrity, D.; Henry, K.; et al. Climate-smart agriculture for food security. Nat. Clim. Chang. 2014, 4, 1068–1072. [Google Scholar] [CrossRef]
- Cabas, J.; Weersink, A.; Olale, E. Crop yield response to economic, site and climatic variables. Clim. Chang. 2010, 101, 599–616. [Google Scholar] [CrossRef]
- Tao, F.; Zhang, Z.; Xiao, D.; Zhang, S.; Rötter, R.P.; Shi, W.; Liu, Y.; Wang, M.; Liu, F.; Zhang, H. Responses of wheat growth and yield to climate change in different climate zones of China, 1981–2009. Agric. Forest Meteorol. 2014, 189–190, 91–104. [Google Scholar] [CrossRef]
- Chu, L.; Huang, C.; Liu, Q.; Cai, C.; Liu, G. Spatial Heterogeneity of Winter Wheat Yield and Its Determinants in the Yellow River Delta, China. Sustainability 2019, 12, 135. [Google Scholar] [CrossRef] [Green Version]
- Quan, S.; Li, Y.; Song, J.; Zhang, T.; Wang, M. Adaptation to Climate Change and its Impacts on Wheat Yield: Perspective of Farmers in Henan of China. Sustainability 2019, 11, 1928. [Google Scholar] [CrossRef] [Green Version]
- Zhang, J.; Balkovič, J.; Azevedo, L.B.; Skalský, R.; Bouwman, A.F.; Xu, G.; Wang, J.; Xu, M.; Yu, C. Analyzing and modelling the effect of long-term fertilizer management on crop yield and soil organic carbon in China. Sci. Total Environ. 2018, 627, 361–372. [Google Scholar] [CrossRef] [PubMed]
- Karthikeyan, L.; Chawla, I.; Mishra, A.K. A Review of Remote Sensing Applications in Agriculture for Food Security: Crop Growth and Yield, Irrigation, and Crop Losses. J. Hydrol. 2020, 124905. [Google Scholar] [CrossRef]
- Tyagi, V.; Nagargade, M.; Singh, R.K.; Jatav, H.S. Sustainable Development for Agriculture and Environment; Anu Books H.O.: New Delhi, India, 2018. [Google Scholar]
- Liu, L.; Zhang, X.; Xu, W.; Liu, X.; Wu, X. Challenges for global sustainable nitrogen management in agricultural systems. J. Agric. Food Chem. 2020, 68, 3354–3361. [Google Scholar] [CrossRef]
- Xin, C.; Chuanmin, S.; Jiali, L.; Jing, W.; Yue, L.; Wenjing, L.; Jing, S. Modelling environment and poverty factors for sustainable agriculture in the Three Gorges Reservoir Regions of China. Land Degrad. Dev. 2018, 29, 3940–3953. [Google Scholar]
- Qi, X.; Wang, R.Y.; Li, J.; Zhang, T.; Liu, L.; He, Y. Ensuring food security with lower environmental costs under intensive agricultural land use patterns: A case study from China. J. Environ. Manag. 2018, 213, 329–340. [Google Scholar] [CrossRef]
Figure 1.
Geographical location of the study area.

Figure 2.
Flowchart of this study.

Figure 3.
Details of phenological information.

Figure 4.
Spatial distribution of the average annual NPP during the growing season of winter wheat from 2000 to 2015.
Figure 4.
Spatial distribution of the average annual NPP during the growing season of winter wheat from 2000 to 2015.

Figure 5.
Relationship between NPP and yield at the provincial scale.

Figure 6.
Comparisons between simulated and statistical yields.

Figure 7.
Spatial distribution of yields of winter wheat from 2000 to 2015.

Figure 8.
Spatial distribution of change rate of winter wheat yield from 2000 to 2015.


Table 1.
Data resources.
| Name | Time | Data Type | Scale/Resolution | Data Resources |
|---|---|---|---|---|
| 1 km-grid crop phenological dataset | 2000–2015 | Raster | 1 km × 1 km | figshare |
| Phenological observations | 1994–2013 | Table | \ | China Integrated Meteorological Information Service System (CIMISS) |
| 1 km-grid NPP dataset | 2000–2015 | Raster | 1 km × 1 km | Global Change Research Data Publishing and Repository |
| Statistical yields | 2000–2015 | Table | \ | Nation Bureau of Statistics of China |
| Administrative data | 2010 | Vector | 1:1,000,000 | Resources and Environmental Scientific Data Center (RESDC), Chinese Academy of Sciences (CAS) |
Table 2.
Regression parameters of the models.
| Year | a | R2 | F | p |
|---|---|---|---|---|
| 2000 | 3.233 | 0.926 | 187.493 | 0.000 |
| 2001 | 3.353 | 0.976 | 611.230 | 0.000 |
| 2002 | 2.706 | 0.946 | 263.572 | 0.000 |
| 2003 | 2.848 | 0.945 | 260.345 | 0.000 |
| 2004 | 2.718 | 0.962 | 377.466 | 0.000 |
| 2005 | 2.701 | 0.956 | 325.228 | 0.000 |
| 2006 | 3.327 | 0.961 | 370.477 | 0.000 |
| 2007 | 2.610 | 0.955 | 323.049 | 0.000 |
| 2008 | 2.694 | 0.961 | 374.336 | 0.000 |
| 2009 | 3.078 | 0.974 | 558.510 | 0.000 |
| 2010 | 3.429 | 0.971 | 498.378 | 0.000 |
| 2011 | 3.289 | 0.969 | 474.230 | 0.000 |
| 2012 | 3.269 | 0.976 | 607.815 | 0.000 |
| 2013 | 3.286 | 0.965 | 414.918 | 0.000 |
| 2014 | 3.362 | 0.966 | 429.335 | 0.000 |
| 2015 | 2.692 | 0.964 | 406.964 | 0.000 |
© 2020 by the authors. Licensee MDPI, Basel, Switzerland. This article is an open access article distributed under the terms and conditions of the Creative Commons Attribution (CC BY) license (http://creativecommons.org/licenses/by/4.0/).
Share and Cite
MDPI and ACS Style
Han, D.; Cai, H.; Yang, X.; Xu, X. Multi-Source Data Modeling of the Spatial Distribution of Winter Wheat Yield in China from 2000 to 2015. Sustainability 2020, 12, 5436. https://doi.org/10.3390/su12135436
AMA Style
Han D, Cai H, Yang X, Xu X. Multi-Source Data Modeling of the Spatial Distribution of Winter Wheat Yield in China from 2000 to 2015. Sustainability. 2020; 12(13):5436. https://doi.org/10.3390/su12135436
Chicago/Turabian StyleHan, Dongrui, Hongyan Cai, Xiaohuan Yang, and Xinliang Xu. 2020. "Multi-Source Data Modeling of the Spatial Distribution of Winter Wheat Yield in China from 2000 to 2015" Sustainability 12, no. 13: 5436. https://doi.org/10.3390/su12135436
Note that from the first issue of 2016, this journal uses article numbers instead of page numbers. See further details here.