Article

Expectations and Challenges in the Labour Market in the Context of Industrial Revolution 4.0. The Agglomeration Method-Based Analysis for Poland and Other EU Member States

by
Marcin J. Piątkowski
Department of Entrepreneurship and Innovation, Cracow University of Economics, 31-510 Krakow, Poland
Sustainability 2020, 12(13), 5437; https://doi.org/10.3390/su12135437
Submission received: 30 April 2020 / Revised: 26 June 2020 / Accepted: 3 July 2020 / Published: 6 July 2020

Abstract

:
Technological revolution brings forth major changes in the labour market as well as the necessity to adapt to the shifting conditions on the part of both employees and entrepreneurs. This notion fits in with the European Policy of “Lifelong Learning” which presents the necessity to constantly improve skills and participate in the process of learning through the entire period of professional engagement. The aim of the article is to diagnose the current situation in the labour market and expectations towards employees as a result of the technological revolution and digitization, and to analyze whether there are groups of countries in the EU with similar features describing the labour market and to present the differences between these groups. The study uses research methods based on literature research, content analysis and comparative analysis, and the empirical part uses cluster analysis—the Ward method, using secondary statistical data from the Eurostat database. It was verified which groups of the Member States exhibited similarities to the extent of: forms of employment; work productivity; commitment of entrepreneurs and employees to the process of continuing vocational training (CVT) and lifelong learning; educating future employees of the economy at the level of higher education (HE) in STEM fields and development of digital skills as well as commitment of governments of each EU Member State to financing research and development in higher education institutions (HEIs). It may be ascertained that the average values of variables describing the pattern followed by “new” Member States which joined the EU in 2004 or later are, in majority, lower than the values of the same variables describing the pattern followed by the “old” Member States. It cannot be unambiguously stated that the affiliation with the Eurozone in any way determined whether a given group of Member States is better or worse than the other. The resulting figures may become significant at the stage of developing the employment policy as well as the education policy and the professional career development policy in the respective Member States. Those results may be applied to both evaluation and planning of actions to be taken against the background of the development strategy in order to reduce clearly visible inequalities between the European Union Member States.

1. Introduction

The interest in the issue of the current situation in the labour market in conjunction with Industry 4.0 arises from the belief that the industrial revolution will translate into a rapid increase in the efficiency of enterprises [1,2]. The change in the activities of enterprises will be associated with significant transformations in the process of educating future economic staff and the development of expected competences by employees and changes in the area of the labour market [3,4] and human resources management [5]. It particularly applies to the role of an individual in an intelligent manufacturing plant and the related necessary changes in employee professional qualifications and competences [6], especially in the area of digital skills and the process of continuous professional development.
The fourth industrial revolution is a galloping development of new technologies, with increased availability and high personalization of introduced technical solutions. These changes include digital production, network communications, computer technologies and automation, as well as many other areas [7]. The essence of the Industry 4.0 concept is based on a symbiosis of advanced production techniques, and information and communication technologies (ICT) as well as the speed and quality of the information provided [8]. The technological revolution is based on changes in the following areas: CPS (Cyber-Physical System), Internet of Things (IoT), Internet of Services (IoS), robotics and artificial intelligence, Big Data, cloud computing and augmented reality. They affect both products and processes, allowing improvements in performance and productivity among companies that introduce such technologies [9,10].
Over the past few years, digital technologies profoundly remodelled ways of doing business and have a significant impact on building the competitive position of enterprises [11]. Not even a decade ago, mobile devices, social networks, computing cloud or the analytical capacity of companies were so undeveloped that few people were able to predict how deeply ingrained they would become in business projects or entrepreneur–customer [12] and entrepreneur (owner)–employee relations [8]. ICTs are present in the modern economy in almost every sector. They become part of the daily life of the digital society and are used, among others, in the production process, in logistics, transport, health care, banking, and finally, in the public sector. They accompany an increasing number of people, both in the professional and private sphere [13,14].
A major aspect is related with the process of tailoring the skills and competences of employees required by the modern market to technological advancement. Attention should be drawn to the competences and skills of HEIs’ graduates entering the labour market as well as current employees (particularly in terms of digital literacy skills). Thus, the notion of lifelong learning, which is currently gaining in importance, is still crucial. “Lifelong Learning” is important both among all employees, regardless of age, and at every stage of professional career development and in each professional group. It means that apart from HEIs, the significant role in the process of vocational education and professional career development is being played by employers who provide their employees with the career development and training opportunities.
Thus, bearing in mind the crucial importance of the human factor for the development of economic activity, it is important to ensure employee career development opportunities through various forms of activities. A qualified employee translates into a higher competitive position of the enterprise [15]. It is indispensable to take appropriate steps to assure continual development of human resources and take advantage of their skills and competences. In the process of altering the employment model and increasing labour efficiency, an employer should consider, among other factors, innovative incentive schemes, flexible employment schemes in order to involve high-potential employees, as well as providing employees with new career development and training opportunities [16].
The presented areas are related to challenges in the labour market, expectations towards employees, and the possibility of continuous improvement of competences and skills by employees in the work environment, however, in the process of training these competences at the level of higher education, it was decided to analyze in relation to all European Union countries.
The aim of the article is to diagnose the current situation in the labour market and expectations towards employees as a result of the technological revolution and digitization, and to analyze whether there are groups of countries in the EU with similar features describing the labour market and to present the differences between these groups.
This article is based on the study of the related literature and the comparative analysis which enabled to define variables significantly related to the situation in the labour market, taking into account the impact of technological progress on employees and the labour market itself. Therefore, particular attention was drawn to the aspects related to HE, digital literacy skills and the issue of lifelong learning as factors significantly influencing work productivity. Improving employees’ competences and skills is regarded as an essential component of adapting to changing needs stemming from technological advancement. The diagnosed variables were utilised in the empirical part of the article to conduct the analysis of agglomerations based on Ward’s method in order to group 28 Member States of the European Union. This approach resulted in the clusters consisting of Member States with little variety to the extent of the assumed diagnostic characteristics within the group but proving differences among clusters. In order to complement the research, the analysis also utilises the clustering technique based on seniority of respective Member States in the European Union and differences between the so called “old” and “new” Member States. Through the use of the agglomeration method, the resulting figures enable to indicate which of the countries are faring better or worse in the areas significant for the labour market and crucial in terms of technological advancement. Those results may certainly be used and may become helpful in developing employment and education policies as well as professional career development policies in respective Member States. Furthermore, the research results may be applied to both evaluation and planning of actions to be taken against the background of the sustainable development strategy in order to reduce clearly visible inequalities between the Member States.

2. Literature Review

2.1. The Changes in the Labour Market

The majority of authors differentiate between the scenarios of complete automation and retaining human control over machines [17,18]. According to the positive vision of development, the Industry 4.0 revolution provides for the opportunity of creating a new and better workplace where a man and his or her needs matter most. In turn, the negative vision of a manufacturing plant of the future assumes dominance of technology over man [19]. Automation will not be limited to simple and repetitive or hazardous physical tasks but may threaten the position of numerous employees engaged in white-collar work of intellectual, cognitive or analytical nature by taking over certain routine tasks such as transport, office administration or follow-up or consumer services. Generally, 9% of jobs in the OECD countries are assumed to be automated and 25% may be significantly altered as the result of automation of 50–70% of the related tasks [20].
Boston Consulting Group indicates the employment rate will increase by 6% on the grounds of the increasing demand for a highly qualified workforce in the engineering and automotive industries [21]. The research indicates that the demand for highly qualified employees and technician-specialists with competences grossly exceeding their current professional qualifications is expected to rise [22]. Unfortunately, the future of qualified workers is uncertain [18]. The workers performing simple manufacturing tasks are forecast to lose employment as the result of automation. In turn, qualified employees performing complex tasks will be forced to improve their professional qualifications [23,24]. The results of the research prove that along with the technological advancement, low-qualified employees will be re-skilled to perform tasks which are not susceptible to automation, i.e., tasks requiring creative and social competences. These employees will be forced to obtain creative skills [25]. However, technological advancement may become a remedy for a shrinking labour force. Assuming constant demand for work, robots might be able to satisfy and fill in the demand gap by taking over burdensome, strenuous and hazardous tasks [12]. The prospective negative influence of technology on employment may be alleviated through investing in human resources [26] and Continuing Vocational Training of employees.
The changes related to technological advancement primarily require enormous business maturity on the part of entrepreneurs and extensive technological coverage. Apart from implementing innovations and restructuring contemporary manufacturing processes, entrepreneurs have to secure appropriate human resources in order to be prepared to face the challenge of entering the new era. The contemporary labour market expects work autonomy as well as flexible forms of employment. Additionally, Industry 4.0 entails the necessity for lifelong learning and improvement of professional qualifications. The lack of professional career development may result in exclusion from the labour market [27]. Thus, the increased emphasis on better adaptation of employees as the result of technological advancement as well as ensuring labour market efficiency are not the only means of addressing the challenge arising from the next industrial revolution. The prerequisite for social stability and coherence should also be taken into account [28].

2.2. New Competences and Skills of Employees

Taking technological advancement into consideration, one must remember that new jobs will require new competences and new skills. The combination of skills required in modern societies becomes increasingly complex and will continue to change along with the evolution of the workplace increasingly saturated with innovative technology. It requires development of digital literacy skills and capacity for lifelong learning within the framework of early education in order to upskill the future generations of staff members. For the moment the processes addressing problem solving, intuition, creativity and persuasion are the most difficult to automate [25].
Furthermore, it bears noting that the skills required in the STEM fields (science, technology, engineering, math) will, in the future, have to be combined with “soft” skills in the fields of, for instance, psychology or sociology. Repetitive tasks based on performing particular sequences of actions may be successfully completed by machines. However, machines will not substitute for creativity or development of innovations. Machines will not replace a man in anomalous, atypical, unconventional or specialised circumstances. Hence, the idea of isolating human capital (knowledge) as a separate production factor. Unless the society prepares for the emerging changes, unemployment may truly become a fact. If the fourth industrial revolution will become challenging for the non-innovative workforce not prepared in terms of digital literacy, it will push it out of the market [13].
Among the competences for the future, the following characteristics are being highlighted: capacity for active learning, creativity (in terms of artistic domain but primarily technological), digital literacy skills, capacity for knowledge sharing and cooperation or the orientation for problem solving [29,30]. These competences will have to be, over time, merged and combined with the STEM skills [31]. A similar opinion is being expressed by entrepreneurs who emphasise the role of technical skills requiring knowledge and understanding of manufacturing processes in combination with respective skills oriented towards creative problem solving and social skills based on communication and cooperation with other individuals. Additionally, entrepreneurs expect from employees to present and express willingness for lifelong learning and knowledge sharing [32].
Along with the emergence of Industry 4.0, robotisation and automation of manufacturing will result in increased requirements concerning mechanical engineering. The demand for new types of materials, construction elements and robot designs will require the cooperation between advanced information technologies and engineers. The development of engineering in cooperation with the most advanced technologies is also to be expected. Similar to in the 1990s, when new services in the beginning of technological revolution emerged, the new wave of advanced technologies may result in innovative services combined with significant changes in the workforce. At the high level of robotisation, one may assume that apart from the innovative technologies, the role of manufacturing will gain in importance, which will, in turn, account for the IT robotisation process [33].
However, the problem of employment and professional career development is exacerbated by the fact that according to the World Economic Forum report, 65% of children born after the year 2007 will work in professions which do not yet exist [34]. Thus, it is necessary to make changes in educational institutions in order to develop attitudes and values as well as the capacity for acquiring and developing professional competences characteristic for the modern labour market [27]. Reaching the vision of a future workplace which will be an economic and social move on the part of governments, businesses and individuals for the benefit of lifelong learning as well integration of re-skilling and upskilling programmes and strategies in the entirety of the professional spectrum is a necessity. For this reason, upgrading the educational policy is targeted at the rapidly improving quality of education, and upskilling, regardless of age, is vital [34]. Due to this fact, entrepreneurs, who were somewhat naturally obliged to educate employees to ensure that their skills and competences are adequate for the needs and expectations of the entrepreneurs, will play a pivotal role in this process.

2.3. Continuing Vocational Training and Lifelong Learning

In order to speak about the sustainable development in the context of the labour market and acquiring knowledge, we should consider both the aspect of lifelong learning as well as CVT of employees. The process of education does not end with graduation from a vocational school or HEI. Employers should participate in costs of professional development of their employees, owing to whom, employers are able to multiply capital and enter new markets.
The participation of the workforce in routine and repetitive tasks of the manufacturing sector will decrease due to diminishing work productivity, and the number of jobs for atypical and unconventional tasks which will require higher level of competences, overall, will increase. Thus, development of industry within the framework of the economy 4.0 will result in large-scale initiatives for the benefit of lifelong learning including upskilling for individuals remaining in their current positions [35]. Therefore, the necessity for lifelong learning and development of competences is emphasised [36].
Particular attention is being drawn to the necessity for upskilling in the STEM field (science, technology, engineering, math) [29]. By the year 2020, the labour market will have been estimated to be short of approximately 1 million individuals educated and trained in those fields. Currently, such individuals are particularly valuable and sought after, which is also observable in Poland where the demand for programmers is constantly growing [37]. This, in turn, requires investing at all stages of education as well as in the area of further vocational training of older individuals already active in the labour market [29]. The attention must be also drawn to differences in adaptation to changes and capacity for learning among employees representing different generations. To this effect, the understanding of employees’ needs should facilitate implementation of the process of further vocational training in an enterprise regardless of employees’ age and despite the inter-generational differences [38,39]. Unfortunately, the cases where lifelong learning is being perceived as an additional cost rather than an investment can still be observed in various businesses [40].
Along with the development of the concept of the Industry 4.0, the demand for the manufacturing labour and the Research and Development labour will keep growing whereas the importance of hierarchical management in organisations will keep diminishing. Due to that, a gap emerges to be possibly filled in by the professional career development based on vocational training. Implementation of a business model based on digitalisation and a technologically advanced workplace will be possible only with qualified staff members responsible for technologically advanced tasks available—also in newly set up companies which often act as a driving force of technological and economic advancement. The labour market policy also has to adapt to the new changes. The increased dynamic and greater requirements for relocation of employees are to be particularly expected [41].
Development of economy based on a digital platform facilitates reorganisation of the labour market and workflow [42]. The Internet is increasingly becoming the meeting point of employees and recruiters. In recent years, job opportunity online platforms have emerged to connect individuals searching for work with freelancers from companies on the lookout for employees [28,43]. Furthermore, in the face of the threat of the pandemic at the turn of 2020, our world needed to address the importance of utilisation of information and communication technologies in order to maintain continuity of operations of individual enterprises. Wherever it was possible, workflow was reorganised on the basis of application of IT tools and remote work, in the face of the need for social isolation and distancing across the world.

2.4. Flexibility of Employment and Inequalities

Opening the economy to globalization processes contributes to the increasing importance of exogenous factors affecting the conduct of business by domestic enterprises and their competitiveness. Thereby, the interest of owners and managers of companies in non-standard forms of employment in relation to traditional work schemes has aroused. Due to the economic turmoil, competitive companies are forced to become more flexible, also in the area of employment [44,45]. Thus, the existing model of long-term employment is changing and is gradually phased out by means of flexibility, both in terms of time and nature of labour which is to contribute to making the labour market more attractive for employers and employees alike [39].
A particular type of flexibility is the employment flexibility. It is the ability to rapidly adjust the number and competence profile of employees to the changing conditions and needs. Its scope may be considered from the perspective of the number of employees, spatial mobility of employees and working time [46]. The flexibility of employment defined as the adjustment of the size and structure of employment as a result of changes that the company has to cope with, should be analysed on the grounds of the adopted employment model, organisation form and working time as well as the flexibility of remuneration [47]. From the point of view of economic operators, due to the flexible forms of organisation of working time, entrepreneurs have a greater capacity for influencing their human resources depending on the nature of the performed work, work cycle or intensity of the performed tasks [48,49]. The structure of a flexible employment model assumes the existence of a small group of employees permanently connected to the company due to their key competences and a large number of employees employed in flexible forms of work [44].
Taking into account the flexibility of employment, Poland is at the forefront of statistical figures in terms of the number of people employed under civil law contracts [50]. Although it is an important instrument to mitigate the effects of the economic collapse, it does not guarantee pension security or employment security for people employed under such contracts. M. Guzikowski indicates that reduction of the scale of employee protection, which should be accompanied by the liberalisation of regulations governing employment of new employees, may seem advisable. By doing so, companies could more flexibly adjust the size of employment to changes in the labour market [51].
It should be remembered that flexible forms of employment carry the risk of work dehumanization. It means that the short-term nature of the employee’s relationship with the organisation may result not only in a low degree of an employee’s identification with the company but also in a low level of self-motivation to work. Furthermore, the attention is being drawn to the opportunity for emergence of social inequality and divisions which may potentially result from the implemented technological changes. These inequalities will result not only from the job slash but also from the poor social mobility and the sustaining digital gap. Social inequality may also become exacerbated in various branches, sectors, regions or jobs because of the widening digital gap between those who are and those who are not able to keep up with the technological advancement [52,53]. On the other hand, digitalisation may help mitigate the labour market inequalities between sexes. The economy based on digital technologies could particularly secure and ensure greater work flexibility and better balance between work and family or knocking down cultural barriers and equalizing opportunities for women in comparison to men in the labour market [28,54]. However, technological advancement may become a remedy for a shrinking labour force. Assuming constant demand for work, robots might be able to satisfy and fill in the demand gap by taking over burdensome, strenuous and hazardous tasks [12].

2.5. Employment Policy—The Concept of Flexicurity

One of the proposed solutions to the problem of reconciling, or even balancing, flexibility with the labour market security is the concept of flexicurity. The European Commission draws attention to the need for introduction of the model of flexicurity in the Member States of the EU [55]; the basic premise of which is a synthesis of two elements of the institutional system of the labour market acting in two opposite directions, i.e., employment security and income stability (security) with flexibility of the labour market. It results from the permanent restructuring to which modern economies, and thus also their labour markets, are subject to [51]. This concept varies significantly from country to country, assuming national variants, due to which, elements will be more emphasised. In the Belgian and German variants, greater emphasis is placed on income security, whereas in Denmark and the Netherlands—on job security. Numerous authors have attempted to analyze flexicurity in their research and taxonomy of this concept [56,57,58]. The European Foundation identifies five flexicurity models: Nordic, Anglo-Saxon, Continental, Mediterranean, East European and Italian. Poland was qualified as the East European model characterised by a lack of income security, average/low flexibility of the labour market, moderate taxation, low social security outlays, low support for active labour market policies and low involvement in lifelong learning.
Concurrently, the scale of professional mobility in Poland is below the European average. The research outcome indicates that employers utilise flexible forms of employment in order to minimise labour costs of business activity, and the idea of flexicurity, due to being costly in execution, is difficult to realise in Polish conditions. As a result, a large group of employees without stable employment, underpaid and with a restricted social benefit package develops. For the moment, CVT serves as the basic method for securing professional mobility of employees. Employees employed under indefinite term work contracts are the preferred employees in education of whom employers are willing to invest in. Thus, in the case of Polish companies, the two main areas of flexicurity—flexible employment and CVT of employees—instead of supplementing each other, appear to be mutually exclusive. Therefore, an incentive scheme, conducive for employers interested in CVT of all employees, should be implemented.

3. Materials and Methods

The article sets out the following purpose of work: Diagnose the current situation in the labour market and expectations towards employees as a result of the technological revolution and digitization and to analyze whether there are groups of countries in the EU with similar features describing the labour market and to present the differences between these groups.
To achieve this goal, the following research questions were formulated:
-
What are the expectations towards employees in the context of technological progress, especially the digitization of social and economic life?
-
What is the current situation in the labour market and in terms of the competences of graduates and employees, as well as in terms of improving qualifications of employees in EU Member States?
-
Is it possible to distinguish a group of EU countries with similar characteristics and are there differences in the labour market between “old” and “new” EU Member States?
To achieve the research goal and answer the research questions posed, the theoretical part of the article has been prepared by means of research methods based on the comparative analysis of the present data and the analysis of contents on the basis of the selection of domestic and international related literature. The reports prepared by international institutions engaged in researching the labour market, CVT, improving employees’ competences, lifelong learning and influence of technology in the labour market (the issues relevant from the perspective of this paper) were utilised. The empirical part of this article has been prepared on the grounds of the secondary data procured from Eurostat database and concerning Poland and the remaining Member States of the European Union (including Great Britain). It means that the described phenomena are presented on the basis of the entire research sample. The research methods applied in the article have been based on the comparative analysis of the presented data, the contents analysis and Ward’s agglomeration method, and have been used with the following goals:
  • Isolating and specifying characteristics and qualities important for the labour market in consequence of the Industry 4.0 revolution for 28 Member States of the EU, including Poland.
  • The cluster analysis of the EU Member States through the use of the agglomeration method in respect of the similarities while taking into consideration the same variables.
  • The comparative analysis on the grounds of the resulting figures.
During the research and the process of defining variables influencing labour market changes resulting from the technological advancement, particular attention has been drawn to the aspects related with HE, digital literacy skills and notion of lifelong learning. Improving competences and skills of employees is deemed to be an indispensable factor for adaptation to the changing needs resulting from the technological advancement, particularly necessary in modern times. It is also an important issue from the perspective of HEIs’ graduates entering the labour market.
The process of selecting variables used for grouping analysis consisted of three stages. In the first step, the initial selection of variables was based on a literature review, including reports: DESI 2019—Human Capital. Digital Inclusion and Skills [59], European Innovation Scoreboard [60], Human Development Report 2019 [61], IMD World Digital Competitiveness Ranking [62], Skills supply and demand in Europe [63], Global Report on Adult Learning and Education (GRALE) [64], DigComp 2.1—The Digital Competence Framework for Citizens [30], and Vocational education and training in Europe (1995–2035) [65]. Variables related to the labour market, labour productivity, STEM education process, continuous adult education, use of information and communication technologies and digital technologies in society, and the level of socio-economic development of countries were selected. Based on this, a list of 35 variables was created. In the next stage, a correlation analysis was carried out, based on which variables for which the correlation coefficient value which were greater than 0.7 were rejected (to eliminate collinearity as a condition when creating clusters). The third stage consisted of analysing the importance of predictors in cluster analysis, which rejected those variables whose impact on the grouping process was less than 30%. These activities allowed for the final selection of 10 variables used for further analysis.
In order to identify clusters consisting of the EU Member States, similar in terms of a given characteristic, the cluster analysis, one of the object classification methods, was used. Ward’s method (minimal variation method), which is one of the cluster analysis’ agglomeration methods utilising the variation analysis approach to estimate distance between clusters, was used in the research.
In the case of the cluster analysis, attention must be paid to two factors: the representativeness of the sample and multicollinearity. The representativeness condition has been fulfilled, as the entire research sample is covered by the research (all 28 Member States, as of 31 December 2018, have been taken into consideration). In turn, multicollinearity occurs when independent variables are highly correlated. Following J. Steczkowski [66], the following correlation and dependence ranges have been adopted for the analysis of correlation and dependence coefficient: below 0.2 (no linear correlation between the analysed characteristics), 0.2–0.4 (weak correlation), 0.4–0.7 (moderate correlation), 0.7–0.9 (strong correlation), above 0.9 (very strong correlation). In order to eliminate multicollinearity a correlation analysis has been performed for the variables initially selected on the basis of literature review, and the variables for which the correlation coefficient value exceeds 0.7 were discarded. Furthermore, to eliminate outliers, the diagram of case profiles was utilised.
Through the use of the comparative analysis and the contents analysis, and after performing the procedure described above, the variables significant from the point of view of influence on work productivity and the labour market in the context of the Industry 4.0 revolution in relation to the issues of lifelong learning and improving professional competences by employees were identified. The description of variables is presented in Table 1 and the detailed results of the analysed variables for each of the 28 EU Member States are contained in Appendix A.
Variables number: 1, 2, 4–9 were defined as stimulants i.e., it is expected that those variables will reach higher values, in turn, variables number: 3 and 10 were defined as destimulants i.e., it is expected that those variables will reach lower values. In order to conduct the aggregation analysis, values of the variables were converted from destimulants into stimulants according to the following formula [67]:
x i j * = max i x i j x i j
where:
  • x i j —output values for i-th realisation of j-th variable and
  • max x i j —maximum for i-th realisation of j-th variable.
Before the aggregation of variables, the procedure of input data standardization was performed according to the following formula [68]:
z i j = ( x i j x ¯ j S ( x j ) ) p
where:
  • x i j —output values for i-th realisation of j-th variable
  • x ¯ j —arithmetic average of j-th variable,
  • S ( x j ) —standard deviation of j-th variable,
  • p = 1.
Standardisation facilitates comparing values of numerous variables independently of their original distribution and measuring units.
Next, using Ward’s method, the cluster analysis of countries was performed on the basis of the specified and standardised variables. This method facilitates grouping the researched objects for which variance within each cluster is the smallest and, concurrently, the variance between individual clusters is as large as possible. For this reason, Ward’s method is considered to be highly effective because it ensures homogeneity of the objects inside clusters and heterogeneity between clusters. This method aims for minimizing the sum of squares of deviation within clusters. The measure of diversity of clusters to the extent of average values is the ESS (Error Sum of Squares) described with the following formula [69]:
E S S = i = 1 n x i 2 1 n ( 1 = i n x i ) 2
where:
  • x i —value of a variable which is segmentation criterion for i-th object,
  • n —number of objects in a cluster.
As a result of applying this method, a dendrogram (tree diagram) was produced which illustrates the hierarchical structure of the set of objects presenting the decreasing similarity between the objects. The dendrogram is supplemented with a “heat map” which graphically presents the variables which underwent the process of standardization in combination with the researched cases (Member States). The best approach to determining the number of clusters is to include information from both the scree plot and dendrogram. This method is used for the needs of cluster grouping and determining their number. In the process of choosing the number of clusters, the moment of cutting was determined by the situation when on the scree plot, for the first time, the distance between successive stages defining clusters in the cluster analysis process was significantly large [70,71]. It was the first time between the 25th and the 26th stage, therefore the cluster analysis was stopped after the 25th stage (i.e., 2 stages before the end). In this way, 3 distinct clusters were obtained.
In the statistical analysis and presentation, Statistica and Microsoft Excel programs were used. The resulting figures were presented by means of the following forms of graphical data projection: tables, a dendrogram, a heat map, coordinate graphs, and a box plot.

4. Results and Discussion

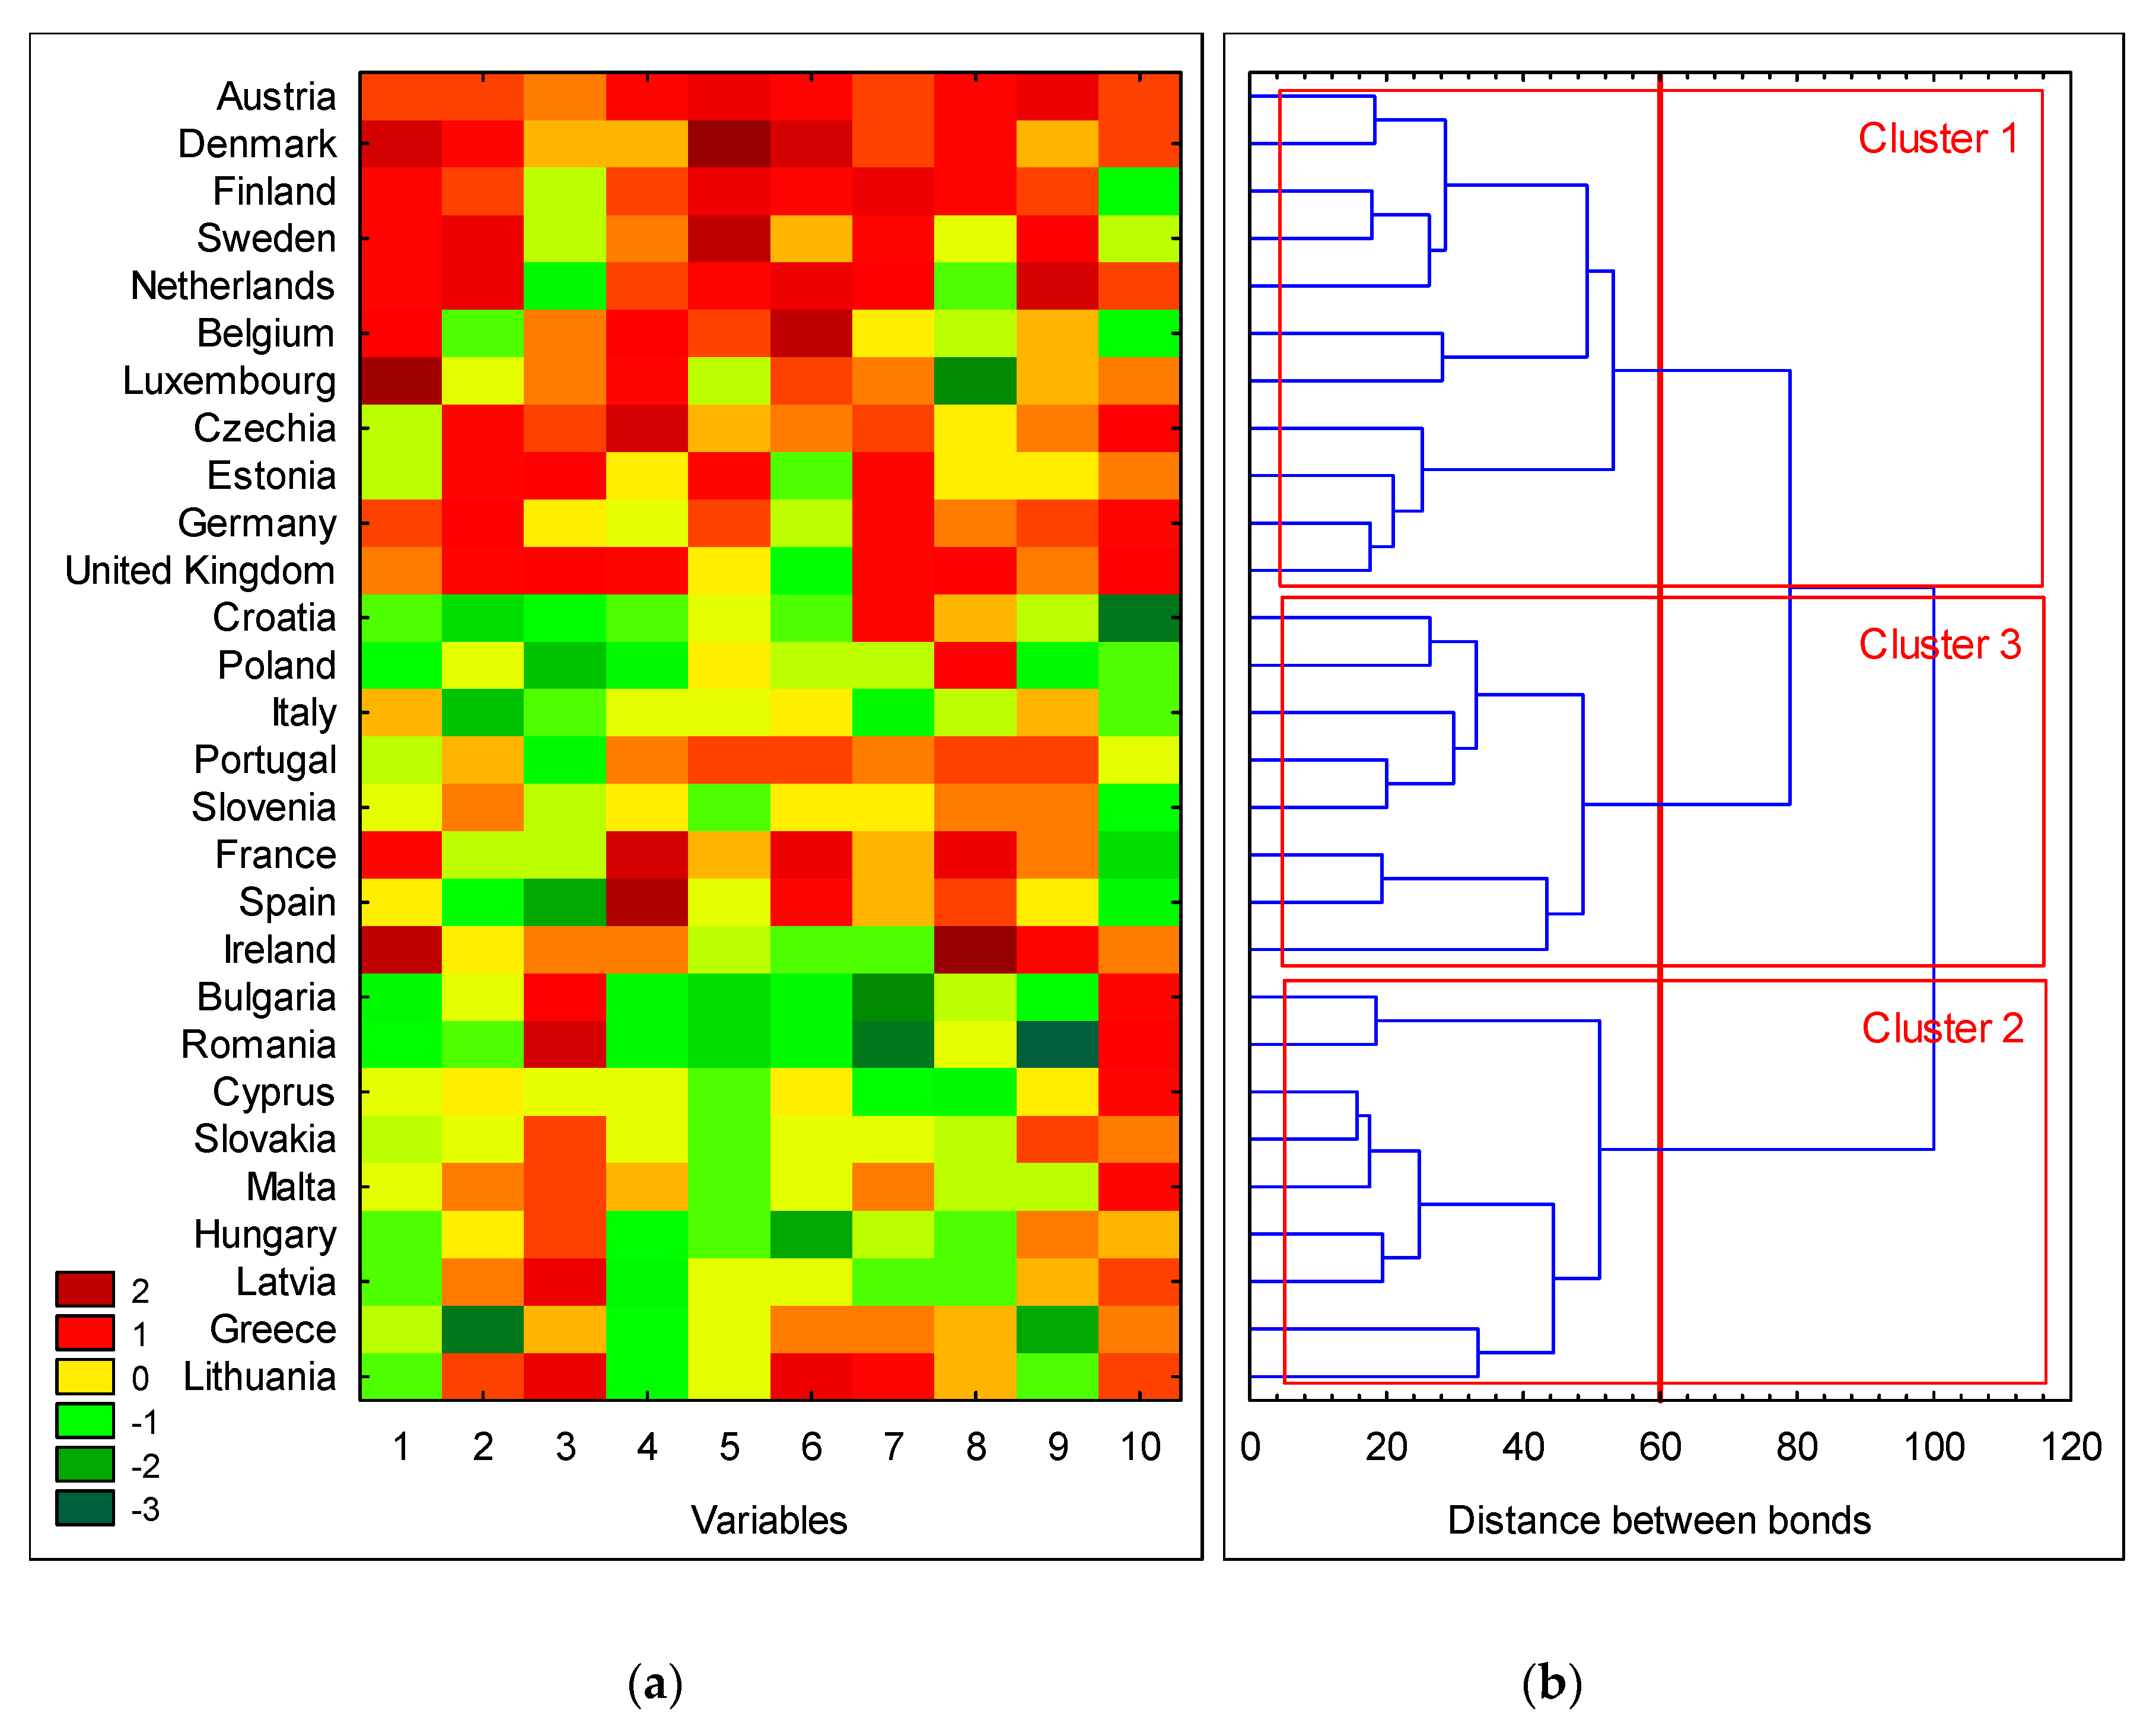
4.1. Analysis of Results at the Clusters Level

On the grounds of the performed analysis of variables’ aggregation by means of Ward’s method, three clusters of countries, similar within each cluster in terms of assumed characteristics and concurrently differing between individual clusters, were established. The results of the performed analysis are the dendrogram and the heat map presented in Figure 1.
The list of 28 EU Member States divided into three clusters defined by means of Ward’s method on the grounds of the adopted diagnostic characteristics is as follows (for the purpose of more comprehensive analysis, these countries were also divided into the countries which joined the European Union in 2004 or later, the so called “new Member States” (13)—they were indicated by underlining their name, and countries which belong to the Eurozone (18)—indicated by italicization):
  • Cluster 1 (11 countries): Austria, Belgium, Czech Republic, Denmark, Estonia, Finland, Germany, Luxembourg, the Netherlands, Sweden, United Kingdom;
  • Cluster 2 (9 countries): Bulgaria, Cyprus, Greece, Hungary, Latvia, Lithuania, Malta, Romania, Slovakia;
  • Cluster 3 (8 countries): Croatia, France, Ireland, Italy, Poland, Portugal, Slovenia, Spain.
The basic descriptive characteristics for each of the clusters are presented in Table 2.
The variables adopted for the analysis are significant from the point of view of influence of employees’ productivity and the labour market in the context of the technological advancement (the Industry 4.0 revolution). These variables are significantly related to a lifelong learning process which is crucial for the process of analysing and planning future changes by the authorities of individual countries.
Below is a description of each cluster, containing its characteristics in terms of the countries that belong to it and due to the features included in the study.

4.1.1. Cluster 1

As the result of cluster analysis by means of Ward’s method, it can be observed that the first cluster contains countries possessing the greatest potential in the area of the researched characteristics in comparison to the remaining groups. To an extent, they can serve as a model for the remaining EU Member States. From among these 11 countries, as much as 9 are the so called “old” EU Member States and 7 countries belongs to the Eurozone. In this cluster, the average value of work productivity per hour is the highest (54 euro) among all three clusters and simultaneously 42% higher than the EU average. The employment rate in this group is also higher than the EU average by 3.6 percentile points and is 77.4%. From the perspective of involvement of entrepreneurs who employ more than 10 workers in the CVT, nearly one third of companies has a special part of their budget allocated towards this goal. In this cluster, the average number of the economic operators who have a part of their budget allocated towards the education of employees exceeds the EU average of 24%. Additionally, in the terms of employees’ participation in various informal forms of education related to the performed work, the countries grouped in the first cluster dominate over the rest with the average percentage of 52% of employees aged 25–64 participating in such forms of education. The highest values have been recorded in the Netherlands, Austria and Sweden. The level of expenditures for the R&D in HE measured as the percentage of GDP is 0.6% among the countries from the first cluster and is higher than the EU average by 0.2 percentile points. To this extent, the group is dominated by the three Nordic countries: Denmark, Sweden and Finland. The number of HEIs’ graduates in STEM fields (science, technology, engineering, math) per 1000 individuals is 17. In turn, the average percentage of workers possessing basic and advanced digital literacy skills is 85% for the countries grouped in the first cluster. The highest share of workers aged 25–34 declaring to possess these types of skills has been recorded among the first cluster countries: Finland, the Netherlands, United Kingdom, Germany and Estonia.

4.1.2. Cluster 2

This group consists of nine countries, all of which, apart from Greece, are young members of the European Union. The countries grouped in the second cluster are characterised by the lowest average values for the variables considered in the research. Furthermore, the majority of countries in this group are members of the Eurozone. The average level of work productivity in the second cluster, represented by the eight youngest members of the EU and Greece, is barely 19 euro, 50% of the average for the entirety of the EU. The percentage of workers aged 20–64 and employed for a fixed term is 73%. Employees’ participation in the work-related courses and training is the lowest in the entire EU—barely 35%. The situation is the worst in Romania and Greece where only 6% and 17% of employees, respectively, undertake actions leading to improving qualifications through participation in courses and training. The average level of expenditures for R&D in the second cluster is 0.22% of GDP. The lowest, infinitesimal expenditures below 0.1% of GDP, have been incurred by the governments of Bulgaria and Romania. Moreover, in these countries, less than 50% of workers aged 25–34 possess basic or advanced digital literacy skills. The number of HEIs’ graduates in STEM fields per 1000 individuals is 14 and is lower by 4 than the average for the entire EU.

4.1.3. Cluster 3

The last, third cluster, consists of eight countries with the minority of those countries joining the EU in 2004 or later i.e., Poland, Slovenia and Croatia. The majority of this group is members of the Eurozone. The employment rate in the countries from the third cluster (70%) is close to the EU average (74%). The percentage of workers aged 20–64 employed under fixed period work contracts is 18.3% and the percentage of individuals employed under short-term work contracts for a period of up to 3 months is 3.8%. These are the highest values for these two variables overall among all the clusters. In case of precarious work, the first six places with the highest values are occupied by the Member States grouped in this cluster. In terms of companies with budget allocated towards the CVT of their employees in this cluster, every one in four (26%) of economic operators has a part of their budget devoted to this goal. The average level of the state budget expenditures towards the Research and Development in the third cluster is 0.35% of GDP. The number of HEIs’ graduates in STEM fields aged 20–29 per 1000 individuals is 22 and is 4 individuals higher than the average for the entire EU. Ireland, France and Poland are the countries where the conversion factor of the number of STEM graduates is the highest.

4.2. Extended Analysis Based on Variables and Clusters

In the next part of this paper, the analysis of respective variables describing conditions in the labour market for each of the clusters was performed; as well as a reference has been made to conditions and circumstances in Poland and EU. This analysis relates to the process of education and upskilling employees in particular, as well as to employment rates. The presence of statistical diversity between the clusters in relation to the adopted cluster analysis method is presented in Table 3.
The average value for work productivity measured as the ratio between GDP in current prices divided by the number of working hours in 2018 is the highest in the first cluster (54 euro) among all three clusters and, simultaneously, 42% higher than the average value for the entire EU (38 euro). The lowest values are present in the second cluster (19 euro) represented by the 8 youngest members of the EU and Greece. The work productivity value in Poland by the end of 2018 was 17 euro which, unfortunately, is not even a half of the European average (exactly 45% of the average value for the EU). In these terms, Poland is placed in the 24th position among the EU Member States and last but three among the “new” Member States. In this group, the highest values were produced by Slovenia (89 euro), Bulgaria (58 euro) and Romania (57 euro). However, it is noteworthy that Romania, Ireland and Poland are at the forefront of countries where the increase of the productivity ratio between 2010 and 2018 was the highest in the entire EU (141%, 138%, 127% respectively).
The distribution of the average values in division to clusters of the “old” and “new” EU Member States is presented in Figure 2. The confidence intervals for both clusters do not overlap and this implies that, taking into consideration the division in terms of seniority in the EU, it can be ascertained that the average productivity per hour values in both of these groups differ significantly. It has been confirmed by the ANOVA univariate analysis (under assumption that the variables are measurable and independent as well as the assumption of normal distribution in each of the groups and homogeneousness of variance).
The high increase in work productivity during the span of eight years is dominant among the new Member States where the first eleven spots out of twelve are occupied by the youngest members of the EU. This should be met with contentment as it implicates that joining the EU facilitated faster development of these countries and the increase in work efficiency. This is the goal of providing support to the new Member States under financial instruments and other forms of aid—to level and mitigate differences between regions and Member States. In this regard, Greece places last and is the sole country to record the decrease in productivity in comparison to the year 2010. It should be definitely read and perceived as a detrimental phenomenon and the confirmation of the economic collapse this country has been unable to cope with since the year 2009.
The next variable utilised in the research is the employment rate which is one of the indicators of realisation of “Europe 2020—A strategy for smart, sustainable and inclusive growth” adopted by Member States in 2010 with the object of reinvigorating economic growth and revitalising, as well as with the goal of energising reforms in the EU Member States [72]. According to the stipulations of this strategy, the value of this indicator for the entire European Union should reach 75% by the year 2020. Taking into consideration the cluster analysis utilising Ward’s method, the situation is the best in the first cluster where the average value of the employment rate is higher than the European Union average by 3.6 percentile points. The values reached by the EU Member States from second and third clusters are below the average value for 28 countries but, fortunately, these values are not far off, with the level of standard deviation not exceeding 5.5%.
In the adopted document, Poland declared to reach, within the established timeframe, the employment rate of 71% and was able to reach this goal as early as in 2018 (72.2%). During the eight years since 2010, the largest increase, above 20%, has been noted in Malta, Hungary, Lithuania and Estonia. In Poland, the increase of 12.3% was registered. In the same period, the decrease in the employment rate has been noted in Cyprus (−1.5%) and in Greece (−6.7%). In both these countries, the attempts at restoring the employment rate can be observed, which has been increasing since 2014, but as the result of the two crises, the financial crisis of 2008 and the Eurozone crisis of 2011, these countries were unable to return to levels from before the year 2009. In regards to the division in terms of sex, the values of the employment rate in Poland are as follows: men (79.4%), women (65%). The female employment rate in economy is lower by 11.6% across the entire EU than the employment rate of men. The greatest disproportions have been recorded in Malta (21.9%), Greece (21%), and in Italy (19.8%).
Among the variables which directly refer to the structure and model of employment, the indicators describing the percentage of the individuals employed for a fixed term and the percentage of the individuals employed under short-term work contracts for a period not exceeding 3 months (defined as precarious work) were also taken into consideration. In both cases, this issue concerns employees aged 20–64. The Member States grouped in the third cluster produced the highest values for both of these variables and the average values for this cluster are 18.3% and 3.8% respectively. In turn, the average European Union values are 11% in the terms of individuals employed for a fixed term and 1.9% in case of precarious work. Figure 3 presents distribution of the average values in each of the three clusters for the variable concerning the share of individuals employed under fixed term work contracts.
The highest percentage of the individuals aged 20–64 employed under fixed term work contracts and exceeding 20% has been registered in Spain, where every fourth individual is employed under such terms—26%, Poland—24% and in Portugal—22%. The average European Union value for the year 2018 concerning the employment for a fixed term has not been exceeded by 15 Member States grouped in the second and third clusters which produced indications on the level ranging from 1.1% (Romania), 1.4% (Lithuania) and up to 10.8% in Germany.
In the terms of precarious work, the first six spots with highest indications has been occupied by Member States grouped in the third cluster. The largest percentage of individuals employed under short-term work contracts has been recorded in Croatia (6.5%). In Poland, 3.6% of individuals aged 20–64 are employed under such terms, 1.7% more than the average value for the European Union. In turn, in 17 of the Member States grouped in the remaining two clusters, the level of job insecurity related with precarious work is lower than the European Union average (1.9%) with the values ranging between 0.2–0.3% in the case of Romania, United Kingdom and the Czech Republic, and 1.9% in the case of Hungary. It should be noted that the values of these two variables remaining at high level is detrimental from the point of view of an employee and his professional stability. It can be assumed that the economy is strong when the percentage of fixed term work contracts and work contracts for a period of up to 3 months remains as low as possible. However, it should be remembered that the currently growing model of employment covering the non-standard forms of employment is based on the decreasing participation of the indefinite period work contracts in favour of other forms [45]. The models based on the increased share of non-standard forms of employment were presented as early as in the 1980s. At that time, the concepts based on, i.e., flexibility of organisation were developed, such as the concept of flexible structure presented by Ch. Handy [73] and Atkinson’s concept of a flexible company [74].
However, as S. Taylor indicates, the increased popularity of fixed period contracts may result in the decrease in efficiency and commitment of employees. Non-standard forms of employment have been negatively received by employees. For this reason, employees are willing to accept worse working conditions in exchange for the guarantee of stable and permanent employment [75].
Furthermore, as certain authors have noted [23,76], due to the diversification of conditions of the respective groups of employees in terms of professional stability or remuneration, such solutions can lead to segmentation of the internal labour market and the exacerbation of the phenomenon of social inequality. In consequence, such solutions can result in the reduced performance, commitment and self-motivation of employees. However, emergence of these forms of employment are primarily the result of economic factors, increasing instability of the setting, and difficulties with forecasting changes.
The necessity to adapt employees’ skills to the requirements of the changing economy, particularly in the context of technological revolution, requires paying particular attention to the aspect of opportunities for continuing training offered by employers in the workplace, as well as the capacity for and willingness for upskilling expressed by the very employees. This issue fits in with the European policy of Lifelong Learning which advocates the necessity for constant upskilling and participation in the process of learning throughout the entire period of professional engagement. For this reason, these issues were also taken into consideration during cluster analysis.
Due to the survey carried out in the EU every five years (the last one conducted in the year 2015) among companies employing more than 10 individuals, we are in possession of information concerning the percentage of those economic operators which have a part of their budget devoted specifically to CVT. These forms of education include educational or training activities completely or partially funded by the company. Partial funding can include devoting working time to the educational activity as well as financing training equipment. Almost every third company (30%) which has a budget for CVT education is present in the first cluster as well as nearly every fourth company located in the countries belonging to the third cluster. The average value of economic operators who have a part of their budget devoted to CVT of their employees exceeds the European Union average of 24% in the case of both clusters. Unfortunately, in the case of countries grouped in the second cluster, this value is 10% lower than the European Union average and is on the level of 14%. The highest values, in this regard, have been noted in companies located in Spain (48%) and France (40%)—the third cluster, and in the Czech Republic (42%)—the first cluster. The lowest percentage of business entities declaring to possess a special budget devoted to CVT of their employees has been noted in Romania and Bulgaria (8.5% each), Latvia (8.6%)—the second cluster, and in Poland (8.5%)—the third cluster. Considering the division of countries in terms of seniority in the EU, this aspect is clearly dominated by the “old” Member States in which company owners actively operate for the benefit of CVT and significantly outpace representatives of companies from the “new” Member States of the EU. The act of the employer becoming engaged in the activity of this type for the benefit of his employees is largely not appreciated among the younger Member States.
Figure 4 presents the scatter graph and the analysis of correlation between the commitment of company owners to Continuing Vocational Training of their employees by means of allocating a part of their budget towards this goal and work productivity of each of the EU Member States. The aggregation of the “old” Member States belonging primarily to the first cluster is visible, for which the average values after conducting the correlation analysis are higher than the EU average and significantly outmatch average values around which primarily the “new” Member States from the second cluster are gathered.
Statistical significance of the diversification of the average values between these two groups of Member States dependent on the EU seniority is confirmed by Figure 5.
The situation appears to be better in regards to the participation of employees in various informal forms of education related with the performed work among which we may specifically indicate courses, workshops, workplace training—tutelage and private lessons. Moreover, this aspect is invariably dominated by the countries grouped in the first cluster with the average percentage of 52% of employees aged 25–64 (compared to the EU-28 average of 44%) improving their professional competences (with employees from the Netherlands, Austria and Sweden at the forefront). More than a half of employees participating in informal forms of education related with work belongs to the eight Member States which, apart from Slovakia, represent the “old” Member States. The lowest average values for this variable has been produced by employees from the countries grouped in the second cluster. The situation is the worst in Romania and Greece where only 6% and 17% of employees, respectively, undertake actions leading to improving qualifications through participation in courses and training. In Poland, which is placed third to last, 28% of employees aged 25–64 care for their professional development. In case of the remaining countries, these values exceed 30%, and among the countries at the forefront, are more than twice as high and exceed 60%. Figure 6 presents the scatter graph for the EU Member States between the percentage of employees participating in informal education related to work and work productivity per hour. The average correlation values of these two variables in relation to workers from the Member States with longer seniority in the EU are visibly higher than the values in the countries which accessed the EU in 2004 or later. The situation in the labour market in the area of the researched variables strongly indicates diversification between these two groups of the EU Member States.
The efficiency of employees at the initial stage of their careers, particularly knowledge, skills and competences at their disposal, is the derivative of the education system in which they participate. Only at the latter stage do employee skills develop through the expansion of knowledge resulting from work and by means of CVT. Due to this, the cluster analysis takes into account the variables referring to the expenditures on the Research and Development in the field of HE, the percentage of HEIs’ graduates in the STEM fields and the level of digital literacy skills they possess upon entering the labour market and at the beginning of their careers.
The highest average level of the R&D expenditures in the field of HE measured as the percentage of GDP (0.6%) has been noted among countries from the first cluster and is higher than the EU average by 0.2%. This group has been dominated by three Nordic countries (Denmark, Sweden and Finland) where the level of expenditures is the highest (0.98%, 0.84% and 0.69%, respectively). Ten out of twelve places in regards to the R&D activity in the field of HE have been occupied by the ten “old” EU Member States. Whereas, the last six places in this tally have been occupied by the representatives of the “new” Member States of the EU belonging to the second cluster. The statistically significant diversification of the average values between these two groups of countries has been presented in Figure 7. In 2018, governments of Poland and Great Britain devoted 0.38% of GDP to the R&D activities in the field of HE. The average for the R&D expenditures in the second cluster is 0.22% and 0.35% in the third cluster. The lowest, infinitesimal expenditures in this field were incurred by the governments of Bulgaria and Romania (0.04% and 0.05%).
Considering the number of STEM graduates (i.e., science, math, IT, engineering, production engineering and construction) per 1000 individuals, the highest average number of STEM graduates has been recorded in the third cluster (22 graduates per 1000 individuals). Ireland, France, and Poland (which belong to the third cluster) and Great Britain (which belongs to the first cluster) are countries where the number of HEIs’ graduates in the STEM fields is the highest (33, 26, 24 and 24, respectively). The average number for the entire European Union is 18 graduates per 1000 individuals. In the first cluster, this number is lower by one person and lower by four persons in the second cluster. Apart from Poland, the first ten places in this category have been occupied by nine representatives of the “old” Member States of the EU. We should bear in mind that according to forecasts, the number of STEM graduates in combination with the highly developed digital literacy skills they should possess, will be crucial from the point of view of the technological advancement and the increasing demand for employees possessing competences in these fields.
The important issue relating to the characteristics indispensable in the contemporary and the future labour markets, touched upon in scientific literature and European Union reports [77,78,79], is the subject of employees possessing digital literacy skills. For this reason, this particular variable was also considered in the cluster analysis by means of Ward’s method. Particular attention has been drawn to the individuals beginning their professional career, the individuals aged 25–34. The workers from this age group will be the largest degree of participants effected by the constant changes in the labour market, and to meet these challenges, they will be forced to display a high level of digital literacy skills. Across the entire European Union, three out of four workers (75%) can declare to possess basic or advanced digital literacy skills. The average number for the countries grouped in the first cluster is 85% and in the third cluster is close to the EU average—72%. The largest percentage of the employees aged 25–34 who declare to possess these types of skills have been noted among the countries from the first cluster and these have been: Finland (92%), the Netherlands (89%), Great Britain (87%), Germany (87%) and Estonia (86%). Apart from Estonia, the remaining countries are the so called “old” EU Member States. The number of workers who possess such skills is lower than the EU average in as much as eleven Member States. Less than 50% of workers aged 25–34 in Romania and Bulgaria have been able to display mastery of basic or advanced digital literacy skills, and in Poland, 66% of workers have been able to declare to possess such skills.
In correlating the percentage of populace possessing basic or advanced digital literacy skills with work productivity (Figure 8), the dominant role of the countries from the first cluster and with the longest seniority in the EU can be observed. Far weaker results concerning digital literacy skills in relation to work productivity have been observed among the countries with shorter seniority in the EU, particularly among the countries grouped in the second cluster. It can be assumed that the governments of these countries, particularly the governments of Romania and Bulgaria, will face an enormous challenge to overcome in order to improve these numbers. It will also be a challenge for, as well as the expectation addressed towards, the EU organisation to emphasise even more strongly the issues of improving competences and introducing changes in the labour market among the workers from the new Member States in order to level the differences in development, during planning the European Union budget for the coming period.

4.3. Suggestions for Future Research

In the context of the broad issue of the labour market and the technological advancement discussed in the article, a particularly interesting area of research concerning models of employment and the situation in the labour market in relation to the coronavirus pandemic emerges. The research question which can be posed under these circumstances is: Will the economic collapse resulting from the COVID-19 pandemic be a “salvation” for the entrepreneurs who, up till now, were dealing with the lack of labour force and the increasing demands concerning remuneration? The questions of if and how the relocation of Member States between the clusters will occur and what it will look like, whether the economic crisis will accelerate the implementation of new employers-employees relations and whether the application of modern technologies will influence (or reinforce) the changes in the labour market which were already initiated, are also very interesting areas for exploration and research. As it turns out, companies from the BPO (business process outsourcing), SSC (shared services centre) and ITO (information technology outsourcing) are already engaged in talks concerning the renegotiation of office space rental agreements in order to limit the current and future costs. The managers of companies in these sectors are preparing for transforming the model of employment from a classical full-time model conducted and performed in an office to a model utilising employees’ own place of living and remote work. Such a model of work can grow, and an office will become a place for briefings and conferences where the shift work model will be used based on the office work performed in the office on selected days of the week by teams of employees divided into groups.

5. Conclusions

The application of the research methods based on the review of related literature, and the comparative analysis and the variables aggregation method by means of Ward’s cluster analysis, allowed to complete the established research goals. As the result of this study, it was possible to answer the research questions posed, and then to isolate the features relevant to the labour market in consequence of the technological revolution 4.0 for 28 Member States of the EU.
It has been ascertained which countries display similarities in terms of: the labour market situation and the forms of employment as well as the work productivity measured as the labour productivity; commitment to and involvement of employers in the process of CVT and Lifelong Learning; education of future employees in STEM fields and acquiring digital literacy skills, as well as commitment of the governments of each of the EU Member States to financing Research and Development in HEIs.
The conducted research and the process of agglomeration by means of Ward’s method allowed to specify the three following clusters of EU countries in the field of variables studied: Cluster 1 (Austria, Belgium, the Czech Republic, Denmark, Estonia, Finland, Germany, Luxembourg, the Netherlands, Sweden, United Kingdom); Cluster 2 (Bulgaria, Cyprus, Greece, Hungary, Latvia, Lithuania, Malta, Romania, Slovakia) and Cluster 3 (Croatia, France, Ireland, Italy, Poland, Portugal, Slovenia, Spain).
The main conclusions of the study are as follows:
  • The first cluster contains the countries with the highest potential in terms of examined features in comparison with other clusters. They can, in some way, be a model for other EU countries.
  • The lowest values of variables referring to the labour market in relation to the process of employees’ education and terms of employment describe the situation in the second cluster which, apart from Greece, contains the “youngest” members of the EU.
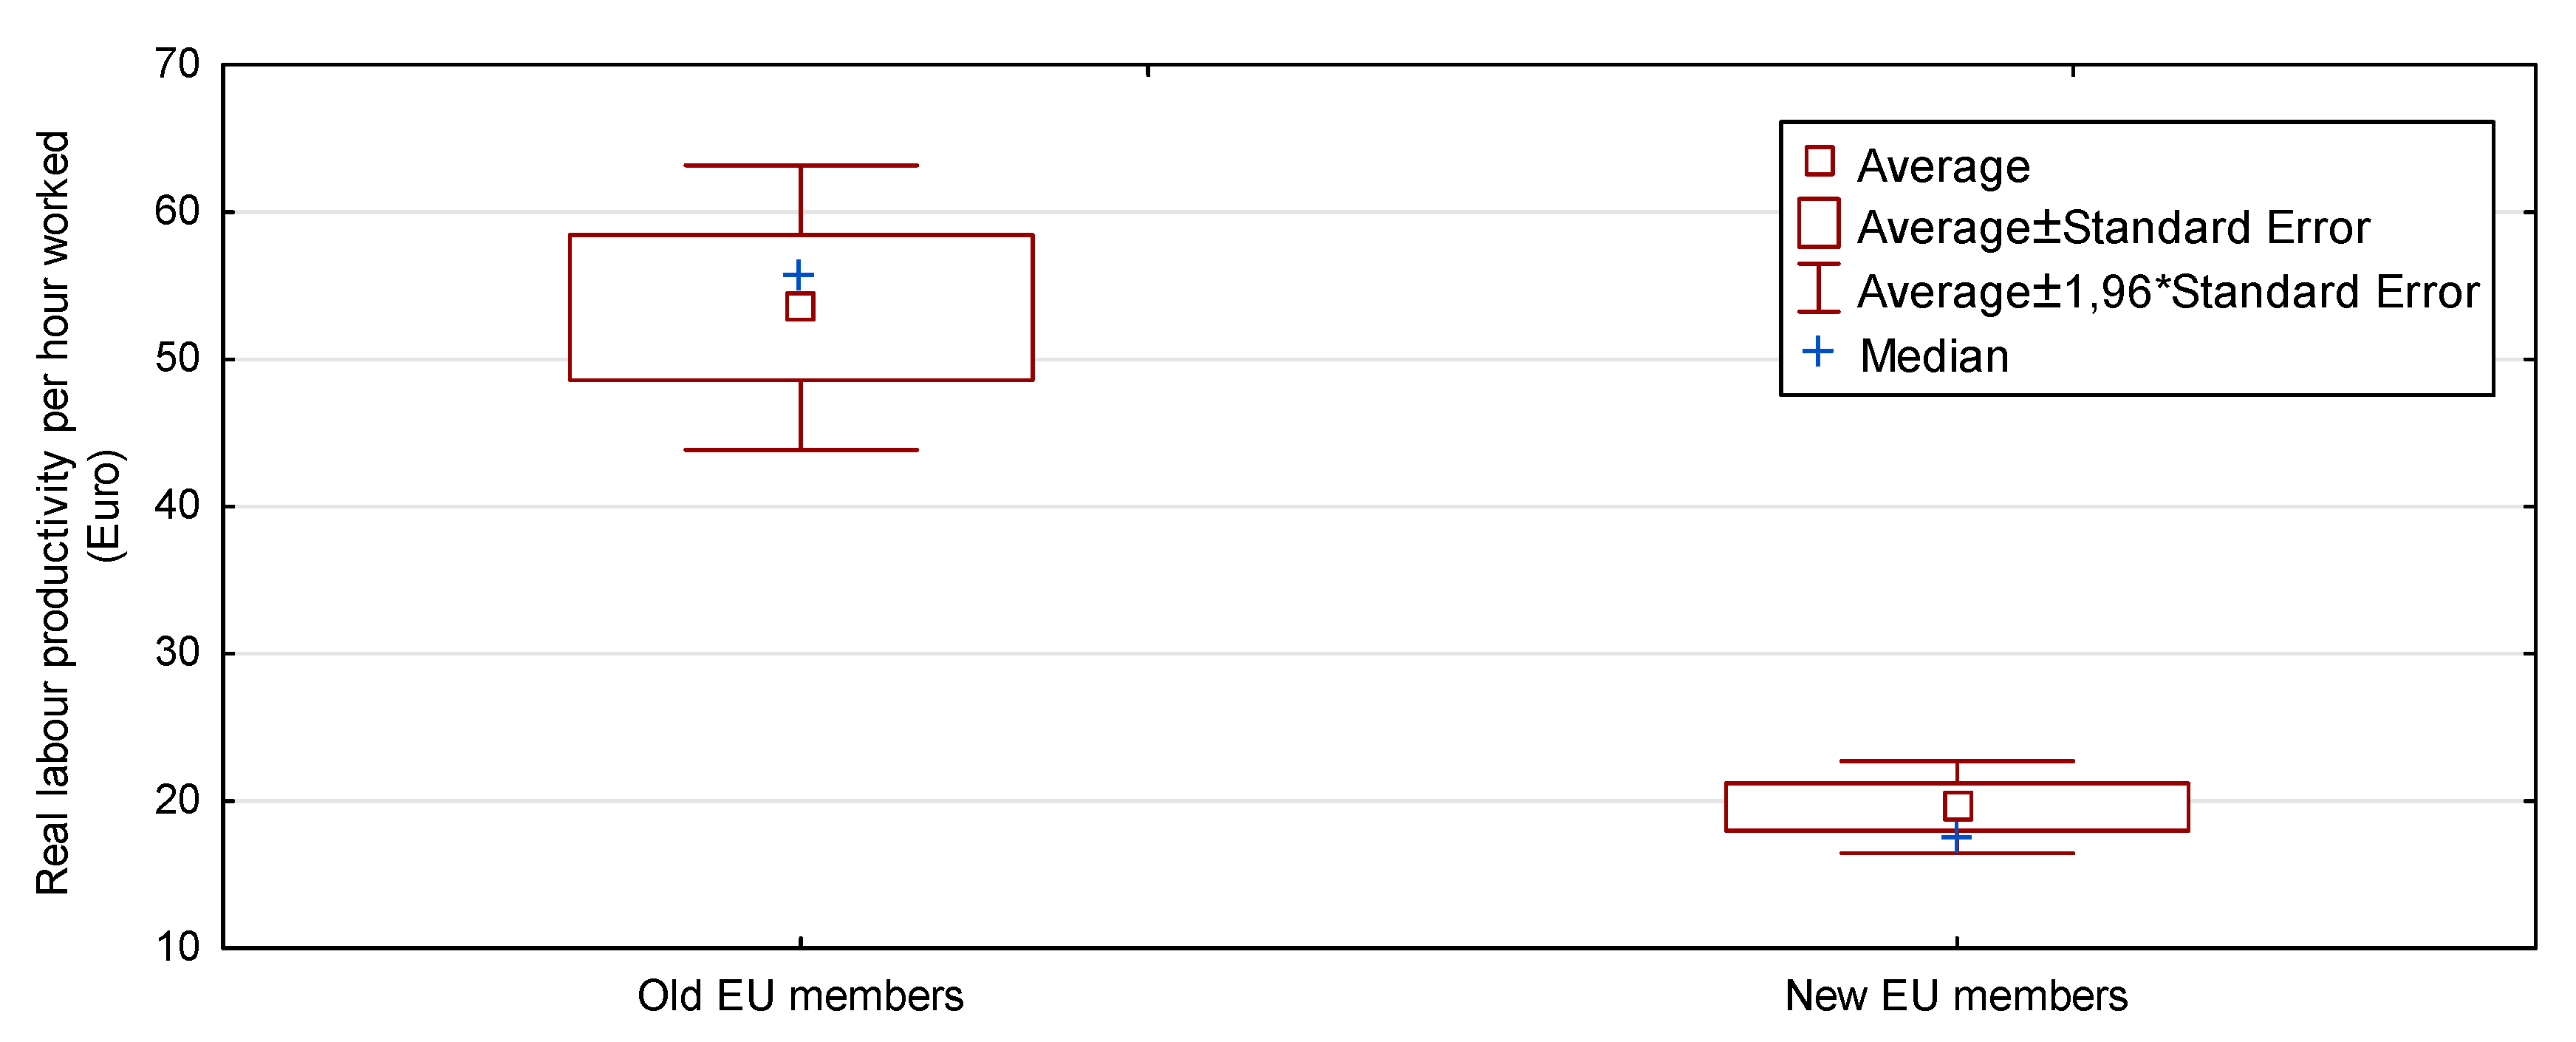
  • The high increase in the level of productivity across the span of eight years has been primarily observed among the new members of the EU. Such a situation should be met with approval as it indicates that accessing the EU allowed the economies of these countries to develop faster and the work productivity to improve. This is the goal of providing support to the “new” Member States under the financial instruments and other forms of aid—to level and mitigate the differences between regions and Member States. Romania and Poland (and from the “old” EU Member States—Ireland) are at the forefront of countries where the increase of the work productivity indicator between 2010 and 2018 has been the highest for the entire EU. To this extent, Greece places last and is the sole country to record the decrease in productivity in comparison to the year 2010. It should be definitely perceived as a negative phenomenon and a confirmation of the economic collapse of that country.
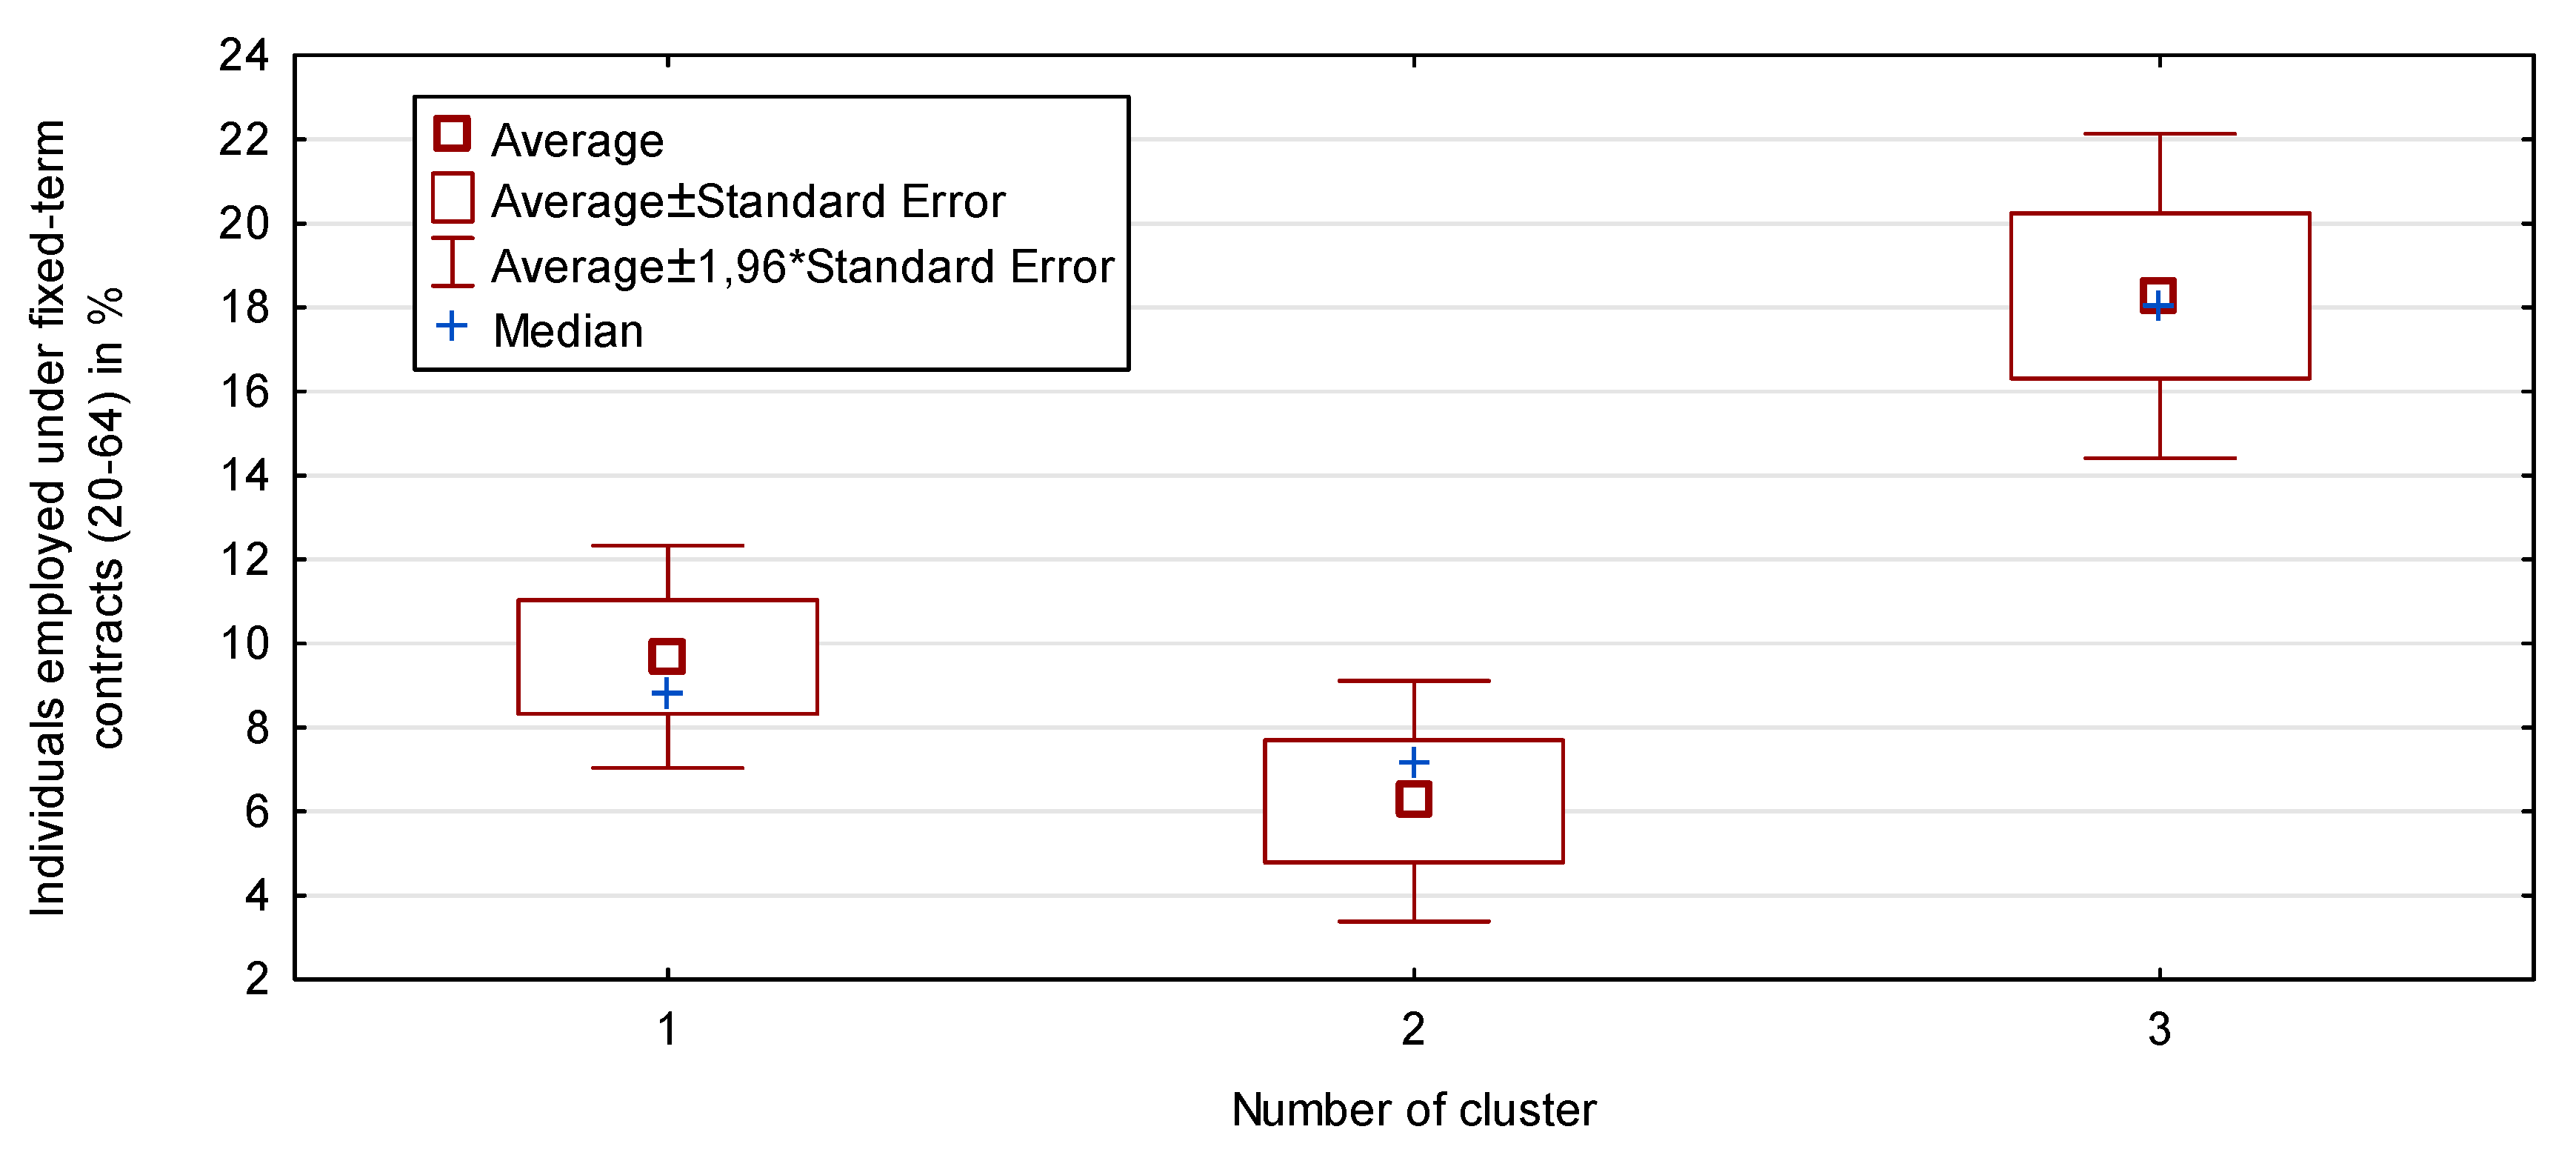
  • The highest percentage of workers aged 20–64 employed under fixed period work contracts exceeding the level of 20% has been recorded in Spain and Poland, where every fourth and every fifth worker, respectively, is employed under such contracts. Persistence of the rate of fixed term and short-term employment for a period of up to three months remaining at a high level is not beneficial from the perspective of an employee and his professional stability. However, it should be considered that the currently growing model of employment covering non-standard forms of employment is based on the decreasing share of indefinite work contracts in favour of other forms.
  • The employment rate of women in the entire European Union is lower by 12 percentile points than the employment rate of men. The greatest disproportions have been recorded in Malta, Greece and Italy.
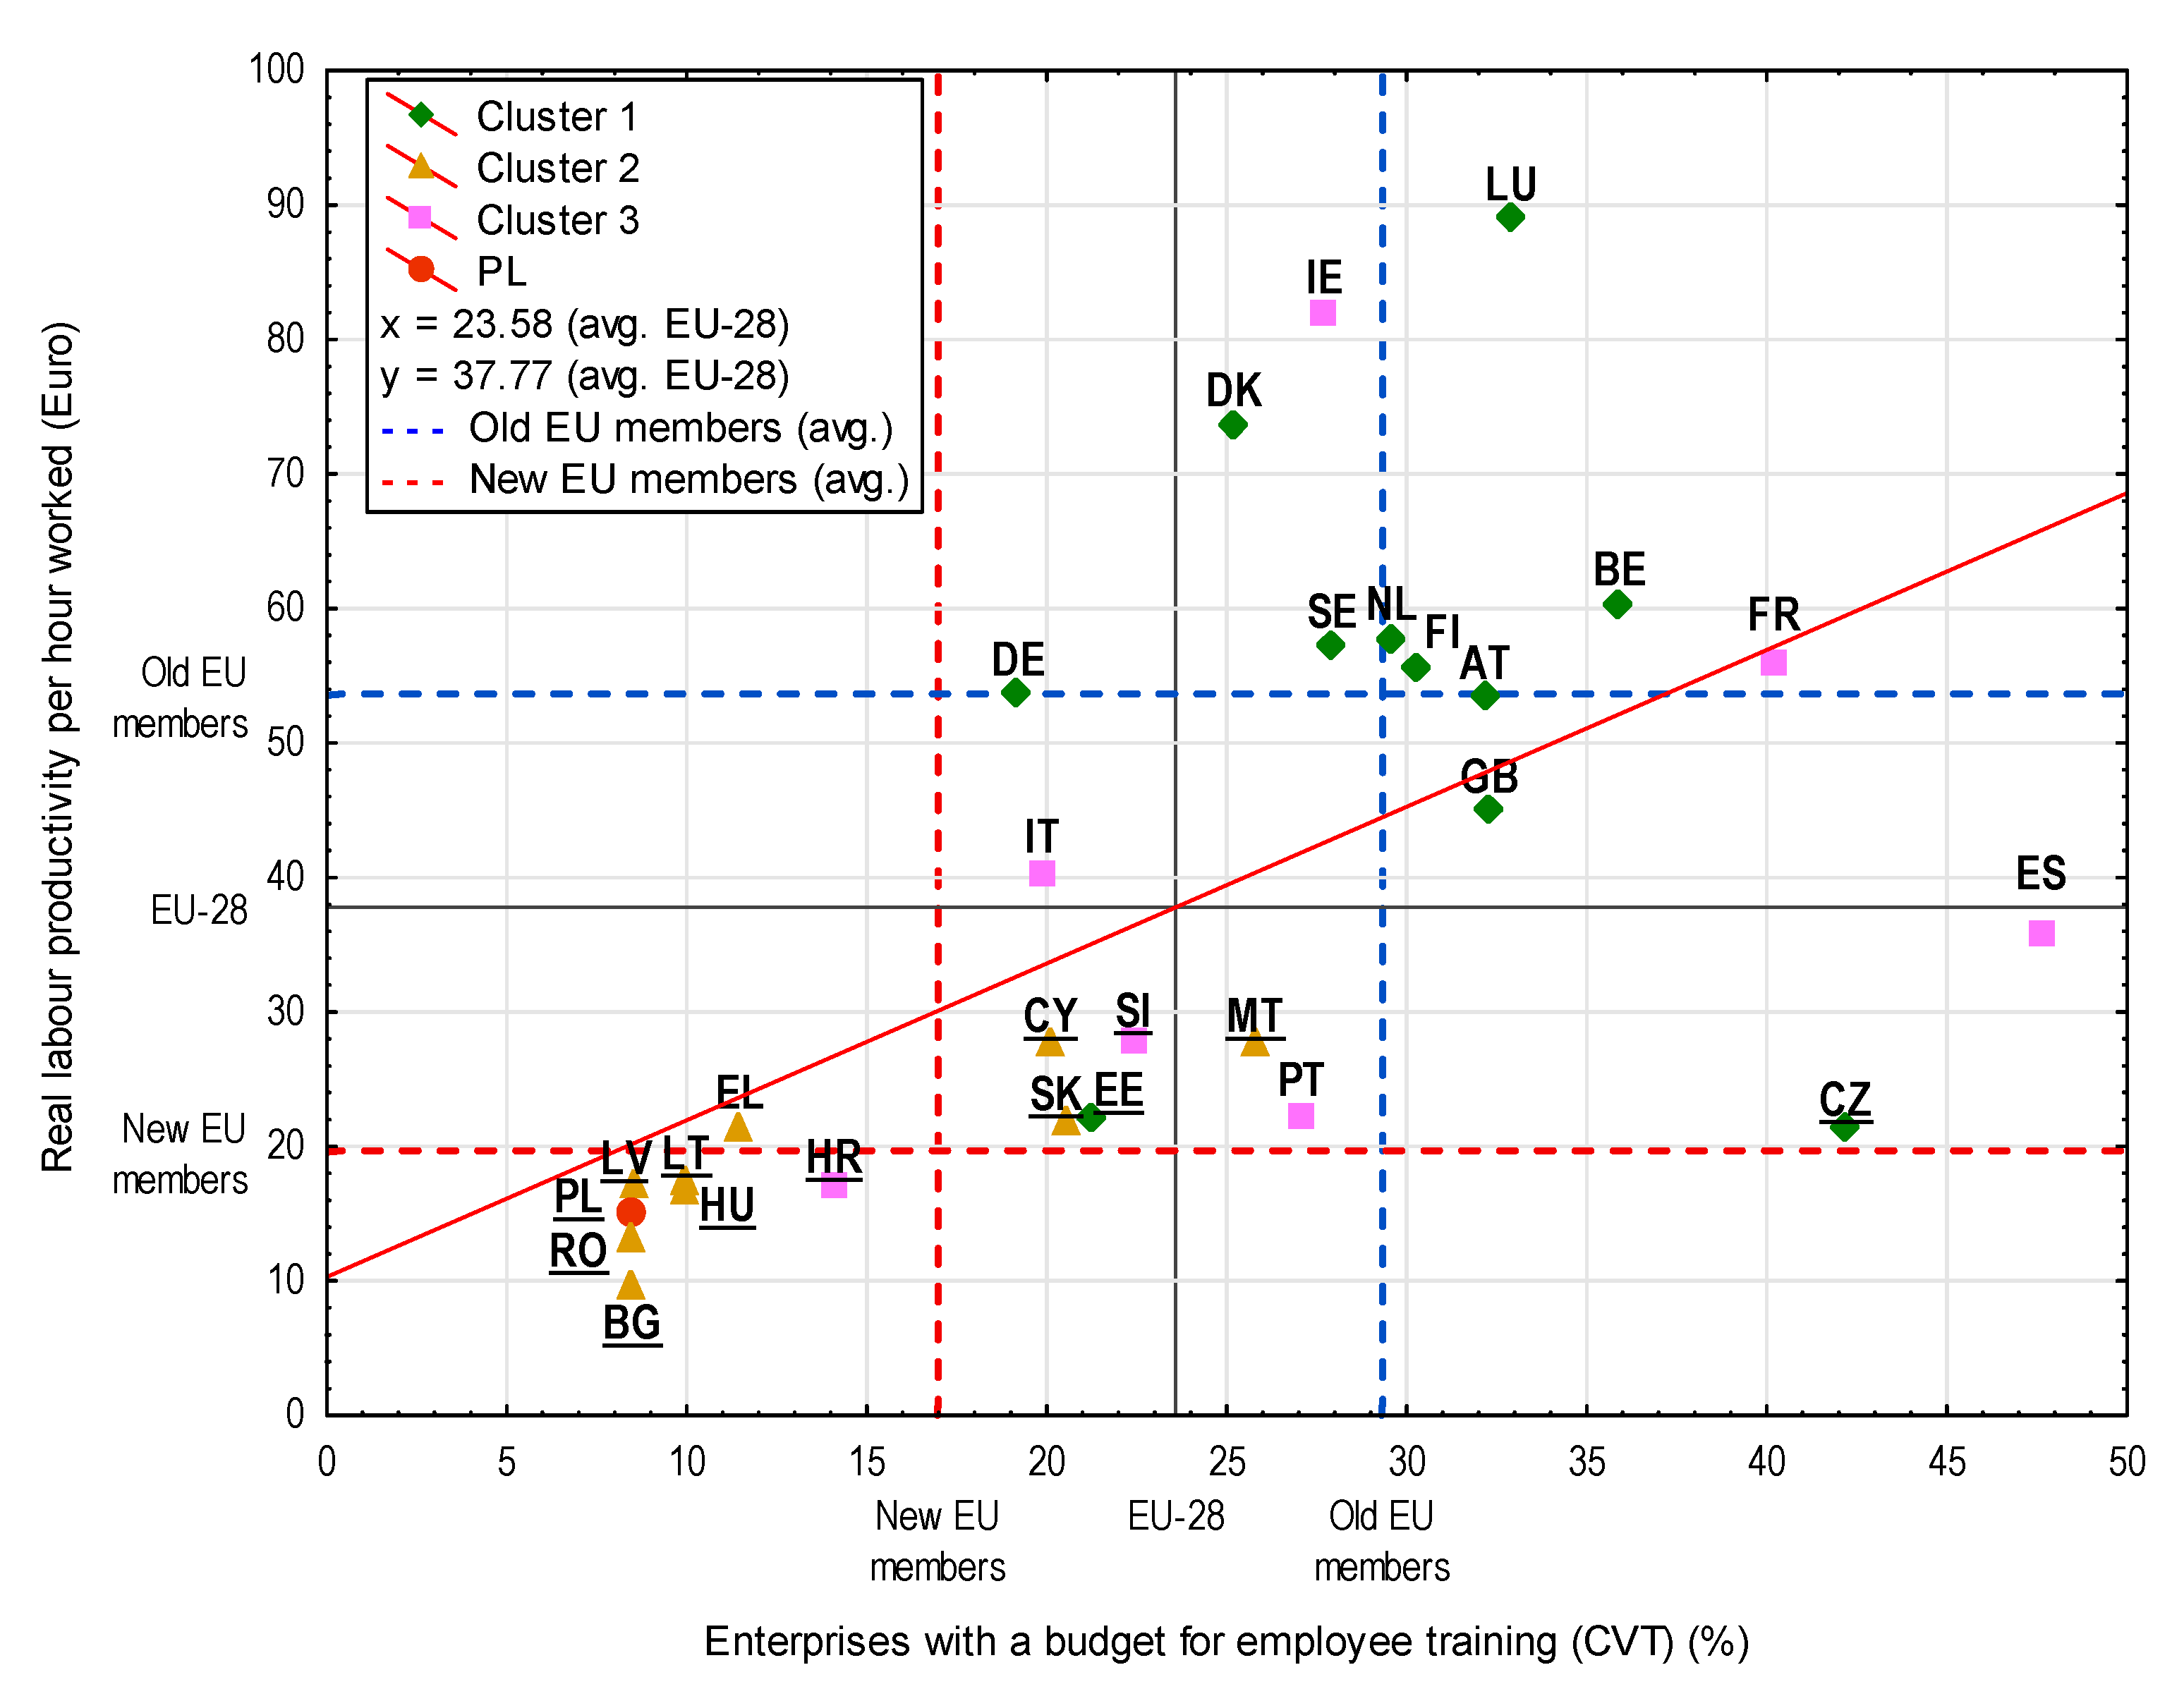
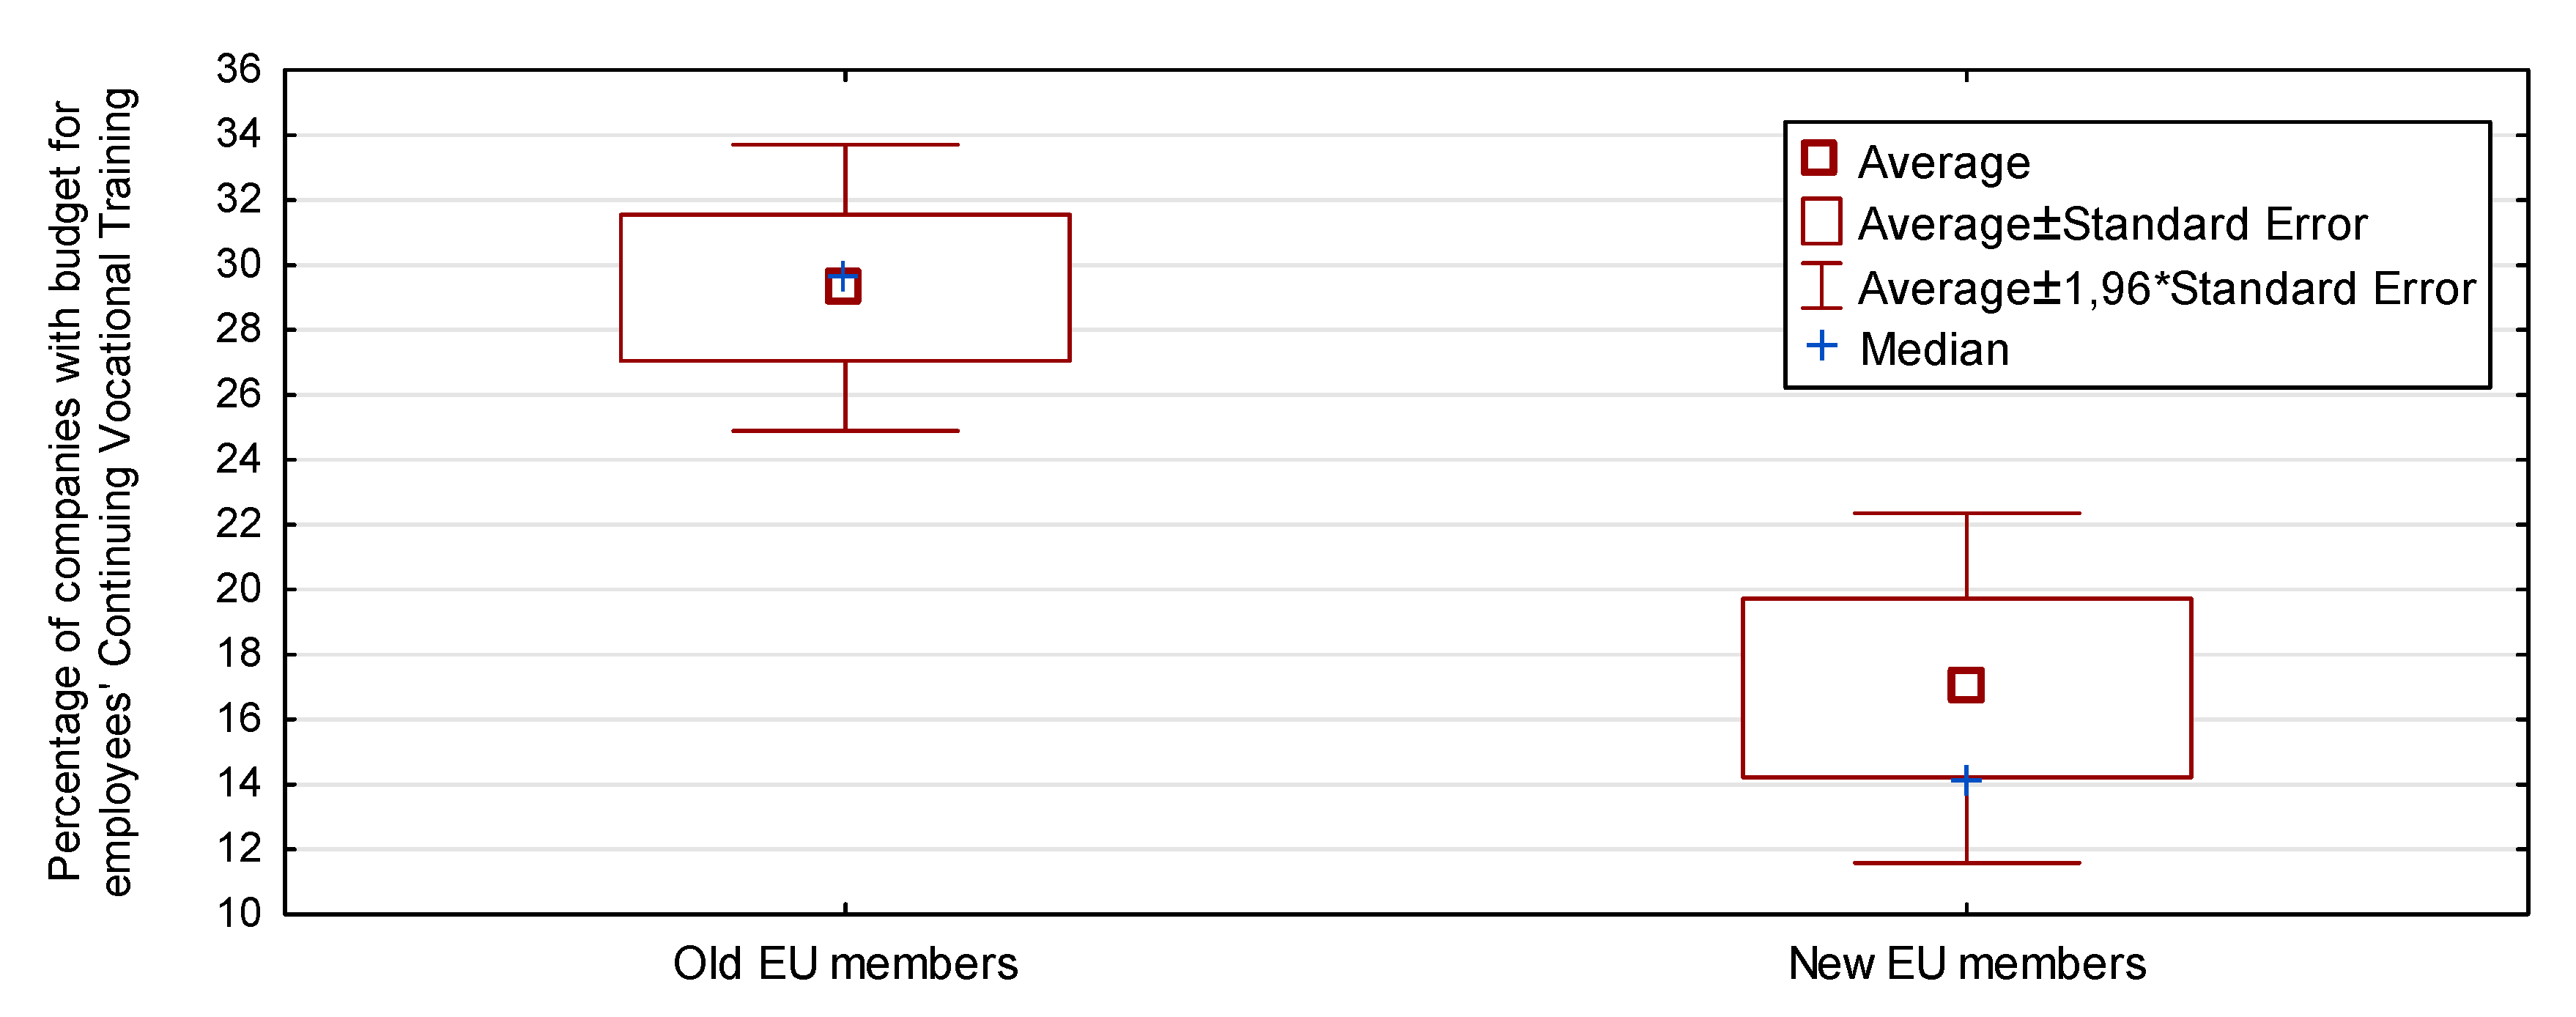
  • The best situation in terms of administering budget for vocational training in companies has been noted among the companies located in Spain, France and the Czech Republic. The lowest percentage of economic operators declaring to have a special budget for CVT of their employees has been noted in Romania, Bulgaria, Latvia and Poland. Considering the division of countries in terms of seniority in the EU, this aspect has been clearly dominated by the “old” Member States in which company owners actively operate for the benefit of CVT and significantly outpace the representatives of companies from the “new” EU Member States. The fact of employers becoming engaged in activity of this type for the benefit of employees is largely not appreciated among the younger Member States.
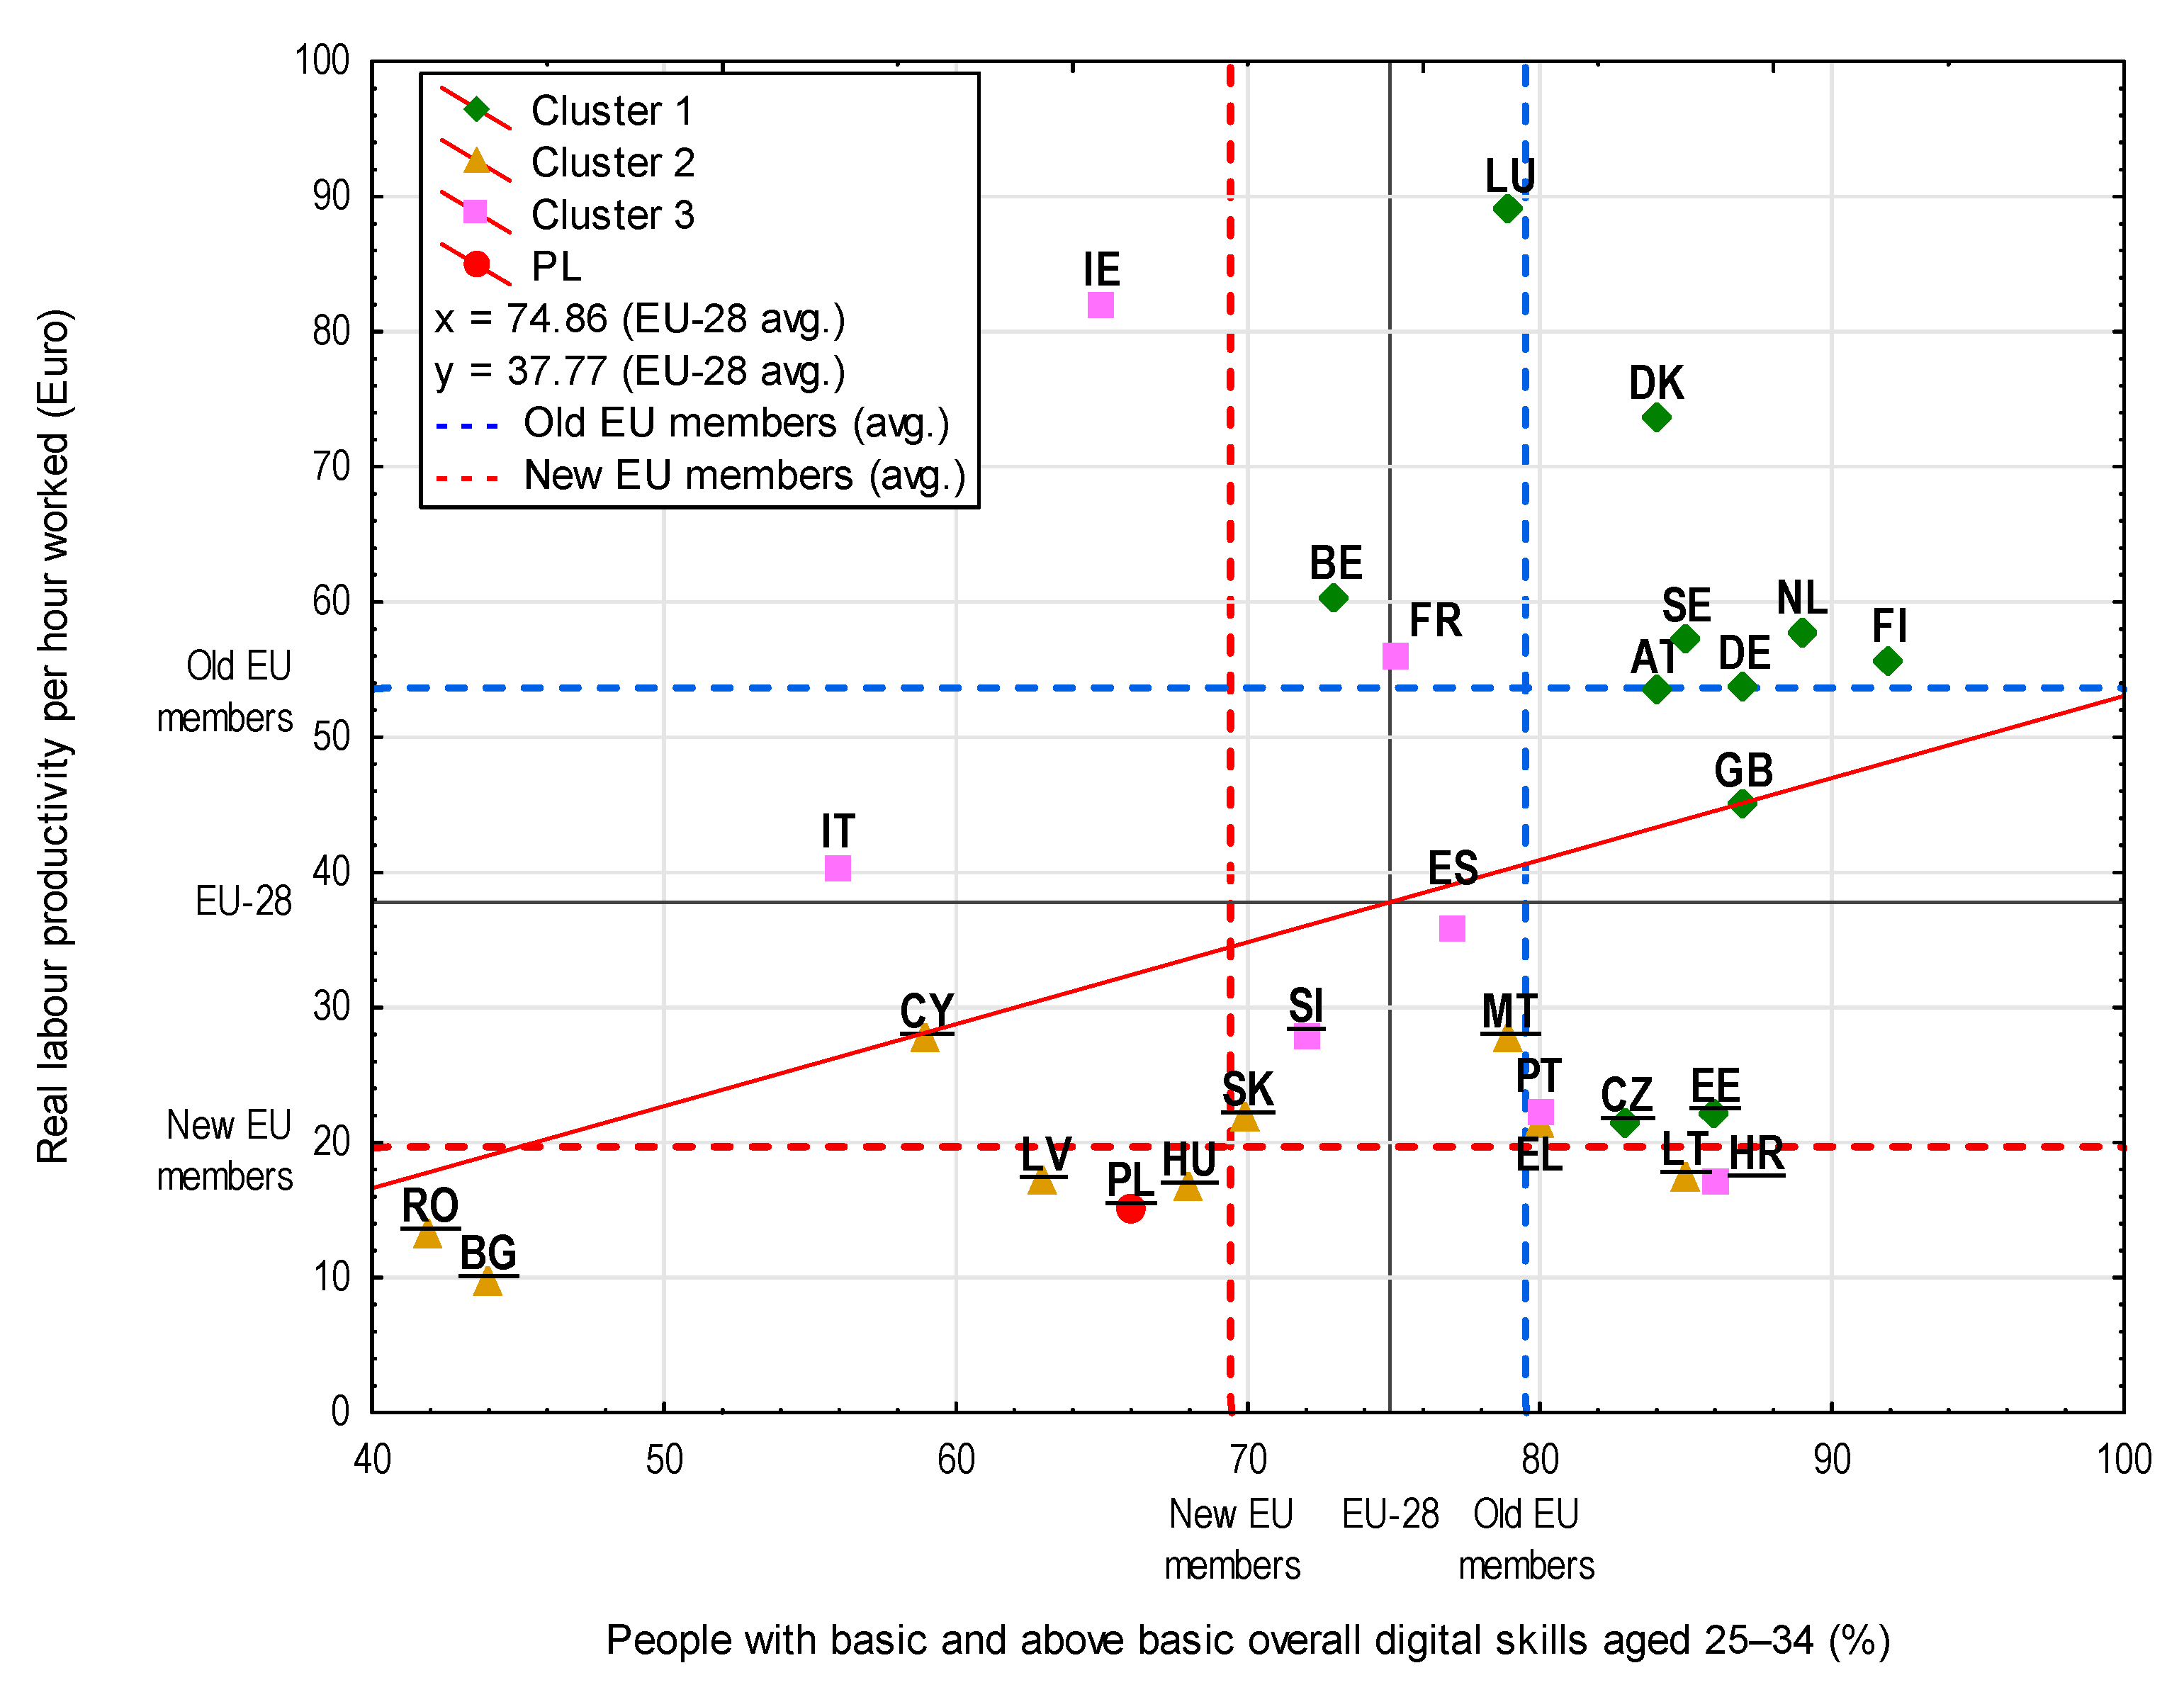
  • Across the entirety of the EU, three out of four employees aged 25–34 (75%) on average, can declare to possess basic or advanced digital literacy skills. Workers from this age group will be to, the largest degree, participants of the constant changes in the labour market, and to meet this challenge, they will be forced to display a high level of digital literacy skills.
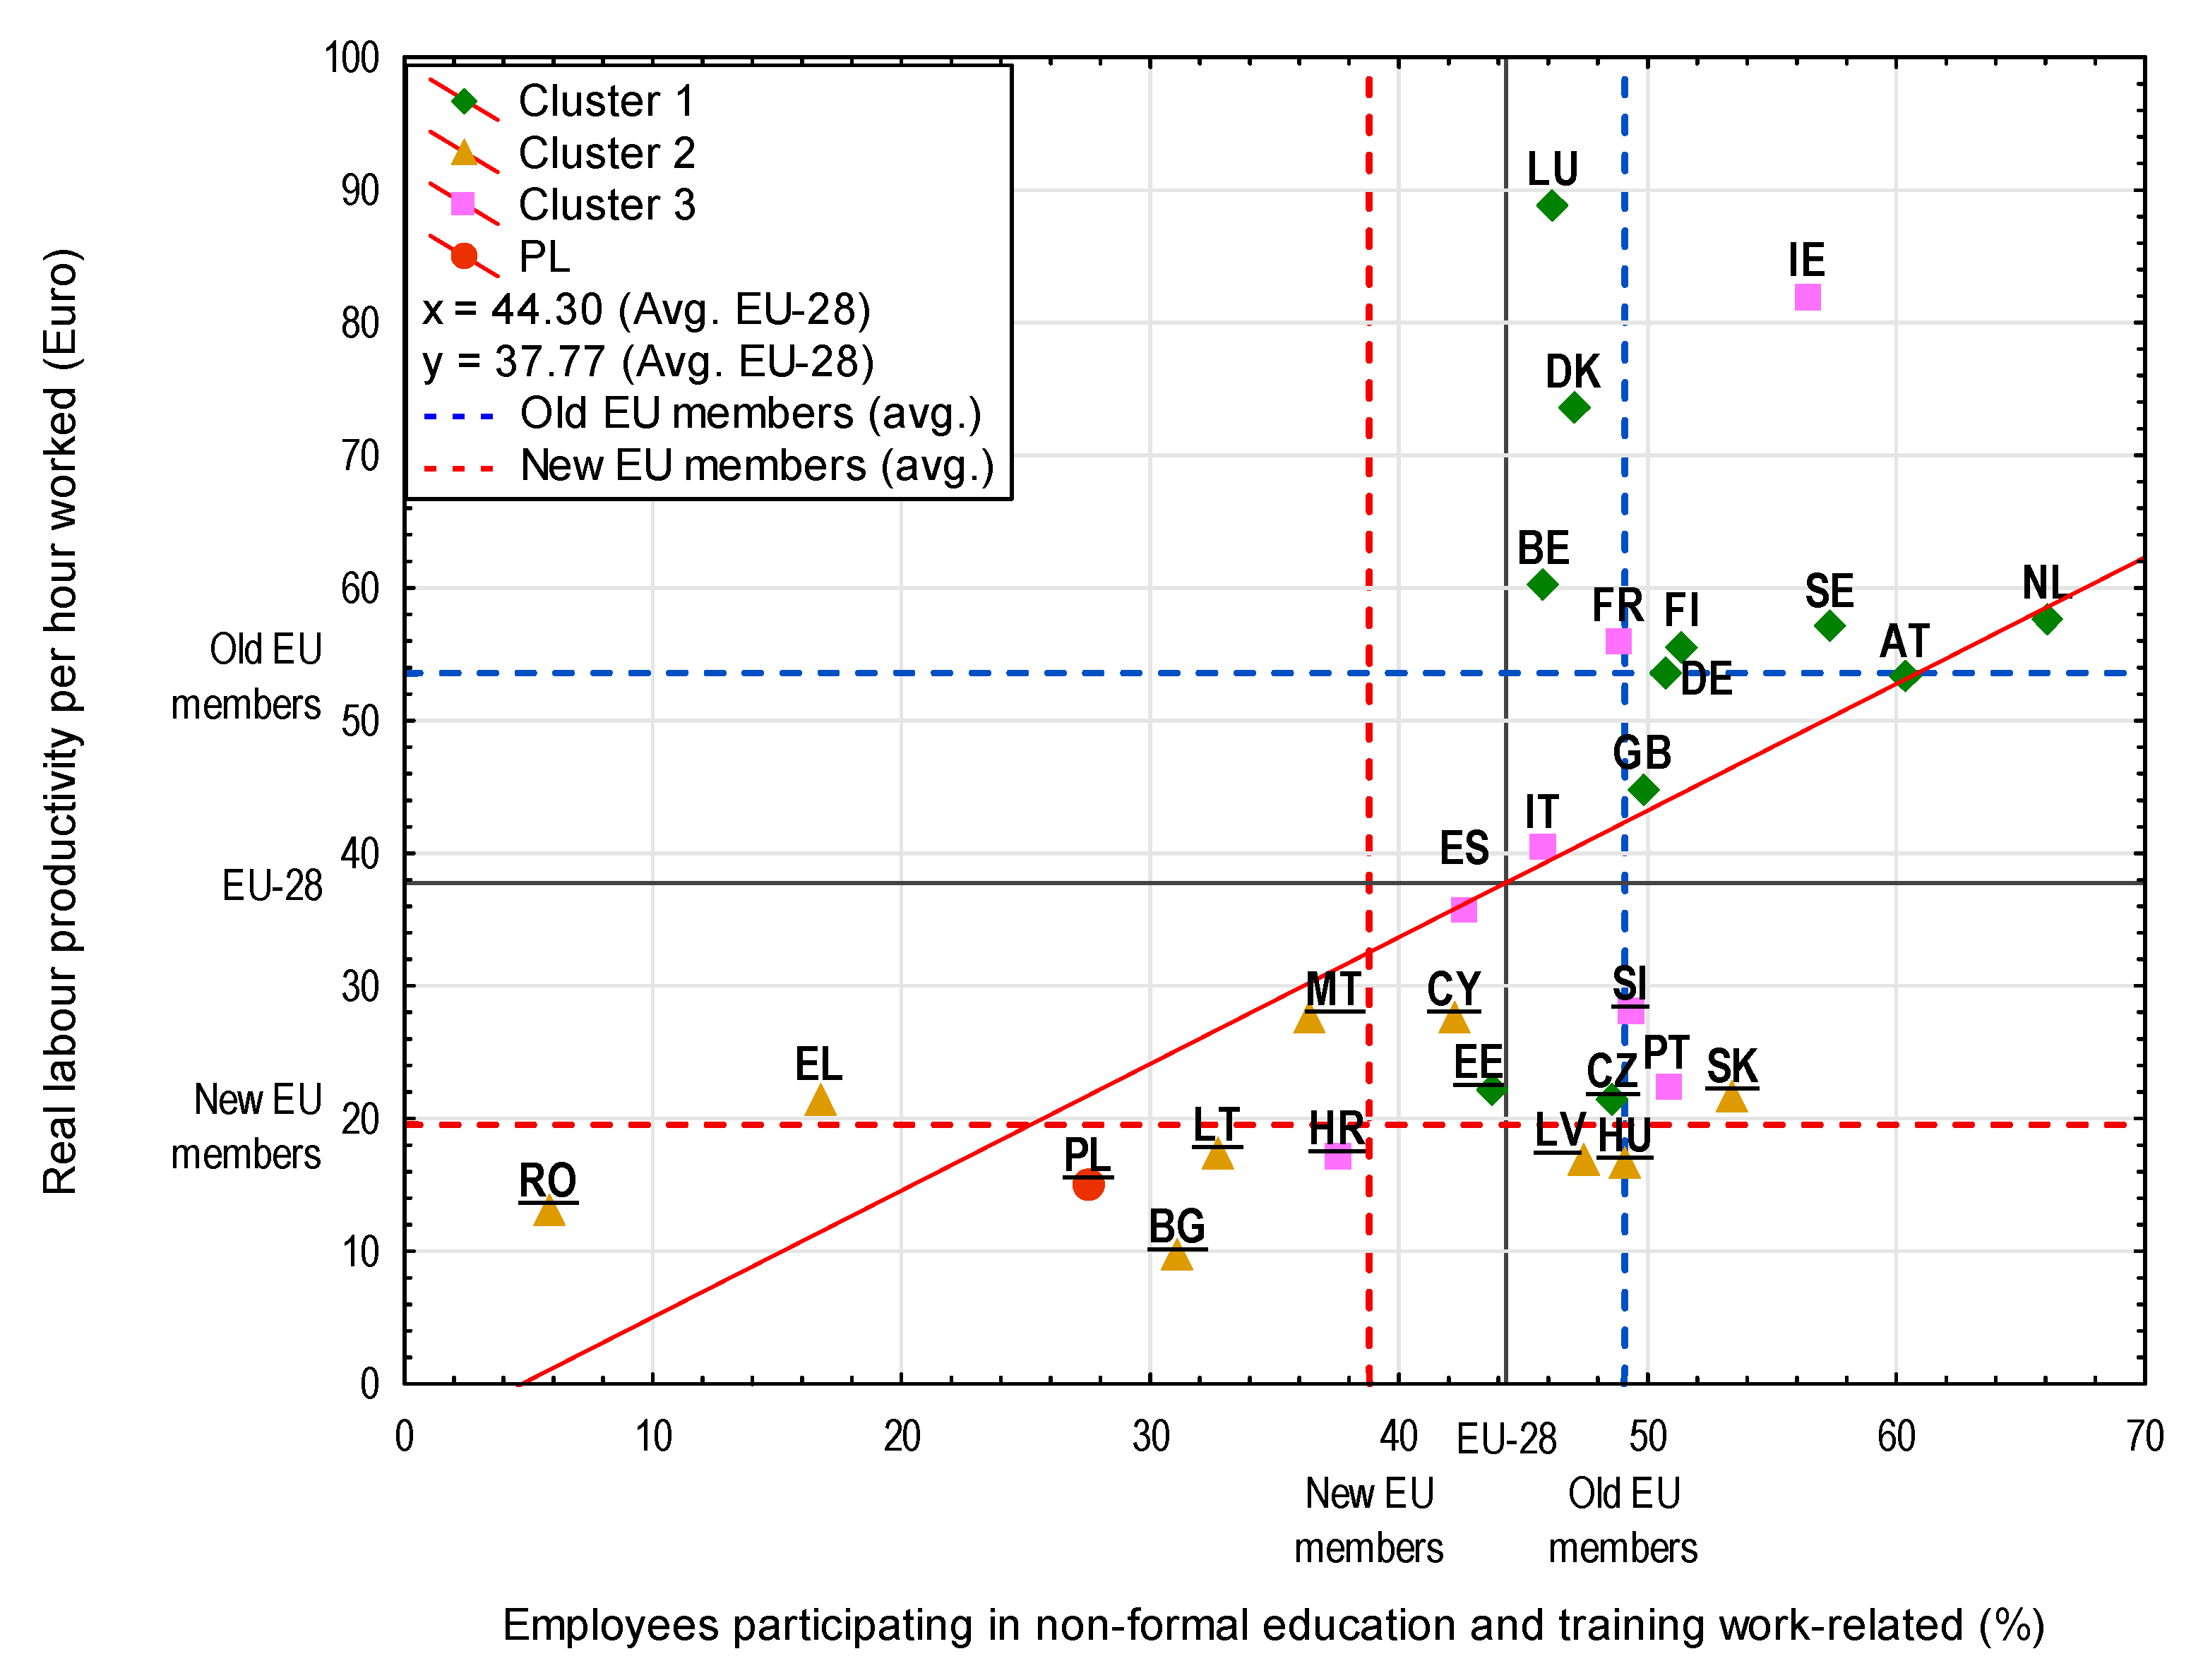
  • The results of the correlation of employee participation in non-formal work-related education combined with labour productivity in the “old” EU Member States are clearly higher than in countries that joined the community in 2004 or later. The statistical significance of diversification of the average values between these two clusters of the Member States, dependent on the seniority in the EU, has been confirmed.
  • It cannot be unequivocally stated that belonging to the Eurozone has any influence on one group of countries faring better than the other. However, it can be produced that the members of the so called “old Union” which are primarily grouped in the first cluster display better values of the researched variables. It means that nearly 70 years since the establishment of the European Coal and Steel Community, the ideas of its founders advocating equal development in Europe require stronger emphasis on providing aid to those Member States which are coping with problems concerning development and that these problems touch not only the “new” Member States. These problems are plaguing even Greece, which still has problems with returning to levels from before 2009, i.e., the two crises Greece had to deal with (the financial crisis of 2008 and the Eurozone crisis of 2011).
The necessity to adapt employees’ skills to requirements of the changing economy, particularly in the context of technological revolution, requires paying particular attention to the aspect of continuing training offered by employers in the workplace as well as the capacity and willingness for upskilling displayed by the very employees.
The effects of the actions taken in the areas of developing the STEM skills and developing digital literacy skills as well as the expenditures for Research and Development will become visible in the future, in the areas of increased work productivity and innovations in the field of economy. For this reason, governments of the “new” Member States should significantly increase the expenditures in these areas and take the actions directed at improving conditions. We have to remember that the appropriately implemented reforms and expenditures in the areas of education and Research and Development will always result in the added value. Despite the fact that the results may emerge with a delay, the effects will always be positive and beneficial. The results of the actions taken should be a vision of the long-term and sustainable economic development, particularly important in the context of coping with the economic collapse resulting from the COVID-19 pandemic in the turn of 2019 and 2020.
The participation of employers in Continuing Vocational Training of their employees should always be perceived by employers as an investment in human capital, resulting in increased work productivity and never as an additional expense. Furthermore, entrepreneurs should emphasise the recognition of needs and opportunities for development of their employees of all ages more strongly. The process of professional development should cover all generations of workers, but for the younger generation, the opportunity for development and participation in learning and education is particularly important in the process of selecting a future workplace.
This issue should also be considered from the perspective of entrepreneurs/employers. They are concerned that investing in development and education of an employee will be unprofitable if an employee is not loyal and is prone to becoming bored with and changing his job when he will notice that the expected results of his development are not occurring as quickly as he expected.

Funding

The article came into being within a research project which has been financed by the Ministry of Science and Higher Education of the Republic of Poland within “Regional Initiative of Excellence” Programme for 2019–2022 conducted by the Cracow University of Economics (Project No: 021/RID/2018/19).

Acknowledgments

Thank you to three anonymous reviewers for their suggestions and comments that contributed to improving the final version of the research paper.

Conflicts of Interest

The author declares no conflict of interest.

Appendix A

Table A1. The values of the researched variables for the EU Member States.
CountryNo. of ClusterEU Members
OLD = 1
NEW = 2
Euro-Zone
Yes = 1
No = 2
Work Producti-vity Per HourEmployment RatePercentage of Individuals Employed for Fixed PeriodCompanies with Budget for Employees’ Continuing Vocational TrainingExpenditures for R&D in HE as a % of GDPCompanies Using Electronic Management SystemsIndividuals Possessing Digital SkillsGraduates of HEIs in the STEM FieldsEmployees Participating in Informal Education and Work-Related TrainingPrecarious Employment for a Period of Up to 3 Months
Unit of Measurement---Euro%%%%%%No. of Individuals Per 1000 People%%
Austria11153.376.26.832.20.71438422.060.40.8
Belgium11160.369.78.535.90.54537313.645.83.5
Czech Republic1229.779.97.942.20.41388316.848.60.3
Denmark11217.177.58.825.20.98508422.647.01.0
Estonia12127.679.53.021.30.63268616.543.71.2
Finland11121.476.315.130.30.69439222.451.43.5
Germany11173.679.910.819.20.56298720.450.70.3
Luxembourg11122.172.19.632.90.2541793.846.21.4
Netherlands11155.679.217.729.60.59488912.066.10.8
Sweden11256.082.414.027.90.84378515.057.32.7
United Kingdom11253.678.74.332.30.38248723.649.80.3
Bulgaria22257.772.43.78.50.04234414.331.10.6
Cyprus22115.173.913.720.10.23335910.142.20.5
Greece21122.359.511.211.50.33388017.916.71.3
Hungary22213.274.47.110.00.19146812.149.11.9
Latvia22121.876.82.78.60.34326312.747.41.1
Lithuania22128.077.81.410.00.34488518.932.70.7
Malta22135.875.57.525.80.22327913.836.40.4
Romania22257.169.91.18.50.05234215.15.80.2
Slovakia22144.972.47.820.60.20317014.753.41.3
Croatia32221.465.219.314.10.31268618.537.56.5
France31116.671.315.440.20.45487526.048.84.7
Ireland31182.074.18.627.70.24286532.756.41.2
Italy31140.463.016.819.90.33355614.545.83.7
Poland32217.072.223.98.50.38296623.627.53.6
Portugal31117.475.421.527.10.56428020.650.82.6
Slovenia32188.975.414.822.40.23337219.449.33.7
Spain31127.667.025.947.60.33437721.942.64.2
UE-28 (avg.)---37.873.811.023.60.41357517.744.31.9
Old-15 (avg.)---53.573.513.029.30.52407919.349.12.1
New-13 (avg.)---19.674.38.816.90.27306915.938.81.7
Old-15 = “old” EU Member States, New-13 = “new” EU Member States. Source: Eurostat (accessed on 10 March 2020).

References

  1. Kagermann, H. Chancen von Industrie 4.0 nutzen. In Industrie 4.0 in Produktion, Automatisierung und Logistik; Bauernhansl, T., ten Hompel, M., Vogel-Heuser, B., Eds.; Springer Vieweg: Wiesbaden, Germany, 2014; pp. 603–614. [Google Scholar]
  2. Dean, M.; Spoehr, J. The fourth industrial revolution and the future of manufacturing work in Australia: Challenges and opportunities. Labour Ind. J. Soc. Econ. Relat. Work 2018, 28, 166–181. [Google Scholar] [CrossRef]
  3. Bercovici, E.G.; Bercovici, A. Israeli labor market and the Fourth Industrial Revolution. Amfiteatru Econ. 2019, 21, 884–895. [Google Scholar] [CrossRef]
  4. Whysall, Z.; Owtram, M.; Brittain, S. The new talent management challenges of Industry 4.0. J. Manag. Dev. 2019, 38, 118–129. [Google Scholar] [CrossRef] [Green Version]
  5. Piwowar-Sulej, K. Human resource management in the context of Industry 4.0. Organ. Manag. Sci. Q. 2020, 1, 103–113. [Google Scholar]
  6. Da Silva, V.L.; Kovaleski, J.L.; Pagani, R.N.; Silva, J.D.M.; Corsi, A. Implementation of Industry 4.0 concept in companies: Empirical evidences. Int. J. Comput. Integr. Manuf. 2020, 33, 325–342. [Google Scholar] [CrossRef]
  7. Zhou, K.; Liu, T.; Zhou, L. Industry 4.0: Towards future industrial opportunities and challenges. In Proceedings of the 2015 12th International Conference on Fuzzy Systems and Knowledge Discovery (FSKD), Zhangjiajie, China, 10 February 2015; pp. 2147–2152. [Google Scholar] [CrossRef]
  8. Ślusarczyk, B. Selected results of introducing the Industry 4.0 concept in enterprises. Organ. Rev. 2019, 1, 4–10. [Google Scholar]
  9. Rao, S.K.; Prasad, R. Impact of 5G technologies on smart city implementation. Wirel. Pers. Commun. 2018, 100, 161–176. [Google Scholar] [CrossRef]
  10. Niedbał, R.; Wrzalik, A.; Sokołowski, A. Fourth Industrial revolution as a challenge to maintain enterprise competitiveness. J. Mark. Mark. Stud. 2017, 7, 557–570. [Google Scholar]
  11. Piątkowski, M.J. The role of IT management systems in enterprise development and building a competitive position (Rola informatycznych systemów do zarządzania w rozwoju przedsiębiorstwa i budowaniu pozycji konkurencyjnej). In Problems of Increasing the Competitiveness of Enterprises (Problemy Wzrostu Konkurencyjności Przedsiębiorstw); Zieliński, K., Ed.; PWN: Warszawa, Poland, 2015; pp. 79–86. [Google Scholar]
  12. Gracel, J.; Makowiec, M. Core competencies of managers in the fourth industrial revolution (Industry 4.0). Acta Univ. Nicolai Copernici Zarządzanie 2017, 44, 105–129. [Google Scholar] [CrossRef] [Green Version]
  13. Olender-Skorek, M. The fourth industrial revolution and some economic theories. Soc. Inequal. Econ. Growth 2017, 51, 38–49. [Google Scholar]
  14. Pereira, A.C.; Romero, F. A review of the meanings and the implications of the Industry 4.0 concept. Procedia Manuf. 2017, 13, 1206–1214. [Google Scholar] [CrossRef]
  15. Bagieńska, A. Measurement and analysis of the efficiency of human capital in a small enterprise in Poland. Financ. Internet Q. 2015, 11, 1–9. [Google Scholar] [CrossRef] [Green Version]
  16. Firlej, K.A. Objectives and directions of employment restructuring in the company. J. Manag. Financ. 2013, 1, 195–208. [Google Scholar]
  17. Kurz, C. Industrie 4.0 verändert die arbeitswelt. gewerkschaftliche gestaltungsimpulse für “bessere” arbeit. In Identität in der Virtualität. Einblicke in Neue Arbeitswelten und “Industrie 4.0”; Schröter, W., Ed.; Talheimer Verlag: Mössingen, Germany, 2014; pp. 106–111. [Google Scholar]
  18. Windelband, L. Zukunft der facharbeit im zeitalter: Industrie 4.0. J. Tech. Educ. 2014, 2, 138–160. [Google Scholar]
  19. Bendkowski, J. The impact of industry 4.0 on production work. Sci. Pap. Sil. Univ. Technol. Organ. Manag. Ser. 2017, 112, 21–33. [Google Scholar] [CrossRef]
  20. Arntz, M.; Gregory, T.; Zierahn, U. The risk of automation for jobs in OECD countries: A comparative analysis. OECD Soc. Employ. Migr. Work. Pap. 2016, 189, 1–34. [Google Scholar]
  21. Rüßmann, M.; Lorenz, M.; Gerbert, P.; Waldner, M.; Justus, J.; Engel, P.; Harnisch, M. Industry 4.0: The future of productivity and growth in manufacturing industries. Boston Consult. Group 2015, 9, 54–89. [Google Scholar]
  22. Hirsch-Kreinsen, H. Wandel von Produktionsarbeit—Industrie 4.0; Technische Universität Dortmund: Dortmund, Germany, 2014; Volume 38. [Google Scholar]
  23. Hawksworth, J.; Berriman, R.; Cameron, E. Will Robots Really Steal our Jobs? An International Analysis of the Potential Long Term Impact of Automation; PricewaterhouseCoopers: London, UK, 2018. [Google Scholar]
  24. Ganschar, O.; Gerlach, S.; Hämmerle, M.; Krause, T.; Schlund, S. Produktionsarbeit der Zukunft—Industrie 4.0; Spath, D., Ed.; Fraunhofer Verlag IAO: Stuttgart, Germany, 2013. [Google Scholar]
  25. Frey, C.B.; Osborne, M.A. The future of employment: How susceptible are jobs to computerisation? Technol. Forecast. Soc. Chang. 2017, 114, 254–280. [Google Scholar] [CrossRef]
  26. Jagannathan, S.; Ra, S.; Maclean, R. Dominant recent trends impacting on jobs and labor markets—An Overview. Int. J. Train. Res. 2019, 17, 1–11. [Google Scholar] [CrossRef] [Green Version]
  27. Pietrulewicz, B.; Łosyk, H. Social and education problems at the working space in the fourth-generation industry context. Probl. Prof. 2018, 2, 69–77. [Google Scholar]
  28. Kergroach, S. Industry 4.0: New challenges and opportunities for the labour market. Foresight STI Gov. 2017, 11, 6–8. [Google Scholar] [CrossRef]
  29. Infuture Hatalska Foresight Institute. Employee of the Future; Infuture Hatalska Foresight Institute: Gdańsk, Poland, 2019. [Google Scholar]
  30. Vuorikari, R.; Punie, Y.; Gomez, S.C.; Van Den Brande, G. DigComp 2.0: The Digital Competence Framework for Citizens. Update Phase 1: The Conceptual Reference Model; Joint Research Centre: Luxembourg, 2016. [Google Scholar]
  31. Annunziata, M.; Bourgeois, H. The future of work: How G20 countries can leverage digital-industrial innovations into stronger high-quality jobs growth. Econ. Open Access Open Assess. E J. 2018, 12, 1–23. [Google Scholar] [CrossRef] [Green Version]
  32. Ministry of Technology and Entrepreneurship/Simens. Smart Industry Poland 2019. Engineers in the Era of the Fourth Industrial Revolution. Research Report; Ministry of Technology and Entrepreneurship/Simens: Warszawa, Poland, 2019. [Google Scholar]
  33. Chovancova, B.; Dorocakova, M.; Malacka, V. Changes in industrial structure of GDP and stock indices also with regard to the Industry 4.0. Bus. Econ. Horiz. 2018, 14, 402–414. [Google Scholar] [CrossRef] [Green Version]
  34. World Economic Forum. The Future of Jobs. Employment, Skills and Workforce Strategy for the Fourth Industrial Revolution; OECD Employment Outlook; World Economic Forum: Geneva, Switzerland, 2016. [Google Scholar]
  35. Wolter, M.I.; Mönnig, A.; Hummel, M.; Schneemann, C.; Weber, E.; Zika, G.; Helmrich, R.; Maier, T.; Neuber-Pohl, C. Industry 4.0 and the Consequences for Labour Market and Economy. Scenario Calculations in Line with the BIBB-IAB Qualifications and Occupational Field Projections; Institute for Employment Research: Nuremberg, Germany, 2015. [Google Scholar]
  36. Bughin, J.; Hazan, E.; Lund, S.; Dahlström, P.; Wiesinger, A.; Subramaniam, A. Skill Shift: Automation and the Future of the Workforce; McKinsey Global Institute: Brussels, Belgium, 2018. [Google Scholar]
  37. Noonan, R. STEM Jobs: 2017 Update; US Department of Commerce: Washington, WA, USA, 2017.
  38. Dolot, A. The characteristics of Generation Z. E Mentor 2018, 2, 44–50. [Google Scholar] [CrossRef]
  39. Burksaitiene, D.; Jegelavičiūtė, R.; Grenčíková, A.; Krajčo, K.; Sokol, J. Economic indicators paradigm on the labour market in Lithuania and Slovakia. Eng. Econ. 2019, 30, 612–620. [Google Scholar] [CrossRef]
  40. Martínez-Morales, I.; Marhuenda-Fluixá, F. Vocational education and training in Spain: Steady improvement and increasing value. J. Vocat. Educ. Train. 2020. [Google Scholar] [CrossRef]
  41. Weber, E. Industry 4.0: Job-Producer or Employment-Destroyer? Aktuelle Berichte: Nuremberg, Germany, 2016. [Google Scholar]
  42. Kenney, M.; Zysman, J. The rise of the platform economy. Issues Sci. Technol. 2016, 32, 61–69. [Google Scholar]
  43. Manyika, J.; Lund, S.; Robinson, K.; Valentino, J.; Dobbs, R. A Labor Market That Works: Connecting Talent with Opportunity in the Digital Age; McKinsey Global Institute: San Francisco, CA, USA, 2015. [Google Scholar]
  44. Bombiak, E. Flexibility and stabilization—Employment policy dilemmas in contemporary organizations. J. Mark. Mark. Stud. 2016, 3, 50–59. [Google Scholar]
  45. Piątkowski, M.J. Flexible forms of employment in achieving the objectives of the company. Manag. Financ. Mark. Probl. 2011, 22, 127–134. [Google Scholar]
  46. Baron-Puda, M. The paradigm of functional flexibility in personnel policy of a company with unit production. Enterp. Manag. 2019, 22, 2–10. [Google Scholar]
  47. Piórkowska-Wojciechowska, K. The employment flexibility in the context of employee loyalty creation. Res. Pap. Wrocław Univ. Econ. 2006, 1141, 265–271. [Google Scholar]
  48. Górska, J. Alternative forms of employment—Possibilities and limitations. Res. Pap. Pozn. Univ. Econ. 2001, 6, 169–181. [Google Scholar]
  49. Piątkowski, M.J. The importance of employment forms in the functioning of the enterprises. Econ. Probl. Serv. 2011, 73, 431–442. [Google Scholar]
  50. Brzeziński, A. Flexible forms of employment and their frequency range. Res. Rev. Czest. Univ. Technol. Manag. 2017, 28, 194–207. [Google Scholar] [CrossRef]
  51. Guzikowski, M. Advisability of implementing flexicurity in Poland. Optim. Econ. Stud. 2016, 1, 135–148. [Google Scholar] [CrossRef] [Green Version]
  52. OECD. Going Digital: The Future of Work for Women. Policy Brief on The Future of Work; OECD: Paris, France, 2017. [Google Scholar]
  53. Ćwiek, M. Digital divide in Poland and in the European Union. Econ. Probl. Serv. 2018, 2, 217–224. [Google Scholar] [CrossRef]
  54. Prieto, J.S.; Torres, J.M.T.; García, M.G.; García, G.G. Gender and digital teaching competence in dual vocational education and training. Educ. Sci. 2020, 10, 1–12. [Google Scholar]
  55. European Commission. Towards Common Principles of Flexicurity: More and Better Jobs through Flexibility and Security; Office for Official Publications of the European Communities: Luxembourg, 2007. [Google Scholar]
  56. Auer, P.; Chatani, K. Flexicurity: Still going strong or a victim of crisis? In Research Handbook on the Future of Work and Employment Relations; Townsend, K., Wilkinson, A., Eds.; Edward Elgar Publishing: Northampton, UK, 2011; pp. 253–278. [Google Scholar]
  57. Ciuca, V.; Pasnicu, D.; Son, L.; Sipos, C.; Iordan, M. The Romanian flexicurity—A response to the European labour market needs. Rom. J. Econ. Forecast. 2009, 10, 161–183. [Google Scholar]
  58. Laporšek, S.; Dolenc, P. The analysis of flexicurity in the EU members states. Transylv. Rev. Adm. Sci. 2011, 7, 125–145. [Google Scholar]
  59. Storey, J.; Quintas, P.; Taylor, P.; Fowle, W. Flexible employment contracts and their implications for product and process innovation. Int. J. Hum. Resour. Manag. 2002, 13, 1–18. [Google Scholar] [CrossRef]
  60. European Commission. Regional Innovation Scoreboard 2019; Office for Official Publications of the European Communities: Luxembourg, 2019. [Google Scholar]
  61. UNDP. Human Development Report 2019; UNDP: New York, NY, USA, 2019. [Google Scholar]
  62. IMD. IMD World Digital Competitiveness Ranking 2019; IMD: Lausanne, Switzerland, 2019. [Google Scholar]
  63. Cedefop. Skills Supply and Demand in Europe; Cedefop: Luxembourg, 2010. [Google Scholar]
  64. UNESCO. 4th Global Report on Adult Learning and Education (GRALE); UNESCO: Hamburg, Germany, 2019. [Google Scholar]
  65. Cedefop. Vocational Education and Training in Europe, 1995–2035: Scenarios for European Vocational Education and Training in the 21st Century; Cedefop: Luxembourg, 2020. [Google Scholar]
  66. Steczkowski, J. A Representative Method in the Study of Economic and Social Phenomena. (Metoda Reprezentacyjna w Badaniach Zjawisk Ekonomiczno-Społecznych); Wydawnictwo Naukowe PWN: Warszawa, Poland, 1995. [Google Scholar]
  67. Serafin, R.; Luściński, S. Normalization of delivery assessment criteria in supply systems (Normalizacja kryteriów oceny dostaw w systemach zaopatrzenia). In Innovations in Production Management and Production Engineering (Innowacje w Zarządzaniu i Inżynierii Produkcji); Knosala, R., Ed.; Oficyna Wydawnicza PTZP: Opole, Poland, 2016; pp. 1010–1021. [Google Scholar]
  68. Zeliaś, A. (Ed.) Taxonomic Analysis of Spatial Diversity of Living Standards in Poland in a Dynamic Approach (Taksonomiczna Analiza Przestrzennego Zróżnicowania Poziomu Życia w Polsce w Ujęciu Dynamicznym); Wyd. Akademii Ekonomicznej: Kraków, Poland, 2000. [Google Scholar]
  69. Ward, J.H., Jr. Hierarchical grouping to optimize an objective function. J. Am. Stat. Assoc. 1963, 58, 236–244. [Google Scholar] [CrossRef]
  70. Zivadinovic, N.K.; Dumicic, K.; Casni, A.C. Cluster and factor analysis of structural economic indicators for selected European countries. WSEAS Trans. Bus. Econ. 2009, 6, 331–341. [Google Scholar]
  71. Yim, O.; Ramdeen, K.T. Hierarchical cluster analysis: Comparison of three linkage measures and application to psychological data. Quant. Methods Psychol. 2015, 11, 8–21. [Google Scholar] [CrossRef]
  72. European Commission. Europe 2020: The European Union Strategy for Growth and Employment; Office for Official Publications of the European Communities: Brussels, Belgium, 2010. [Google Scholar]
  73. Handy, C. Understanding Organizations; Oxford University Press: New York, NY, USA, 1993. [Google Scholar]
  74. Atkinson, J. Manpower strategies for flexible organisations. Pers. Manag. 1984, 8, 28–31. [Google Scholar]
  75. Taylor, S. Employment Variability. How to Keep Employees in the Company. (Płynność Zatrudnienia. Jak Zatrzymać Pracowników w Firmie); Wolters Kluwer: Kraków, Poland, 2006. [Google Scholar]
  76. Król, M. Employment forms diversification and the social inequality. Soc. Inequal. Econ. Growth 2015, 2, 367–377. [Google Scholar]
  77. Czaja, I.; Urbaniec, M. Digital exclusion in the labour market in European countries: Causes and consequences. Eur. J. Sustain. Dev. 2019, 8, 324–336. [Google Scholar] [CrossRef]
  78. Pagani, L.; Argentin, G.; Gui, M.; Stanca, L. The impact of digital skills on educational outcomes: Evidence from performance tests. Educ. Stud. 2016, 42, 137–162. [Google Scholar] [CrossRef] [Green Version]
  79. European Commission. DESI 2019—Human Capital—Digital Inclusion and Skills; Office for Official Publications of the European Communities: Brussels, Belgium, 2019. [Google Scholar]
Figure 1. Defining clusters through Ward’s agglomeration method (a) Heat map; (b) Dendrogram. Source: Own study based on research.
Sustainability 12 05437 g001
Figure 2. The average productivity per hour values for the “old” and “new” EU Member States. Source: Own study based on research.
Sustainability 12 05437 g002
Figure 3. The average values for the share of individuals employed for a fixed term aged 20–64 in the EU Member States grouped in clusters defined by means of Ward’s agglomeration method. Source: Own study based on research.
Sustainability 12 05437 g003
Figure 4. Scatter graph and the analysis of correlation between the percentile share of companies with budget allocated towards the CVT and work productivity per hour for the EU Member States. Source: Own study based on research.
Sustainability 12 05437 g004
Figure 5. The average percentage of companies with budget allocated towards CVT in the “old” and the “new” Member States of the EU. Source: Own study based on research.
Sustainability 12 05437 g005
Figure 6. The scatter graph and the analysis of correlation for the EU Member States between the percentage of employees participating in informal education related with the performed work and work productivity per hour. Source: Own study based on research.
Sustainability 12 05437 g006
Figure 7. The average expenditures on the R&D in higher education among the “old” and “new” Member States of the EU. Source: Own study based on research.
Sustainability 12 05437 g007
Figure 8. The scatter graph and the analysis of correlation for the EU Member States between the percentage of populace aged 25–34 possessing basic or advanced digital literacy skills and work productivity per hour. Source: Own study based on research.
Sustainability 12 05437 g008
Table 1. Description of the variables utilised in the agglomeration method.
No. of a VariableName of a VariableDescription of a Variable and a Measuring UnitSource of DataReference Year
1Work productivity per hourWork productivity calculated as GDP in current prices in euro for a given year divided by the number of work hours (euro).Eurostat:
PORDATA
2018
2Employment rateThe number of employed individuals aged 20–64 in population (%).Eurostat:
[lfsi_emp_a]
2018
3Individuals employed under fixed-term contractsThe percentage of working individuals aged 20–64 working under fixed-term employment contract (%).Eurostat:
[lfsa_esegt]
2018
4Companies with budget for employees’ Continuing Vocational TrainingThe percentage of companies employing more than 10 individuals with budget for CVT—educational or training activities completely or partially financed by a company. Partial financing may cover devoting working time to training as well as financing training equipment (%).Eurostat:
[trng_cvt_07s]
2015
5Expenditures for R&D in higher educationExpenditures for R&D in higher education as % of GDP (%).Eurostat:
[rd_e_gerdtot]
2018
6Companies utilising electronic management systemsThe percentage of companies employing more than 10 individuals which use ERP systems for electronic management of various aspects of the company (%).Eurostat:
[isoc_eb_iip]
2019
7Individuals possessing digital skillsThe percentage of individuals aged 25–34 possessing basic or advanced digital skills (%).Eurostat:
[educ_uoe_grad04]
2019
8Graduates of HEIs in the STEM fieldsThe number of graduates of HEIs aged 20–29 graduating in the fields of science, math, IT, engineering, manufacturing, construction per 1000 individuals (number of individuals).Eurostat:
[educ_uoe_grad04]
2017
9Employees participating in informal education and work-related trainingThe percentage of employees aged 25–64 participating in informal institutionalized forms of education related with work and covering: courses, workshops, workplace training courses—tutelage, private lessons (%).Eurostat:
[trng_aes_124]
2016
10Precarious employment for a period of up to 3 monthsThe percentage of employees aged 20–64 employed under short term agreement for a period of up to 3 months (%).Eurostat:
[lfsa_qoe_4ax1r2]
2018
Source: Own study based on Eurostat.
Table 2. The descriptive statistics of the researched characteristics in relation to the various methods of the cluster analysis.
VariableNo. of the ClusterAverageCIMedianMinMaxLQ (Q1)UQ (Q3)SD
−95%+95%
(1) Work productivity per hour153.5040.3566.6555.6021.4088.9044.9060.3019.57
219.1414.4923.8017.409.7027.6016.6021.806.06
337.0918.2055.9731.9015.1082.0019.7048.2022.59
EU-2837.7729.0846.4527.809.7088.9019.4055.8022.40
Old-1553.5342.9464.1255.6021.4088.9040.4060.3019.12
New-1319.5816.1023.0717.409.7028.0016.6022.105.77
(2) Employment rate177.4074.9179.8978.7069.7082.4076.2079.903.70
272.5168.3376.6973.9059.5077.8072.4075.505.44
370.4566.4474.4671.7563.0075.4066.1074.754.80
EU-2873.8471.7675.9374.9059.5082.4071.7077.655.38
Old-1573.4969.9177.0675.4059.5082.4069.7078.706.46
New-1374.2571.8376.6874.4065.2079.9072.4076.804.02
(3) Percentage of individuals employed for fixed period19.686.6712.698.803.0017.706.8014.004.48
26.242.879.627.101.1013.702.707.804.39
318.2813.6222.9318.058.6025.9015.1022.705.57
EU-2811.038.4313.649.201.1025.906.9515.256.72
Old-1513.009.7716.2311.204.3025.908.6016.805.84
New-138.764.4313.097.501.1023.903.0013.707.16
(4) Companies with budget for employees’ Continuing Vocational Training129.9125.5434.2730.3019.2042.2025.2032.906.50
213.738.6718.8010.008.5025.808.6020.106.59
325.9415.1336.7524.758.5047.6017.0033.9512.93
EU-2823.5819.2927.8623.808.5047.6012.8031.2511.05
Old-1529.3024.4834.1229.6011.5047.6025.2032.908.71
New-1316.9710.9922.9514.108.5042.208.6021.309.90
(5) Expenditures for R&D in Higher Education10.600.460.740.590.250.980.410.710.21
20.220.130.300.220.040.340.190.330.11
30.350.260.450.330.230.560.280.420.11
EU-280.410.320.490.340.040.980.240.560.23
Old-150.520.400.640.540.240.980.330.690.22
New-130.270.180.370.230.040.630.200.340.16
(6) Companies using electronic management systems139.2732.7945.7641.0024.0053.0029.0048.009.65
230.4422.9637.9332.0014.0048.0023.0033.009.74
335.5028.8042.2034.0026.0048.0028.5042.508.02
EU-2835.3631.6139.1134.0014.0053.0028.5043.009.67
Old-1540.1335.4844.7842.0024.0053.0035.0048.008.40
New-1329.8524.9134.7931.0014.0048.0026.0033.008.17
(7) Individuals possessing digital skills184.4581.0587.8685.0073.0092.0083.0087.005.07
265.5653.8377.2868.0042.0085.0059.0079.0015.26
372.1364.1680.0973.5056.0086.0065.5078.509.52
EU-2874.8669.7979.9279.0042.0092.0067.0085.0013.06
Old-1579.5374.2884.7980.0056.0092.0075.0087.009.49
New-1369.4660.5078.4270.0042.0086.0063.0083.0014.83
(8) Graduates of HEIs in the STEM fields117.1513.1521.1616.803.8023.6013.6022.405.96
214.4012.2916.5114.3010.1018.9012.7015.102.74
322.1517.5726.7321.2514.5032.7018.9524.805.48
EU-2817.7015.4819.9217.353.8032.7014.0521.955.73
Old-1519.2715.4923.0420.603.8032.7014.5022.606.81
New-1315.8813.7118.0615.1010.1023.6013.8018.503.60
(9) Employees participating in informal education and work-related training151.5546.8956.2049.8043.7066.1046.2057.306.93
234.9822.9746.9936.405.8053.4031.1047.4015.62
344.8437.3352.3547.3027.5056.4040.0550.058.99
EU-2844.3039.3849.2347.205.8066.1039.8550.7512.71
Old-1549.0543.0055.1149.8016.7066.1045.8056.4010.94
New-1338.8231.1146.5442.205.8053.4032.7048.6012.77
(10) Precarious employment for a period of up to 3 months11.440.612.261.000.303.500.302.701.23
20.890.471.310.700.201.900.501.300.55
33.782.495.063.701.206.503.104.451.54
EU-281.931.292.571.250.206.500.653.501.65
Old-152.131.312.961.400.304.700.803.501.49
New-131.690.582.811.100.206.500.501.901.85
CI = Confidence Interval for the Average, LQ = Lower Quartile, UP = Upper Quartile, SD = Standard Deviation, Old-15 = “old” EU Member States (Austria, Belgium, Denmark, Finland, France, Germany, Greece, Ireland, Italy, Luxembourg, Netherlands, Portugal, Spain, Sweden, United Kingdom), New-13 = “new” EU Member States (Bulgaria, Croatia, Cyprus, Czech Republic, Estonia, Hungary, Latvia, Lithuania, Malta, Poland, Romania, Slovakia, Slovenia), Source: Own study based on research.
Table 3. Statistical diversity between the clusters in relation to the adopted cluster analysis method.
No. of the VariableName of the VariableStatistical Diversity between the Clusters
Ward’s Method (3 Clusters)“Old” (1) and “New” (2) EU Member States (2 Clusters)
1Work productivity per hour1–21–2
2Employment rate1–3
3Percentage of individuals employed for fixed period1–3, 2–3
4Companies with budget for employees’ Continuing Vocational Training (CVT)1–21–2
5Expenditures for R&D in Higher Education1–2, 1–31–2
6Companies using electronic management systems1–2
7Individuals possessing digital skills1–2, 1–3
8Graduates of HEIs in the STEM fields2–3
9Employees participating in informal education and work-related training1–2
10Precarious employment for a period of up to 3 months1–3, 2–3
Source: Own study based on research.

