Man-Induced Discrete Freshwater Discharge and Changes in Flow Structure and Bottom Turbulence in Altered Yeongsan Estuary, Korea

1
National Institute of Meteorological Sciences/KMA, Seogwipo 63568, Korea
2
Department of Oceanography, Inha University, Incheon 22212, Korea
*
Author to whom correspondence should be addressed.
Water 2020, 12(7), 1919; https://doi.org/10.3390/w12071919
Submission received: 3 June 2020
/
Revised: 29 June 2020
/
Accepted: 1 July 2020
/
Published: 5 July 2020
(This article belongs to the Special Issue Turbulence and Flow–Sediment Interactions in Open-Channel Flows)
Abstract
:Flow measurements were performed in the altered Yeongsan estuary, Korea, in August 2011, to investigate changes in flow structure in the water column and turbulence characteristics very close to the bed. Comparison between the bottom turbulent kinetic energy (TKE) and suspended sediment concentration (SSC) was conducted to examine how discrete freshwater discharge affects the bottom sediment concentration. The discrete freshwater discharge due to the gate opening of the Yeongsan estuarine dam induced a strong two-layer circulation: an offshore-flowing surface layer and a landward-flowing bottom layer. The fine flow structure from the bed to 0.35 m above the bottom (mab hereafter) exhibited an upside-down-bell-shaped profile for which current speed was nearly uniform above 0.1 mab, with the magnitude of the horizontal and vertical flow speeds reaching 0.1 and 0.01 m/s, respectively. The bottom turbulence responded to the freshwater discharge at the surface layer and the maximum magnitude of the Reynolds stress reached up to 2 × 10⁻⁴ m2/s2 during the discharged period, which coincided with increased SSC in the bottom boundary layer. These results indicate that the surface freshwater discharge due to opening of the estuarine dam gate increases the SSC by the discharge-induced intensification of the turbulent flow in the bottom boundary layer.
1. Introduction
In estuaries, water currents are mainly driven by tide, wind, and freshwater discharge [1]. Other factors affecting the flow structure include density stratification caused by temperature and salinity, seabed roughness due to the bottom surficial texture and bedforms, and also artificial alterations such as dam construction. Water currents play an important role in the transportation and distribution of suspended sediment which can change the topography and morphological shape of an estuary. Especially when the bottom surface is composed of silt or mud, resuspension of sediment can be very dependent on the turbulent flow activity above the bed. Turbulent flow near the bed is a well-known factor which generates sediment-related processes such as erosion, dispersion, and transportation in the bottom layer [2,3,4].
Artificial alteration of an estuarine environment, such as dam construction to block the saltwater intrusion and the regulation of the freshwater discharge, can modify the physical environment such as the tidal range and circulation structure [5,6]. One factor which can induce a sudden response from an estuary is forced freshwater discharge because rapid currents can be formed in the surface with a velocity difference between the surface and bottom layers. When any such artificial change occurs such as discontinuous freshwater input, an estuary naturally will adjust to these changes. An example of an estuary which has experienced such artificial change is the Yeongsan River estuary (Figure 1), located in the southwestern portion of the Korean peninsula. Yeongsan River is one of the four major rivers in Korea. It has a drainage area of 3455 km2 and a length of 129.5 km. The Yeongsan estuary has a series of offshore islands and extensive salt marsh complexes, with an average water depth of 20 m. The main channel was blocked by a dam in February 1981, and now it behaves as a semi-enclosed bay [7]. The tide is macrotidal with a semi-diurnal tidal range of 4.5 m, and 70% of the annual rainfall of 840 mm occurs from June to August.
According to several studies, the physical environmental conditions have changed after the dam construction. Kang [6] showed that the tidal range increased to 60 and 43 cm for extreme high and low tide, respectively, while the tidal velocity decreased with an ebb tidal dominance causing a change in the sediment transport mechanisms. During the summer season when the gate opens frequently, the freshwater discharge has become an important factor to change the current, temperature, and salinity distribution because of sudden and forced discharge through the surface layer [8,9,10,11,12]. In terms of flow system change, for example, Cho et al. [11] suggested that there exist four layers under low discharge conditions during the summer season, showing seaward flow in the surface and middle layer, and landward flow in the bottom layer and between the surface and middle layers. With freshwater discharge due to the gate opening, a two-layer circulation is formed with strong stratification between the offshore-flowing surface layer and the landward-flowing bottom layer. So, the freshwater discharge can affect directly the estuarine circulation system. In addition, through 210Pb and 7Be radioisotope geochronology in the Yeongsan estuary, Williams et al. [13] showed that high sedimentation rates up to 9 cm/year occur in the estuary, and the sediment deposition primarily occurs during episodic events corresponding to high discharge. However, the flow structure and the associated sediment suspension near the bed during freshwater discharge are still not well understood.
In the Yeongsan estuary, a sudden release of freshwater in the surface layer due to opening of the estuarine dam gate can cause rapid intensification of the seaward flow. It is expected, then, that the flow of the lower layer should respond to the sudden and strong surface flow. In such a case, the bottom flow response could be coupled to change in the velocity shear, and this in turn could be a cause for sediment resuspension from the bed. To our knowledge, this is the first field observation to report the characteristics of flow, turbulence, and suspended sediment in the bottom boundary layer in response to discrete freshwater discharge. Somewhat related to this topic includes those of entrainment and mixing in a turbulent jet [14,15], jet scour [16], and sediment discharge by jet-induced flow [17,18,19]. Therefore, the main objectives in this study are to investigate how the freshwater discharge changes the structure of the bottom turbulent flow properties like the Reynolds stress and the turbulent kinetic energy (TKE), and to elucidate how the bottom turbulent flow interacts with the suspended sediment near the seabed by using observed water current and suspended sediment concentration data to capture the turbulent structure and suspended sediment concentration in the bottom boundary layer during a freshwater discharge. The observation and data processing scheme are described in Section 2, and the analysis results about the evolution of the mean and turbulent flow and the bottom suspended sediment concentrations are shown in Section 3. The role of man-induced freshwater discharge on the flow structure and suspended sediment concentration fluctuations above the seabed is discussed in Section 4, and finally, a very brief conclusion and meaning of this study are shown in Section 5.
2. Observation and Data Processing
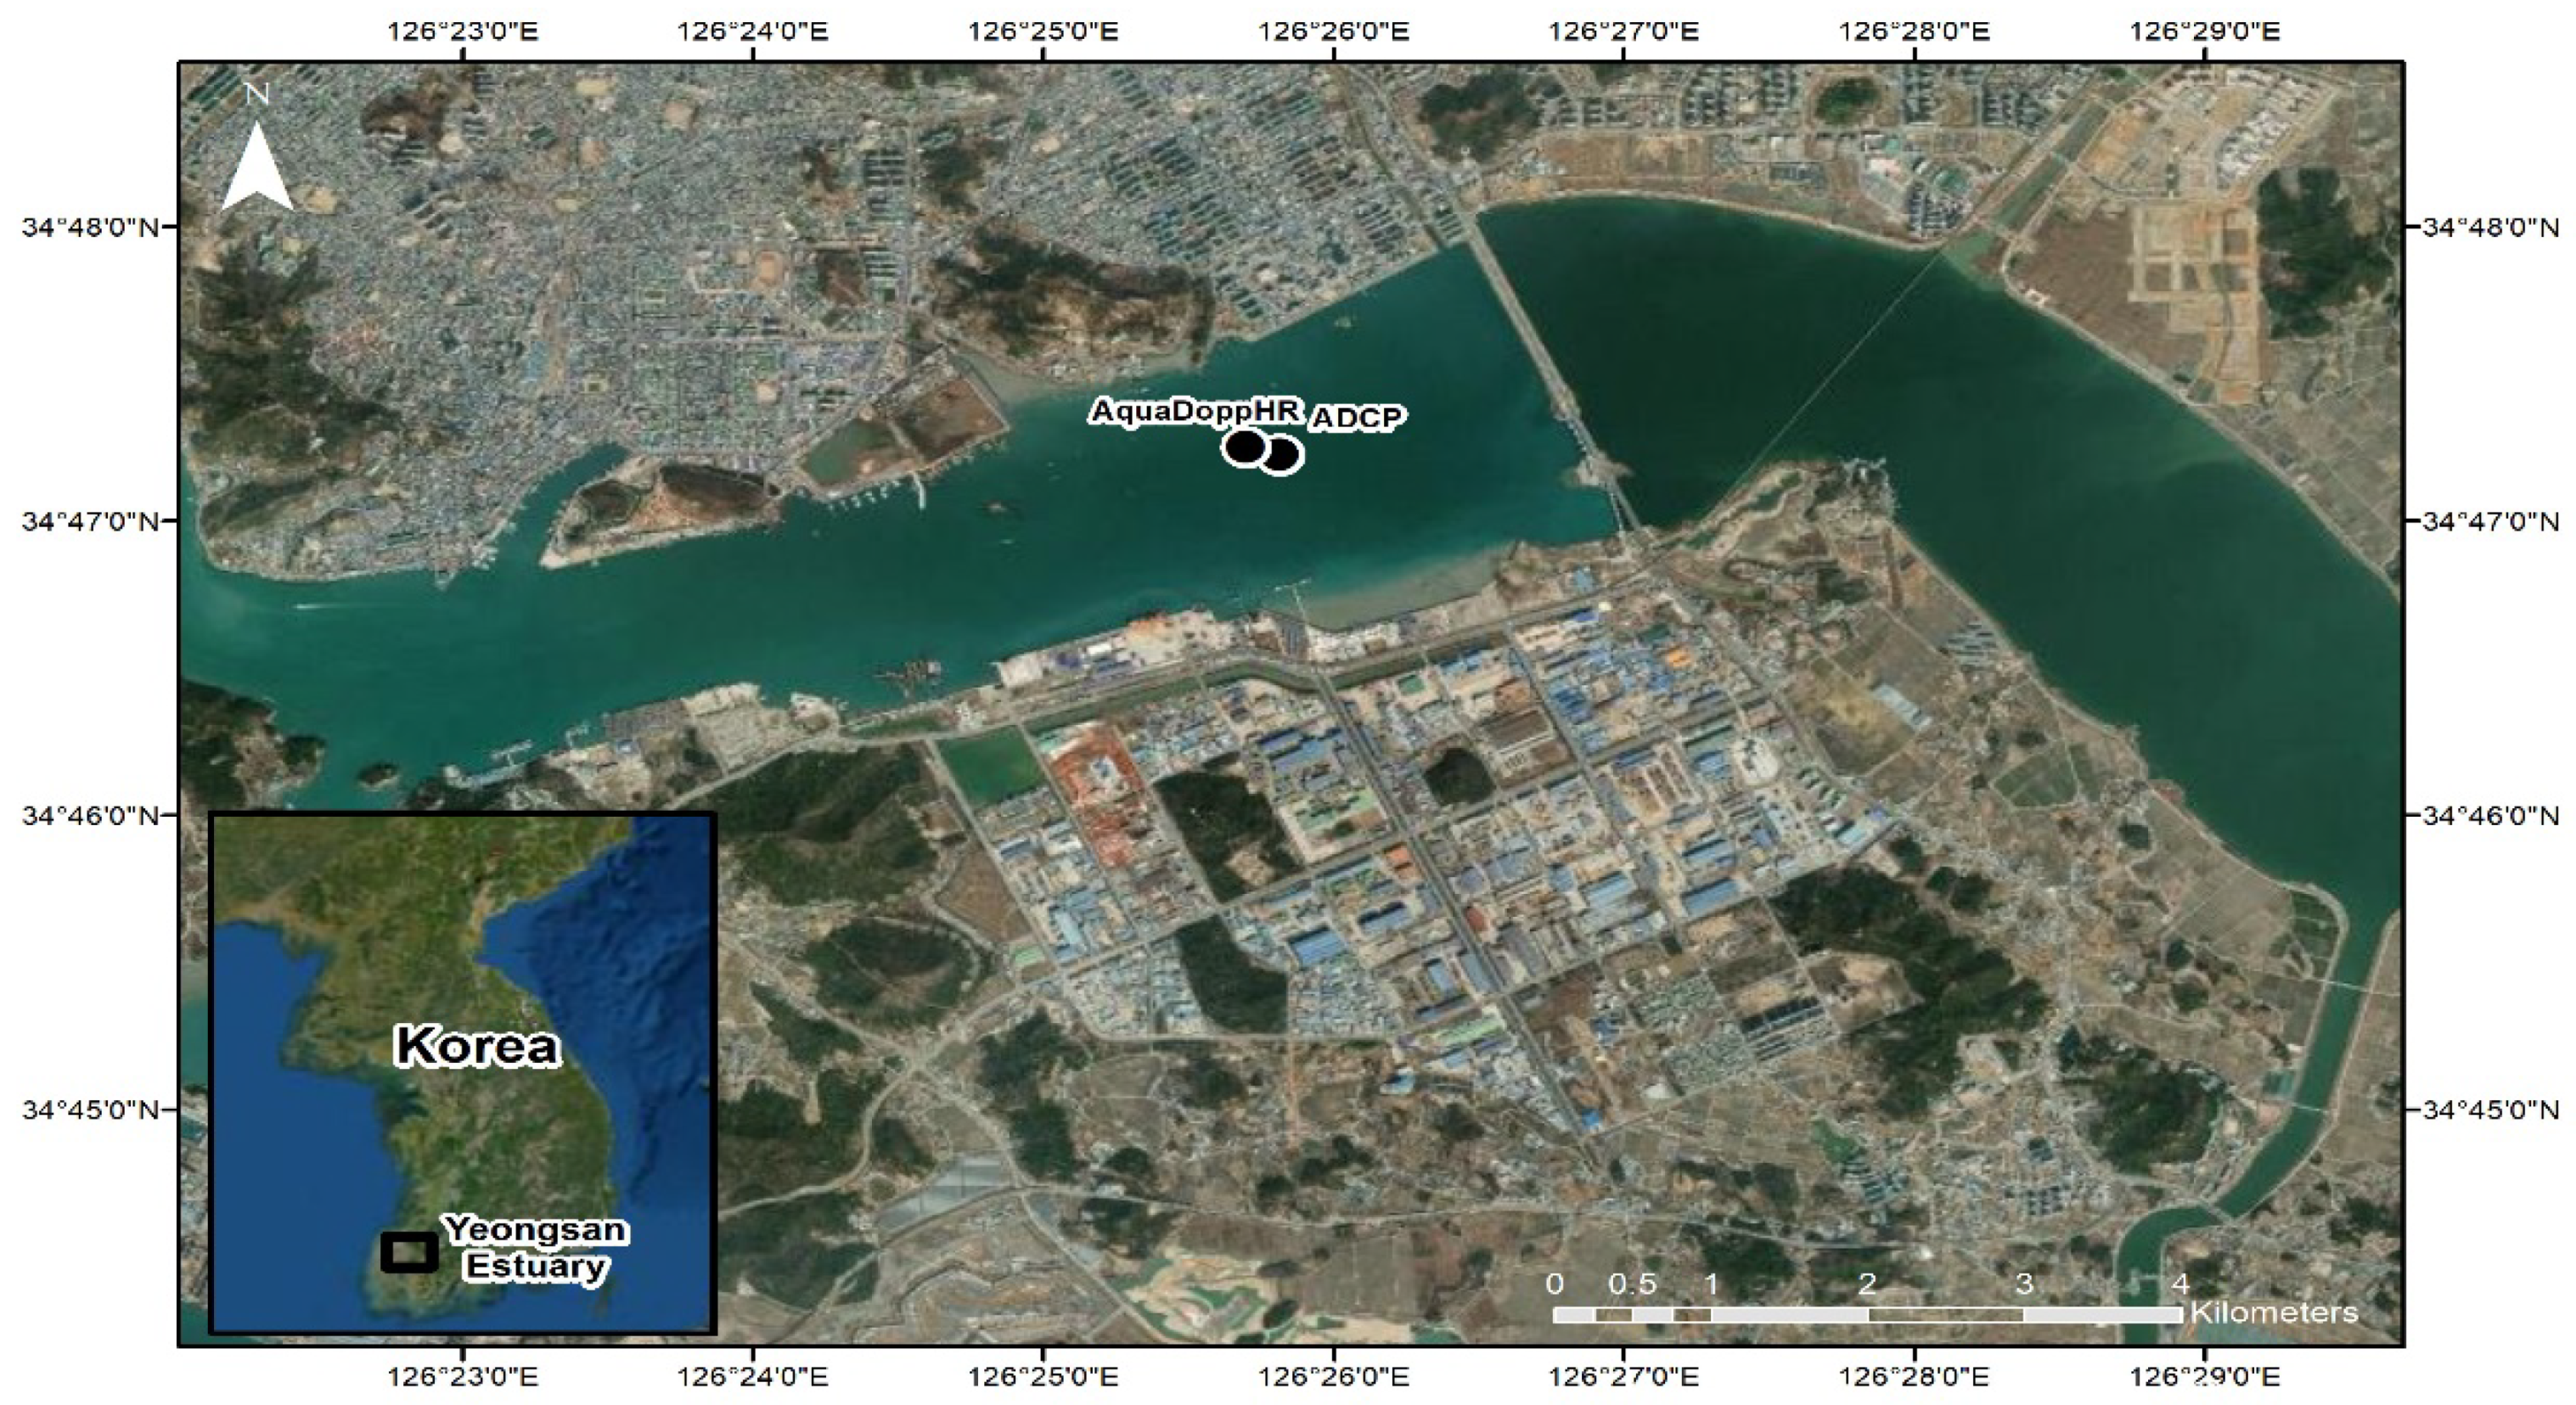
The experiment campaign was designed specifically to observe the flows in both the bottom and upper layers during the period of discrete freshwater discharge in the Yeongsan estuary, Korea, during August 2011 (Figure 1). Two current meters, an ADCP (RDI 1200 kHz, Teledyne, Poway, CA) and an AquaDoppHR (Model: AQP 9116, Nortek, Boston, MA), were moored near the Yeongsan estuarine dam in the inner estuary (Figure 1 and Table 1). The ADCP was mounted on the bed with an up-looking orientation to measure the flow profile in the water column, and the AquaDoppHR was bottom-mounted at about 1 m above bottom (mab hereafter) with down-looking orientation for near-bed turbulence measurements. The current profiles obtained from the ADCP with high percent good values of 85 and above were averaged by burst with a 30-min interval for the flow structure in the water column (Table 1).
The ADCP current data were not rotated into the along- and cross-channel directions because the main direction of the freshwater discharge was east–west. The observed current data were separated into tidal and residual flows based on the tidal harmonic analysis developed by Foreman [20] and implemented into MATLAB as T_TIDE [21]. From the residual flow, it was possible to check how the upper layer flow responded to the sudden freshwater discharge from the gate opening of the dam.
The AquaDoppHR was programmed for burst sampling to observe the fine structure of the mean and turbulent flow characteristics very near the bed. The burst sampling lasted for 8.5 min in 30-min burst intervals the same as the ADCP, however, the AquaDoppHR sampling frequency was higher at 4 Hz. The AquaDoppHR profiled from the bed to 0.35 mab with 5 cm bin size spatial resolution. The bed was detected from the trend of the acoustic signal strength along each beam, in which the signal strength generally shows maximum value at the bed. In this case, since three beams were looking at the bottom, the maximum value was located in different bins of each beam such as the 7th, 8th, and 9th bins. A possible reason for different bin numbers showing the maximum signal strength could be the bed status. Since the bed surface that the AquaDoppHR was looking down upon was not perfectly flat, and because it is hard to know the true bed status at the midpoint between the three beams, we selected the middle value of bins as the bed level.
The near-bed velocity data obtained from the AquaDoppHR were first despiked using an averaging method after visual inspection of all bursts. Then, the mean, variance, and covariance values of the different flow components of all bins for each burst were calculated to estimate the turbulent flow characteristics such as the Reynolds stress components and the turbulent kinetic energy (TKE). The Reynolds stress and the TKE were calculated by using the following two equations (Equations (1) and (2)):
where u′, v′, and w′ are the turbulent components of the east–west (u), north–south (v), and up–down (w) components of a velocity vector, u = (u, v, w), for each burst sampling period, respectively. U and V are the mean flow components of each burst for horizontal flow, for example, u = U + u′ and v = V + v′, and the bracket (< >) means time averaging for a burst period. Finally, the suspended sediment concentration (SSC) was calculated by conversion of the acoustic backscatter signal of the four beams of the moored ADCP. A more detailed procedure for this calculation can be found in Park and Lee [22].
R13 = −<u′w′>, R23 = −<v′w′>
TKE = (<u′2> + <v′2> + <w′2>)/2
3. Results
3.1. Freshwater Discharge and Flow Structure Change
One of the key factors to affect the estuarine flow in an altered estuary is the freshwater discharge since it makes both a forced seaward current in the surface layer and a density difference between the upper and lower layers. Moreover, the strength of the surface current as well as the density gradient depends on the amount of freshwater discharge. In this section, the response of the surface water after the freshwater discharge is depicted using the ADCP data. A time series of discharge is compared with the current structure and then with the change in residual flow (component with tides removed, using 17 tidal constituents) in the water column.
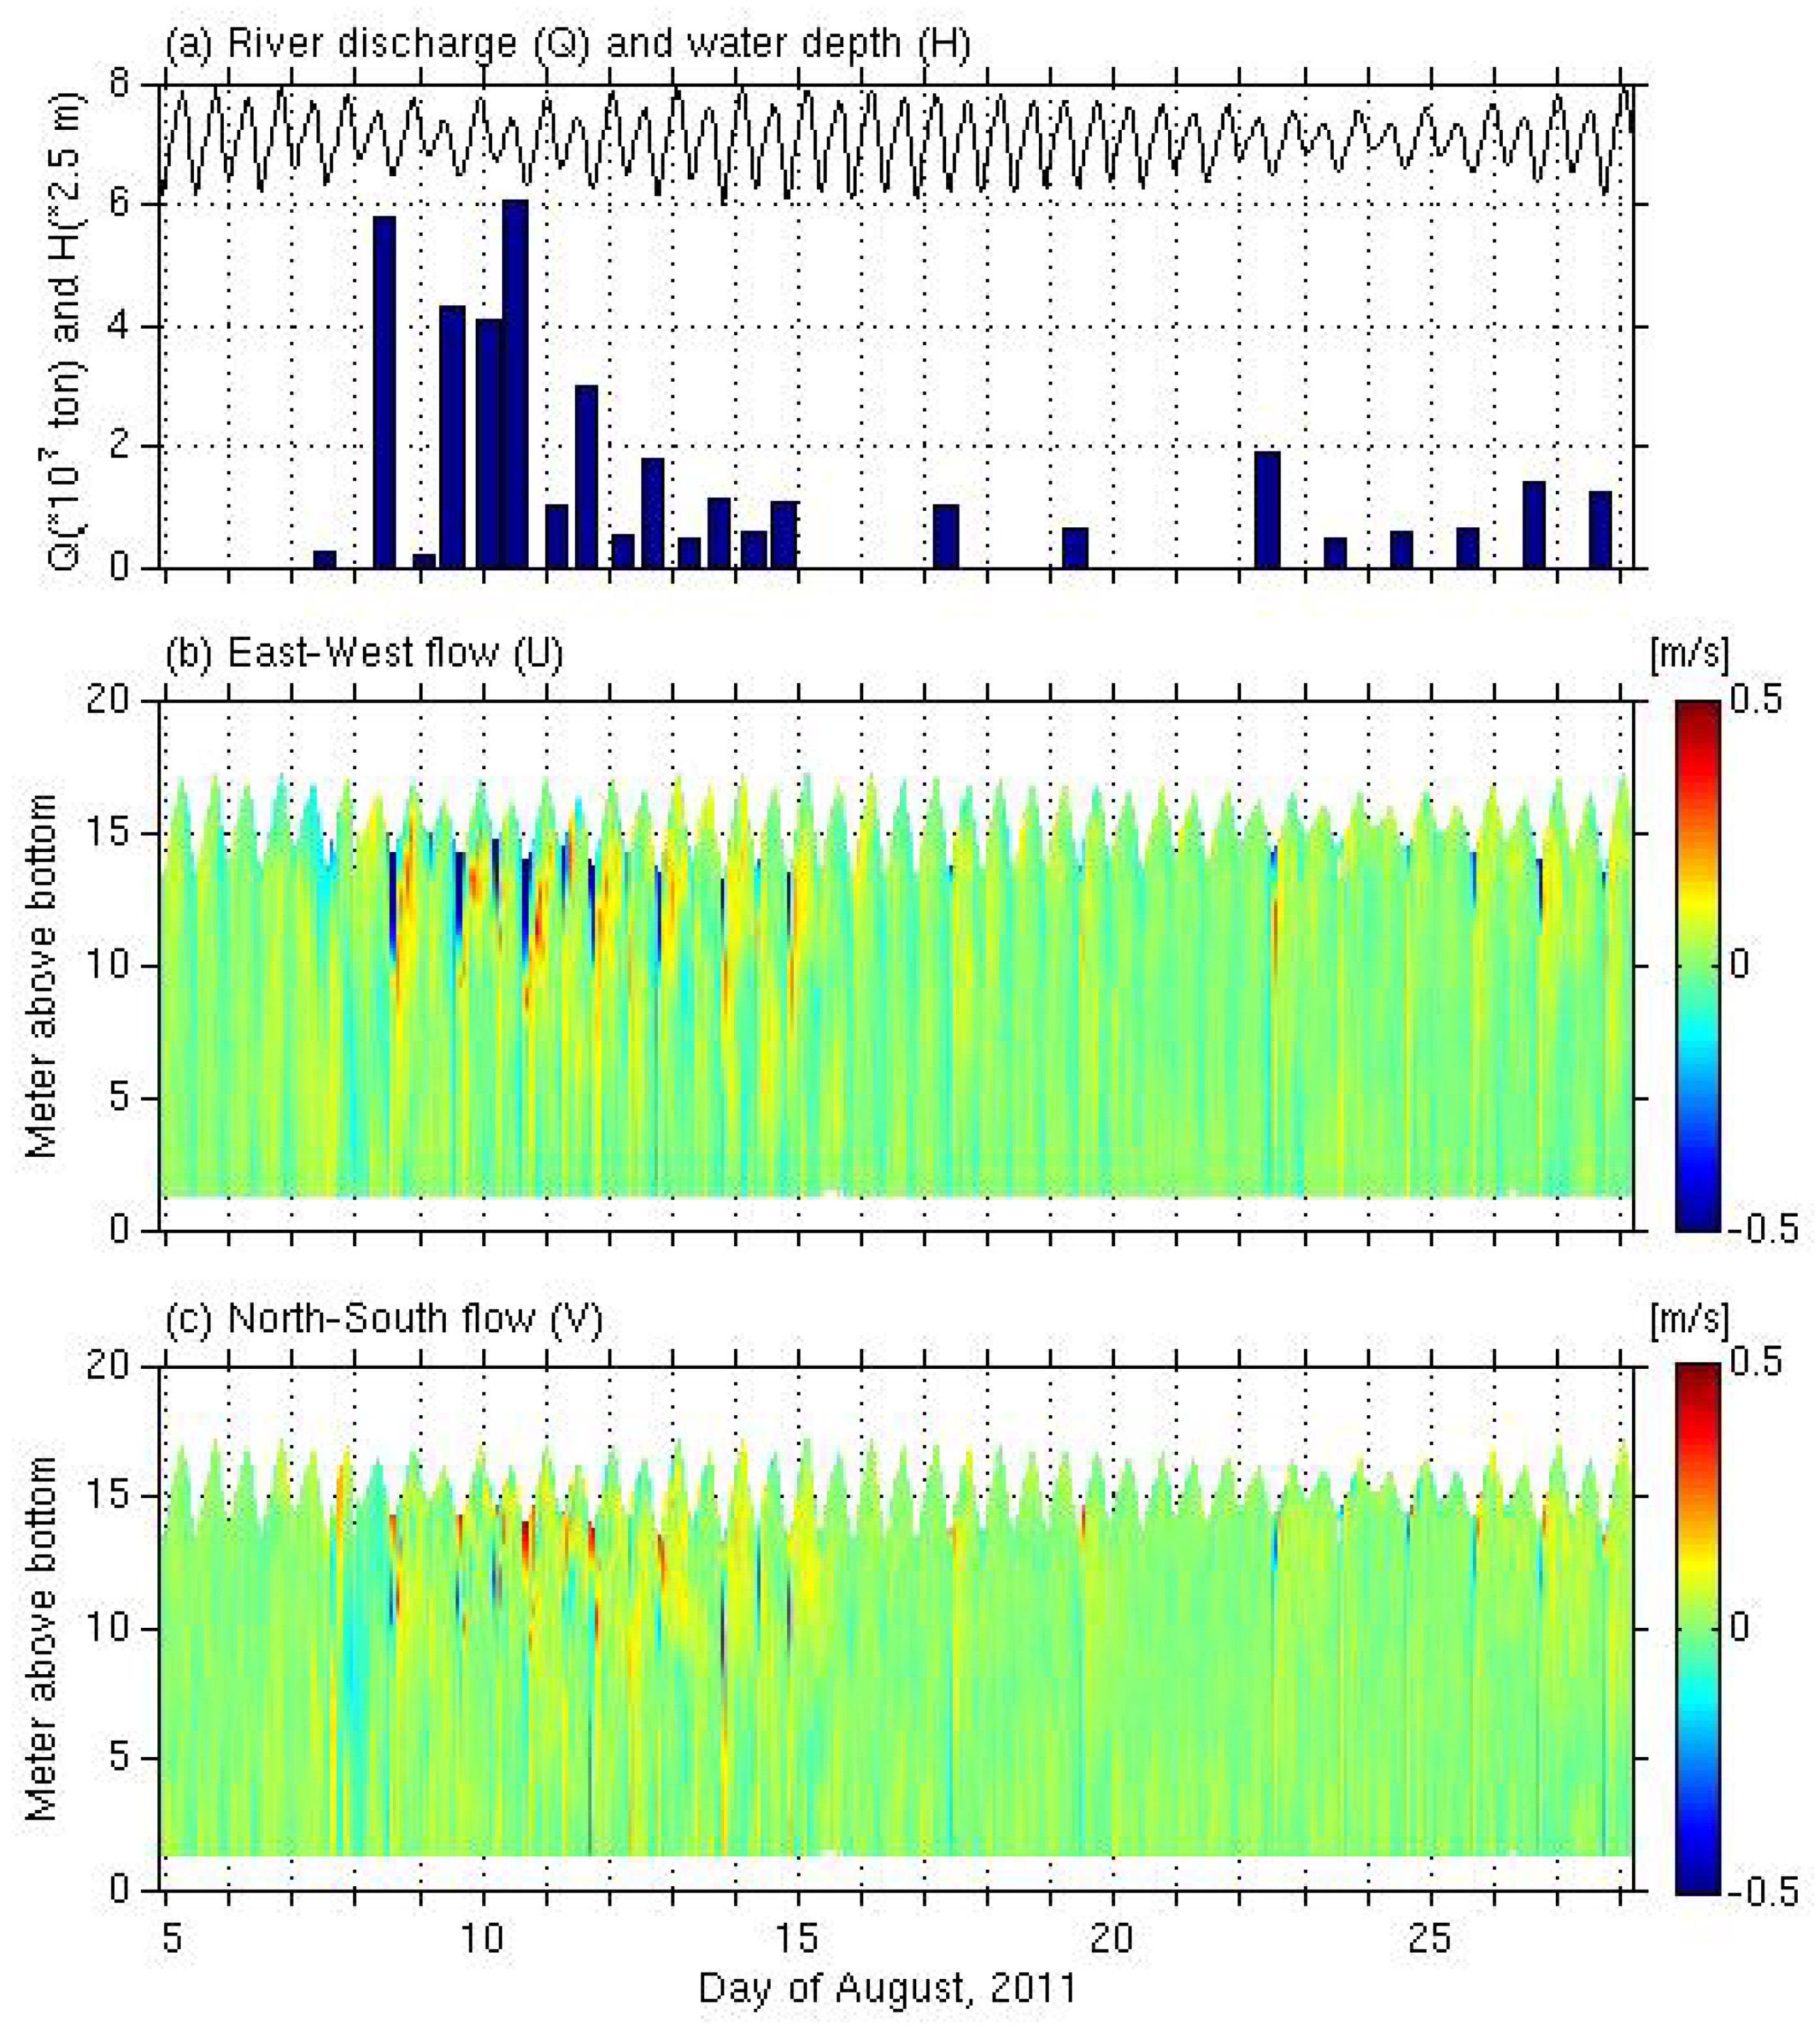
Figure 2 shows the discrete freshwater discharge and mean current velocity for U and V, during 5–28 August 2011. According to typical gate operation procedure, the gates were opened only during the low tide to prevent saltwater intrusion. On 11 August, over 6 × 10⁷ tons of freshwater were discharged. After the discharge, the westward surface current rapidly increased to greater than 0.5 m/s and affected at least 5 m below the surface. At the same time, an opposite flow to the east formed in the lower layer. The sudden release of freshwater also increased the north–south component of the flow in a short period of time. When there was no freshwater discharge, the current speed was less than 0.25 m/s and the flow structure simply repeated the flood and ebb states such that eastward flow occurred during flood, westward flow occurred during ebb, and almost zero flow occurred during both high and low slack tides.
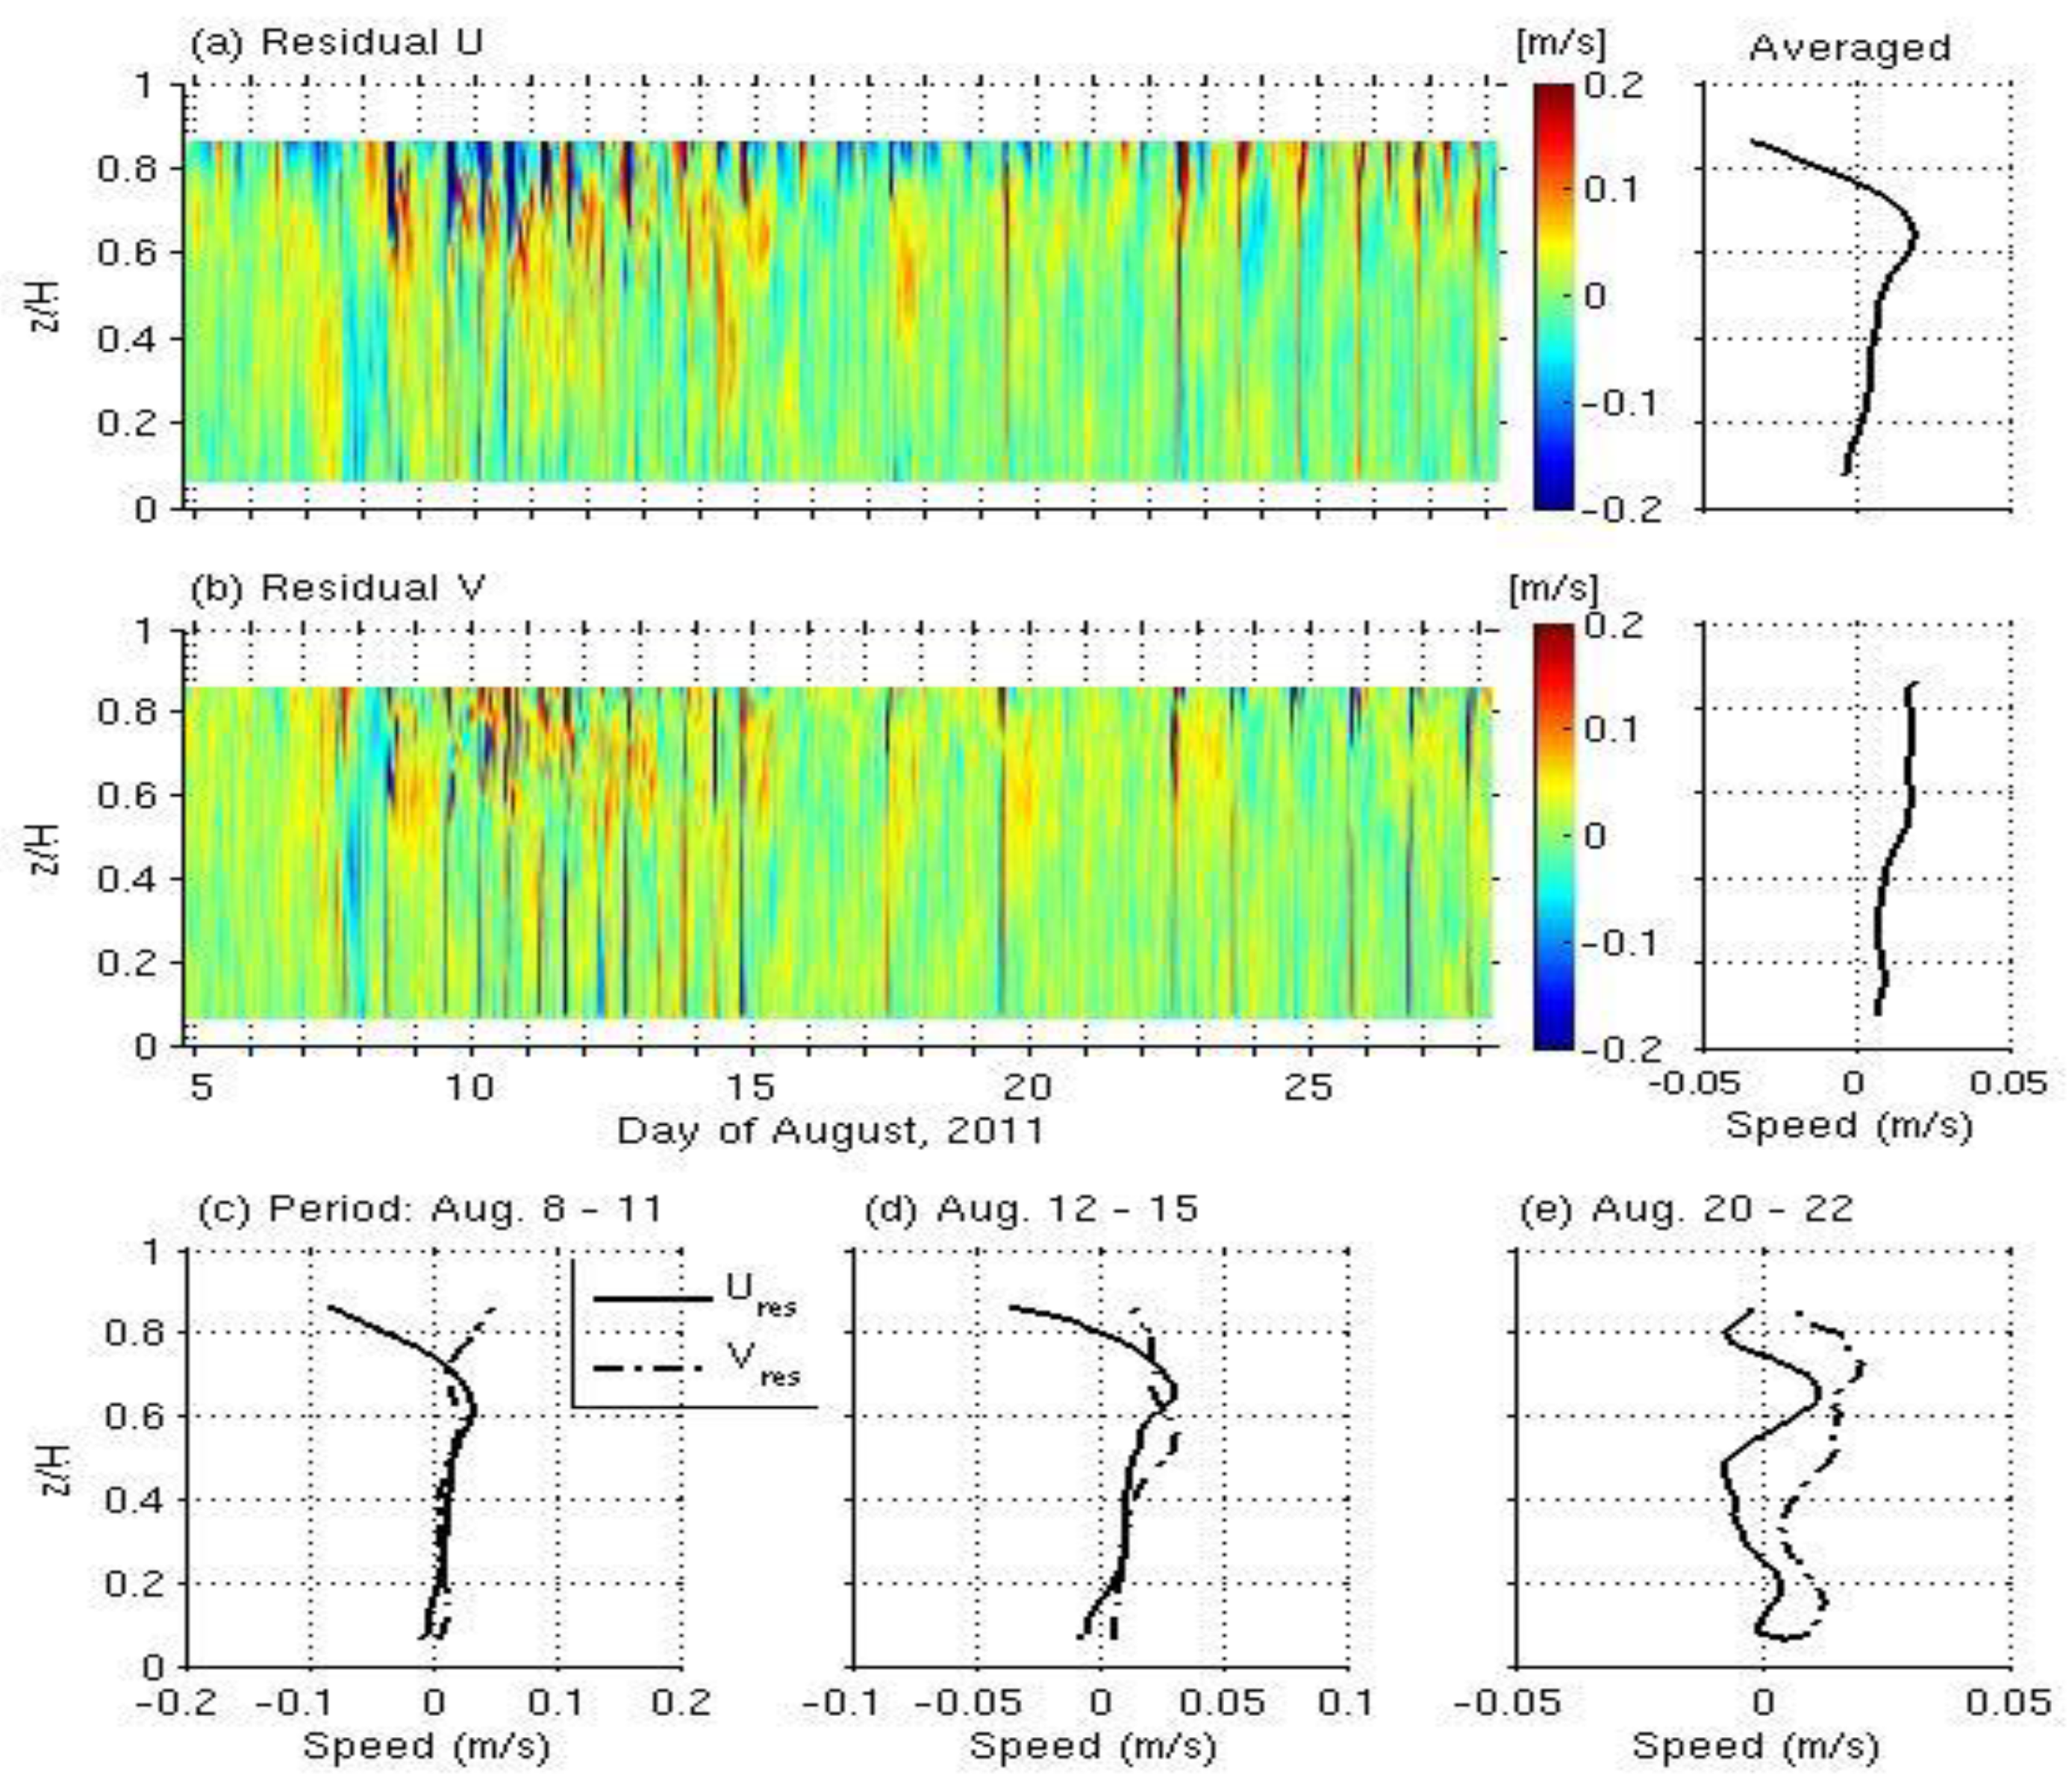
The tide-removed residual flow showed in detail how the mean flow structure could be changed by the amount of freshwater discharge (Figure 3). During freshwater discharge, the residual flow showed a two-layer system as expected wherein the upper layer moves seaward and the lower layer flows landward. The flow was seaward from the surface to 0.6 z/H (i.e., z = 9.6 m for H = 16 m) on 10 August 2011, and the depth of the seaward flow decreased as the freshwater discharge decreased. When the amount of discharged water increased, the lower layer also showed a stronger response of landward flow just after the discharge. Of course, the peak speed of the residual u-component appeared in the surface. During no or very weak discharge periods (20–22 August in Figure 3), the residual flow was also weak (almost less than 0.01 m/s) and the vertical structure was hard to specify because of the multilayered structure. This stagnant vertical structure changed with a rapid increase in the speed of the residual current when freshwater discharges occurred.
The averaged residual flow structure for the whole observation period was a typical two-layer flow system that should be induced by vertical gravitational circulation in an estuary [1,23]. The mechanism of this structure is known very well, and there are two forcing factors: the barotropic and baroclinic forcing. The sea level difference between the upper and lower estuary acts as the barotropic forcing, making seaward flow in the upper layer, while the density difference forms the baroclinic forcing, making landward flow in the lower layer. The v-component showed a single-layer structure with very weak flow to the north, and the speed was less than 2 cm/s. This could have been due to the position of the dam gate which is located at the southern part of the dam (Figure 1). The two-layer structure during the entire period was an important aspect of the overall vertical structure of the flow since there was a stagnant, multilayer flow structure during the weak or no freshwater discharge periods (Figure 3d,e).
The strength of the upper- and lower-layer flow depended on the amount of the freshwater discharge. Figure 3 shows the vertical structure change of the residual flow with variation in the amount of discharge, for example, relatively high, low, and no freshwater cases. During the high freshwater discharge period on 8–11 August 2011, the maximum speed of the seaward residual flow was about 0.1 m/s in the surface layer, and a landward flow existed below 0.7 z/H with a quarter of the speed of the surface layer. As the amount of freshwater discharge decreased, the thickness of landward flow in the subsurface layer was increased from 0.7 z/H to 0.8 z/H, and the speed of the surface layer rapidly decreased. This represents the seawater response inside the estuary after blocking the freshwater release. When the barotropic forcing completely disappears due to no freshwater discharge, the water column has a multilayer flow structure, for example, a three- or four-layer structure, indicating that there were many local flows without a dominant flow pattern (Figure 3e). This indicated that during the no freshwater discharge period in this estuary, the residual flow pattern was indistinct and exhibited weak and vertically variable horizontal currents in a stagnant environment. Therefore, the freshwater discharge plays the major role in intensifying the two-layer system, including the residual circulation, in this estuary.
3.2. Bottom Boundary Layer Flow and Reynolds Stress
In the previous section, we examined the impact of freshwater discharge on the flow of the water column above the bottom boundary layer (BBL). In this section, the response of the bottom boundary layer flow to the rapid seaward flow in the upper layer is examined. Data from the AquaDoppHR, moored in a downward-looking orientation on a tripod during 24–28 August 2011, were used to show the detailed structure of the horizontal and vertical components of the BBL flow, the Reynolds stress components, and the turbulent kinetic energy.
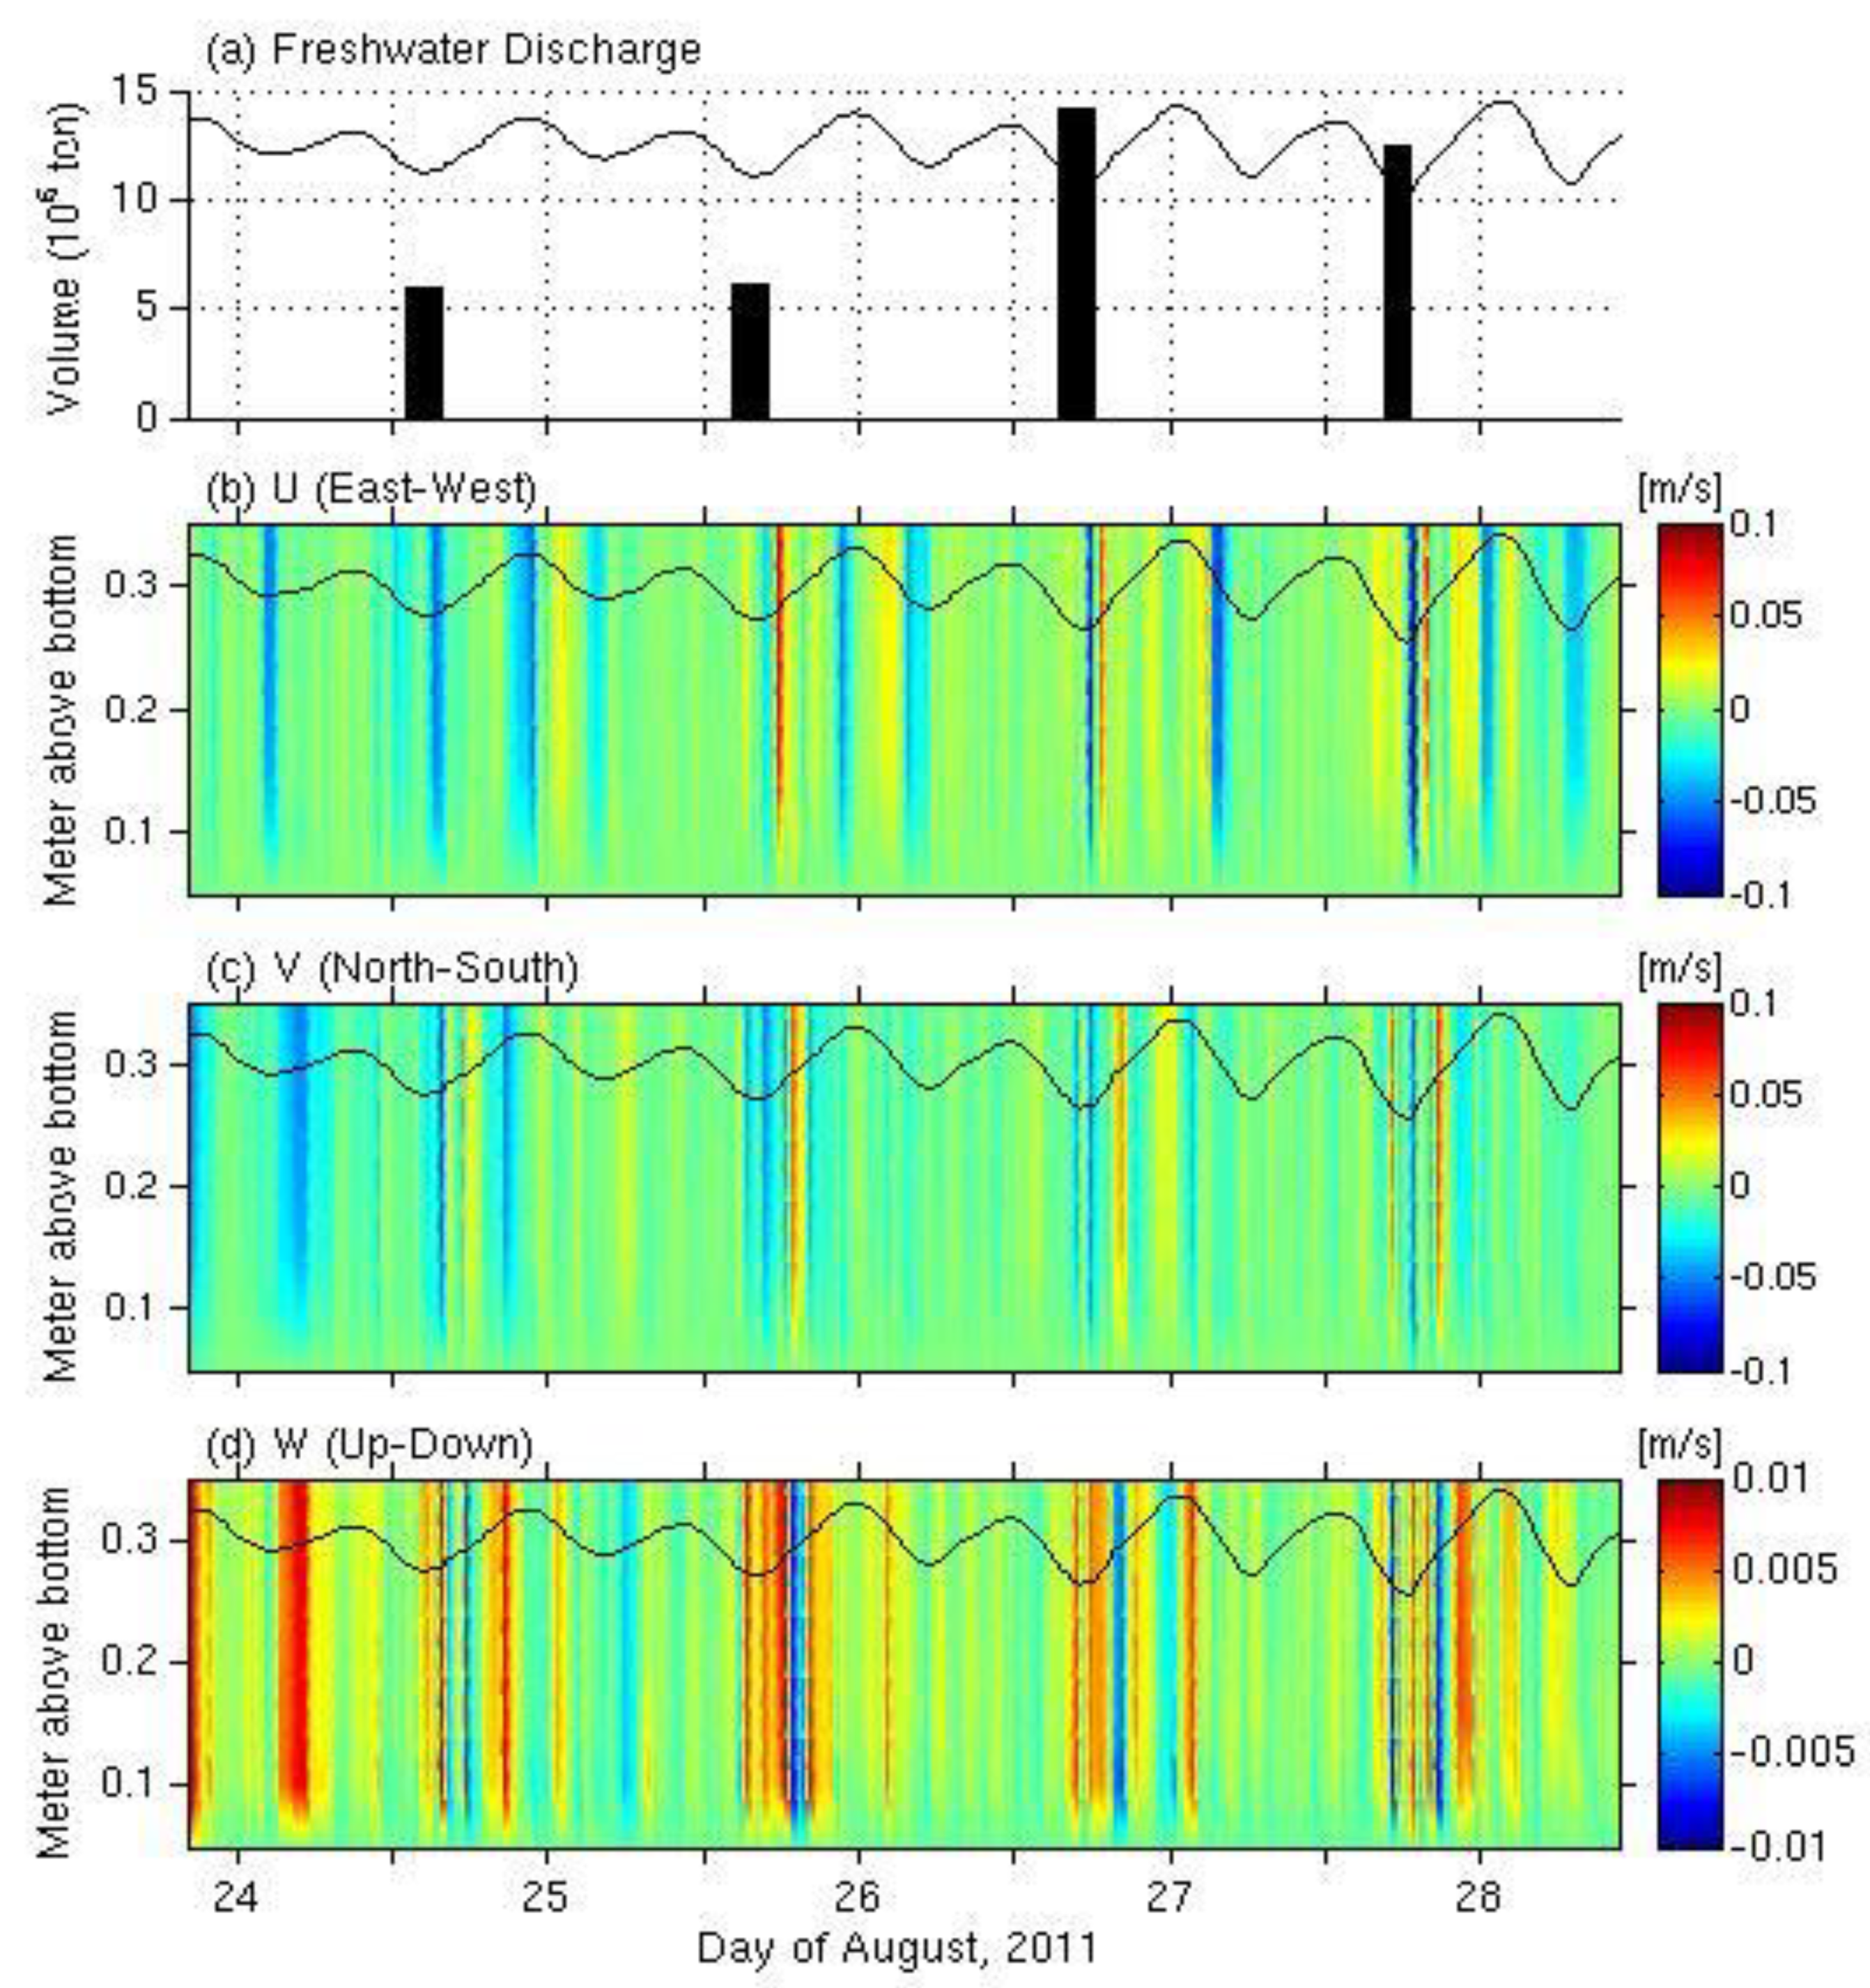
Figure 4 shows the time variation of sea level, the amount of freshwater discharge, and the horizontal and vertical flows at the bottom. The magnitude of flow was about 0.1 m/s in the horizontal component and about 0.01 m/s in the vertical component, and the ebb and flood patterns were not clear since there were several irregular changes in the flow direction even during the flood or ebb tides. The vertical structure of flow indicated that the current magnitude of each profile was similar at 0.15–0.35 mab (Figure 4). However, it began to decrease from 0.15 mab and became almost zero near the bed due to the bottom friction. This phenomenon became clearer as the speed increased. The bottom seaward flow during the low tide was evidence of the fact that the freshwater release can directly affect the bottom flow strength and reverse the flow direction. When freshwater was discharged in the surface layer, the bottom seaward flow was intensified for a short time and then a landward flow appeared (Figure 4b). During 24–28 August 2011, the dam gates opened four times during the low tide: two openings on 24–25 August discharged about 6 × 10⁶ tons of water and the other two openings released over 12 × 106 tons of water (Figure 4a). As the amount of freshwater discharge increased (i.e., on 26 August and 27 August), the change in the flow direction and strength was sharper than the other two cases. One possible reason that the reversed (landward) flow occurred in such a short time could be a result of water mass conservation. When freshwater moved rapidly seaward due to the dam gate opening, it could have produced a return flow in the bottom layer to make the water mass balance inside the estuarine area. The response of the north–south and up–down flow showed a spike-like change just after the freshwater discharge (Figure 4c,d). It is noted, on the other hand, that the flow speed was very weak or almost zero during the no freshwater discharge periods on 25 August and 27 August. It is also interesting to mention the fluctuation of the vertical flow since it displayed directional change (positive to negative) as the freshwater rapidly moved seaward in the upper layer even though the speed was one order of magnitude less than that of the horizontal flow (Figure 4d). The speed of the vertical flow was about 1 cm/s. This fluctuation of the vertical flow occurred during the low tide and was intensified when the freshwater was discharged. Therefore, the freshwater release by opening of the dam gate caused a rapid and strong seaward surface flow, and its impact could reach the bottom and influence the bottom flow structure such as with sudden direction changes in both the horizontal and vertical flow.
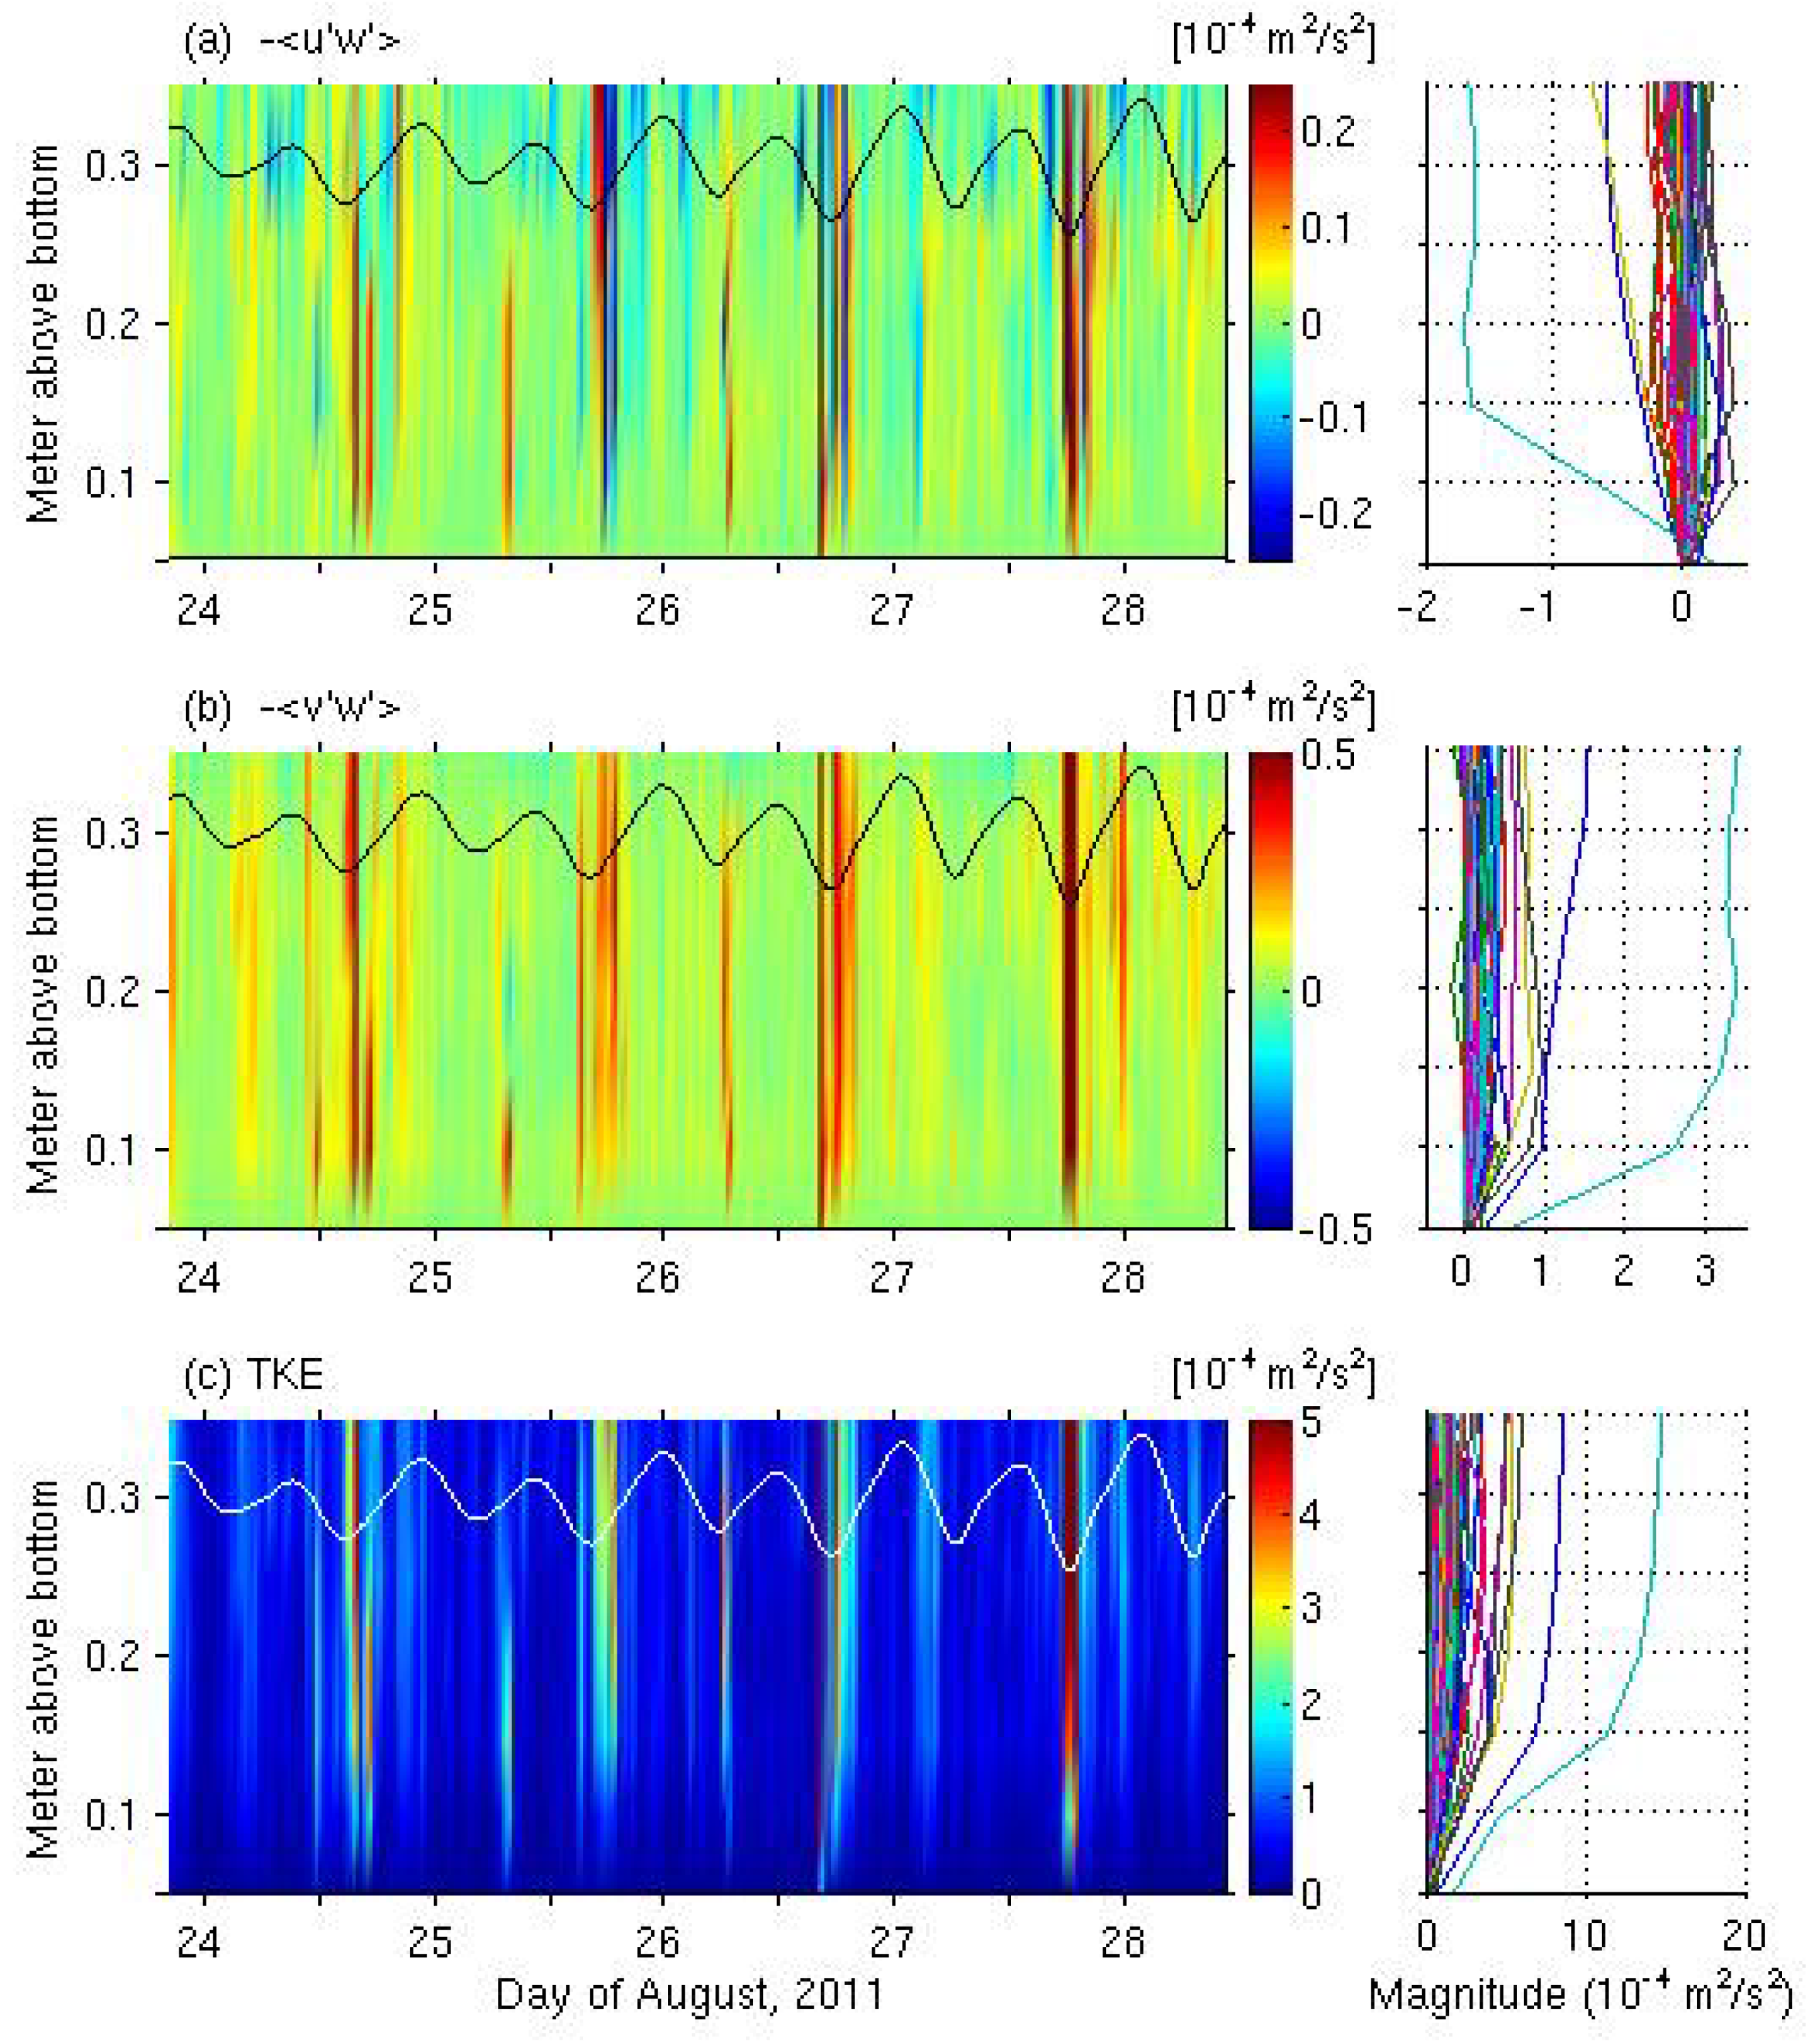
At the bottom boundary layer, the increase of near-bed flow can affect the velocity shear and thus intensify the turbulent flow activity. Figure 5 shows the variation of the Reynolds stresses and turbulent kinetic energy in the bottom boundary layer. The vertical structure is similar to the shape of an upside-down bell. The stress terms, −<u′w′>, showed a symmetric structure except for a few cases where the values became strongly negative (Figure 5a), and −<v’w’> displayed mostly positive values (Figure 5b). This was related to the fluctuation pattern of the flow. During the freshwater discharge, as noted above, the seaward flow was intensified for a short period of time and then the flow direction was reversed, making −<v′w′> symmetric. However, a mostly southward v-component flow was responsible for the positive values of −<v′w′>. Thus, the flow change due to the surface freshwater discharge was linked to the bottom stress intensification and turbulent flow change.
Figure 5c displays the time variation of turbulent kinetic energy. The vertical distribution of TKE is similar to the upside-down half-bell shape and the magnitude rapidly increased from the bed to 0.1–0.2 mab and then remained relatively constant above 0.2 mab. With respect to time, the TKE also increased during the freshwater discharge during low tide, and was proportional to the amount of freshwater discharge. The maximum value during this study period appeared during the late low tide on 27 August.
3.3. Suspended Sediment Concentration and TKE
The major sources of suspended sediment in estuarine environments in general are from the upstream and the sea, as well as bed erosion by flow–bed interaction. In this section, the temporal change in SSC profiles after the freshwater discharges is investigated and the relationship between the turbulent flow activity and SSC in the bottom boundary layer is examined.
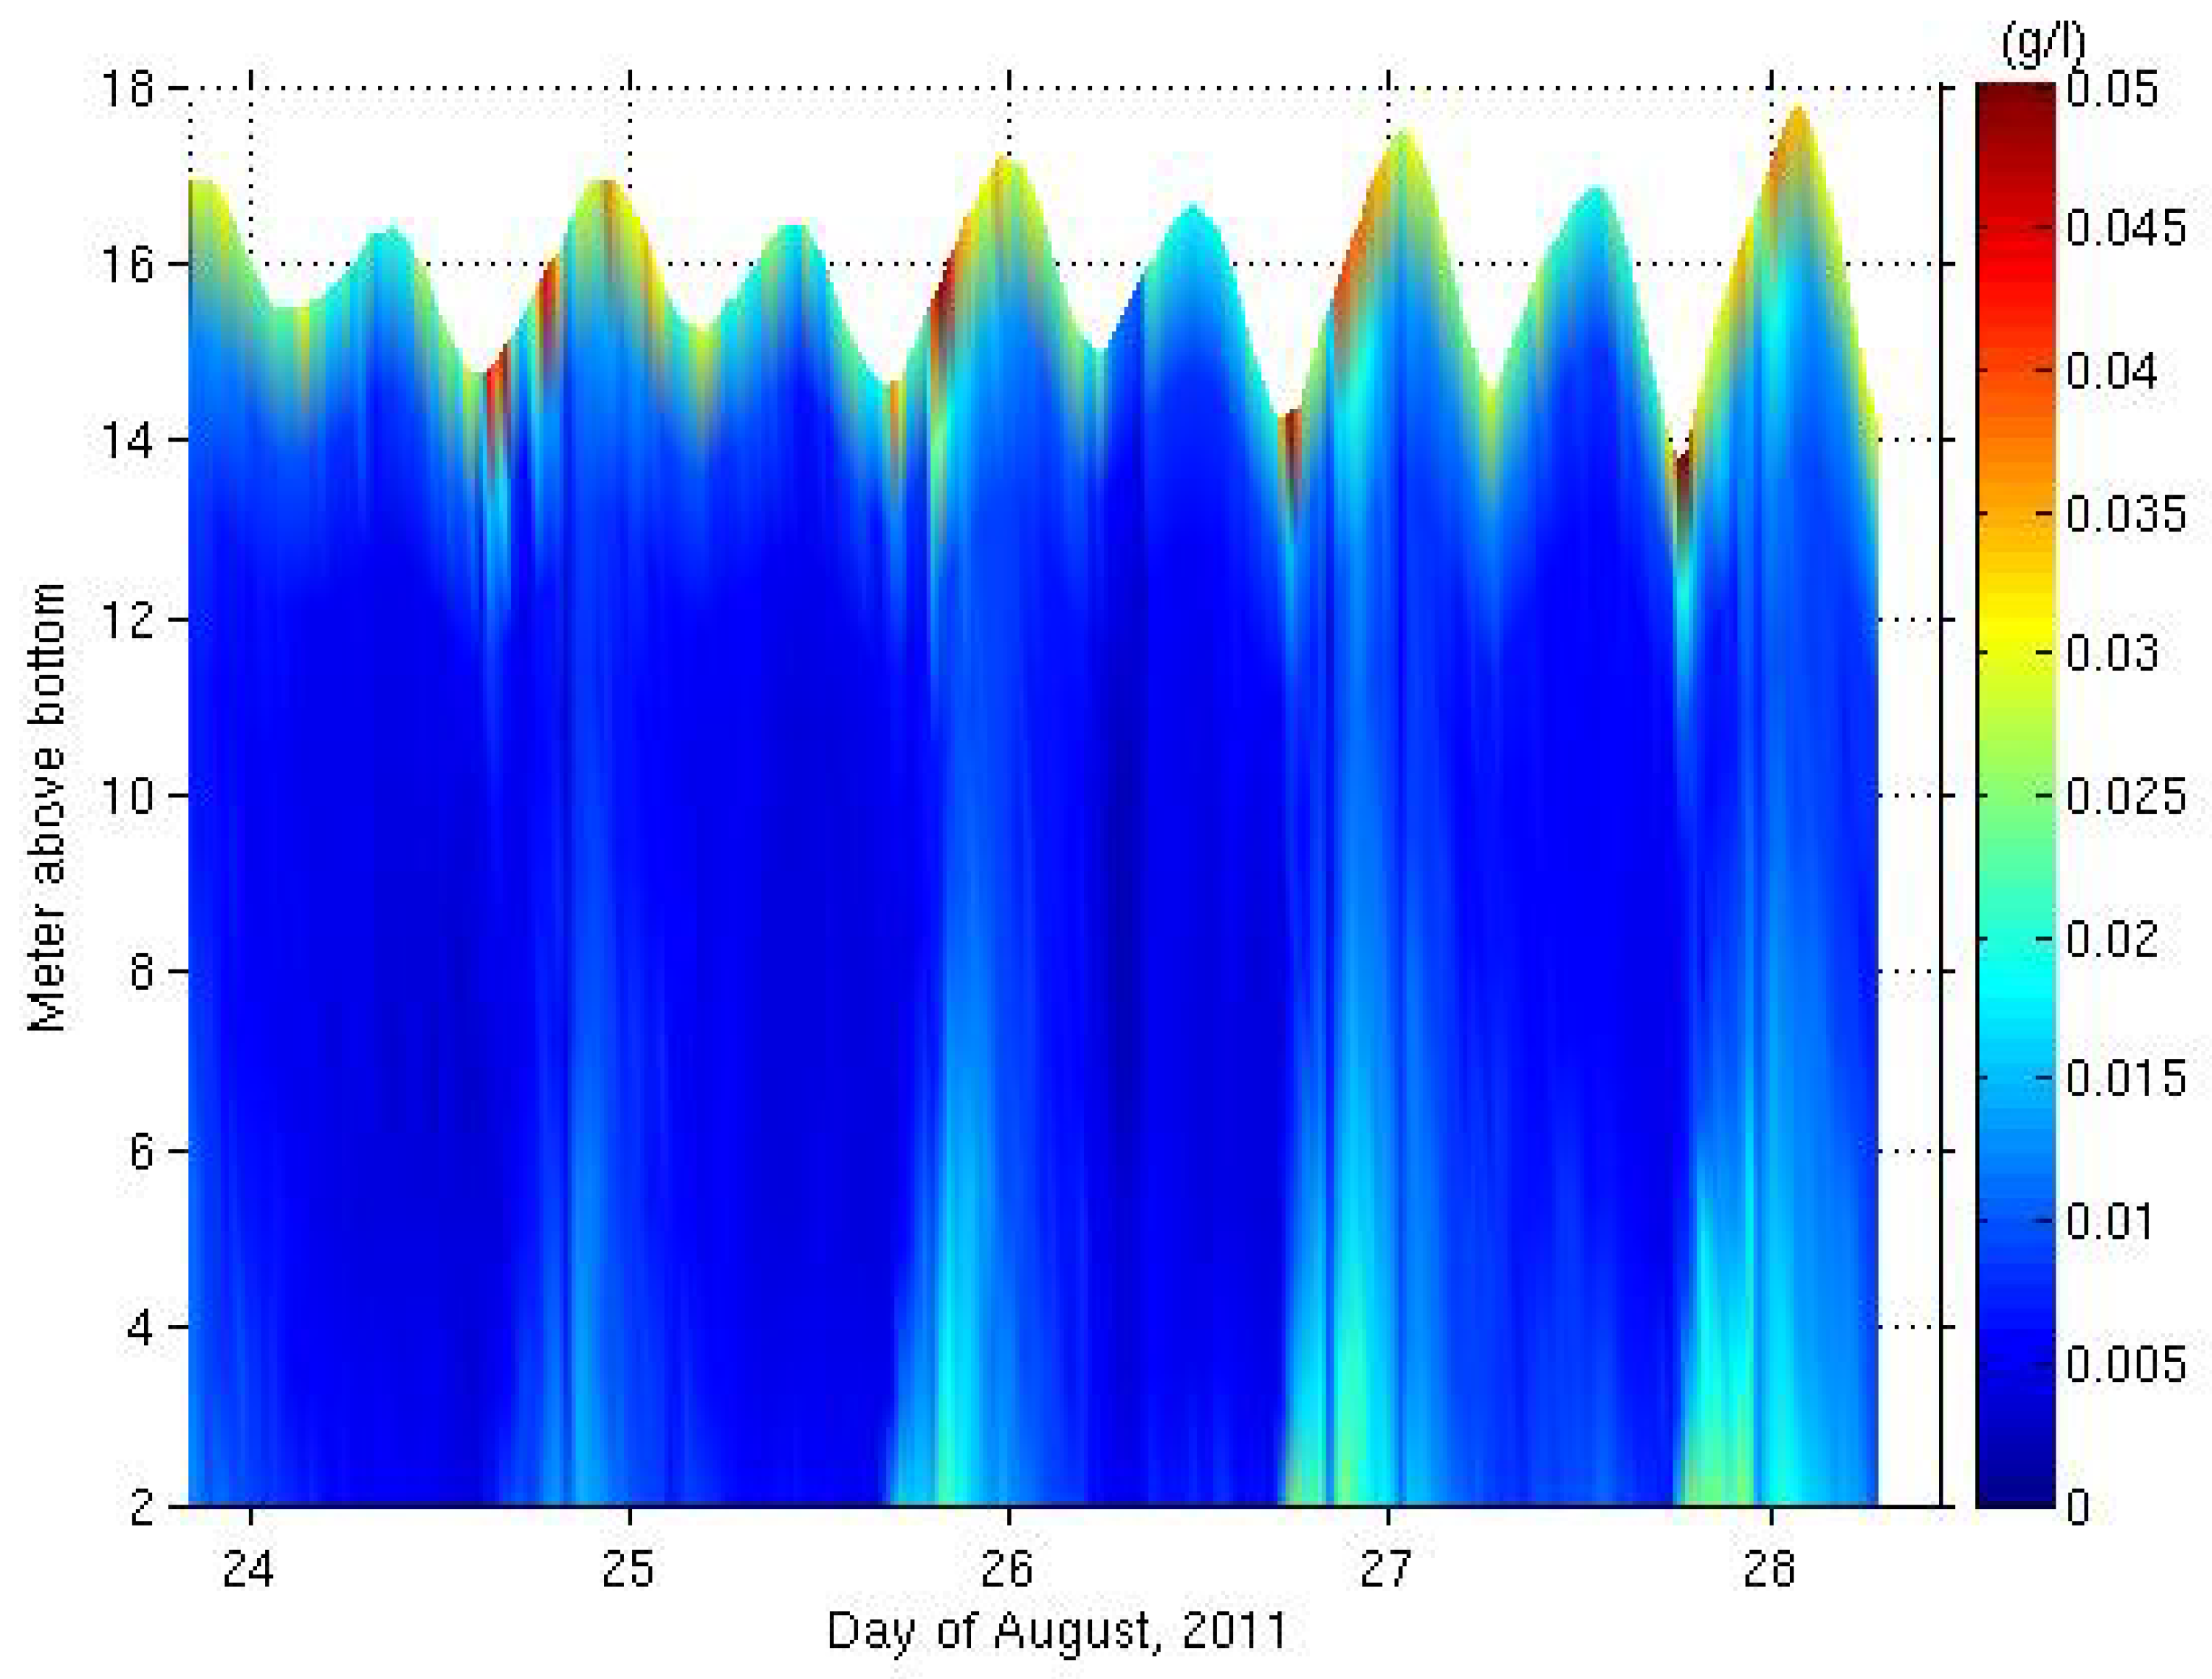
Figure 6 illustrates the time variation of SSC profiles during 24–28 August 2011. There were clearly high SSCs found in the surface layer. During the second low tide of each day that freshwater discharge occurred, higher SSCs were observed. It appeared to be due to direct input of suspended sediment discharged from the upstream. As no peaks of SSC were observed when there was no freshwater discharge, for example, during the first low tide of each day, it is evident that the freshwater discharge due to the opening of the dam gate was the main source of the suspended sediment in the surface layer. Another interesting aspect is that high SSC occurred after the freshwater discharge during the flood tide. It is likely that offshore-advected high SSCs during the low tide returned back into the estuary during the flood tide, resulting in high SSCs.
Below the surface layer, for example, around 10–12 mab, the SSC was mostly less than 0.01 g/L except during the second flood tide of each day. However, the SSC in the bottom layer suddenly increased and appeared to propagate into the higher layers whenever the surface freshwater was discharged. For example, SSC greater than 0.02 g/L (light green in Figure 6) reached above 6 mab during 25–27 August. In the previous section, we saw the rapid increase of bottom flow speed and stress-related terms (see Figure 4 and Figure 5), and this kind of change in the physical factors could induce erosion of bottom sediments if the bed of this area consisted of very fine sediment such as silt, clay, or mud. According to Kim et al. [24] and Williams et al. [13], the sediments of this estuary consist mainly of silt–clay mixtures in which silt is distributed in the shallow areas and clay exists in the relatively deep areas of the central estuary. Certainly, the bed shear stress observed during the freshwater discharge (see Figure 5) can resuspend the fines high into the water column (Figure 6). Furthermore, Bang et al. [25] simulated sediment transport by using a numerical model, and showed that the discharge-induced estuarine circulation could cause overall silt-size sediment deposition and sustained suspension of clay sediment.
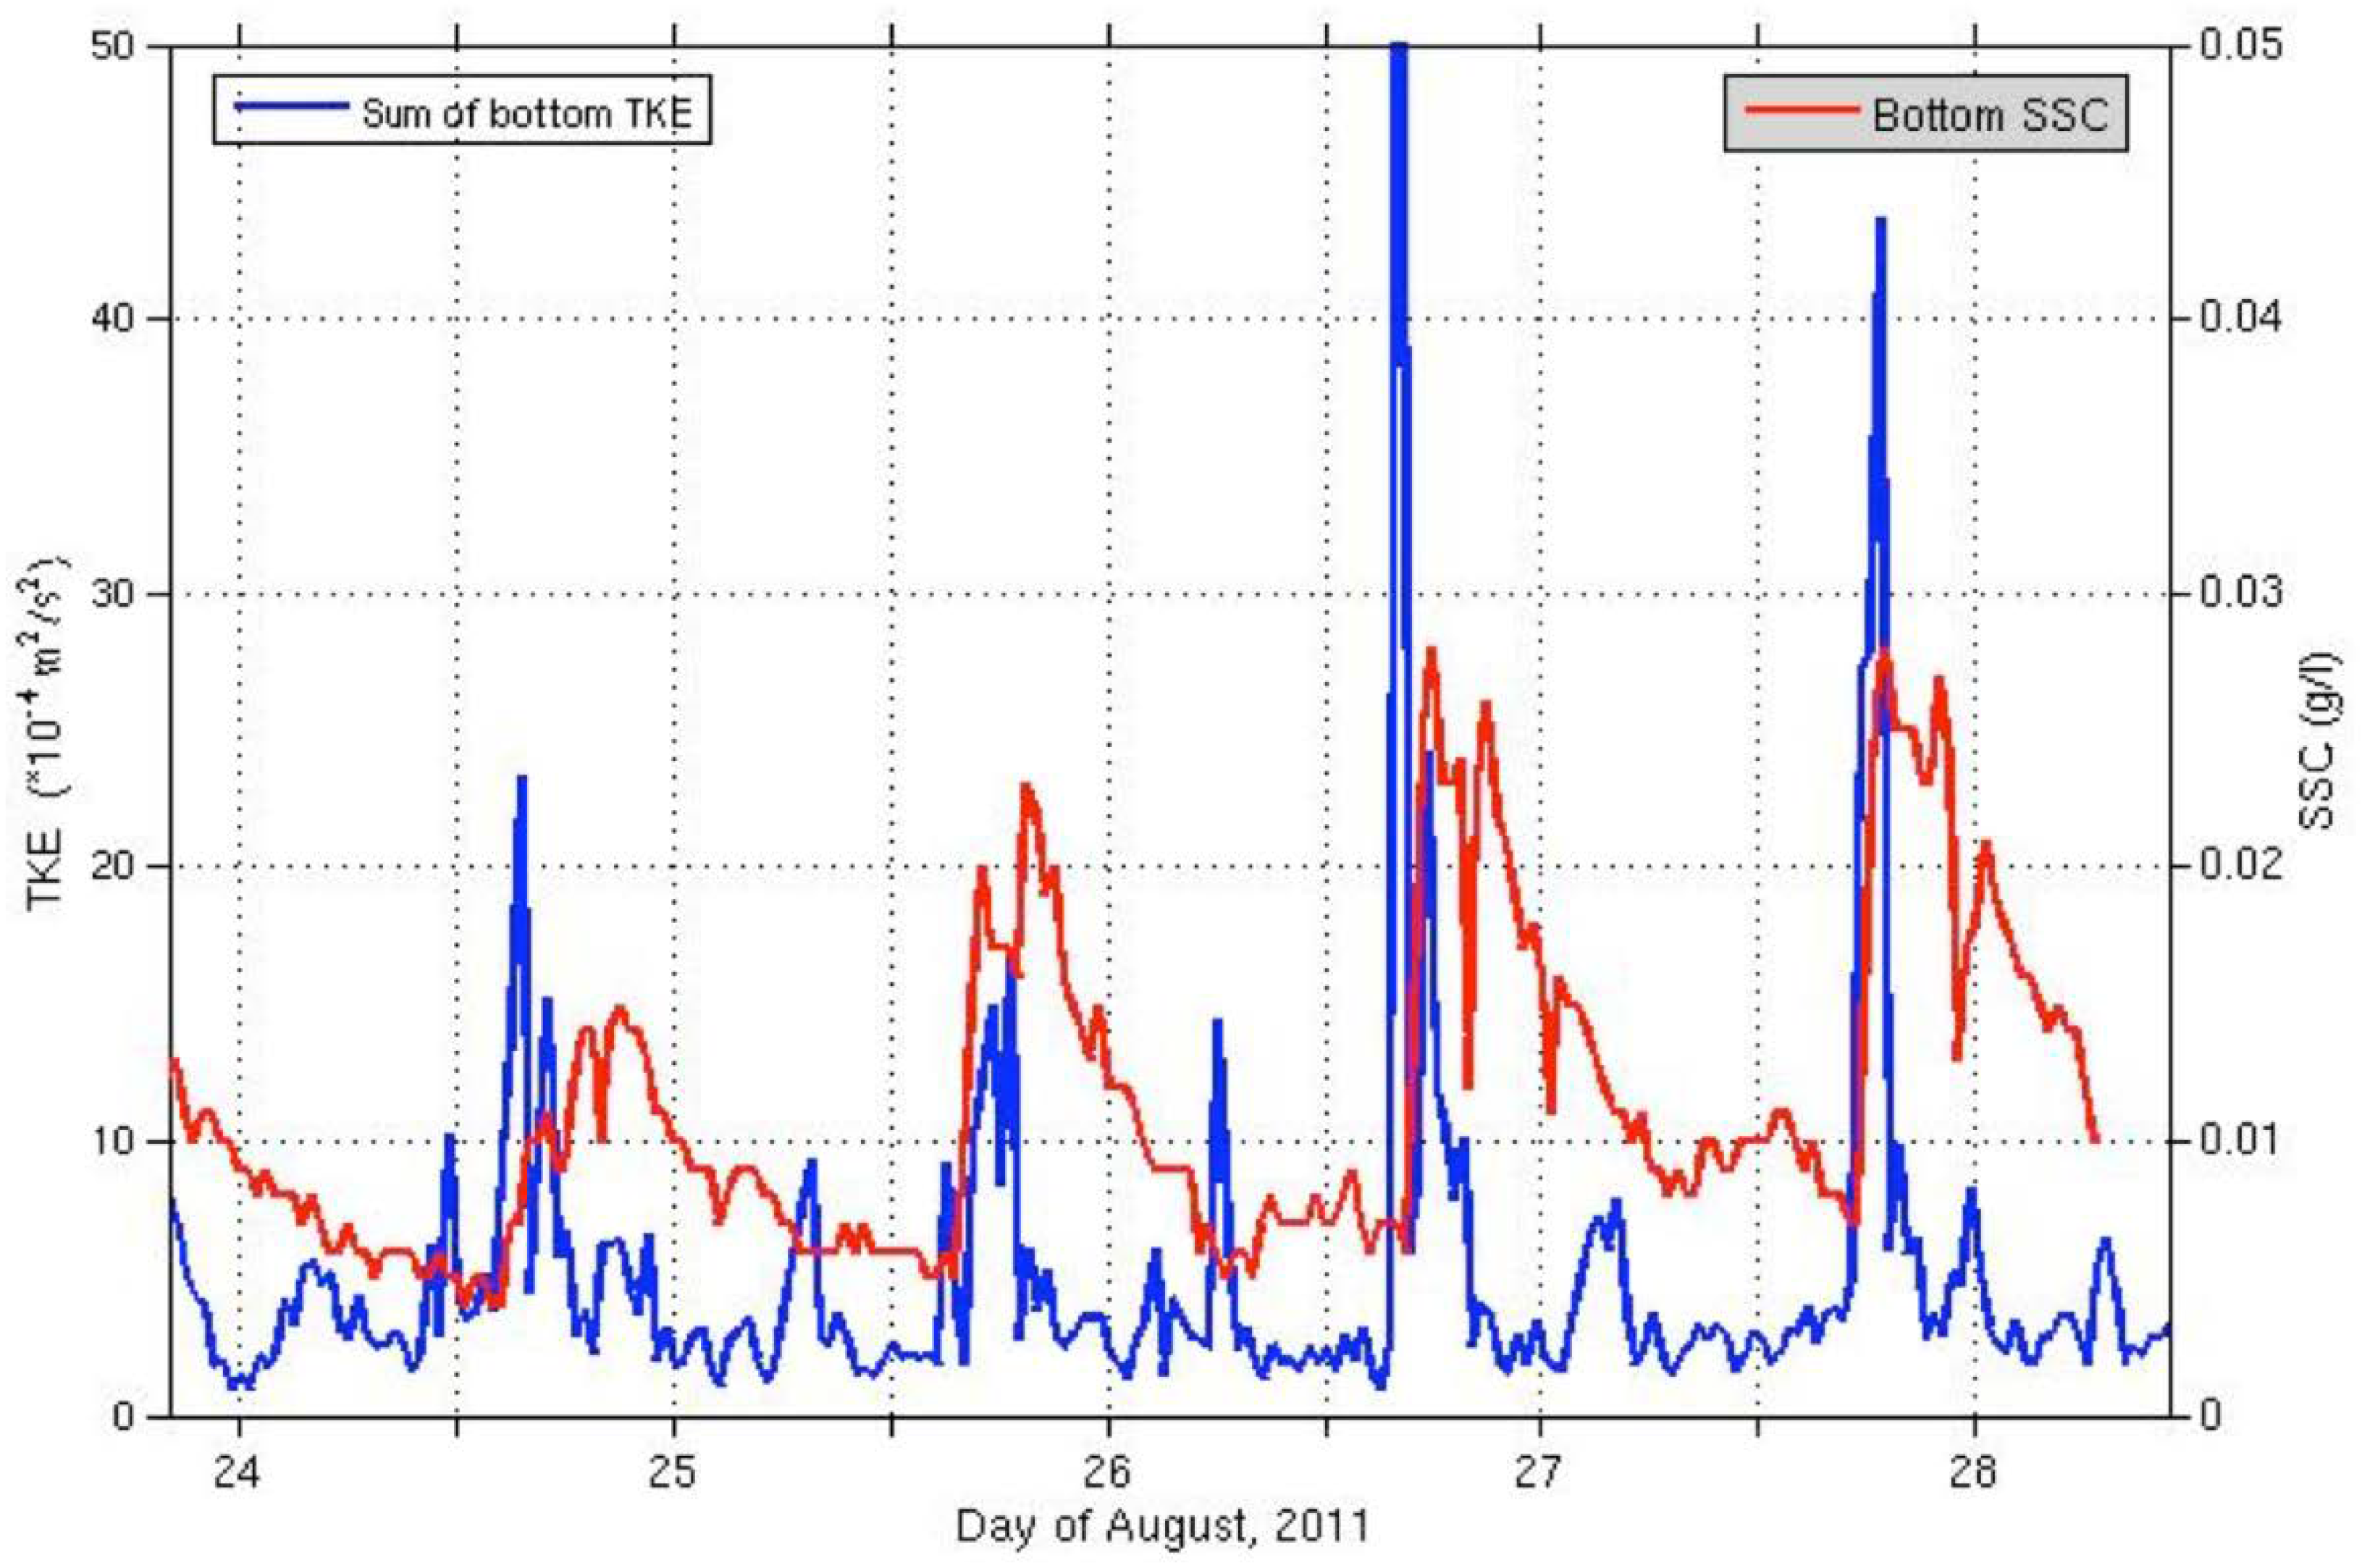
The time series of the TKE and SSC in the bottom boundary layer is illustrated in Figure 7. It is clear that the SSC rapidly increased and then gradually decreased until the next event occurred. The TKE exhibited a peak during each freshwater discharge and was proportional to the amount of freshwater discharge. Likewise, the SSC matched well with the amount of freshwater discharge. This kind of synchronization was repeated during every freshwater discharge. Thus, it could be generalized from this relationship that when the turbulent flow was intensified by the strong seaward surface flow, a relatively large amount of sediment could be resuspended from the bed.
4. Discussion
In estuaries altered by an estuarine dam, the opening of the dam gates results in a sudden release of a significant amount of freshwater to the river mouth area, resulting in changes to the physical and environmental conditions such as the formation of a strong surface current and sediment suspension. Measurement of the water currents during August 2011 in the Yeongsan estuary was carried out to investigate the changes in the vertical flow structure, the bottom turbulent flow, and the relationship between the bottom turbulent flow activity and the variation of suspended sediment concentration during the freshwater discharge.
The freshwater discharge due to dam gate opening could significantly affect the vertical structure of flow, inducing velocity shear and turbulent flow activity in the bottom boundary layer. During the period of no or weak discharge, the flow was mostly tidal motion and the vertical structure showed multiple layers. Cho et al. [11] showed that the spreading of warm freshwater discharged over the pre-existing surface water and the intrusion of warm saline water along the bottom from the open sea produced a multilayer structure, and the multilayer structure remained throughout the summer due to strong stratification and a weak tidal current in the Yeongsan estuary. During the freshwater discharge, however, a two-layer system developed with seaward flow in the surface and landward flow in the lower layer [7,26]. The thickness of the seaward flow was affected by the amount of freshwater, and the thickness of landward flow in the subsurface layer increased as the freshwater amount decreased. The magnitude of the residual flow was about 10 cm/s in the surface during the discharge periods, and became stagnant with weak, vertically variable horizontal flows during no discharge periods.
The bottom flow near the bed did not follow the general flood and ebb cycle in tidal motion. The seaward and landward flows were, however, formed after freshwater discharge, for example, on 25–27 August. This appears as strong evidence that the freshwater release due to opening of the dam gate affected the bottom flow strength. One more interesting aspect is that the reversed (landward) flow followed after the initial seaward flow. A two-layer circulation system was suggested wherein, following the water mass conservation principle, a landward flow could happen in order to recover the water overtransported to the sea by the suddenly intensified seaward flow which could cause additional seaward movement. Considering the concomitant vertical flow pattern of up and down, the upward flow above the bed was first shown when freshwater was released and then downward flow happened with a maximum magnitude of 0.01 m/s.
An impact of surface freshwater discharge to the bottom boundary layer was an intensification of the turbulent flow activity. As the bottom flow changed because of the surface freshwater discharge, the fluctuation of seaward and landward flow over a short period of time caused the stress to increase in the bottom boundary layer which was linked to an increase in TKE. The Reynolds stresses showed a symmetric structure in their vertical distribution and their magnitude rapidly increased during the freshwater discharge period with a maximum magnitude of 2 × 10⁻⁴ m2/s2. The TKE structure had the shape of an upside-down half-bell with an increase from the bed to 0.1–0.2 mab. Like the stresses, the magnitude of TKE was proportional to the amount of freshwater discharge and reached over 1 × 10⁻³ m2/s2 for the discharged period.
The SSC estimated from the acoustic backscatter signal of the four beams of the ADCP displayed high values in the surface and bottom layers. The high SSC in the surface happened after or during the freshwater discharge, indicating that the main source of suspended sediment was the upstream river water because there was not any other source of sediment during low tide and there was no such peak value of SSC when there was no freshwater discharged. The rapid increase of SSC in the bottom also happened after the surface freshwater discharge and it gradually propagated to the upper layer, and since it happened at the same time or after the sudden increase of the bottom TKE, the SSC near the bed was related to the intensified bottom turbulent flow that was the result of surface freshwater discharge due to the opening of the dam gate.
5. Conclusions
Using ADCP measurements in the altered Yeongsan estuary, we examined the flow in the water column and above the bed resulting from opening of the dam gate and the release of water with different properties (salinity, temperature, flow rate). The freshwater discharge was responsible for intensifying the two-layer circulation of offshore surface flow and landward bottom flow. The rapid and strong seaward surface flow affected the bottom flow structure, leading to sudden directional changes in both the horizontal and vertical flow. Responding to the freshwater discharge, the bottom turbulence also intensified rapidly, which in turn resuspended a large amount of sediment from the bed. The results of this study indicate that the surface freshwater discharge due to opening of the estuarine dam gate affects the behavior of water flow, bottom turbulence, and sediment transport in the altered Yeongsan estuary. Finally, it should be noted that since many estuarine dams have been constructed rapidly all over the world, for example, in the estuaries of the Senegal River, the Rhine-Muse rivers, and the Murray-Darling rivers, and that the construction of new estuarine dams is also under consideration, the results of this study could provide valuable insight into morphological change in estuarine environments with man-induced discrete freshwater discharges.
Author Contributions
Conceptualization, methodology, resources, writing—review and editing, G.-h.L.; formal analysis, investigation, validation, writing—original draft preparation, K.K. All authors have read and agreed to the published version of the manuscript.
Funding
This research was funded by Inha University Research Grant, 63142-01” and by the National Institute of Meteorological Sciences of the Korea Meteorological Administration project titled “Development of Marine Meteorology Monitoring and next-generation Ocean Forecasting System (KMA2018-00420).
Acknowledgments
The authors would like to thank anonymous reviewers for their constructive comments to make the high quality research.
Conflicts of Interest
The authors declare no conflict of interest.
References
- Dyer, R. Estuaries: A Physical Introduction, 2nd ed.; John Wiley & Sons Ltd.: Chichester, UK, 1997; pp. 1–32. [Google Scholar]
- Lee, G.; Dade, W.B.; Friedrichs, C.T.; Vincent, C.E. Spectral estimates of bed shear stress using suspended-sediment concentrations in a wave-current boundary layer. J. Geophys. Res. 2003, 108, 1–15. [Google Scholar] [CrossRef]
- Holmedal, L.E.; Myrhaug, D. Boundary layer flow and net sediment transport beneath asymmetrical waves. Cont. Shelf Res. 2006, 26, 252–268. [Google Scholar] [CrossRef]
- Wren, D.G.; Kuhnle, R.A.; Wilson, C.G. Measurements of the relationship between turbulence and sediment in suspension over mobile sand dunes in a laboratory flume. J. Geophys. Res. Earth Surf. 2007, 112, 1–14. [Google Scholar] [CrossRef]
- Byun, D.S.; Wang, X.H.; Holloway, P.E. Tidal characteristic adjustment due to dyke and seawall construction in the Mokpo Coastal Zone, Korea. Estuar. Coast. Shelf Sci. 2004, 59, 185–196. [Google Scholar] [CrossRef]
- Kang, J.W. Changes in tidal characteristics as a result of the construction of sea-dike/sea-walls in the Mokpo coastal zone in Korea. Estuar. Coast. Shelf Sci. 1999, 48, 429–438. [Google Scholar] [CrossRef]
- Shin, H.J.; Lee, G.; Kang, K.; Park, K. Shift of estuarine type in altered estuaries. Anthr. Coasts 2019, 170, 145–170. [Google Scholar] [CrossRef] [Green Version]
- Jung, T.S.; Kim, T.S. Prediction System of Hydrodynamic Circulation and Freshwater Dispersion in Mokpo Coastal Zone. J. Korean Soc. Mar. Environ. Energy 2008, 11, 13–23. [Google Scholar]
- Kang, J.W.; Kim, Y.S.; Park, S.J.; So, J.K. 3-D Applicability of the ESCORT Model—Simulation of Freshwater Discharge. J. Korean Soc. Coast. Ocean Eng. 2009, 21, 230–240. [Google Scholar]
- Park, L.H.; Cho, Y.K.; Cho, C.; Sun, Y.J.; Park, K.Y. Hydrography and circulation in the Youngsan river estuary in summer, 2000. J. Korean Soc. Oceanogr. 2001, 6, 218–224. [Google Scholar]
- Cho, Y.; Park, L.; Cho, C.; Tae, I.; Park, K. Multi-layer structure in the Youngsan Estuary, Korea. Estuar. Coast. Shelf Sci. 2004, 61, 325–329. [Google Scholar] [CrossRef]
- Park, H.B.; Kang, K.; Lee, G.; Shin, H.J. Distribution of Salinity and Temperature due to the Freshwater Discharge in the Yeongsan Estuary in the Summer of 2010. J. Korean Soc. Oceanogr. 2012, 17, 139–148. [Google Scholar]
- Williams, J.; Dellapenna, T.; Lee, G.; Louchouarn, P. Sedimentary impacts of anthropogenic alterations on the Yeongsan Estuary, South Korea. Mar. Geol. 2014, 357, 256–271. [Google Scholar] [CrossRef]
- Dahm, W.J.A.; Dimotakis, P.E. Measurements of entrainment and mixing in turbulent jets. AIAA J. 1987, 25, 1216–1223. [Google Scholar] [CrossRef] [Green Version]
- Van Rhee, C. Sediment Entrainment at High Flow Velocity. J. Hydraul. Eng. 2010, 136, 572–583. [Google Scholar] [CrossRef]
- Hoffmans, G.J.C.M. Jet scour in equilibrium phase. J. Hydraul. Eng. 1998, 124, 430–437. [Google Scholar] [CrossRef]
- Althaus, J.M.I.J.; De Cesare, G.; Schleiss, A.J. Fine sediment release from a reservoir by controlled hydrodynamic mixing Measurement devices. In Proceedings of the 34th World Congress of the International Association for Hydro-Environment Research and Engineering, Brisbane, Australia, 26 June–1 July 2011; pp. 1763–1770. [Google Scholar]
- Althaus, J.M.I.J.; Cesare, G.D.; Schleiss, A.J. Sediment Evacuation from Reservoirs through Intakes by Jet-Induced Flow. J. Hydraul. Eng. 2015, 141, 04014078. [Google Scholar] [CrossRef]
- Wohl, E.; Cenderelli, A. Sediment deposition and transport patterns following a reservoir sediment release. Water Resour. Res. 2000, 36, 319–333. [Google Scholar] [CrossRef]
- Foreman, M. Manual for Tidal Currents Analysis and Prediction; Institute of Ocean Sciences, Patricia Bay: Sidney, BC, Canada, 2004; pp. 2–30. [Google Scholar]
- Pawlowicz, R.; Beardsley, B.; Lentz, S. Classical tidal harmonic analysis including error estimates in MATLAB using T TIDE. Comput. Geosci. 2002, 28, 929–937. [Google Scholar] [CrossRef]
- Park, H.B.; Lee, G. Evaluation of ADCP backscatter inversion to suspended sediment concentration in estuarine environments. Ocean Sci. J. 2016, 51, 109–125. [Google Scholar] [CrossRef]
- Hansen, D.V.; Rattray, M. Gravitational Circulation in Straits and Estuaries. J. Mar. Res. 1966, 23, 104–122. [Google Scholar]
- Kim, Y.; Chang, J.H. Long-term Changes of Bathymetry and Surface Sediments in the dammed Yeongsan River Estuary, Korea, and Their Depositional Implication. Sea 2017, 22, 88–102. [Google Scholar]
- Bang, K.; Kim, T.I.; Song, Y.S.; Lee, J.H.; Kim, S.W.; Cho, J.; Kim, J.W.; Woo, S.B.; Oh, J.K. Numerical Modeling of Sediment Transport during the 2011 Summer Flood in the Youngsan River Estuary, Korea. J. Korean Soc. Coast. Ocean Eng. 2013, 25, 76–93. [Google Scholar] [CrossRef]
- Kim, Y.H.; Hong, S.; Song, Y.S.; Lee, H.; Kim, H.; Ryu, J.; Park, J.; Kwon, B.; Lee, C.; Khim, J.S. Seasonal variability of estuarine dynamics due to freshwater discharge and its influence on biological productivity in Yeongsan River Estuary, Korea. Chemosphere 2017, 181, 390–399. [Google Scholar] [CrossRef] [PubMed]
Figure 1.
Study area and location of current meters in Yeongsan estuary, Korea. Black dots mark the location of two current meters placed in August 2011.
Figure 1.
Study area and location of current meters in Yeongsan estuary, Korea. Black dots mark the location of two current meters placed in August 2011.

Figure 2.
Time series of the freshwater discharge and water flow. (a) Freshwater discharge and water depth, (b) u-component of current velocity, (c) v-component of current velocity. In (b,c), negative values indicate west- and south-directed velocities, respectively.
Figure 2.
Time series of the freshwater discharge and water flow. (a) Freshwater discharge and water depth, (b) u-component of current velocity, (c) v-component of current velocity. In (b,c), negative values indicate west- and south-directed velocities, respectively.

Figure 3.
Change of vertical structure of the residual (tide-removed) flow: (a) east–west component, (b) north–south component, and mean flow structure of each period such as (c) high (i.e., Q > 4 × 10⁷ ton on 8–11 August), (d) low (i.e., Q < 1 × 10⁷ ton on 12–15 August), and (e) no freshwater discharge (20–22 August). Two profiles on the right side of (a,b) are the residual over the entire period. The negative values on (a,b) indicate west- and south-directed residual velocities, respectively.

Figure 4.
Time variation of the flow structure of the bottom boundary layer with freshwater discharge: (a) sea level and freshwater discharge, (b) east–west component, (c) north–south component, and (d) vertical component. The solid line in each panel indicates the sea surface level variation pattern and the scale was adjusted.

Figure 5.
Reynolds stress and turbulent kinetic energy profiles near bed: (a) east–west component, (b) north–south component, and (c) turbulent kinetic energy (TKE). Black and white solid lines in the left panel indicate the sea level variation.
Figure 5.
Reynolds stress and turbulent kinetic energy profiles near bed: (a) east–west component, (b) north–south component, and (c) turbulent kinetic energy (TKE). Black and white solid lines in the left panel indicate the sea level variation.

Figure 6.
Variation of suspended sediment concentration during 24–28 August 2011.

Figure 7.
Comparison between the turbulent kinetic energy (TKE) and suspended sediment concentration (SSC) changes in the bottom boundary layer.
Figure 7.
Comparison between the turbulent kinetic energy (TKE) and suspended sediment concentration (SSC) changes in the bottom boundary layer.


Table 1.
Measurement scheme for the current meters in Yeongsan estuary.
| Instrument | Location | Sampling Rate/Interval/ Period | Bin Size/ Blank Dist./ Orientation | Remarks |
|---|---|---|---|---|
| ADCP Sentinel (RDI 1200kHz) | 34°47′13.47″ N 126°25′48.88″ E | 2 Hz/30 min/ 5–28 August 2011 | 0.25 m/0.38 m/ Up-looking | Frame height: 0.7 m |
| AquaDoppHR (AQP 9116) | 34°47′15.05″ N 126°25′41.85″ E | 4 Hz/30 min/ 23–29 August 2011 | 0.05 m/0.40 m/ Down-looking |
© 2020 by the authors. Licensee MDPI, Basel, Switzerland. This article is an open access article distributed under the terms and conditions of the Creative Commons Attribution (CC BY) license (http://creativecommons.org/licenses/by/4.0/).
Share and Cite
MDPI and ACS Style
Kang, K.; Lee, G.-h. Man-Induced Discrete Freshwater Discharge and Changes in Flow Structure and Bottom Turbulence in Altered Yeongsan Estuary, Korea. Water 2020, 12, 1919. https://doi.org/10.3390/w12071919
AMA Style
Kang K, Lee G-h. Man-Induced Discrete Freshwater Discharge and Changes in Flow Structure and Bottom Turbulence in Altered Yeongsan Estuary, Korea. Water. 2020; 12(7):1919. https://doi.org/10.3390/w12071919
Chicago/Turabian StyleKang, KiRyong, and Guan-hong Lee. 2020. "Man-Induced Discrete Freshwater Discharge and Changes in Flow Structure and Bottom Turbulence in Altered Yeongsan Estuary, Korea" Water 12, no. 7: 1919. https://doi.org/10.3390/w12071919
Note that from the first issue of 2016, this journal uses article numbers instead of page numbers. See further details here.