Source Apportionment and Integrated Assessment Modelling for Air Quality Planning


Department of Mechanical and Industrial Engineering (DIMI), University of Brescia, via Branze 38, 25123 Brescia, Italy
*
Author to whom correspondence should be addressed.
Electronics 2020, 9(7), 1098; https://doi.org/10.3390/electronics9071098
Submission received: 26 May 2020
/
Revised: 29 June 2020
/
Accepted: 30 June 2020
/
Published: 5 July 2020
(This article belongs to the Special Issue Modeling and Control of Environmental Systems: Theory and Application)
Abstract
:In Northern Italy a large fraction of the population is exposed to PM10 and PM2.5 concentrations that exceed the European limit values and the stricter WHO air quality guidelines. For this reason, in 2017 four Regions (Piemonte, Lombardia, Veneto, and Emilia Romagna) and the national Ministry of the Environment adopted a set of joint measures, namely the “Po Basin air quality plan”. The plan mainly tackles emission from road transport, residential heating, and agriculture. Air quality plans at regional and local scale are usually implemented defining a set of emission abatement measures, starting from experts’ knowledge. The aim of this work is to define a methodology that helps decision makers in air quality planning, combining two different approaches: Source-Apportionment techniques (SA) and Integrated Assessment Modelling (IAM). These techniques have been applied over a domain in Northern Italy to analyze the contribution of emission sources on PM10 concentration and to compute an optimal policy, obtained through a multi-objective optimization approach that minimizes both the PM10 yearly average concentration and the policy implementation costs. The results are compared to the Po Basin air quality plan impacts. The source-apportionment technique and the IAM optimization approach show intervention priorities in three main sectors: residential heating, agriculture, and road transport. The Po Basin air quality plan is effective in reducing PM10 concentrations, but not efficient, as a matter of fact the cost-effective policy at the same cost has a higher impact on air quality and on greenhouse gases emissions reduction.
1. Introduction
Air pollution is a serious threat to human health [1], and in general a sanitary problem causing high social costs related to morbidity and mortality, not only due to medical treatment but also to loss in productivity [2]. In 2017, the 44% of the European population was exposed to PM10 concentration exceeding the WHO guidelines values [3]. In May 2018, Italy was referred to the EU Court of Justice for high levels of particulate matter (PM) and failure in controlling nitrogen dioxide (NO2) concentrations in the past years. The air quality burden in Italy is mainly located in the Po Basin area, due to meteorological and orographic conditions that do not allow the dispersion of pollutants in atmosphere and facilitates secondary pollutant formation processes. In 2017, the annual limit value of 40 µg/m3 for NO2 concentration has been exceeded in the 10% of the Italian monitoring stations, mainly located in large urban areas in northern Italy (but also Toscana, Umbria, Lazio, and Campania). Exceedances of the European limit value for yearly average PM2.5 concentration have been measured in 34 air quality monitoring stations in Italy, all of them located in the Po Basin [4]. Even if a decreasing trend in PM10 and PM2.5 concentration has been registered in the past 10 years, the population is still exposed to air pollution exceeding the European values.
In Italy, although the regional administrative level is responsible for air pollution control and planning, some efforts have been made in the past years to study the long-range transport typical of this area and implement inter-regional plans. In 2013 a first agreement was signed by eight regions and five ministries that aimed at the implementation of coordinated measures to tackle air pollution, but, despite these attempts, the European air quality standards were not reached [5,6]. Therefore, in 2017 a new Po Basin agreement was developed between the four largest and most populated regions in Northern Italy (Piemonte, Lombardia, Veneto, and Emilia Romagna), the Ministry of the Environment, and the Ministry of Agriculture [7]. The project “Po Regions Engaged to Policies of Air” (PREPAIR) also aims at implementing the measures foreseen in the regional plans and in the Po Basin agreement at a larger scale to reinforce the sustainability and effectiveness of results. In 2016 the European Directive 2284 was issued (National Emission Ceilings Directive (NECD)). It defines the reduction of national emissions of NOx, SO2, VOC, and PM2.5 that each member state must reach in 2020 and 2030 [8]. The directive has been transposed in Italy with the decree 81/2018, and the Italian National Plan for atmospheric pollution control is still in the scoping phase [6].
The implementation of a plan consists of the identification of the emission sources that contribute to air pollution and, therefore, the definition of intervention priorities. Furthermore, measures to reduce air pollution can be identified following a cost-effectiveness approach [5,9,10,11]. The first task can be performed by means of source apportionment (SA) techniques. SA techniques include receptor-oriented models and source-oriented models:
- Receptor-oriented models identify the source measuring ambient concentration of pollutants and their components at specific sites (receptors);
Because of northern Italy complex meteorology and orographic condition, SA techniques have been often used to understand PM10 composition and formation. In Reference [14], positive matrix factorization was used to obtain PM10 source apportionment in the city of Milan highlighting the important contribution of secondary pollutants. Source-oriented SA have been applied using a Chemical Transport Model (CTM) at an urban receptor by [15] to perform both a sectorial SA, identifying the emission activities that contribute to pollutants concentration, and a spatial SA to understand where the precursors are emitted.
The definition of a plan also includes budget constraints and the need to evaluate human health impacts due to pollutants exposure, greenhouse gases (GHG) emissions, and energy savings. Integrated assessment modelling systems are useful tools addressed to environmental policy makers that are in need to identify efficient emission abatement measures. These models bring together interdisciplinary knowledge: emission inventories, abatement measures databases with implementation costs and pollutant removal efficiencies, source-response surrogate models, and health impacts models [9]. The Greenhouse gas - Air pollution Interactions and Synergies model (GAINS)was used to find efficient emission reduction policy at European scale using end-of-pipe emission abatement technologies [16], therefore it was adapted at national scale in different member states [17]. The Regional Integrated Assessment Tool (RIAT+) is an air quality integrated assessment model [11] used in different areas in Europe [18]. In Reference [19] the Multi-dimensional Air Quality model (MAQ) is presented, an IAM that includes energy efficiency and fuel switch measures in the decision problem, addressing the need to implement win-win measures that consider both energy consumption, therefore GHG emissions, and air pollution control.
In this work the uses of both source apportionment technique and IAM is presented as a valuable methodology to implement an air quality plan, the results are compared to the Po Basin Plan. The SA technique aims at: (1) studying the current air quality situation in the Po Basin, (2) identifying secondary pollutant formation and (3) defining the intervention priorities to reduce emissions. IAM in optimization approach is used to study the impacts of a cost-effective policy and compare them to the Po Basin Plan (PBP) ones. The PBP is implemented in a scenario approach to compute impacts on air quality, costs, GHG emissions and human health, and therefore understand if the plan gives an effective response to SA results.
2. Materials and Methods
In this Section, the methodology and the models used to implement a combined analysis of an air quality plan are discussed. In particular, the PBP is evaluated through a scenario analysis and then it is compared to the results of the source-apportionment analysis and to an optimal policy (OP) obtained, through an optimization approach, at the same cost of the PBP.
Air quality integrated assessment modelling can be implemented following two different approaches, scenario analysis and optimization [20,21]. In the scenario analysis impacts are evaluated considering the emission reduction due to the application of measures defined a-priori by experts or applying source-apportionment techniques. The optimization approach implements cost-effectiveness or multi-objective optimization, where the measures (decision variables) are iteratively modified to minimize an objective function composed by multiple indexes.
2.1. Comprehensive Air Quality Model with Extension (CAMx): Source Apportionment Analysis
The source-apportionment analysis is performed using the modelling chain WRF-CAMx composed by the Eulerian photochemical transport model CAMx, developed by ENVIRON, coupled with the Weather and Research Forecasting model (WRF), developed by the National Oceanic and Atmospheric Administration (NOAA) and National Centers for Environmental Prediction (NCEP).
The open source CAMx model is a CTM developed to simulate primary and secondary pollutants transport and concentration at different scales. The spatial resolution is defined separately for the horizontal grid and the vertical layers. The latter is flexible because the vertical layers height can vary in space and time, therefore the model can be adapted to different meteorological models, in this case WRF was used. CAMx simulates the emission, dispersion, chemical reaction and removal of pollutants, by moving the Eulerian continuity equation forward in time for each chemical species. The continuity equation is numerically solved for each time step by means of a splitting operator approach: the total concentration, C, is computed by sequentially solving the partial differential equation systems, that express the contribution of each major process (emission, advection, diffusion, chemistry, and removal) within each grid cell [22].
For the gaseous phase CAMx implements the Carbon Bond CB05 mechanism with 156 chemical reactions and 51 species [23], using the chemical solver based on the Euler backward iterative method (EBI) [24]. Chemistry and physics of particulate matter are handled by a module that implements the Regional Acid Deposition Model (RADM). The Secondary Organic Aerosol Production module (SOAP) [25] and the ISORROPIA thermodynamic module [26] implement respectively the organic aerosol-gas partitioning and oxidation chemistry and the partitioning of inorganic aerosol constituents (sulfate, nitrate, ammonium, and chloride) between the gas and aerosol phases. Particulate and Ozone Source Apportionment Technology (PSAT/OSAT) are implemented in CAMx. They allow to quantify emission sectors contributions in the PM concentration simulation. In particular, PSAT was developed to apply ozone and nitrogen oxides source apportionment methodology (previously developed in OSAT) to PM transport and formation [27]. Primary PM source apportionment can be modelled by linear relationships between sources and receptors, but the linearity assumption cannot be extended to the secondary PM formation. CTMs are suitable to simulate primary and secondary pollutants concentration. Usually the pollutants concentration is a non-linear combination of impacts of all emission sources, so the integration with PSAT module using a reactive tracer approach allows to track also secondary PM, requiring more than one tracer family [28].
2.2. Multi-Dimensional Air Quality System (MAQ): Scenario Analysis and Multi-Objective Optimization
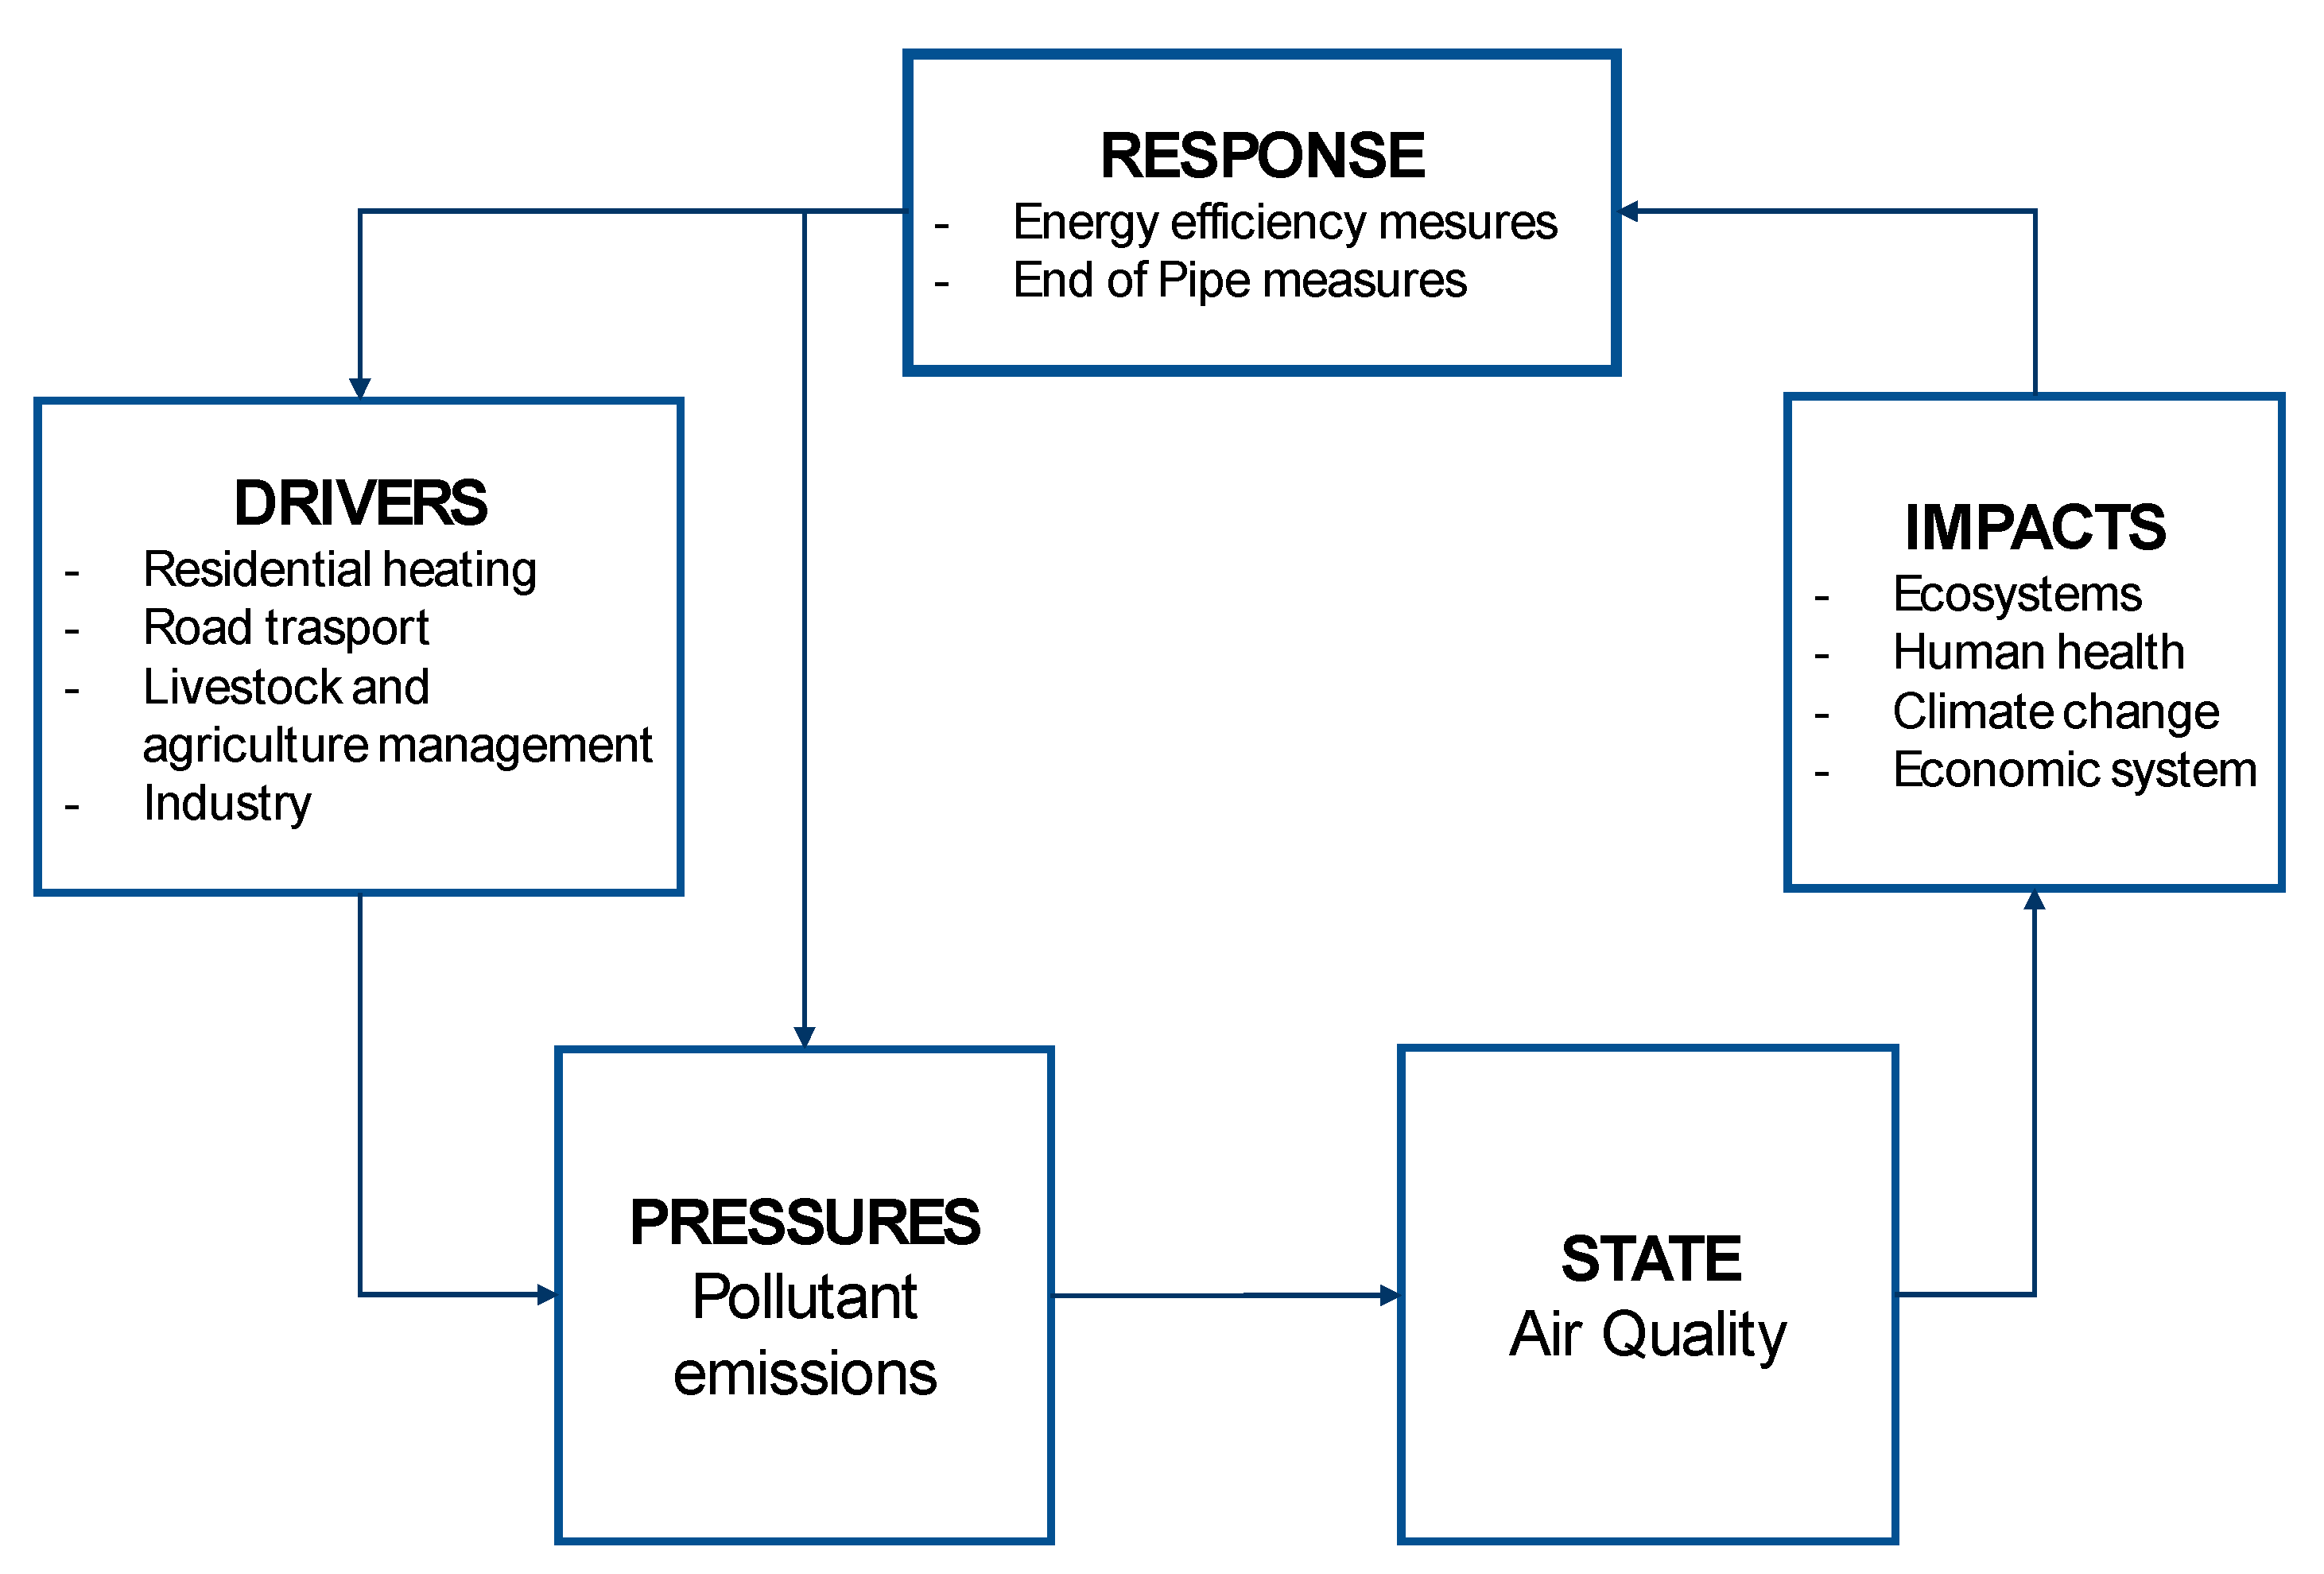
The MAQ model is a decision support systems (DSS) aimed at helping environmental policy makers, often with a budget constraint, in the selection of air quality control measures. The model also evaluates impacts on human health and greenhouse gases emissions. MAQ is an Air Quality IAM system that implements the Drivers-Pressures-State-Impacts-Responses framework (DPSIR) adopted by the European Environmental Agency [29]. In Figure 1 is represented the causal scheme used in MAQ. Responses to air pollution impacts are the emission abatement measures:
- End-of-pipe technologies reduce the pollutant emission right before it is discharged in atmosphere without fuel or energy variation, meaning they are reducing the pressures;
- Energy measures include energy efficiency technologies that reduce the energy consumption by varying the level of a human activity (driver) that is causing the emissions and fuel switch measures that substitute a fuel with a more efficient one.
The MAQ model can be applied to perform scenario analysis, cost-effectiveness optimization, and multi-objective optimization. In the optimization approaches, the decision variables of the problem are the responses, meaning the application rates of emission abatement measures, that can be both end-of-pipe technologies and energy efficiency measures. The decision problem can be formalized as a minimization of an objective function depending on the set of the decision variables .
In the multi-objective approach, the objective function is composed by two indexes, an Air Quality Index (AQI) and a policy implementation cost index (C). The cost-effectiveness approach is a specific case where the cost is fixed, becoming a constrain, and only the AQI is minimized. The set of optimal policies is computed by varying iteratively the application rates of the measures to obtain the minimum AQI at the minimum cost, satisfying the constraints. The MAQ optimization approach implementation and the constraints are reported in [19]. In this study MAQ is also used in scenario mode to assess the impacts of the PBP.
In scenario analysis, the Air Quality Indexes (e.g., PM10 and NO2 yearly average concentration) are computed defining a priori the decision variables, the application of emission abatement measures (). The problem is formalized as follows:
The variation of AQI due to the application of the measures is defined as:
The link between the variation of emission and the AQI, , is computed by MAQ using an artificial neural network based surrogate model, identified as presented in [30]. describes the emission abatement due to the application of end-of-pipe measures, energy efficiency measures, or fuel switch measures. The emission of a pollutant depends on the emission factor of each activity, the activity level that can be modified by energy efficiency measures, the pollutant removal efficiency of the end-of-pipe measures and its application rate. If energy efficiency measures are applied, emission computation becomes non-linear. Emissions are computed for NO2, ozone, and PM precursors (NOx, VOC, NH3, PM, and SO2) and for greenhouse gases (in terms of equivalent CO2). Description of the methodology used to compute the emissions is reported in [19].
The MAQ model also estimates health impacts, applying the ExternE methodology [31]. Health impact indicators are computed for each cell using the concentration–response relations of each health impact and considering the amount of population exposed to air pollution. The population cohorts considered depend on the health impacts analyzed: adults, children, over 65 years old, asthmatics, and population over 30. External costs, in terms of morbidity and mortality, are computed, multiplying the health impact indicator for its economic value [32].
3. Case Study
The models described in Section 2 are used to implement source apportionment, scenario analysis and multi-objective methodologies. The methodology is applied to study the intervention priorities in the Po Basin and define an efficient policy, with a focus on Lombardia Region. In this work, the source-apportionment technique using CAMx/PSAT is applied to assess the current air quality situation and evaluate the emission sources in the Po Basin domain and their contribution to secondary pollutant formation processes (O3, PM10 and NO2). Furthermore, both integrated assessment approaches, scenario analysis and multi-objective optimization, are evaluated using the MAQ model. The Po Basin Plan, defined by four regions in Northern Italy and the Ministry of the Environment, is assessed through scenario analysis: the measures defined in the plan are applied over the domain and impacts are computed in terms of pollutants concentrations, equivalent CO2 emissions, health impacts, costs, and savings. Then, a multi-objective decision problem has been solved with MAQ, minimizing both PM10 yearly average concentration and policy implementation cost. The OP, described in the results, is the one obtained at the same cost of the PBP.
In this Section, data used in the CAMx simulation are described and results of the source apportionment are discussed. Furthermore, the implementation of the Po Basin Plan in the MAQ model is detailed, including all the assumptions made. Impacts resulting from the scenario analysis approach and the multi-objective optimization are then analyzed and compared.
The CAMx source apportionment domain covers a 540 km2 by 360 km2 area with a 6 km2 by 6 km2 spatial resolution. The simulation is performed for year 2011, the year was selected because the scarce precipitations that allow stagnation and formation of pollutants in atmosphere. The meteorological inputs are generated for the reference year using the WRF model, applied on two one-way nested domains: European scale and Po Basin scale. Emission input are provided by the INEMAR emission inventories for each region [33], detailed for CORINAIR macro-sectors [34]. Where emissions were not available from the regional inventories (cells outside Italy), European emission inventory EMEP is used. The emission data include VOC, CO, NOx, NH3, SO2, PM10, and PM2.5 annual emissions for each cell of the domain. For each emission activity in the domain, monthly, daily, and hourly pollutant specific temporal profiles are applied for different emission sources, seasons of the year and types of day (weekdays, days before holiday, and holidays). Chemical characterization of VOC and physicochemical characterization of PM is performed using chemical and granulometric speciation profiles, dependent on the emission activity.
Two types of pollutant emissions are given in input to CAMx:
- Gridded emission at the soil level (first 10 m CAMx vertical layer): they include non-punctual industrial sources, mobile sources (road traffic and other vehicles), residential and commercial heating, agricultural, and biogenic emissions;
- Punctual emission sources of industrial stacks: they are included considering plume temperature, flow rate, height, and diameter of the chimney.
In this work eight SA groups are considered:
- energy production;
- residential heating;
- industrial processes, that includes CORINAIR macrosectors 3, 4 and 5;
- solvent use;
- mobile sources, that includes both road and non-road transport (macrosectors 7 and 8);
- waste treatment;
- agriculture;
- other emissions (that includes biogenic emissions).
Furthermore, boundary condition (BC) effects are defined as separated SA groups. BC and biogenic emissions cannot be manipulated, meaning reduced with an air quality plan. The validation of CAMx simulation is performed using concentration of PM10, NO2, and O3 measured by the air quality monitoring network, stored in ARPA Lombardia and BRACE Sinanet databases [33,35]. Validation results in terms of correlation, normalized mean error, and normalized mean absolute error are described in [22].
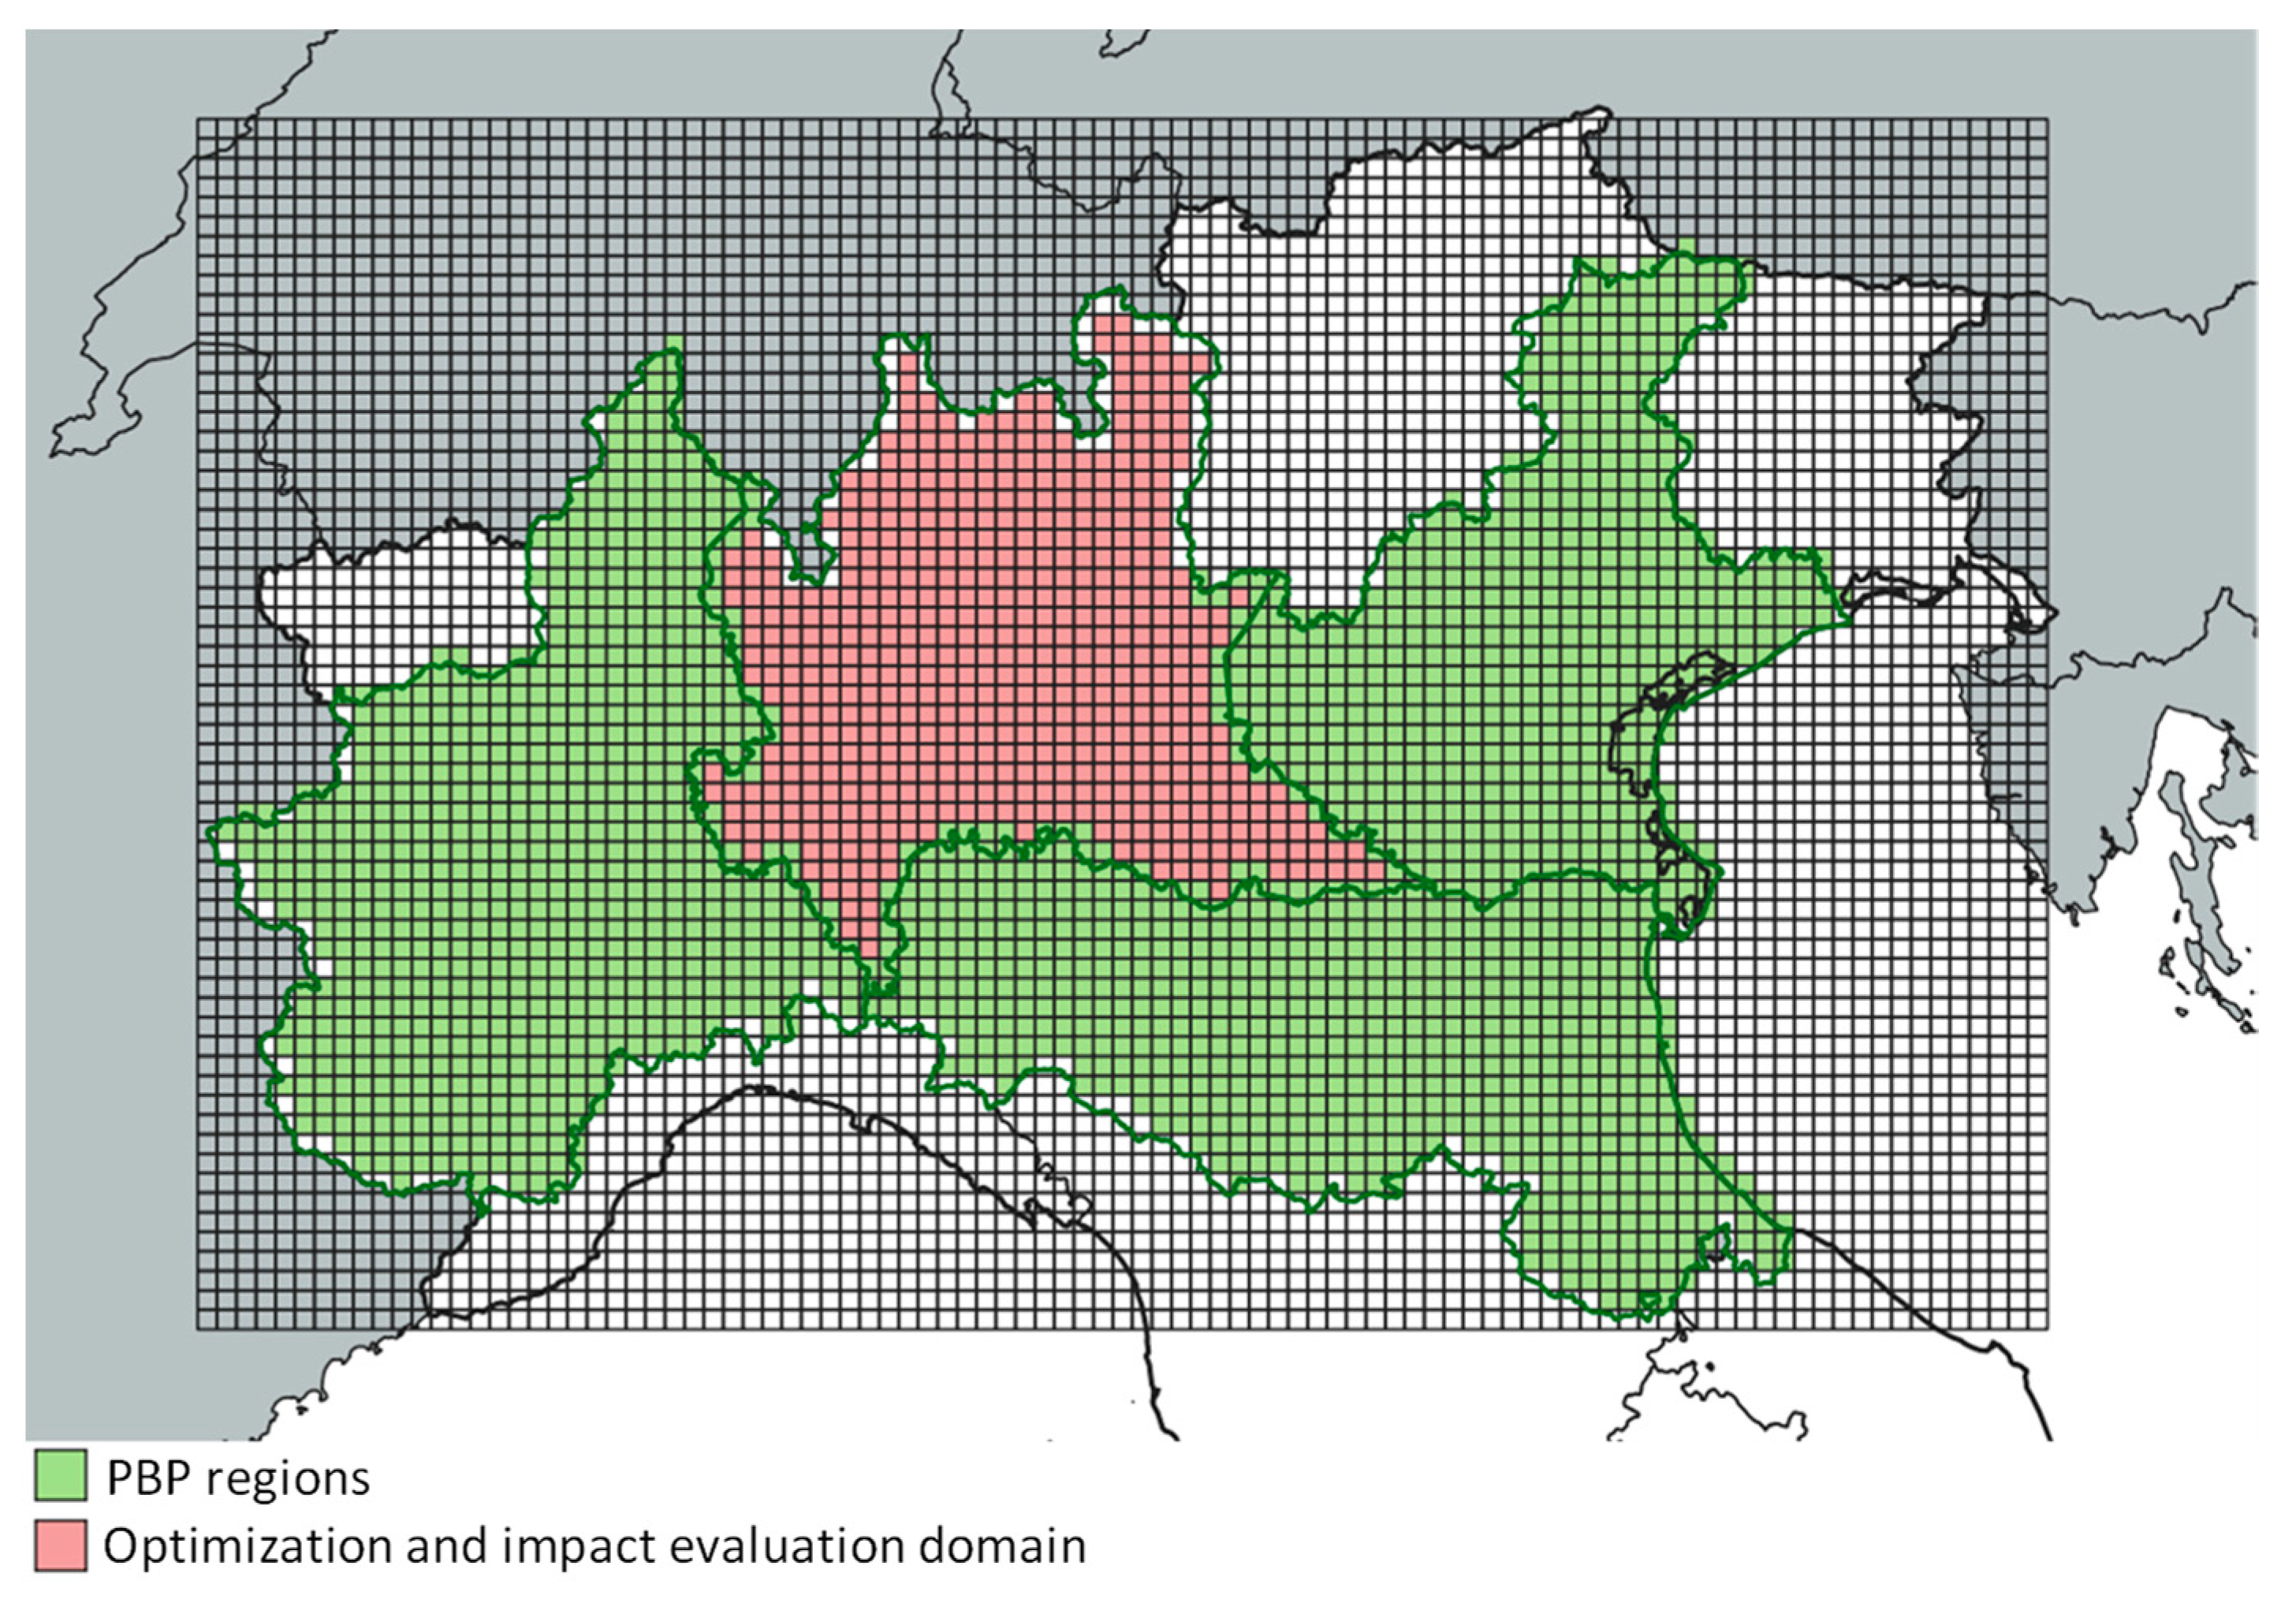
MAQ model simulation domain is composed by 5890 cells 6 km2 by 6 km2. Emission reduction due to the application of the PBP are applied in all the four regions involved in the plan, impacts are evaluated only in Lombardia region, as shown in Figure 2. Two measures databases are used in input: The end-of-pipe measures database is derived from GAINS model control options [16], the energy measures database is based on VALUTA project data [36].
4. Po Basin Plan Scenario Implementation in MAQ
The PBP does not provide exactly quantitative information on how much the measures proposed should be applied nor information on the expected pollutants emission reductions. Therefore, a few hypotheses are formulated based on available data and information published in literature.
The PBP focuses on residential heating (CORINAIR macrosector 2), road traffic (CORINAIR macrosector 7), and agriculture (CORINAIR macrosector 10). Measures in road traffic should be applied only in winter (from 1 October to 31 March) when PM10 and PM2.5 measured concentration often exceeds the limit values, other measures application (for example limitation of biomass burning in residential heating or banning the incineration of agricultural residual vegetal material) is imposed only in case of exceedances of PM limit values. In this work all the measures described in the plan are applied all year long, in order to understand the maximum benefits achievable. Measures implemented to assess the impacts of PBP are reported in Table 1.
4.1. Road Transport
The plan provides a limitation in diesel vehicles circulation for both heavy and light duty diesel vehicles (HDV and LDV), buses and cars. Starting from October 2020 diesel cars, LDV, and HDV with a European emission standard classification older than EURO 4 will not be able to circulate in urban areas with more than 30,000 inhabitants. Besides this, in the PBP scenario other stricter measures provided by the Lombardia region air quality plan are included: limitation of EURO 0 gasoline cars, ban of EURO 0, EURO 1, and EURO 2 diesel buses, and limitation of stage 0 and stage 1 two-strokes engine motorcycles [37]. All these measures are applied over the entire domain (no distinction between urban areas and the rest of the region) and all year long.
4.2. Residential Heating
Residential heating in Lombardia is responsible for the 45% of primary PM emissions, 5% of VOC emissions and 19% of CO2 emissions. The plan stresses the problem of PM and VOC emissions due to heaters running on fuelwood and biomass. Measures for the abatement of fireplaces and stoves of the GAINS database are applied at the maximum feasible application rate, the removal efficiencies have been changed according to the DL 186/2017 [38], hypothesizing that the future installation of solid fuel local space heaters will be, up to 2030, in line with the lowest emitting technologies (“five stars” local space heaters) [5].
4.3. Agriculture
Agriculture sector (that includes also livestock management) mainly emits ammonia, a precursor of secondary PM. Measures in the management of cattle livestock are incremented of 15% according to literature [5]. Furthermore, the ban of open agricultural waste burning, according to DL 152/2006, is applied to reduce PM emissions classified in the waste treatment macrosector.
5. Results
5.1. CAMx Source Apportionment
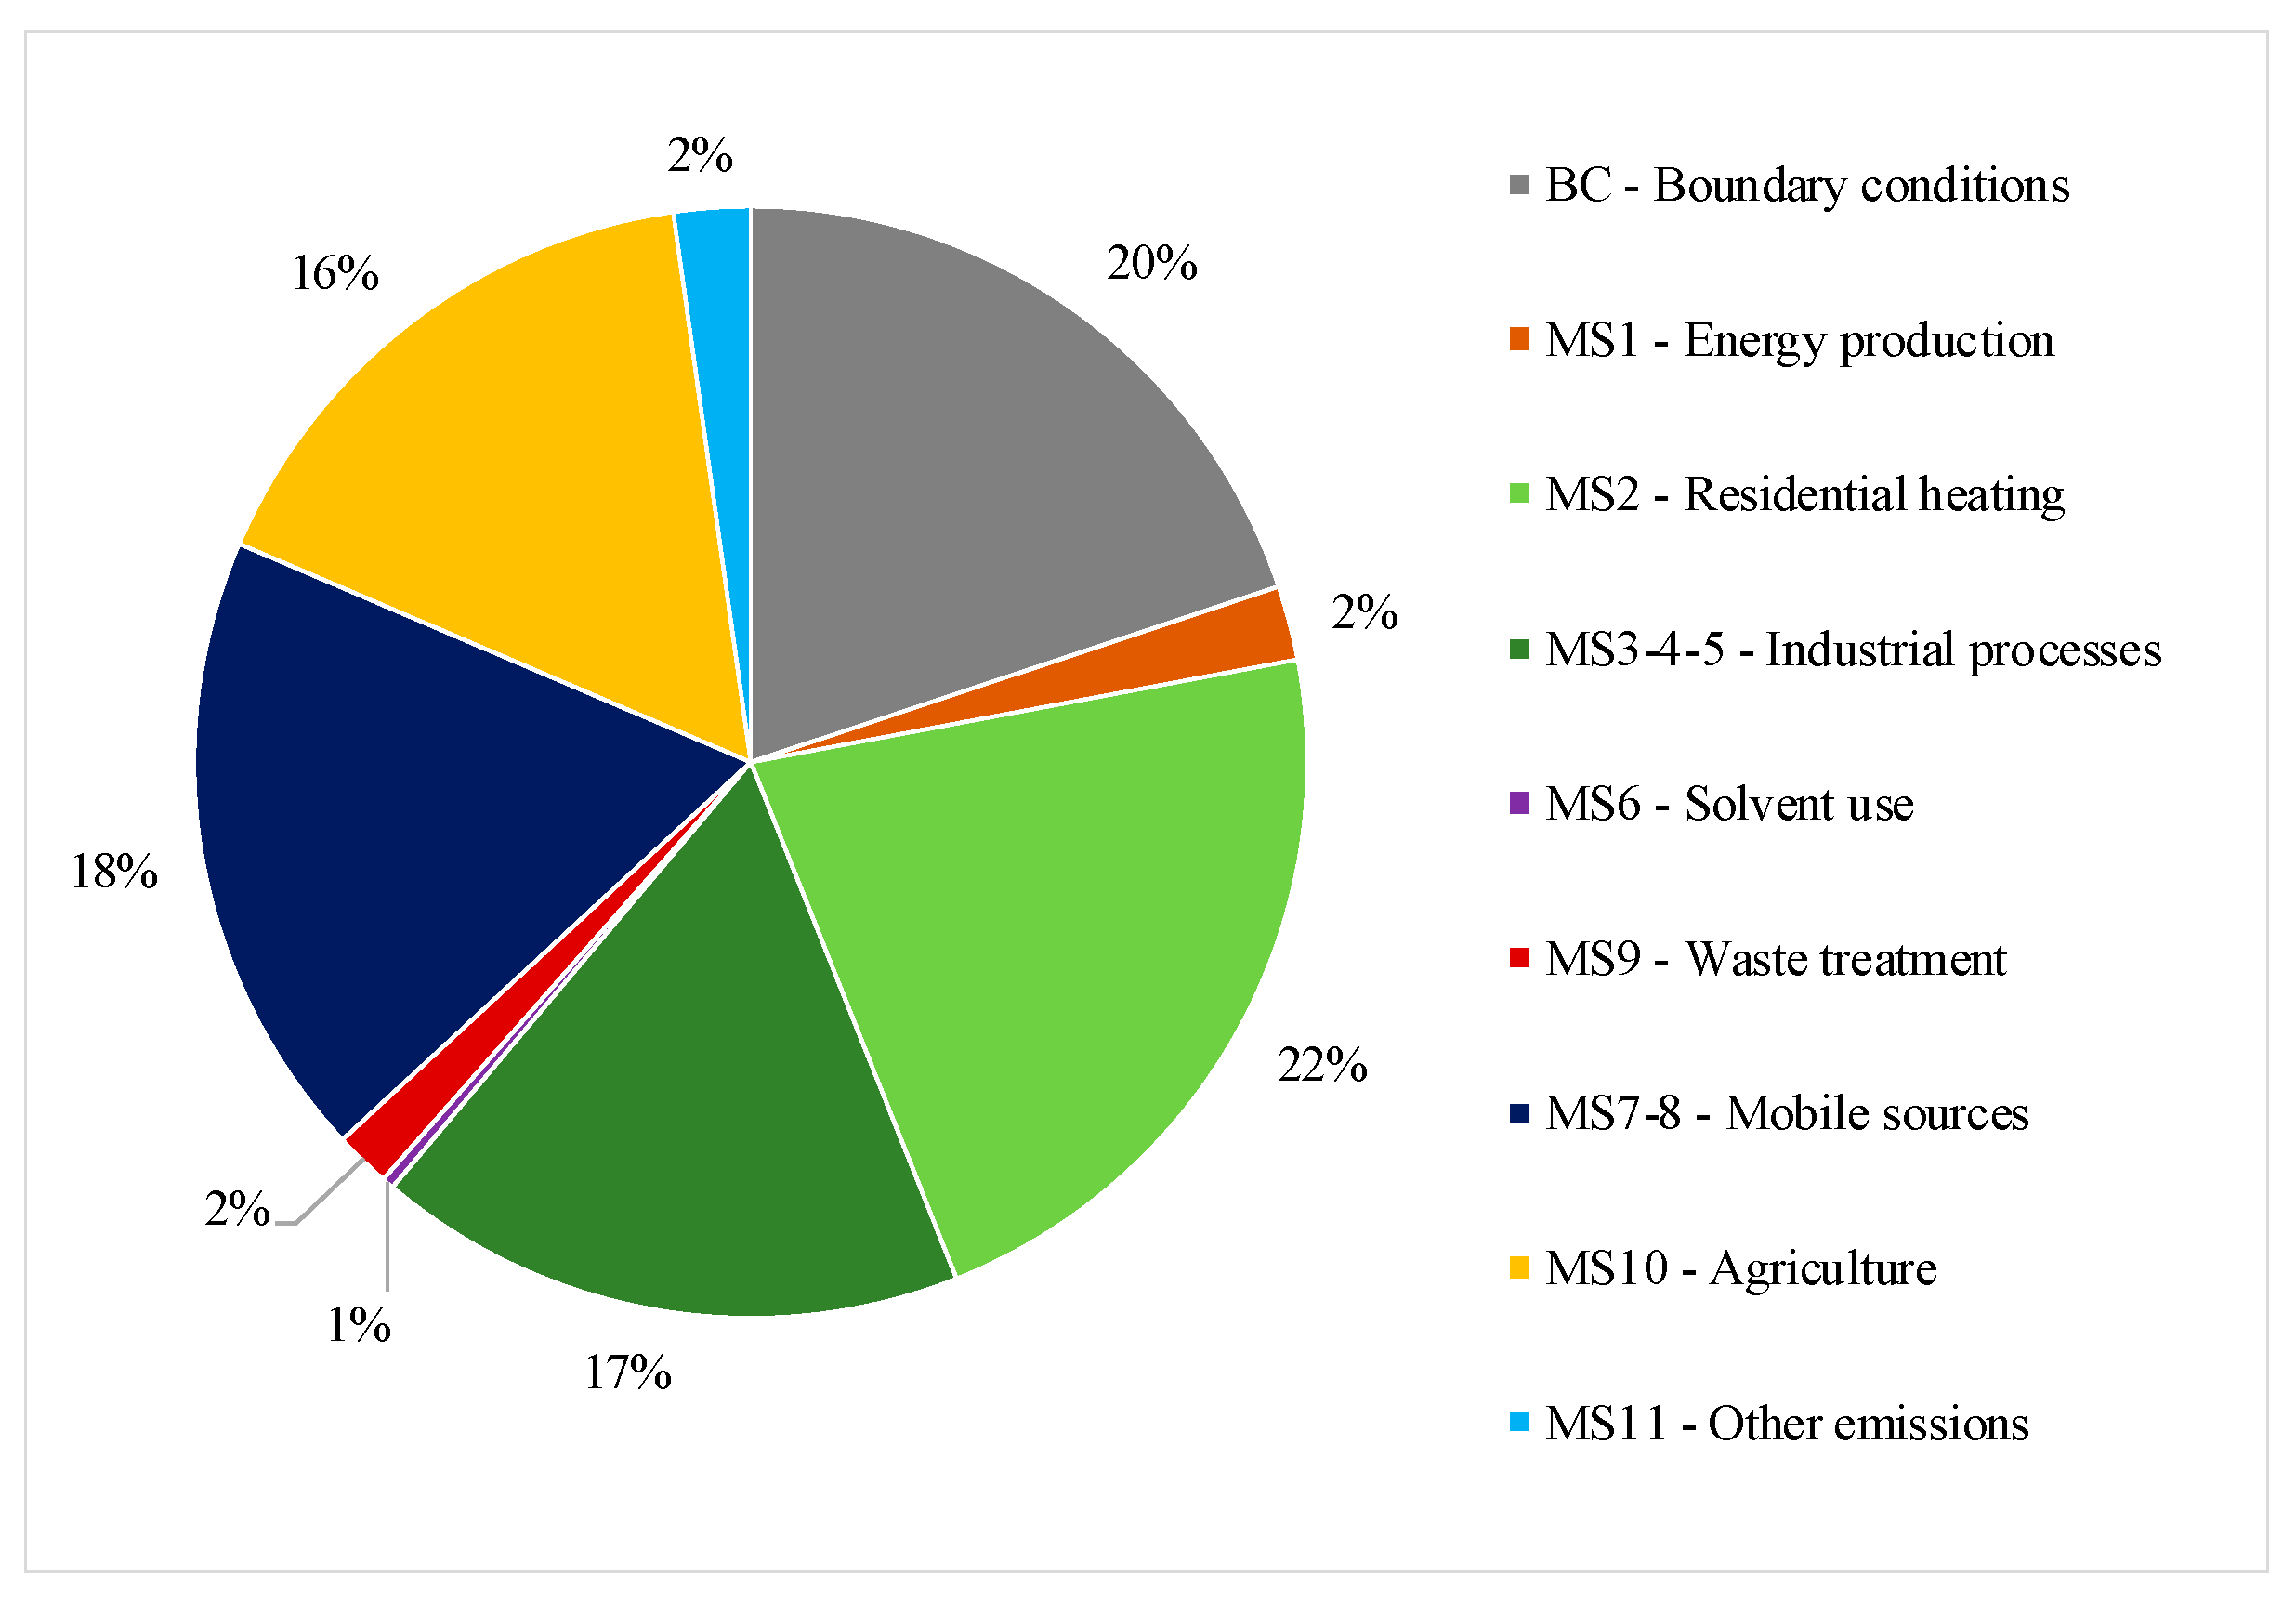
The maximum impacts for the different SA groups considered on the yearly PM10 concentration in Lombardia is reported in Table 2. The results show strong impacts of residential heating, industrial activities, road and non-road transport and agriculture. These sectors contribute both to primary PM (mainly from residential heating) and secondary inorganic PM10 formation from nitrogen dioxides and ammonia emitted by industrial processes, road transport and agriculture. The maximum impact of boundary condition (BC) is equal to 6.5 µg/m3 and the percentage SA results (Figure 3), 20% for the BC, shows the need of inter-regional common action to effectively reduce air pollutants concentrations.
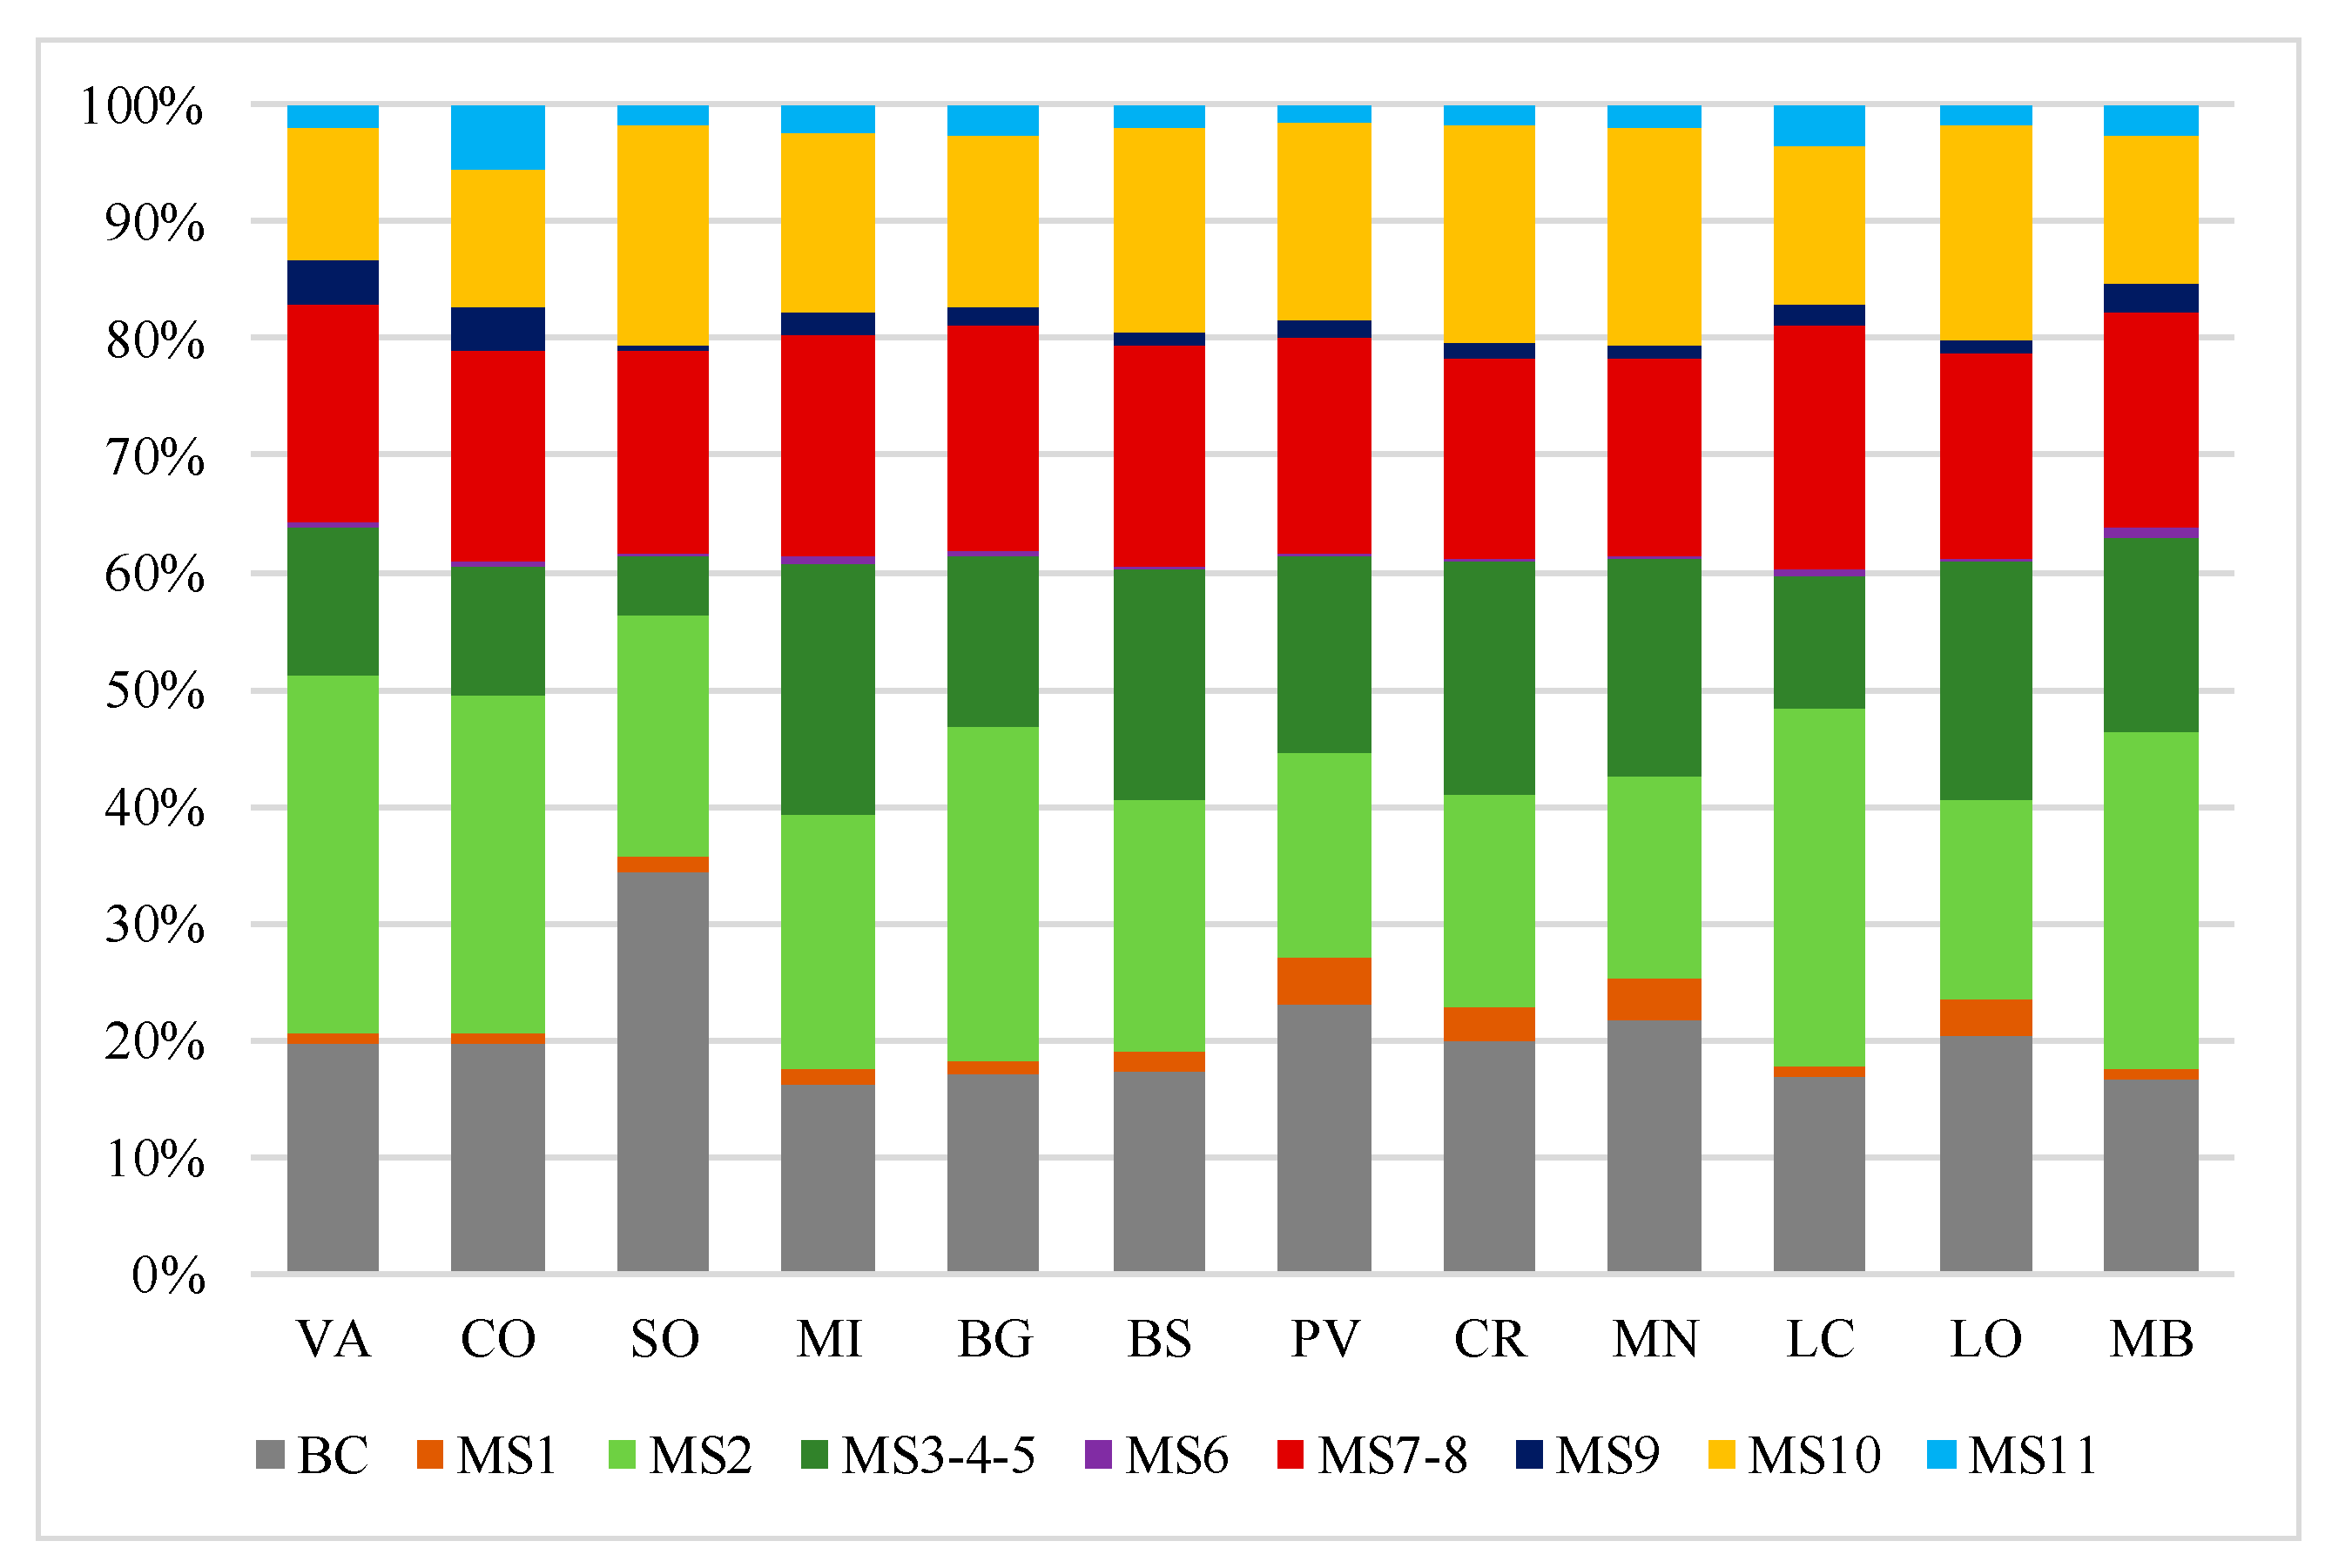
In Figure 4 the SA results are reported for all the 12 provinces of the Lombardia region. On the whole region is clear the contribution of residential heating (MS2) and mobile sources (MS7-8), while agriculture (MS10) and industrial processes (MS3-4-5) importance depends on the activity intensity in the province.
5.2. MAQ Model Po Basin Plan Scenario and Optimal Policy
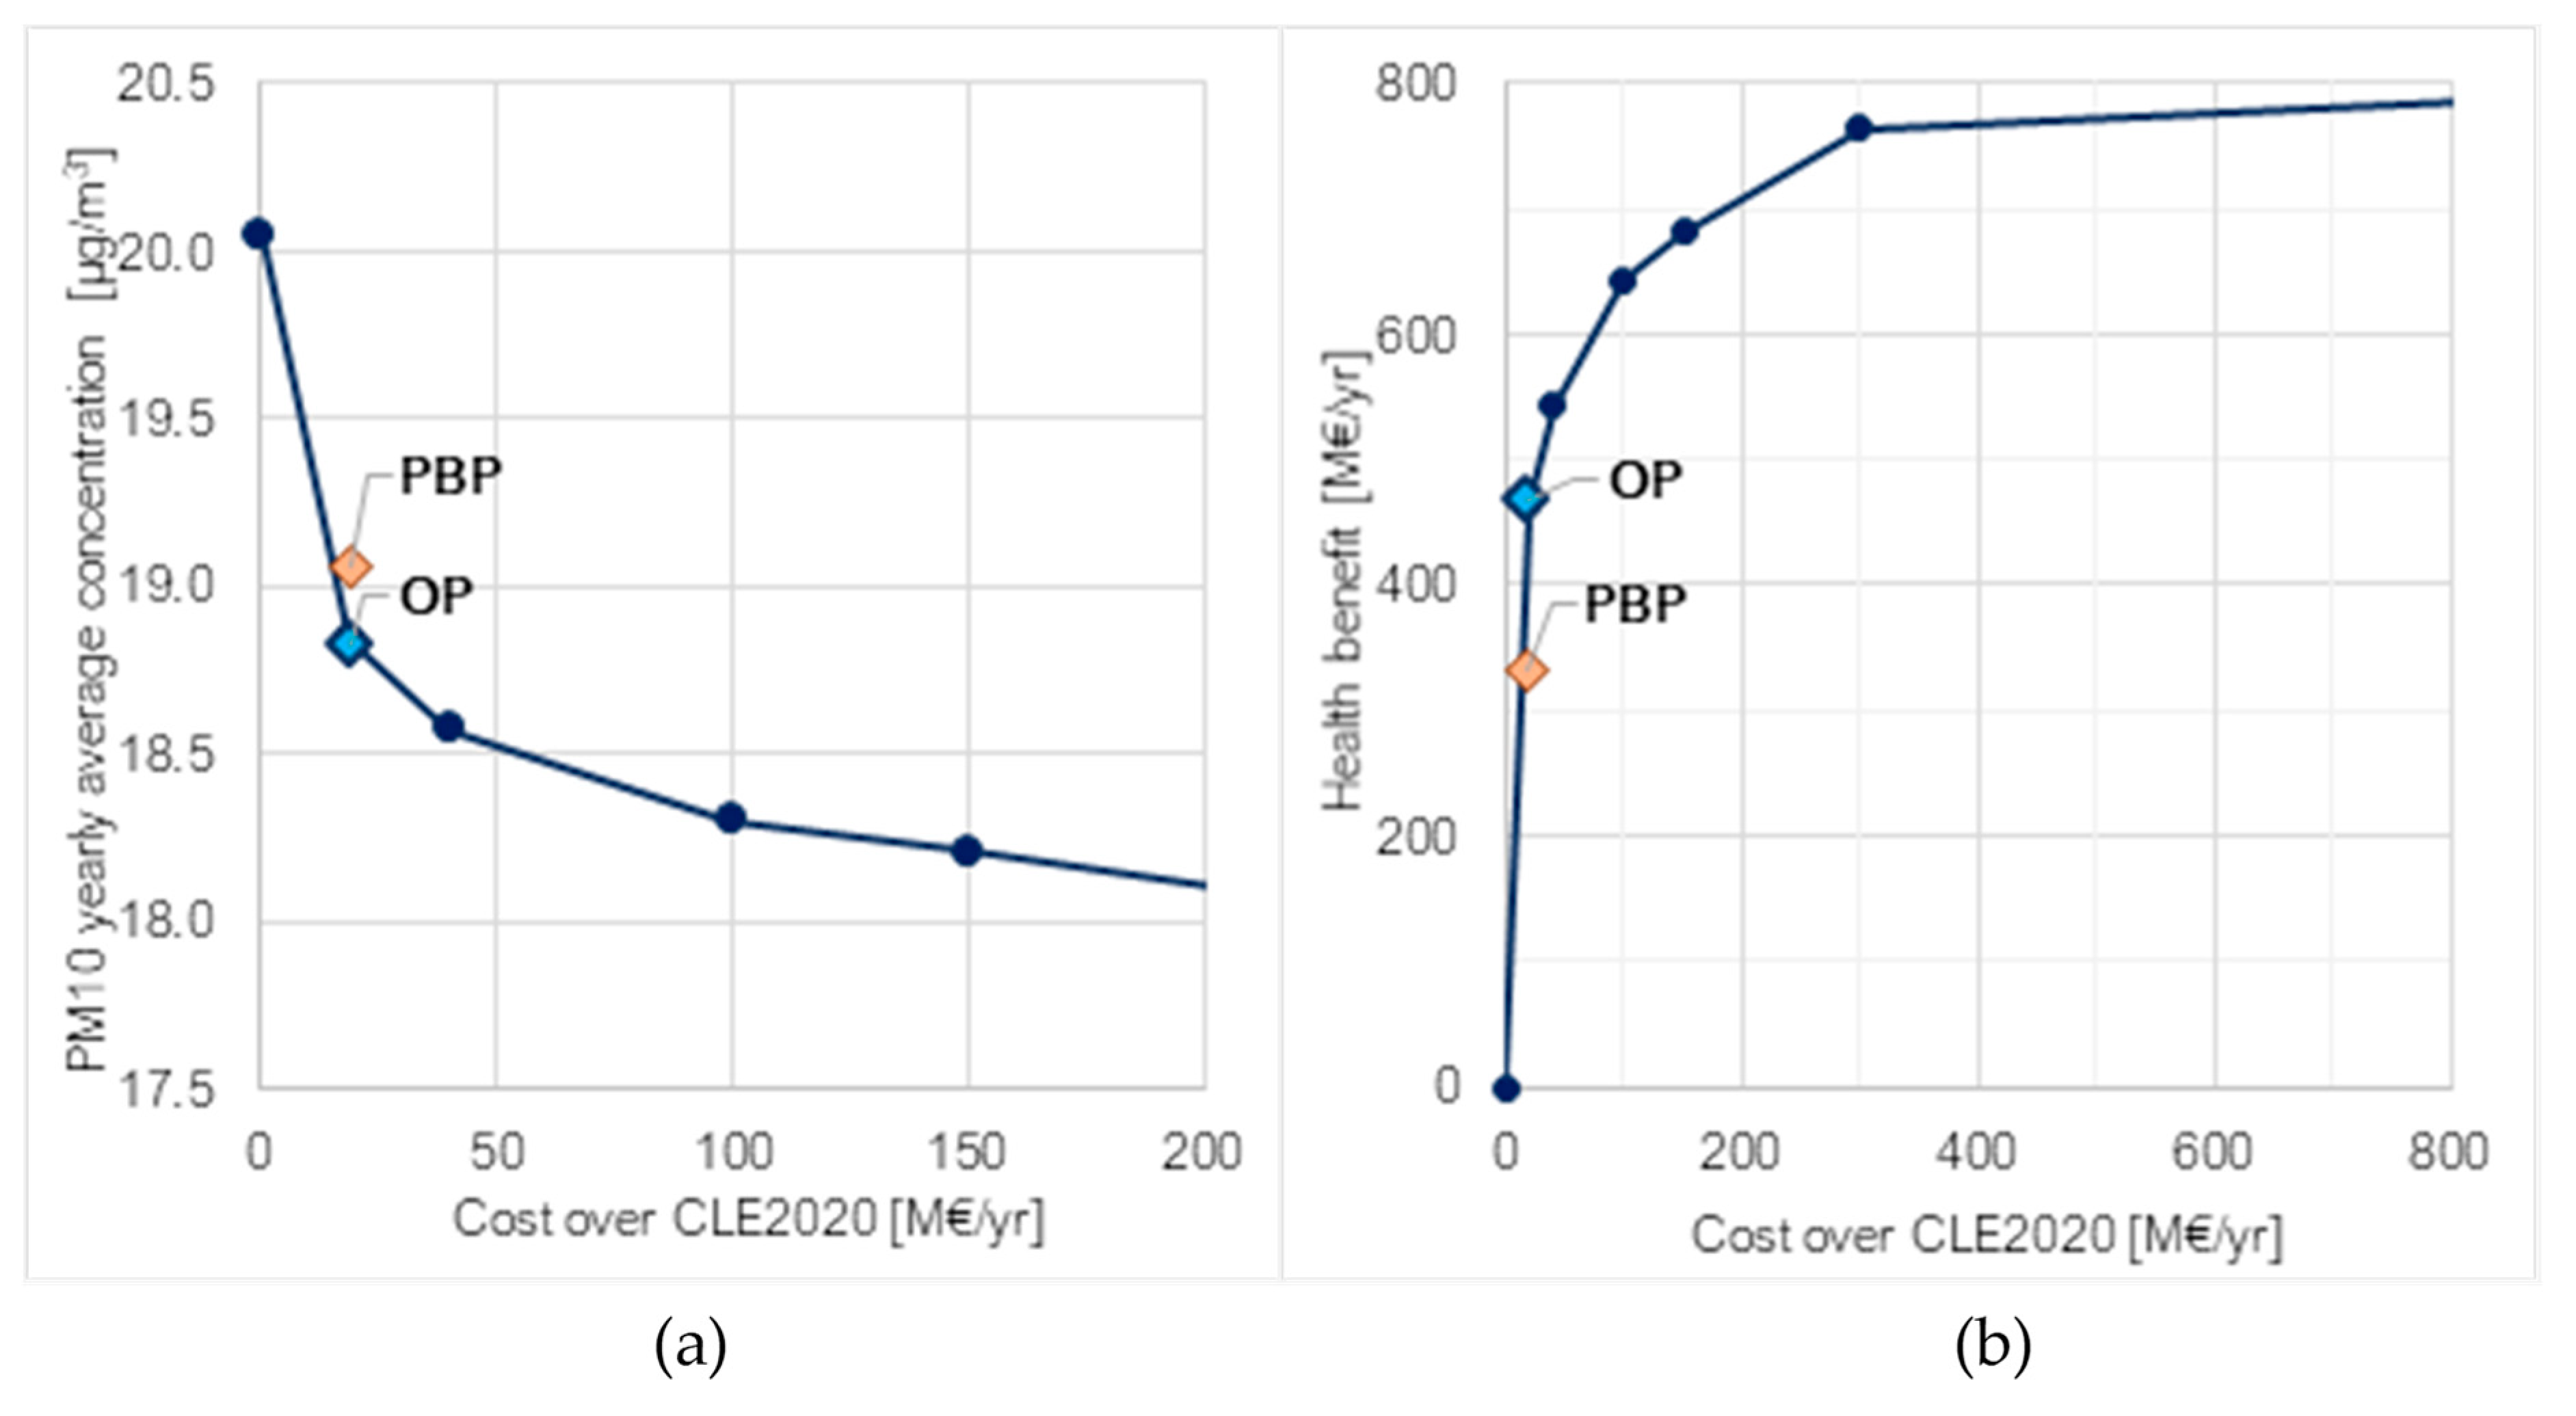
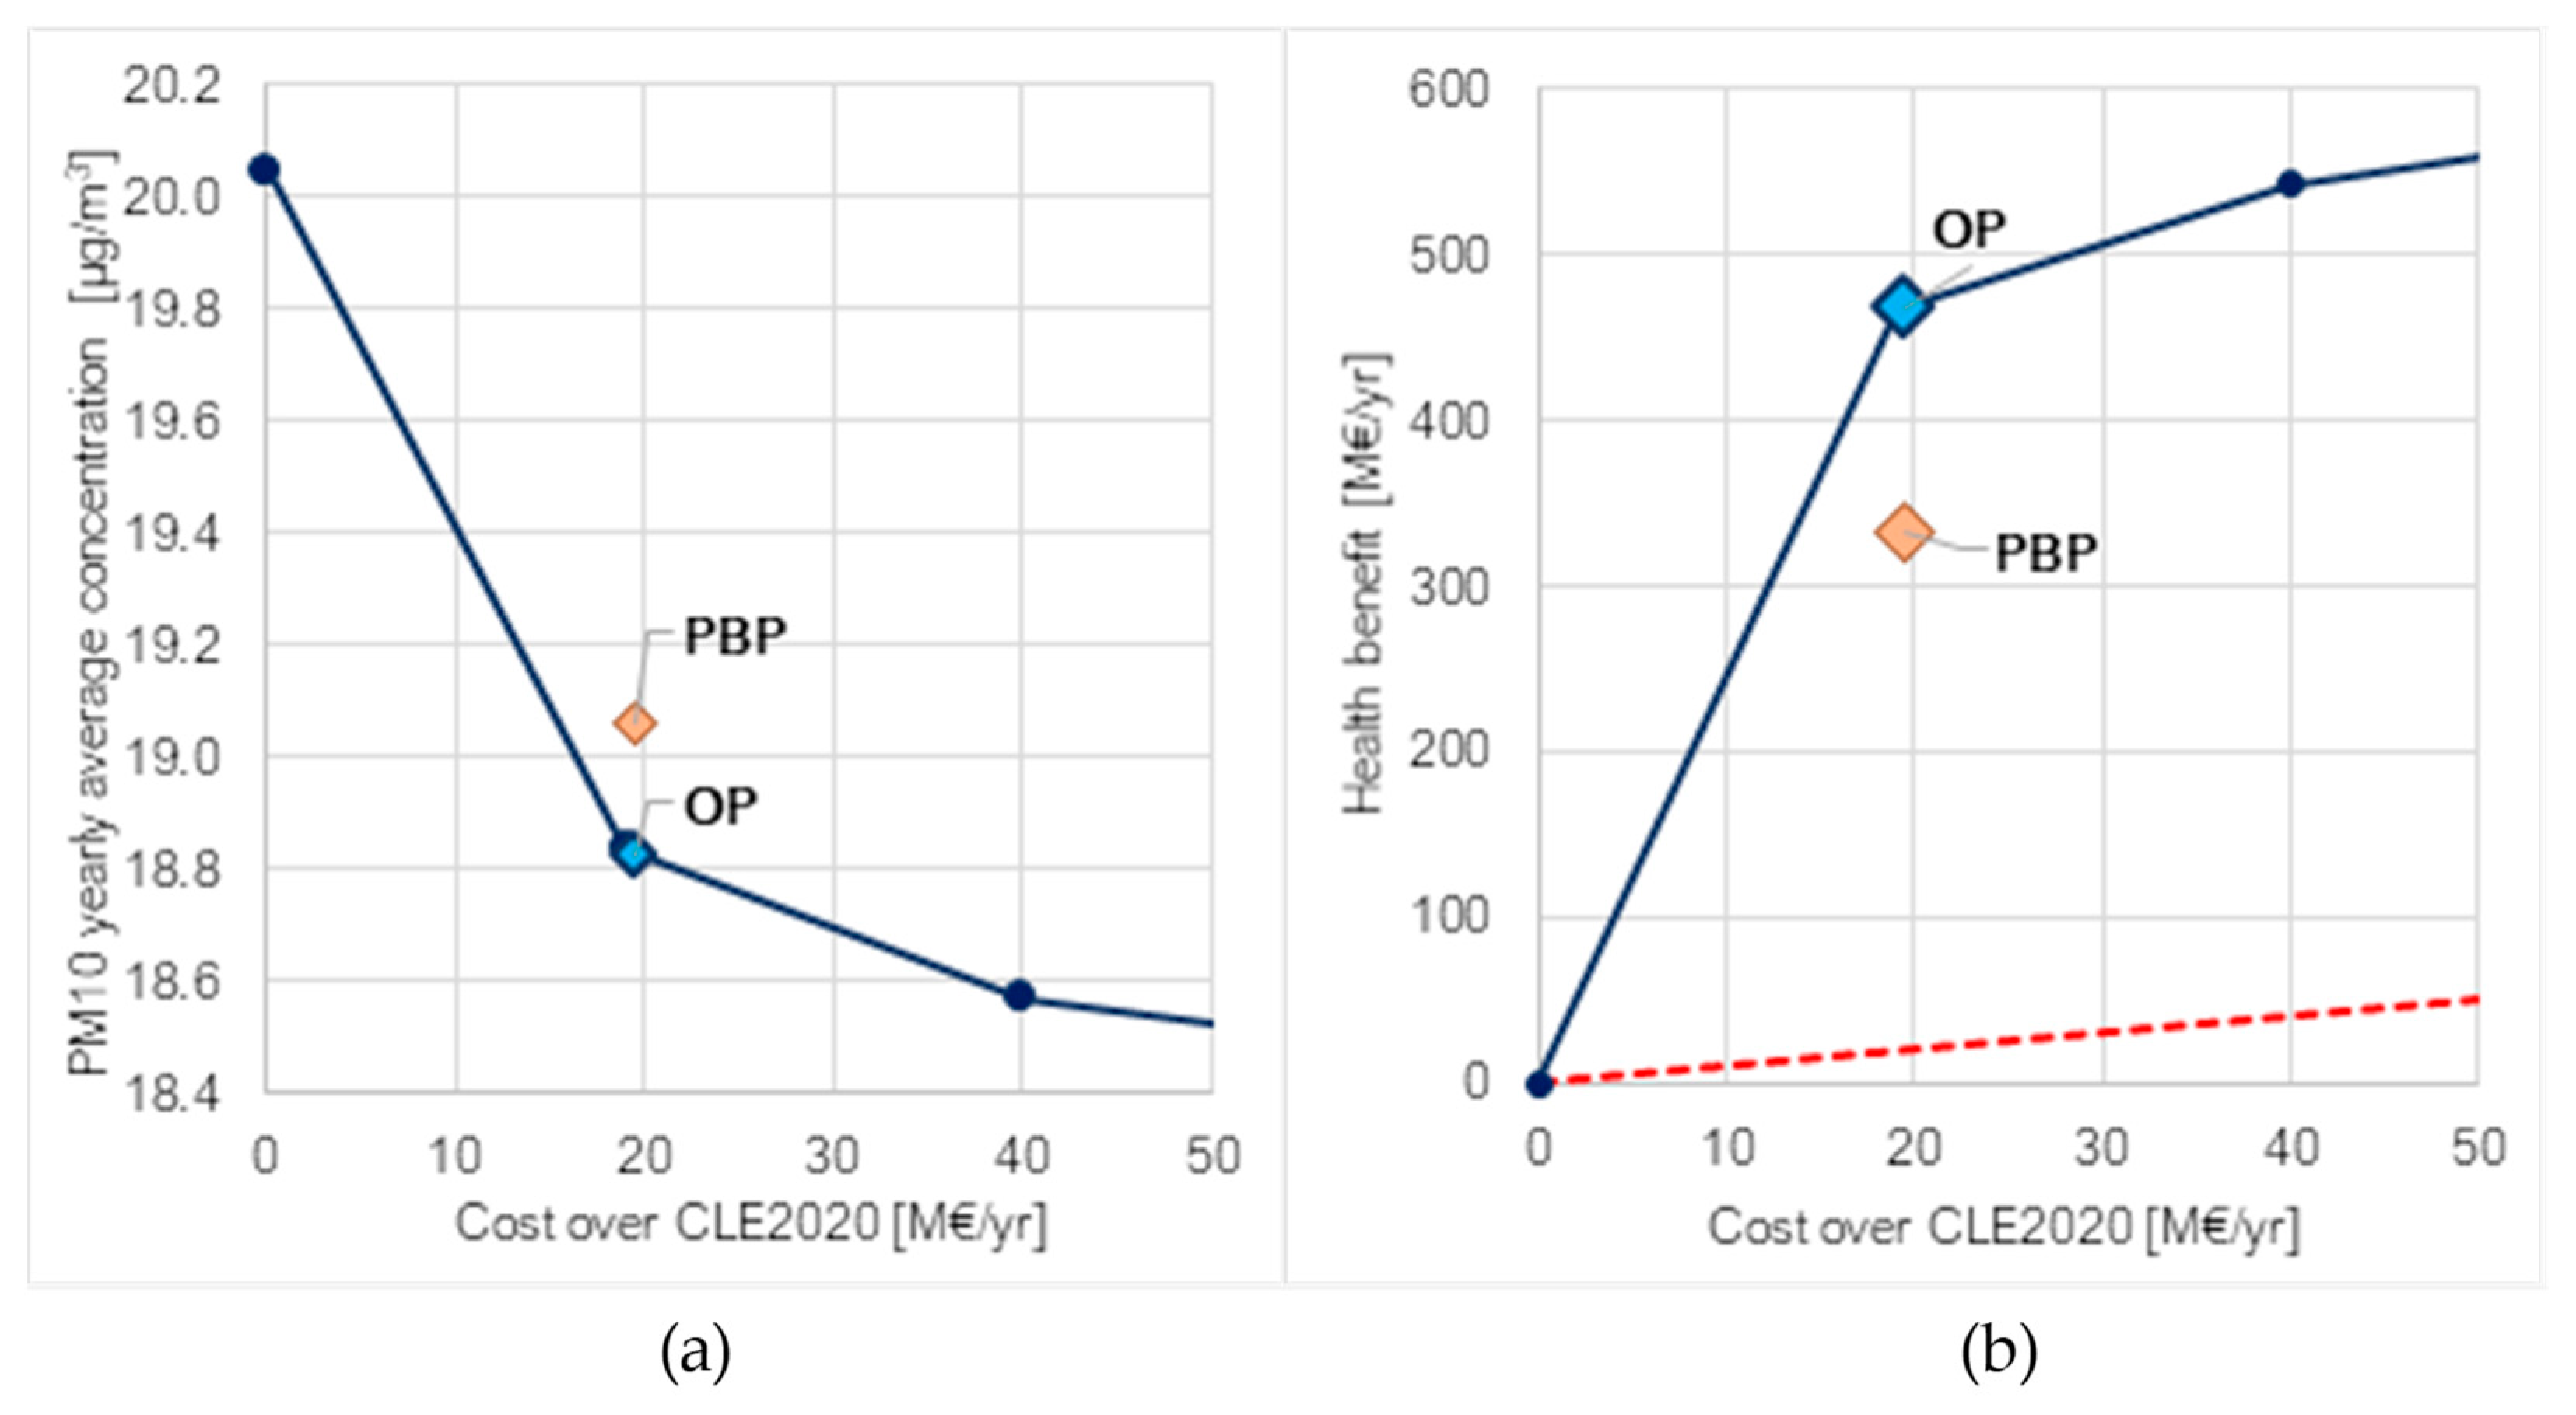
Figure 5a shows the comparison between the PBP scenario and the OP, computed by means of a multi-objective optimization. The cost of the policy is represented on the horizontal axis and the Air Quality Index on the vertical axis, in this case PM10 yearly average concentration is considered. The cost of both the PBP scenario and the OP is 19.6 M€/yr. The continuous line is the Pareto front representing the solutions of the multi-objective problem that minimizes both the AQI and the costs, meaning the set of efficient policies. The base case (first point on the left) is the current legislation scenario (CLE2020) representing the application of the legislation in force in 2020 (at national and European level). In Figure 5b the cost-benefit analysis is shown. On the vertical axis the health savings due to reduction in morbidity and mortality are represented. At the same cost over CLE, the health benefits due the reduction in PM10 concentration exposure amount to 332 M€/yr and 468 M€/yr for respectively the PBP and the OP scenarios. In Figure 6 it is clear, from both the objective space representation and the cost-benefit analysis, that the optimal policies dominate the PBP scenario. Furthermore, the cost-benefit analysis shows that both PBP and OP scenarios guarantee health savings higher than policy implementation cost (the points are above the red line, representing the cost–benefit plan bisector).
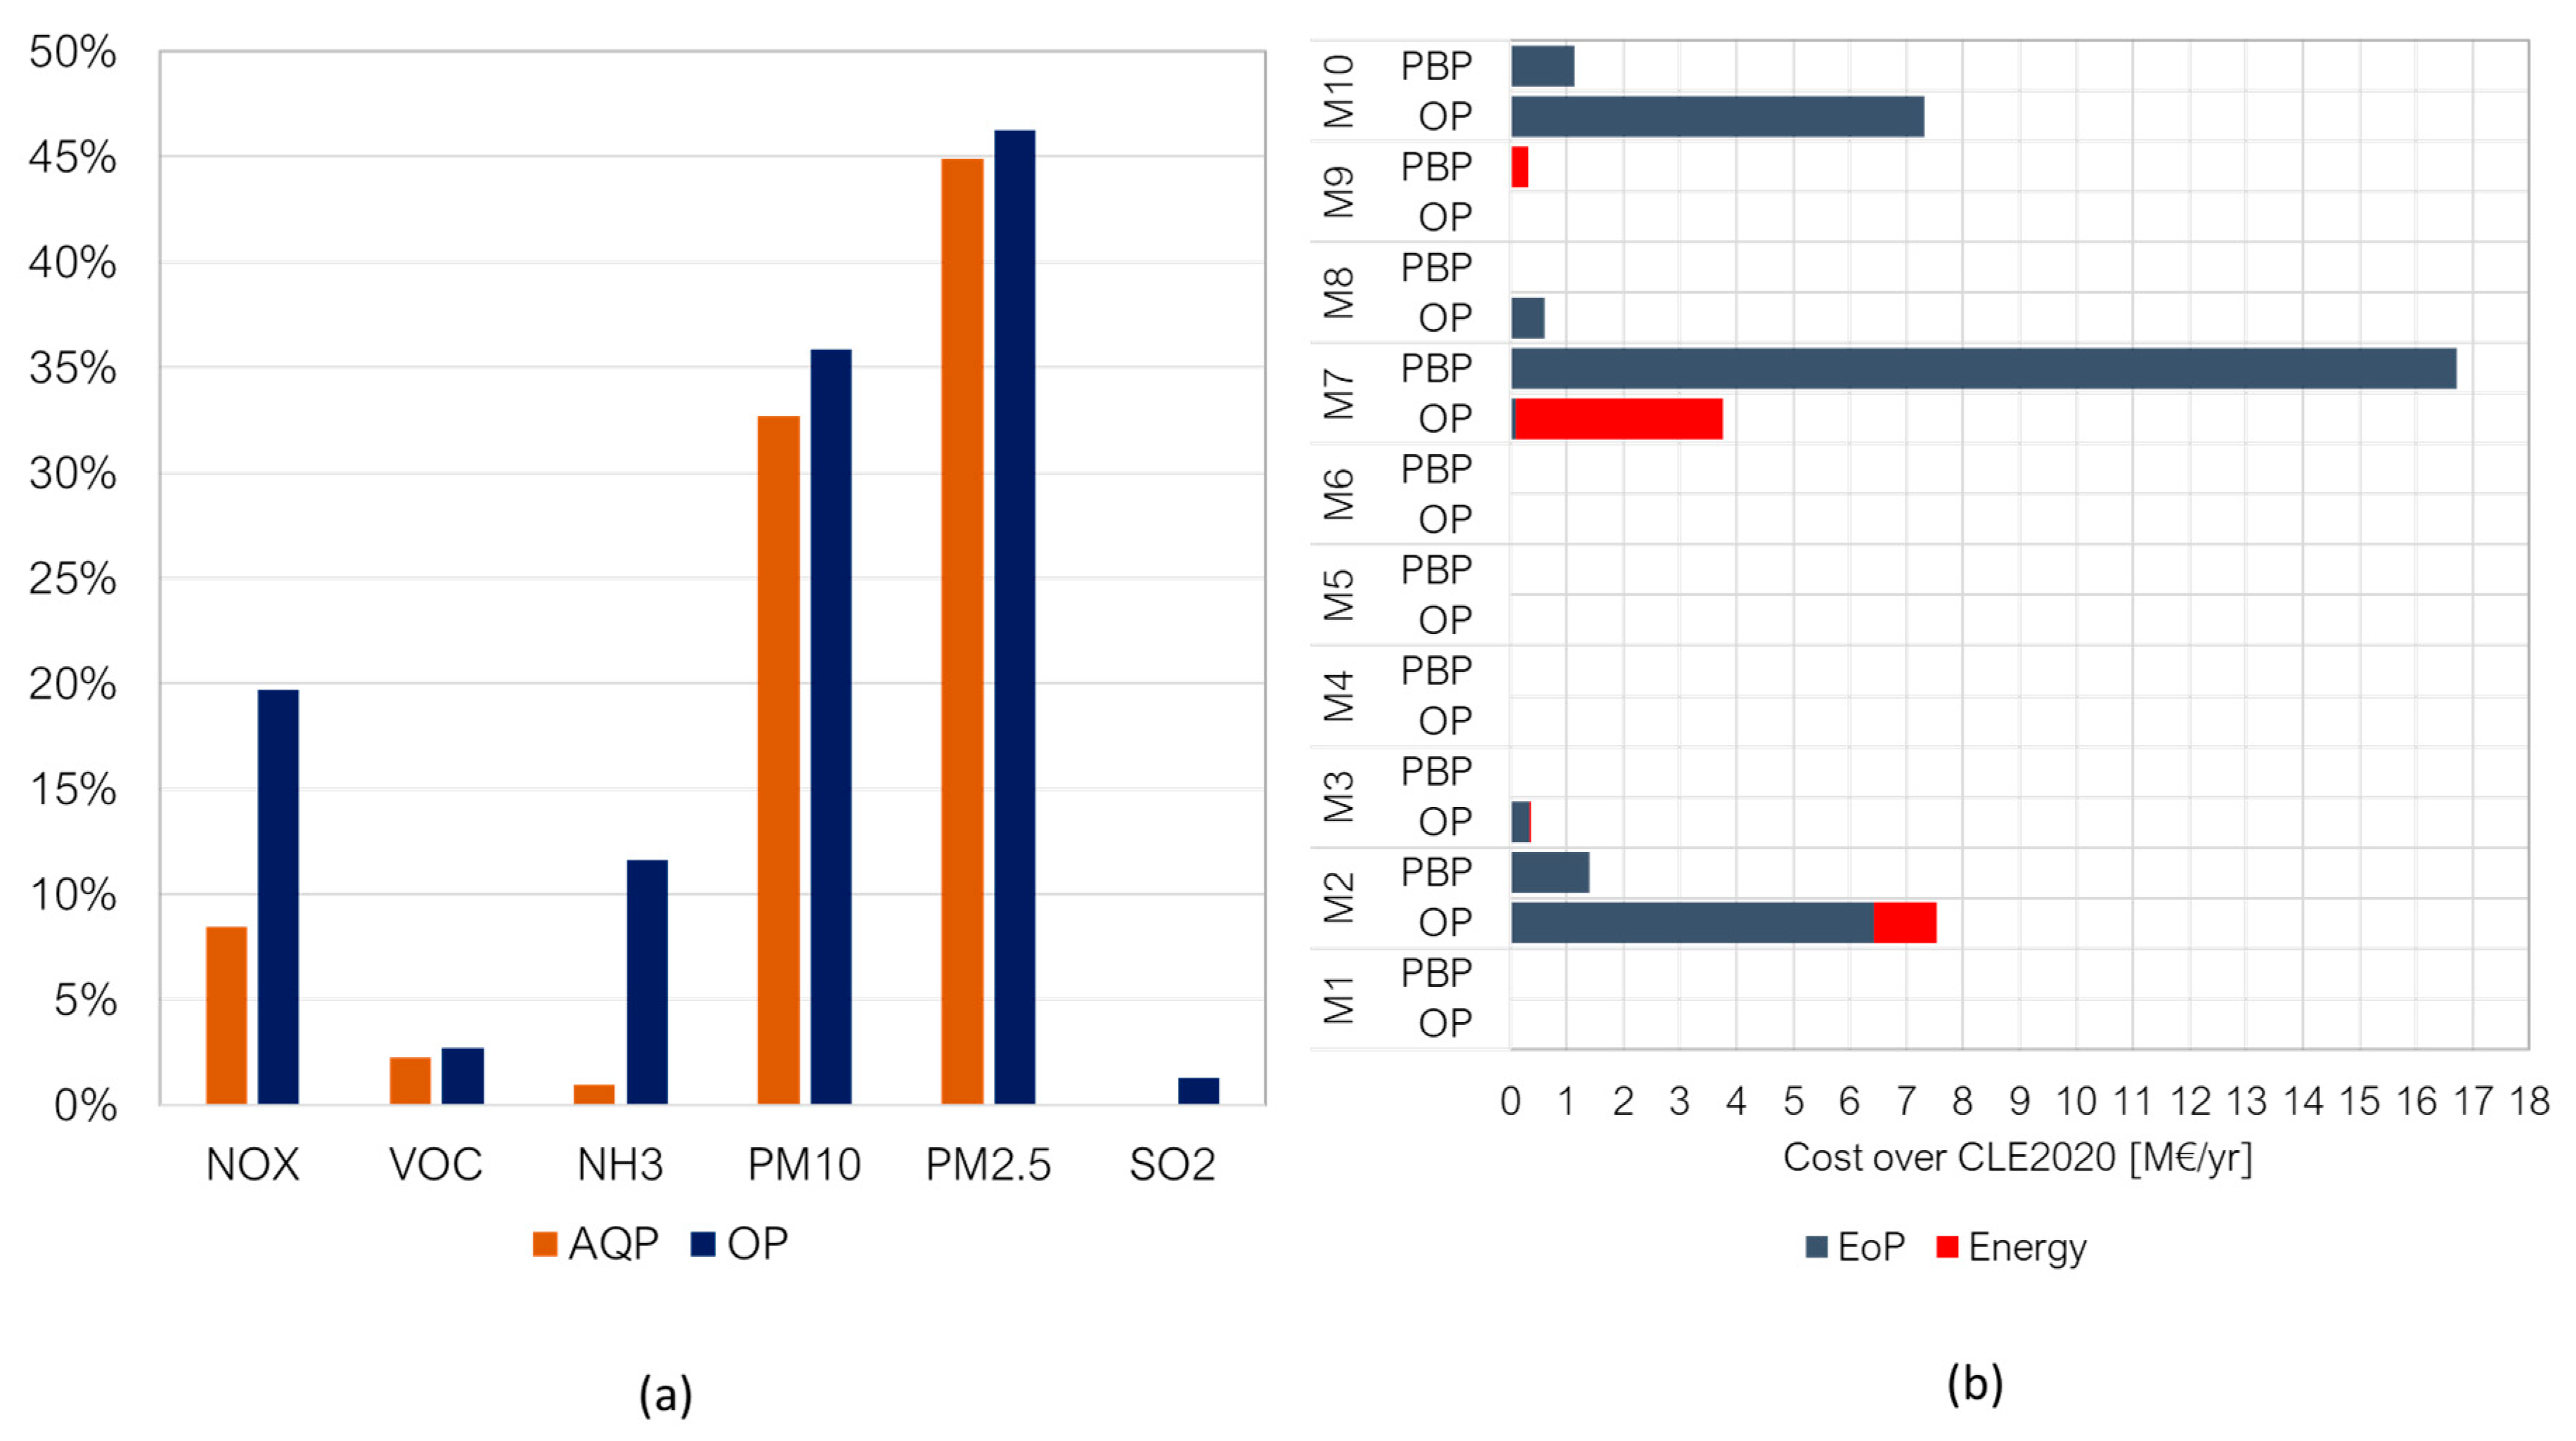
Health impacts, PM10 average concentrations (AQI), and CO2 equivalent emission are compared between the two policies in Table 3. The AQI reduction (∆AQI) and, accordingly, health savings are larger in the optimal policy compared to the PBP, in the first one there is a reduction of 1.3 µg/m3 against 1.0 µg/m3 for the PBP scenario. The PBP scenario includes also the impacts of boundary conditions variation, because the emission reductions estimated for the Lombardia region, due to the application of the plan, are also applied in the other three regions involved. Equivalent CO2 reduction is negligible for the PBP (5 kt/yr) since only end-of-pipe measures are applied, those technologies do not reduce the energy consumption (meaning the fuel use), the slight reductions shown depend mainly on road traffic sector measures. On the other hand, the optimal policy includes both energy measures and end-of-pipe technologies, therefore there is a reduction of 4338 kt of equivalent CO2/yr. In Figure 7 emission variations and costs are reported for each CORINAIR macrosector, reduction of PM and VOC emissions are similar for the two policies, caused by the application of measures for the improvement of fireplaces and stoves efficiency.
The PBP focuses mainly on two macrosectors: residential heating and road transport, while the OP implements measures in almost all sectors. In Table 4 the main measures (application increase higher than 10% with respect to CLE2020) are reported including the measures implementation cost and the application variation with respect to the base case. In the OP the main investments in the road traffic sector aim at the reduction of diesel vehicle circulation, especially in urban areas, implementing energy measures that limit the commuters use of cars (soft mobility measures) and LDV and HDV circulation in the cities. Compared to the PBP, in the OP higher efforts are implemented to abate ammonia emission from livestock management and to reduce consumption in residential buildings, not only improving the efficiency of fireplaces and stoves (an important source of primary PM, as shown also by the SA results) but also certifying the energy efficiency of the buildings and centralizing the energy production using the district heating.
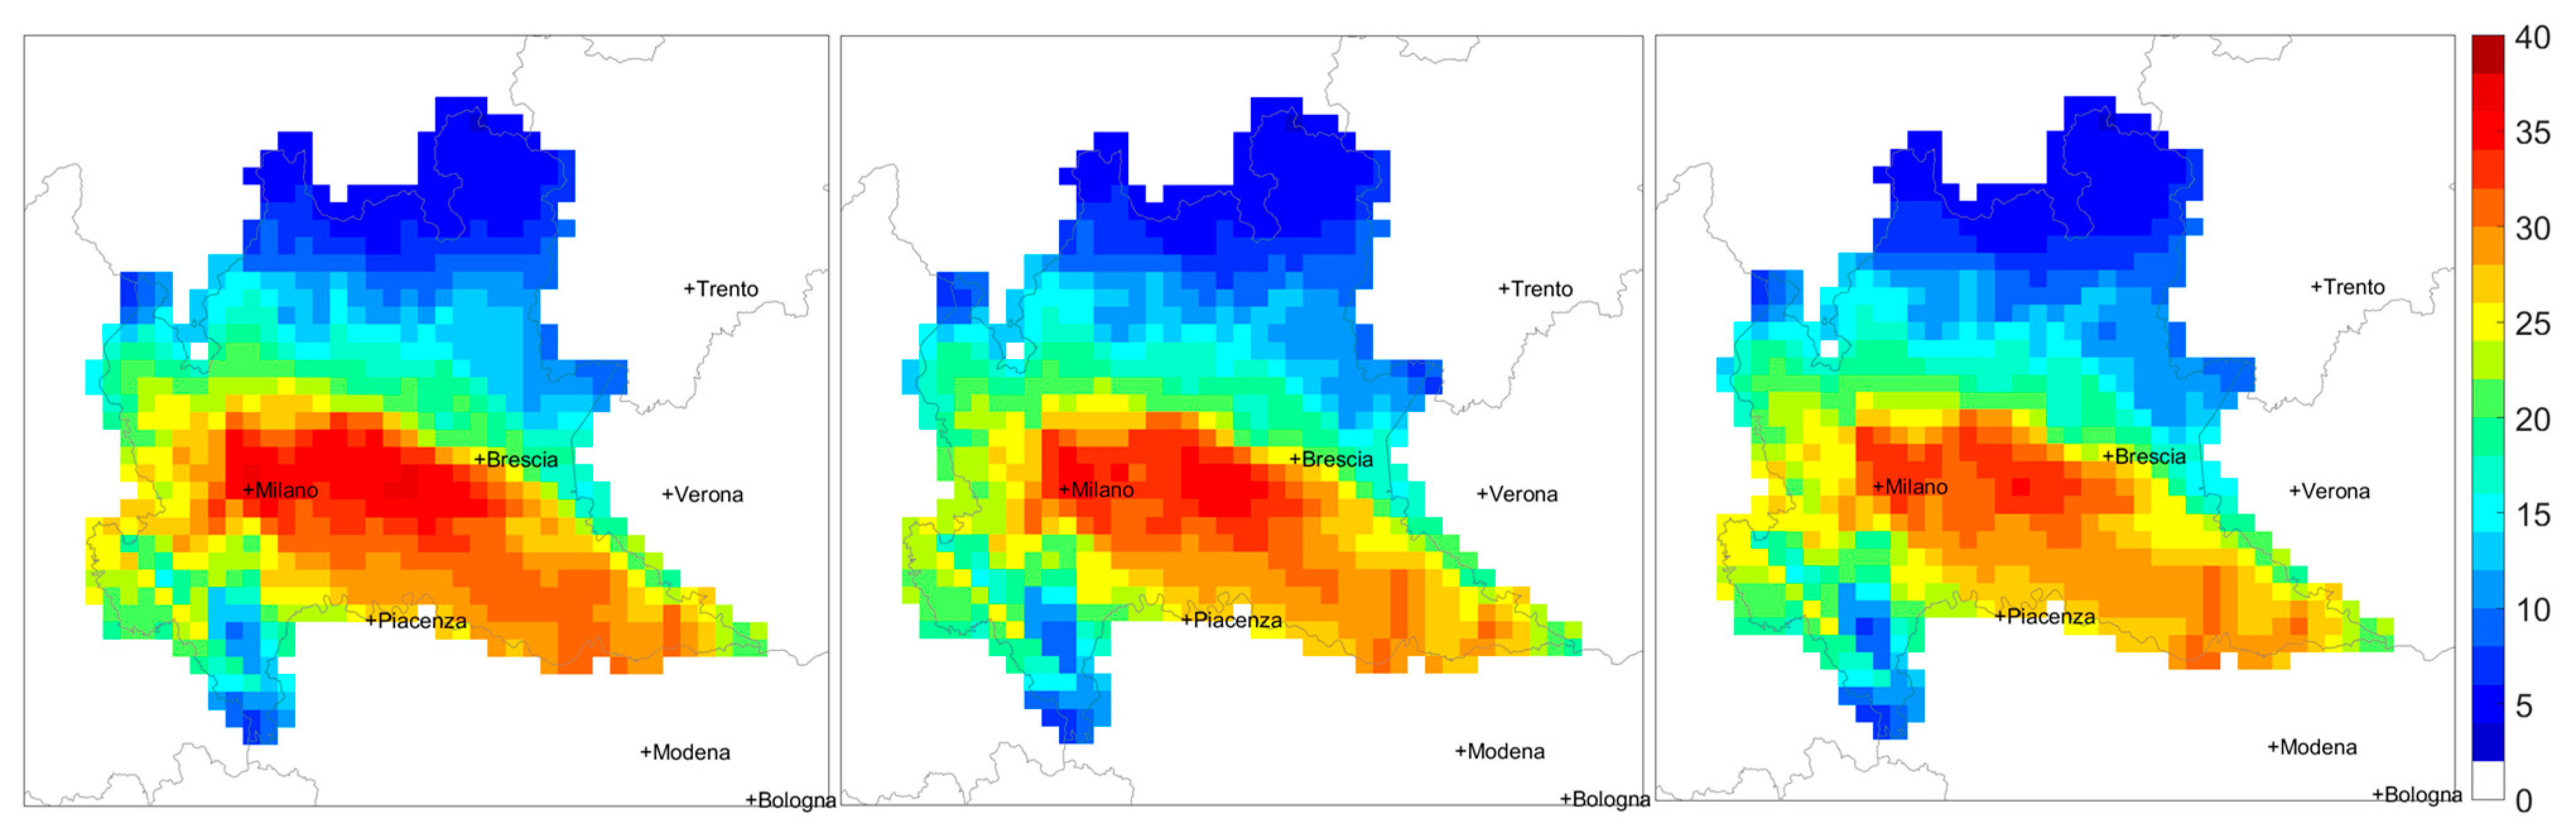
Impacts in terms of PM10 yearly average concentration are displayed in Figure 8. In the OP higher reductions in the area between Milan and Brescia are visible but critical spots remain close to the urban areas. In the PBP concentration map, there are lower concentrations in the west boundary cells because emission reductions are applied also in the neighboring regions.
6. Discussion
In this work a methodology that includes CTM source apportionment technique and an integrated assessment modelling approach is used to study the emission sources in the Po Basin and evaluate impacts of air quality policies in Lombardia region. The two methodologies give different type of information: the CTM describes the atmosphere physics, which are the sectors that mainly contribute to air pollution. Also a spatial source apportionment is possible to understand the geographical distribution of the sources. The IAM considers both the air quality problem and the emission abatement measures that can be implemented, including the policy costs, health benefits and GHG emissions. Despite the differences between the approaches presented, the results in terms of intervention priorities for air quality planning are the same, in fact the use of different methodologies shows that the cost-effectiveness measures obtained through a multi-objective optimization fully respond to the intervention priorities computed using SA techniques. Furthermore, source apportionment and IAM are used also to evaluate the Po Basin Plan.
The CAMx source apportionment stresses the need of intervention in residential heating, industrial activities, road and non-road transport, and agriculture. Residential heating is responsible of 22% of PM10 concentration in Lombardia, in fact the Po Basin Plan, issued in 2017, tackles mainly emission coming from biomass fuel use and diesel road transport. CAMx results are coherent with other studies that focus on the Northern Italy/Lombardia domain. In the study presented in [15], residential and commercial heating (biomass burning) accounts for the 23% of PM2.5 concentrations in Milan. Furthermore, a comparison between receptor and chemistry-transport modelling source-apportionment over the Po Basin, shows that residential heating and road transport have an important role in PM2.5 concentrations [13].
The MAQ model is used (1) to apply the PBP measures and compute the impacts in a scenario analysis approach and (2) to define a cost-efficient policy to reduce the PM10 yearly average concentration over the domain, at the cost of the PBP, in an optimization approach. PBP impacts in terms of air quality, human health, GHG emissions and policy cost are computed implementing the measures reported in the plan. The boundary conditions are modified applying in the other three PBP regions the emission reductions estimated for the Lombardia domain. Even if emission reductions in neighboring regions have been applied, PBP PM10 yearly average concentration is slightly higher than OP where measures to reduce air pollution are identified following a cost-effectiveness approach and applied only in Lombardia. The PBP partially responds to the SA results in terms of intervention priorities. However, more efforts in reducing ammonia emissions from agriculture must be made to reduce secondary PM, in fact the cost-effectiveness of livestock and agriculture ammonia abatement measures is a topic studied in previous works [19,32]. Another study on the impacts of the Po Basin Plan [5], applied on the whole national domain, shows issues in the European limit values compliance especially in Lombardia and confirm that the PBP measures are reducing emissions but more efforts are needed.
The present study highlights the high emission density that characterizes this area and stresses the relevance of residential heating emission control. IAM analysis shows that an improvement in biomass heaters can be effective in reducing PM emissions but a reduction in building energy consumption is needed to generate higher policy impacts on GHG emissions.
The study describes a combined approach, using SA techniques and IAM, that allows to evaluate emission reduction priorities and to implement a policy (OP) that gives a response to the PM concentration problem in the Po Basin, highlighted by the SA analysis performed with CAMx, and it is cost-efficient. The comparison with the Po Basin Plan shows that a rigorous modelling framework for the implementation of an Air Quality Plan can improve the impacts of the policy. The OP results in the residential heating sector, where there are end-of-pipe measures comparable to the PBP ones but with additional energy efficiency measures, suggest the need to use modelling tools that include the energy efficiency technologies and fuel consumption reduction policies, for example the MAQ model, that implements the IAM optimization approach including both type of measures.
The work is the starting point for a series of future analyses related in particular to the impact of the meteorological year on the results. Moreover, a study of secondary organic aerosols could be further explored to better understand the atmospheric processes in the domain.
Author Contributions
Conceptualization, E.D.A., C.C. and E.T.; Data curation, E.D.A. and C.C.; Methodology, E.D.A. and C.C.; Software, E.T. and C.C.; Supervision, M.V.; Writing—original draft, E.D.A.; Writing—review & editing, E.D.A., E.T., C.C. and M.V. All authors have read and agreed to the published version of the manuscript.
Funding
This research received no external funding.
Conflicts of Interest
The authors declare no conflict of interest.
Abbreviation
The following acronyms and abbreviations are used in this manuscript.
| AQI | Air Quality Index |
| CAMx | Comprehensive Air quality Model with eXtension |
| CLE2020 | Current LEgislation scenario at 2020 |
| CO2 | Carbon dioxide |
| CORINAIR | Core Inventory of Air Emissions |
| CTM | Chemical Transport Model |
| DPSIR | Drivers-Pressures-State-Impacts-Response framework |
| DSS | Decision Support System |
| EBI | Euler backward method |
| EMEP | European Monitoring and Evaluation Programme |
| GAINS | Greenhouse gas-Air pollution Interactions and Synergies model |
| GHG | Greenhouse Gas |
| HDV | Heavy Duty Vehicles |
| IAM | Integrated Assessment Modelling |
| INEMAR | INventario EMissioni Aria (emission inventory) |
| ISORROPIA | thermodynamic equilibrium aerosol model |
| LDV | Light Duty Vehicles |
| MAQ | Multi-dimensional Air Quality model |
| NCEP | National Centers for Environmental Protection |
| NECD | National Emission Ceilings Directive |
| NOAA | National Oceanic and Atmospheric Administration |
| NOX-NO2 | Nitrogen oxides/dioxide |
| OP | Optimal Policy |
| OSAT | Ozone Source Apportionment Technology |
| PBP | Po Basin Plan |
| PM | Particulate Matter |
| PREPAIR | Po Regions Engaged in Policies of Air |
| PSAT | Particulate Source Apportionment Technology |
| RADM | Regional Acid Deposition Model |
| RIAT+ | Regional Integrated Assessment Tool plus |
| SA | Source Apportionment |
| SO2 | Sulphure dioxide |
| SOAP | Secondary Organic Aerosol Production |
| VOC | Volatile Organic Compounds |
| WHO | Word Health Organization |
| WRF | Weather Research and Forecasting |
References
- Stanaway, J.D.; Afshin, A.; Gakidou, E.; Lim, S.S.; Abate, D.; Abate, K.H.; Abbafati, C.; Abbasi, N.; Abbastabar, H.; Abd-Allah, F.; et al. Global, regional, and national comparative risk assessment of 84 behavioural, environmental and occupational, and metabolic risks or clusters of risks for 195 countries and territories, 1990–2017: a systematic analysis for the Global Burden of Disease Study. Lancet 2018, 392, 1923–1994. [Google Scholar] [CrossRef] [Green Version]
- Hunt, A.; Searl, A.; Ferguson, J.; Hurley, F. Social Costs of Morbidity Impacts of Air Pollution; OECD Environment Working Papers, no 99; OECD Publishing: Paris, France, 2016. [Google Scholar]
- European Environment Agency. Air Quality in Europe—2019 Report. EEA Report No 10/2019 (Issue 10). 2019. Available online: https://www.eea.europa.eu/publications/air-quality-in-europe-2019 (accessed on 9 January 2020).
- ISPRA. Analisi dei trend dei principali inquinanti atmosferici in Italia (2008–2017); 2018. Available online: https://www.isprambiente.gov.it/files2019/pubblicazioni/rapporti/R_302_18_TREND_ARIA.pdf (accessed on 7 December 2019).
- D’Elia, I.; Piersanti, A.; Briganti, G.; Cappelletti, A.; Ciancarella, L.; Peschi, E. Evaluation of mitigation measures for air quality in Italy in 2020 and 2030. Atmos. Pollut. Res. 2018, 9, 977–988. [Google Scholar] [CrossRef]
- MATTM. Programma nazionale di controllo dell’inquinamento atmosferico. 2019. Available online: https://va.minambiente.it/it-IT/Oggetti/Documentazione/7123/10252 (accessed on 9 November 2019).
- MATTM. Nuovo accordo di programma per l’adozione coordinata e congiunta di misure per il miglioramento della qualità dell’aria nel bacino padano. 2017. Available online: https://www.regione.lombardia.it/wps/wcm/connect/5f880847-0a8c-4f20-b220-0685af81d03c/allegato+dgr+6675.pdf?MOD=AJPERES&CACHEID=ROOTWORKSPACE-5f880847-0a8c-4f20-b220-0685af81d03c-mDYplMI (accessed on 11 June 2019).
- European Commission. Directive 2016/2284/EC on the Reduction of National Emissions of Certain Atmospheric Pollutants. 2016. Available online: https://eur-lex.europa.eu/legal-content/IT/TXT/?uri=CELEX%3A32016L2284 (accessed on 25 May 2019).
- Guariso, G.; Maione, M.; Volta, M. A decision framework for Integrated Assessment Modelling of air quality at regional and local scale. Environ. Sci. Policy 2016, 65, 3–12. [Google Scholar] [CrossRef]
- Thunis, P.; Miranda, A.; Baldasano, J.M.; Blond, N.; Douros, J.; Graff, A.; Janssen, S.; Juda-Rezler, K.; Karvosenoja, N.; Maffeis, G.; et al. Overview of current regional and local scale air quality modelling practices: Assessment and planning tools in the EU. Environ. Sci. Policy 2016, 65, 13–21. [Google Scholar] [CrossRef]
- Carnevale, C.; Finzi, G.; Pisoni, E.; Volta, M.; Guariso, G.; Gianfreda, R.; Maffeis, G.; Thunis, P.; White, L.; Triacchini, G. An integrated assessment tool to define effective air quality policies at regional scale. Environ. Model. Softw. 2012, 38, 306–315. [Google Scholar] [CrossRef]
- Belis, C.A.; Pernigotti, D.; Pirovano, G.; Favez, O.; Jaffrezo, J.; Kuenen, J.; Van Der Gon, H.D.; Reizer, M.; Riffault, V.; Alleman, L.; et al. Evaluation of receptor and chemical transport models for PM10 source apportionment. Atmos. Environ. X 2020, 5, 100053. [Google Scholar] [CrossRef]
- Pirovano, G.; Colombi, C.; Balzarini, A.; Riva, G.; Gianelle, V.; Lonati, G. PM2.5 source apportionment in Lombardy (Italy): Comparison of receptor and chemistry-transport modelling results. Atmos. Environ. 2015, 106, 56–70. [Google Scholar] [CrossRef]
- Bernardoni, V.; Vecchi, R.; Valli, G.; Piazzalunga, A.; Fermo, P. PM10 source apportionment in Milan (Italy) using time-resolved data. Sci. Total Environ. 2011, 409, 4788–4795. [Google Scholar] [CrossRef] [PubMed]
- Pepe, N.; Pirovano, G.; Balzarini, A.; Toppetti, A.; Riva, G.; Amato, F.; Lonati, G. Enhanced CAMx source apportionment analysis at an urban receptor in Milan based on source categories and emission regions. Atmos. Environ. X 2019, 2, 100020. [Google Scholar] [CrossRef]
- Amann, M.; Bertok, I.; Borken-Kleefeld, J.; Cofala, J.; Heyes, C.; Höglund-Isaksson, L.; Klimont, Z.; Nguyen, B.; Posch, M.; Rafaj, P.; et al. Cost-effective control of air quality and greenhouse gases in Europe: Modeling and policy applications. Environ. Model. Softw. 2011, 26, 1489–1501. [Google Scholar] [CrossRef]
- D’Elia, I.; Bencardino, M.; Ciancarella, L.; Contaldi, M.; Vialetto, G. Technical and Non-Technical Measures for air pollution emission reduction: The integrated assessment of the regional Air Quality Management Plans through the Italian national model. Atmos. Environ. 2009, 43, 6182–6189. [Google Scholar] [CrossRef]
- Miranda, A.; Relvas, H.; Viaene, P.; Janssen, S.; Brasseur, O.; Carnevale, C.; Declerck, P.; Maffeis, G.; Turrini, E.; Volta, M. Applying integrated assessment methodologies to air quality plans: Two European cases. Environ. Sci. Policy 2016, 65, 29–38. [Google Scholar] [CrossRef]
- Turrini, E.; Carnevale, C.; Finzi, G.; Volta, M. A non-linear optimization programming model for air quality planning including co-benefits for GHG emissions. Sci. Total Environ. 2018, 621, 980–989. [Google Scholar] [CrossRef] [PubMed]
- Blond, N.; Carnevale, C.; Douros, J.; Finzi, G.; Guariso, G.; Janssen, S.; Maffeis, G.; Martilli, A.; Pisoni, E.; Real, E.; et al. A Framework for Integrated Assessment Modelling. Syst. Ind. Maint. Boost Qual. Manag. Programs 2016, 9–35. [Google Scholar] [CrossRef] [Green Version]
- Relvas, H.; Miranda, A.; Turrini, E.; Lopes, D.; Silveira, C.; Ferreira, J.; Lopes, M.; Sá, E.; Duque, L.; Borrego, C.; et al. Air Quality Modelling to Support Decision-Making: Scenario and Optimization Approaches. In Air Pollution Modeling and its Application XXIV 2016; Springer: Cham, Switzerland, 2016; pp. 161–165. [Google Scholar] [CrossRef]
- Carnevale, C.; De Angelis, E.; Finzi, G.; Pederzoli, A.; Turrini, E.; Volta, M. A non linear model approach to define priority for air quality control. IFAC-PapersOnLine 2018, 51, 210–215. [Google Scholar] [CrossRef]
- Yarwood, G.; Rao, S.; Yocke, M. Updates to the Carbon Bond Chemical Mechanism: CB05. Final Report Prepared for US EPA. 2005. Available online: http://www.camx.com/publ/pdfs/CB05_Final_Report_120805.pdf (accessed on 9 January 2020).
- Hertel, O.; Berkowicz, R.; Christensen, J.; Hov, Ø. Test of two numerical schemes for use in atmospheric transport-chemistry models. Atmos. Environ. Part A Gen. Top. 1993, 27, 2591–2611. [Google Scholar] [CrossRef]
- Strader, R.; Gurciullo, C.S.; Pandis, S.N.; Kumar, N.; Lurmann, F.W. Development of Gas-Phase Chemistry, Secondary Organic Aerosol, and Aqueous-Phase Chemistry Modules for PM Modeling. Final report for CRC Project A21-1 prepared for the Coordinating Research Council, Atlanta; GA by Sonoma Technology, Inc.: Petaluma, CA, USA, 1998. [Google Scholar]
- Nenes, A.; Pandis, S.N.; Pilinis, C. Continued development and testing of a new thermodynamic aerosol module for urban and regional air quality models. Atmos. Environ. 1999, 33, 1553–1560. [Google Scholar] [CrossRef]
- Yarwood, G.; Morris, R.E.; Wilson, G.M. Particulate Matter Source Apportionment Technology (PSAT) in the CAMx Photochemical Grid Model. In Air Pollution Modeling and Its Application XVII; Springer: New York, NY, USA, 2007; pp. 478–492. [Google Scholar]
- Ramboll Environment and Health. CAMx User’s Guide Version 6.50. 2018. Available online: www.camx.com (accessed on 8 January 2020).
- EEA. Environmental indicators: Typology and overview. Technical Report No. 25/1999, Eur. Environ. Agency. 1999. Available online: https://www.eea.europa.eu/publications/TEC25 (accessed on 11 November 2019).
- Carnevale, C.; Finzi, G.; Guariso, G.; Pisoni, E.; Volta, M. Surrogate models to compute optimal air quality planning policies at a regional scale. Environ. Model. Softw. 2012, 34, 44–50. [Google Scholar] [CrossRef]
- European Commission. ExternE Externalities of Energy. Methodology 2005 Update. 2005. Available online: http://www.externe.info/ (accessed on 11 November 2019).
- Carnevale, C.; De Angelis, E.; Finzi, G.; Pisoni, E.; Turrini, E.; Volta, M. Coupling European data and local air pollution models for integrated assessment. IFAC-PapersOnLine 2018, 51, 67–72. [Google Scholar] [CrossRef]
- Regione Lombardia. INEMAR. 2014. Available online: http://www.inemar.eu/ (accessed on 16 October 2019).
- European Environment Agency. EMEP/EEA Air Pollutant Emission Inventory Guidebook 2016. EEA Report 21/2016. 2016. Available online: https://www.eea.europa.eu/publications/emep-eea-guidebook-2016 (accessed on 18 October 2019).
- ISPRA. BRACE. 2013. Available online: http://www.sinanet.isprambiente.it/it/rete-sinanet (accessed on 18 October 2019).
- Arpal and Convenzione UniBS-Polimi. Progetto VALUTA. 2014. Available online: https://www.arpalombardia.it/Pages/Aria/Aria-Progetti/Progetto-Valuta.aspx (accessed on 4 July 2019).
- Regione Lombardia. Misure di limitazione per migliorare la qualità dell’aria. 2019. Available online: https://www.regione.lombardia.it/wps/portal/istituzionale/HP/DettaglioRedazionale/servizi-e-informazioni/cittadini/Tutela-ambientale/Qualita-dell-aria/misure-di-limitazione-per-qualita-aria/misure-di-limitazione-per-qualita-aria (accessed on 23 December 2019).
- MATTM. Regolamento recante la disciplina dei requisiti, delle procedure e delle competenze per il rilascio di una certificazione dei generatori di calore alimentati a biomasse combustibili solide. 2017. Available online: https://www.gazzettaufficiale.it/eli/id/2017/12/18/17G00200/sg/ (accessed on 23 December 2019).
Figure 1.
DPSIR framework adapted for the Multi-dimensional Air Quality (MAQ) system.

Figure 2.
MAQ model domain. Multi-objective optimization and scenario analysis results are evaluated over Lombardia region (pink cells). The Po Basin Plan (PBP) is applied in Lombardia, Piemonte, Emilia Romagna, and Veneto (green cells).
Figure 2.
MAQ model domain. Multi-objective optimization and scenario analysis results are evaluated over Lombardia region (pink cells). The Po Basin Plan (PBP) is applied in Lombardia, Piemonte, Emilia Romagna, and Veneto (green cells).

Figure 3.
PM10 Source apportionment results in the Lombardia region.

Figure 4.
PM10 Source apportionment results for each Province in Lombardia region.

Figure 5.
(a) PBP and optimal policy (OP) in the objective space, on the horizontal axes the cost over the base case (current 2020 legislation scenario in 2020 (CLE2020)) is represented, on the vertical axes the Air Quality Index, in this case the PM10 yearly average concentration. (b) cost–benefit analysis, on the vertical axes are represented the health savings in terms of morbidity and mortality.

Figure 6.
(a) PBP and OP in the objective space, zoom on costs between 0 M€/yr and 50 M€/yr. (b) cost–benefit analysis, zoom on costs between 0 M€/yr and 50 M€/yr.
Figure 6.
(a) PBP and OP in the objective space, zoom on costs between 0 M€/yr and 50 M€/yr. (b) cost–benefit analysis, zoom on costs between 0 M€/yr and 50 M€/yr.

Figure 7.
(a) Percentage pollutant emission reduction computed by the MAQ system for the two scenarios, PBP and OP. (b) Cost over CLE2020 in each CORINAIR SNAP1 macrosectors for the two scenarios analyzed.
Figure 7.
(a) Percentage pollutant emission reduction computed by the MAQ system for the two scenarios, PBP and OP. (b) Cost over CLE2020 in each CORINAIR SNAP1 macrosectors for the two scenarios analyzed.

Figure 8.
PM10 yearly concentration in the CLE2020 scenario (on le the left), PBP (in the center), and the optimal policy (on the right) (µg/m3).
Figure 8.
PM10 yearly concentration in the CLE2020 scenario (on le the left), PBP (in the center), and the optimal policy (on the right) (µg/m3).


Table 1.
Measures implemented in the PBP.
| SNAP1 | Measure |
|---|---|
| Road transport | Substitution of diesel car EURO 0, 1, 2, 3, 4 with EURO 6 and EURO 6a/b diesel cars |
| Substitution of diesel LDV EURO 0, 1, 2, 3, 4 with EURO 6 and EURO 6a/b diesel LDV | |
| Substitution of diesel HDV EURO 0, 1, 2, 3, 4 with EURO 6 and EURO 6a/b diesel HDV | |
| Substitution of stage 1 and stage 2 (2-strokes) mopeds and motorcycles with stage 3 | |
| Substitution of diesel buses EURO 0, 1, 2 with EURO 6 and EURO 6a/b diesel buses | |
| Non-industrial combustion plants | New performance certification for stoves powered by fuelwood and biomass according to DL 186/2017 to DL 186/2017 |
| Waste treatment | Ban of open agricultural waste burning according to DL 152/2006 |
| Agriculture | Covered outdoor storage of manure in cattle livestock Low Ammonia application in cattle livestock |
Table 2.
Maximum impacts of source apportionment (SA) groups on PM10 average concentration in Lombardia (µg/m3).
Table 2.
Maximum impacts of source apportionment (SA) groups on PM10 average concentration in Lombardia (µg/m3).
| SA Group | PM10 Max Impact (µg/m3) |
|---|---|
| BC—Boundary Conditions | 6.5 |
| MS1—Energy production | 2.1 |
| MS2—Residential heating | 12.9 |
| MS3-4-5—Industrial processes | 12.0 |
| MS6—Solvent use | 0.3 |
| MS7-8—Mobile sources | 10.0 |
| MS9—Waste treatment | 2.3 |
| MS10—Agriculture | 9.1 |
| MS11—Other emission | 2.4 |
Table 3.
Impacts of the scenarios analyzed with respect to CLE2020 in terms of health, costs and savings, Air Quality Index, and greenhouse gases (GHG) emissions.
Table 3.
Impacts of the scenarios analyzed with respect to CLE2020 in terms of health, costs and savings, Air Quality Index, and greenhouse gases (GHG) emissions.
| Scenario | Cost over CLE2020 (M€/yr) | Health Savings (M€/yr) | Energy Savings (M€/yr) | AQI (μg/m3) | ΔAQI (%) | CO2 eq (kt/yr) | ΔCO2 eq (%) |
|---|---|---|---|---|---|---|---|
| CLE2020 | - | 0 | 0 | 20.1 | - | 80,791 | - |
| PBP | 19.6 | 332 | 0 | 19.1 | 5% | 80,786 | 0.01% |
| OP | 19.6 | 468 | 1520 | 18.8 | 6% | 76,453 | 5.37% |
Table 4.
Main measures, both end-of-pipe and energy measures (in italics), selected through the cost-effectiveness optimization approach.
Table 4.
Main measures, both end-of-pipe and energy measures (in italics), selected through the cost-effectiveness optimization approach.
| SNAP1 | Measure | Cost over CLE2020 (M€/yr) | Application Rate variation |
|---|---|---|---|
| Combustion in manufacturing industry | Stage 1 and 2—process NOx and SO2 control in cement and lime industry | 0.08 | 50% (NOx)–10% (SO2) |
| Good practice to limit fugitive emission in iron foundries | 0.10 | 35% | |
| Electrostatic precipitator (1 field and 2 fields) | 0.04 | 20% (1-field)–10% (2-fields) | |
| Solvent and other product use | Use of water-based leather coating | 0.00 | 11% |
| Road transport | Optimization of urban goods delivery (diesel LDV) | 0.89 | 100% |
| Toll payment on ordinary roads for heavy duty vehicles | 0.00 | 50% | |
| Filters of EURO2 buses | 2.04 | 33% | |
| Commuting by bus, walking, bike | 0.56 | 11% | |
| Non-industrial combustion plants | High efficiency deduster in medium boilers | 1.32 | 100% |
| Improved fireplaces | 1.26 | 57% | |
| New biomass stoves | 3.83 | 48% | |
| Performance certification for stoves | 0.11 | 50% | |
| Methane district heating | 0.19 | 25% | |
| Energy performance certificates for buildings | 0.11 | 12% | |
| Other mobile sources and machinery | Stage 3A and 3B on nonroad diesel engines for use in rail traction | 0.60 | 38% |
| Stage 3B on non-road diesel engines for use in construction machinery and agriculture | 0.01 | 22% | |
| Agriculture | Low ammonia application; high efficiency in cattle, pigs and poultry livestock | 7.10 | 80% |
© 2020 by the authors. Licensee MDPI, Basel, Switzerland. This article is an open access article distributed under the terms and conditions of the Creative Commons Attribution (CC BY) license (http://creativecommons.org/licenses/by/4.0/).
Share and Cite
MDPI and ACS Style
De Angelis, E.; Carnevale, C.; Turrini, E.; Volta, M. Source Apportionment and Integrated Assessment Modelling for Air Quality Planning. Electronics 2020, 9, 1098. https://doi.org/10.3390/electronics9071098
AMA Style
De Angelis E, Carnevale C, Turrini E, Volta M. Source Apportionment and Integrated Assessment Modelling for Air Quality Planning. Electronics. 2020; 9(7):1098. https://doi.org/10.3390/electronics9071098
Chicago/Turabian StyleDe Angelis, Elena, Claudio Carnevale, Enrico Turrini, and Marialuisa Volta. 2020. "Source Apportionment and Integrated Assessment Modelling for Air Quality Planning" Electronics 9, no. 7: 1098. https://doi.org/10.3390/electronics9071098
Note that from the first issue of 2016, this journal uses article numbers instead of page numbers. See further details here.