Water Flow Behavior and Storage Potential of the Semi-Arid Ephemeral River System in the Mara Basin of Kenya
 Sospeter Simiyu Wekesa1,2*
  Tibor Yvan Stigter1
  Luke O. Olang2,3
  Francis Oloo2
  Kelly Fouchy1
  Michael E. McClain1,4
- 1Department of Water Resources and Ecosystems, IHE Delft Institute for Water Education, Delft, Netherlands
- 2Hydrology and Earth Information Labs, Centre for Integrated Water Resources Management, Technical University of Kenya, Nairobi, Kenya
- 3Department of Biosystems and Environmental Engineering, Technical University of Kenya, Nairobi, Kenya
- 4Department of Water Management, Delft University of Technology, Delft, Netherlands
Alluvial corridors of ephemeral river systems provide viable opportunities for natural water storage in dry lands. Whilst alluvial corridors are widely recognized as water buffers, particularly for areas experiencing constant water scarcity, little research has been undertaken in Sub-Saharan Africa to explore their hydrological variability and water resource potential as alternative water sources for nearby communities. This study investigated the water flow behavior and storage potential of an ephemeral river system in the Mara Basin of Kenya for purposes of supporting water resources development and ecological sustainability. The water flow processes – including the recharge rates and water loss processes – from existing sand storage systems were established through monitoring of ground and surface water levels. Water samples along the alluvial corridor were collected and analyzed for major ions and isotopic signatures required to establish the water storage dynamics. The storage potential was estimated through Probing and Electrical Resistivity Tomography techniques, augmented with in-situ measurements of hydraulic conductivities and channel bed porosities. The mean annual storage volume in the alluvium of the study reach was estimated at 1.1 Mm3, potentially capable of providing for the annual domestic and livestock water demands of the area. Transmission losses into the alluvium beneath the ephemeral channel-bed were noted to attenuate the flood peak discharges, depending on the level of saturation of the alluvial bed. However, water storage in the alluvium was subject to losses through evapotranspiration and seepage through fractured bedrocks. The study demonstrated the potential of alluvial corridors as water storage buffers providing alternative water sources to communities within the dry land regions with water scarcity, thereby to supporting ecosystem sustainability.
Introduction
Ephemeral river systems (ERS) are a common drainage feature in arid and semi-arid regions across the globe (Hussey, 2007; Camarasa-Belmonte, 2016). Due to erratic rainfall patterns in drylands and lower buffering capacity of catchment storage, their flow pathways are a complex hydrological phenomenon (Tooth, 2000; Morin et al., 2009; Costigan et al., 2017). Normally, the flows of ERS occur for short periods, usually days or even hours, and are a direct response to heavy storm events (Berardi et al., 2013; Dogramaci et al., 2015). A distinguishing feature of ephemeral rivers in semi-arid environments is the presence of a significant volume of water storage in the channel alluvium between runoff events (Mpala et al., 2016). The volume of flow events in such systems is influenced by transmission losses to groundwater storage beneath the channel bed (Abdulrazzak and Sorman, 2006; Shanafield and Cook, 2014; Pacheco-Guerrero et al., 2017). Rapid infiltration and percolation into the unsaturated alluvium during flow events ensures continuous water availability despite the rarity of flow events (Costa et al., 2013, 2012; Jarihani et al., 2015; Rodríguez-Burgueño et al., 2017). Studies have shown that water stored within the alluvium provides an alternative source for sustainable water supply and food production during dry periods (Arnold et al., 2016; Costigan et al., 2017; Koundouri et al., 2017; Olang et al., 2019).
In ERS, alluvial corridors occur due to extreme weather conditions characterized by high variability in precipitation and temperature, leading to incomplete soil formation. The resultant soil type is usually sandy with low cohesive properties that can easily be eroded (Davies et al., 1994; Crouvi et al., 2013; Wang et al., 2014). With each flow event, sediment is mobilized and a layer of deposition builds the channel bed of the ephemeral river (Mansell and Hussey, 2005). Availability of water resources in such “sand rivers” depends largely on the frequency of flow events, the storage potential and permeability of the sands, and the importance of discharge mechanisms such as evapotranspiration, base flow and vertical leakage. Some studies have further shown that unregulated anthropogenic activities are likely to increase water demand thereby altering the hydrological and ecological regimes of such systems (Sheldon et al., 2010; Steward et al., 2012; Chiu et al., 2017).
During the last two decades, there has been an exponential increase in our understanding of ERS, which are abundant in dryland areas of Sub-Saharan Africa, the Mediterranean region as well as some parts of Australia, Chile, and the United States (Cid et al., 2017). Outstanding reviews have synthesized the existing knowledge base on ERS, highlighting their vital ecosystem services (Boulton, 2014). However, relevant to this research, previous efforts to investigate the ERS hydrological processes have emphasized only flow behavior and transmission losses (Hughes and Sami, 1992; Sharma and Murthy, 1994; Lange et al., 1997; Dunkerley and Brown, 1999; Lange, 2005; Mansell and Hussey, 2005; Mpala et al., 2016; Schoener, 2016). Some of these studies have further investigated the interaction between the transmission losses in the alluvium and its consequences on the flow behavior. Water flow behavior in alluvial corridors is largely determined by the rate of transmission losses that often reduces the discharge volumes and peaks as the leading flood wave advances downstream (Tooth, 2000; Morin et al., 2009; Costa et al., 2013). While it is today widely acknowledged that ERS alluvial corridors provide viable opportunities for nature-based water storage in arid and semi-arid regions (Hussey, 2007; Catherine and Fran, 2008; Gonzalez-carballo, 2018; Moulahoum, 2018), few studies have been undertaken within Sub-Saharan Africa to explore their hydrological variability, especially as alternative water sources for areas experiencing water scarcity. This can be largely attributed to limited information on the underlying hydrological processes, due to poor gauge networks coupled with limited infrastructure to support continuous measurements in the drylands.
Several techniques have been developed to assess hydrological variability in ERS (Shanafield and Cook, 2014). These techniques can broadly be classified into three main clusters. The first cluster entails methods – such as monitoring fluctuations in water content, controlled infiltration experiments and use of heat as a tracer – to monitor infiltration through the river bed providing point estimates of infiltration and transmission losses (Parissopoulos and Wheater, 1992; Dunkerley and Brown, 1999; Stewart-deaker et al., 2000; Dahan et al., 2008; Dunkerley, 2008; Batlle-Aguilar and Cook, 2012; Dowman et al., 2013). Although measurements of water content allow for a rapid detection of vertical infiltration rates, it is not possible to determine flux changes once stream bed sediments are saturated. Therefore, the technique cannot capture late infiltration resulting from long flood events and which may be significant in replenishing continuous natural losses from storage such as percolation and transmission flows (Dahan et al., 2008; Olang and Fürst, 2011). Hydraulic properties measured from controlled experiments are not always indicative of infiltration rates at a river-reach-scale, however, the technique provides an opportunity to estimate infiltration rates when it may not be practical to undertake sampling, particularly during flow events. A critical setback to adopting heat as a tracer to estimate infiltration into sand-beds along ephemeral rivers is that sub-surface flow is multidimensional in nature as opposed to the one-dimensional modeling provided in most thermal measurements (Amiaz et al., 2011).
The second set of techniques is based on measuring discharge during flow events to provide estimates of transmission losses over a large spatial extent (Lane et al., 1971; Pool, 2005; Harte and Kiah, 2009; Blasch et al., 2013; Rodríguez-Burgueño et al., 2017). Such methods include water balance estimates along the river reach and tracking of flood-wave fronts. Flow necessary for the water balance calculation over a reach length is typically estimated using a rating curve that provides the stage-discharge relationship. But construction of an accurate rating curve in ERS is problematic due to the flashy nature of flood waves and significant deposition and scouring that constantly alter the streambed geometry (Constantz et al., 1994; Fenton, 2018). Further, alteration of channel geometry makes it difficult to adequately parameterize over a long stretch of reaches for accurate simulation of key hydrological processes using existing models. The third group of approaches involves monitoring groundwater storage dynamics in the alluvium before, during and after flow events providing information on actual recharge into the alluvial deposits (Freyberg, 1983; Sorman and Abdulrazzak, 1993; Abdulrazzak and Sorman, 2006; Christiansen et al., 2011; Dowman et al., 2013). Application of groundwater mounding to estimate direct recharge in ERS relies on numerous assumptions, in particular, homogeneity in the porous medium and uniformity in the geological properties in the longitudinal direction (Hantush, 1967; Goodrich et al., 2013). Groundwater dating provides information on longer-term discharges and requires limited field time. However, it may not be possible to distinguish between indirect-localized recharge resulting from transmission losses and the contribution of diffuse recharge to the river-bed storage (Shanafield and Cook, 2014). Due to variations in both temporal and spatial scales of the measurement methods, processes in ephemeral rivers are at best investigated with a combination of methods. This allows constraining obvious uncertainties associated with each technique since they all have varying weaknesses and strengths.
In this study, we adopted a multi-method approach, involving quantification of the water storage potential of sand deposits in the alluvial corridor, ground and surface water level monitoring and water quality assessment for major ions and stable isotopes. We investigated the relationship between water flow dynamics, recharge into the alluvial corridors as a means of replenishing the natural water storage, and the natural processes that account for water losses in the alluvium. We further looked at the role of the sand river for water users, including groundwater dependent ecosystems.
Materials and Methods
The conceptual approach and flow of methodologies applied in this study are presented in Figure 1. We conducted field measurements of event-based surface water stage and measured groundwater-level fluctuations in the alluvium using pressure transducers. In addition to in-situ water quality measurements, we collected water samples for laboratory analysis of major ions and stable isotopes. We determined sediment type and related water storage potential and permeability of the alluvium along the river reach through probing and Electrical Resistivity Tomography (ERT), augmented with in-situ measurements of hydraulic conductivities and channel bed porosities.
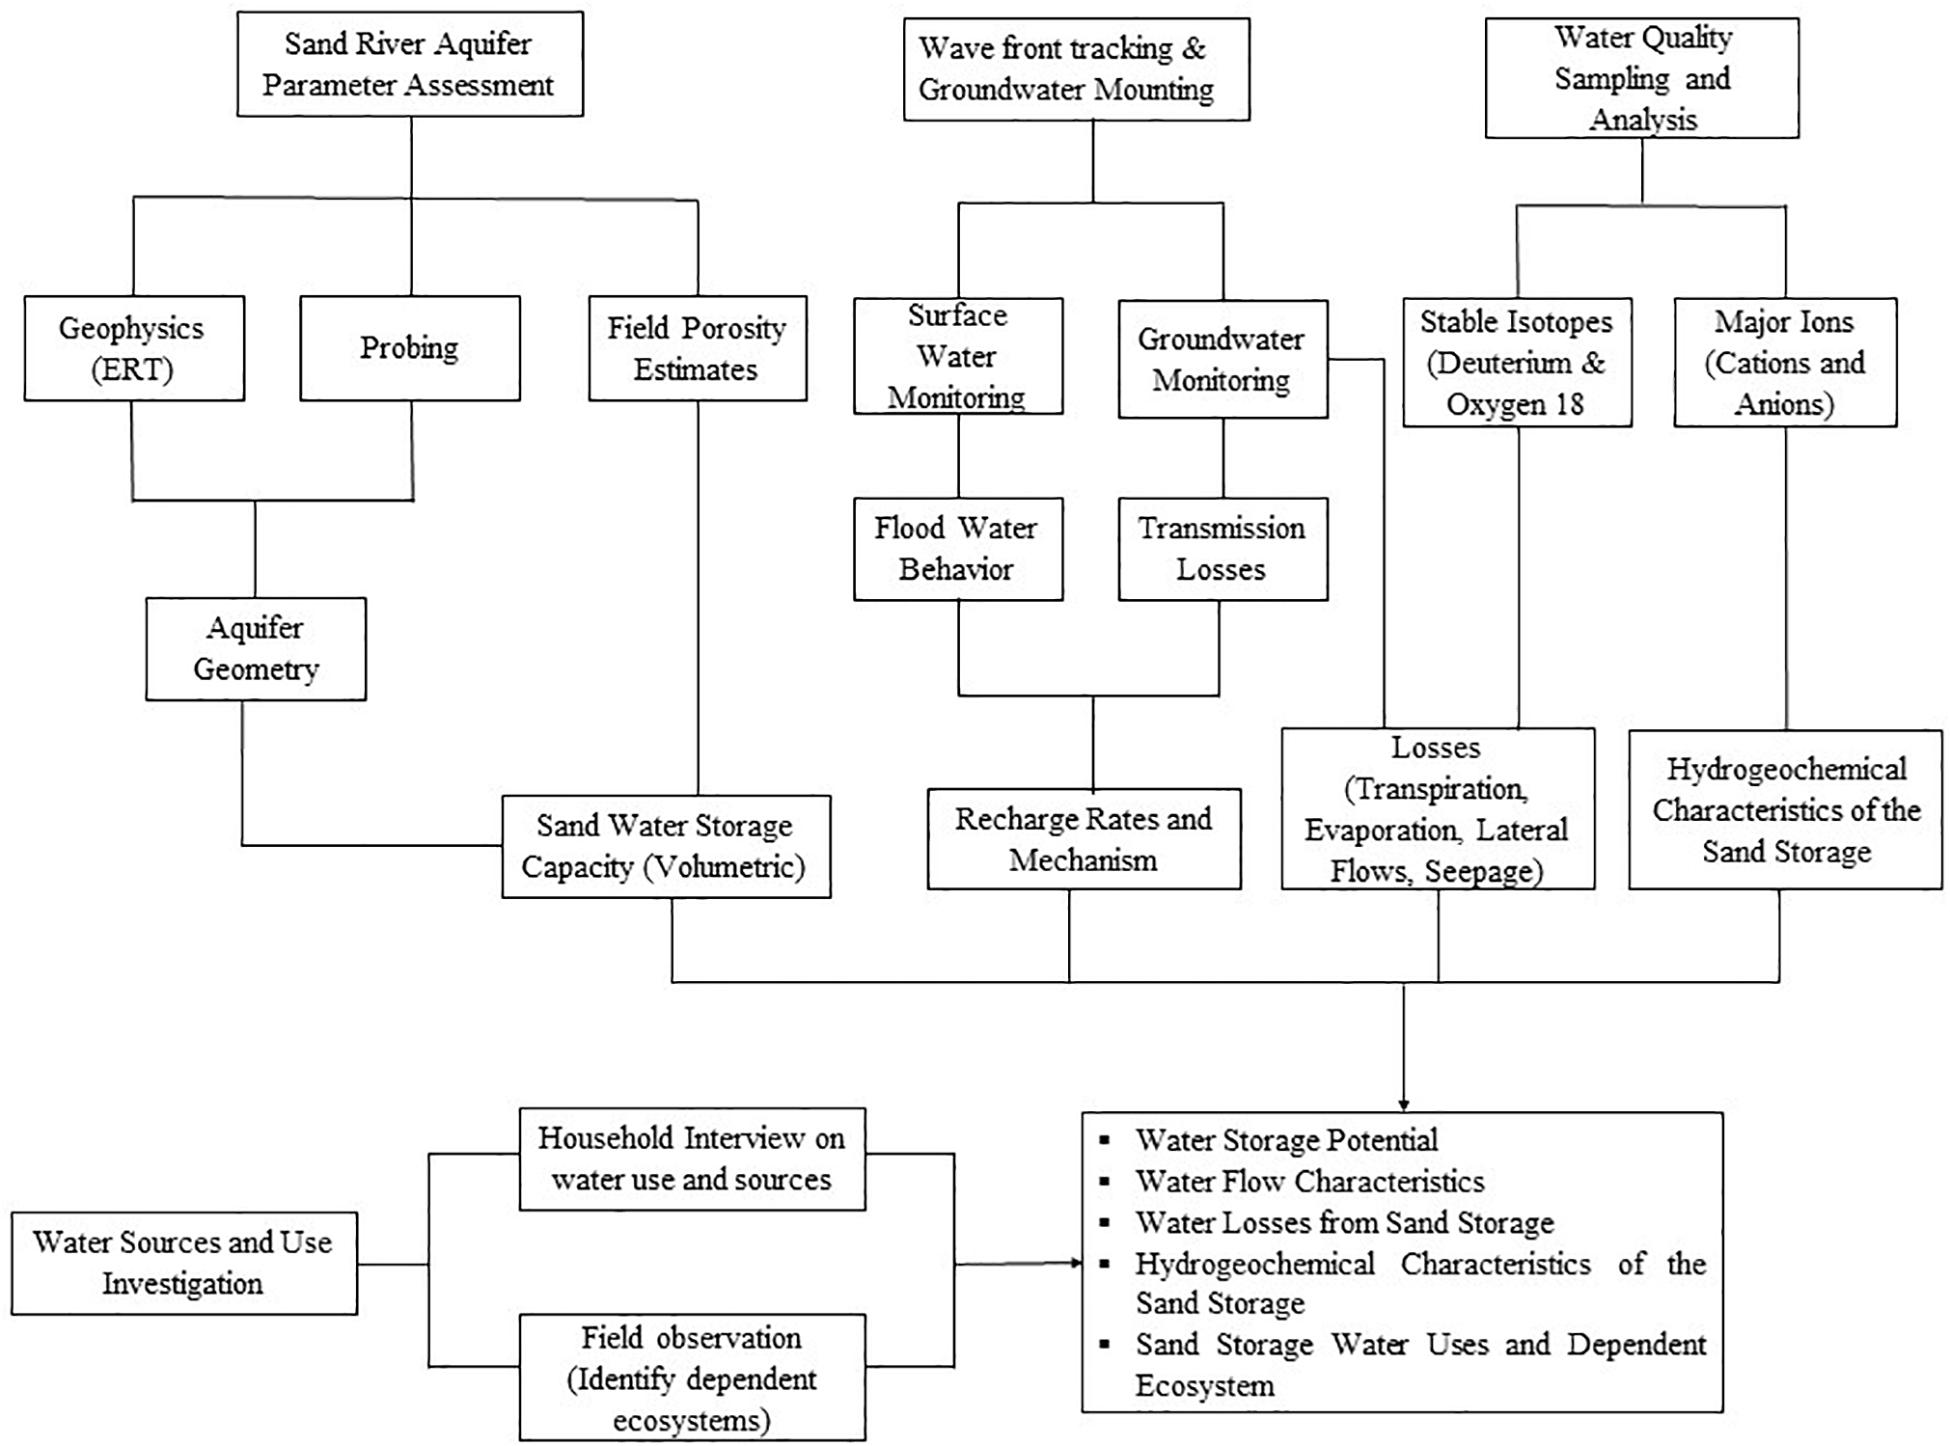
Figure 1. Conceptual approach of the study: flow of methodologies. A three-step multi-method approach was adopted: (1) Desktop study and data collection planning; (2) Field investigations; and (3) Data processing and analysis. Applied techniques cut across the three main group of techniques available to study ephemeral rivers (Shanafield and Cook, 2014).
Description of the Study Area
The Sand River sub-catchment is located on the Kenyan side of the larger transboundary Mara River Basin of Kenya and Tanzania (Figure 2 inset). The Sand River is an ephemeral system, occasionally flooded by high flows from highly variable rain events. The sub-catchment covers an area of 1,830 km2, varying between 1,520 and 2,500 m above mean sea level. The terrain is gently undulating with flood plains that have rocky scarps, influenced by the present geology. Parallel ridges and intruding valleys are dominant in the study area. The lower sections of the Sand River lie within the Masai Mara National Reserve, which is globally and uniquely known for the great wildebeest migration. Rainfall distribution around the area is bimodal, with the longer season concentrated between March and June (Omonge et al., 2020). The annual potential evapotranspiration (about 500–1,200 mm) often exceeds the annual precipitation (about 300–850 mm). Annual recharge of the regional aquifer system is unknown, but climate characteristics of the basin suggest it is small. The daily mean temperatures vary between 17 and 22°C.
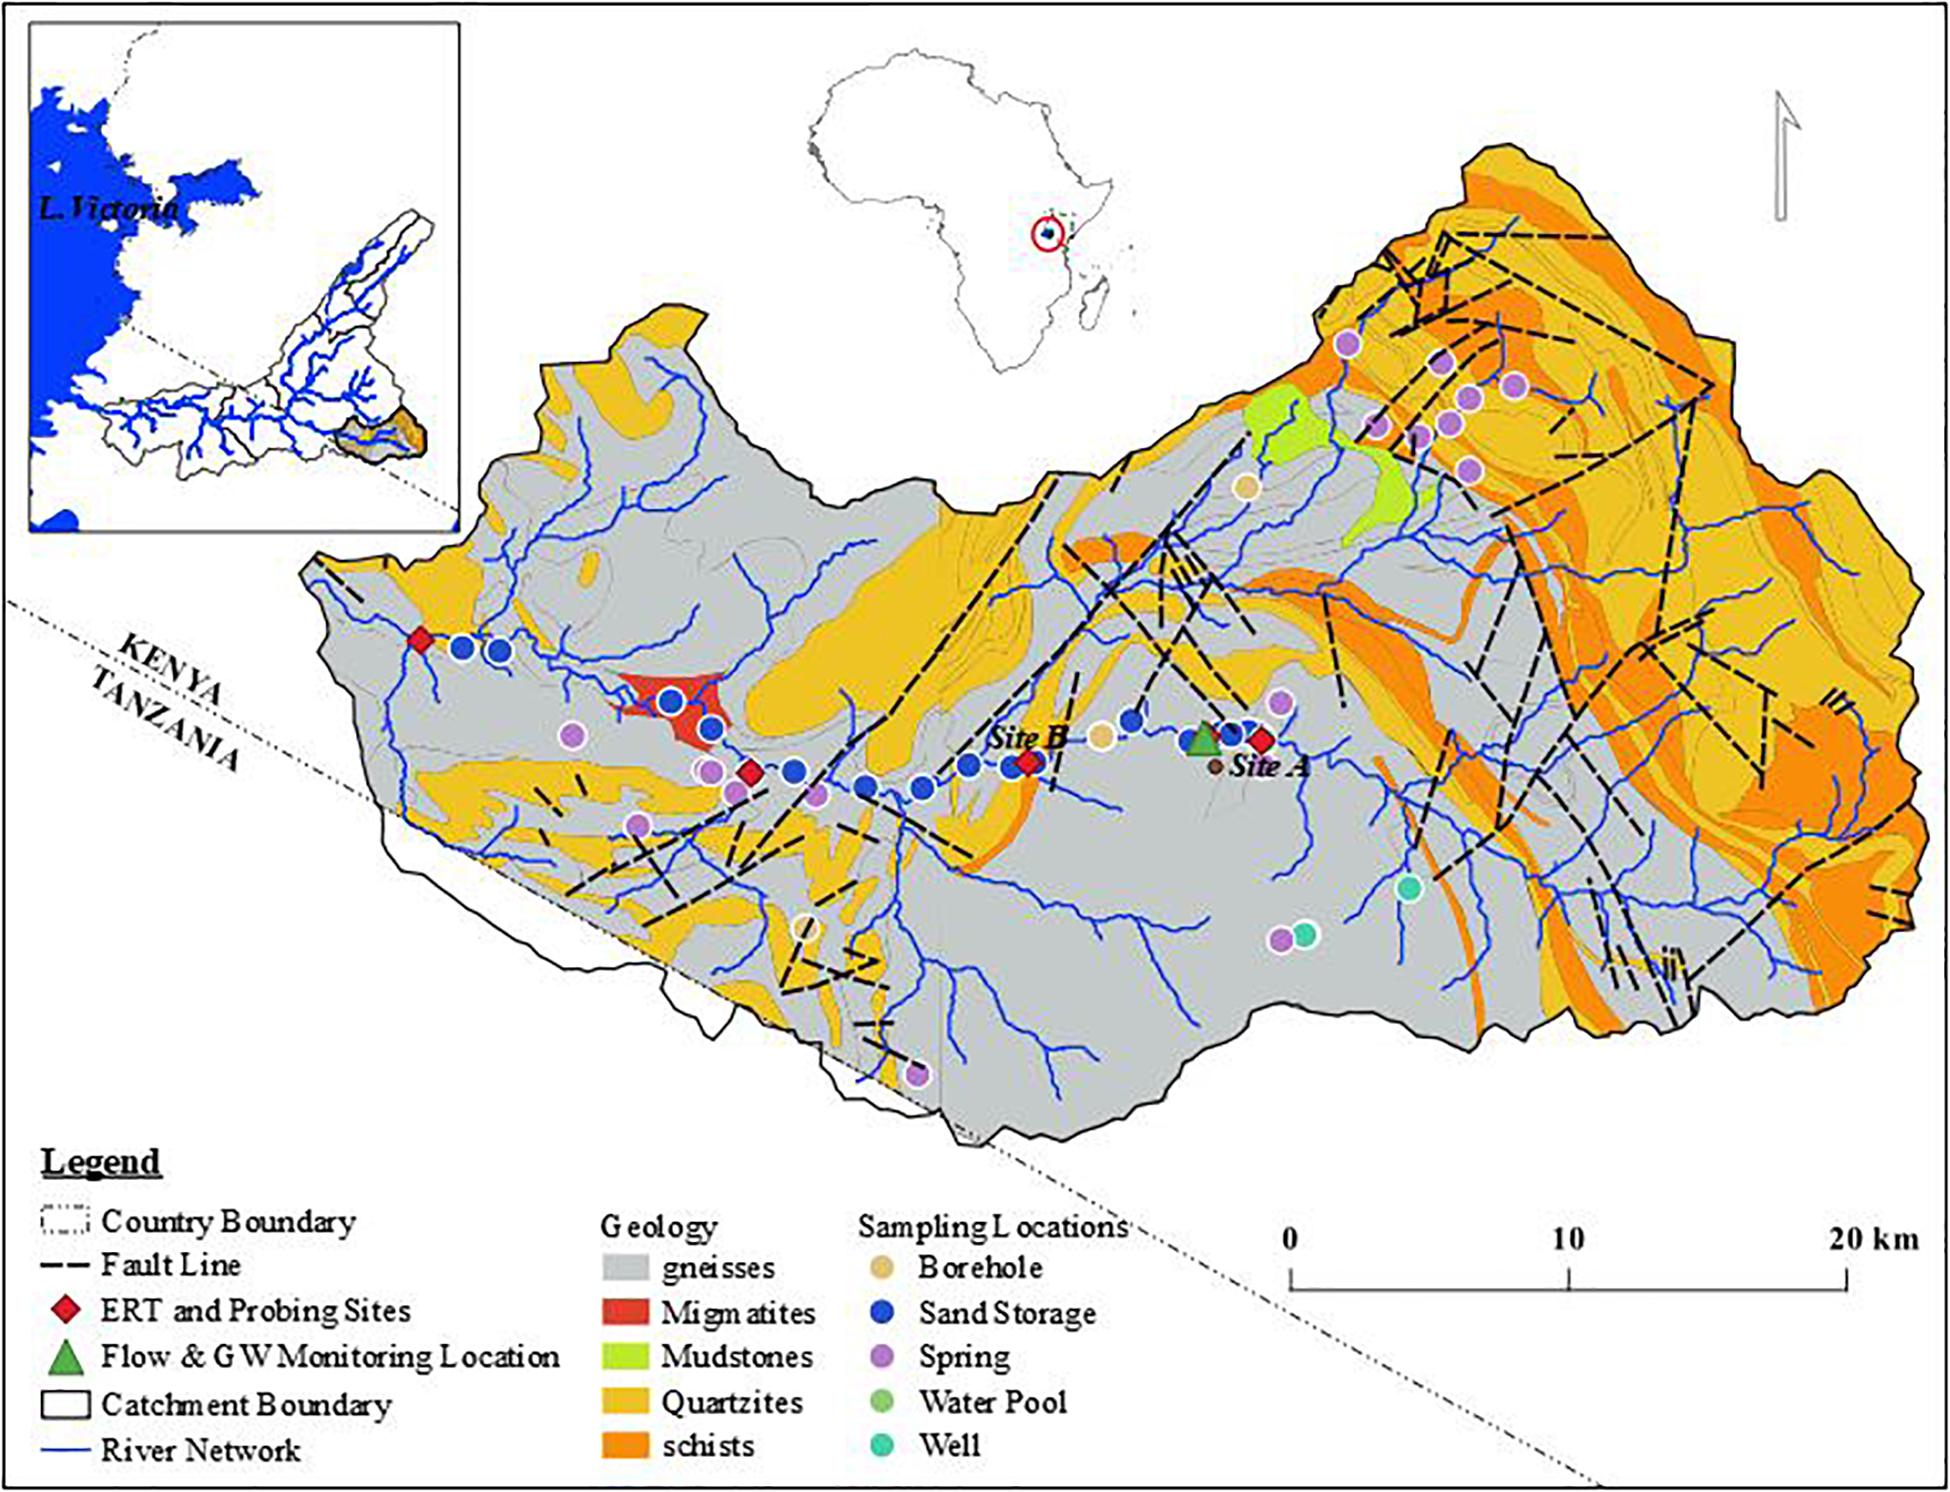
Figure 2. The Sand River sub-catchment, indicating the hydro-geological properties, local surface geology, study water points, and sampling and survey locations.
The main geology is the rock basement system composed of three main metamorphic rocks; gneiss, quartzite and schist (Figure 2). These rocks underlay a superficial layer that forms part of the upper unconfined shallow aquifer. Dominant soil types are clay, clay loam, sandy-clay-loam and sandy-loam (Defersha et al., 2012; Mwangi et al., 2016). Sandy soils are reddish brown surrounding muscovite-quartzite and quartzite rock outcrops in the hilly areas of the sub-basin. Dominant natural vegetation covers in the sub-basin are grasslands and savannah, covering 50 and 28% of the land area, respectively. Fragments of natural and planted forests cover 10% of the total sub-basin area and are concentrated on hillslopes. Shrubs cover 12% of the sub-basin. Economic activities include livestock husbandry, small scale irrigated farming and tourism with livestock keeping being the main source of livelihood in the area (Lamprey and Reid, 2004). Tourism is related to the nearby national reverse and provides an alternative source of income. Socio-economic development is highly dependent on the available water resources in the ephemeral river system.
Estimate of Water Storage Capacity of the Alluvial Corridor
We produced a two-dimensional (2-D) model of the sub-surface resistivity using an ABEM-1000 Terrameter with 41 electrodes attached to a multi-electrode cable spanning 200 m for 8 profiles and 120 m for 2 profiles at selected sites along the reach length as indicated in Figure 2. The ground resistivity obtained from these electrical resistivity tomography (ERT) surveys was related to parameters such as sediment/rock type, porosity and water content (Loke, 2000; Pánek et al., 2008). The Wenner configuration, which has a high sensitivity to vertical changes in resistivity and the strongest signal strength due to its low geometric factor was chosen for electrode configuration. A 5 m electrode spacing was adopted for the first 8 profiles and changed to 3 m for the last 2 profiles to better capture the depth of alluvial deposits at two sites. Measurements were stored in the instrument and downloaded later using ABEM Terrameter SAS4000/SAS1000 Software for inversion in the RES2DINV software (Araffa, 2009). We confirmed the depth of the sand deposits by driving a metallic rod into the sand layers; an approach commonly referred to as probing. Four sites in the upstream of the Sand River sub-catchment were chosen for probing. We noted the depth to the bedrock including elevations and coordinates of the probing points. Probing intervals of 10 and 3 m were adopted for longitudinal and transverse sections respectively. Porosity was measured on site by filling a container of known volume with sand from the probed sections, and adding water to saturation. An approximate value of effective porosity was assumed to be the ratio of the volume of water that saturated the sand to the volume of the container (Mansell and Hussey, 2005). In this case, the sand was disturbed and thus we attempted to achieve some degree of the natural state by gently compacting before saturating with water. Due to limited data available, potential evapotranspiration, which was considered as a sink to sand storage, was estimated based on the Blaney and Criddle approach (Rahimikhoob and Hosseinzadeh, 2014; Hafeez and Khan, 2018). The resultant potential evapotranspiration was then used to estimate the reference evaporation that is often taken as open water evaporation (Han, 2018; Xiang et al., 2020).
Groundwater and Surface Water Monitoring
We made groundwater and surface water measurements at selected sites in upstream sections of the Sand River in the vicinity of the ERT measurements (Figure 2). A piezometer was installed in the middle of the streambed to measure groundwater level fluctuations in the shallow alluvial aquifer (Figures 3A–C). Measurements for groundwater levels were taken at 15-min intervals using a submersible Mini-Diver pressure transducer installed at a depth of 1 m below the surface and with a pressure range of 1,000 cm H2O (Kaasinen, 2003; Freeman et al., 2004). Similar pressure transducers were used to monitor the surface water stage, approximately 10 m upstream of the installed piezometer (Figures 3A,B) and water level fluctuations in a water pool opposite the location of the piezometer (Figures 3A,C) with measurements made at 15-min intervals as well. To obtain the exact depth of water above the divers, raw readings from the transducers were corrected by barometric compensation using measurements of air pressure from a Baro-Diver (Schlumberger Water Services, 2007).
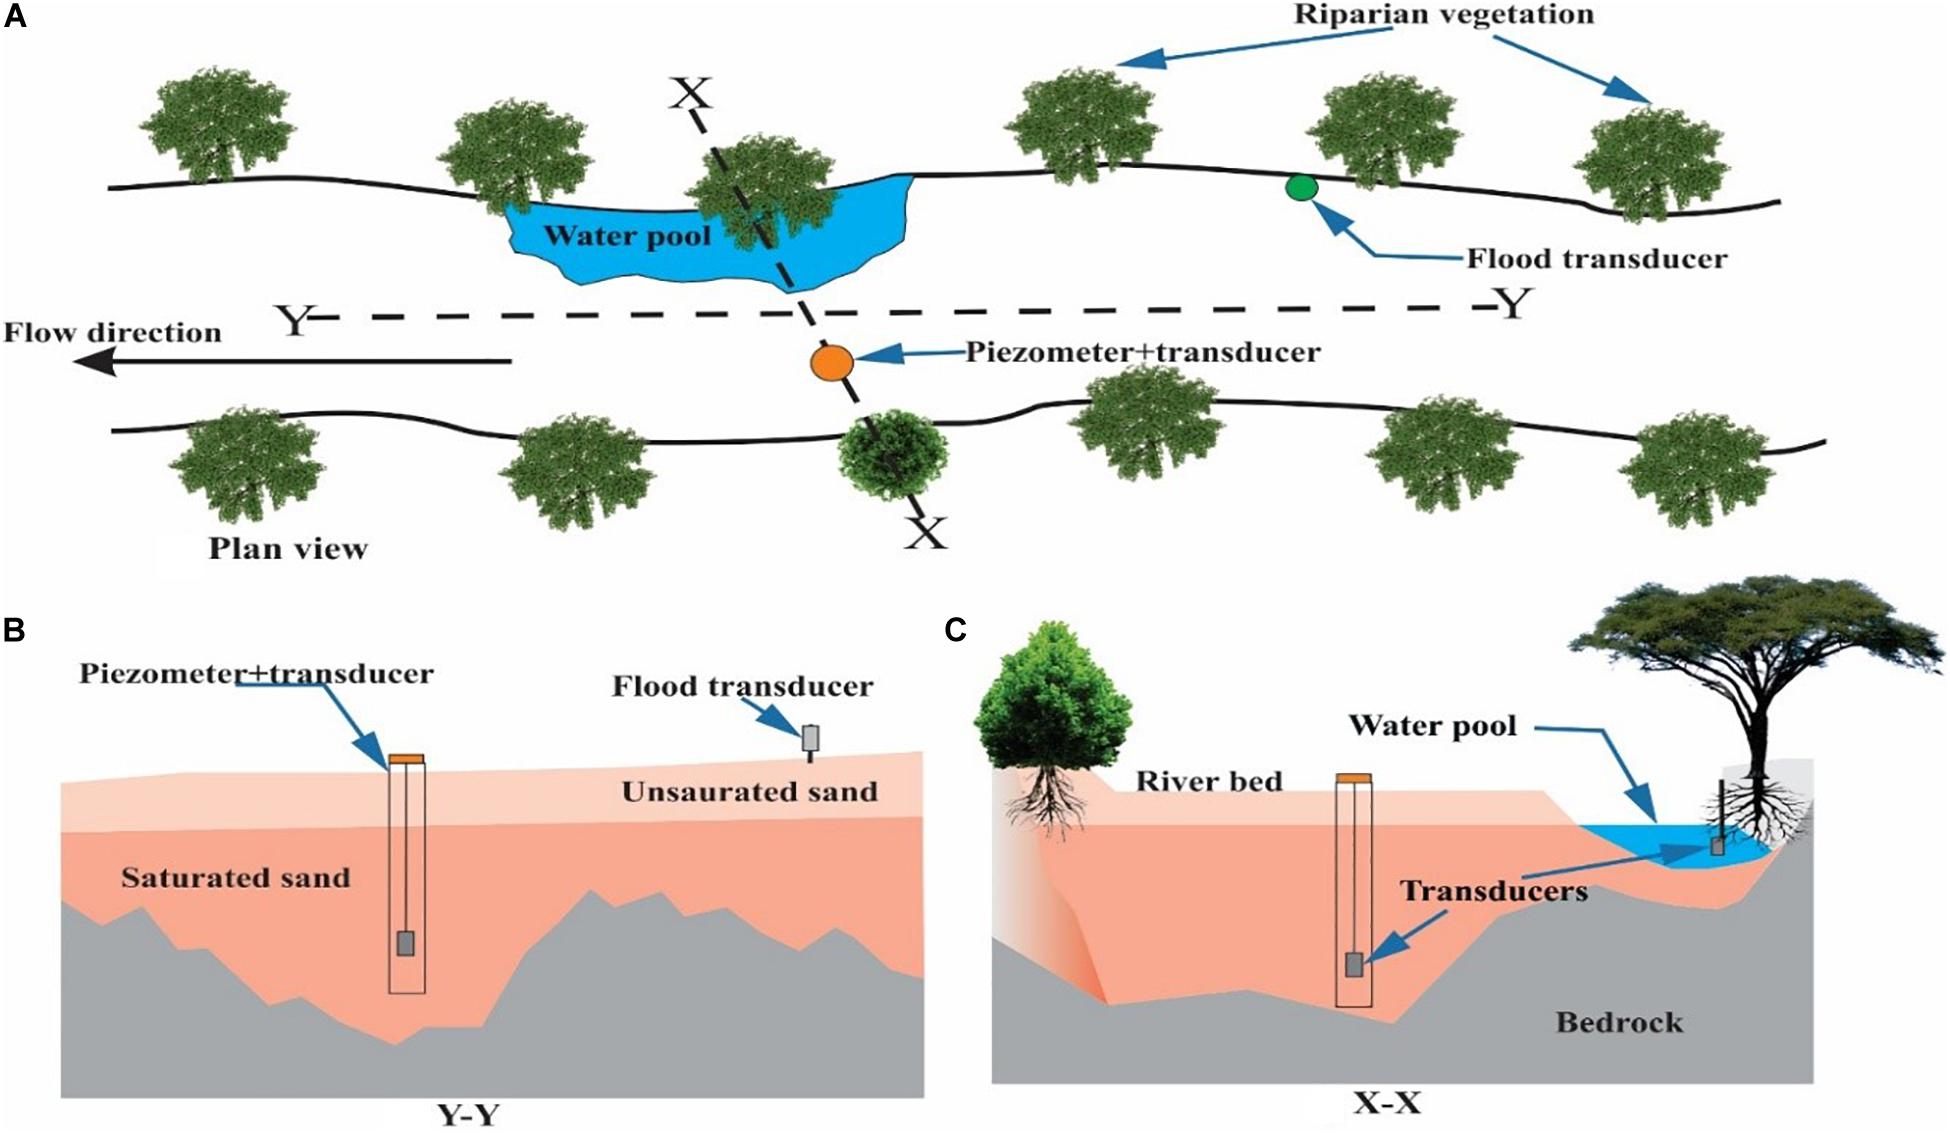
Figure 3. Schematic representation of groundwater, surface flow, and water pools monitoring transducer installations in the upstream of the Sand River sub-catchment between November and December, 2016. (A) Plan view, (B) Longitudinal (Y-Y) section and (C) Transverse (X-X).
Water Sampling and Analysis
We collected water samples along the entire Sand River stretch from both groundwater and surface water (pools, sand and flowing surface water). Two samples were collected per site for major ions. 50 ml sample bottles for both anions and cations were filled with water filtered through 0.45 μm pore size filters. For cations the samples were acidified with 2–3 drops of 65% Nitric acid (Appelo and Postma, 2006) to prevent oxidation, stop bacterial growth and minimize precipitation or adsorption of cations that would otherwise change the chemical composition of the sample. All the samples were then stored cool at 4°C. Samples for stable isotopes (Oxygen-18 and Deuterium) were neither filtered nor stored in regulated conditions. Care was only taken to prevent evaporation of the sample during storage and transportation with double-capped 1 ml glass bottles. Temperature, electrical conductivity (EC), pH, Alkalinity and chloride (Cl) were determined in-situ. Alkalinity is prone to changes and therefore has to be measured in-situ. Conductivity, pH and temperature were measured with probes. A field titration Hach Kit (Hutton, 1983; Bartram and Pedley, 1996) was used to measure alkalinity and Cl with 0.2 M sulphuric acid/bromocresolgreen-methylred indicator for alkalinity and silver nitrate/potassium as reagents for alkalinity and Cl, respectively. Major ions (sodium, magnesium, calcium, nitrate chloride and sulfate) and stable isotopes (Oxygen-18 and Deuterium) were analyzed in the laboratories of IHE Delft, The Netherlands. Spectrometry (Rosenberg and Panne, 2014) was used to measure major cations in which atomic absorption was adopted for magnesium and calcium and atomic emission for sodium. Ion chromatography was used to measure major anions. An LGR liquid water isotope analyser was used to measure stable isotope concentrations and results are reported relative to Vienna Standard Mean Ocean Water (Mook and Geyh, 2000).
Water Sources and Use Investigation
We conducted household interviews to establish the existing water sources supporting varying demand sectors across the catchment. Two main strata were considered representing the two administrative boundaries that form part of the catchment. The stratified sampling technique was adopted for the strata classification since it minimizes errors by ensuring that all the dimensions of a particular target population are included and therefore increases survey efficiency. We further sub-divided the two key strata into multiple sub-strata based on the perceived existing water demand sectors. Main water sources initially envisaged to exist in the study area prior to the household survey included the storage in the alluvium along the Sand River, (un)protected springs, wells and boreholes. Location of the persons interviewed, including water sources, were mapped using the Garmin GPSMAP 64 geographical positioning system. Statistical analysis of the data captured was done using the Microsoft Excel spreadsheet and the resultant excel database converted to GIS database using QGIS software.
Results
Storage Potential
Alluvial Corridor Geometry
Aquifer geometry and sand properties determine the storage potential in the sand deposits along ephemeral river systems. Subsurface resistivity along the river ranged from 10 to 1,280 Ωm (Figures 4A,B). Very low resistivity between 10 and 15 Ωm on either side of the riverbanks (bottom graphs of 4A/B) revealed clay-rich sediments in the subsurface, whereas the highest resistivities (above 400–500 Ωm) reveal the occurrence of (partially fractured) bedrock. The probing results illustrate the undulating nature of the bedrock, creating natural micro reservoirs that impede downstream flows within the sand deposits. They further reveal the limited thickness of the sand river deposits and shallow depth of the bedrock, ranging from 0 m (at rock outcrops) to a maximum of 2 m (Figures 4C,D). Both the longitudinal and transverse resistivity profiles at site A illustrate the presence of water at greater depths (as shown by intermediate resistivities, 20–160 Ωm) and thus a possible existing connectivity between the sand river alluvial aquifer and the regional aquifer system. The occurrence of downward or upward flow depends on the differences in hydraulic head between the two aquifers. However, ERT profiles could not distinctively show the depth of the shallow alluvium even at 3-m electrode spacing.
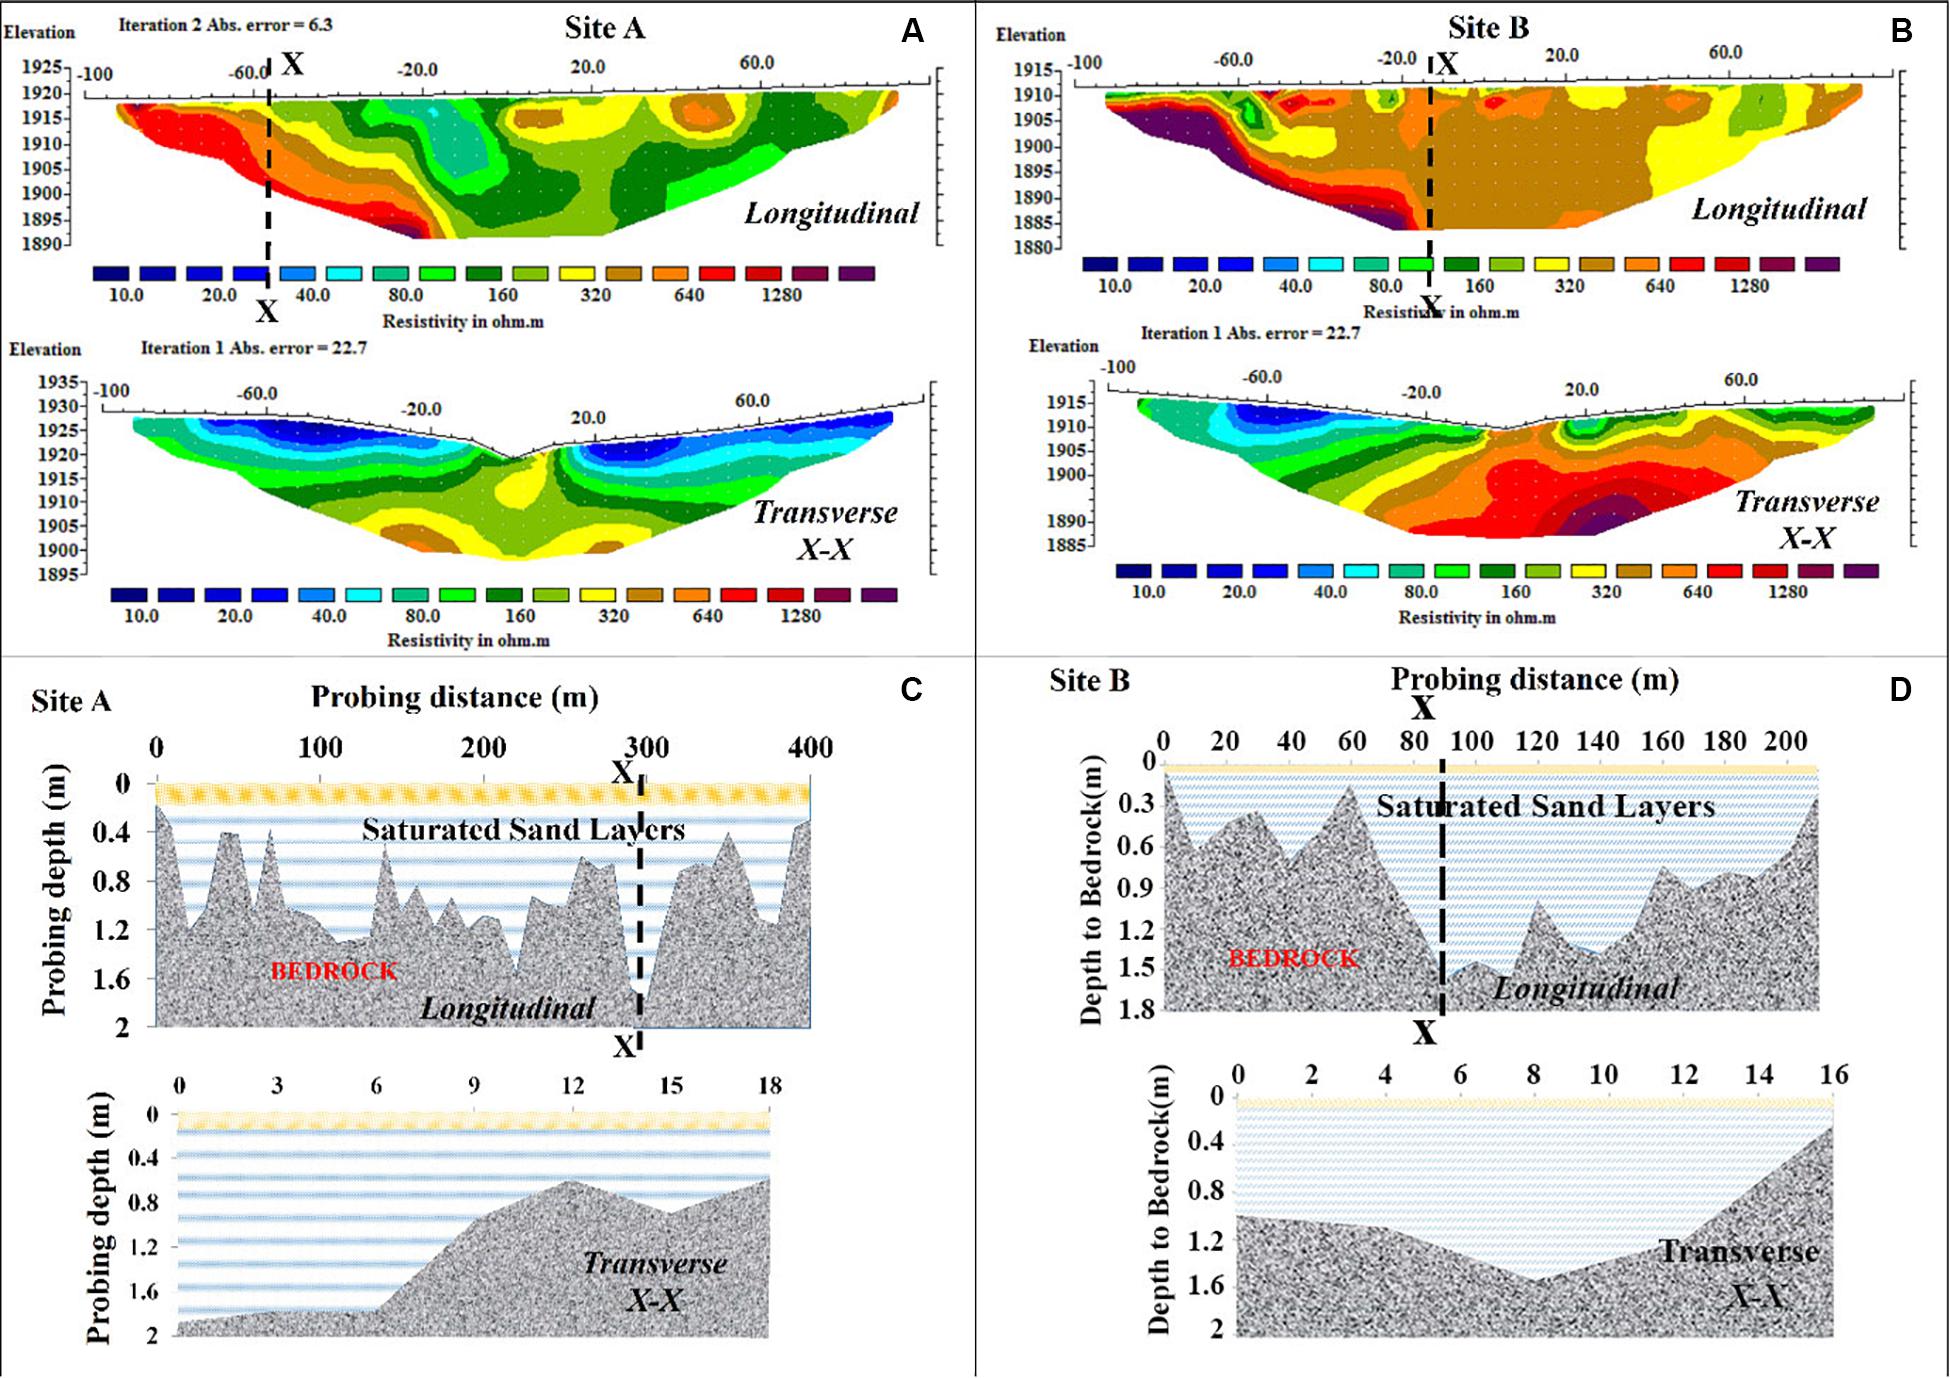
Figure 4. Longitudinal and transverse profiles of resistivity (A,B) and probed bedrock depths (C,D) undertaken at sample sites A and B.
Water Sand Storage Potential
The potential of water storage in the alluvium along the sand river was estimated for sections A and B, which are 10 km apart (Figure 2). Based on the estimated aquifer geometry determined by probing depth and measuring width along the reach length, the potentials of water storage at full capacity for sections A and B are 6,810 and 2,757 m3, respectively. The sand medium was assumed to be isotropic with a uniform field measured total porosity of 33%. The volume estimates were based on lengths of 400 and 210 m for the two sections (Figures 4C,D). Considering the length of the two sections, storage potential per unit length (m) is 17 and 13 m3/m for sections A and B, respectively.
Water Flow Characteristics
Surface Flow Behavior
Historical stage measurements from the downstream of the Sand River record high flow variability (Figure 5A). Observed water levels <0.3 m were considered as a non-flowing or dry river. At a gauge height of 0.7 m, there was a major deflection point on the frequency exceedance curve. We adopted this level as a flood event threshold. Frequency duration analysis indicated that 37 dry spells occurred between July 2013 and January 2016. 30% of the dry spells lasted for a maximum of 2 weeks while the rest persisted for more than a month. The longest dry spell and flood event in the 31-month period lasted for approximately 4 months and 2 weeks, respectively. Our flow stage measurements performed in the field between the 23rd and 27th of November 2017 at a selected site in the upstream of the catchment captured two significant flood flow events (Figure 5B): one of maximum 33.3 cm that occurred on the 24th and one of maximum 89.9 cm that occurred on the 25th. A smaller event was also captured on the 27th.
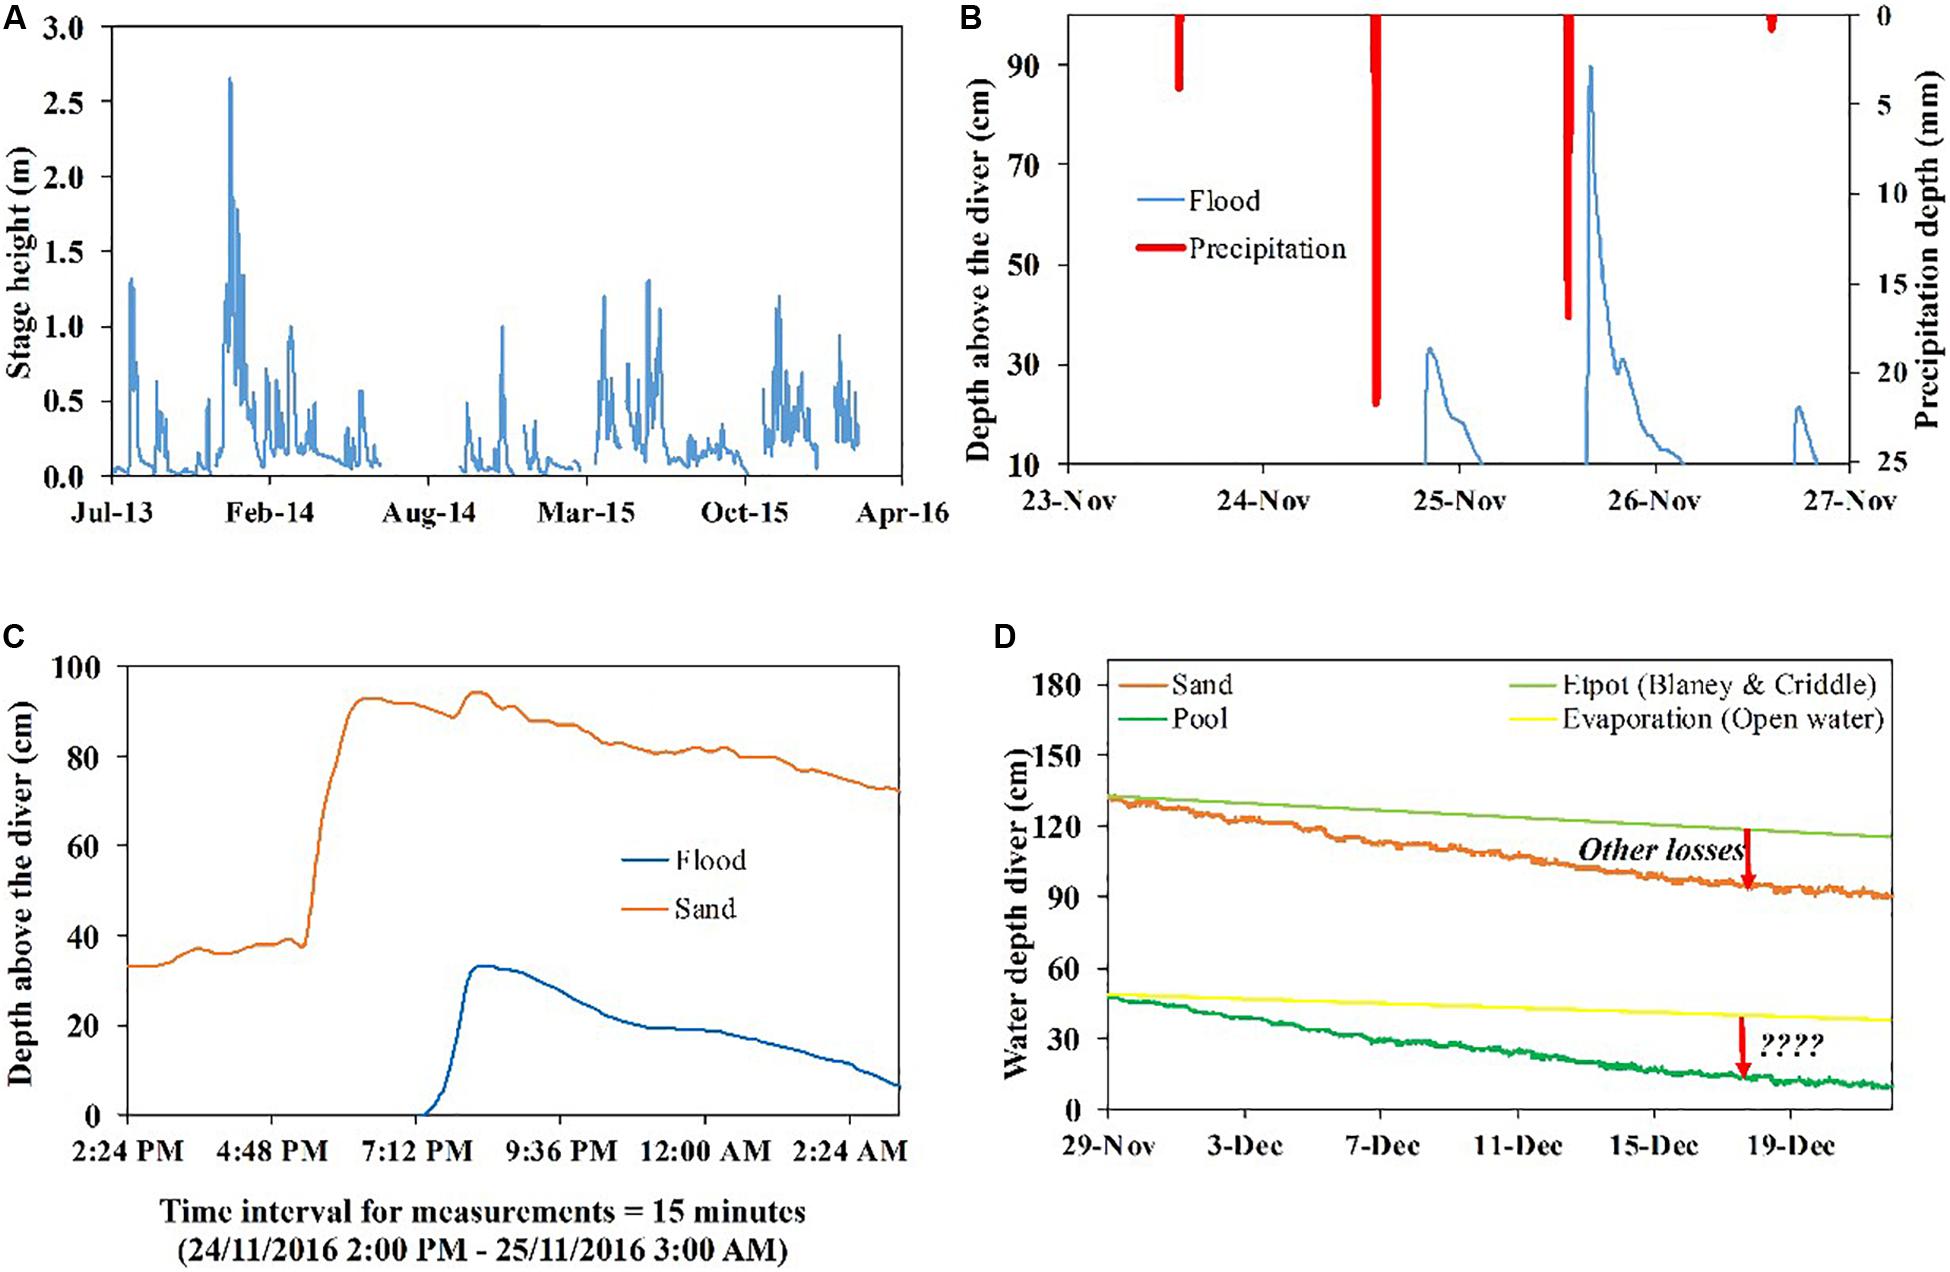
Figure 5. (A) Hydrograph at sand river gate gauge site; (B) flow responses based on individual rain events; (C) recharge and flood dynamics; and (D) losses in the sand storage due to evaporation and transpiration, as well as other losses to vertical and lateral flow. Surface water and Groundwater monitoring were undertaken at the site indicated in Figure 2. However, historical measurements were for the existing gage station further downstream.
Transmission Losses and Recharge
Measured hydrographs for the floodwater and groundwater recharge in the alluvial corridors exhibit similar characteristics; steep rising and gentler recession limbs with a lag in time of rise (Figure 5C). The recession limbs were clearly noted to have a longer duration. A recharge process observed on the 24th of November after a rain event indicated a steady rise in groundwater level to full aquifer saturation in 1.5 h. The sand deposits remained fully saturated with minor fluctuations until the floodwater peaked, after which both hydrographs, groundwater and surface water, receded at a similar rate. The groundwater level in the alluvial deposits remained at a higher level than before the flood onset and subsequent infiltration, percolation and recharge. The rising limb of the groundwater hydrograph defines the rate of recharge while the difference between initial and final groundwater levels defines the amount of transmission losses. A recharge rate of 0.6 cm/min resulted in a recharge magnitude of 0.34 m. Assuming isotropy in the aquifer with porosity and uniform river width of 33% and 15 m, respectively, estimated recharge volume occurring per unit length is approximately 1.7 m3.
Losses From the Sand Storage
Losses from the aquifer due to direct evaporation are evident by the stable isotope composition in the water samples collected along the Sand River (Figure 6A). Isotopic ratios ranged from 7.1 to -19‰ and 0.89 to -3.8‰ for Deuterium (δ2H or δD) and Oxygen-18 (δ18O), respectively. The gradient of a straight line fitted to the data points is 5.64, a value less than 8.13 and 7.68, slopes for the Global Meteoric Water Line (GMWL) and Local Meteoric Water Line (LMWL), respectively. Zooming into the sub-daily data for the water pool inside the sand river (Figure 6B) reveals that the water level in the pool and sand deposits drops during the daytime and stabilizes during the night (Figure 6B). The drop of 30 mm is too high for evaporation alone; uptake and transpiration by riparian vegetation must play an additional role. No drop in water level occurs at midnight. Maximum increase in water level rise ensues between midnight and 4AM, an indication of lateral inflow from the aquifer. Figure 5D illustrates that losses in the Sand River are higher than only from evapo(transpiration), as the drop in water level over time needs to be explained by other losses.
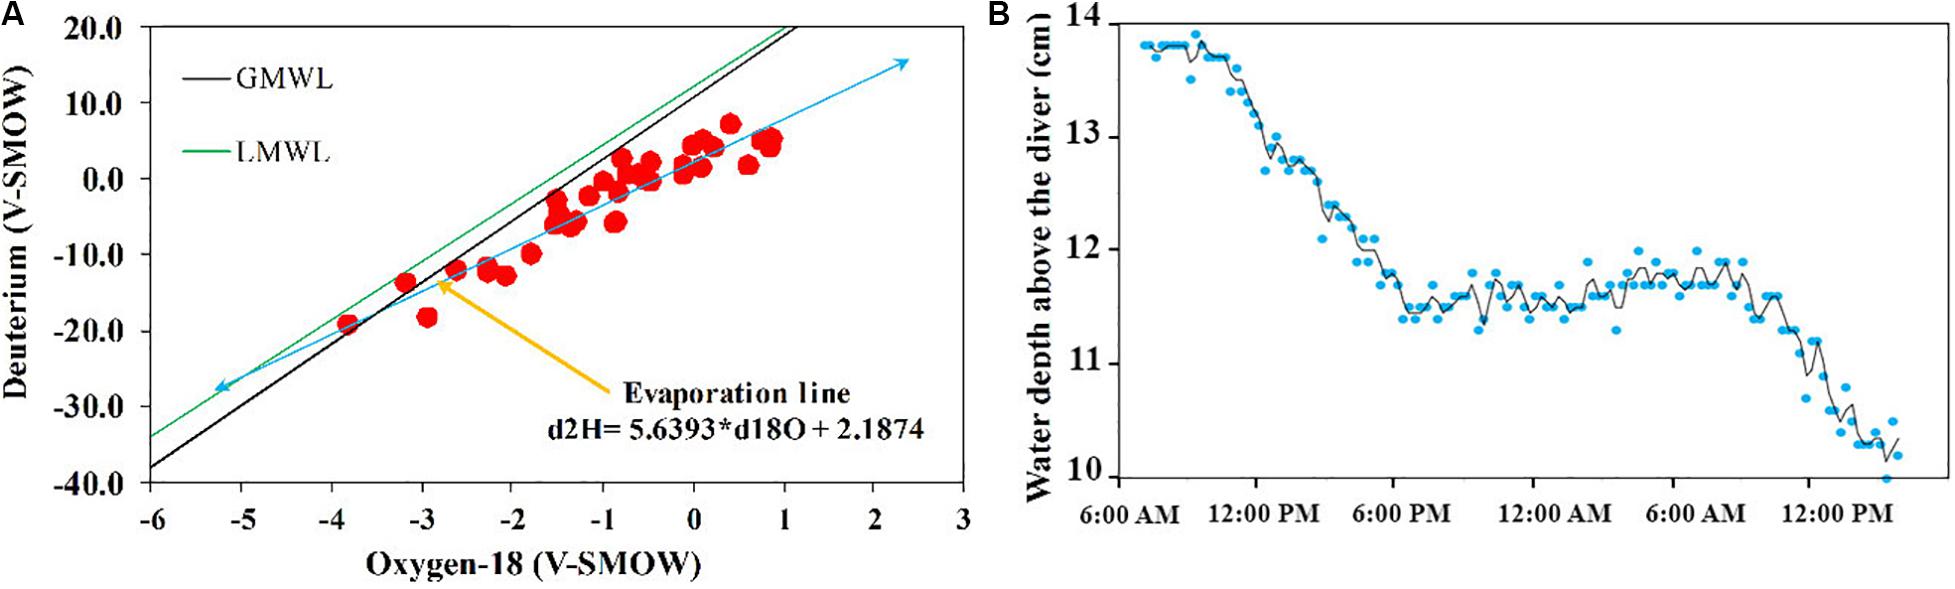
Figure 6. (A) Isotopic composition for samples from the sand deposits; (B) Diurnal fluctuations in water level obtained from water level measurements in the pool.
Hydro-Geochemical Characteristics of the Sand Storage
Groundwater in the alluvial storage is mainly characterized by a Ca-HCO3 water type (Figure 7). Calcium and sodium are the main cations while bicarbonate is the main anion. The presence of Na+ and Ca2+ is attributed to the geological formations of the study area, in particular gneiss and schist, which are composed of silicate minerals rich in Na+ and Ca2+. Upon weathering the incongruent dissolution releases these cations and produces HCO3– through reaction with dissolved CO2. This causes the Na/Cl ratio in the water samples to exceed the seawater ration of 0.86 (Figure 8F). Surface water in the discrete isolated water bodies along the Sand River presents two distinct water types: Ca-HCO3 and Ca-Cl/Ca-SO4 suggesting different environments drive the chemistry. Surface water chemistry indicating Ca-HCO3 water type is revealing the signature of the alluvial aquifer, indicating groundwater stored in the alluvium is discharged to the surface at some point. The CaSO4/CaCl water type represents run-off, with a low bicarbonate concentration and somewhat higher sulfate and chloride concentrations due to evaporation.
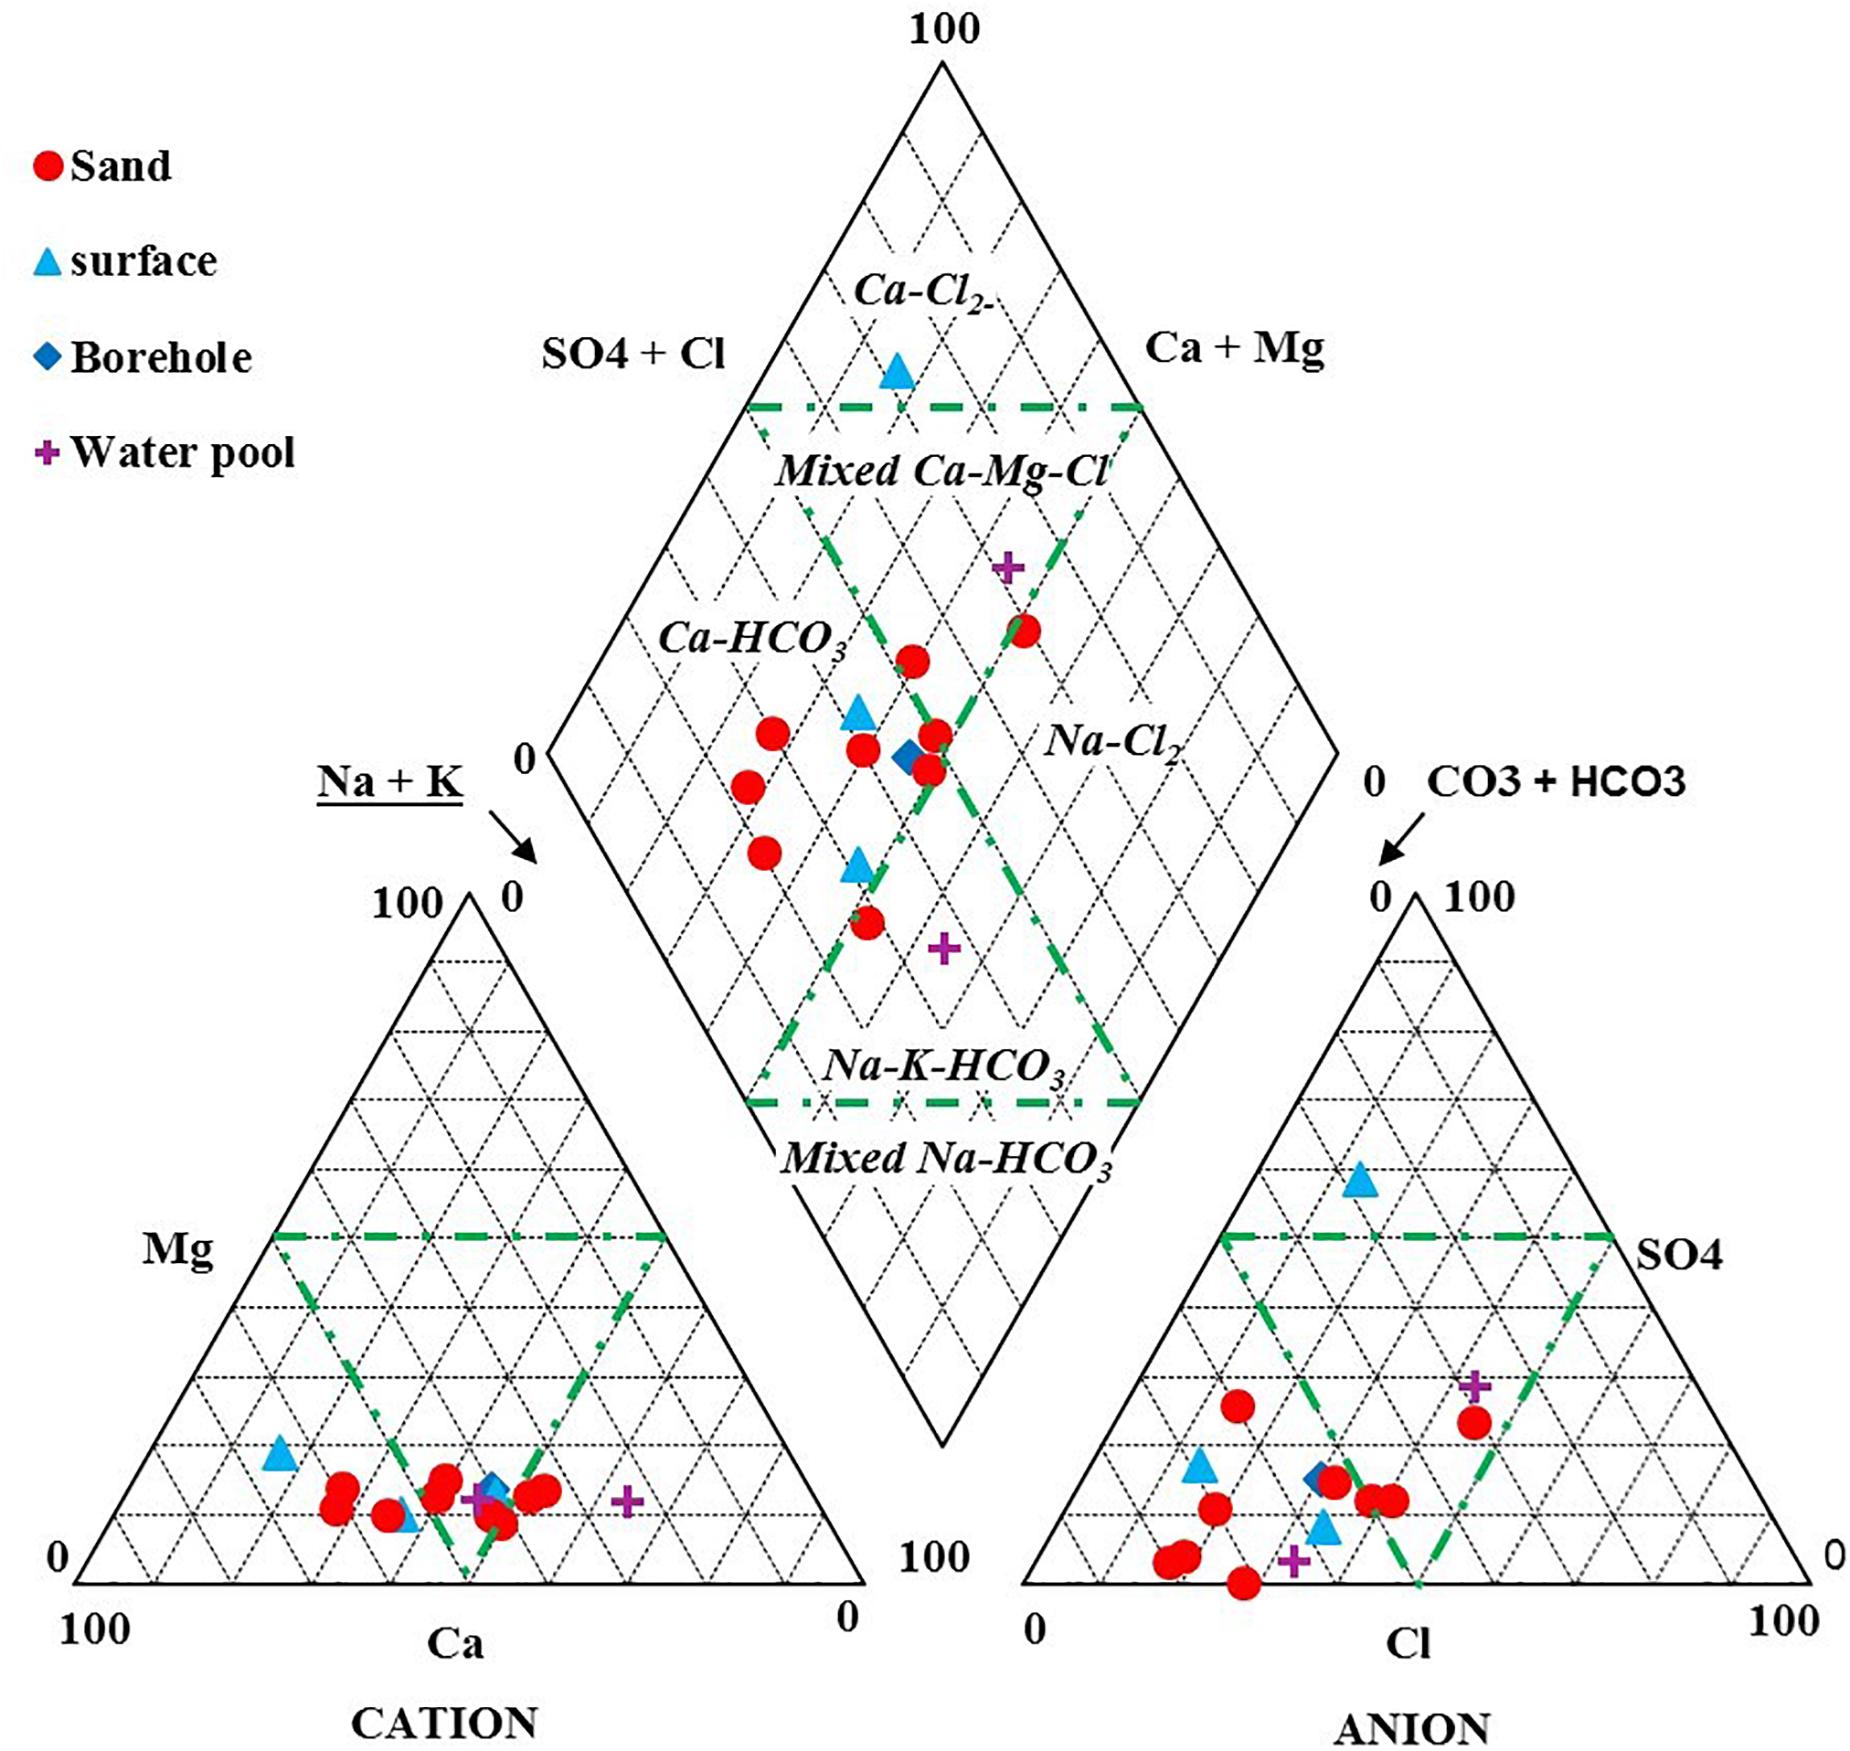
Figure 7. Surface water and groundwater samples collected from the Sand River (Alluvium, surface flow, storage in the water pools) and boreholes plotted in a Piper-Trilinear diagram.
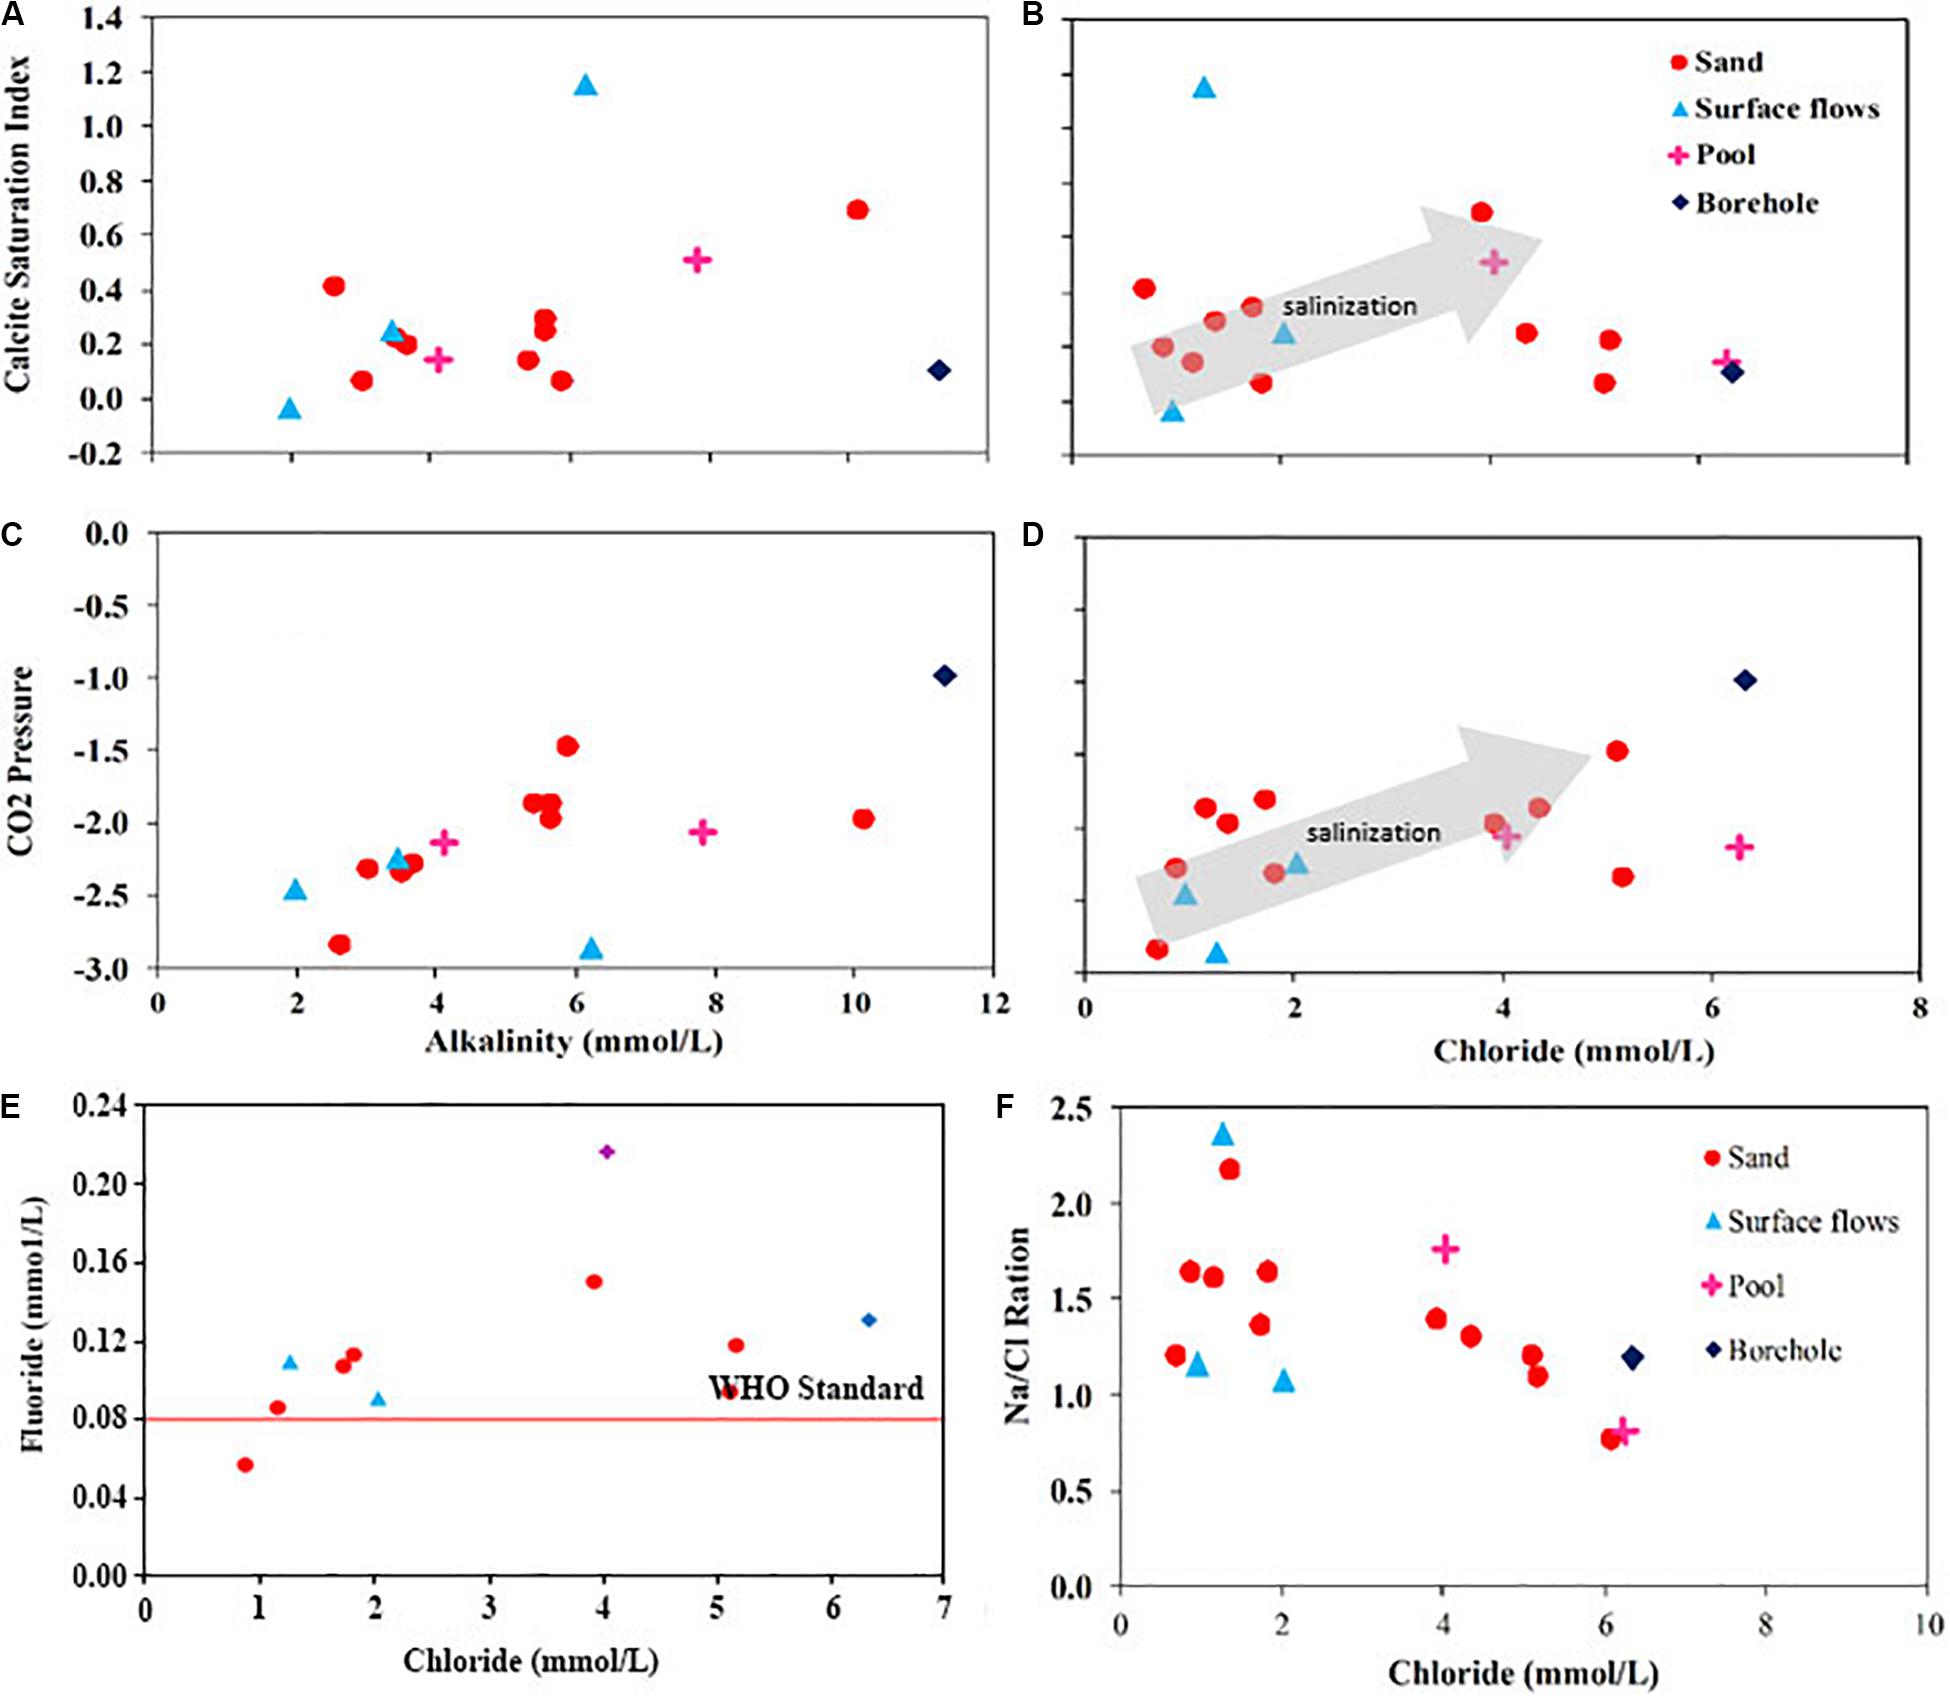
Figure 8. Scatter plots for calcite saturation vs. alkalinity (A) and chloride (B), CO2 pressure vs. alkalinity (C) and chloride (D), fluoride vs. chloride (E) and Na/Cl ratio vs. chloride (F).
Calcite saturation in the collected samples is directly proportional to alkalinity (Figure 8A). All the waters from the sand deposits are in equilibrium or slightly super-saturated with calcite. Supersaturation seems enhanced by evaporation as revealed by higher Cl concentrations (Figure 8B) and a positive correlation with calcite saturation in some samples. In more evaporated groundwater samples, calcite precipitation has already occurred, lowering the saturation index again. CO2 pressures in the sand deposits range from 10–1.5 atm, typical for groundwater passing through soils richer in CO2, to 10–3.0 atm, almost in equilibrium with the atmosphere (Appelo and Postma, 2006) (Figures 8C,D). CO2 pressures of the water pools confirm their hydraulic connection to the alluvial aquifer (Figure 3C), and the same holds for the river water, although lower CO2 pressures do reveal degassing taking place (confirmed by a high calcite supersaturation in one of the samples). Fluoride concentration in water along the Sand River is almost everywhere above 1.5 mg/L (Figure 8E), the admissible maximum concentration based on WHO guidelines. The relationship between sodium and chloride gives even more insights into the hydrogeological processes that occur in the alluvial aquifer altering the chemistry of the recharged water (Figure 8B).
Sand Storage Water Uses and Dependent Ecosystems
Water storage in the alluvium supports local livelihoods and diverse ecosystems. Local people informed us they use water in the alluvium to support their own domestic needs as well as their livestock needs. Abstractions for livestock and domestic water are estimated as approximately 1.3 Mm3/year. Sheep account for more than half the total livestock population in the Sand River sub-catchment, but water is also used by cows, goats and donkeys. In general, livestock accounts for 80% of the total water demand. Discrete isolated water bodies commonly referred to as water holes (Sheldon et al., 2010) were observed along sections of the river channel (Figure 9). Such water holes mainly occur at channel bends with a rocky river bed, in the vicinity of large riparian trees and channel sections with rock outcrops. Despite their shallow nature (<0.5 m), some of the water holes hold water through the dry periods. The drop in water level in the pool was similar to the drop in the sand deposits, suggesting a connection between the sand storage and the persistence of the water holes (Figure 5D). EC values for the sampled water holes ranged between 1,762 and 930 μS/m. A borehole in the vicinity of the sampled water holes had an EC value of 1,569 μS/m, while water from the alluvium nearby indicated an EC concentration of 975 μS/m.
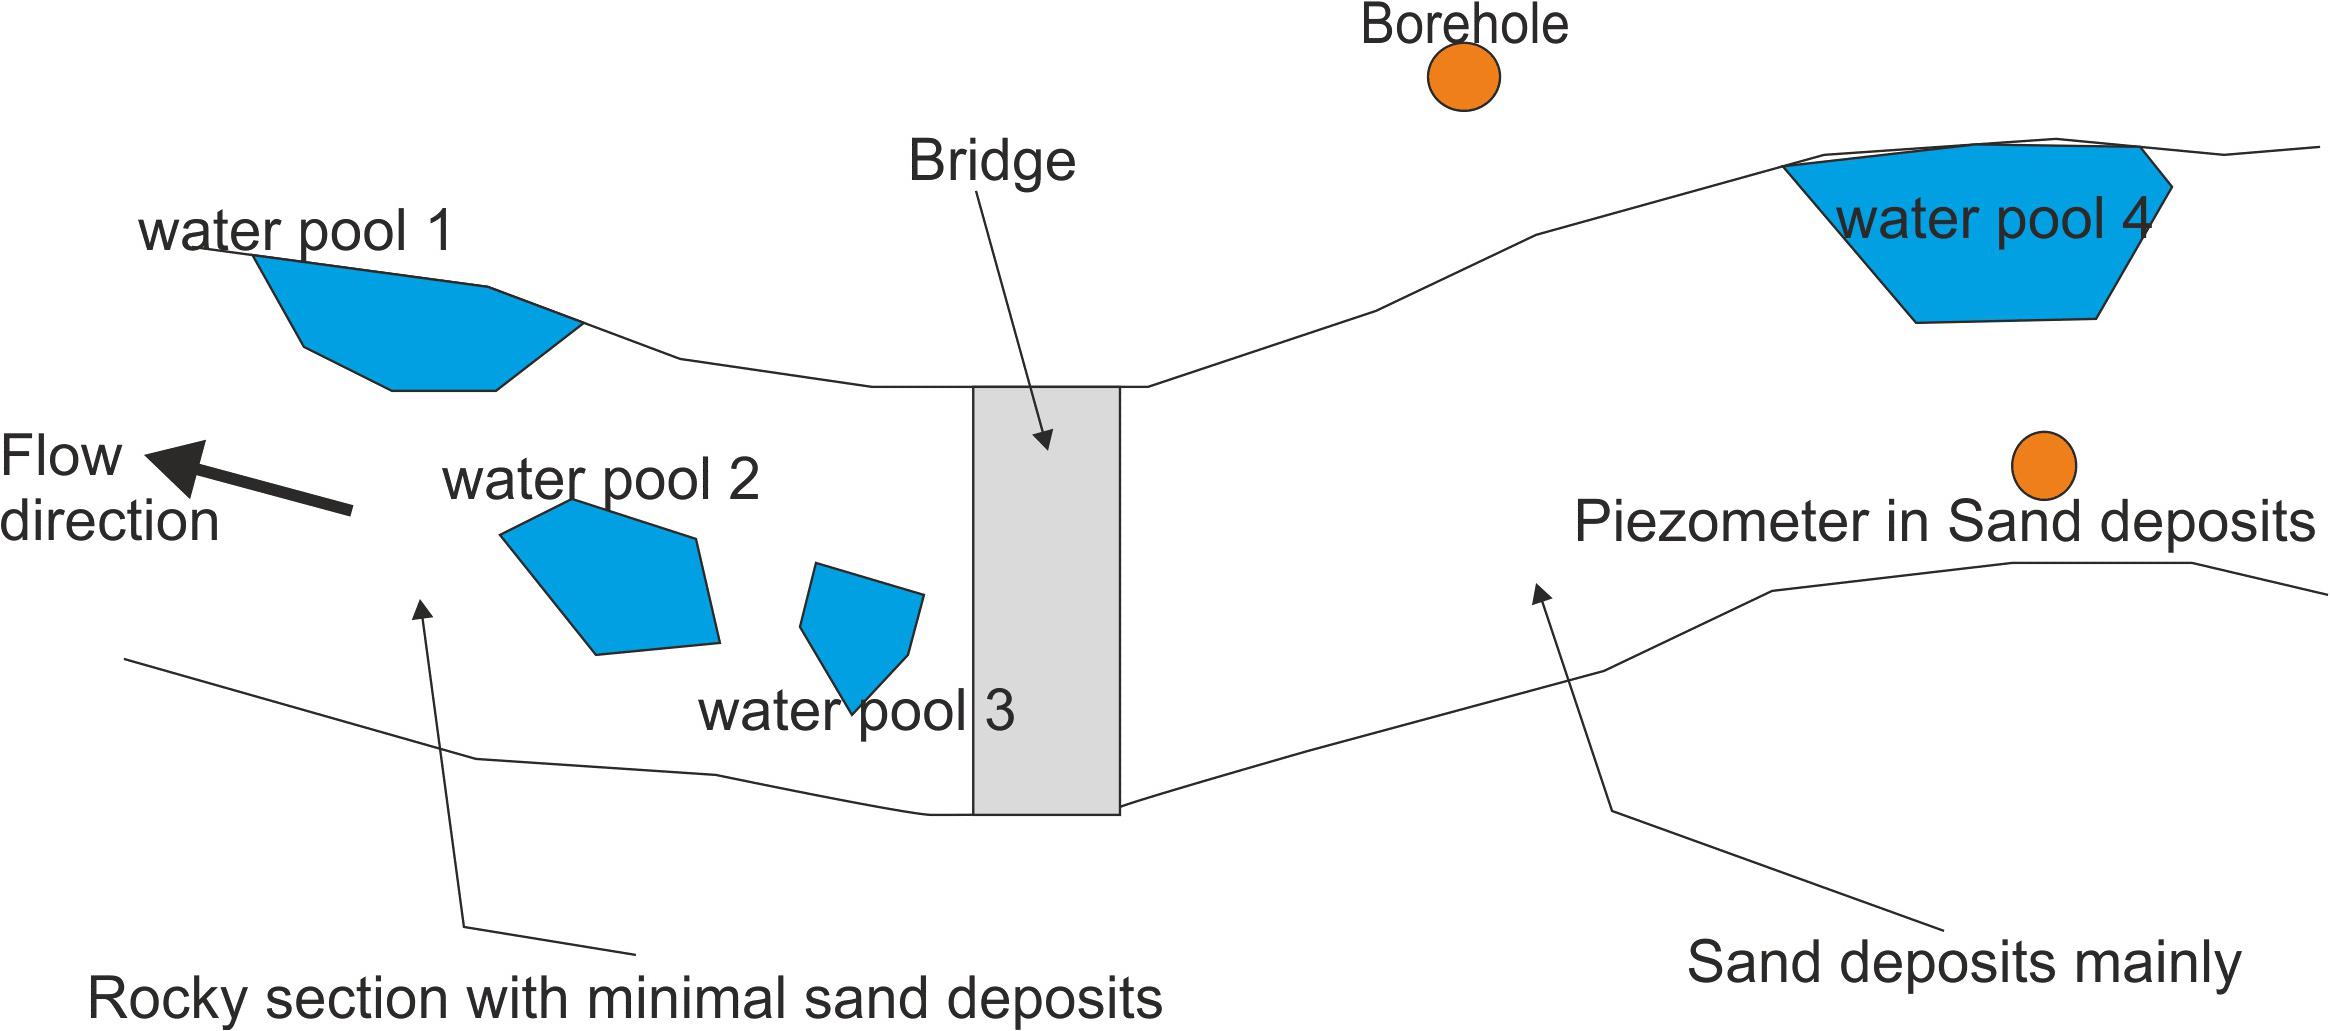
Figure 9. Section of the Sand River studied to establish dependency of water holes on groundwater. The section is near Olderkesi Market Centre (Figure 2).
Biota in the Sand River includes aquatic, semi-aquatic and terrestrial species (Figure 10). The water holes were observed to have fish particularly after a flow event. Tadpoles, mature frogs and turtles were also observed in most of the identified isolated water bodies along the Sand River. Unique though, are the amphibian species that burrow into the alluvium and stay above phreatic line through the dry spell (Figure 10c). Such species have the ability to go into a state of dormancy in which energy consumption is limited by reducing both the heart and respiratory rates. The Sand River has patches of undisturbed riparian vegetation in the upstream sections of the catchment. Roots of the vegetation penetrating the sand deposits were observed along the river channel (Figure 10d).
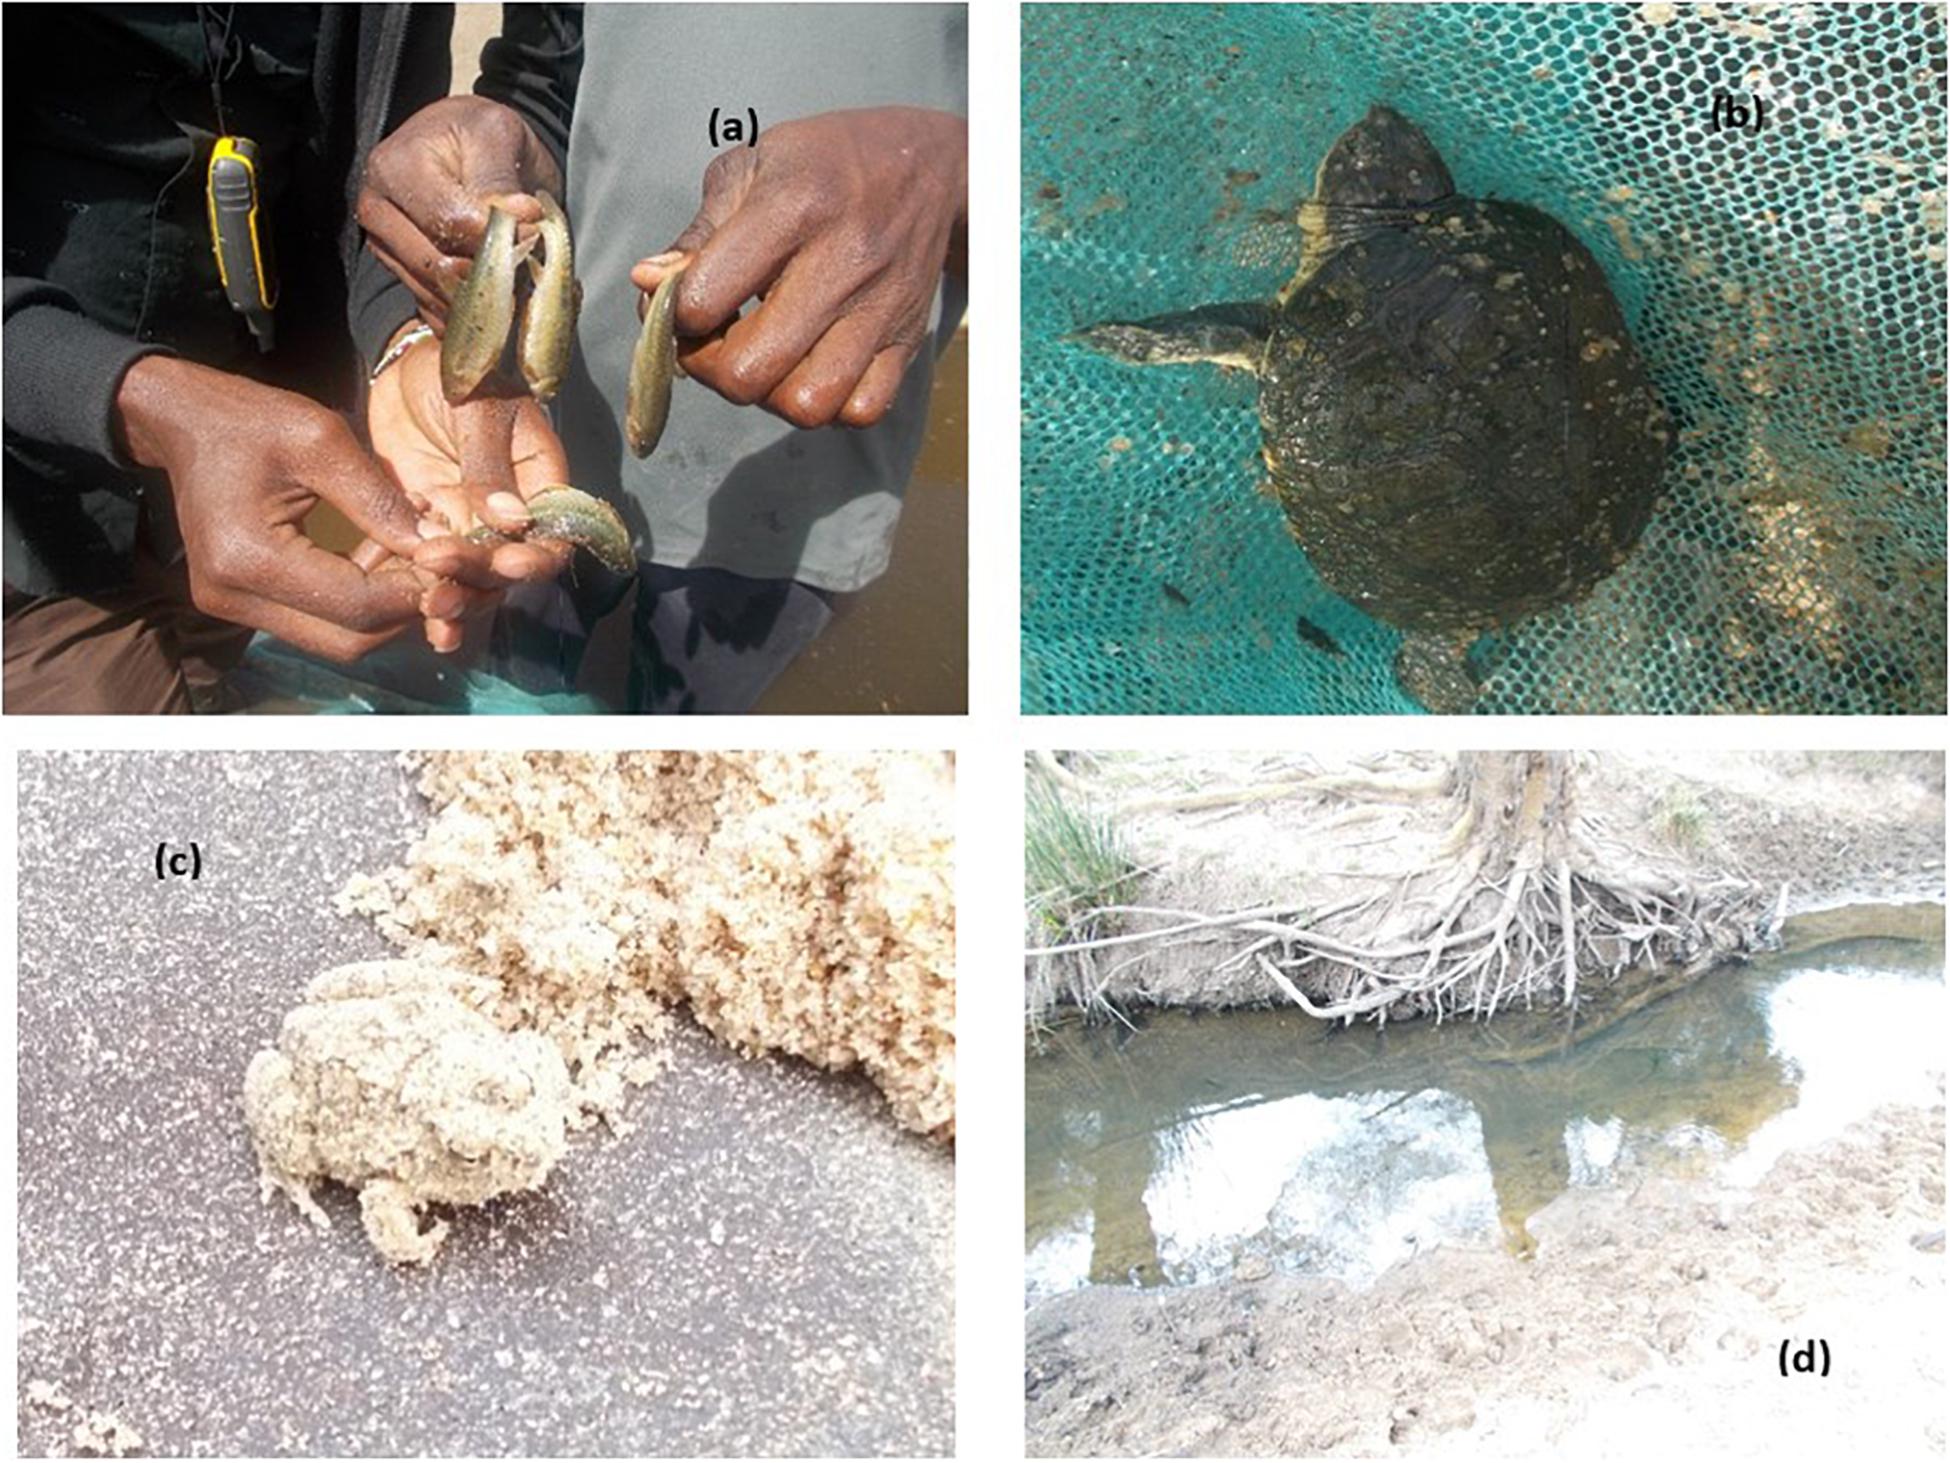
Figure 10. Biota in the Sand River; (a) fish (b) turtle (c) frog commonly known as Spencer burrowing frog in Australia (d) roots of a riparian tree penetrating sand deposits through the water pool.
Discussion
Results from the field show that variability in storm-related flood pulses in the Sand River is dependent on the antecedent soil moisture in the alluvium deposits underlying the river bed; similar to the characteristics illustrated by Pacheco-Guerrero et al. (2017) and Abdulrazzak and Sorman (2006). At the onset of a rainstorm, advancement of a surface flow wave downstream is limited by infiltration into the sand deposits. The rate of infiltration and percolation in comparison with the rate of flow of a flood governs the advance and magnitude of a flood on an unsaturated sand bed. As noted by Costa et al. (2013), the findings illustrate that groundwater recharge in the alluvial bed by transmission losses is an important function of water flow behavior in the Sand River. Even though observations in this research are based on only three storm events, limiting the extent to which concrete judgment on water flow behavior can be made, two critical observations are the time lag in the rising limbs and the similar behavior of the recession limbs. Rate of flow of a flood is a function of the rate at which run-off enters the river channel as well as the slope. On the other hand, infiltration rates are dependent on the properties of the sand deposits, including porosity. A flood cannot advance over an unsaturated sand bed if infiltration rates exceed the discharge rates. Thus, there is a lag in the rising limb of the surface water flow compared to the rising limb of the groundwater level (Figure 5C). Similar to our findings, Moulahoum (2018) also noted that logger data of the groundwater level in the Shashane riverbed aquifer, in the Mzingwane catchment, Zimbabwe, showed that the riverbed is entirely saturated at the beginning of the first major rainfall-runoff event and major surface runoff occurs only after the riverbed is saturated. Mansell and Hussey (2005) illustrated that flows in the sand deposits along sand rivers are an extension of surface discharges that can be estimated based on the flood water recession curve; an aspect that is further affirmed by the similar behavior characteristics of the recession limbs. However, the assumption may only hold until the saturation depth that corresponds to no surface flow conditions i.e., maximum depth of alluvium saturation on a dry riverbed. Saturation of this particular depth in which the groundwater recession limb is similar to the floodwater is dependent on the positive pressure exerted on the riverbed, usually equivalent to the flood height.
The water storage potential along the Sand River depends on the hydraulic properties of the alluvium as well as the geometry of the aquifer including the nature of the underlying layer. Wider sections of the river course have potentially larger sand volumes and thus a higher storage potential. The bedrock underlying alluvial deposits undulates, creating natural barriers that trap water upstream and therefore reduce lateral flows. Much of the water drawn from alluvial corridors in the dry periods is from these natural micro-reservoirs. Storage is replenished as the river is flooded a number of times in a hydrological year. Considering that a flood wave cannot advance over an unsaturated sand bed, each flow event that floods the entire river reach fully recharges the alluvial aquifer. Human settlements are located in the close vicinity to the river at a regular spacing of approximately 500 m. With an estimated combined domestic and livestock water demand of 1.3 Mm3, the estimated daily water demand or required abstraction for every 500 m river stretch is 15 m3/day. Considering the storage estimated for the sections A and B at full capacity varies between 13 and 17 m3/m, the instantaneous storage volume likely ranges between 6,500 and 8,500 m3 for each 500 m reach. Such storage volumes would meet demands for more than a year if it were assumed that it only supports domestic and livestock water demands. Given that the alluvial aquifer is replenished following each significant runoff event, this storage should be sufficient to meet the water requirements for livestock and human domestic demands with sufficient reserves to provide for wildlife and ecosystem sustainability. Nyongesa (2020), also noted that sand storage along ephemeral rivers can sufficiently support sustainable irrigated agriculture.
Besides artificial water abstraction from the alluvium along the Sand River, natural processes such as direct evaporation, transpiration by the riparian vegetation, seepage through fractured bedrock, and lateral flow accounts for continued decreases in stored water. Direct evaporation is evident from the deviation of the isotopic signature for the water in the alluvium from both the GMWL and LMWL. Gibson et al. (1993) noted that gradients for evaporation lines are always less than 8 but often fall between 4 and 6, where our line of fit lies. Although not investigated in this research, Hellwig (1973) and Love et al. (2011) found that evaporation occurs up to maximum depths of between 60 and 90 cm, depending on sand particle sizes. As a result, groundwater salinity tends to increase, as indicated by increasing Cl concentrations (Stigter et al., 1998). The chemistry of water in the sand storage is further affected by rock-water interactions, in a silicate rock environment where the chemical evolution of groundwater is mainly a function of residence time. The response of the alluvial system is fast; recharge rates and decreases in storage are rapid, which limits chemical evolution. However, the presence of micro-catchments allows storage of water under reduced evaporative effects long enough for sufficient interaction with the aquifer media. This is revealed by the higher ion contents, in particular Ca2+, Na+ and HCO3–, as well as the presence of fluoride. The latter was present in concentrations above the drinking water guidelines, which needs to be considered when using the alluvial water for domestic supply.
Vertical losses through downward flow into fractured bedrock can also be an important loss of alluvial water, given that that once in the fracture zone it is more difficult to abstract the water. Groundwater level observations in the Sand River clearly showed that the rate of decline was larger than explained by evapotranspiration only (Figure 5D). Part of the decline can also be explained by lateral subsurface flow within the alluvial aquifer. Irrespective of the dominating process, such a decline has a direct impact on the storage capacity of the alluvial aquifer, especially when the sand layers are still relatively thin, as is the case here.
The Sand River is a linear oasis with a proliferation of woody vegetation along the riparian zone. Water storage in the alluvium ensures constant water availability for transpiration, thereby supporting the growth of riparian vegetation. Diurnal fluctuations observed from the groundwater level monitoring provides evidence of losses through transpiration (Figure 6B). Vegetation transpires maximally during the day. ET is almost negligible between midnight and 5:00 am (White, 1932). Observed increases in groundwater level when ET is negligible is an illustration of lateral flows in the alluvial deposits. The river hosts a range of aquatic (semi) and terrestrial organisms that are uniquely adapted to the “boom,” “burst” and cease-to-flow hydrologic regimes (Sheldon and Thoms, 2008). Water holes along the river reach are hydrologically (semi)permanent features adapted to the dynamic inter-flood intervals thereby providing refugia to biota during no-flow conditions. Is persistence of the waterholes through dry periods dependent on water storage in the alluvium? Water level measurements coupled with water quality results during our study suggests that indeed, the isolated aquatic islands are alluvium groundwater storage dependent ecosystems.
Water storage along alluvial corridors of Sand Rivers is a shared resource between humans and natural ecosystems, and as such, both are susceptible to changes in use and availability patterns. Over-extraction of water from the alluvium may result to ecological stress particularly on water-controlled ecosystems. Such ecological stress becomes apparent through species migration, extirpation and shifts in the composition of riparian vegetation. For instance, unsustainable water resource development threatens persistence of waterholes thereby diminishing their capacity as refugia for both aquatic and semi-aquatic micro-organisms (Sheldon et al., 2010). Arnold et al. (2016) notes that a shift in vegetation composition can result to competitive species as opposed to more tolerant species adapted the flow variability of dryland rivers. The changes in vegetation types has been found to alter hydrological processes -such as evapotranspiration – controlling groundwater fluctuations or tip the water balance to either side – positive or negative (Poff and Zimmerman, 2010). On contrary, Moulahoum (2018), illustrated that water levels in the banks of Shashane Sand River in Zimbabwe sustaining the riparian corridors had the tendency to be higher, i.e., above the sand river water level, in the dry season, due to the finer texture and higher clay content. ERT measurements illustrated in Figures 4A,B also revealed a similar fine-textured and clay-rich sediments in the sub-surface. Such a phenomenon may enhance capillary rise to partly counteract the effects of the drop in water level in the sand river during the dry season caused by abstractions. Water resource exploitation along ephemeral rivers should thus be designed such that ecosystem integrity is preserved without limiting socio-economic water supply for the nearby communities.
Conclusion
We investigated water flow processes and storage potential along the Sand River using field-based measurements. Surface flow monitoring and measured groundwater level in the alluvium have shown that variability in flood magnitude is dependent on alluvium water saturation level. Advancement of a flood wave over unsaturated sand bed is dependent on the rate of infiltration and subsequent percolation, commonly referred to as transmission losses. However, other factors such as the slope of the river channel and rate of runoff flow into the channel play a key role in water flow behavior. Besides impacts on the flood behavior, transmission losses recharge the alluvial aquifer thus replenishing the nature-based water storage along the Sand River. Such storage is a critical alternative water source for communities along the river as it supports domestic use and livestock watering. We have made two critical observations with regard to flood behavior and groundwater recharge rates in the alluvium: (1) time lag in the rising limbs and (2) similar behavior in the recession limbs. Water storage in the sand deposits is also subject to losses due to natural processes such as direct evaporation, transpiration and lateral flow in the sand deposits. However, probing results at selected sections have also shown that bedrock underlying the alluvium undulates, thereby limiting lateral flows. The undulating nature creates micro-catchments that enhance storage to support water demands. Further, we have established that water storage in the alluvium also supports dependent ecosystems including riparian vegetation and water pools that act as refugia for (semi)aquatic biota. This research has demonstrated the potential of alluvial corridors along ephemeral rivers as alternative water sources for livelihood sustainability and rural community development in the water scarce arid (semi) regions of East Africa.
Data Availability Statement
All datasets generated for this study are included in the article/Supplementary Material.
Author Contributions
SW designed the study, collected and analysed data and prepared the manuscript. TS, MM, and KF conceived the study, offered supervision on study design, data collection and analysis, funding and prepared the manuscript. LO and FO guidance on extended data analysis and prepared the manuscript. All authors contributed to the article and approved the submitted version.
Funding
The Dutch Organization for International Organization (NUFFIC) provided financial support for a study scholarship. The field data collection was funded by Mau Mara Serengeti (MaMaSe) Sustainable Water Initiative and The Netherlands Embassy in Kenya.
Conflict of Interest
The authors declare that the research was conducted in the absence of any commercial or financial relationships that could be construed as a potential conflict of interest.
Acknowledgments
We would like to acknowledge the financial support of the Dutch Organization for Internationalization in Education (NUFFIC) for the study scholarship that enabled this contribution. We are grateful in particular to the Mau Mara Serengeti (MaMaSe) Sustainable Water Initiative and the Netherlands Embassy in Kenya for the generous financial support that enabled fieldwork activities. We further acknowledge the Kenya Water Resources Authority, Kericho Sub-regional office and the Olderkesi Water Resource User Association for providing support during the data collection. Many thanks to Professor Paul Shiundu for the opportunity to work within the Labs at the Technical University of Kenya for extended analysis of the data beyond the period of study.
Supplementary Material
The Supplementary Material for this article can be found online at: https://www.frontiersin.org/articles/10.3389/fenvs.2020.00095/full#supplementary-material
FIGURE S1 | Frequency duration curve for the daily water level measured between July, 2013 and January, 2016 at the existing Gauge Location.
References
Abdulrazzak, M. J., and Sorman, A. U. (2006). Transmission losses from ephemeral stream in arid region. J. Irrig. Drain. Eng. 120:669. doi: 10.1061/(asce)0733-94371994120:3(669)
Amiaz, Y., Sorek, S., Enzel, Y., and Dahan, O. (2011). Solute transport in the vadose zone and groundwater during flash floods. Water Resour. Res. 47:W10513. doi: 10.1029/2011WR010747
Appelo, C. A. J., and Postma, D. (2006). Geochemistry, groundwater and pollution. Vadose Zone J. 54, 10254–10269. doi: 10.2136/vzj2005.1110br
Araffa, S. A. S. (2009). Geophysical investigation for shallow subsurface geotechnical problems of Mokattam area, Cairo, Egypt. Environ. Earth Sci. 59, 1195–1207. doi: 10.1007/s12665-009-0109-2
Arnold, S., Attinger, S., Frank, K., Baxter, P., Possingham, H., and Hildebrandt, A. (2016). Ecosystem management along ephemeral rivers: trading off socio-economic water supply and vegetation conservation under flood regime uncertainty. River Res. Appl. 32, 219–233. doi: 10.1002/rra.2853
Bartram, J., and Pedley, S. (1996). Water quality monitoring- a practical guide to the design and implementation of freshwater quality studies and monitoring programmes. United Nat. Environ. Program World Heal. Organ. 14, 2756–2765. doi: 10.1002/ejoc.201200111
Batlle-Aguilar, J., and Cook, P. G. (2012). Transient infiltration from ephemeral streams: a field experiment at the reach scale. Water Resour. Res. 48:W11518. doi: 10.1029/2012WR012009
Berardi, L., Laucelli, D., Simeone, V., and Giustolisi, O. (2013). Simulating floods in ephemeral streams in Southern Italy by full-2D hydraulic models. Int. J. River Basin Manag. 11, 1–17. doi: 10.1080/15715124.2012.746975
Blasch, K., Ferré, T. P. A., Hoffmann, J., Pool, D., Bailey, M., and Cordova, J. (2013). “Processes controlling recharge beneath ephemeral streams in Southern Arizona,” in Groundwater Recharge in a Desert Environment: The Southwestern United States, (Cham: Springer), 69–76. doi: 10.1029/009WSA05
Boulton, A. J. (2014). Conservation of ephemeral streams and their ecosystem services: What are we missing? Aquat. Conserv. Mar. Freshw. Ecosyst. 24, 733–738. doi: 10.1002/aqc.2537
Camarasa-Belmonte, A. M. (2016). Flash floods in mediterranean ephemeral streams in valencia region (Spain). J. Hydrol. 541, 99–115. doi: 10.1016/j.jhydrol.2016.03.019
Catherine, L., and Fran, S. (2008). Hydrological changes and ecological impacts associated with water resource development in large floodplain rivers in the australian tropics. River Res. Appl. 22, 1085–1095. doi: 10.1002/rra
Chiu, M. C., Leigh, C., Mazor, R., Cid, N., and Resh, V. (2017). Anthropogenic threats to intermittent rivers and ephemeral streams. Inter. Rivers Ephem. Streams 2017, 433–454. doi: 10.1016/B978-0-12-803835-2.00017-6
Christiansen, L., Binning, P. J., Rosbjerg, D., Andersen, O. B., and Bauer-Gottwein, P. (2011). Using time-lapse gravity for groundwater model calibration: an application to alluvial aquifer storage. Water Resour. Res. 47:W06503. doi: 10.1029/2010WR009859
Cid, N., Bonada, N., Carlson, S. M., Grantham, T. E., Gasith, A., and Resh, V. H. (2017). High variability is a defining component of mediterranean-climate rivers and their biota. Water 9:52. doi: 10.3390/w9010052
Constantz, J., Thomas, C. L., and Zellweger, G. (1994). Influence of diurnal variations in stream temperature on streamflow loss and groundwater recharge. Water Resour. Res. 30, 3253–3264. doi: 10.1029/94WR01968
Costa, A. C., Bronstert, A., and De Araújo, J. C. (2012). A channel transmission losses model for different dryland rivers. Hydrol. Earth Syst. Sci. 16, 1111–1135. doi: 10.5194/hess-16-1111-2012
Costa, A. C., Foerster, S., de Araújo, J. C., and Bronstert, A. (2013). Analysis of channel transmission losses in a dryland river reach in north-eastern Brazil using streamflow series, groundwater level series and multi-temporal satellite data. Hydrol. Process. 27, 1046–1060. doi: 10.1002/hyp.9243
Costigan, K. H., Kennard, M. J., Leigh, C., Sauquet, E., Datry, T., and Boulton, A. J. (2017). Flow regimes in intermittent rivers and ephemeral streams. Inter. Rivers Ephem. Streams 2017, 51–78. doi: 10.1016/b978-0-12-803835-2.00003-6
Crouvi, O., Pelletier, J. D., and Rasmussen, C. (2013). Predicting the thickness and aeolian fraction of soils in upland watersheds of the mojave desert. Geoderma 195-196, 94–110. doi: 10.1016/j.geoderma.2012.11.015
Dahan, O., Tatarsky, B., Enzel, Y., Kulls, C., Seely, M., and Benito, G. (2008). Dynamics of flood water infiltration and ground water recharge in hyperarid desert. Ground Water 46, 450–461. doi: 10.1111/j.1745-6584.2007.00414.x
Davies, B., Thoms, M., Walker, K., O’Keeffe, J., and Gore, J. (1994). “Dryland rivers: their ecology, conservation and management,” in The Rivers Handbook: Hydrological and Ecological Principles, eds P. Calow and G. E. Petts (Hoboken, NJ: Wiley), 484–511. doi: 10.1002/9781444313871.ch25
Defersha, M. B., Melesse, A. M., and McClain, M. E. (2012). Watershed scale application of WEPP and EROSION 3D models for assessment of potential sediment source areas and runoff flux in the Mara River Basin, Kenya. Catena 95, 63–72. doi: 10.1016/j.catena.2012.03.004
Dogramaci, S., Firmani, G., Hedley, P., Skrzypek, G., and Grierson, P. F. (2015). Evaluating recharge to an ephemeral dryland stream using a hydraulic model and water, chloride and isotope mass balance. J. Hydrol. 521, 520–532. doi: 10.1016/j.jhydrol.2014.12.017
Dowman, C. E., Ferré, T. P. A., Hoffmann, J. P., Rucker, D. F., and Callegary, J. B. (2013). Quantifying ephemeral streambed infiltration from downhole temperature measurements collected before and after streamflow. Vadose Zo. J. 2, 595–601. doi: 10.2136/vzj2003.5950
Dunkerley, D., and Brown, K. (1999). Flow behaviour, suspended sediment transport and transmission losses in a small (sub-bank-full) flow event in an Australian desert stream. Hydrol. Process. 13, 1603–1620.
Dunkerley, D. L. (2008). Bank permeability in an Australian ephemeral dry-land stream: variation with stage resulting from mud deposition and sediment clogging. Earth Surf. Process. Land. 33, 226–243. doi: 10.1002/esp.1539
Fenton, J. D. (2018). On the generation of stream rating curves. J. Hydrol. 564, 748–757. doi: 10.1016/j.jhydrol.2018.07.025
Freeman, L. A., Carpenter, M. C., Rosenberry, D. O., Rousseau, J. P., Unger, R., and McLean, J. S. (2004). Use of Submersible Pressure Transducers in Water-Resources Investigations. Reston: U.S. Geological Survey.
Freyberg, D. L. (1983). Modeling the effects of a time-dependent wetted perimeter on infiltration from ephemeral channels. Water Resour. Res. 19, 559–566. doi: 10.1029/WR019i002p00559
Gibson, J. J., Edwards, T. W. D., and Bursey, G. G. (1993). Estimating evaporation using stable isotopes: quantitative results and sensitivity analysis for two catchments in Northern Canada. Nord. Hydrol. 24, 79–94. doi: 10.2166/nh.1993.006
Gonzalez-carballo, A. (2018). Assessing Groundwater Recharge And Storage Enhancements In The Alluvial Aquifers Of The Tigray Highlands (ethiopia). Delft: UNESCO-IHE Institute for Water Education.
Goodrich, D. C., Williams, D. G., Unkrich, C. L., Hogan, J. F., Scott, R. L., Hultine, K. R., et al. (2013). “Comparison of methods to estimate ephemeral channel recharge, walnut gulch, san pedro river basin, Arizona,” in Groundwater Recharge in a Desert Environment: The Southwestern United States, eds J. F. Hogan and F. M. Phillips (Washington, DC: American Geophysical Union), doi: 10.1029/009WSA06
Hafeez, M., and Khan, A. A. (2018). Assessment of hargreaves and blaney-criddle methods to estimate reference evapotranspiration under coastal conditions. Am. J. Sci. Eng. Technol. 3, 65–72. doi: 10.11648/j.ajset.20180304.11
Han, D. (2018). FAO irrigation and drainage paper no. 56. Glob. Chang. Biol. 24, 43–69. doi: 10.1080/02626667909491834
Hantush, M. S. (1967). Growth and decay groundwater-mounds in response to. Water Resour. Res. 3, 227–234. doi: 10.1029/wr003i001p00227
Harte, P. T., and Kiah, R. G. (2009). Measured river leakages using conventional streamflow techniques: the case of Souhegan River, New Hampshire, USA. Hydrogeol. J. 17, 409–424. doi: 10.1007/s10040-008-0359-1
Hellwig, D. H. R. (1973). Evaporation of water from sand, 4: the influence of the depth of the water-table and the particle size distribution of the sand. J. Hydrol. 18, 317–327. doi: 10.1016/0022-1694(73)90055-3
Hughes, D. A., and Sami, K. (1992). Transmission losses to alluvium and associated moisture dynamics in a semiarid ephemeral channel system in Southern Africa. Hydrol. Process. 6, 45–53. doi: 10.1002/hyp.3360060105
Hussey, S. W. (2007). Water from Sand Rivers: Guidelines For Abstraction. Leicestershire: Loughborough University.
Hutton, L. G. (1983). Field Testing of Water in Developing Countries. Medmenham: Water Research Centre.
Jarihani, A. A., Larsen, J. R., Callow, J. N., McVicar, T. R., and Johansen, K. (2015). Where does all the water go? Partitioning water transmission losses in a data-sparse, multi-channel and low-gradient dryland river system using modelling and remote sensing. J. Hydrol. 529, 1511–1529. doi: 10.1016/j.jhydrol.2015.08.030
Kaasinen, E. (2003). User needs for location-aware mobile services. Pers. Ubiquitous Comput. 7, 70–79. doi: 10.1007/s00779-002-0214-7
Koundouri, P., Boulton, A. J., Datry, T., and Souliotis, I. (2017). Ecosystem services, values, and societal perceptions of intermittent rivers and ephemeral streams. Inter. Rivers Ephem. Streams 2017, 455–476. doi: 10.1016/B978-0-12-803835-2.00018-8
Lamprey, R. H., and Reid, R. S. (2004). Expansion of human settlement in Kenya’s Maasai Mara: what future for pastoralism and wildlife? J. Biogeogr. 31, 997–1032. doi: 10.1111/j.1365-2699.2004.01062.x
Lane, L. J., Diskin, M. H., and Renard, K. G. (1971). Input-output relationships for an ephemeral stream channel system. J. Hydrol. 13, 22–40. doi: 10.1016/0022-1694(71)90198-3
Lange, J. (2005). Dynamics of transmission losses in a large arid stream channel. J. Hydrol. 306, 112–126. doi: 10.1016/j.jhydrol.2004.09.016
Lange, J., Leibundgut, C., Grodek, T., Lekach, J., and Schick, A. P. (1997). Using artificial tracers to study water losses of ephemeral floods in small arid streams. IAHS Publ.
Loke, M. H. (2000). Electrical Imaging Surveys For Environmental And Engineering Studies. A Practical Guide to 2-D and 3-D Surveys. Unpubl. short Train. course Lect. notes. Penang: Geotomo Software.
Love, D., van der Zaag, P., Uhlenbrook, S., and Owen, R. J. S. (2011). A water balance modelling approach to optimising the use of water resources in ephemeral sand rivers. River Res. Appl. 27, 908–925. doi: 10.1002/rra.1408
Mansell, M. G., and Hussey, S. W. (2005). An investigation of flows and losses within the alluvial sands of ephemeral rivers in Zimbabwe. J. Hydrol. 314, 192–203. doi: 10.1016/j.jhydrol.2005.03.015
Mook, W. G., and Geyh, M. (2000). Environmental isotopes in the hydrological cycle, principles and applications. Groundwater 39:196.
Morin, E., Grodek, T., Dahan, O., Benito, G., Kulls, C., Jacoby, Y., et al. (2009). Flood routing and alluvial aquifer recharge along the ephemeral arid Kuiseb River, Namibia. J. Hydrol. 368, 262–275. doi: 10.1016/j.jhydrol.2009.02.015
Moulahoum, A. W. (2018). Using Field Assessment and Numerical Modelling Tools to Optimize a Water Abstraction System in the Shashane Sand River Aquifer (Zimbabwe). Delft: UNESCO-IHE Institute for Water Education.
Mpala, S. C., Gagnon, A. S., Mansell, M. G., and Hussey, S. W. (2016). The hydrology of sand rivers in Zimbabwe and the use of remote sensing to assess their level of saturation. Phys. Chem. Earth Parts A/B/C 93, 24–36. doi: 10.1016/j.pce.2016.03.004
Mwangi, H. M., Julich, S., Patil, S. D., McDonald, M. A., and Feger, K. H. (2016). Modelling the impact of agroforestry on hydrology of Mara River Basin in East Africa. Hydrol. Process. 30, 3139–3155. doi: 10.1002/hyp.10852
Nyongesa, S. J. (2020). Understanding the Hydrogeology of Kajiado and the Role of Sand River on Groundwater Storage and Abstraction. Delft: IHE DELFT Institute for Water Education. doi: 10.1002/hyp.10852
Olang, L. O., and Fürst, J. (2011). Effects of land cover change on flood peak discharges and runoff volumes: model estimates for the Nyando River Basin. Kenya. Hydrol. Process. 25, 80–89. doi: 10.1002/hyp.7821
Olang, L. O., Herrnegger, M., Wimmer, D., and Fürst, J. (2019). A Spatial Database of Hydrological and Water Resources Information for the Nyangores Watershed of Kenya. Hydrology and Water Resources Management in Arid, Semi-Arid, and Tropical Regions. Pennsylvania: IGI Global, doi: 10.4018/978-1-7998-0163-4.ch008
Omonge, P., Herrnegger, M., Gathuru, G., Fürst, J., and Olang, L. (2020). Impact of development and management options on water resources of the upper Mara River Basin of Kenya. Water Environ. J. 2, 1–12. doi: 10.1111/wej.12554
Pacheco-Guerrero, A., Goodrich, D. C., González-Trinidad, J., Júnez-Ferreira, H. E., and Bautista-Capetillo, C. F. (2017). Flooding in ephemeral streams: incorporating transmission losses. J. Maps 13, 350–357. doi: 10.1080/17445647.2017.1305303
Pánek, T., Hradecký, J., and Šilhán, K. (2008). Application of electrical resistivity tomography (ERT) in the study of various types of slope deformations in anisotropic bedrock: case studies from the flysch carpathians. Stud. Geomorphol. CarpathoBalcan. 42, 57–73.
Parissopoulos, G. A., and Wheater, H. S. (1992). Experimental and numerical infiltration studies in a wadi stream bed. Hydrol. Sci. J. 37, 27–37. doi: 10.1080/02626669209492559
Poff, N. L., and Zimmerman, J. K. H. (2010). Ecological responses to altered flow regimes: a literature review to inform the science and management of environmental flows. Freshw. Biol. 55, 194–205. doi: 10.1111/j.1365-2427.2009.02272.x
Pool, D. R. (2005). Variations in climate and ephemeral channel recharge in southeastern Arizona. U. S. Water Resour. Res. 41:55. doi: 10.1029/2004WR003255
Rahimikhoob, A., and Hosseinzadeh, M. (2014). Assessment of blaney-criddle equation for calculating reference evapotranspiration with NOAA/AVHRR data. Water Resour. Manag. 28, 3365–3375. doi: 10.1007/s11269-014-0670-7
Rodríguez-Burgueño, J. E., Shanafield, M., and Ramírez-Hernández, J. (2017). Comparison of infiltration rates in the dry riverbed of the Colorado River Delta during environmental flows. Ecol. Eng. 106, 675–682. doi: 10.1016/j.ecoleng.2017.02.014
Rosenberg, E., and Panne, U. (2014). “Atomic absorption spectrometry (AAS) and atomic emission spectrometry (AES),” in Handbook of Spectroscopy, eds G. Gauglitz and D. S. Moore (Berlin: Springer), 507–582. doi: 10.1002/9783527654703.ch15
Schlumberger Water Services (2007). Diver-Office User’s Manual 1-47. Houston, TX: Schlumberger Water Services.
Schoener, G. (2016). Quantifying transmission losses in a new mexico ephemeral stream: a losing proposition. J. Hydrol. Eng. 22. doi: 10.1061/(asce)he.1943-5584.0001473
Shanafield, M., and Cook, P. G. (2014). Transmission losses, infiltration and groundwater recharge through ephemeral and intermittent streambeds: a review of applied methods. J. Hydrol. 511, 518–529. doi: 10.1016/j.jhydrol.2014.01.068
Sharma, K. D., and Murthy, J. S. R. (1994). Estimating transmission losses in an arid region - a realistic approach. J. Arid. Environ. 27, 107–112. doi: 10.1006/jare.1994.1051
Sheldon, F., Bunn, S. E., Hughes, J. M., Arthington, A. H., Balcombe, S. R., and Fellows, C. S. (2010). Ecological roles and threats to aquatic refugia in arid landscapes: dryland river waterholes. Mar. Freshw. Res. 61:39. doi: 10.1071/mf09239
Sheldon, F., and Thoms, M. C. (2008). Relationships between flow variability and macroinvertebrate assemblage composition: data from four Australian Dryland rivers. River Res. Appl. 4, 1251–1270. doi: 10.1002/rra.907
Sorman, A. U., and Abdulrazzak, M. J. (1993). Infiltration-recharge through wadi beds in arid regions. Hydrol. Sci. J. 38, 173–186. doi: 10.1080/02626669309492661
Steward, A. L., Von Schiller, D., Tockner, K., Marshall, J. C., and Bunn, S. E. (2012). When the river runs dry: human and ecological values of dry riverbeds. Front. Ecol. Environ. 10:110136. doi: 10.1890/110136
Stewart-deaker, B. A. E., Stonestrom, D. A., and Moore, S. J. (2000). Streamflow, Infiltration, and Ground-Water Recharge at Abo Arroyo. New Mexico: USGS.
Stigter, T. Y., Van Ooijen, S. P. J., Post, V. E. A., Appelo, C. A. J., and Carvalho Dill, A. M. M. (1998). A hydrogeological and hydrochemical explanation of the groundwater composition under irrigated land in a mediterranean environment. J. Hydrol. 28, 262–279. doi: 10.1016/S0022-1694(98)00168-1
Tooth, S. (2000). Process, form and change in dry land rivers: a review of recent research. J. Earth Sci. 51, 67–107. doi: 10.1016/s0012-8252(00)00014-3
Wang, M., Su, Y., and Yang, X. (2014). Spatial distribution of soil organic carbon and its influencing factors in desert grasslands of the hexi corridor, Northwest China. PLoS One 9:e094652. doi: 10.1371/journal.pone.0094652
White, W. N. (1932). A Method of Estimating Ground-Water Supplies Based On Discharge By Plants And Evaporation From Soil. Utah: USGS.
Keywords: alluvial corridors, ephemeral river systems, water storage potential, water flow processes, Mara River Basin, Kenya
Citation: Wekesa SS, Stigter TY, Olang LO, Oloo F, Fouchy K and McClain ME (2020) Water Flow Behavior and Storage Potential of the Semi-Arid Ephemeral River System in the Mara Basin of Kenya. Front. Environ. Sci. 8:95. doi: 10.3389/fenvs.2020.00095
Received: 24 January 2020; Accepted: 08 June 2020;
Published: 03 July 2020.
Edited by:
Albert Chakona, South African Institute for Aquatic Biodiversity, South AfricaReviewed by:
Joris Eekhout, Spanish National Research Council, SpainNidhi Nagabhatla, United Nations University Institute for Water, Environment and Health, Canada
Copyright © 2020 Wekesa, Stigter, Olang, Oloo, Fouchy and McClain. This is an open-access article distributed under the terms of the Creative Commons Attribution License (CC BY). The use, distribution or reproduction in other forums is permitted, provided the original author(s) and the copyright owner(s) are credited and that the original publication in this journal is cited, in accordance with accepted academic practice. No use, distribution or reproduction is permitted which does not comply with these terms.
*Correspondence: Sospeter Simiyu Wekesa, soswek@yahoo.com