Frequency and Density Associated Grouping Patterns of Male Roosevelt Elk
 Floyd W. Weckerly
- Department of Biology, Texas State University, San Marcos, TX, United States
Group-size variation has been examined within a framework of costs and benefits to ecological factors such as food limitations and risks from predators. Social interactions between males from male–male competition might also influence group size particularly in polygynous males. To explore the role of social and ecological factors on group size outside the mating season I examined the influence of abundance on male grouping patterns in a population of Roosevelt elk (Cervus elaphus roosevelti) in northwestern California, USA. Male grouping patterns were complex, males often group with other males, but they also can be transient members of female groups. Because male–male competition is pervasive even outside of the mating season, sizes of groups comprised of males only should be positive and linearly related to abundance of the male population or frequency associated. Whereas the number of males in female groups should be inversely related to female abundance or density associated. Males associating with females is more likely at low female abundance because females might still be reproductively active and per capita forage should be abundant. Across a 23-year study I examined whether male or female abundance was related to male only group sizes and the number of males in female groups. Size of male-only groups displayed a positive, linear relationship with male abundance and the number of males in female groups exhibited an inverse, linear relationship with female abundance. Uncovering forces influencing male grouping patterns required using the appropriate metric of abundance. Social factors likely influenced sizes of male-only groups and ecological factors probably influenced male prevalence in female groups.
Introduction
Variation in group size usually is examined within a framework of costs and benefits to forage acquisition and detecting and diluting predation risks in groups comprised of females or without regard to group composition (Bell, 1971; Alexander, 1974; Jarman, 1974; Underwood, 1982; Pulliam and Caraco, 1984; Wrangham and Rubenstein, 1986; Heard, 1992; Peterson et al., 2005; Proffitt et al., 2012). Dynamics of male groups size, however, differ from those of females in many ungulate populations (Clutton-Brock et al., 1982; Weckerly, 2001; Childress and Lung, 2003; Jedrzejewski et al., 2006; Richardson and Weckerly, 2007; Winnie and Creel, 2007; Vander Wal et al., 2013; Marino and Baldi, 2014). As such, factors that dictate grouping patterns in males might differ from those of females.
Male grouping patterns outside of the mating season are complex. Adult males aggregate with other adult males or with females. Groups comprised of adult males or male-only groups are prevalent but mixed-sex groups also exist. The frequency of mixed-sex groups and the number of males in those groups appears to be dynamic (Ortega and Franklin, 1995; Thirgood, 1996; Weckerly et al., 2001; Chiyo et al., 2014; Galezo et al., 2018; Wang et al., 2018; Meldrum and Ruckstuhl, 2019). But the processes influencing male-only groups and the number of males in mixed-sex groups have rarely been examined.
Male-only group sizes might be influenced by male–male competition for access to females even outside of the mating season (Weckerly, 2001; Childress and Lung, 2003; Winnie and Creel, 2007; Vander Wal et al., 2012; Peterson and Weckerly, 2018). As a result of male–male competition, aggressive interactions between males can be frequent (McCullough, 1969; Weckerly et al., 2001). Male-only groups, therefore, are probably not a cohesive collection of individuals. Rather, male-only groups might display fusion-fission dynamics where individuals mix with differing sets of males (Ortega and Franklin, 1995; Thirgood, 1996; Weckerly, 2001).
As the number of males in a population dictate the number of potential interactors, sizes of male-only groups should be associated with male abundance. A positive, linear relationship or frequency associated relationship would be anticipated when there are no dramatic changes in ecological factors such as forage distribution and predation risks across a range of abundances (Vander Wal et al., 2013). Two linear relationships are plausible. There could be a 1:1 or isometric relationship between male abundance and male-only group size. For each one animal increase in abundance, there is also a one animal increase in group size. All males are coalesced into one group which is also the size of the male population. One large group might improve forage detection and acquisition and mitigate individual predation risks. An isometric relationship has been proposed and observed when females inhabit an area where forage patches such as meadows are embedded in forests that have little forage (Street et al., 2013; Weckerly, 2017; McGuire, 2018; Lesmerises et al., 2018).
The alternative frequency associated relationship is a small group relationship, a possibility not previously considered. This scenario should occur when male-only group sizes are fueled by male–male competition and fusion–fission group dynamics is prevalent at all male abundances. As a result, an isometric relationship would not be possible and group sizes would be smaller than male abundance. The regression of male abundance on male-only group size would have a small slope (<1.0) and an intercept of 0.0.
After the mating season mixed-sex groups are often ephemeral and occur when individuals of one sex enter groups comprised of the opposite sex (Galezo et al., 2018; Meldrum and Ruckstuhl, 2019). Polygynous males might enter and leave female groups to forage or assess mating opportunities (Weckerly et al., 2001; Galezo et al., 2018). But male entry should be conditional on the environmental setting. One environmental setting would be negative feedbacks between food supplies and female abundances or an abundance associated relationship (McCullough, 1979; Weckerly, 2017). Males should associate with females for fitness returns perhaps when forage is less limited. At high female abundance the more limited forage and the remote likelihood that some females are in estrus limits fitness payoffs from visits to female groups (Morrison, 1960; Guinness et al., 1971, 1978; Asher et al., 2011; Keller et al., 2015; Johnson et al., 2019). Furthermore, when males are aggregated with females, time in the group will be transient because of foraging costs associated with aggregating with females (Turner et al., 2005; Peterson and Weckerly, 2018. Males might spend their time assessing and seeking mating opportunities at the expense of feeding or female proximity, not forage per se, limits or interferes with male foraging (Prins, 1989; Turner et al., 2005; Peterson and Weckerly, 2018).
Herein I had two objectives. One, I determine whether the male abundance–male-only group size relationship was isometric or small group. Two, I examined if female abundance was inversely related to the number of males in mixed-sex groups. The study population was an unhunted and nonmigratory population of Roosevelt elk that inhabited a landscape with a stable composition of discrete forage habitats in an ecosystem dominated by forest that had little forage. The mild climate precluded climatic extremes from differentially affecting size dimorphic females and males, which can prompt differential habitat selection and affect group size (Aublet et al., 2009). Across the 23-year study, female abundance changed by more than a factor of three and male abundance changed by more than a factor of four. These attributes made this study system appealing for clarifying abundance associations with male grouping patterns. To my knowledge, no one has examined forces driving both male-only group size and number of males in mixed-sex groups. Specifically, showing how male-male competition can constrain male-only group sizes and a density-dependent mechanism to maintain sex-specific groups. This research offers new insights into the evolution of gregariousness in male groups.
Materials and Methods
Study Area
The study population inhabited the lower part of the Prairie Creek drainage in Redwood National and State Parks, Humboldt County, California USA (41.2132°N, 124.0046°W). The prime habitat for foraging by elk was the Boyes and Davison meadow complexes, which had flat topography and were about 3 km apart (Peterson and Weckerly, 2017). Boyes meadow was 51 ha and the Davison meadows were 50–60 ha in total area. For the first 19 years of the study from 1997 to 2015, Davison meadows were 50 ha. In late 2015 an adjacent 10 ha meadow to the south of Davison meadows that was privately owned was purchased by a non-profit organization and deeded to Redwood National and State Parks. Under private ownership elk were hazed when they ventured onto the parcel. Hazing ceased in late 2015 and elk began using the meadow in early 2016, which continued into 2019 (McGuire, 2018; Koetke, 2019). Summers were generally cool and dry, and winters were mild and wet. Precipitation mostly fell from October to April, usually 120–180 cm. Snow was rare; respective mean minimum and maximum winter temperatures were 2 and 10°C. In summer, the respective mean minimum and maximum temperatures were about 10 and 20°C (Starns et al., 2015). Forage in meadows was mostly annual and perennial grasses with some forbs. Green-up of meadow vegetation began with autumn rains; plants grew slowly into late winter and more rapid growth began in early spring. Vegetation biomass peaked in May or June (Starns et al., 2015). Discrete meadows were surrounded by second- and old-growth redwood (Sequoia sempervirens)-conifer forests that dominated the area. Elk were non-migratory and not legally hunted in Redwood National and State Parks. Mountain lions (Puma concolor) and black bears (Ursus americanus) inhabit the parks. Mountain lions can prey on elk of all ages whereas black bears mostly prey on neonatal elk (Weckerly, 2017).
Surveys and Groups
Systematic surveys were conducted in January to collect data on group sizes and estimate abundances. January is roughly 3 months after the mating season when most conceptions occur (Weckerly, 2017). Although rare, copulations and conceptions do occur 3 months after the mating season (Guinness et al., 1978; Johnson et al., 2019). Furthermore, males still had developed antlers in January (Weckerly, 2017). Beginning at dawn, surveys were conducted for 1.75 h. The route was driven in a vehicle and all elk that were detected (solitary or in groups) were counted and classified as adult females (≥1 year old), juveniles, subadult, or yearling males (1–2 years), and adult males (≥2 years). Age classifications were delineated based on body size of females and juveniles and antler dimensions of subadult and adult males. Subadult males had unbranched antlers and adult males had branched antlers. Elk were grouped when two or more individuals displayed coordinated movement which meant they were often within 50 m of one another. When necessary to obtain an accurate count, I exited the vehicle and approached elk to within 10–200 m. Elk in the Prairie Creek drainage were accustomed to people and thus did not flee at my approach. In 1997 and 2000–2019, 10 surveys were conducted in each year. In 1998 and 1999, 5 surveys were conducted in each year. Field procedures were approved under animal care and use protocols approved through Texas State University (KSMJK6_02, 0735_1106_07, 1035_1112_31, 1019_1031_23, IACUC20168174611, A4147-01).
Up to 1 month before surveys began in January, I searched both Boyes and Davison meadow complexes for elk that I could uniquely identify from morphological distinctions (scars, ear slits, antler and pelage anomalies, and sometimes ear tags). These “naturally” marked elk also were noted during systematic surveys. The frequency of naturally marked elk and count data were used to estimate male abundances with Bowden’s mark-resight estimator when the count data in a year indicated that individual males were missed during surveys (Bowden and Kufeld, 1995; Weckerly, 2017). I was likely to miss known individual males if there were unmarked males counted during surveys. Later in the time series when males were less abundant, I usually was able to uniquely identify all males based on antler and pelage anomalies and thus the tally of marked males was my index of male abundance. Adult females, juveniles, and subadult males were socially bonded and formed a cohesive group, hereafter referred to as the Davison herd. Individuals in the Davison herd had high sighting probabilities (>0.80) so I used the highest count as the index of female abundance (Peterson and Weckerly, 2017; Weckerly, 2017).
Group Metrics and Analyses
I used an animal focused metric of male-only group size, typical group size (Jarman, 1974). Typical group size is calculated as where G is the number of individuals in the ith group. Solitary elk were included in typical group size calculations. Another reason why I selected typical group size is that this metric will be the same as the arithmetic mean of group sizes when all groups are the same size (Heard, 1992). When there is variability, typical group size is smaller than mean group size and the deviation between typical and mean group sizes increases with greater variation in group sizes. These features between mean and typical group sizes were convenient for assisting in distinguishing the two kinds of frequency associated group sizes, isometric and small-group relationships.
One tacit assumption about typical group size is that all animals in the population are detected (Jarman, 1974). This assumption was not met in every survey of my male-only groups so group-size estimates might be biased. To circumvent the detection issue, I only used survey data where the sum of all male-only group sizes and number of males in mixed-sex groups equaled the estimated male abundances. In years when Bowden’s estimates of male abundance were necessary, I used surveys where the sum was at least the lower bound of the 95 percent confidence interval of estimated abundances.
To assess whether fusion-fission grouping occurred I calculated the proportion of groups observed during surveys that were comprised of unique compositions (Sueur et al., 2011). In a year when two or more surveys occurred where all males were detected, unique compositions were either when there were different-sized groups or when group sizes were the same, but groups had unique combinations of known individuals. In 20 of the 23 years there were a total of 98 surveys that met these criteria. The range in number of surveys in a year with unique combinations was 2–10 (median = 3.5). My metric of fusion-fission grouping was the proportion of the 98 surveys with unique compositions.
I estimated the number of males in mixed-sex groups (Davison herd) in two ways. I calculated the median of the number of males in the Davison herd in each year. I chose the median over the mean because the distribution of group sizes tend to be skewed right (Reiczigel et al., 2008). I also reported the high count of males in the Davison herd across the surveys conducted in each year. If the number of males in the Davison herd is ephemeral, then I expected the high count of males to be more strongly related to herd abundance than median number of males. I assumed that when males were in the Davison herd they were readily detected because I observed the herd repeatedly at close distances.
Least-squares regressions were estimated between abundances (Davison herd, male population) and response variables (median number and high count of males in Davison herd). Because there were unequal number of male-only groups across years (Supplementary Material), I estimated a regression weighted by number of male-only groups in each year (Ryan, 1997). Weights were positively related to number of male-only groups.
I considered likely changes in K (environmental carrying capacity) that occurred across the 23 years of the study (Weckerly, 2017; Koetke, 2019). Because of a population irruption that began in 1991 a correction in density-dependent herd growth associated with a population decline likely occurred in the first 9 years of the study from 1997 to 2005. From 2006 to 2016 density-dependent growth was emerging, and from 2017 to 2019 when a new 10-ha forage patch became available to the herd (McGuire, 2018). Beginning in 2017 a new, higher K likely was emerging. I used a nested models analysis (Sokal and Rohlf, 2012) to assess if relationships between abundance and number of males differed between 1997–2005 and 2006–2016 or if one relationship across the 20 years would suffice. Data in 2017–2019 were excluded from regression analysis because of few data points. Regressions were estimated from 10,000 bootstrapped samples of data and I reported 95 percent confidence intervals of regression coefficients.
Results
Abundance of the Davison herd declined from 1997 to 2006 (Figure 1). The abundance in 2006 was also the year of lowest abundance (17 elk) for the herd across the 23-year time series. After 2006 the herd steadily increased but there was a noticeable increase in herd abundance between 2017 and 2018. The abundances in 2018 and 2019 were the largest (62) documented in the time series. The temporal pattern in male abundance was strikingly different. The highest abundance of 33 was early in the time series (1997) and then progressively declined to a low of 7 in 2015 and 2016.
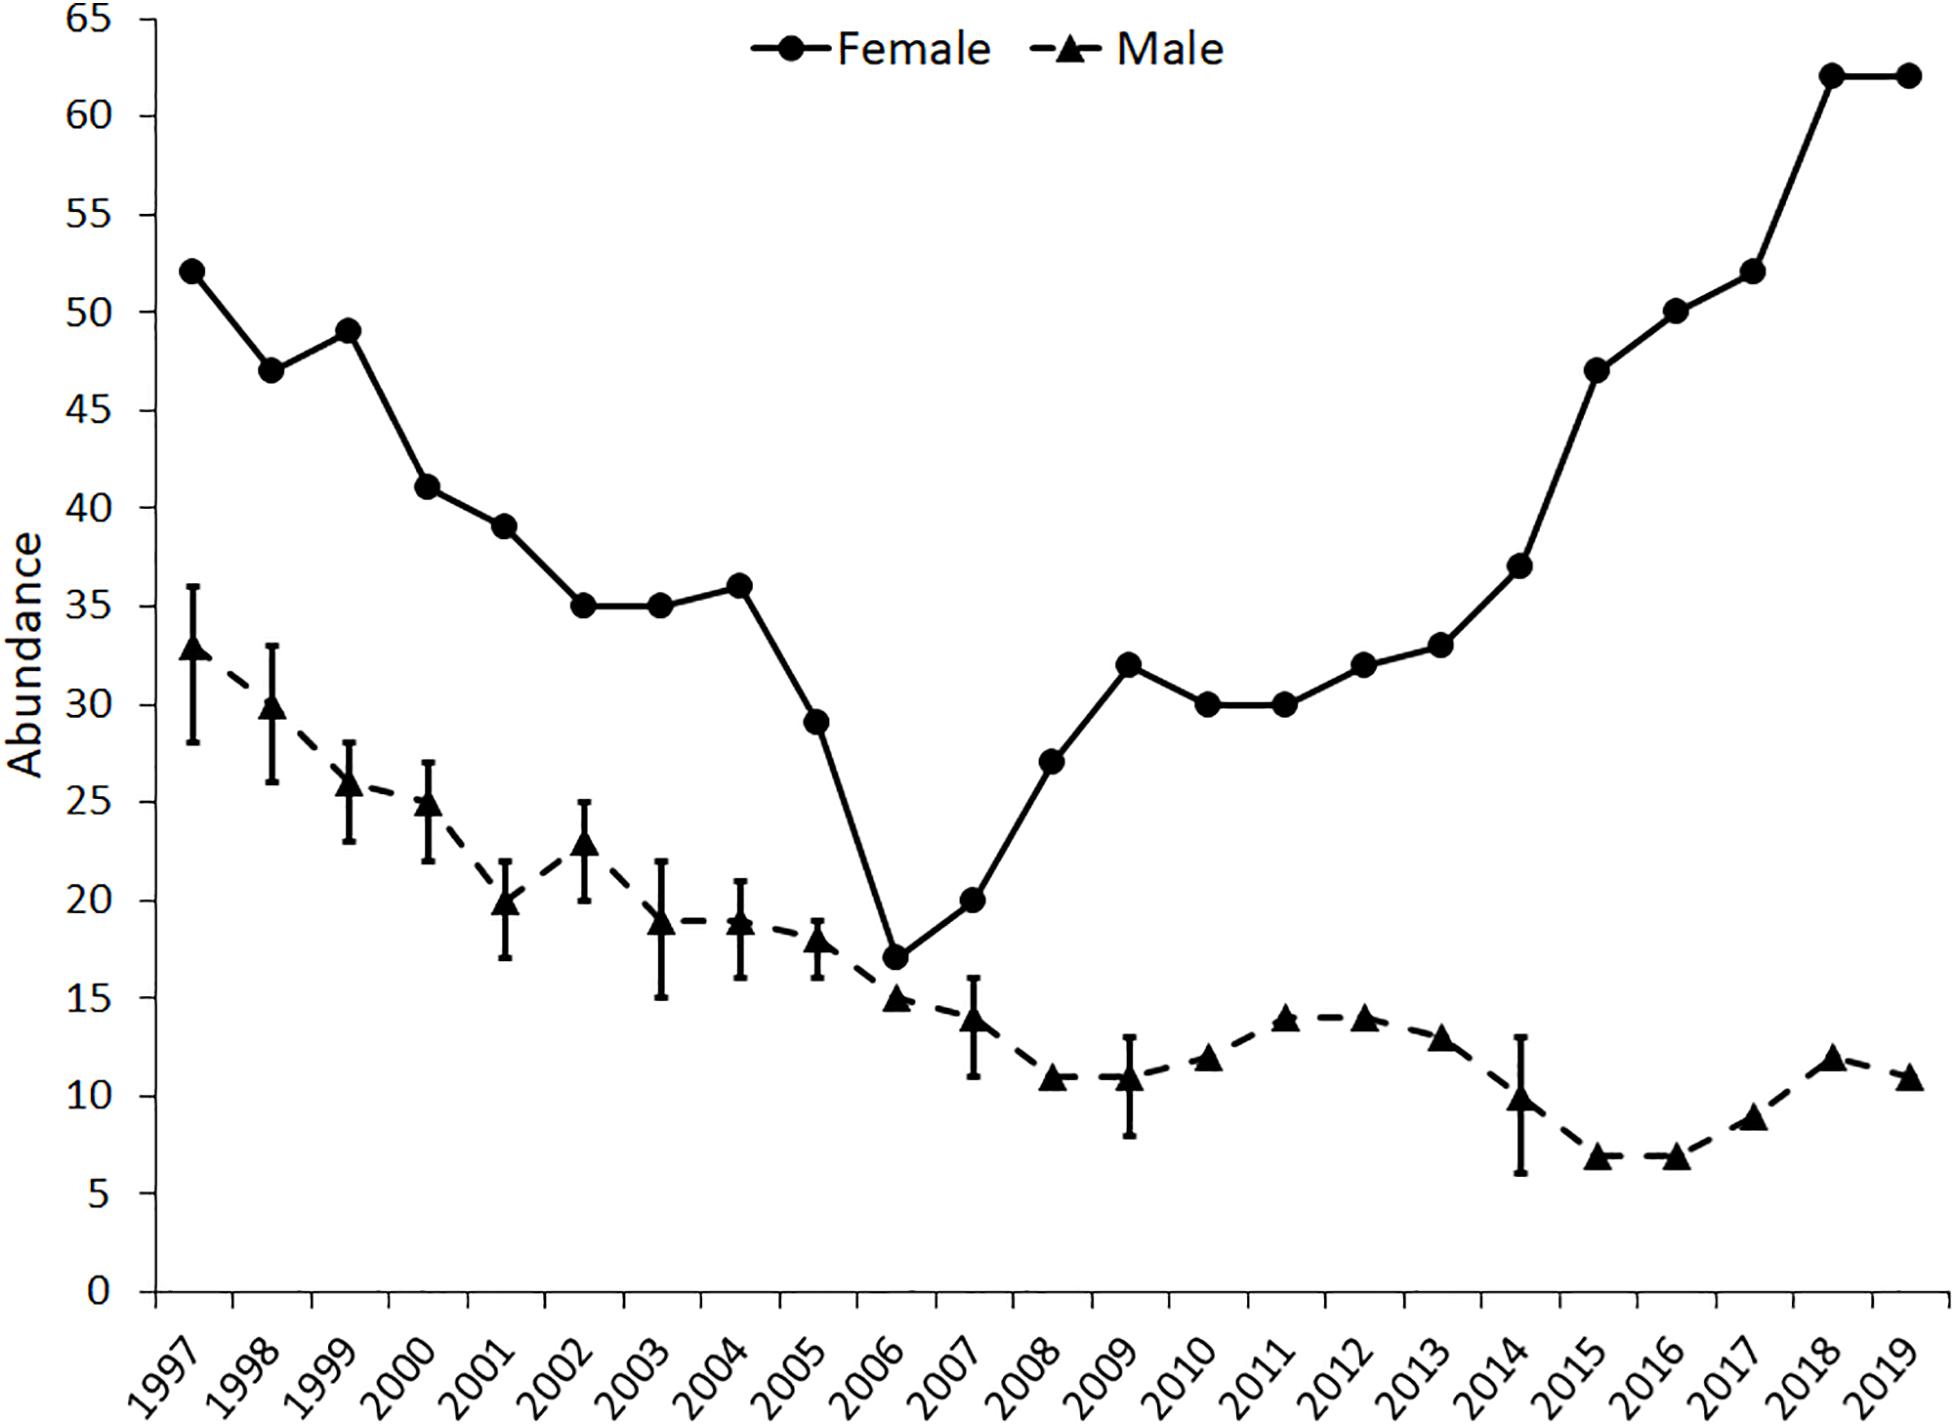
Figure 1. Time series of abundances of the Davison herd (female) and male population. Error bars are 95 percent confidence intervals for years when male abundances were estimated using Bowden’s mark-resight estimator.
Males in male-only groups displayed fusion-fission dynamics as there were unique compositions in 78 of the 98 surveys (80%). Among the 220 surveys conducted in 23 years there were 154 surveys (70%) with males in the Davison herd (i.e., mixed-sex groups). Across these 154 surveys, the proportion of males from the male population that were in the Davison herd ranged from 0.03 to 0.89. The respective 25th, 50th, and 75th percentiles were 0.08, 0.10, and 0.22. In roughly 25% of surveys, a substantial part of the male population was in the Davison herd on the Davison meadow complex.
Male abundance, but not Davison herd abundance, displayed a relationship with male-only group sizes (Table 1). Abundance of the Davison herd was weakly related to median number of males in the Davison herd but more strongly related to high count of males in the Davison herd. Male abundance, however, had little influence on either of the two measures of number of males in the Davison herd.
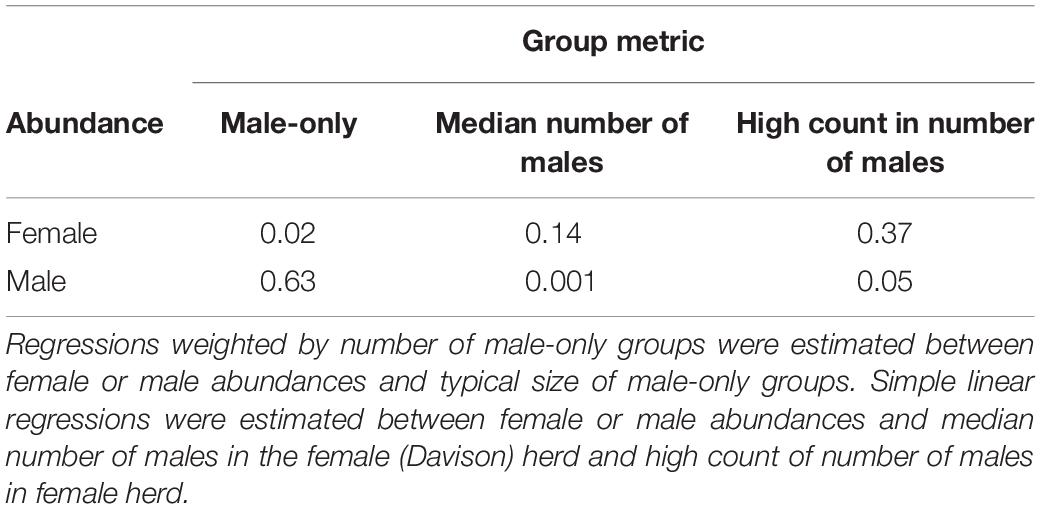
Table 1. Coefficients of determination (r2) from bootstrapped regressions.
Male abundance displayed a frequency associated, small-group relationship with male-only group size (Figure 2). The estimated intercept of the regression passed through the origin and the estimated slope (0.42) was < 1.0. There was an abundance associated response, however, between Davison herd abundance and high count of males in that herd between 1997 and 2016 (Figure 3). Considering likely changes in K between 1997 and 2005, and from 2006 to 2016 did not affect the inverse relationship between herd abundance and high count of males [F(2, 16) = 1.9, P = 0.175].
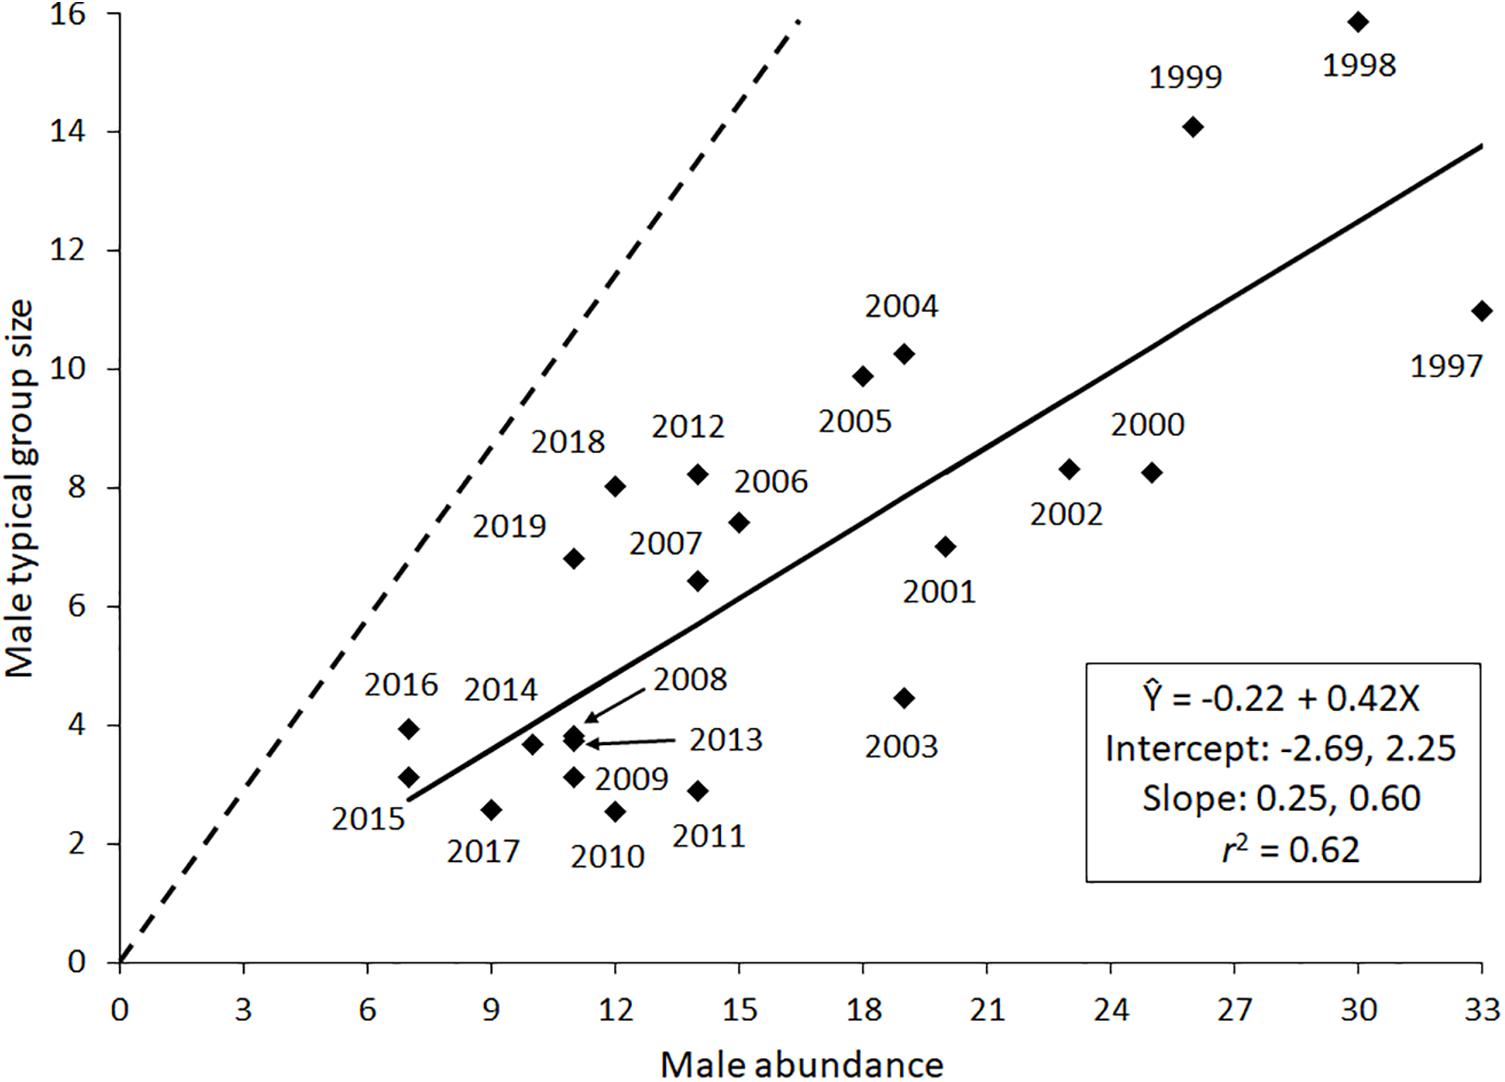
Figure 2. Scatterplot of data and weighted regression estimating relationship between male abundance and male-only group size. The regression coefficients, r2, and lower and upper 95% confidence intervals for each regression coefficient are also reported. The dashed line represents an isometric relationship.
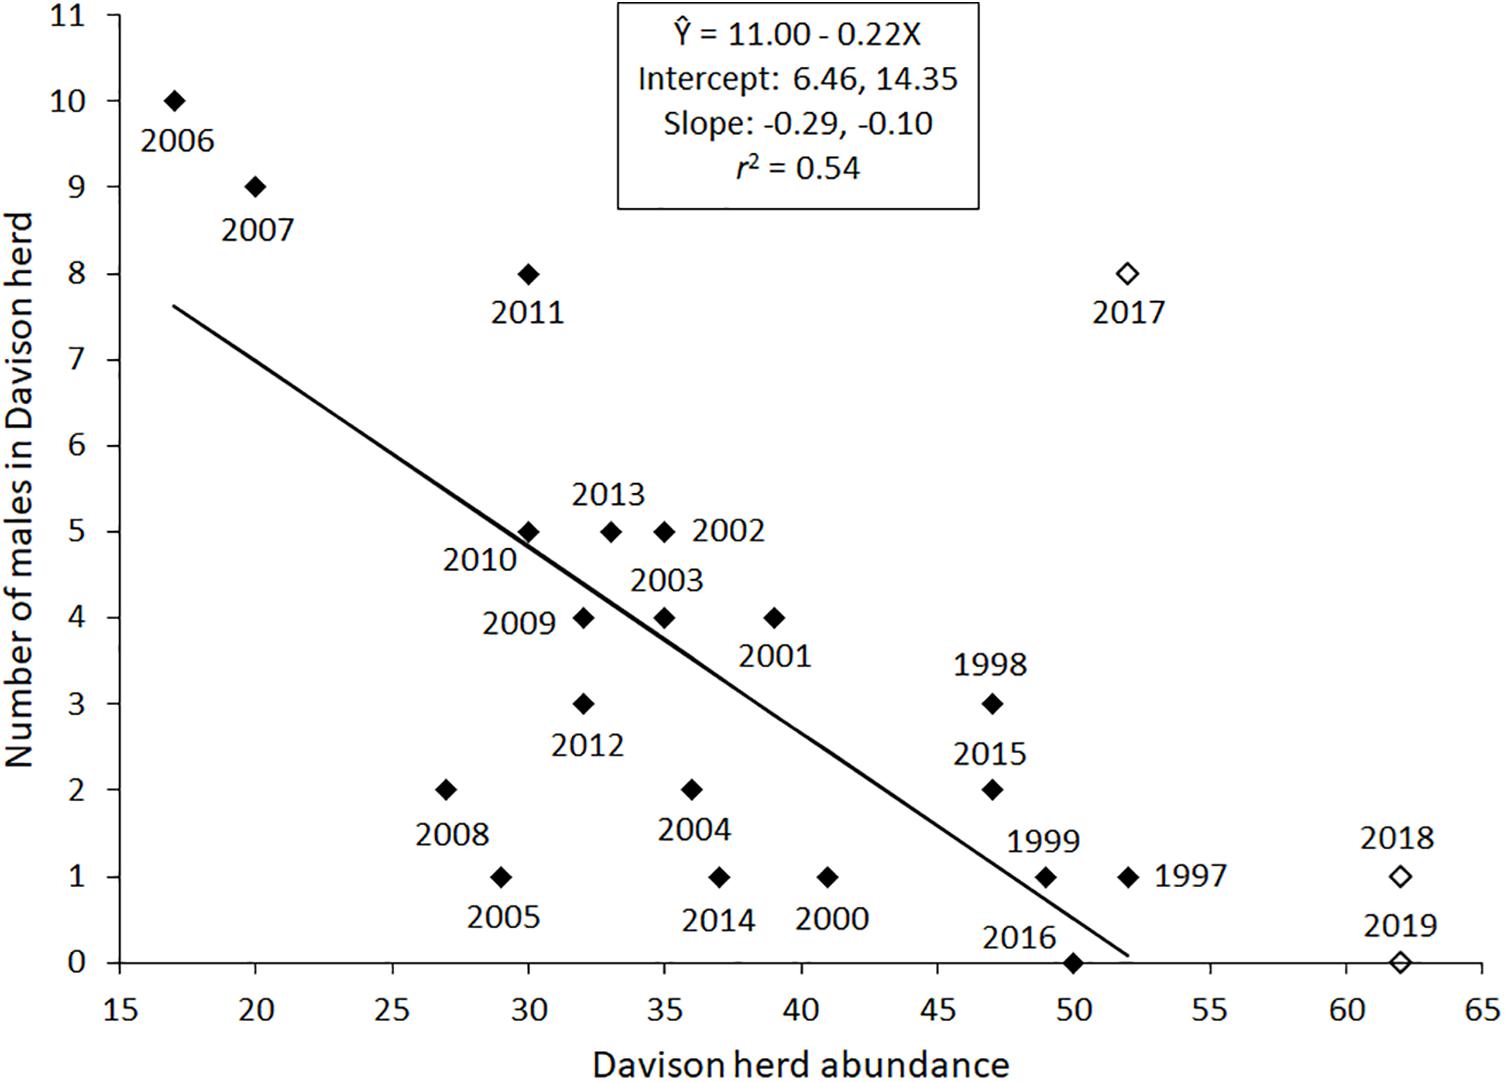
Figure 3. Scatterplot of data and regression estimating high count of males in the Davison herd from Davison herd abundance for 1997–2016 (solid diamonds). The years 2017–2019 have open diamonds. Data in those years were not included in analysis because the herd expanded use into a new forage habitat and the result is likely to be an increase in K carrying capacity.
Discussion
There were three novel aspects to my study. One, I examined abundance relationships in the two possible male grouping patterns, male-only groups and males in mixed-sex groups (Davison herd). Two, I uncovered the metric of abundance that was related to each of the group types. Three, I described frequency and density associated relationships that were used to identify when social and ecological factors were likely affecting male grouping patterns. These outcomes are important to understanding the evolution of male gregariousness, which is complex.
As expected, male abundance was related to male-only group size, which displayed a small-group relationship. Thus, social factors likely played a role in influencing male group sizes after the mating season. Males presumably interact with other males to learn social skills or to maintain a high social status once that is attained (Weckerly, 2001). As male abundance determines the number of possible interactors, it was more strongly related to male-only group size than was female abundance. The constant fusion-fission group dynamics means that group size is less than the largest possible group size, precluding the manifestation of an isometric relationship. An isometric relationship was displayed by the Davison herd (Weckerly, 2017). These females and juveniles are in one cohesive group presumably because it improves forage acquisition and lessens risks from predators when discrete forage patches are embedded in forests that have little forage (Street et al., 2013). The small-group relationship is consistent with social and not ecological factors influencing male-only group sizes because an isometric relationship was not found and the fusion-fission group size dynamics. Male–male competition, a driver of fusion-fission dynamics, is constant across male abundances and constrains their group sizes.
Small male-only group sizes in polygynous and group-living herbivores is common outside of the mating season (Hirth, 1977; Owen-Smith, 1993; Winnie and Creel, 2007; Li et al., 2012; Vander Wal et al., 2013; Weckerly and Ricca, 2014). Small male-only group size can ostensibly be attributable to fewer adult males relative to adult females in populations. Males typically have shorter longevity than females probably because of sexual selection and large body size (Owen-Smith, 1993; Toïgo and Gaillard, 2003; Tidiere et al., 2015). Nonetheless, when considering abundance of males and the number of males that potentially could be grouped, I observed that male-only group sizes were still small. Small male-only group size is likely because of fusion-fission dynamics brought about by male–male competition and because males occurred with females at times. The implication is that male-only group sizes should be small because male–male interactions to improve reproductive success should be constantly occurring across a variety of environmental settings.
Ecological factors probably have a role in male-only group sizes outside of the mating season (Winnie and Creel, 2007; Chiyo et al., 2014). Boyes and Davison meadow complexes are rather small forage patches (51–60 ha) situated in expanses of forests that presumably provide much less forage for elk. Consequently, females and males frequent the same meadows and are often in proximity (Weckerly, 2017). Consequently, the patchiness of forage habitat might have influenced the high frequency (70%) across all years that one or more males were in the Davison herd (mixed-sex groups). When the landscape is comprised of more open forage habitat, frequency of mixed-sex groups appears to be lower (Conradt, 1999; Peterson and Weckerly, 2017). Males associating with female groups is probably filtered through local environmental settings (Bleich et al., 1997).
An inverse relationship between female abundance and number of males in mixed-sex groups provides a mechanism for females, which are subordinate to males, to reduce male entry into female groups (Weckerly et al., 2001). At low female abundance, relative to K, food limitations should be lessened and, consequently, males might seek females to assess mating possibilities. Males entering female groups probably receive little interference to group entry from individual females. Although my study was conducted 3 or so months after the mating season, estrous females might exist at that time (Guinness et al., 1978; Weckerly, 2017; Johnson et al., 2019), generating the motivation for males to enter female groups. At high female abundance, relative to carrying capacity, males are reluctant to seek out and associate with females because per capita food resources are low. Additionally, there is the cost of reduced foraging time when males aggregate with females because males have low tolerance for foraging animals in close proximity or because males are assessing and possibly courting females which I did observe (Prins, 1989; Turner et al., 2005; Peterson and Weckerly, 2018).
Because I did not detect an influence of a likely change in K on the relationship between Davison herd size and number of males in that herd it calls into question whether food limitations have a pronounced impact on male entry into the Davison herd (Koetke, 2019). The Davison herd presumably went through a four-stage irruption between 1991 and 2016 (Weckerly, 2017). The first two stages, rapid growth and peak of the irruption, occurred from 1991 to 1997, the third stage, herd decline occurred from 1998 to 2006, and the fourth stage, emergence of a new K, occurred between 2006 and 2016. Between 1997 and 2005 there might not have been a large enough range in herd sizes to detect a change in the relationship between herd abundance and number of males in the herd.
Perhaps males are more strongly cued to females that possibly are in or going to be in estrus. The “female in estrus” possibility seems more likely at low herd abundance when females are likely to be in a higher nutritional plane which should improve the chances that females are reproductive. This possibility might also be playing out after 2015. In late 2015 a new forage patch became available. In a matter of months after the patch became accessible, the Davison herd was using the new patch (McGuire, 2018). Inclusion of this forage patch presumably alleviated forage limitations among females in the Davison herd as recruitment increased for the next 2 years (McGuire, 2018; Koetke, 2019). A new and elevated K seemed likely from 2017 to 2019. In 2017 there might have been more females in better physiological condition than in 2018 and 2019. In turn, more males entered the Davison herd in 2017 than in the other 2 years. K and influences on males associating with females, outside the mating season, might be less than the influence of K on prevalence of reproductively active females.
The inverse relationship between Davison herd abundance and number of males in that herd is not likely because of increased vulnerability to predators at small group sizes when population abundance is also low (Thirgood, 1996; Meldrum and Ruckstuhl, 2019). In my study population, group size is a weaker correlate of vigilance in females and males than proximity of individuals across a range of abundances (Peterson and Weckerly, 2018). When individuals lift their heads when grazing it is more likely to be in response to conspecific interactions than to risks from predators. Moreover, in the open, flat meadows of the study area individual vulnerability to attack and capture by mountain lions or black bears is probably less than in nearby forests (Weckerly, 2017).
An abundance-associated mechanism for reducing male entry into female groups is useful to explaining intersexual habitat use, population level phenomenon like sexual segregation, and reducing the prospect of male harassment (Parker, 1979; McCullough, 1999; Wearmouth et al., 2012). Ultimately, females should aggregate in habitat with abundant and nutritious forage for fitness returns as should males. Although resource use and selection by size-dimorphic females and males differs, there remains considerable niche overlap, particularly at low abundances, which means that females and males can be in proximity (Kie and Bowyer, 1999; Long et al., 2009). The abundance-associated relationship uncovered herein offers a proximate mechanism to preclude males from aggregating with females as well as reduce male harassment.
The inverse relationship between Davison herd (female) abundance and number of males in the herd was weaker than the male abundance–male-only group size relationship. Perhaps the inverse relationship was spurious. A spurious correlation might manifest if only young sexually mature but socially immature males associated with females more than older males (Owen-Smith, 1993; Bleich et al., 1997; Wang et al., 2018). I did not know the age structure of the male population or the age of males that frequented the Davison herd. But, about 25 percent of the time, a substantial part of the male population was aggregated with females. On those occasions it seemed unlikely that most of the male population was comprised of young and socially immature males. It was plausible that more than just young and socially immature males aggregated with females.
The relationship between Davison herd abundance and median number of males in the Davison herd was weak. Because males are transient members of female groups, my measure of central tendency, the median, failed to capture the dynamic of males entering the Davison herd and the length of time males remained in the herd. As such, measures of central tendency probably cannot capture that dynamic across weekly or monthly time scales.
Male grouping patterns from small to large total abundance are complex because male-only groups and males in mixed-sex groups associate with different measures of abundances. Furthermore, female and male abundances do not have to be strongly connected. Male abundance was highest early in the time series, which might have been associated with dispersing males seeking forage and assessing mating opportunities (Loe et al., 2009). Davison meadow became available to elk in 1991 and there was rapid growth of both female and male abundances until 1997 when the Davison herd peaked in abundance (Weckerly, 2017). After 1997 male abundance steadily declined as did the Davison herd abundance. Herd abundance began to rebound in 2007 but male abundance did not. After 2006, male survival might have declined. Alternatively, males typically disperse from natal herds as yearlings. Therefore, the rate that males dispersed into Boyes and Davison meadow complexes from the Davison and other herds in the region might have declined because of forage limitations in the Davison meadows (Peterson and Weckerly, 2017). Perhaps there were few males to disperse to the Boyes and Davison meadow complexes. Whatever the possible mechanism(s), lower male abundance when female abundances were high also has been documented in two other populations of C. elaphus that were not hunted (Coulson et al., 2004; Cobb, 2010).
Male grouping patterns 3 months after the mating season were influenced by both ecological and social factors. Ecological factors influenced prevalence of males in female groups and social factors had a large influence on size of groups comprised of adult males. Uncovering the roles of ecological and social factors required the appropriate metric of abundance. In the past, abundance–group size relationships used total abundance (females and male), but in this study the male abundance–male-only group size and Davison herd abundance–number of males in the herd relationships were more informative. Uncovering the appropriate metric of abundance was needed to directly examine why male and female group sizes display such different dynamics. Information that was needed to provide additional insights into the evolution of male gregariousness.
Data Availability Statement
The datasets generated for this study are available on request to the corresponding author.
Ethics Statement
The animal study was reviewed and approved by the Texas State University, Institutional Animal Care and Use Committee.
Author Contributions
FW was responsible for all aspects of the study: developing the questions, designing the study, collecting, analyzing and interpreting the data, and writing the manuscript.
Funding
Funding was provided by the Alamo Safari Club, California Fish and Wildlife, Granite Bay Safari Club, Rocky Mountain Elk Foundation, Houston Safari Club, and Save the Redwoods League.
Conflict of Interest
The authors declare that the research was conducted in the absence of any commercial or financial relationships that could be construed as a potential conflict of interest.
Acknowledgments
I am grateful to the students that assisted in field work: A. Duarte, J. Hunt, R. Keheler, L. Koetke, N. Kolbe, M. Longoria, R. Luna, K. McFarland, A. McGuire, M. O’Day, L. Peterson, K. Richardson, M. Ricca, S. Shelton, S. Robinson, H. Starns, G. Street, L. Williamson, and D. Wolcott. I thank L. Koetke, Z. Espinoza, and two reviewers for comments on a previous draft.
Supplementary Material
The Supplementary Material for this article can be found online at: https://www.frontiersin.org/articles/10.3389/fevo.2020.00204/full#supplementary-material
References
Asher, G. W., Scott, I. C., Archer, J. A., Ward, J. F., and Littlejohn, R. P. (2011). Seasonal luteal cyclicity of pubertal and adult red deer (Cervus elaphus). Anim. Reprod. Sci. 125, 138–147. doi: 10.1016/j.anireprosci.2011.03.009
Aublet, J. F., Festa-Bianchet, M., Bergero, D., and Bassano, B. (2009). Temperature constraints on foraging behaviour of male Alpine ibex (Capra ibex) in summer. Oecologia 159, 237–247. doi: 10.1007/s00442-008-1198-4
Bell, R. H. V. (1971). A grazing ecosystem in the Serengeti. Sci. Am. 225, 86–93. doi: 10.1038/scientificamerican0771-86
Bleich, V. C., Bowyer, R. T., and Wehausen, J. D. (1997). Sexual segregation in mountain sheep: resources or predation? Wildlife Monogr. 134, 3–50.
Bowden, D. C., and Kufeld, R. C. (1995). Generalized mark-resight population size estimation applied to Colorado moose. J. Wildlife Manag. 59, 840–851.
Childress, M. J., and Lung, M. A. (2003). Predation risk, gender and the group size effect: does elk vigilance depend upon the behaviour of conspecifics? Anim. Behav. 66, 389–398. doi: 10.1006/anbe.2003.2217
Chiyo, P. I., Wilson, J. W., Archie, E. A., Lee, P. C., Moss, C. J., and Alberts, S. C. (2014). The influence of forage, protected areas, and mating prospects on grouping patterns of male elephants. Behav. Ecol. 25, 1494–1504. doi: 10.1093/beheco/aru152
Clutton-Brock, T. H., Guinness, F. E., and Albon, S. D. (1982). Red deer: Behavior and Ecology of two Sexes. Chicago, IL: University of Chicago.
Cobb, M. A. (2010). Spatial Ecology and Population Dynamics of Tule elk (Cervus elaphus nannodes) at Point Reyes National Seashore, California. Dissertation, University of California, Berkeley, Berkeley, CA.
Conradt, L. (1999). Social segregation is not a consequence of habitat segregation in red deer and feral soay sheep. Anim. Behav. 57, 1151–1157. doi: 10.1006/anbe.1999.1067
Coulson, T., Guinness, F., Pemberton, J., and Clutton-Brock, T. (2004). The demographic consequences of releasing a population of red deer from culling. Ecology 85, 411–422. doi: 10.1890/03-0009
Galezo, A. A., Krzyszczyk, E., and Mann, J. (2018). Sexual segregation in Indo-Pacific bottlenose dolphins is driven by female avoidance of males. Behav. Ecol. 29, 377–386. doi: 10.1093/beheco/arx177
Guinness, F., Lincoln, G. A., and Short, R. V. (1971). The reproductive cycle of the female red deer, Cervus elaphus L. J. Reprod. Fertil. 27, 427–438. doi: 10.1530/jrf.0.0270427
Guinness, F. E., Gibson, R. M., and Clutton-Brock, T. H. (1978). Calving times of red deer (Cervus elaphus) on Rhum. J. Zool. 185, 105–114. doi: 10.1111/j.1469-7998.1978.tb03316.x
Heard, D. C. (1992). The effect of wolf predation and snow cover on musk-ox group size. Am. Natural. 139, 190–204. doi: 10.1086/285320
Hirth, D. H. (1977). Social behavior of white-tailed deer in relation to habitat. Wildlife Monogr. 53, 1–55.
Jarman, P. J. (1974). The social organisation of antelope in relation to their ecology. Behaviour 48, 215–267. doi: 10.1163/156853974x00345
Jedrzejewski, W., Saedtke, H., Kamler, J. F., Jedrzejewska, B., and Stenkewitz, U. (2006). Group size dynamics of red deer in Bialowieza Primeval Forest. Poland. J. Wildlife Manag. 70, 1054–1059. doi: 10.2193/0022-541x(2006)70[1054:gsdord]2.0.co;2
Johnson, B. K., Jackson, D. H., Cook, R. C., Clark, D. A., Coe, P. K., Cook, J. G., et al. (2019). Roles of maternal condition and predation in survival of juvenile elk in Oregon. Wildlife Monogr. 201, 3–60. doi: 10.1002/wmon.1039
Keller, B. J., Bleisch, A. D., Millspaugh, J. J., Lehman, C. P., Kragel, J. J., Hansen, L. P., et al. (2015). Extended duration of parturution season in North American elk (Cervus elaphus). Am. Midland Natural. 173, 162–167. doi: 10.1674/0003-0031-173.1.162
Kie, J. G., and Bowyer, R. T. (1999). Sexual segregation in white-tailed deer: density-dependent changes in use of space, habitat selection, and dietary niche. J. Mammal. 80, 1004–1020. doi: 10.2307/1383271
Koetke, L. J. (2019). Elk Population Dynamics When Carrying Capacities Vary Across and Within Herds. Thesis, Texas State University, San Marcos, TX.
Lesmerises, F., Johnson, C. J., and St-Laurent, M.-H. (2018). Landscape knowledge is an important driver of the fission dynamics of an alpine ungulate. Anim. Behav. 140, 39–47. doi: 10.1016/j.anbehav.2018.03.014
Li, C., Jiang, Z., Li, L., Li, Z., Fang, H., Li, C., et al. (2012). Effects of reproductive status, social rank, sex and group size on vigilance patterns in przewalski’s gazelle. PLoS One 7:e32607. doi: 10.1371/journal.pone.0032607
Loe, L. E., Mysterud, A., Veiberg, V., and Langvatn, R. (2009). Negative density-dependent emigration of males in an increasing red deer population. Proc. R. Soc. Lon. B 2763, 2581–2587. doi: 10.1098/rspb.2009.0224
Long, R. A., Rachlow, J. L., and Kie, J. G. (2009). Sex-specific responses of North American elk to habitat manipulation. J. Mammal. 90, 423–432. doi: 10.1644/08-mamm-a-181.1
Marino, A., and Baldi, R. (2014). Ecological correlates of group-size variation in a resource-defense ungulate, the sedentary Guanaco. PLoS One 9:e89060. doi: 10.1371/journal.pone.0089060
McCullough, D. R. (1969). The tule elk: its history, behavior, and ecology. Univ. Calif. Publ. Zool. 88, 1–191.
McCullough, D. R. (1979). The George Reserve Deer Herd: Population Ecology of a k Selected Species. Ann Arbor, MI: University of Michigan Press.
McCullough, D. R. (1999). Density dependence and life-history strategies of ungulates. J. Mammal. 80, 1130–1146. doi: 10.2307/1383164
McGuire, A. G. (2018). Roosevelt elk Response to a Newly Available Forage Patch. Thesis, Texas State University, San Marcos, TX.
Meldrum, G. E., and Ruckstuhl, K. E. (2019). Mixed-sex group formation in bighorn sheep in winter: trading costs of synchrony for benefits of group living. Anim. Behav. 77, 919–929. doi: 10.1016/j.anbehav.2008.12.023
Morrison, J. A. (1960). Characteristics of estrus in captive elk. Behaviour 16, 84–92. doi: 10.1163/156853960x00052
Ortega, I. M., and Franklin, W. L. (1995). Social organization, distribution and movements of a migratory guanaco population in the Chilean Patagonia. Rev. Chil. Histor. Nat. 68, 489–500.
Owen-Smith, N. (1993). Comparative mortality rates of male and female kudus: the costs of sexual size dimorphism. J. Anim. Ecol. 62, 428–440.
Parker, G. A. (1979). “Sexual selection and sexual conflict,” in Reproductive Competition in Insects, eds M. S. Blum and N. A. Blum (London: Academic Press), 123–166. doi: 10.1016/b978-0-12-108750-0.50010-0
Peterson, L. M., and Weckerly, F. W. (2017). Male group size, female distribution and changes in sexual segregation by Roosevelt elk. PLoS One 12:e0187829. doi: 10.1371/journal.pone.0187829
Peterson, L. M., and Weckerly, F. W. (2018). Social behavior and changes in foraging behavior in a gregarious ungulate. J. Mammal. 99, 1422–1429.
Peterson, M. N., Lopez, R. R., Laurent, E. J., Frank, P. A., Silvy, N. J., and Liu, J. (2005). Wildlife loss through domestication: the case of endangered Key deer. Conserv. Biol. 19, 939–944. doi: 10.1111/j.1523-1739.2005.00069.x
Prins, H. H. T. (1989). Condition changes and choice of social environment in African buffalo bulls. Behaviour 108, 297–324.
Proffitt, K. M., Gude, J. A., Shamhart, J., and King, F. (2012). Variations in elk aggregation patterns across a range of elk population sizes at Wall Creek. Montana. J. Wildlife Manag. 76, 847–856. doi: 10.1002/jwmg.310
Pulliam, H. R., and Caraco, T. (1984). “Living in groups: is there an optimum group size?,” in Behavioral Ecology: AN Evolutionary approach, 2nd Edn, eds J. R. Krebs and N. B. Dvies (Oxford: Blackwell), 122–147.
Reiczigel, J., Lang, Z., Rozsa, L., and Tothmersz, B. (2008). Measures of sociality: two different views of group size. Anim. Behav. 75, 715–721. doi: 10.1016/j.anbehav.2007.05.020
Richardson, K. E., and Weckerly, F. W. (2007). Intersexual social behavior of urban white-tailed deer and its evolutionary implications. Can. J. Zool. 85, 759–766. doi: 10.1139/z07-057
Sokal, R. R., and Rohlf, F. J. (2012). Biometry: The principles and Practice of Statistics in Biological Research. New York, NY: W. H. Freeman and Company.
Starns, H. D., Weckerly, F. W., Ricca, M. A., and Duarte, A. (2015). Vegetation changes associated with a population irruption by Roosevelt elk. Ecol. Evol. 5, 109–120. doi: 10.1002/ece3.1327
Street, G. M., Weckerly, F. W., and Schwinning, S. (2013). Modeling forage mediated aggregation in a gregarious ruminant. Oikos 122, 929–937. doi: 10.1111/j.1600-0706.2012.20974.x
Sueur, C., King, A. J., Conradt, L., Kerth, G., Lusseau, D., Mettke-Hofmann, C., et al. (2011). Collective decision-making and fission-fussion dynamics: a conceptual framework. Oikos 120, 1608–1617. doi: 10.1111/j.1600-0706.2011.19685.x
Thirgood, S. J. (1996). Ecological factors influencing sexual segregation and group size in fallow deer (Dama dama). J. Zool. 239, 783–797. doi: 10.1111/j.1469-7998.1996.tb05478.x
Tidiere, M., Gaillard, J.-M., Muller, D. W. H., Lackey, L. B., Gimenez, O., Clauss, M., et al. (2015). Does sexual selection shape sex differences in longevity and senescence patterns across vertebrates? A review and new insights from captive ruminants. Evolution 69, 3123–3140. doi: 10.1111/evo.12801
Toïgo, C., and Gaillard, J.-M. (2003). Causes of sex-biased adult survival in ungulates: sexual size dimorphism, mating tactic or environmental harshness? Oikos 101, 376–384. doi: 10.1034/j.1600-0706.2003.12073.x
Turner, W. C., Jolles, A. E., and Owen-Smith, N. (2005). Alternating sexual segregation during the mating season by male African buffalo (Syncerus caffer). J. Zool. 267, 291–299.
Vander Wal, E., van Beest, F. M., and Brook, R. K. (2013). Density-dependent effects on group size are sex-specific in a gregarious ungulate. PLoS One 8:e53777. doi: 10.1371/journal.pone.0053777
Vander Wal, E., Yip, H., and McLoughlin, P. D. (2012). Sex-based differences in density-dependent sociality: an experiment with a gregarious ungulate. Ecology 93, 206–212. doi: 10.1890/11-0020.1
Wang, M., Alves, J., da Silva, A. A., Yang, W., and Ruckstuhl, K. E. (2018). The effect of male age on patterns of sexual segregation in Siberian ibex. Sci. Rep. 8:13095.
Wearmouth, V. J., Southall, E. J., Morritt, D., Thompson, R. C., Cuthill, I. C., Partridge, J. C., et al. (2012). Year-round sexual harassment as a behavioral mediator of vertebrate population dynamics. Ecol. Monogr. 82, 351–366. doi: 10.1890/11-2052.1
Weckerly, B. (2017). Population Ecology of Roosevelt elk: Conservation and Management in Redwood National and State Parks. Reno, NV: University of Nevada Press.
Weckerly, F. W. (2001). Are large male roosevelt elk less social because of aggression? J. Mammal. 82, 414–421. doi: 10.1093/jmammal/82.2.414
Weckerly, F. W., and Ricca, M. A. (2014). Aggression and coexistence in female caribou. Arctic 67, 189–195.
Weckerly, F. W., Ricca, M. A., and Meyer, K. P. (2001). Sexual segregation in Roosevelt elk: cropping rates and aggression in mixed-sex groups. J. Mammal. 82, 825–835. doi: 10.1093/jmammal/82.3.825
Winnie, J. J., and Creel, S. (2007). Sex-specific behavioural responses of elk to spatial and temporal variation in the threat of wolf predation. Anim. Behav. 73, 215–225. doi: 10.1016/j.anbehav.2006.07.007
Keywords: density dependence, gregariousness, forage acquisition, frequency dependence, polygyny, predation risk, redwood forest, ungulate
Citation: Weckerly FW (2020) Frequency and Density Associated Grouping Patterns of Male Roosevelt Elk. Front. Ecol. Evol. 8:204. doi: 10.3389/fevo.2020.00204
Received: 03 December 2019; Accepted: 03 June 2020;
Published: 03 July 2020.
Edited by:
R. Terry Bowyer, University of Alaska Fairbanks, United StatesReviewed by:
Kelley M. Stewart, University of Nevada, Reno, United StatesMatthew Jason Kauffman, University of Wyoming, United States
Copyright © 2020 Weckerly. This is an open-access article distributed under the terms of the Creative Commons Attribution License (CC BY). The use, distribution or reproduction in other forums is permitted, provided the original author(s) and the copyright owner(s) are credited and that the original publication in this journal is cited, in accordance with accepted academic practice. No use, distribution or reproduction is permitted which does not comply with these terms.
*Correspondence: Floyd W. Weckerly, fw11@txstate.edu