Statistical Damage Shear Constitutive Model of Rock Joints Under Seepage Pressure
 Shijie Xie
 Hang Lin
 Yifan Chen1*
  Yixian Wang
 Rihong Cao
- 1School of Resources and Safety Engineering, Central South University, Changsha, China
- 2School of Civil Engineering, Hefei University of Technology, Hefei, China
The constitutive relation of rock joints in the percolation environment has always been a frontier research topic in the field of geotechnical engineering, involving nuclear waste disposal, dam foundation construction, tunnel tunneling, and other fields. In this study, a shear statistical damage constitutive model of rock joints considering seepage pressure was proposed, which takes into account the statistical damage, stage deformation characteristics and seepage action in the process of joint shear deformation. By introducing the seepage pressure reduction coefficient and establishing the relationship between the model parameters and the seepage pressure, the prediction of joint shear stress-displacement curves under different seepage pressures was achieved. The comprehensive comparisons between the theoretical results and the experimental results reveals that the model can accurately reflect the shear deformation law of joints and reasonably simulate the shear stress-displacement relationship of joints. And ultimately, the physical significance of the model parameters and their relationship with shear strength characteristics are discussed via the gray correlation method. The model and verification results presented in this study can deepen the understanding of the shear behavior of joints subject to high seepage pressure and contribute to the design and optimization of geotechnical engineering in the percolation environment.
Introduction
Rock joints, which are ubiquitous in slope, fracture zone, and underground engineering excavation area, have a significantly weaker bearing capacity than the two wall surface rock masses (Yong et al., 2018; Lin et al., 2019a; Wang et al., 2020; Xie et al., 2020a; Zhang et al., 2020a,b). And typically, shear slip failure along joints has dominated the main failure modes of the aforementioned rock engineering under the action of external forces or drastic changes in the geological environment (Meng et al., 2017; Han et al., 2020; Li et al., 2020; Lin et al., 2020a; Yuan et al., 2020). Besides, as the main movement channel of groundwater, the seepage properties of joints also present a powerful influence on the shear mechanical properties of joints. In this case, the investigation on the strength characteristics and seepage characteristics of rock joints under shear load is of great practical significance for guaranteeing the safety and stability of geotechnical engineering and scientific rationality of design.
The salient issues of shear failure of joint under seepage pressure have globally attracted extensive attention from scientists and engineers. Since the establishment of the classical cubic law (Snow, 1969), numerous scholars have carried out explorations on the influence of stress on seepage characteristics of rock joints, including experimental research and numerical model research on the seepage characteristics of rock joint under normal stress, shear stress and composite stress, and obtained very rich results (Raven and Gale, 1985; Lee and Cho, 2002; Yasuhara et al., 2006; Xia et al., 2017; Zhao et al., 2017a,b). For the seepage characteristics of the fracture surfaces with circular convex contact areas, Walsh (1981) applied the effective stress theory to derive the influence coefficient of the contact area. Zimmerman et al. (1992) simplified the fracture surfaces to oval bulges, derived the correction factor for the contact area effect, and extended it to the analysis of irregular contact areas. Assisted with the COMSOL Multiphysics numerical method, Yang et al. (2015) proposed a finite element mathematical model of rock masses considering permeability and elastic anisotropy. Equipped by self-developed apparatus, Liu and Chen (2011) studied the seepage and deformation properties of rock joints subjected to normal stress, as well as lateral stress. Rong et al. (2017) conducted joint shear-seepage coupling tests to three types of granite joints with different roughness, and pointed out that the discharge was sensitive to the changes of normal stress, joint roughness coefficient (JRC), and pressure gradient.
Although these aforesaid valuable contributions lay a good foundation for further understanding of the deformation characteristics of rock joints under hydro-mechanical (HM) coupling conditions, the researches on the shear stress-displacement relationship of joints under seepage pressure, that is, the constitutive model, is still rarely reported. Olsson and Barton (2001) proposed an improved empirical engineering model that considers the coupling of hydraulic aperture and shear stress-displacement of joints during the shear process. Under the framework of the cubic law and minimum potential energy principle, Zhao et al. (2016) developed a coupled stress-seepage model to reflect the characteristics of the pre- and post-shear stress–displacement curves. Despite enriching the constitutive modeling of rock joints under seepage pressure, however, the theoretical model that directly include the shear stress, normal stress and seepage pressure remain unavailable.
Therefore, in this study, the modified constitutive model proposed by Lin et al. (2019b), as well as the additional introduction of the seepage pressure reduction coefficient β to quantitatively investigate the reduction effect of seepage pressure, was developed to predict the shear stress-displacement curves of joints under high seepage pressure. Particularly, the model considers the stage characteristics of shear behavior of joints under seepage pressure. All the parameters required by the proposed model can be directly determined from the laboratory direct shear tests. The validity of the proposed constitutive model was verified by experimental results.
Construction of the Damage Statistical Model
Constitutive Damage Model of Joint Shear in Seepage Environment
Based on damage statistics theory and joint shear deformation characteristics, Lin et al. (2019b) proposed a shear constitutive model that reflects the whole joint shear deformation characteristics as follows:
where ks is the shear stiffness, uy is the yield shear displacement, τr is the residual shear stress, and m and u0 are the Weibull distribution parameters.
Moreover, the Weibull distribution parameters m and u0 can be mathematically solved as:
where τp and up are the peak shear stress and peak shear displacement, respectively.
The shear constitutive model of rock joints is sensitive to permeable engineering environment, such as the interaction and superposition of stress field, seepage field, even temperature field and chemical field (Lei et al., 2019; Zhao et al., 2019; Lin et al., 2020b; Xie et al., 2020b). In order to thoroughly understand the problem of multi-field coupling, the method of the system research is needed, including the internal relations of the subsystems and the interactions among the subsystems. However, due to the complexity of this multi-field coupling, it is difficult to clearly reflect the whole coupling process, and it is quite difficulty to establish an accurate mathematical model up to now.
By establishing the relationship between model parameters (ks,uy, τp, up, u0, m) and seepage pressure Pw, a statistical damage constitutive model considering seepage pressure can be established. Then the joint shear stress-displacement curve under a certain seepage pressure can be predicted by the existing sample shear stress-displacement curve. Based on the above conjecture, on the basis of Equation 1, the relationship between each parameter in Equation 1 and seepage pressure Pw is considered
where A(Pw), B(Pw), C(Pw), D(Pw), E(Pw), F(Pw) represent the certain correlations between corresponding model parameters and seepage pressure Pw.
Therefore, as long as the relationship between model parameters and seepage pressure Pw are determined, the statistical constitutive model of joint shear damage considering seepage pressure can be established by substituting Equation 3 into Equation 1:
Determination of the Relationship Between Model Parameters and Seepage Pressure
Experimental Results
In this study, experimental data from literature (Qian, 2018; Qian et al., 2018) were selected as examples to establish a statistical damage constitutive model of rock joints considering seepage pressure.
The shear-flow coupling tests were performed on three artificial joint samples with different roughness surfaces. Twenty seven samples with the size of 200 × 100 × 100 mm (length × width × height) were produced with different joint morphologies, divided into 3 groups (denoted as L, M, and H) and 9 samples with identical morphology in each group. The joint roughness coefficient (JRC) corresponding to these 3 groups of samples are : L: JRC = 5.657, M: JRC = 10.793, and H: JRC = 13.897, respectively. Note that, these samples were numbered as the rule of X-RJ N, where X stands for the group name (L, M, or H), and N stands for sample number. The values of seepage pressure (pw) adopted in the tests were 1, 2, and 3 MPa, and the normal stresses of 5, 8, and 10 MPa were applied, respectively. The uniaxial compressive strength (σc) and basic friction angle (φb) of prefabricated joint samples are 77.14 MPa and 32.48°, respectively.
All direct shear tests strictly follow the latest revised ISRM recommendations (Muralha et al., 2014). The obtained shear test results are presented in Figures 1–3, and the relevant test data are recorded as shown in Table 1.
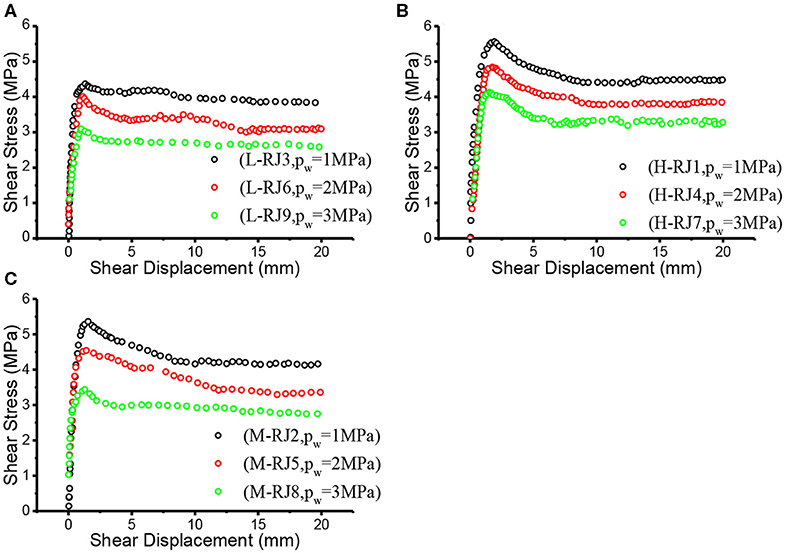
Figure 1. Shear stress-displacement curves of three joint groups under normal stress of 5 MPa and three different seepage pressures. (A) L joint (B) H joint (C) M joint.
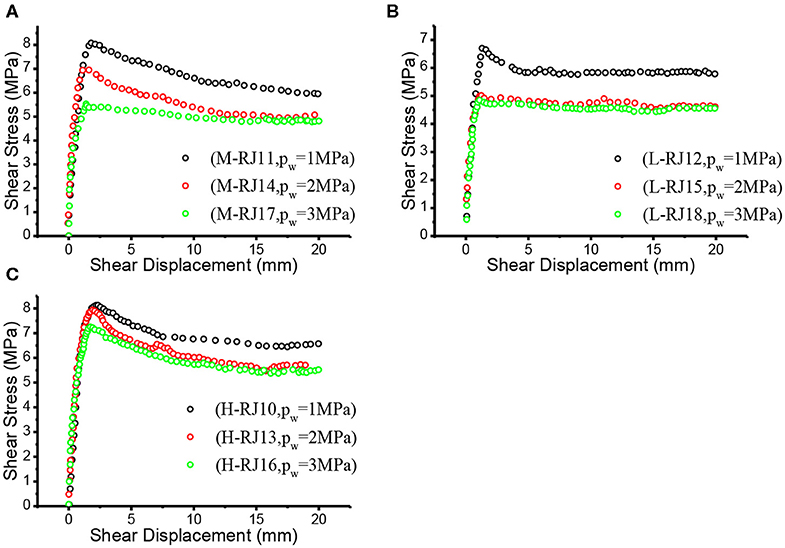
Figure 2. Shear stress-displacement curves of three joint groups under normal stress of 8 MPa and three different seepage pressures. (A) M joint (B) L joint (C) H joint.
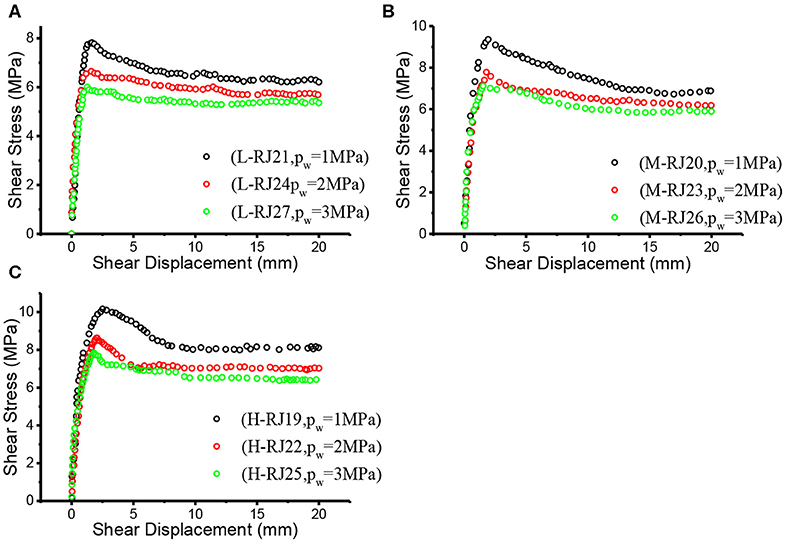
Figure 3. Shear stress-displacement curves of three joint groups under normal stress of 10MPa and three different seepage pressures. (A) L joint (B) M joint (C) H joint.
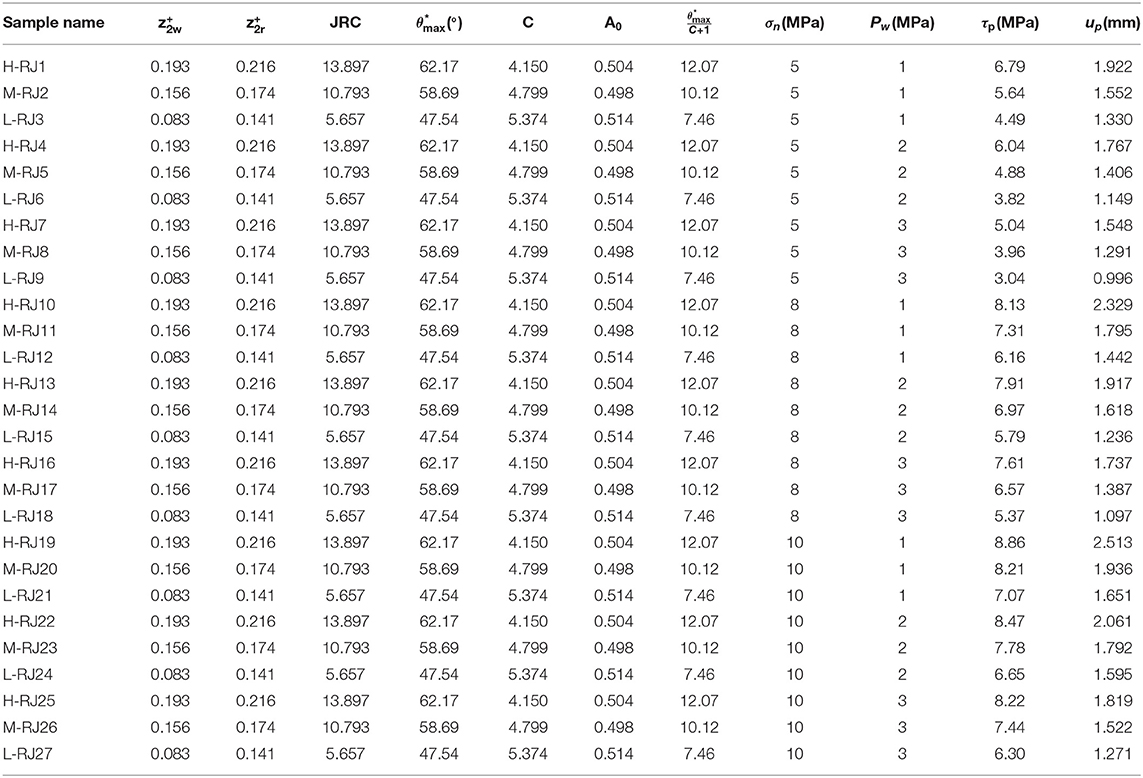
Table 1. Roughness parameters of different types of joint samples and direct shear test results.
According to the test results, the shear stress-displacement curves of joints under seepage pressure basically conform to the typical shear stress-displacement curve (Figure 4): elastic deformation stage (1), yield stage (2), post-peak deformation stage (3), residual deformation stage (4), where τy and uy represent the yield shear stress and yield shear displacement, τp and up stand for the peak shear stress and the peak shear displacement, τr and ur are the residual shear stress and the residual shear displacement, respectively. Practically, not all characteristics of four stage mentioned above are available in experimental curves due to objective attributes or subjective operations. A typical phenomenon is that a few experimental constitutive relationship curves may not have obvious residual deformation stage (lack of residual shear stress τr), that is, the shear stress still keeps a downward trend at the end of the shear process, but this stage still cannot be omitted in the constitutive relationship modeling process.
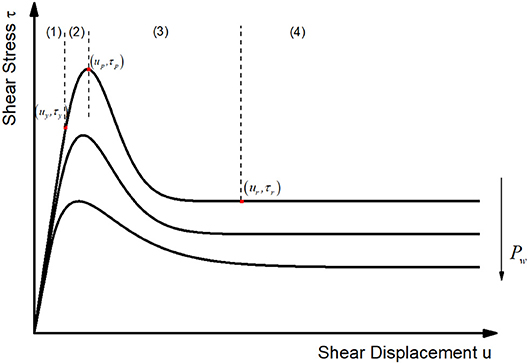
Figure 4. Ideal shear stress-stress displacement curves.
Determination of the Peak Shear Stress τp Under Seepage Pressure
It is strongly evident in Figures 1, 3 that with the increase of seepage pressure, the peak shear stress τp decreases continuously. From the view of influence mechanism, Xia and Sun (2002) pointed out that both the cohesive force c and internal friction angle φ of most rocks (except mudstone, shale and other soft rocks) showed no significant changes due to the existence of water, and therefore the reduction of shear strength was mainly caused by the decrease of the effective normal stress on joint surface, i.e., (σn−Pw), which can be explained by the effective stress principle of geotechnical materials (Xia et al., 2020), namely:
where σn is normal stress, Pw is seepage pressure, φ and c are internal friction angle and cohesive force, respectively.
By means of wavelet transform and 3D laser scanning technology, Qian (2018) established a new peak shear strength criterion considering the influence of joint match coefficient (JMC) and the first order undulations and second order roughness of joints, namely:
where JMC is the joint match coefficients, JCS is the joint wall compressive strength, φb is the basic friction angle of the joint, and are the slope root mean square of first-order waviness and second-order unevenness, respectively.
Actually, in the process of shearing, due to the alternant occurrence of shear shrinkage and shear dilatation on joint surface, the contact interaction emerged between part of the joint surface will trigger the instantaneous variation of the action of seepage pressure. As a consequence, the effective stresses acting on rough joints are dynamic. Referring to the modification of the effective stress principle by Biot (1963) (i.e., Biot coefficient), a seepage pressure reduction coefficient symbolically expressed as β, representing the average effect of seepage pressure on shear strength reduction, was introduced in this section. And therefore, Equation 6 can be recast into:
The relevant test data in Table 1 were substituted into Equation 7, and the seepage pressure reduction coefficient β was calculated as 0.825.
In order to find a good model to predict the peak shear stress, by comparing Equation 7 with JRC-JMC model, (Xia et al., 2014; Yang et al., 2016), the prediction errors of each model are demonstrated in Table 2:
To facilitate the comparison of the error between the experimental peak shear stress and the predicted peak shear stress of different models, the average estimation error was adopted as the precision index, as shown in Equation 9 (Liu et al., 2017):
where τpeak,exp is the experimental peak shear stress,τpeak,est is the estimated peak shear stress, and n is the number of joint samples.
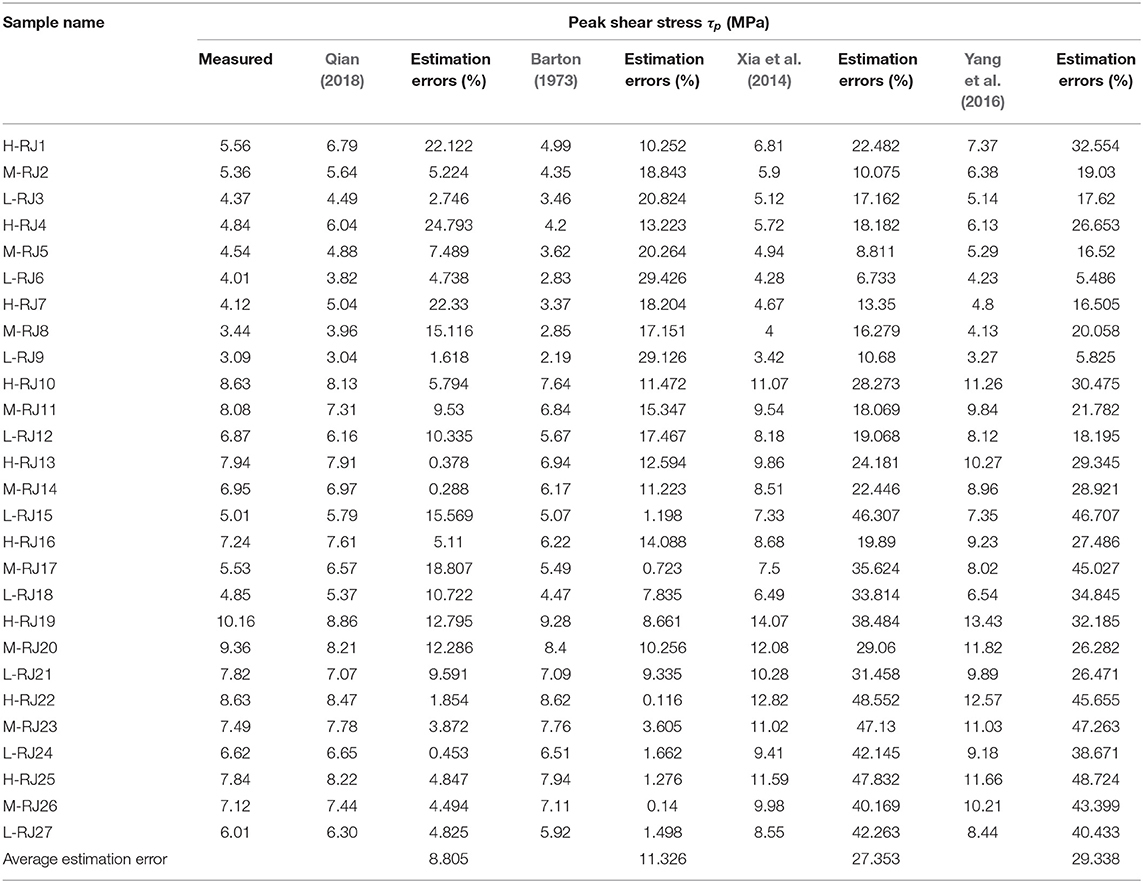
Table 2. Comparison of the experimental peak shear stress and the predicted peak shear stress of different models.
The comparison results in Table 2 show that the deviations with the measures values of the four models are 8.805% (Equation 7), 11.326% (JRC-JMC), 27.353% (Yang et al., 2016), 29.338% (Xia et al., 2014), respectively. Obviously, the prediction error of Equation 7 is significantly smaller than that of other models. Therefore, Equation 7 is selected as the method to establish the peak shear stress τp in this study.
Determination of the Peak Shear Displacement up Under Seepage Pressure
In literature (Qian, 2018), the existing models commonly used to calculate the peak shear displacement up were compared:
where L0 is the laboratory-scale joint sample length (in meters) and Ln is the field-scale length (i.e., the spacing of cross-joints that gives the effective block size) (in meters). In this modeling attempt, Ln was set equal to L0.
The average deviation equation (See Equation 9) is still used to analyze the prediction effects of each model in Equation 10. The comparison results are tabulated in Table 3, it can be seen from Table 3 that Qian's model has the best effect (the average deviation is only 7.49%). Therefore, Qian's model is selected as the method to predict the peak shear displacement up in this study.
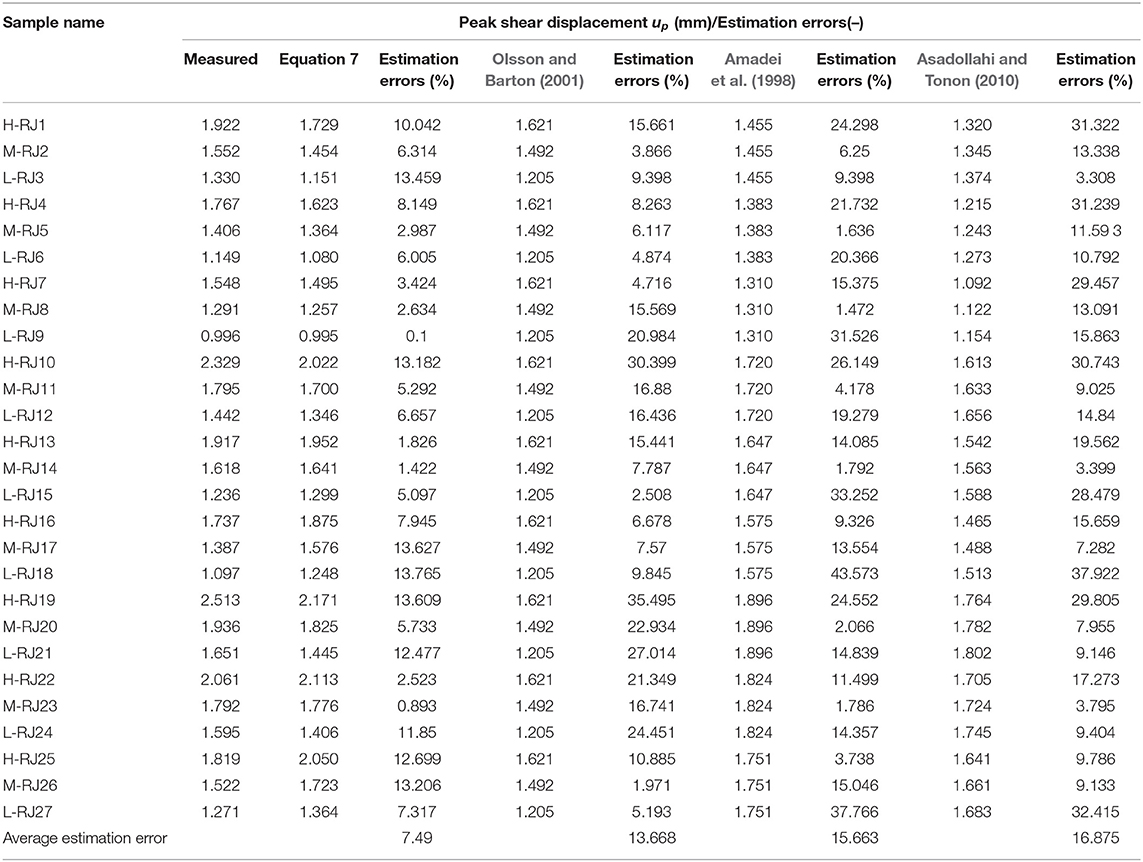
Table 3. Comparison of the experimental peak shear displacement and the predicted peak shear displacement of different models.
Determination of the Yield Shear Displacement uy Under Seepage Pressure
The yield shear displacement uy is the turning point of the shear stress-displacement curve from the elastic deformation stage to the pre-peak softening stage. At present, there is no general theoretical analytic solution for the determination of the position of this point. With reference to the method of Xia et al. (2014) and Qian (2018), the shear displacement of the joint sample at the moment where the initial dilatancy occurred was taken as the yield shear displacement. The ratio of shear displacement at the time of dilatation to peak shear displacement of each sample can be obtained from reference (Qian, 2018). Finally, uy = 0.38up was selected as the yield point in this study.
Determination of the Shear Stiffness ks Under Seepage Pressure
The determination of shear stiffness ks (i.e., the slope of elastic deformation stage) strongly depends on the accurate value of yield shear stress τy. Goodman (1976) conducted a large number of joint direct shear tests, and the results showed that the yield shear stress was approximately equal to 70–90% of the peak shear stress. Amadei et al. (1998) analyzed the direct shear test characteristics of natural joint sample and artificially created joint sample under constant load, and found that 75% of the peak shear stress was suitable for yield shear stress. Hungr and Coates (1978) found that 0.9τp as the yield shear stress is suitable for engineering applications. Although the above literatures have evaluated the yield stress determination of joints based on experimental data, there is no general method that can accurately capture the yield stress of joints in complex stress states.
According to the test data of different types of joints, it is a common method to obtain a summary of the test data with yield stress characteristics from a limited number of strength tests. In section Determination of the Shear Stiffness ks Under Seepage Pressure, the method for determining the yield point has been discussed. The shear stress corresponding to the yield displacement selected in section Determination of the Shear Stiffness ks Under Seepage Pressure and the corresponding peak shear stress were plotted in the Y-X coordinate system to fit the curve. When τy = 0.7213τp, the optimal fitting effect can be observed. The specific process is described in detail in reference (Qian, 2018), which is not shown in this section due to space limitations.
In this case, the shear stiffness ks can be determined by the following equation:
Therefore, the shear stiffness ks determined in this verification is .
Determination of the Residual Shear Stress τr Under Seepage Pressure
As described in Figure 4, the constitutive relationship is ideal, with obvious residual deformation stage, as well as exact residual shear stress (τr), which is the key point when using the Equation 1 to simulate the shear stress-displacement curve. However, in the actual stress-displacement curve (Figures 1–3), there is no constant residual stage in the curve. Therefore, the suggested methods by International Society for Rock Mechanics (ISRM) were adopted for determining the residual shear stress τr. A value of τ corresponding to a variation lower than 5% during 1.0 cm shear displacements is selected. The residual shear stress τr is generally determined by the following equation:
where φr is the residual internal friction angle.
In the permeable environment, Equation 12 can be converted to Equation 13:
In order to simplify the modeling process, the common practice is to use basic friction angle φb instead of residual friction angle φr. However, on the basis of the test results of a large number of laboratory direct shear tests on natural tensile fractured joints (gneiss joints, limestone joints, granite joints) and corresponding tensile joint replicas, Park et al. (2013) found that the basic internal friction angle (φb) slightly differs with the residual internal friction angle (φr). Moreover, an empirical estimation method for the residual internal friction angle (φr) in the percolation environment is recommended in literature (Park et al., 2013; Qian, 2018), as shown in Equation 14:
where φp is the peak dilatancy angle, a and b are dimensionless parameters used to fit test data, respectively.
The peak dilatancy angle φp under higher normal stress can be determined by Equation 15 (Bandis et al., 1983):
Due to the limited space, the relevant experimental regression results are not presented here, and the final residual shear stress data used for verification are indicated in Table 4.
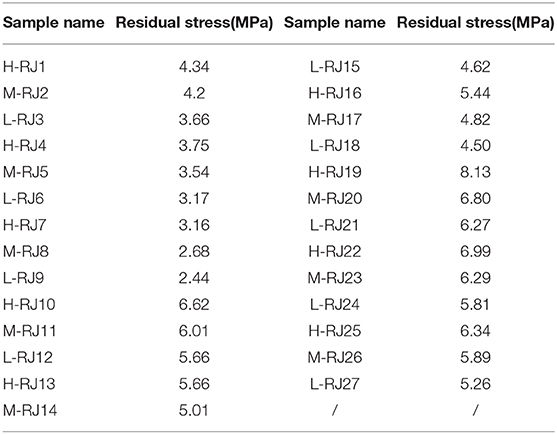
Table 4. Residual shear stress used to verify the feasibility of the proposed model.
Model Verification
In order to evaluate the capability and rationality of the constitutive model proposed in this paper (Equation 4), the experimental example in reference (Qian, 2018) under high seepage pressure was selected as the verification.
The experimental parameters (i.e., the parameters in the proposed model with clear shear physics meanings) ks, τr, up, τp in Equation 4 have been determined in section Determination of the Relationship Between Model Parameters and Seepage Pressure, so the Weibull parameters m and u0 can be achieved from Equation 2. The relevant data in Tables 1–4 were substituted into Equation 2 to obtain the corresponding model parameters m and u0 of each test result.
Specifically, M-RJ2 test data was adopted here as an illustrative example for detailed validation. Before the shear-flow coupling test, the relevant roughness parameters and mechanical properties parameters of the M-RJ2 sample can be determined through 3D morphology scanning and relevant basic mechanical properties testing, as shown in Equation 16. Also note that these parameters in Equation 16 have been shown in the previous sections (see Tables 1–4), and the re-display here is only for the specific test (M-RJ2 sample) to detailedly elaborate on the steps that these parameters in Equation 16 are used to solve the specific model parameters (τp, up, m, u0, etc.).
By substituting the data in Equation 16 into the method for predicting peak shear stress (see Equation 7) and peak shear displacement (see Equation 10, Qian's model) determined above, the predicted values of τp and up can be denoted as
After obtaining τp and up, according to the method described in section Determination of the Yield Shear Displacement uy Under Seepage Pressure to Determination of the Residual Shear Stress τr Under Seepage Pressure, the corresponding values of uy, ks, τr of M-RJ2 sample can be computed by substituting the relevant test data in Equation 16 and Equation 17:
By combining Equations 17 and 18 with Equation 2, it can be calculated that the Weibull distribution parameters u0 and m of M-RJ2 sample are, respectively:
In such cases, all these constitutive model parameters in Equation 4 have been solved, so the predicted specific constitutive model expression of corresponding M-RJ2 sample can be derived as following:
The comparative plots for the experimental data (M-RJ2 sample) and predicted model curve (Equation 20) are plotted in Figure 5 below. As shown, there is a great agreement between the experimental data of M-RJ2 sample and predicted model curve. And the obtained correlation coefficient R2 value of 0.978 reveals that the proposed model sufficiently simulates the shear characteristics of rock joints under seepage pressure. It is worth noting that the peak values of the predicted curve and the experimental results are not completely consistent because the predicted τp and up have certain errors with the experimental results. Of course, this error is relatively acceptable. In sections Determination of the Peak Shear Stress τp Under Seepage Pressure and Determination of the Peak Shear Displacement up Under Seepage Pressure, the prediction error of the method used in this study has been compared with these widely used methods such as the JRC-JMC model and Barton model.
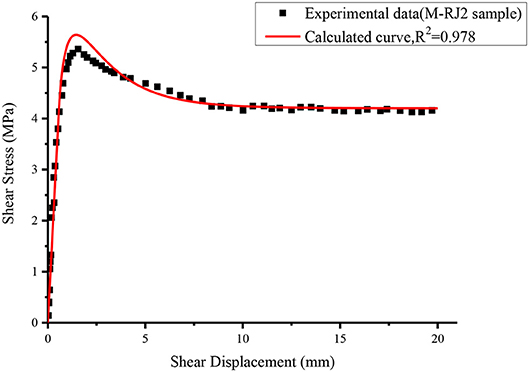
Figure 5. Comparison between the calculated curve of proposed model and experimental result (M-RJ2 sample).
In the same way, the proposed model is also used to simulate the remaining experimental results in Figures 1–3, and the predicted results are presented in Figures 6–8. Good agreement can be observed between the experimental and calculated results in Figures 6–8.
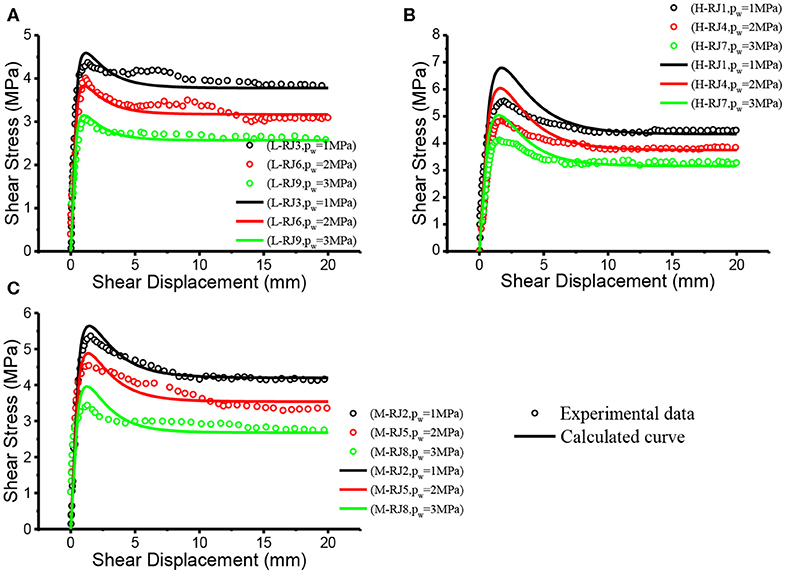
Figure 6. Comparison between the calculated curve of proposed model and experimental result (σn = 5MPa). (A) L joint (B) H joint (C) M joint.
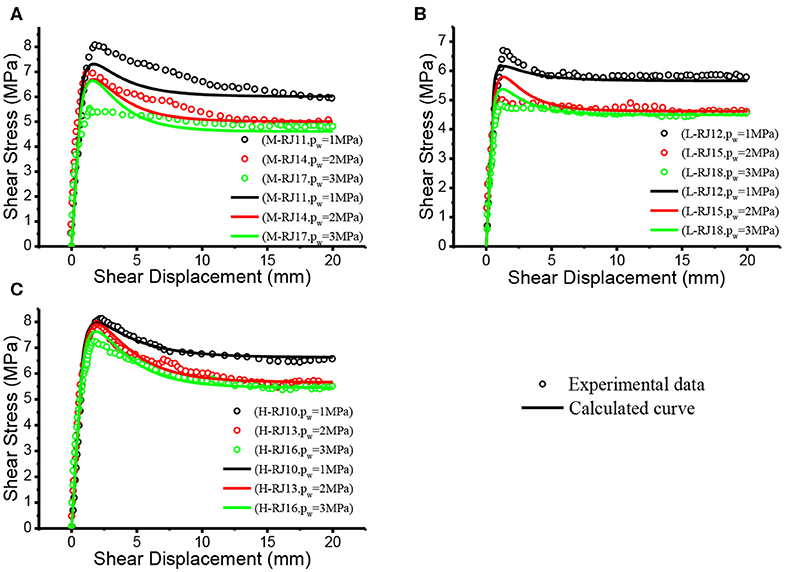
Figure 7. Comparison between the calculated curve of proposed model and experimental result (σn = 8MPa). (A) M joint (B) L joint (C) H joint.
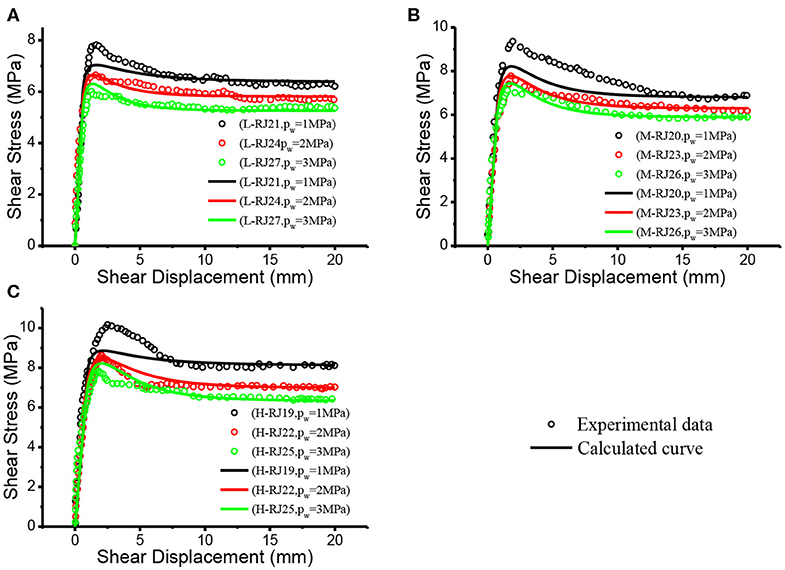
Figure 8. Comparison between the calculated curve of proposed model and experimental result (σn = 10MPa). (A) L joint (B) M joint (C) H joint.
Discussion
Parametric Analysis
Although the Weibull distribution parameters m and u0 can be calculated from Equation 2, their physical significance in engineering practice is difficult to be seen from the expression itself. Equation 20 was selected as the data source to analyze the influence of parameters m and u0 on the constitutive relation curve. The relationship between shear stress-displacement curves under the action of different parameters m and u0 is schematically shown in Figure 9. It can be clearly seen that the two parameters have no effect on the elastic deformation stage.
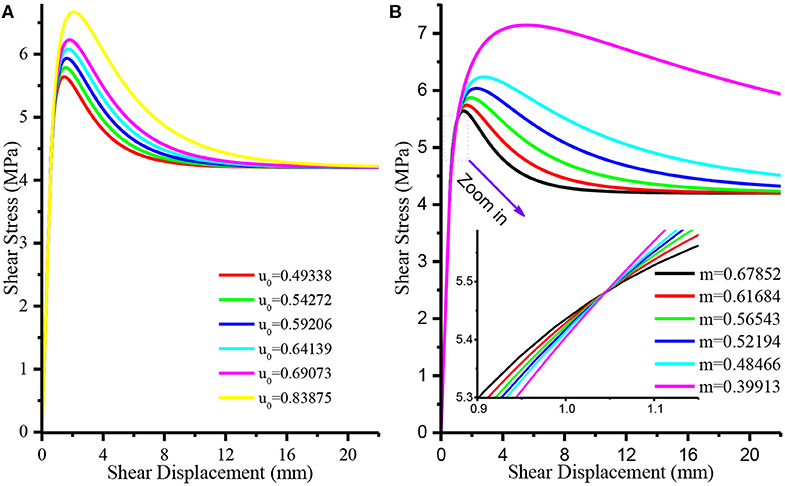
Figure 9. The results for parametric studies of the proposed model for different values of Weibull distribution parameters. (A) Different u0, (B) different m.
Specifically, with the increase of the value of the parameter u0, the peak shear stress increases, while the relationship between the parameter m and the peak shear stress shows a trend opposite to that of u0. When u0 increased to 1.7 times of the original value (i.e., the u0 values varied from 0.49338 to 0.83875), the peak shear stress increased by 18.12%, while m increased to 1.7 times of the original value (i.e., the m values varied from 0.39913 to 0.67852), the peak shear stress decreased by 26.525%, that is, m was more sensitive to the peak shear stress. The shear stress vs. shear displacement curves corresponding to different u0 are approximately parallel after the yield point, and with the increase of m, the post-peak softening characteristic of joints becomes more obvious, that is, the stress drop from peak shear stress τp to residual shear stress τr occurs more rapidly.
The variation trend of model parameters under different normal stress and seepage pressure is extracted, as illustrated in Figures 10, 11. The results show that seepage pressure and normal stress have the opposite effect on model parameters. With the increase of normal stress, both m and u0 decrease, while with the increase of seepage pressure, both m and u0 increase.
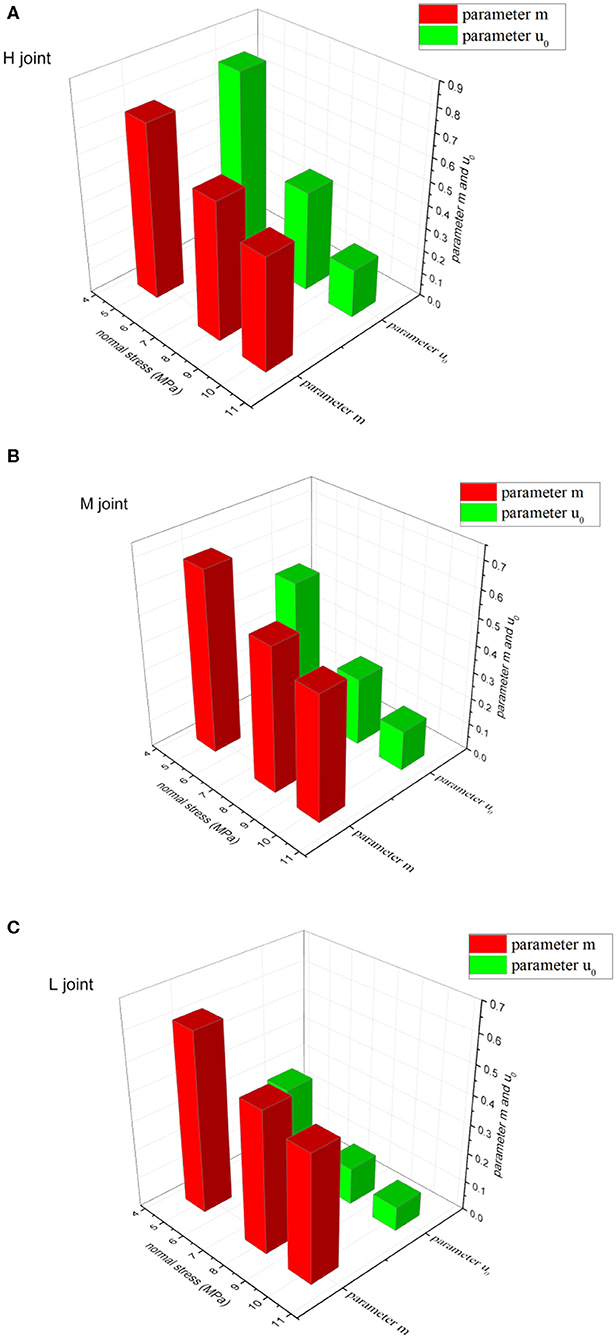
Figure 10. The relationship between normal stress and model parameters m and u0. (A) H joint (B) M joint (C) L joint.
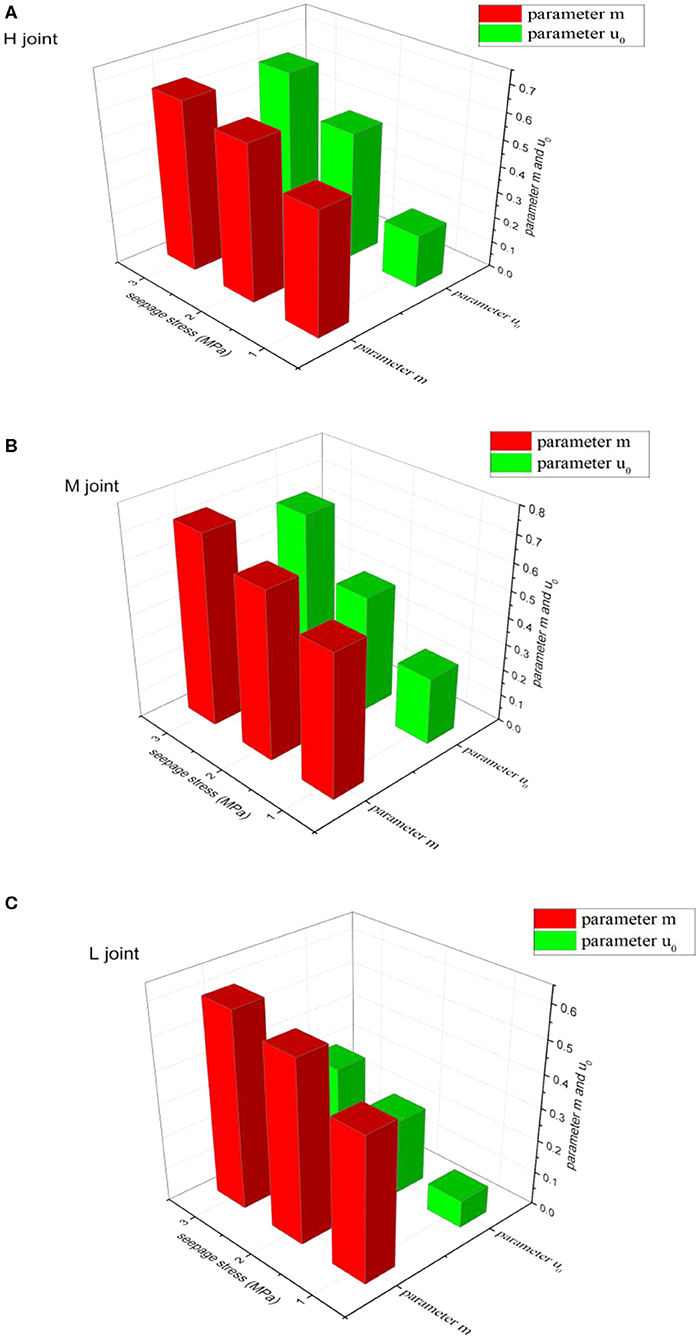
Figure 11. The relationship between seepage pressure and model parameters m and u0. (A) H joint (B) M joint (C) L joint.
Gray Relational Analysis
The qualitative research in section Parametric Analysis has found that the Weibull distribution parameters m and u0 have different influence mechanisms on the peak shear stress τp. In order to further quantitatively explore the influence degree of m and u0 on the peak shear stress, the gray relational analysis is introduced. For the analysis of the relationship between objects with incomplete information of behavior mechanism, scarce behavior data and unclear inherent connotation, the gray relational analysis (Deng, 1982), as a mathematical method, can accurately find out the relevancy between influencing factors (comparative sequences) and system characteristic factors (reference sequence).
In this paper, the correlation between the model parameters m and u0 and the peak shear stress τp is calculated by using the gray correlation analysis method, and the main influencing factors are sought by comparing the correlation degree. The gray relational analysis steps are as follows (Ning et al., 2019):
(1) Build the original data matrix
The peak shear stress τp of 27 groups of test data (Table 2) was selected as the reference sequence, and the two parameters m and u0 were analyzed as the comparative sequences. The original data matrix [X] can be derived as:
In the above matrix, the first column of the original data matrix is the peak shear stress corresponding to each test, the second and third columns are the corresponding parameters m and u0, where xij (i = 1,2, … 27; j = 0,1) represents the corresponding data of the i-th test on the j-th factor.
(2) Construction of the initial value matrix
In order to eliminate the influence of dimension and transform the original data into relative values around 1, this paper adopts the method of initial value processing according to the following equation:
The relevant data are substituted into Equation 22 to obtain the initial value matrix as shown below:
(3) Construction of the absolute difference matrix
The absolute difference matrix[Δ] is formed by the following equation:
where .
The relevant data in this study are substituted into the corresponding absolute difference matrix:
(4) Construction of the gray relational coefficient matrix
In the absolute difference matrix [Δ], the maximum Δmax and minimum difference Δmin can be defined as:
According to Equation 27, the gray relational coefficient matrix [ϑ] is expressed as:
where , and ω is the distinguishing coefficient within the range of [0,1], normally being 0.5.
can be easily obtained from Equation 21, and the gray relational coefficient matrix [ϑ] can be obtained by substituting , ω = 0.5 and related data into Equation 27:
(5) Calculation of the gray relational coefficient
The gray relational coefficient γ reflects the effect degree of the influencing factors (comparative sequences) on the system characteristic factors (reference sequence). The gray relational coefficient γj can be expressed as Equation 29:
It can be calculated that the gray relational coefficient of m (γ1 = 0.3560) is greater than the gray relational coefficient of u0 (γ2 = 0.3471), that is, the relation between m and the peak shear stress is closer than that between u0 and peak shear stress.
Conclusion
The prediction of shear deformation of rock joints in the percolation environment is a vital component in geotechnical engineering. In this study, a new method for estimating the shear constitutive model of rock joints subject to high seepage pressure is presented in detail. This method is originated from the new joints constitutive model proposed by Lin et al. (2019b). The modeling results are validated and compared with the experimental results. And the effects of Weibull distribution parameters m and u0 on the constitutive relationship and their response to normal stress and seepage pressure were also detailedly lucubrated as well. The following key conclusions can be drawn:
(1) The joint shear stress-shear displacement curve in the percolation environment can be divided into four stages: elastic deformation stage, yield stage, post-peak deformation stage, residual deformation stage. Based on the damage statistics theory and the relationship between model parameters and seepage pressure, a statistical damage constitutive model considering seepage pressure was proposed.
(2) The model proposed in this study can accurately predict the whole shear process of rock joints under different seepage pressure. In addition, the physical meaning of the model parameters is clear and sufficient. All the model parameters can be directly determined from the laboratory direct shear tests, indicating the convenience of the model in the modeling process.
(3) The mechanism of influence of normal stress and seepage pressure on Weibull parameters m and u0 is different. As the normal stress increases, both Weibull parameters m and u0 decrease, and as the seepage pressure increases, both Weibull distribution parameters m and u0 increase. The Weibull distribution parameters m and u0 decrease has different influence mechanisms on the peak shear stress. Gray relational analysis reveals that the effect of m on the peak shear stress is greater than the effect of u0.
Data Availability Statement
All datasets generated for this study are included in the article/supplementary material.
Author Contributions
HL, YC, and JL contributed conception and design of the study. SX organized the database and wrote the first draft of the manuscript. YW performed the statistical analysis. RC wrote sections of the manuscript. All authors contributed to manuscript revision, read, and approved the submitted version.
Funding
This paper gets its funding from project (51774322) supported by National Natural Science Foundation of China; Project (2019zzts666, 2019zzts303) supported by the Fundamental Research Funds for the Central Universities of Central South University. Project (2018JJ2500) supported by Hunan Provincial Natural Science Foundation of China. The authors wish to acknowledge these supports.
Conflict of Interest
The authors declare that the research was conducted in the absence of any commercial or financial relationships that could be construed as a potential conflict of interest.
Abbreviations
A0, Normalized area corresponding to the apparent dip angle θmax = 0; C, Roughness parameter characterizing the distribution of apparent dip angles over the joint surface; E, Young's modulus (GPa); JCS, Joint wall compressive strength (MPa); JMC, Joint match coefficients; JRC, Joint roughness coefficient; L0, Laboratory-scale joint sample length (m); Ln, Field-scale joint sample length (m); N, Sample number; Pw, Seepage pressure (MPa); a, Dimensionless parameter; b, Dimensionless parameter; c, Cohesive force; , Average estimation error; ks, Shear stiffness (MPa/mm); m, Weibull distribution parameter; n, Number of test groups; u, Shear displacement (mm); u0, Weibull distribution parameter; up, Peak shear displacement (mm); ur, Residual shear displacement (mm); uy, Yield shear displacement (mm); Slope root mean square of first-order wavines; Slope root mean square of second-order unevenness; β, seepage pressure reduction coefficient; γ, Gray relational coefficient; [Δ], Absolute difference matrix; , Maximum apparent dip angle in the shear direction (°); [ϑ], Gray relational coefficient matrix; v, Poisson's ratio; ρ, Density (g/cm3); σc, Uniaxial compressive strength (MPa); σn, Normal stress (MPa); σt, Tensile strength (MPa); τ, Shear strength (MPa); τp, Peak shear stress (MPa); τpeak,exp, Experimental peak shear stress (MPa); τpeak,est, Estimated peak shear stress (MPa); τr, Residual shear stress (MPa); τy, Yield shear stress (MPa); φ, Internal friction angle (°); φb, Basic friction angle(°); φp, Peak dilatancy angle(°); φr, Residual friction angle(°); [X], Original data matrix; ω, Distinguishing coefficient.
References
Amadei, B., Wibowo, J., Sture, S., and Price, R. H. (1998). Applicability of existing models to predict the behavior of replicas of natural fractures of welded tuff under different boundary conditions. Geotech. Geol. Eng. 16, 79–128. doi: 10.1023/A:1008886106337
Asadollahi, P., and Tonon, F. (2010). Constitutive model for rock fractures: revisiting Barton's empirical model. Eng. Geol. 113, 11–32. doi: 10.1016/j.enggeo.2010.01.007
Bandis, S. C., Lumsden, A. C., and Barton, N. R. (1983). Fundamentals of rock joint deformation. Int. J. Rock Mech. Min. Sci. Geomech. Abst. 20, 249–268. doi: 10.1016/0148-9062(83)90595-8
Barton, N. (1973). Review of a new shear-strength criterion for rock joints. Eng. Geol. 7, 287–332. doi: 10.1016/0013-7952(73)90013-6
Biot, M. A. (1963). Theory of stability and consolidation of a porous medium under initial stress. J. Mathem. Mech. 12, 521–541.
Deng, J.-L. (1982). Control problems of grey systems. Sys. Contr. Lett. 1, 288–294. doi: 10.1016/S0167-6911(82)80025-X
Goodman, R. E. (1976). Methods of Geological Engineering in Discontinuous Rocks. St Paul, MN: West Publishing Co.
Han, D., Li, K., and Meng, J. (2020). Evolution of nonlinear elasticity and crack damage of rock joint under cyclic tension. Int. J. Rock Mech. Min. Sci. 128:104286. doi: 10.1016/j.ijrmms.2020.104286
Hungr, O., and Coates, D. F. (1978). Deformability of joints and its relation to rock foundation settlements. Can. Geotech. J. 15, 239–249. doi: 10.1139/t78-022
Lee, H. S., and Cho, T. F. (2002). Hydraulic characteristics of rough fractures in linear flow under normal and shear load. Rock Mech. Rock Eng. 35, 299–318. doi: 10.1007/s00603-002-0028-y
Lei, D., Lin, H., Chen, Y., Cao, R., and Wen, Z. (2019). Effect of cyclic freezing-thawing on the shear mechanical characteristics of nonpersistent joints. Adv. Mater. Sci. Eng. 2019:14. doi: 10.1155/2019/9867681
Li, K., Cheng, Y., Yin, Z. Y., Han, D. Y., and Meng, J. J. (2020). Size effects in a transversely isotropic rock under brazilian tests: laboratory testing. Rock Mech. Rock Eng. 63, 2623–2642. doi: 10.1007/s00603-020-02058-7
Lin, H., Ding, X., Yong, R., Xu, W., and Du, S. (2019a). Effect of non-persistent joints distribution on shear behavior. Comptes Rendus Mécanique 347, 477–489. doi: 10.1016/j.crme.2019.05.001
Lin, H., Wang, H., Chen, Y., Cao, R., Wang, Y., Yong, R., et al. (2020a). Shear resistance of rock joint under nonuniform normal stress. Adv. Mater. Sci. Eng. 2020:9316482. doi: 10.1155/2020/9316482
Lin, H., Xie, S. J., Yong, R., Chen, Y. F., and Du, S. G. (2019b). An empirical statistical constitutive relationship for rock joint shearing considering scale effect. C R Mech. 347, 561–575. doi: 10.1016/j.crme.2019.08.001
Lin, H., Zhang, X., Cao, R., and Wen, Z. (2020b). Improved nonlinear Burgers shear creep model based on the time-dependent shear strength for rock. Environ. Earth Sci. 79:149. doi: 10.1007/s12665-020-8896-6
Liu, C.-H., and Chen, C.-X. (2011). A new apparatus for investigating stress, deformation and seepage coupling properties of rock fractures. J. Central South Univ. 18, 1662–1666. doi: 10.1007/s11771-011-0886-0
Liu, Q., Tian, Y., Liu, D., and Jiang, Y. (2017). Updates to JRC-JCS model for estimating the peak shear strength of rock joints based on quantified surface description. Eng. Geol. 228, 282–300. doi: 10.1016/j.enggeo.2017.08.020
Meng, J., Huang, J., Sloan, S., and Sheng, D. (2017). Discrete modelling jointed rock slopes using mathematical programming methods. Comput. Geotech. 96, 189–202. doi: 10.1016/j.compgeo.2017.11.002
Muralha, J., Grasselli, G., Tatone, B., Blümel, M., Chryssanthakis, P., and Yujing, J. (2014). ISRM suggested method for laboratory determination of the shear strength of rock joints: revised version. Rock Mech. Rock Eng. 47, 291–302. doi: 10.1007/s00603-013-0519-z
Ning, Y., Tang, H., Wang, F., and Zhang, G. (2019). Sensitivity analysis of toppling deformation for interbedded anti-inclined rock slopes based on the Grey relation method. Bull. Eng. Geol. Environ. 78, 6017–6032. doi: 10.1007/s10064-019-01505-2
Olsson, R., and Barton, N. (2001). An improved model for hydromechanical coupling during shearing of rock joints. Int. J. Rock Mech. Min. Sci. 38, 317–329. doi: 10.1016/S1365-1609(00)00079-4
Park, J. W., Lee, Y. K., Song, J. J., and Choi, B. H. (2013). A constitutive model for shear behavior of rock joints based on three-dimensional quantification of joint roughness. Rock Mech. Rock Eng. 46, 1513–1537. doi: 10.1007/s00603-012-0365-4
Qian, X. (2018). Study of shear-flow coupled behaviors of rock joints under high seepage pressure [Ph.D. thesis]. Tongji University, Shanghai, China.
Qian, X., Xia, C. C., and Gui, Y. (2018). Quantitative estimates of non-darcy groundwater flow properties and normalized hydraulic aperture through discrete open rough-walled joints. Int. J. Geomech. 18:10. doi: 10.1061/(ASCE)GM.1943-5622.0001228
Raven, K. G., and Gale, J. E. (1985). Water flow in a natural rock fracture as a function of stress and sample size. Int. J. Rock Mech. Min. Sci. Geomech. Abst. 22, 251–261. doi: 10.1016/0148-9062(85)92952-3
Rong, G., Hou, D., Yang, J., Cheng, L., and Zhou, C. (2017). Experimental study of flow characteristics in non-mated rock fractures considering 3D definition of fracture surfaces. Eng. Geol. 220, 152–163. doi: 10.1016/j.enggeo.2017.02.005
Snow, DT. (1969) Anisotropic permeability of fractured media. Water Resour. Res. 5, 1273–1289. doi: 10.1029/WR005i006p01273
Walsh, J. B. (1981). Effect of pore pressure and confining pressure on fracture permeability. Int. J. Rock Mech. Min. Sci. Geomech. Abst. 18, 429–435. doi: 10.1016/0148-9062(81)90006-1
Wang, Y., Zhang, H., Lin, H., Zhao, Y., and Liu, Y. (2020). Fracture behaviour of central-flawed rock plate under uniaxial compression. Theoret. Appl. Fract. Mech. 106:102503. doi: 10.1016/j.tafmec.2020.102503
Xia, C., and Sun, Z. (2002). Engineering Rock Mass Joint Mechanics. Shanghai: Tongji University Press.
Xia, C.-C., Tang, Z.-C., Xiao, W.-M., and Song, Y.-L. (2014). New peak shear strength criterion of rock joints based on quantified surface description. Rock Mech. Rock Eng. 47, 387–400. doi: 10.1007/s00603-013-0395-6
Xia, C. C., Qian, X., Lin, P., Xiao, W. M., and Gui, Y. (2017). Experimental investigation of nonlinear flow characteristics of real rock joints under different contact conditions. J. Hydraul. Eng ASCE. 143:14. doi: 10.1061/(ASCE)HY.1943-7900.0001238
Xia, C. C., Yu, Q.-F., Qian, X., Gui, Y., and Xiao-qing, Z. (2020). Experimental study of shear-seepage behaviour of rock joints under constant normal stiffness. Rock Soil Mech. 41, 57–66.
Xie, S., Lin, H., Chen, Y., Yong, R., Xiong, W., and Du, S. (2020a). A damage constitutive model for shear behavior of joints based on determination of the yield point. Int. J. Rock Mech. Min. Sci. 128:104269. doi: 10.1016/j.ijrmms.2020.104269
Xie, S., Lin, H., Wang, Y., Chen, Y., Xiong, W., Zhao, Y., et al. (2020b). A statistical damage constitutive model considering whole joint shear deformation. Int. J. Damage Mech. 29, 988–1008. doi: 10.1177/1056789519900778
Yang, J., Rong, G., Hou, D., Peng, J., and Zhou, C. B. (2016). Experimental study on peak shear strength criterion for rock joints. Rock Mech. Rock Eng. 49, 821–835. doi: 10.1007/s00603-015-0791-1
Yang, T., Wang, P., Liu, H., Xu, T., Yu, Q., and Shi, W. (2015). Deformational behavior of underground opening using a stress-seepage coupled model considering anisotropic characteristics. Arab. J. Geosci. 8, 6635–6642. doi: 10.1007/s12517-014-1723-1
Yasuhara, H., Polak, A., Mitani, Y., Grader, A. S., Halleck, P. M., and Elsworth, D. (2006). Evolution of fracture permeability through fluid–rock reaction under hydrothermal conditions. Earth Planet. Sci. Lett. 244, 186–200. doi: 10.1016/j.epsl.2006.01.046
Yong, R., Ye, J., Li, B., and Du, S. G. (2018). Determining the maximum sampling interval in rock joint roughness measurements using Fourier series. Int. J. Rock Mech. Min. Sci. 101, 78–88. doi: 10.1016/j.ijrmms.2017.11.008
Yuan, W., Li, J., Li, Z., Wang, W., and Sun, X. (2020). A strength reduction method based on the Generalized Hoek-Brown (GHB) criterion for rock slope stability analysis. Comput. Geotech. 117:103240. doi: 10.1016/j.compgeo.2019.103240
Zhang, C., Zou, P., Wang, Y., Jiang, T., Lin, H., and Cao, P. (2020b). An elasto-visco-plastic model based on stress functions for deformation and damage of water-saturated rocks during the freeze-thaw process. Construct. Build. Mater. 250:118862. doi: 10.1016/j.conbuildmat.2020.118862
Zhang, C. Y., Lin, H., Qiu, C. M., Jiang, T. T., and Zhang, J. H. (2020a). The effect of cross-section shape on deformation, damage and failure of rock-like materials under uniaxial compression from both a macro and micro viewpoint. Int. J. Damage Mech. 20, 1–20. doi: 10.1177/1056789520904119
Zhao, Y., Tang, J., Chen, Y., Zhang, L., Wang, W., Wan, W., et al. (2017b). Hydromechanical coupling tests for mechanical and permeability characteristics of fractured limestone in complete stress-strain process. Environ. Earth Sci. 76:24. doi: 10.1007/s12665-016-6322-x
Zhao, Y., Wang, C., and Wan, W. (2016). Seepage flow during crack propagation process and stress coupled model under compression-shear stress conditions. Rock Soil Mech. 37, 2180–2186. doi: 10.16285/j.rsm.2016.08.008
Zhao, Y., Wang, Y., Wang, W., Tang, L., Liu, Q., and Cheng, G. (2019). Modeling of rheological fracture behavior of rock cracks subjected to hydraulic pressure and far field stresses. Theoret. Appl. Fract. Mech. 101, 59–66. doi: 10.1016/j.tafmec.2019.01.026
Zhao, Y., Zhang, L., Wang, W., Tang, J., Lin, H., and Wan, W. (2017a). Transient pulse test and morphological analysis of single rock fractures. Int. J. Rock Mech. Min. Sci. 91, 139–154. doi: 10.1016/j.ijrmms.2016.11.016
Keywords: rock joints, constitutive model, seepage pressure, shear behavior, gray correlation
Citation: Xie S, Lin H, Chen Y, Wang Y, Cao R and Li J (2020) Statistical Damage Shear Constitutive Model of Rock Joints Under Seepage Pressure. Front. Earth Sci. 8:232. doi: 10.3389/feart.2020.00232
Received: 13 December 2019; Accepted: 29 May 2020;
Published: 03 July 2020.
Edited by:
Sébastien Merkel, Lille University of Science and Technology, FranceReviewed by:
Fanny Descamps, University of Mons, BelgiumAuke Barnhoorn, Delft University of Technology, Netherlands
Copyright © 2020 Xie, Lin, Chen, Wang, Cao and Li. This is an open-access article distributed under the terms of the Creative Commons Attribution License (CC BY). The use, distribution or reproduction in other forums is permitted, provided the original author(s) and the copyright owner(s) are credited and that the original publication in this journal is cited, in accordance with accepted academic practice. No use, distribution or reproduction is permitted which does not comply with these terms.
*Correspondence: Hang Lin, linhangabc@126.com; Yifan Chen, 1051361824@qq.com; Rihong Cao, 18229997417@163.com