Multi-Objective Model Predictive Control for Real-Time Operation of a Multi-Reservoir System
by
 , , , and
Nay Myo Lin
1,2 ,
,
Xin Tian
1,3,*,
Martine Rutten
1,
Edo Abraham
1,
José M. Maestre
4 and
and
Nick van de Giesen
1 1
Department of Water Management, Delft University of Technology, Stevinweg 1, 2628 CN Delft, The Netherlands
2
Department of Irrigation and Water Utilization Management, Thitsar Road, Yankin Township, Yangon 11081, Myanmar
3
KWR Water Research Institute, Groningenhaven 7, 3433 PE Nieuwegein, The Netherlands
4
Department of Engineering of Systems and Automatics, University of Seville, 41092 Seville, Spain
*
Author to whom correspondence should be addressed.
Water 2020, 12(7), 1898; https://doi.org/10.3390/w12071898
Submission received: 17 April 2020
/
Revised: 13 June 2020
/
Accepted: 29 June 2020
/
Published: 3 July 2020
(This article belongs to the Section Hydraulics and Hydrodynamics)
Abstract
:This paper presents an extended Model Predictive Control scheme called Multi-objective Model Predictive Control (MOMPC) for real-time operation of a multi-reservoir system. The MOMPC approach incorporates the non-dominated sorting genetic algorithm II (NSGA-II), multi-criteria decision making (MCDM) and the receding horizon principle to solve a multi-objective reservoir operation problem in real time. In this study, a water system is simulated using the De Saint Venant equations and the structure flow equations. For solving multi-objective optimization, NSGA-II is used to find the Pareto-optimal solutions for the conflicting objectives and a control decision is made based on multiple criteria. Application is made to an existing reservoir system in the Sittaung river basin in Myanmar, where the optimal operation is required to compromise the three operational objectives. The control objectives are to minimize the storage deviations in the reservoirs, to minimize flood risks at a downstream vulnerable place and to maximize hydropower generation. After finding a set of candidate solutions, a couple of decision rules are used to access the overall performance of the system. In addition, the effect of the different decision-making methods is discussed. The results show that the MOMPC approach is applicable to support the decision-makers in real-time operation of a multi-reservoir system.
1. Introduction
Reservoirs are important water retaining structures for management and sustainable development of the world’s water resources. At present, though the social and environmental impacts of dams is being debated, more than 50,000 large dams have been constructed worldwide for irrigation, hydropower generation, flood control, navigation and recreation [1]. According to the report of the world commission on dams, [2], the improvement in operation and maintenance of existing dams offer opportunities to address local (or) regional developments and to minimize the social and environmental impacts. Over the past decades, many researchers have emphasized the optimal operation of a multi-reservoir system for long-term planning [3,4], developing operating rules [5,6] and real-time operations [7,8]. Nowadays, many existing reservoirs are threatened by a changing climate and by growing demands for freshwater and electricity and thus real-time operation plays an important role in reservoir management to improve the performances of existing reservoirs using real-time information such as water demand, rainfall, water level and flow measurement.
In general, optimization, simulation and combined optimization–simulation approaches have been commonly applied to reservoir operation studies. Regarding the optimization techniques, linear programming (LP) and dynamic programming (DP) are mostly used to find the optimal releases of reservoirs [9,10,11,12]. Among them, LP is suitable for a linear optimization problem that consists of a linear objective function subject to linear constraints. DP is more popular than LP because its ability to deal with nonlinearity and stochastic features [13]. However, for a large-scale reservoir system, DP suffers from dimensionality problem that is exponential growth of the states and control variables when the number of reservoirs in the system is increased [14,15]. Although NLP can deal with non–separable objective functions and nonlinear constraints, it is much more complicated and takes time to solve the optimization process compared with the other methods [13]. In the past, many studies have focused on improving the optimization techniques for the optimal operation of a reservoir system [10,12,16,17]. On the other hand, simulation models have also been used to analyze the performance of a reservoir system under alternative operating policies [18,19,20]. Hydrologic or hydraulic routing method is commonly used to model a water system involving reservoirs, hydraulic structures and channels. The most effective approach for solving reservoir operation problems is a combination of optimization and simulation model [21,22,23] in which the control decisions are made by optimizing the control objectives and a simulation model is used to estimate the response of the system for certain control decisions. At present, various combinations of optimization–simulation models are available for real-time operations of a reservoir system and the choice of a method depends on the characteristic of a certain reservoir system, for example, number of reservoirs, types of objective functions and constraints.
In recent years, an advanced real-time control method, the so-called Model Predictive Control (MPC) has been widely applied in water resources management to solve various problems [24,25,26,27]. In fact, MPC is also promising for real-time operations of a reservoir system because it is based on an optimization–simulation approach and is not limited for the various practical application in terms of process model, objective function and constraints [22,28]. MPC differs from the available methods such as a combined DP-LP approach [9], linear quadratic gaussian control [15] and simulation and optimization modelling approach [23] because it anticipates the future system states by optimizing the control objectives along a prediction horizon subject to the system constraints, however, only the first control action is implemented to the system at every control step. Subsequently, the system is updated with the new measurements and the optimization is repeated at each time step [29]. MPC is a model-based control technique that involves an internal model to predict the system states, optimization of the control objectives along a prediction horizon subject to the system constraints and the use of receding horizon principle [30]. Recently, increasing attention has been given to the use of MPC in real-time reservoir operations for various purposes; for example, flood control [31,32], optimal reservoir operation [8,33] and a combination of short and long-term reservoir management [34].
Delgoda et al. [31] proposed the adaptive multi MPC for flood control of a single reservoir, in which inflow uncertainty was addressed using independent MPC controllers and Kalman filters. Using the transport delay in the process model, it has the challenges to capture the dynamics of a large-scale water system. Another way of dealing with forecast uncertainty in the MPC formulation is to use ensemble forecast data to generate the disturbance scenarios or trees that allow to find the adaptive control actions through forecast uncertainty [35,36,37]. Regarding multi-purpose consideration, Galelli et al. [33] presented a deterministic MPC scheme for the optimal operation of the Marina reservoir in Singapore that addressed the trade-offs between flood control, pump usage, and drinking water supply. In addition, Raso et al. [34] proposed an infinite horizon MPC using input structuring to reduce the computational complexity in the optimization process which enables to use MPC in long-term optimal reservoir operation. Other developments, MPC combined with the ensemble forecasts for a single reservoir management, can be found in [35,38]. For a basin scale, Ficchì et al. [32] applied MPC and tree-based MPC (TB-MPC) for flood operation of a four-reservoir system in the Seine River basin (France) and compared the performance of MPC based on a perfect forecast, a deterministic forecast and the ensemble forecast. Although TB-MPC is able to improve the performance of the system, its computational time is 7 times larger than the deterministic MPC and could be increased by adding new reservoirs. In order to reduce the computational time, Tian et al. [7] proposed a large time step scheme to control a large-scale water system, in which a simplified internal model with the large time step setting was used. This simplified model is based on the De Saint Venent equations and has an ability to solve the control process in a reasonable time. Myo lin et al. [8] also applied a simplified internal model to develop an efficient MPC scheme for the optimal operations of the eleven reservoirs in the Sittaung river basin, Myanmar. Over the past decades, most of the studies have focused on flood operation and how to deal with inflow uncertainty in the MPC formulation. On the other hand, multi-reservoir operations may involve multiple conflicting objectives and thus it is required to address the trade-offs between them concerning the decision-maker’s preferences.
The above MPC formulations employ either a weighted-sum or a constraint method to solve the multi-objective control problems, using quadratic programming or nonlinear programming. These classical methods transform a multi-objective optimization problem into a single-objective optimization problem and aim to find one particular trade-off solution at a time. However, multiple trade-off solutions, also known as the Pareto-optimal solutions that are better than all other solutions in at least one objective, exist in solving a multi-objective optimization problem [39]. Thus, for the classical methods, the repetitive optimization is required to find all possible optimal solutions that is subjective to the decision-making in real time. In recent years, multi-objective evolutionary algorithms (MOEAs) are gaining significant attention for multi-objective optimization due to their ability to solve nonconvex, nonlinear and discontinuous problems [40] and to discover the Pareto-optimal solutions between the conflicting objectives as well. The genetic algorithm (GA) is one of the powerful MOEAs that have been widely applied to water resources planning and management problems [41], such as reservoir operations [42], optimal design of water distribution systems [43], optimization of ground water monitoring systems [44], planning of a water supply system under deep uncertainty [45] and inter-basin water transfers [46]. In the context of MPC, Núñez et al. [47] presented an MPC scheme to solve a dynamic pickup and delivery problem, in which GA was used to find the trade-off solutions between the two conflicting objectives, namely the user cost and the operator cost. Another MPC formulation used GA to operate the hydraulic structures in real-time flood control of a river system [48]. Afterwards, Vermuyten et al. [49] addressed the computational burden of GA by using the reduced genetic algorithm (RGA) in an MPC formulation in which RGA was used to optimize the gate levels of hydraulic structures for real-time flood Control. This study showed that the convergence rate of RGA was higher than the standard GA. However, a drawback is that the control solutions may be changed by generating random gate level scenarios with same parameter settings in different optimization runs. In addition, Tian et al. [50] presented the combination of multi-scenario MPC with GA for operational water management and discussed how to select a solution for implementation using the three performance matrices. A main concern of this method is how to efficiently choose a single optimal solution from a Pareto-optimal set. Furthermore, reservoir operations need to address the conflicting behavior of management objectives, consequences of the different decision criteria and the decision-maker involvement in the decision-making process. Thus, a more efficient MPC scheme is required for real-time operation of a water system that allows the decision-makers to visually evaluate and adjust the future output of a process model online in accordance with the different decision criteria. For this reason, this paper proposes a method, called multi-objective Model Predictive Control (MOMPC), to operate multiple reservoirs in real time through an extended MPC scheme that incorporates multi-objective optimization, multi-criteria decision-making and a receding horizon principle.
In the proposed MOMPC formulation, the De Saint Venant equations are used to capture the dynamics of a reservoir system and the non-dominated sorting algorithm-II (NSGA-II) developed by Deb et al. [51] is adopted to find the Pareto-optimal solutions for the conflicting objectives. As the receding horizon principle is applied, an optimal control sequence is determined along a prediction horizon at every control time step, however, only the first control action is implemented to the system to move the next step [52]. Therefore, the implementation of NSGA-II in MPC formulation requires a decision criterion to choose a preferred solution at every control step. For this task, m ulti-criteria decision-making (MCDM) techniques are used to choose a preferred solution from a set of Pareto-optimal solutions. Currently, a number of methods are available in the decision-making field and an extensive review of its strengths and drawbacks can be found in [53]. This study employs the three different decision methods to choose a solution from a Pareto-optimal set and discusses the effect of each decision method on the management objectives. The main advantage of this approach is that it is flexible to make a preferred decision through the visualization of multiple trade-off solutions in real-time. In addition, it is less subjective to solve a multi-objective control problem compared to the classical MPC formulation. To show its ability, the proposed method was applied to real-time operation of a multi-reservoir system in the Sittaung river basin, Myanmar.
2. Methodology
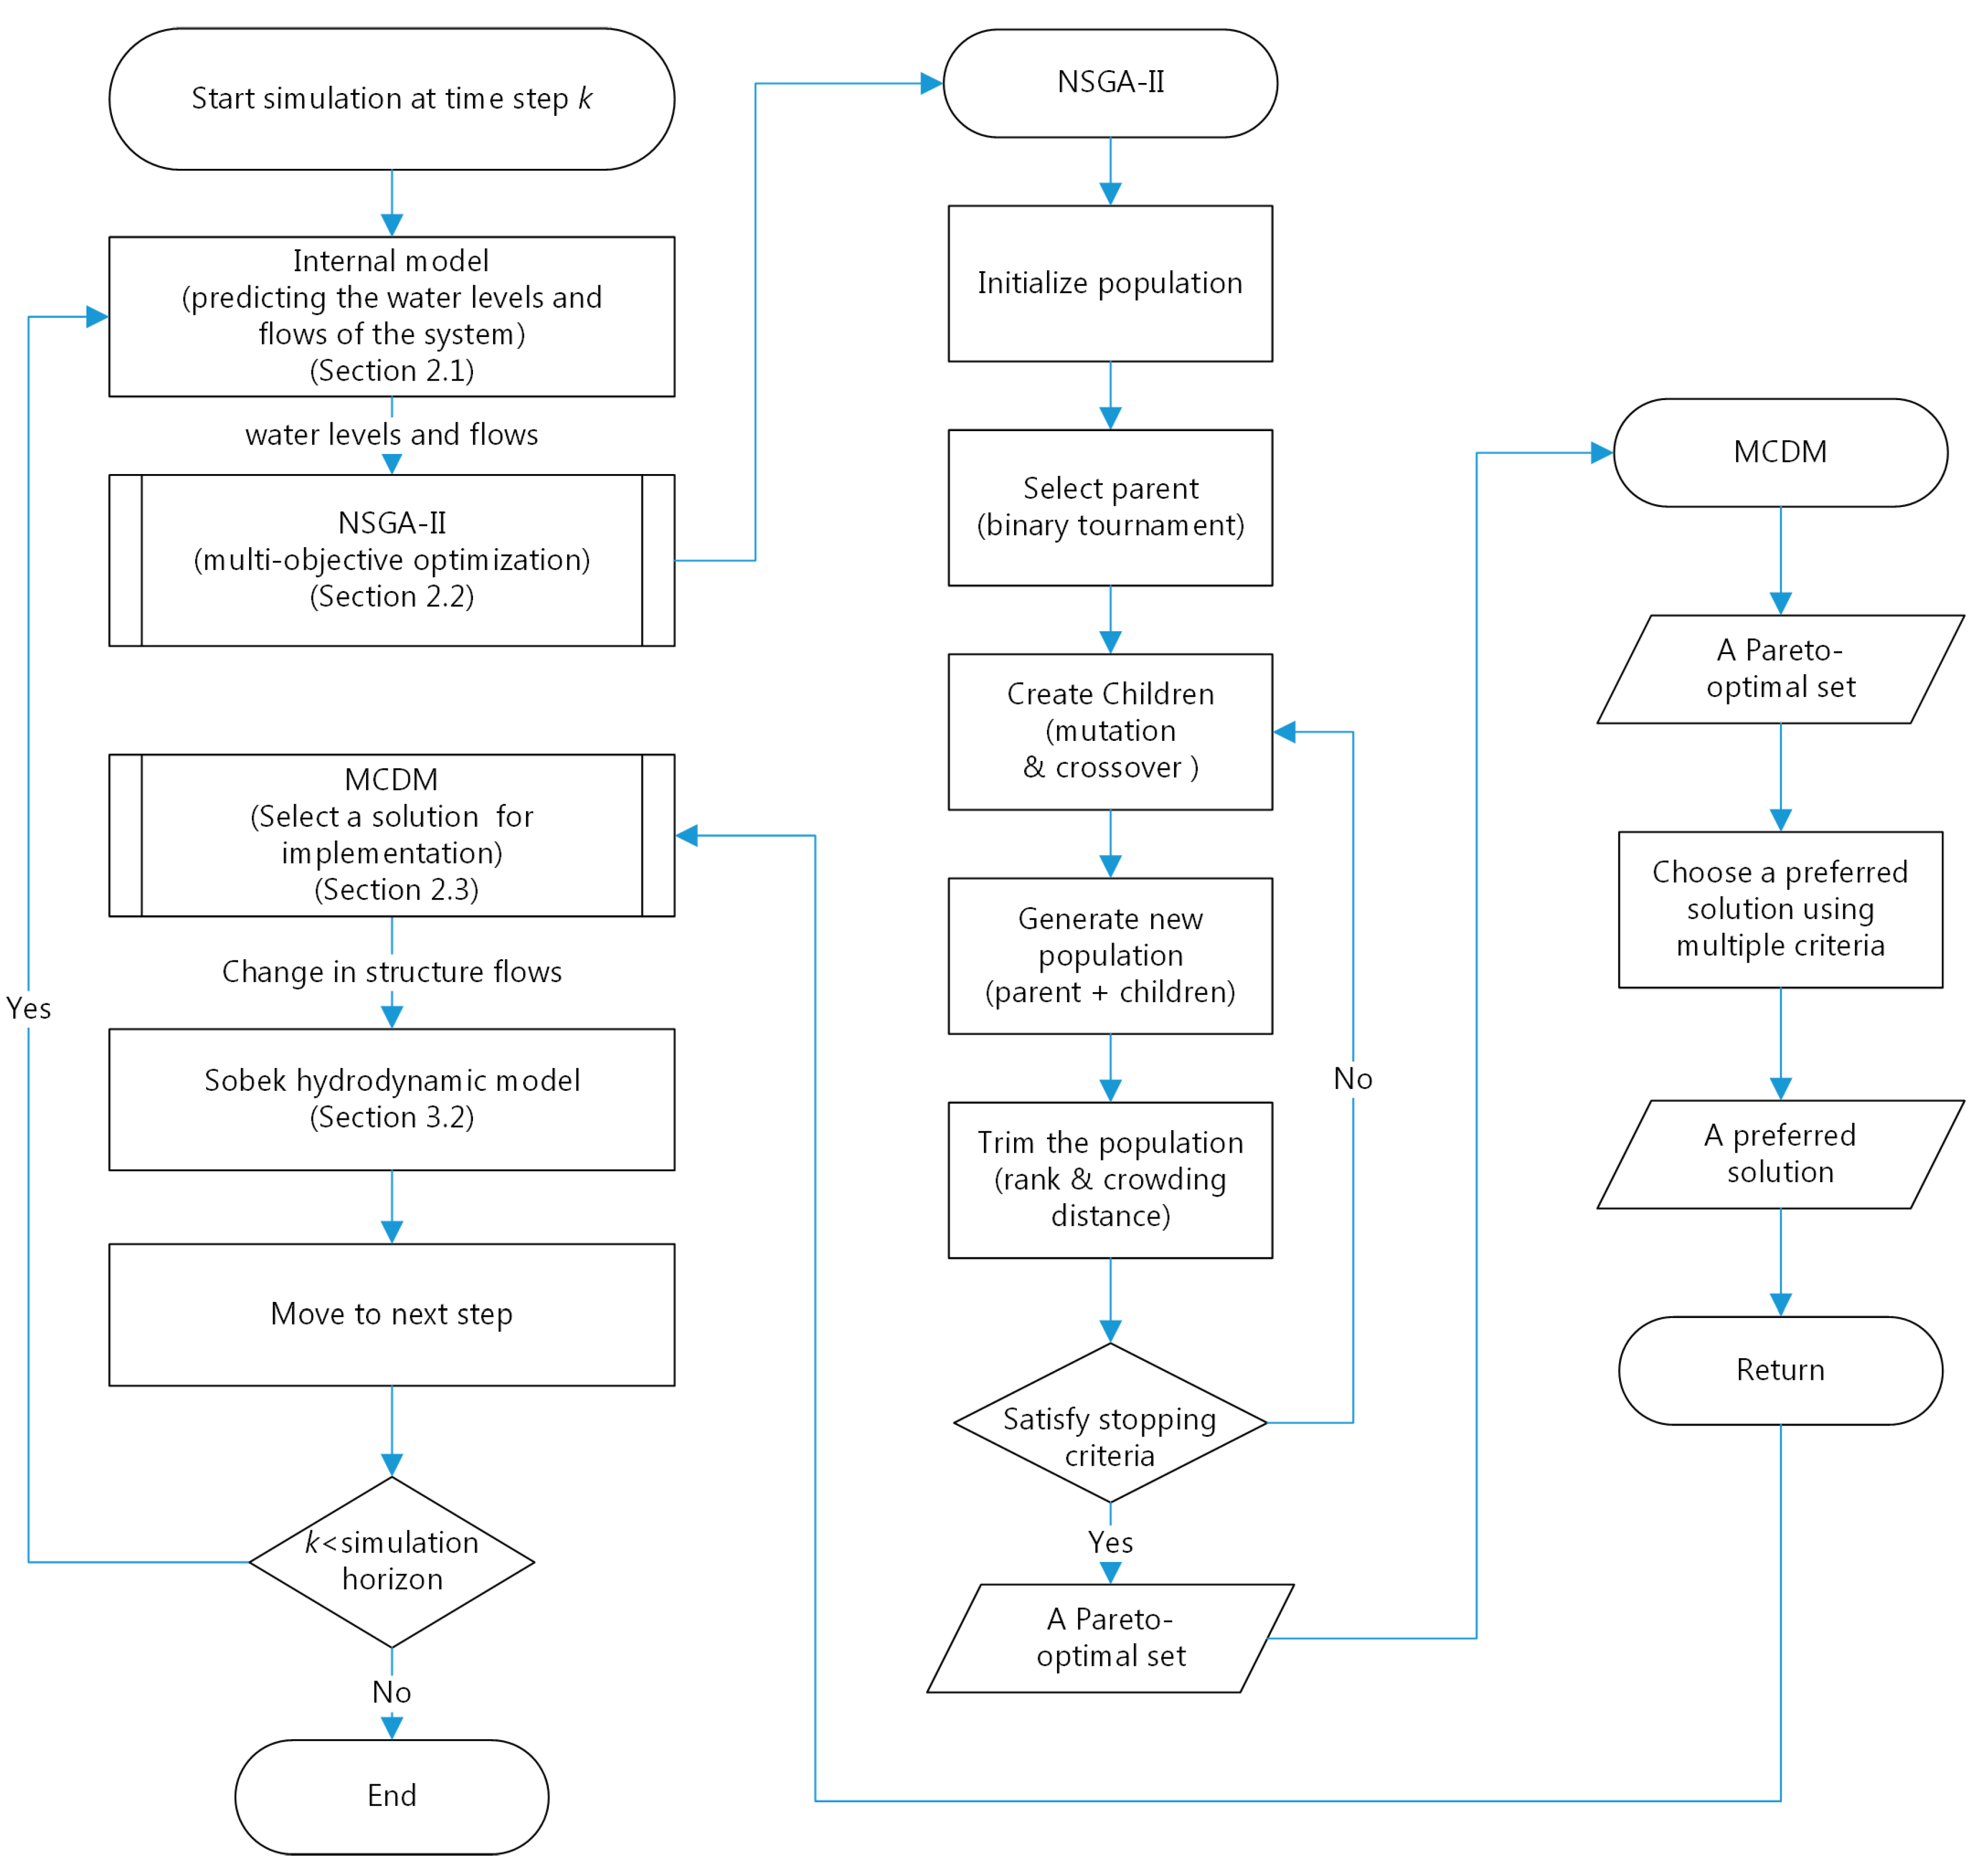
The proposed MOMPC framework combines the non-dominated sorting genetic algorithm (NSGA-II), multi-criteria decision making (MCDM) and the receding horizon principle to operate a multi-reservoir system in real-time. The structure diagram of the method is shown in Figure 1.
2.1. Internal Model or Reservoir System Model
In MOMPC formulation, a reservoir system model is required to predict the future water levels and flows of the system over a prediction horizon as a result of predicted inflows and control flows. Generally, the water levels and flows of a river system can be simulated by using the De Saint Venant equations [54]. This model has been widely used as an internal model in MPC formulation to solve various water management problems [7,55,56] and it can capture the basic dynamics of a water system [57]. In this study, we employed a simplified internal model used in [8,58,59] to approximate the water levels and flows of a reservoir system. The state space representation of a controlled reservoir system can be generally described as follows:
where the state vector x is composed of the water levels and flows of the system, the input vector u is composed of the controlled releases of reservoirs, the disturbance vector d is composed of inflows into the system and k denotes the discrete time step. , and are the matrices relating to the successor state with the current state, input and disturbance, respectively, which can be derived from the discretization of the De Saint Venant equations in time and space Xu [60]. In this study, the staggered grids and implicit numerical integration method presented by Stelling and Duinmeijer [61] was adopted to discretize the De Saint Venant equations because of its ability to deal with every Froude number in the shallow water flows.
2.2. Multi-Objective Optimization
Most real-time operations of multi-reservoir systems involve multiple conflicting objectives, such as irrigation, hydropower generation, flood control and recreation. The demands of these objectives may compete with each other to meet their own management goals. A clear conflict exists between flood control and hydropower generation that flood prevention requires low reservoir water level to create a storage space for large inflow, while high reservoir water level is required for the maximization of hydropower production. During flood event, water supply shortage can be occurred by restriction of reservoir release. In addition, water supply for irrigation, hydropower generation and recreation are competitive each other due to limited storage of reservoir. Clearly, the tasks of reservoir operators are challenging to seek the possible trade-offs between conflicting objectives. The various techniques have been developed to address multi-objective optimization problems and the choice of an optimization method depends on type of problems, available information and the user’s preferences [62]. The commonly used methods are a priori methods such as utility function method, lexicographic method and goal programming, and a posteriori methods such as evolutionary algorithms and normal boundary intersection [62].
2.2.1. Multi-Objective Optimization in the Classical MPC
In general, the classical MPC formulation uses a priori methods termed the weighted-sum method to solve a multi-objective control problem as follows:
where J = objective function, = the weight of the mth objective, m = number of objective functions and N = number of prediction steps. In this method, the weight corresponds to the relative important of each objective and the changes in weight vectors will result the different optimal solutions. Without any information of the weight vectors, this method is highly subjective to find an optimal solution. Moreover, the weighted-sum method is not applicable to find all Pareto optimal solutions in a single simulation run [39]. Thus, it is difficult to apply the weighted-sum approach to any problem, and an MOMPC approach is discussed in the next section.
2.2.2. Multi-Objective Optimization in MOMPC
Instead of scalarizing multiple objectives to a single-objective in the classical MPC formulation, MOMPC optimizes multiple objectives to find the Pareto-optimal solutions. In mathematical terms, the reservoir operation problem can be generally expressed as:
where is the number of inequality constraints and is the number of equality constraints. To solve this optimization problem, MOMPC adopted the NSGA-II to find a Pareto-optimal solution set at every control step. The NSGA-II proposed by Deb et al. [51] is a particular type of multi-objective evolutionary algorithms that outperforms to find a diverse set of solutions and in converging nearer to the true Pareto-optimal set compared to other MOEAs [51]. The first step of NSGA-II is to create the initial populations. Then, parents are selected from the population using a binary tournament selection based on the rank and the crowding distance. The selected parents generate the children using mutation and crossover operators. The current parents and current children are sorted again based on their ranks and the crowding distances and only the best individuals are selected. The optimization is terminated based on the stopping criteria (see in Table 1), and the process is repeated to the next time step. The flowchart of NSGA-II is shown in Figure 1. In this way, a Pareto-optimal set of reservoir releases were determined using the NSGA-II at every control time step. As mentioned previously, MOMPC uses the receding horizon principle, thus, it is required to choose a preferred solution from a Pareto-optimal set at each time step. Therefore, the decision-making procedure is discussed in the next section.
2.3. Multi-Criteria Decision Making
Using the MOEA, a set of trade-off solutions can be found in solving an optimization problem with conflicting objectives. Among these solutions, the choice of a preferred solution should be based on qualitative considerations between them. For this task, MCDM technique is a useful tool for evaluating the performance of each alternative solution through multiple criteria. In the decision-making field, several MCDM techniques are available to choose a single preferred solution, for example, weighted-sum developed by Fishburn, ELECTRE proposed by Bernard Roy, TOPSIS developed by Hwang and Yoon and VIKOR developed by Opricovic [53]. The selection of an MCDM method depends on the decision-maker’s preference in term with the ease of use, sensitivity and ability to deal with uncertainty. In this study, the three MCDM methods were used to develop the eight decision rules and their overall performances were discussed. Using the MOMPC, the decision-makers can visually evaluate the performance of each decision rule and can make a choice based on their preferences.
After obtaining the non-dominated solutions from the previous step, feature scaling was used to standardize the all objective costs into a range [0,1] in which 0 means the worst performance and 1 means the best performance for each objective. Suppose, we have m control objectives and s Pareto solutions at each time step, which is normalized as follows:
After this step, the following decision-making methods were applied to select a desired alternative from a Pareto front and it is actually implemented for the next time step.
2.3.1. Weighted-Sum Method
The weighted-sum method is often used for making decision among a number of alternatives, where an appraisal score is calculated for each alternative solution by multiplying each standardized objective cost by defined weight, followed by the summing up of the weighted scores for all objectives as follows:
Then, an alternative solution that has the highest total score among all alternatives is selected for implementation at each time step.
It should be noted that the weighted-sum method applied in Section 2.2.1 is a priori articulation of preference information before optimizing the objective function. In the MOMPC, it is used to select a solution after obtaining a set of Pareto-optimal solutions.
2.3.2. Maximin Method
The maximin method aims to avoid the worst possible performance of each alternative solution [63] and an alternative is selected as follows:
2.3.3. Maxisum Method
The maxisum method focuses on best possible performance of each alternative solution [63] and an alternative is selected as follows:
2.4. Performances of the System under Alternative Operating Rules
The performance indicators are used to access the possible performance of a reservoir system under alternative operating policies. In this study, reliability of meeting target water levels of reservoirs (or storage volume) was defined based on water level deviation ratio as follows:
where = reliability of meeting target water levels of reservoirs (%), = water level deviations of reservoirs (m), y = index of the decision rule and = number of decision rules. Similarly, reliability of reducing flood risk at a downstream place is defined as follows:
where = reliability of meeting flood control objective at a downstream place (%), = exceeding water depth above the danger level (m). For hydropower generation, reliability of meeting target demand is defined as follows [64]:
where = reliability of maximizing hydropower generation (%), = hydropower demand (MWh), = generated hydropower (MWh).
3. Case Study: A Multi-Reservoir System in the Sittaung River Basin
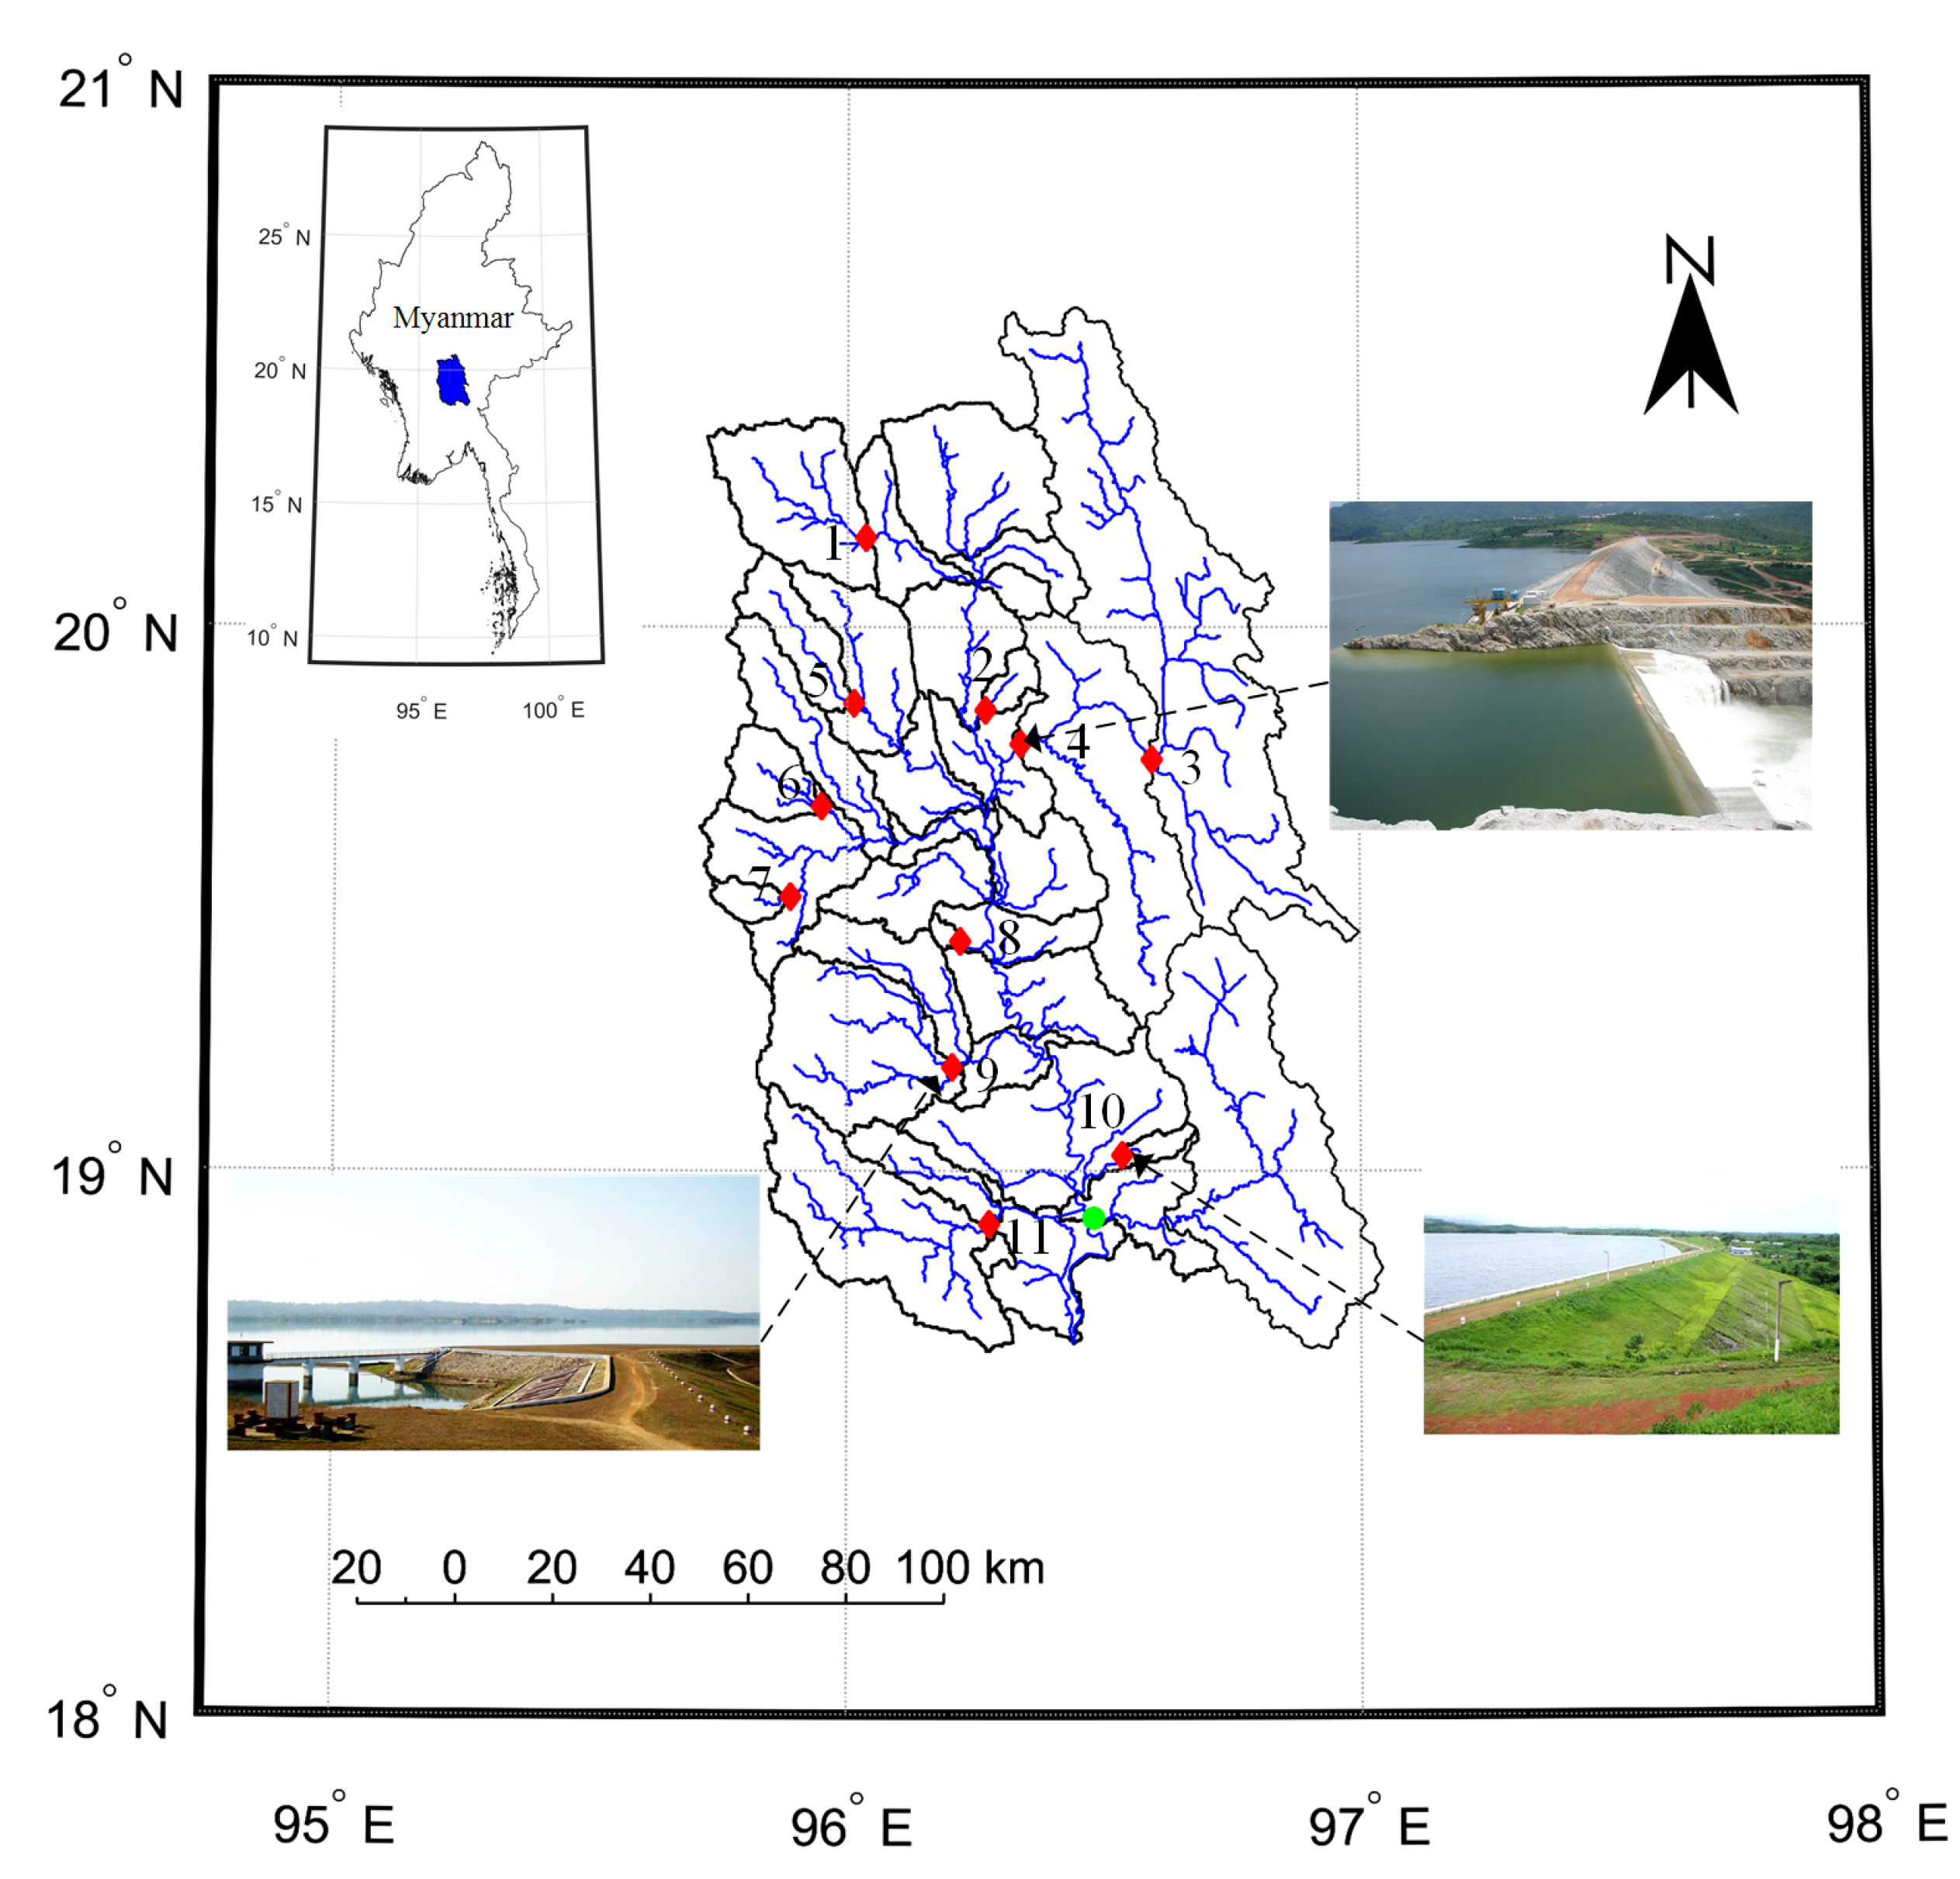
The proposed MOMPC method has been tested on real-time operation of a multi-reservoir system in the upper part of the Sittaung river system, Myanmar where a group of reservoirs has been constructed primarily for irrigation, flood protection and hydropower generation (see Figure 2). This water system is composed of 11 reservoirs and the readers are referred to Myo Lin et al. [8] for the salient features of these reservoirs.
3.1. Control Objectives
During the dry season, the reservoirs are operated to satisfy two main control objectives, i.e., hydropower and irrigation demand. The reservoirs release water for hydropower generation first and then the water is reused for irrigation through the diversion weirs. During the wet season, the reservoirs need to store the water to meet the target storage volumes, while the reservoirs need to release the water for hydropower generation. These objectives are conflicting to each other for meeting their own management goals. Moreover, the releases need to be controlled to reduce the downstream flood risk. Therefore, the reservoir operation is particularly challenging in the wet season compared to the dry season. The following control objectives are considered in this study.
- The first objective () is to maintain the target water levels of reservoirs (or desired storage volume) for irrigation and hydropower generation in the dry season. Therefore, the deviations of reservoirs water level from its reference level are minimized by:where = water level at reservoir i (m), = reference water level of reservoir i (m), = controlled outflow at reservoir i (), = change of control flow at reservoir i (), = relative penalty on water level deviation for reservoir i, = relative penalty on the change of conduit flow at reservoir i, and = number of reservoirs (11 Nos.). The maximum allowed value estimate (MAVE) [29] was used to define the penalties on the change of water level and the conduit outflow. In this study, maximum allowed water level relative to reference level and maximum allowed discharge relative to the conduit capacity were used as MAVE of that variable. The penalties were defined to the reciprocal of the square of the MAVE of that variable.
- The second objective () is to reduce the flood risk at the Taungoo city. A soft constraint [29] is implemented to minimize the water level deviations above the safety water level at a flood control station, which is defined as:where = water level at river reach p (m), = soft constraint [29] on water level at river reach p (m) and = safety water level at river reach p (m).
- The last objective () is to maximize electric energy production at the three reservoirs which is defined as [65]:where = tail water level at outlet structure i (m), = turbine efficiency ranging from 0 to 1 (0.6), g = acceleration due to gravity (9.81 ), = density of water (1000 ), and = 3.
This optimization problem can be written as:
As the control objectives are conflicting to each other, it is required to address the trade-offs between conservation, hydropower generation and flood control. Using MOMPC, the decision-makers can evaluate the possible trade-offs, outcomes of different decision rules and can then select a single preferred solution.
3.2. Model Description
In this study, we employed the rainfall runoff and internal models developed by Myo Lin et al. [8] to implement the MOMPC framework in the Sittaung river basin. In this model, the Sittaung catchment was divided into 34 sub-catchments and their outflow was estimated using the Sacramento rainfall runoff model. As described in Section 2.1, the river system was divided into 82 reaches, and a one-dimensional De Saint Venant equations based internal model was used to estimate the water levels and flows of the system. This simplified internal model was calibrated and validated using the observed data in our previous study [8]. This reservoir system was also modelled by using the SOBEK developed by Deltares [66] to represent as a real water system which was used as the system replacement to update the water levels and flows of the simplified internal model.
3.3. Simulation Settings
Model simulation was conducted for 10 days using 30 min discrete time steps. The NSGA-II was applied to optimize the cost function Equation (12) over a two days prediction horizon which proved long enough to capture the dynamics of the water system [8]. The parameters of NSGA-II are shown in Table 1.
As the receding horizon control was applied, each model simulation used a decision rule, shown in Table 2, to select a release decision at every time step for the whole simulation horizon. Three commonly used MCDM methods were applied and compared their performances. For the weighted-sum method, the weights were defined based on the relative importance of each objective and the sum of all weights is equal to 1. The highest weight for each objective was used in DR 1, DR 2 and DR 3 to find out the best possible performance of one objective without considering all other objectives. Different weight combinations were also used to analyse the trade-off and priority of each objective. To support the decision makers, model simulation was performed eight times to assess the overall performance of the different decision criteria.
4. Results
The proposed MOMPC scheme was applied to the Sittaung reservoir system for real-time operation of a multi-reservoir system involving the three control objectives. Model simulation was conducted for 10 days (simulation horizon) using 30 min discrete time steps. For the Sittaung catchment, the travel time of the water flow from its origin to the outlet takes 41 h for the average flow condition. In this study, as two days prediction horizon was used, it was able to capture the dynamics of water system for the MOMPC formulation. Model was run on 2.5 GHz Intel Core i5 processor 8G RAM computer and the average computation time was 100 s in each time step. This efficiency allows us to update the reservoir operation policy in real-time.
4.1. Pareto Fronts and Trade-Offs
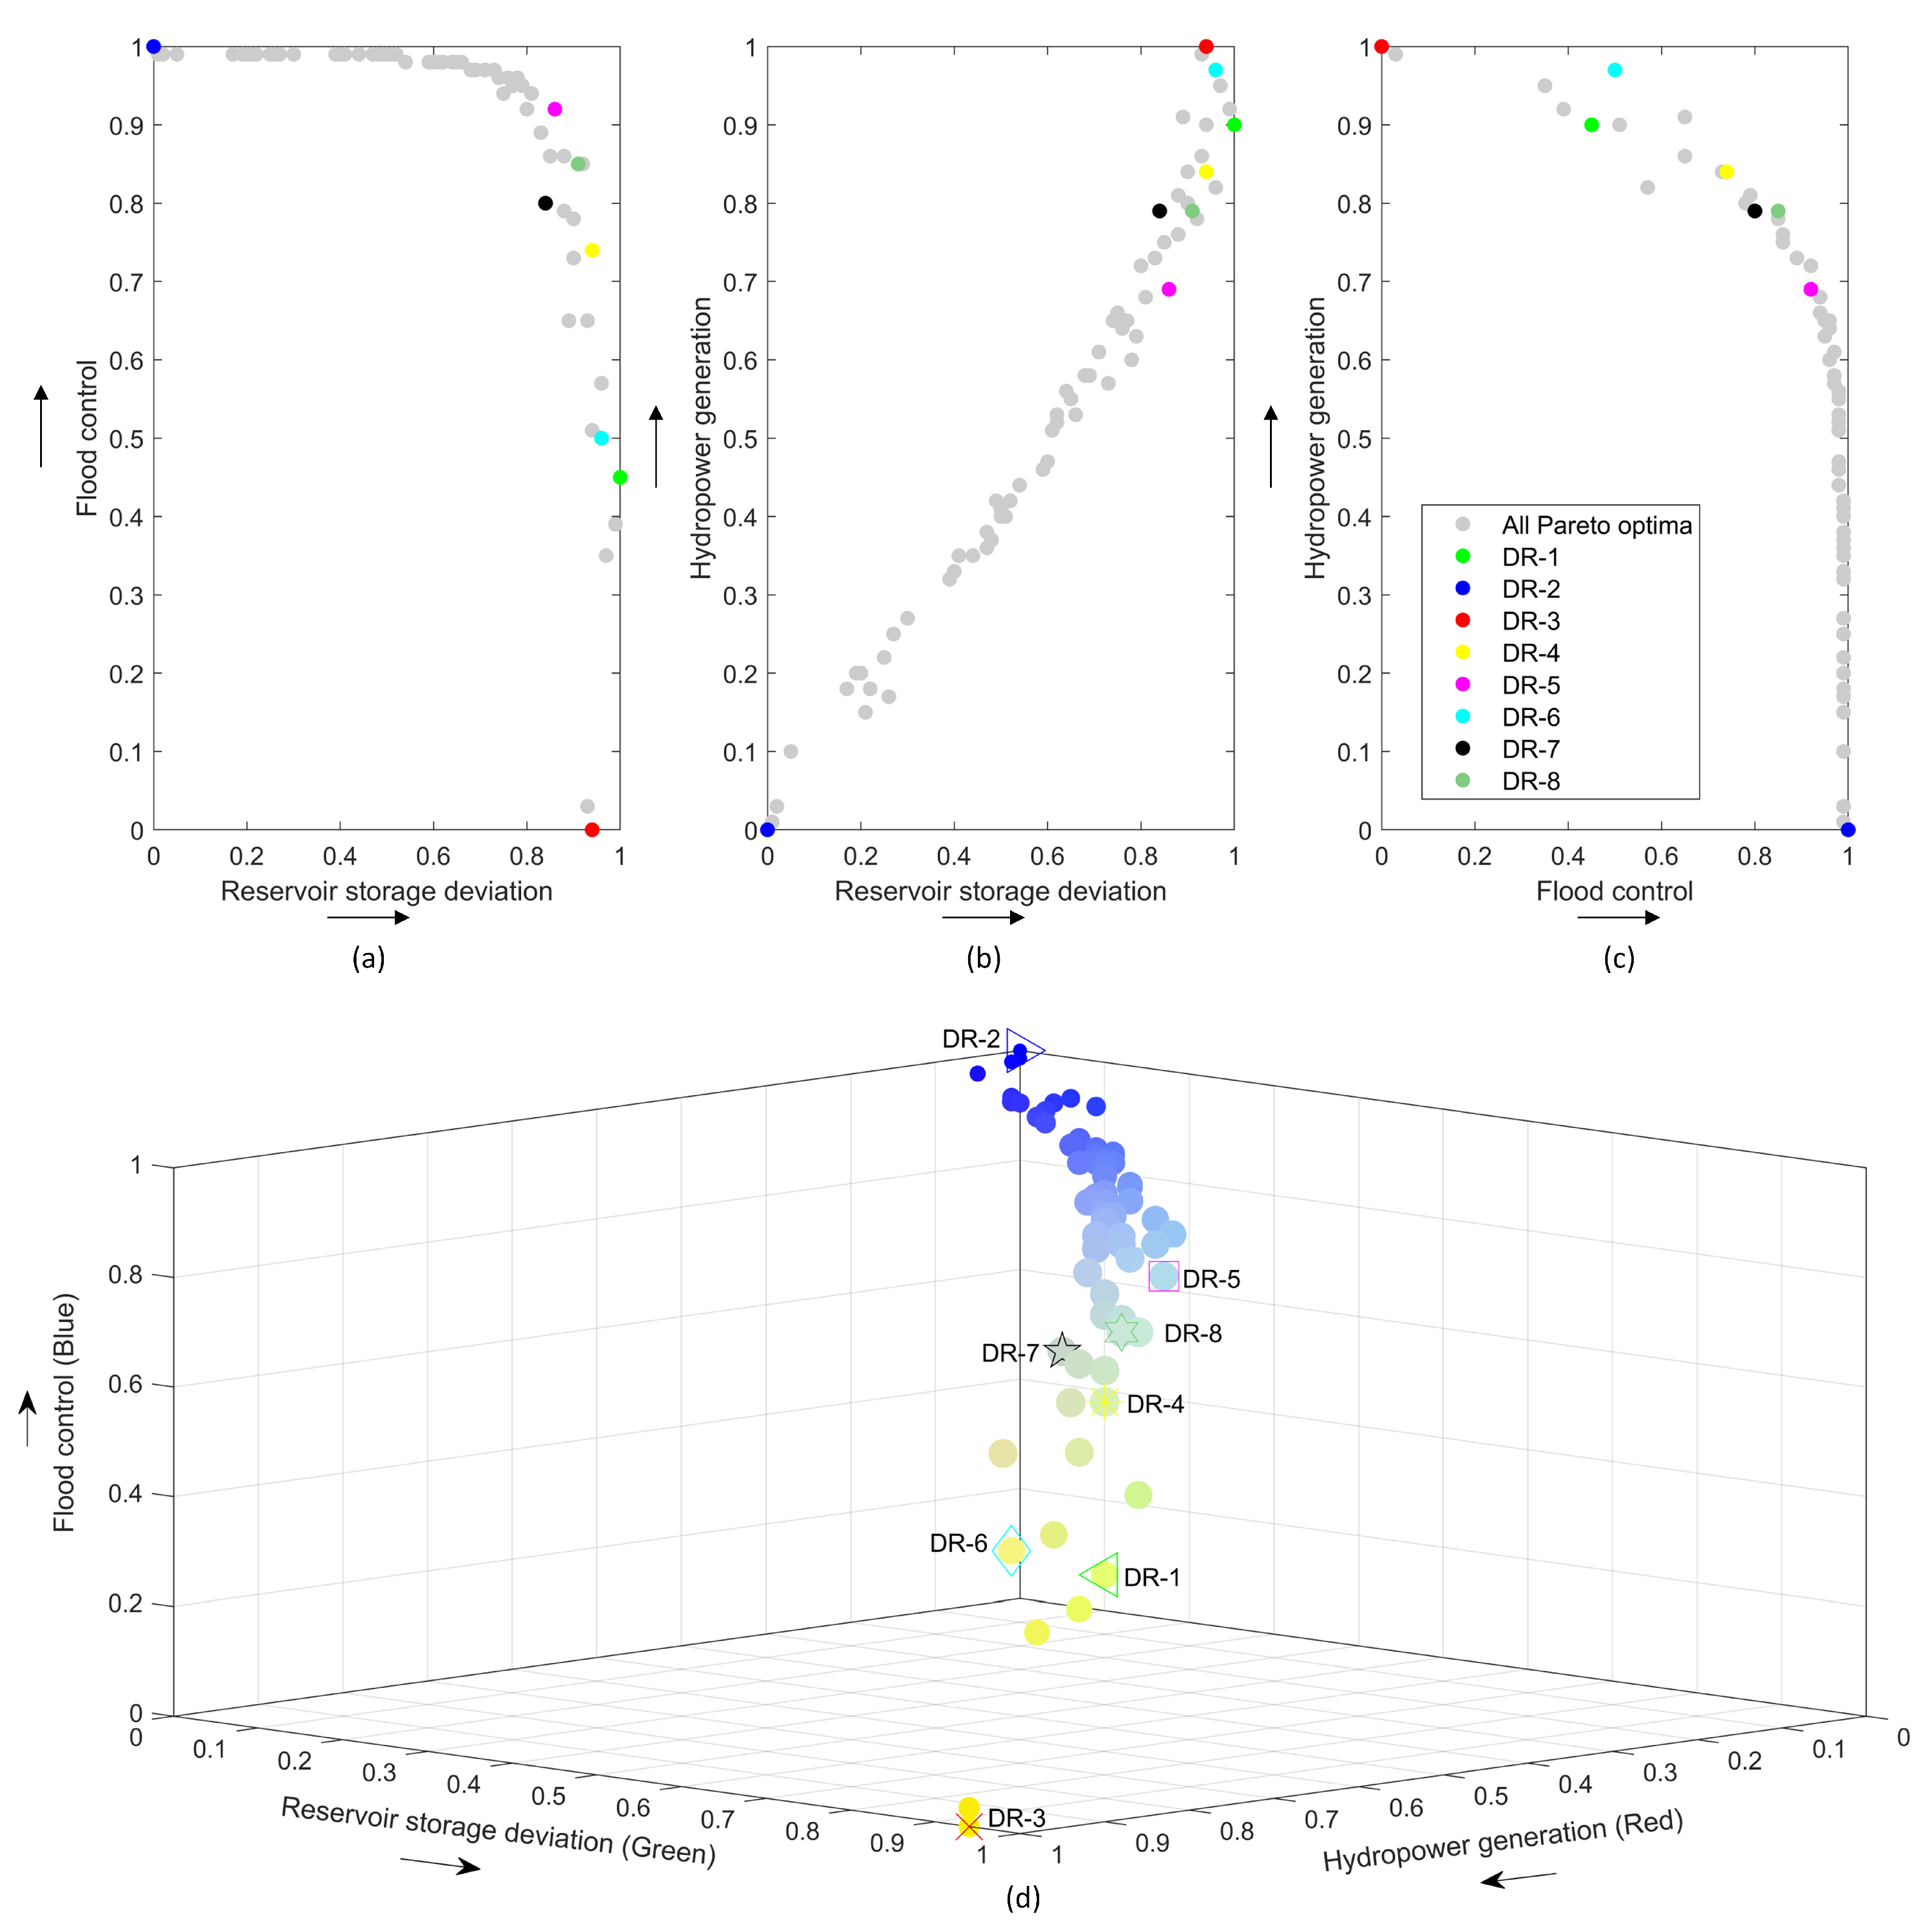
Multi-objective optimization with NSGA-II generates a set of non-dominated solutions in a single simulation run which is beneficial for the decision-makers to make a release decision based on their preferences. In every control time step, a Pareto optimal solution set was obtained and a solution was selected for implementation to the system. According to the results, the different competitions occurred among the control objectives in a prediction horizon of two days. Figure 3a–d shows an example of the obtained Pareto front for a particular time step and illustrates the trade-offs using the eight different decision rules. Figure 3a shows that a clear conflict between minimization of reservoir storage deviation () and the prevention of flooding (). The best performance in terms of is obtained by DR-1, while the lowest performance can be achieved in terms of . A weak conflict exists between and (Figure 3b) because minimization of storage deviation needs to release the water, which is available for hydropower production. Results also show a clear trade-off between and (Figure 3c), where DR-3 can achieve the highest performance in terms of , while the lowest performance is obtained in terms of . Figure 3d reports the projection of non-dominated solutions in the three dimensional plot using different colours. The green, blue and red colours represent the performance of each solution in terms of , and , respectively. The circle’s size further indicate increasing preference in terms of the three objectives. A colour combination, for instance, cyan, implies that a solution has a good performance in both of objective (in green) and objective (in blue). Similarly, a solution has a good performance in terms of objective (in green) and objective (in red); the colour is shown in yellow. In the same way, a solution has a good performance in both of objective (in blue) and objective (in red); the colour is shown in magenta. The highest performance in terms of is shown in the colour blue under DR-2 (see Figure 3d). DR-3 is shown with the yellow colour in Figure 3d which has the high performance in terms of and as well. The large circles with light colour (e.g., DR-4, DR-7 and DR-8 in Figure 3d) represent that these solutions have good performances in terms of all objectives.
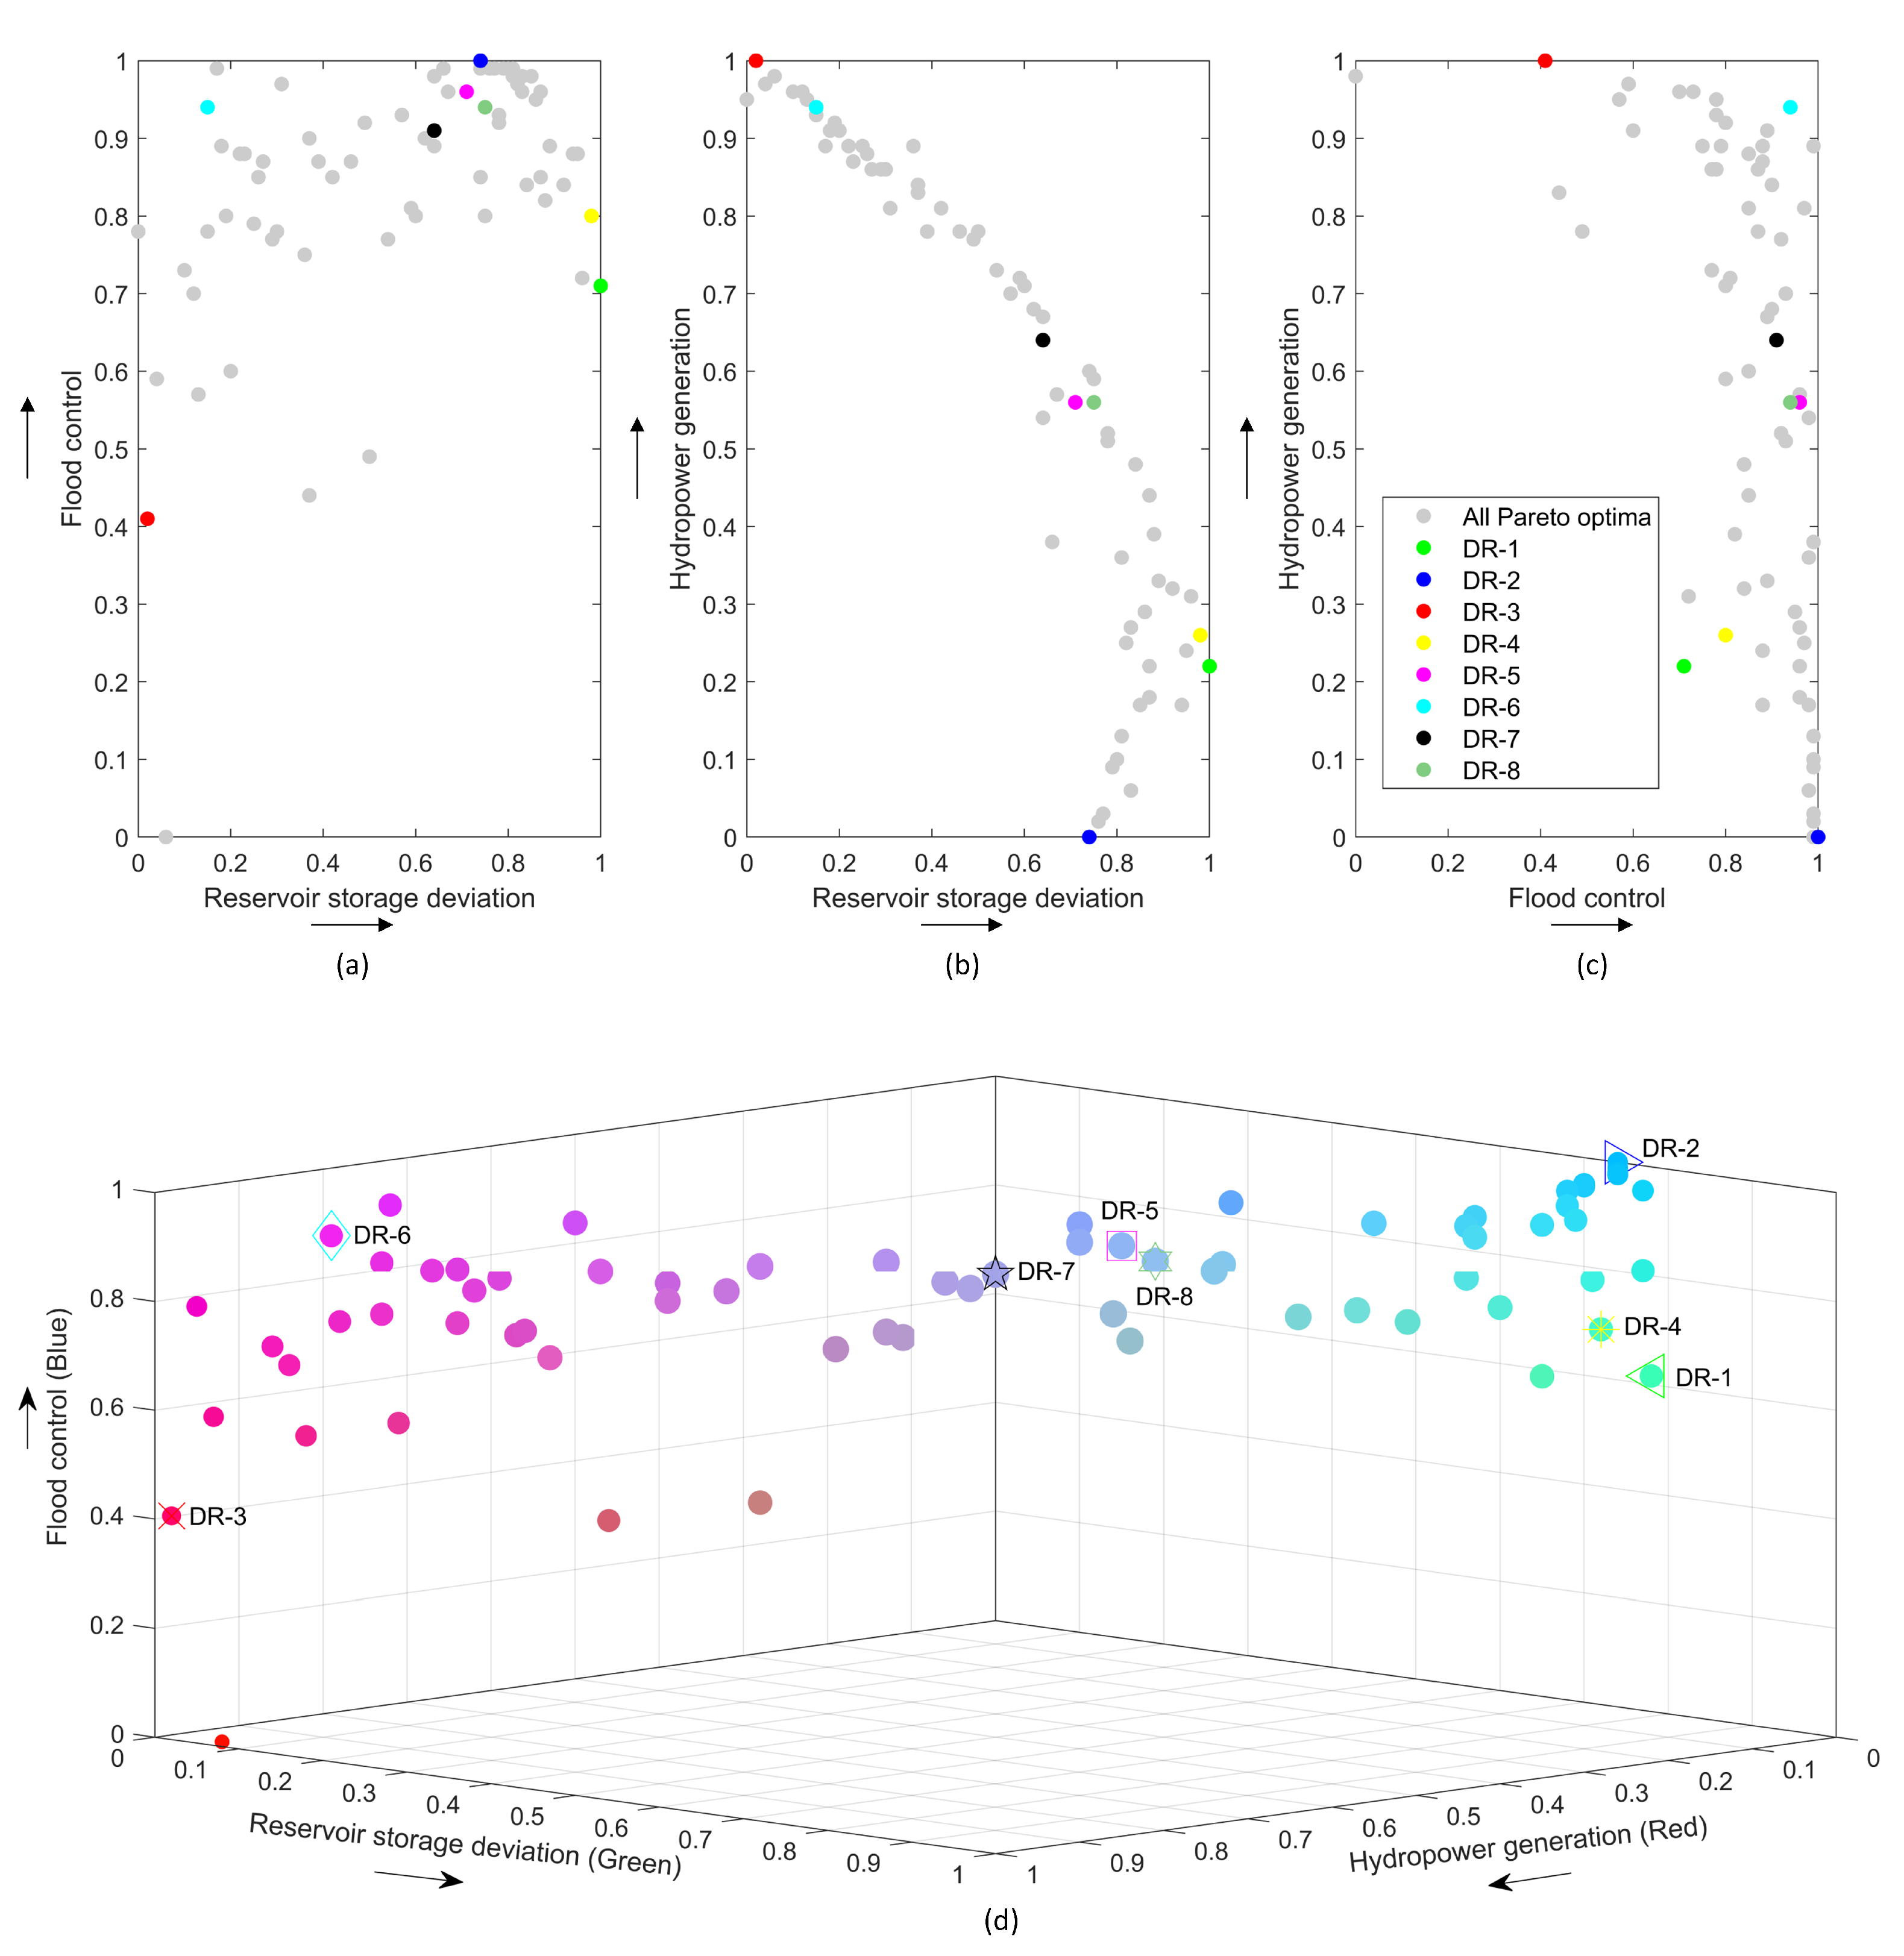
Figure 4a–d shows the obtained Pareto front for another time step. There is a weak conflict between and (Figure 4a), however, a clear conflict exists between and (Figure 4b). This means that the maximization of hydropower generation causes large deviations in the reservoir storages. Figure 4c shows that DR-2 has a negative impact on hydropower generation. Two dimensional (2D) plots in Figure 4a–c is the projection of 3D plot shown a Pareto front for two objectives. However, it is not easy to evaluate the performance of each alternative for all objectives. To clarify that, Figure 4d represents the performance of each alternative in terms of the three objectives. DR-1 has the high performance in terms of and , while a low performance is obtained in terms of (Figure 4d). DR-2 has the worst performance in terms of and DR-3 has the worst performance in terms of . DR-5, 7 and 8 have the better performances in terms of the three objectives compared to all other solutions. In this way, the decision-makers can participate to visually evaluate the trade-off solutions between multiple conflicting objectives.
4.2. Performance of the System
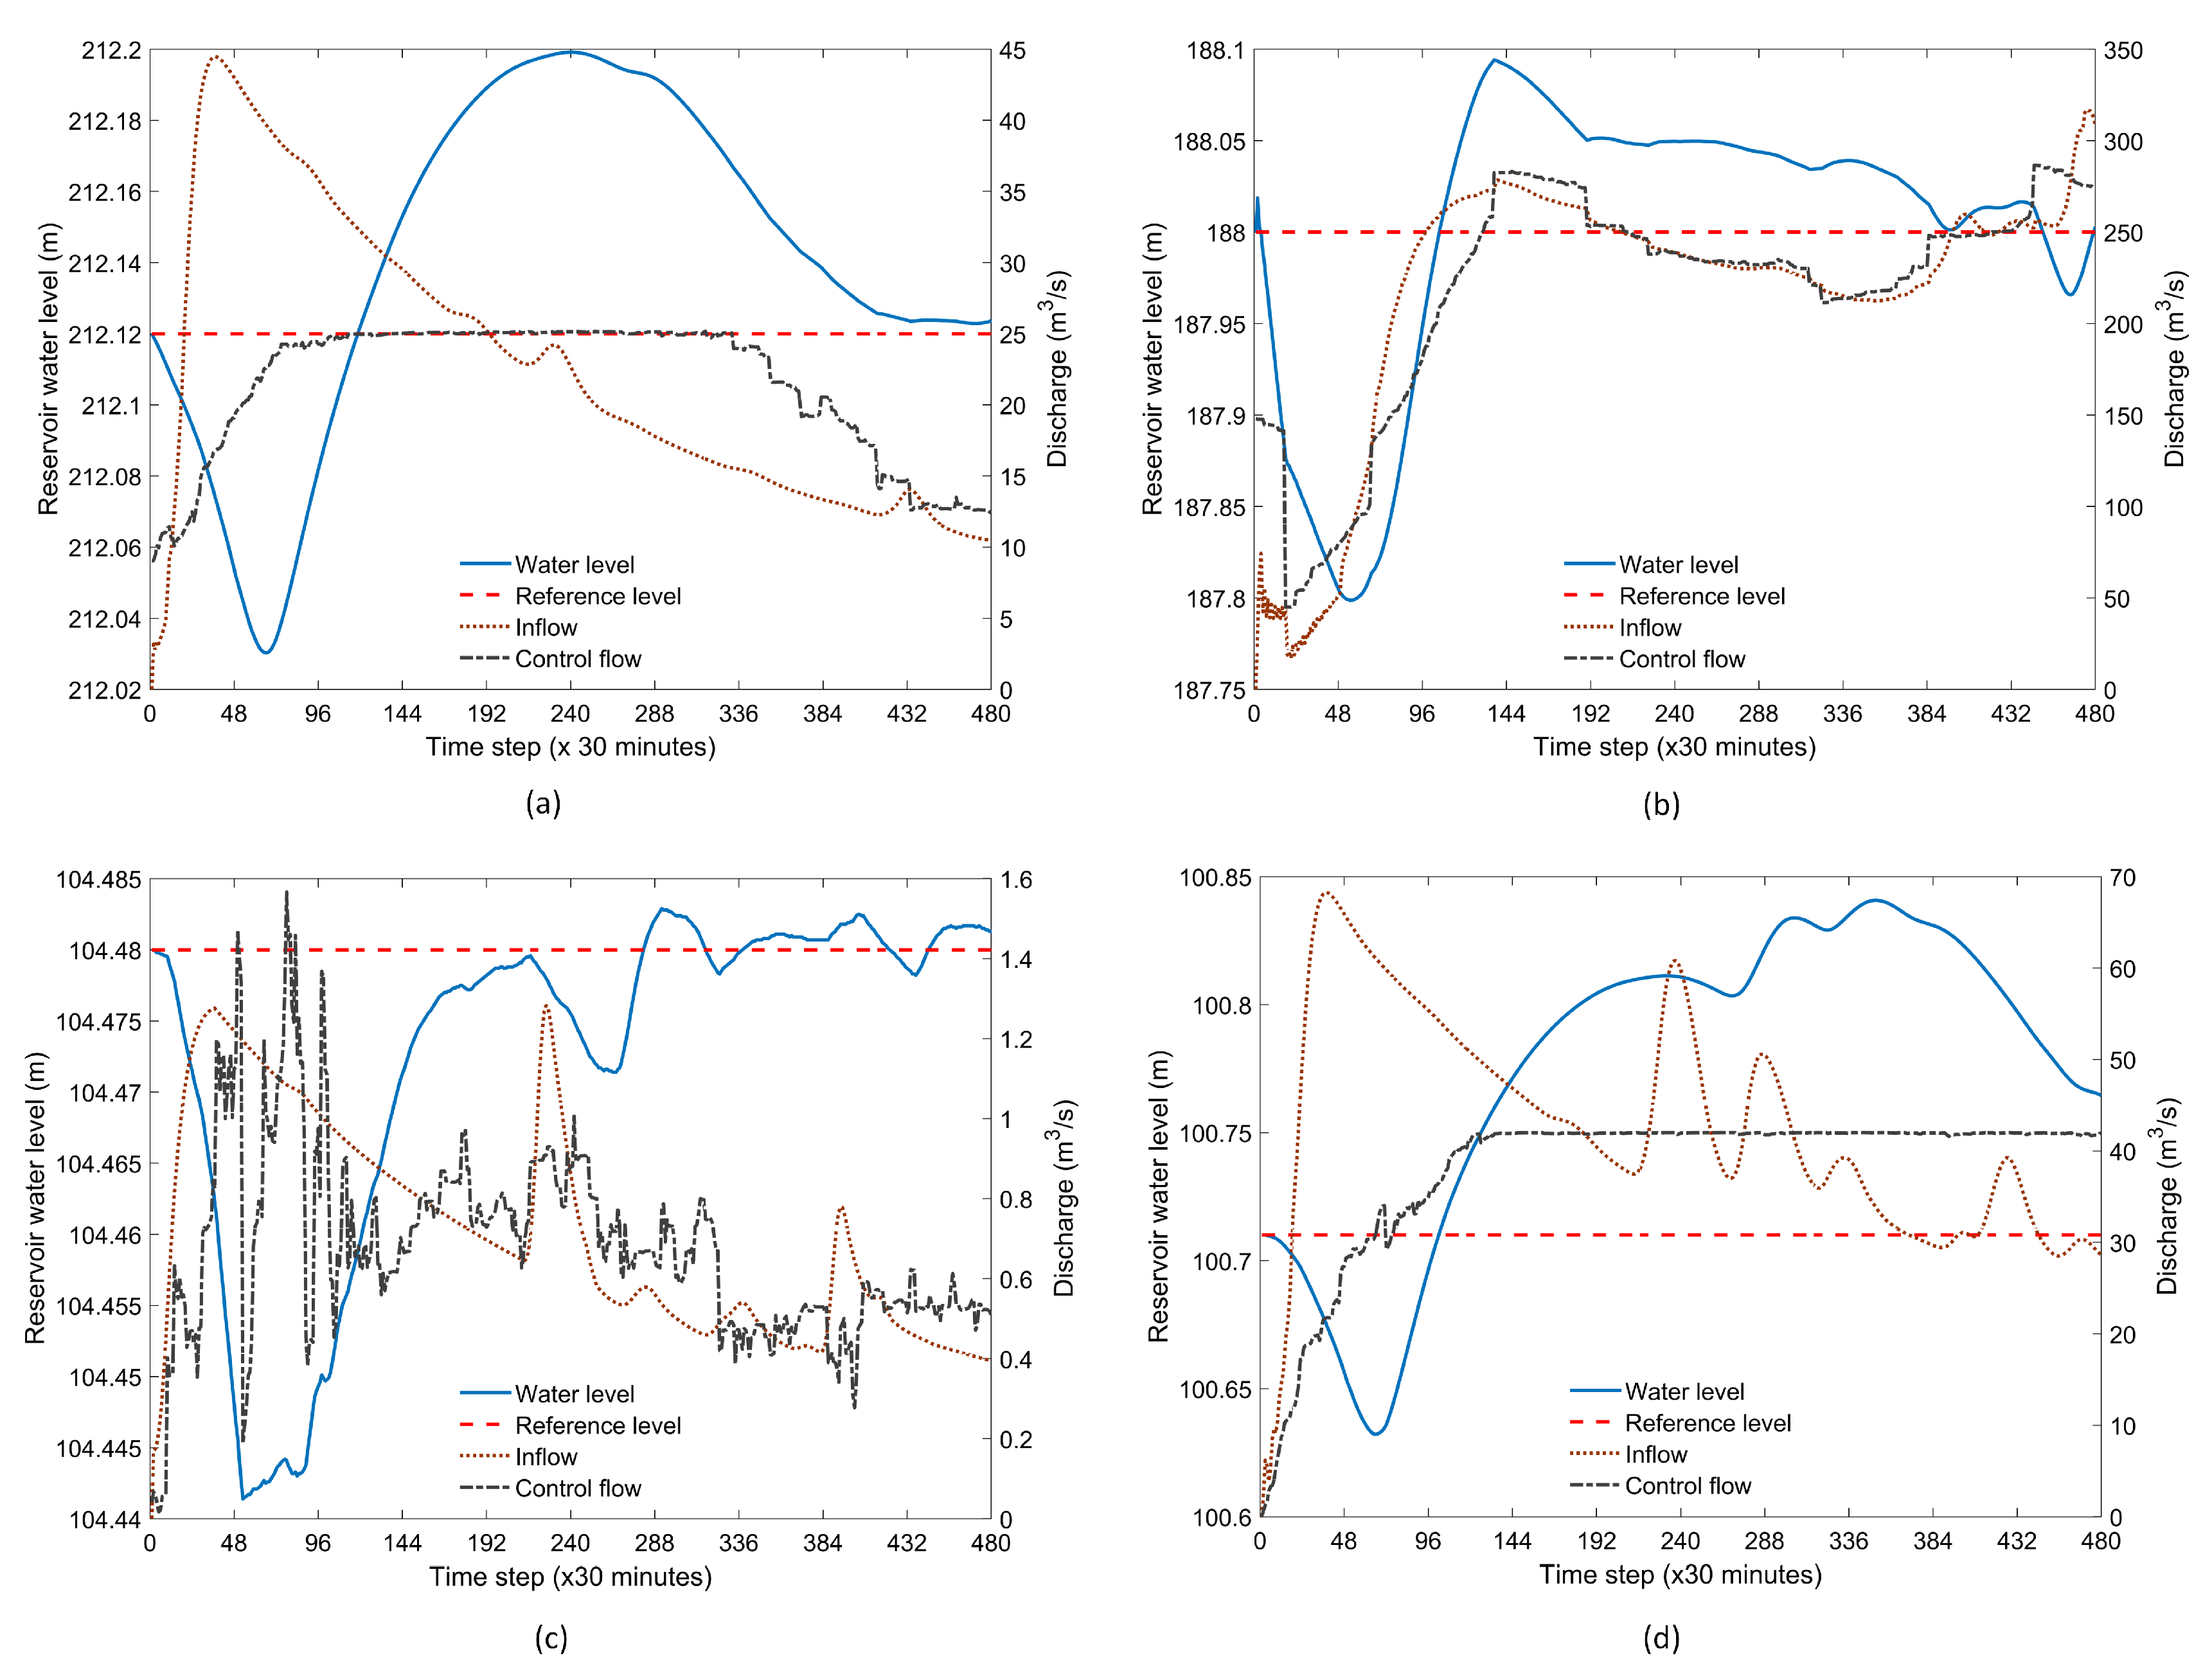
An example of water level control at the reservoirs is shown in Figure 5a–d. DR-1 focuses to control the water levels of reservoir to meet the desired storage capacities. For this operational goal, MOMPC manipulates the outflows of reservoirs to keep the reservoir water levels as close to the reference water levels as possible. In case, inflow exceeds the maximum conduit capacity, a large deviation occurs between the reservoir water level and target water level (Figure 5d). As the eight decision rules are applied in this study, the water levels of reservoirs under the different operating rules are shown in the Supplementary Materials.
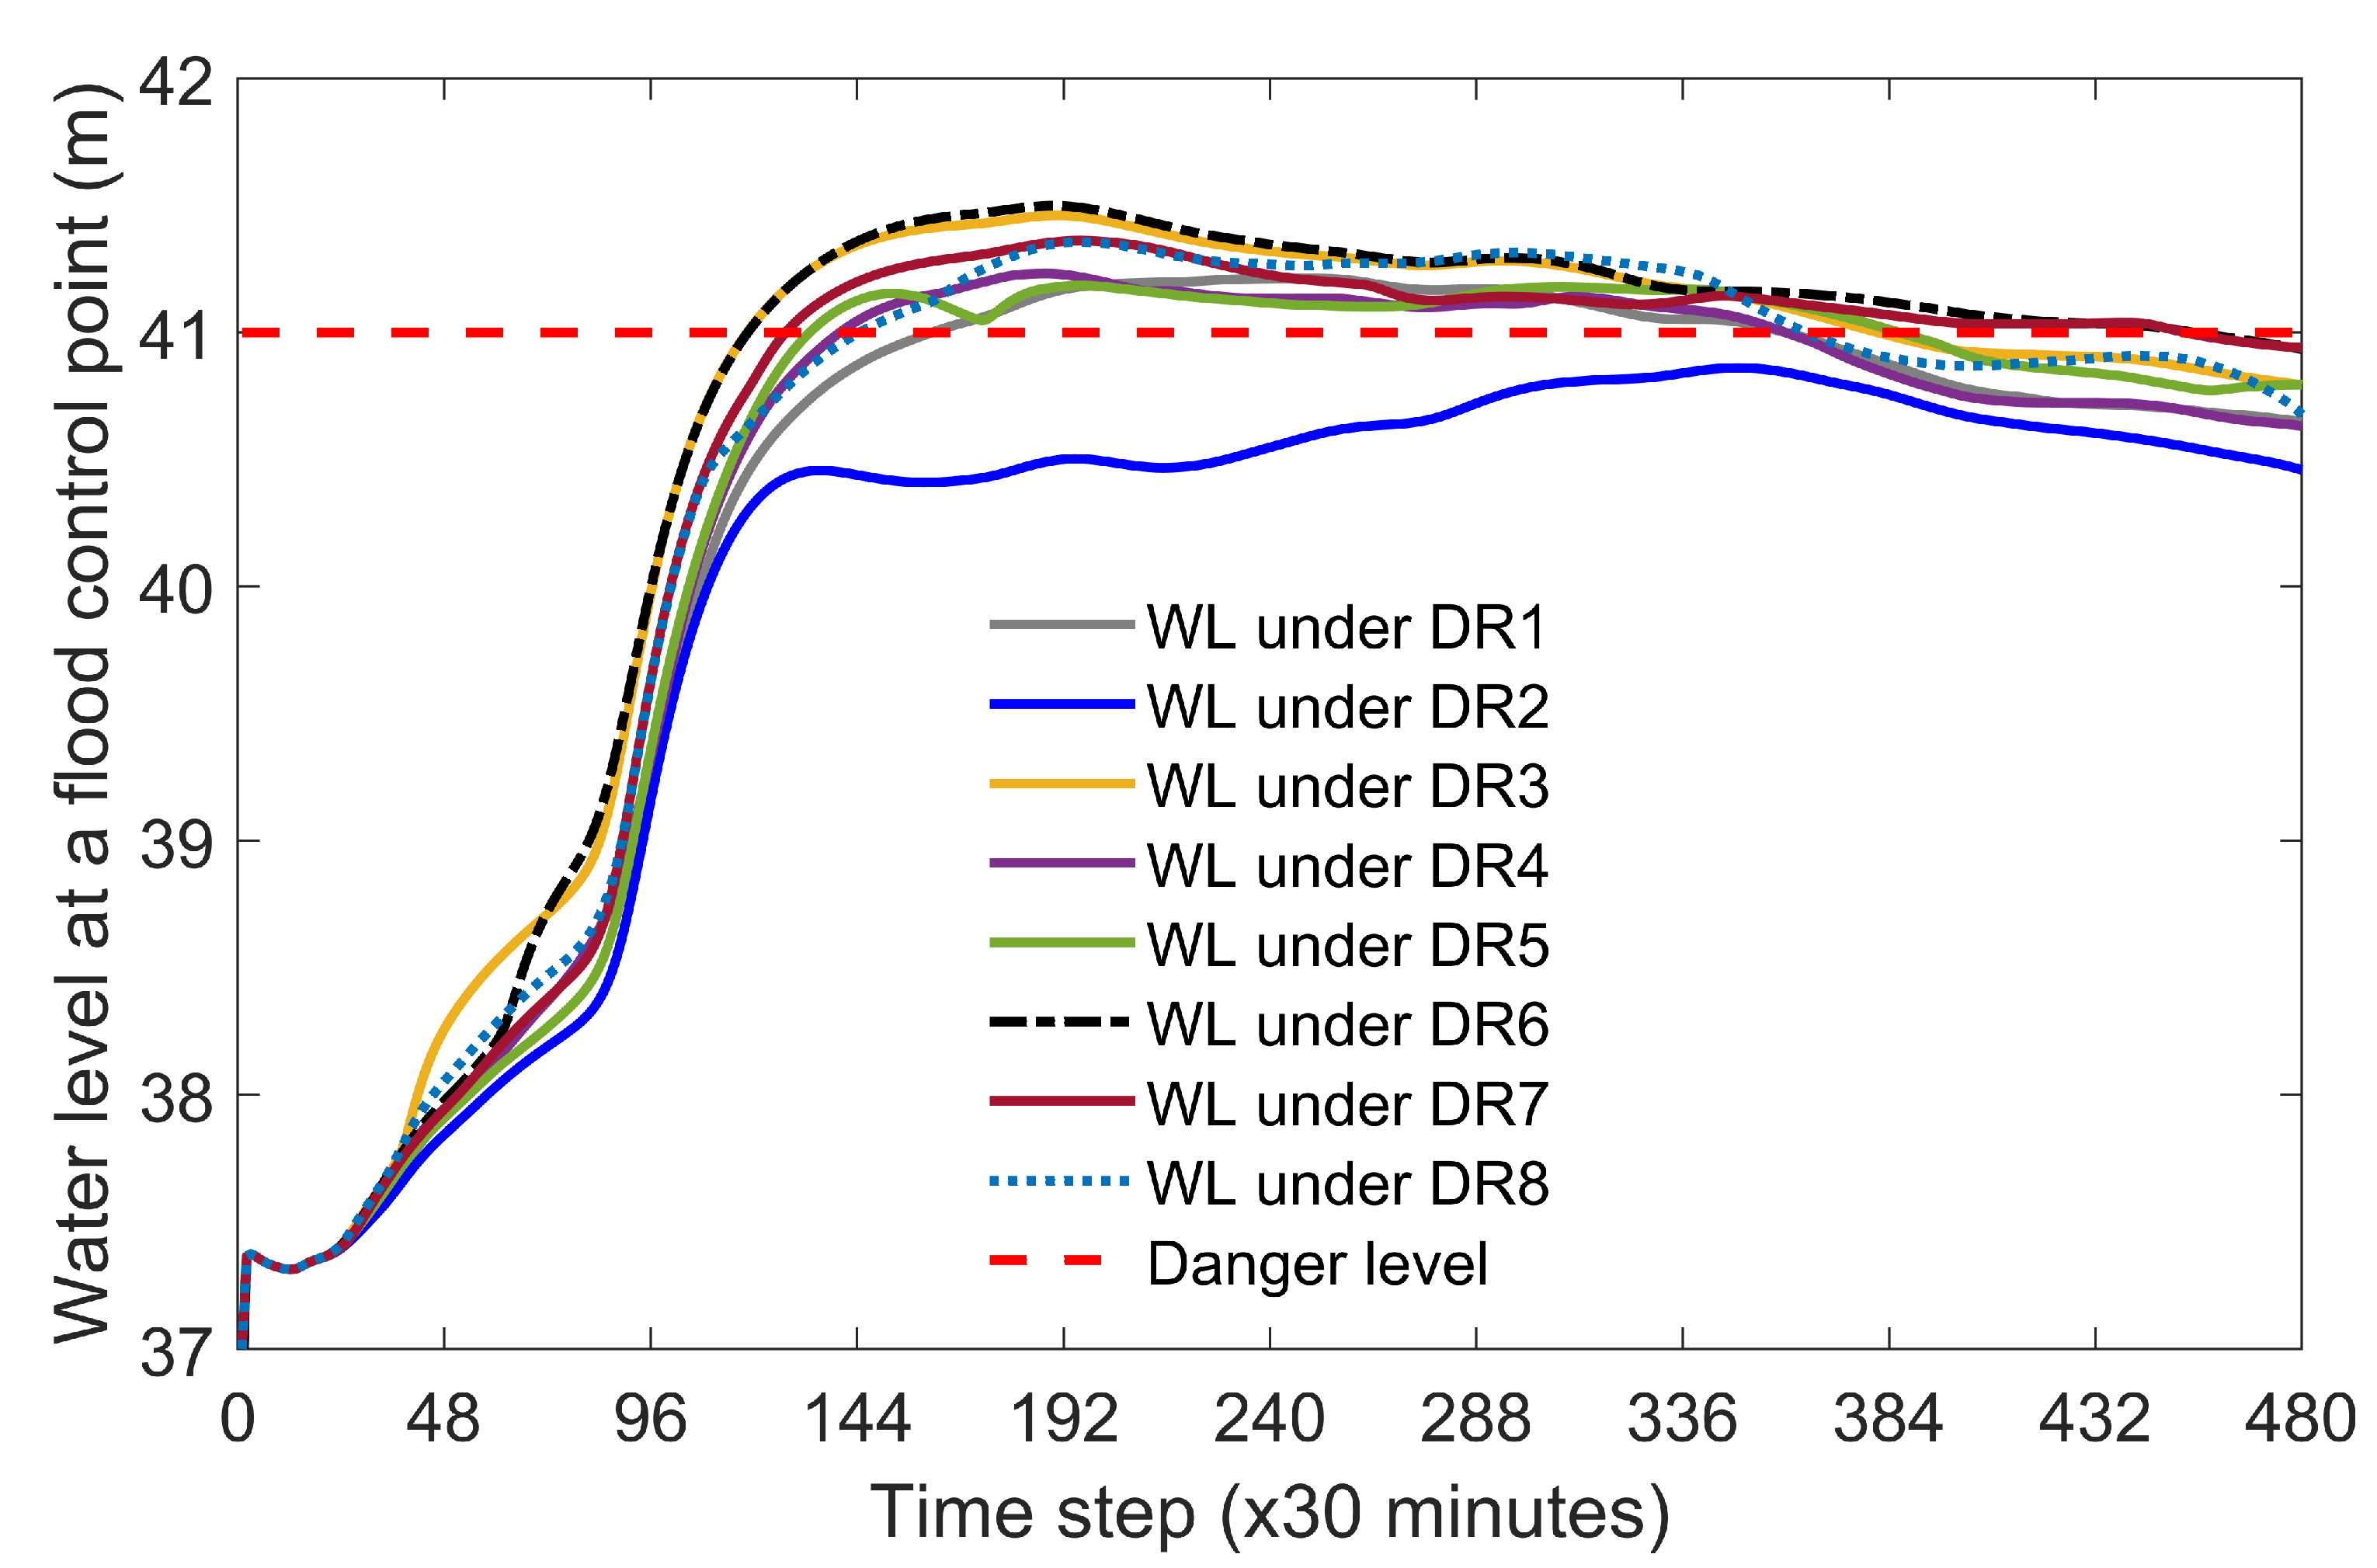
In Figure 6, the water levels at a downstream control point exceeded above the danger level using the different decision rules except DR-2. However, the exceeding water depth and total exceeding time above the danger level vary under each decision rule. Using DR-2, the second objective was focused and reservoir releases were restricted to meet flood control gold. The maximum exceeding water depth can be achieved by using DR-3 and 6 (0.5 m) and the exceeding time above the danger level can last around 7 days compared to the results of the other decision rules.
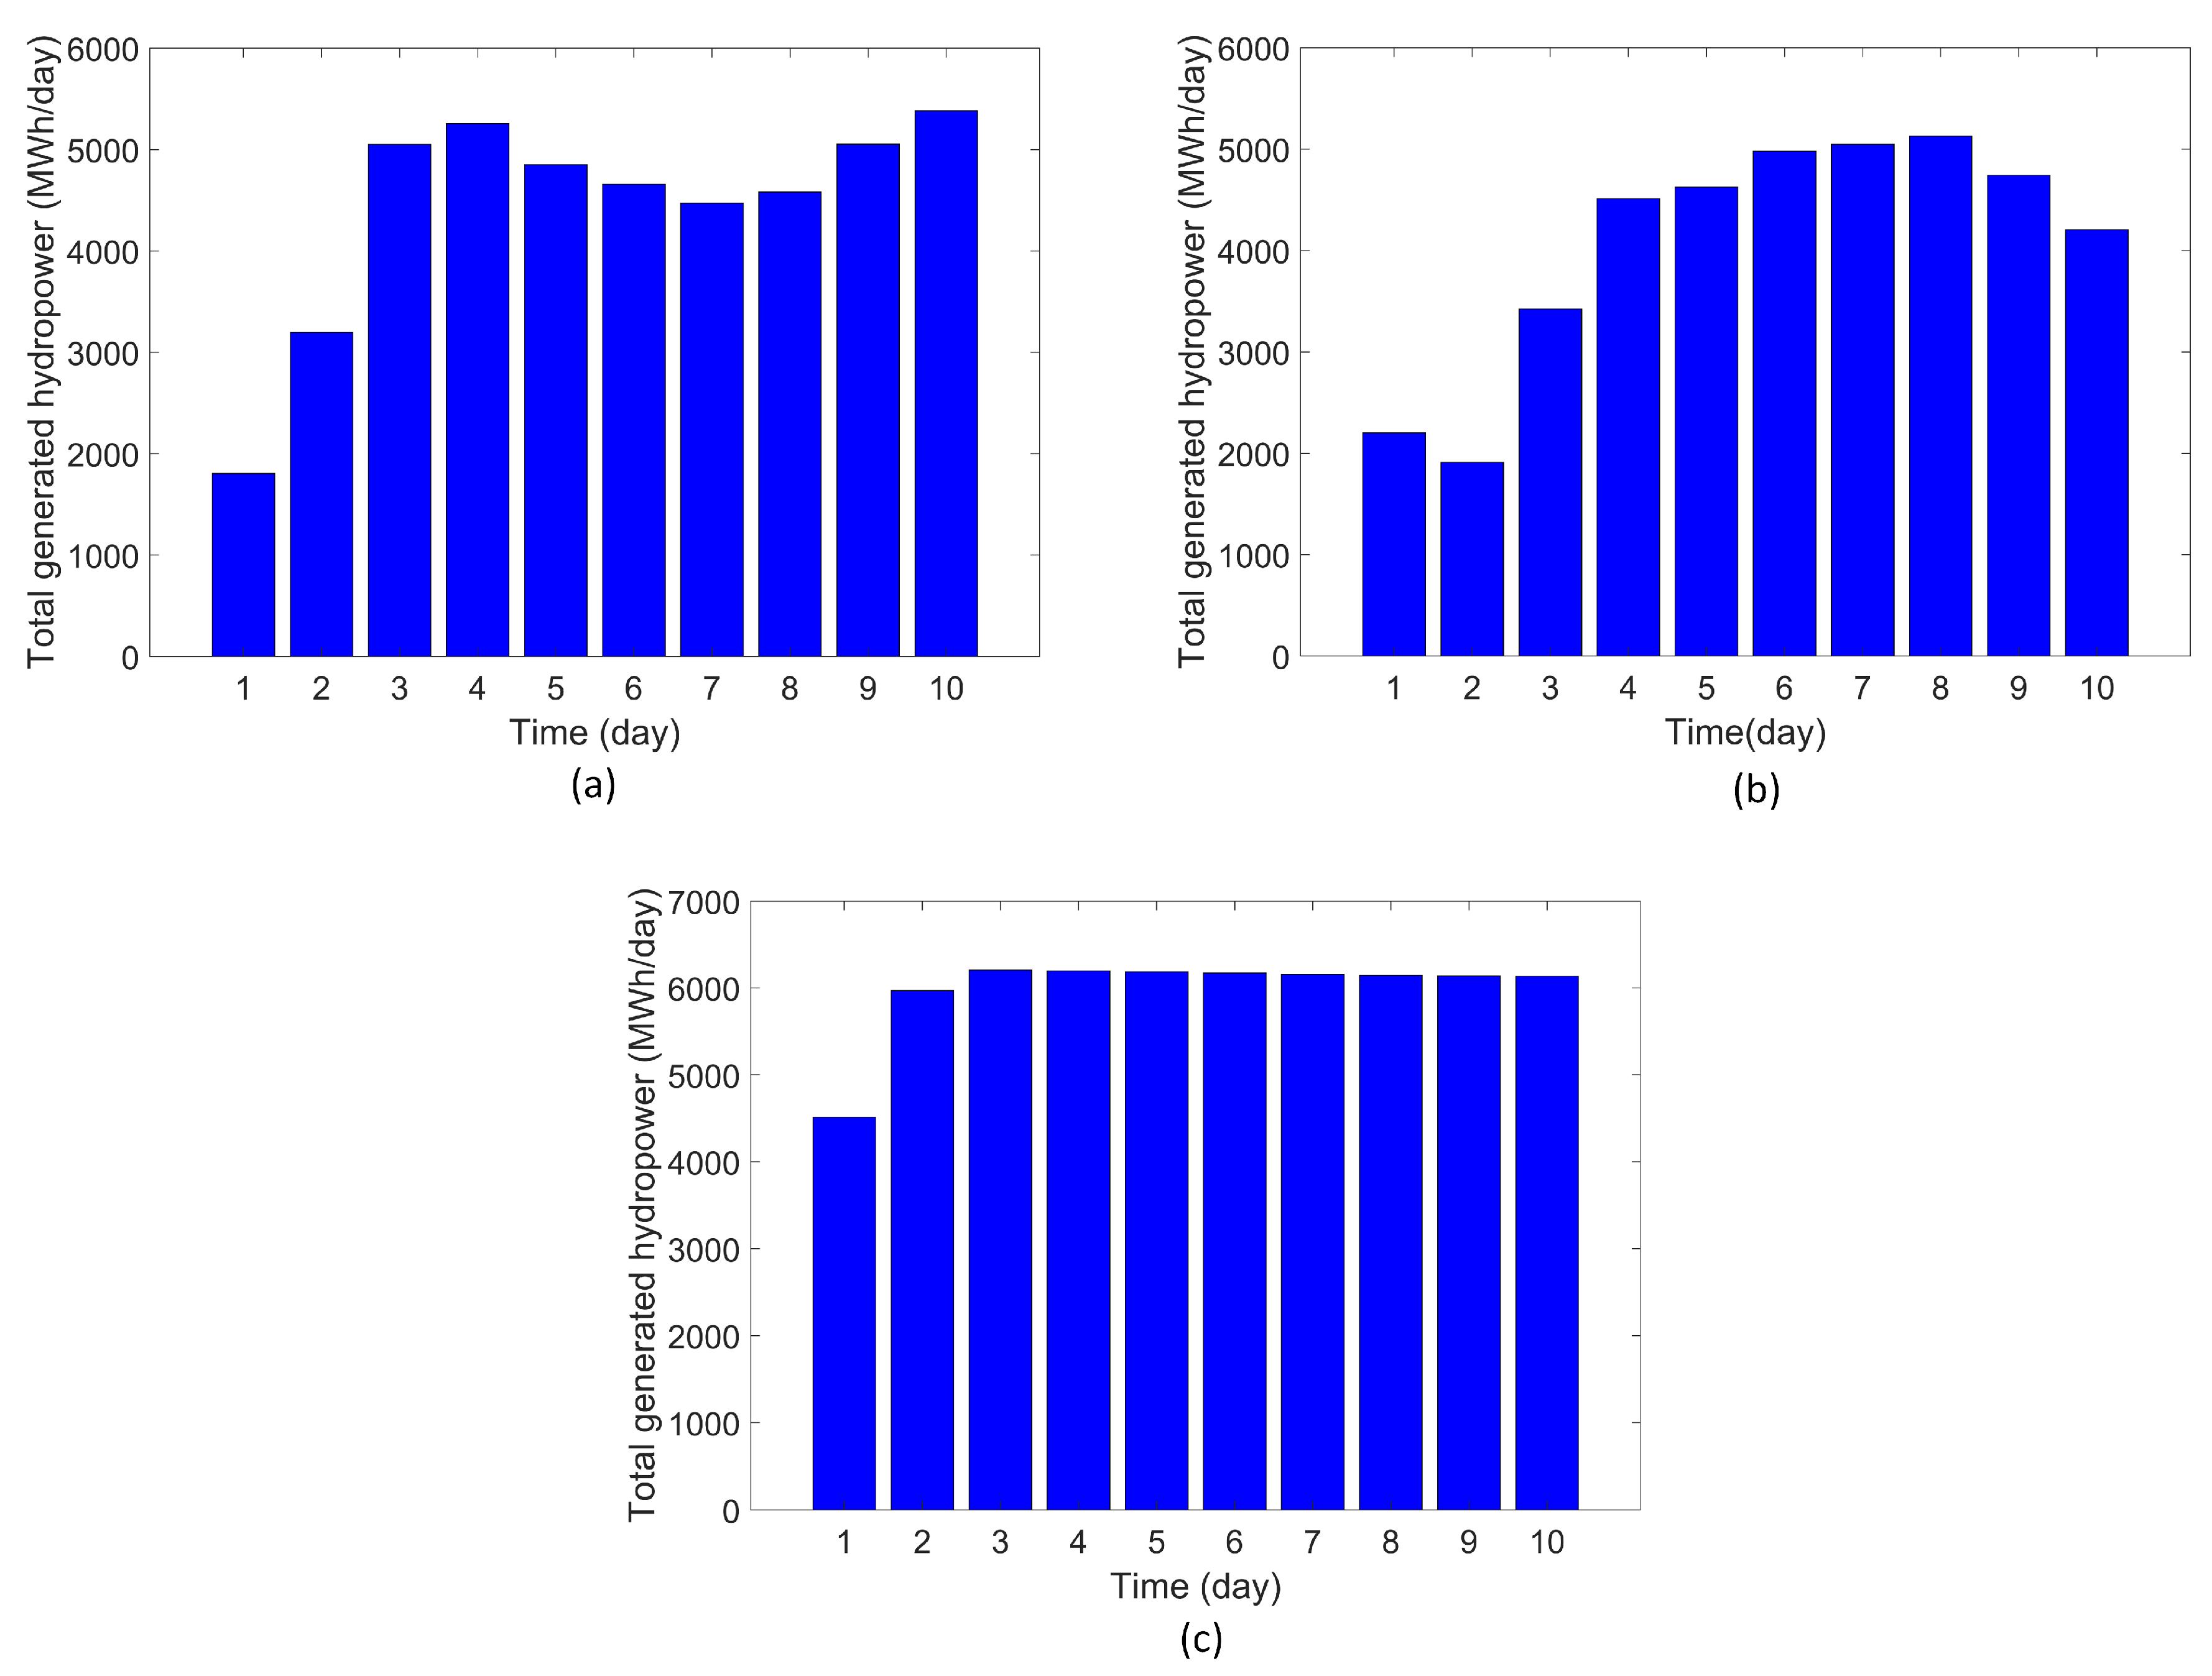
Figure 7a–c shows the total generated hydropower under DR-1, 2 and 3 respectively. DR-2 generates less energy compared to the other rules that it mainly focuses to meet the flood control objective (Figure 7b). DR-3 aims to maximize the energy production that can make the other objective worse off (see Figure 6 and Figure S2 in the Supplementary Materials).
4.3. Overall Performance
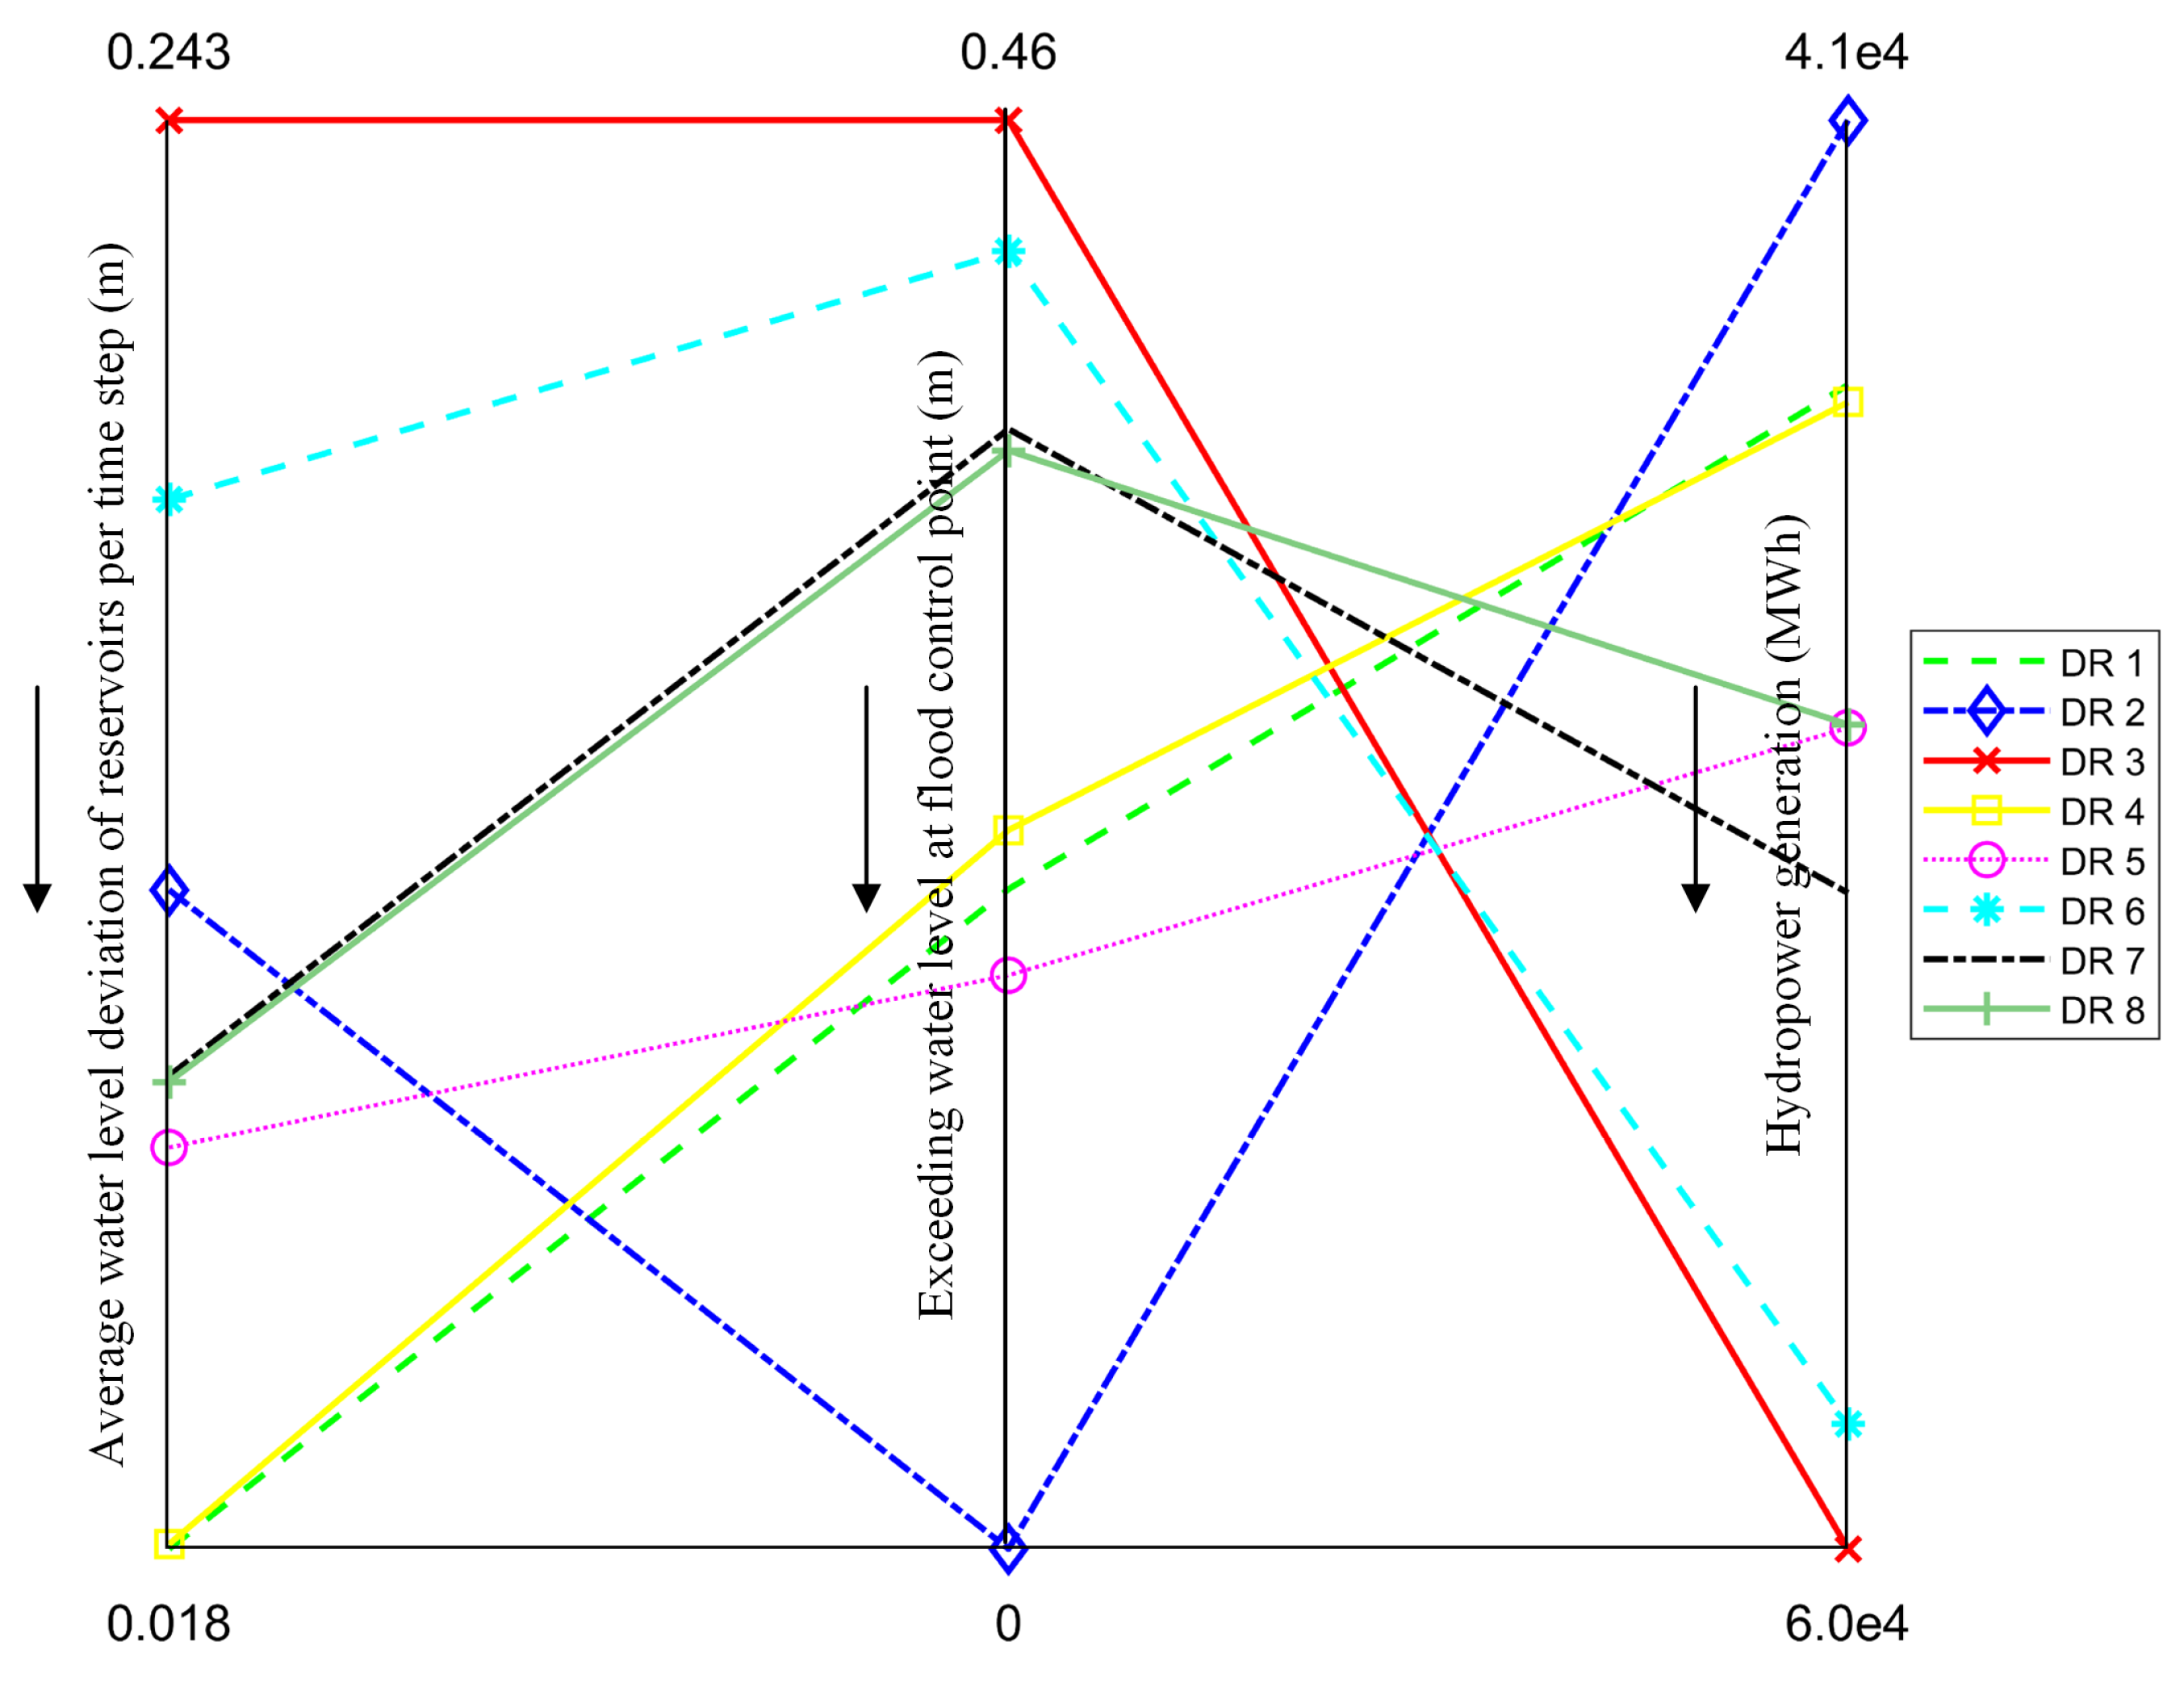
The parallel line visualization in Figure 8 helps the decision makers to clarify the differences between the eight decision rules. The overall performance of each decision rule is presented as a line crossing the vertical axes at the objective values of their corresponding performance. The objective values are shown with their minimum and maximum values and the axes are oriented so that the direction of preference is all downward. Compared to other decision rules, DR-1 has the lowest deviation to the target water levels in the reservoirs. DR-2 achieves the highest performance in flood control, while it has the lowest hydropower production. DR-3 has the highest performance in hydropower production, but has the lowest performance in water level deviation and flood control. DR-4, 5, and 6 clearly show that a high performance could be achieved by applying more weight to a particular objective. DR 7 and 8 show a similar performance in water level deviation and flood control, however, they lead to a small difference in hydropower production. In this way, the overall performance of each decision rule is presented to the decision-makers who can make a choice of a decision-making method based on their preferences.
4.4. Comparison of Results
Table 3 compares the results of the eight decision rules. Among them, DR-1, 2 and 4 have the overall performance greater than 70% compared to other decision rules. The results show that the improvement of storage reliability can certainly increase the flood risk, while a deficit occurs in hydropower production. On the other hand, flood risk could be eliminated by allowing deficits in storage volume and power generation. Similarly, reliability of meeting hydropower demand can be improved while degrading the performances of other objectives. The results provide a range of alternatives and help to realize the conflicting behavior in a reservoir system operation.
5. Discussion
In this section, we discuss the use of NSGA-II in MPC formulation, the selection of MCDM methods and the limitations of the proposed method.
5.1. The Use of GA in MPC Formulation
The main advantages of the MOMPC compared to the classical MPC are the ability to find the real-time Pareto optimal solutions and to make the preferred decision using one of the available MCDM methods. This creates more flexibility to solve multi-objective control problems. As mentioned in Section 1, other advantages of this approach are that NSGA-II can deal with non-linear, non-differentiable and non-continuous optimization problems.
5.2. Selection of a Decision-Making Method
Generally, a multi-objective optimization problem may have a number of alternative solutions. For making a decision, MCDM supports the decision-makers to choose the best alternative from a set of possible alternatives. In this study, we used the three MCDM methods to test our MOMPC approach. For the weighted-sum method, the weights are defined to reflect the relative importance of each objective. It is difficult to identify the relative weights when many stakeholders involve in the decision-making process. In this study, we did not emphasize to find the best weight combinations, but the different weight combinations were used to identify the trade-offs among the conflicting objectives. maximin and maxisum decision rules are also applicable to make a decision, however, the decision-maker’s preference lead for the selection of a MCDM method. For this purpose, the other decision-making methods, for example, TOPSIS, VIKOR and ELECTRE, could be applied in the MOMPC approach.
5.3. Limitations of the Method
The main drawback of MOMPC method is the computational efficiency compared to the classical MPC. The computational time required to find a solution was 100 s per optimization iteration using NSGA-II with 2.5 GHz Intel Core i5 processor 8G RAM computer compared to 6 s for the case using the interior point method with the same computer. Although the computational time of MOMPC is greater than the classical MPC, it is still applicable to use for real-time reservoir operation. However, further investigation is needed for more complex applications. In this study, we emphasize to solve a multi-objective control problem in a multi-reservoir system using the deterministic inflow forecasts. This can deteriorate the MPC performance in real world implementation. Nevertheless, note that this issue is beyond the scope of the current study. there are also specific methods to deal with uncertainty such as stochastic MPC [25,50], which could be applied to mitigate this issue.
6. Conclusions
A methodology combining MPC with GA was proposed for real-time operation of a multi-reservoir system. It has been demonstrated through the application to the Sittaung river basin that this approach is able to find the compromise solution for a multi-objective control problem. Another advantage is that the decision-makers can visually evaluate the trade-off solutions and the effects of different decision rules during model simulation. Moreover, this study presented the use of the weighted-sum, the maximin and the maxisum methods for the decision-making process. In this way, a parallel line plot can be built to support the decision-makers in the assessment of the overall system performance using the different MCDM methods. Thus, the decision-maker’s preference becomes explicit in the selection of a MCDM method. To illustrate our approach, three operational objectives are considered in the Sittaung reservoir system but many objectives may involve in other cases. Therefore, further testing and verification of the proposed methodology in other problems is still necessary. In addition, future research could use the ensemble forecast in MOMPC formulation [36,67] to address the inflow uncertainty.
Supplementary Materials
The following are available at https://www.mdpi.com/2073-4441/12/7/1898/s1, Internal model, Figure S1: Inflows to reservoirs, Figure S2: Reservoir water level under each decision rule.
Author Contributions
Conceptualization and methodology, N.M.L., X.T., M.R., E.A. and N.v.d.G.; software and formal analysis, N.M.L. and X.T.; original draft preparation, N.M.L.; review and editing, X.T., M.R., E.A., J.M.M. and N.v.d.G.; supervision, X.T., M.R., E.A. and N.v.d.G. All authors have read and agreed to the published version of the manuscript.
Funding
This research was funded by Shell International Exploration and Production B.V and the contract number is UI43981.
Acknowledgments
The authors gratefully acknowledge the Department of Irrigation and Water Utilization Management, Myanmar for providing data.
Conflicts of Interest
The authors declare no conflict of interest.
References
- Lehner, B.; Liermann, C.R.; Revenga, C.; Vörösmarty, C.; Fekete, B.; Crouzet, P.; Döll, P.; Endejan, M.; Frenken, K.; Magome, J.; et al. High-resolution mapping of the world’s reservoirs and dams for sustainable river-flow management. Front. Ecol. Environ. 2011, 9, 494–502. [Google Scholar] [CrossRef] [Green Version]
- World Commission on Large Dams. Dams and Development; Technical Report November; World Commission on Large Dams: London, UK, 2000. [Google Scholar]
- Castelletti, A.; Yajima, H.; Giuliani, M.; Soncini-Sessa, R.; Weber, E. Planning the Optimal Operation of a Multioutlet Water Reservoir with Water Quality and Quantity Targets. J. Water Resour. Plan. Manag. 2014, 140, 496–510. [Google Scholar] [CrossRef] [Green Version]
- Ehsani, N.; Vörösmarty, C.J.; Fekete, B.M.; Stakhiv, E.Z. Reservoir operations under climate change: Storage capacity options to mitigate risk. J. Hydrol. 2017, 555, 435–446. [Google Scholar] [CrossRef]
- Oliveira, R.; Loucks, D.P. Operating rules for multireservoir systems. Water Resour. Res. 1997, 33, 839–852. [Google Scholar] [CrossRef]
- Lund, J.R.; Ferreira, I. Operating Rule Optimization for Missouri River Reservoir System. J. Water Resour. Plan. Manag. 1996, 122, 287–295. [Google Scholar] [CrossRef]
- Tian, X.; van Overloop, P.J.; Negenborn, R.R.; van de Giesen, N. Operational flood control of a low-lying delta system using large time step Model Predictive Control. Adv. Water Resour. 2015, 75, 1–13. [Google Scholar] [CrossRef]
- Myo Lin, N.; Rutten, M.; Tian, X. Flood Mitigation through Optimal Operation of a Multi-Reservoir System by Using Model Predictive Control: A Case Study in Myanmar. Water 2018, 10, 1371. [Google Scholar] [CrossRef] [Green Version]
- Becker, L.; Yeh, W.W.G. Optimization of Real Time Operation of a Multiple-Reservoir System. Water Resour. Res. 1974, I, 1107–1112. [Google Scholar] [CrossRef]
- Needham, J.T.; Watkins, D.W., Jr.; Lund, J.R.; Nanda, S.K. Linear Programming for Flood Control in the Iowa and Des Moines Rivers. J. Water Resour. Plan. Manag. 2000, 126, 118–127. [Google Scholar] [CrossRef] [Green Version]
- Wei, C.C.; Hsu, N.S. Multireservoir real-time operations for flood control using balanced water level index method. J. Environ. Manag. 2008, 88, 1624–1639. [Google Scholar] [CrossRef]
- Li, X.; Wei, J.; Li, T.; Wang, G.; Yeh, W.W.G. A parallel dynamic programming algorithm for multi-reservoir system optimization. Adv. Water Resour. 2014, 67, 1–15. [Google Scholar] [CrossRef]
- Yeh, W.W.G. Reservoir Management and Operations Models: A State-of-the-Art Review. Water Resour. Res. 1985, 21, 1797–1818. [Google Scholar] [CrossRef]
- Castelletti, A.; Pianosi, F.; Soncini-Sessa, R. Water reservoir control under economic, social and environmental constraints. Automatica 2008, 44, 1595–1607. [Google Scholar] [CrossRef]
- Wasimi, A.A.; Kitanidis, P.K. Real-Time Forecasting and Daily Operation of a Multireservoir System During Floods by Linear Quadratic Gaussian Control. Water Resour. Res. 1983, 19, 1511–1522. [Google Scholar] [CrossRef]
- Cervellera, C.; Chen, V.C.P.; Wen, A. Optimization of a large-scale water reservoir network by stochastic dynamic programming with efficient state space discretization. Eur. J. Oper. Res. 2006, 171, 1139–1151. [Google Scholar] [CrossRef]
- Yeh, W.W.; Becker, L. Multiobjective analysis of multireservoir operations. Water Resour. Res. 1982, 18, 1326–1336. [Google Scholar] [CrossRef]
- Joshi, G.S.; Gupta, K. A simulation model for the operation of multipurpose multireservoir system for River Narmada, India. J. Hydro-Environ. Res. 2009, 3, 96–108. [Google Scholar] [CrossRef]
- Seibert, S.; Skublics, D.; Ehret, U. The potential of coordinated reservoir operation for flood mitigation in large basins—A case study on the Bavarian Danube using coupled hydrological–hydrodynamic models. J. Hydrol. 2014, 517, 1128–1144. [Google Scholar] [CrossRef]
- Sigvaldson, O.T. A simulation model for operating a multipurpose multireservoir system. Water Resour. Res. 1976, 12, 263–278. [Google Scholar] [CrossRef]
- Fayaed, S.S.; El-Shafie, A.; Jaafar, O. Reservoir-system simulation and optimization techniques. Stoch. Environ. Res. Risk Assess. 2013, 27, 1751–1772. [Google Scholar] [CrossRef]
- Lin, N.M.; Rutten, M. Optimal Operation of a Network of Multi-purpose Reservoir: A Review. Procedia Eng. 2016, 154, 1376–1384. [Google Scholar] [CrossRef] [Green Version]
- Ngo, L.L.; Madsen, H.; Rosbjerg, D. Simulation and optimisation modelling approach for operation of the Hoa Binh reservoir, Vietnam. J. Hydrol. 2007, 336, 269–281. [Google Scholar] [CrossRef]
- Abou Rjeily, Y.; Abbas, O.; Sadek, M.; Shahrour, I.; Hage Chehade, F. Model Predictive Control for optimising the operation of Urban Drainage Systems. J. Hydrol. 2018, 566, 558–565. [Google Scholar] [CrossRef]
- Maestre, J.M.; Raso, L.; Overloop, P.J.V.; Schutter, B.D. Distributed tree-based model predictive control on a drainage water system. J. Hydroinform. 2013, 15, 335–347. [Google Scholar] [CrossRef]
- van Overloop, P.J.; Clemmens, A.J.; Strand, R.J.; Wagemaker, R.M.J.; Bautista, E. Real-Time Implementation of Model Predictive Control on Maricopa-Stanfield Irrigation and Drainage District’s WM Canal. J. Irrig. Drain. Eng. 2010, 136, 747–756. [Google Scholar] [CrossRef]
- Sankar, G.S.; Mohan Kumar, S.; Narasimhan, S.; Narasimhan, S.; Murty Bhallamudi, S. Optimal control of water distribution networks with storage facilities. J. Process. Control. 2015. [Google Scholar] [CrossRef]
- García, C.E.; Prett, D.M.; Morari, M. Model predictive control: Theory and practice—A survey. Automatica 1989, 25, 335–348. [Google Scholar] [CrossRef]
- van Overloop, P.J. Model Predictive Control on Open Water Systems. Ph.D. Thesis, Delft University of Technology, Delft, The Netherlands, 2006. [Google Scholar]
- Camacho, E.F.; Bordons, C. Model Predictive Control; Advanced Textbooks in Control and Signal Processing; Springer: London, UK, 2007. [Google Scholar]
- Delgoda, D.K.; Saleem, S.K.; Halgamuge, M.N.; Malano, H. Multiple Model Predictive Flood Control in Regulated River Systems with Uncertain Inflows. Water Resour. Manag. 2013, 27, 765–790. [Google Scholar] [CrossRef]
- Ficchì, A.; Raso, L.; Dorchies, D.; Pianosi, F.; Malaterre, P.; van Overloop, P.J. Optimal Operation of the Multireservoir System in the Seine River Basin Using Deterministic and Ensemble Forecasts. J. Water Resour. Plan. Manag. 2016, 7, 1–12. [Google Scholar] [CrossRef] [Green Version]
- Galelli, S.; Goedbloed, A.; Schwanenberg, D.; van Overloop, P.J. Optimal Real-Time Operation of Multipurpose Urban Reservoirs: Case Study in Singapore. J. Water Resour. Plan. Manag. 2014, 140, 511–523. [Google Scholar] [CrossRef]
- Raso, L.; Malaterre, P.O. Combining Short-Term and Long-Term Reservoir Operation Using Infinite Horizon Model Predictive Control. J. Irrig. Drain. Eng. 2017, 143, B4016002. [Google Scholar] [CrossRef] [Green Version]
- Raso, L.; Schwanenberg, D.; van de Giesen, N.; van Overloop, P. Short-term optimal operation of water systems using ensemble forecasts. Adv. Water Resour. 2014, 71, 200–208. [Google Scholar] [CrossRef]
- Tian, X.; Negenborn, R.R.; van Overloop, P.J.; María Maestre, J.; Sadowska, A.; van de Giesen, N. Efficient multi-scenario Model Predictive Control for water resources management with ensemble streamflow forecasts. Adv. Water Resour. 2017, 109, 58–68. [Google Scholar] [CrossRef]
- Uysal, G.; Alvarado-Montero, R.; Schwanenberg, D.; Şensoy, A. Real-Time Flood Control by Tree-Based Model Predictive Control Including Forecast Uncertainty: A Case Study Reservoir in Turkey. Water 2018, 10, 340. [Google Scholar] [CrossRef] [Green Version]
- Schwanenberg, D.; Fan, F.M.; Naumann, S.; Kuwajima, J.I.; Montero, R.A.; Assis dos Reis, A. Short-Term Reservoir Optimization for Flood Mitigation under Meteorological and Hydrological Forecast Uncertainty. Water Resour. Manag. 2015, 29, 1635–1651. [Google Scholar] [CrossRef] [Green Version]
- Deb, K. Multi-Objective Optimization; Springer: Boston, MA, USA, 2014; pp. 403–449. [Google Scholar] [CrossRef]
- Reed, P.; Hadka, D.; Herman, J.; Kasprzyk, J.; Kollat, J. Evolutionary multiobjective optimization in water resources: The past, present, and future. Adv. Water Resour. 2013, 51, 438–456. [Google Scholar] [CrossRef] [Green Version]
- Nicklow, J.; Reed, P.; Savic, D.; Dessalegne, T.; Harrell, L.; Chan-Hilton, A.; Karamouz, M.; Minsker, B.; Ostfeld, A.; Singh, A.; et al. State of the Art for Genetic Algorithms and Beyond in Water Resources Planning and Management. J. Water Resour. Plan. Manag. 2010, 136, 412–432. [Google Scholar] [CrossRef]
- Reddy, M.J.; Kumar, D.N. Optimal Reservoir Operation Using Multi-Objective Evolutionary Algorithm. Water Resour. Manag. 2006, 20, 861–878. [Google Scholar] [CrossRef] [Green Version]
- Fu, G.; Kapelan, Z.; Kasprzyk, J.R.; Reed, P. Optimal Design of Water Distribution Systems Using Many-Objective Visual Analytics. J. Water Resour. Plan. Manag. 2013, 139, 624–633. [Google Scholar] [CrossRef] [Green Version]
- Reed, P.M.; Kollat, J.B. Visual analytics clarify the scalability and effectiveness of massively parallel many-objective optimization: A groundwater monitoring design example. Adv. Water Resour. 2013, 56, 1–13. [Google Scholar] [CrossRef] [Green Version]
- Kasprzyk, J.R.; Nataraj, S.; Reed, P.M.; Lempert, R.J. Many objective robust decision making for complex environmental systems undergoing change. Environ. Model. Softw. 2013, 42, 55–71. [Google Scholar] [CrossRef]
- Guo, Y.; Tian, X.; Fang, G.; Xu, Y.P. Many-objective optimization with improved shuffled frog leaping algorithm for inter-basin water transfers. Adv. Water Resour. 2020, 138. [Google Scholar] [CrossRef]
- Núñez, A.; Cortés, C.E.; Sáez, D.; De Schutter, B.; Gendreau, M. Multiobjective model predictive control for dynamic pickup and delivery problems. Control. Eng. Pract. 2014, 32, 73–86. [Google Scholar] [CrossRef]
- Chiang, P.K.; Willems, P. Combine Evolutionary Optimization with Model Predictive Control in Real-time Flood Control of a River System. Water Resour. Manag. 2015, 29, 2527–2542. [Google Scholar] [CrossRef]
- Vermuyten, E.; Meert, P.; Wolfs, V.; Willems, P. Combining Model Predictive Control with a Reduced Genetic Algorithm for Real-Time Flood Control. J. Water Resour. Plan. Manag. 2018, 144, 04017083. [Google Scholar] [CrossRef]
- Tian, X.; Guo, Y.; Negenborn, R.R.; Wei, L.; Lin, N.M.; Maestre, J.M. Multi-Scenario Model Predictive Control Based on Genetic Algorithms for Level Regulation of Open Water Systems under Ensemble Forecasts. Water Resour. Manag. 2019, 33, 3025–3040. [Google Scholar] [CrossRef]
- Deb, K.; Pratap, A.; Agarwal, S.; Meyarivan, T. A fast and elitist multiobjective genetic algorithm: NSGA-II. IEEE Trans. Evol. Comput. 2002, 6, 182–197. [Google Scholar] [CrossRef] [Green Version]
- Morari, M.; Lee, J.H. Model predictive control: Past, present and future. Comput. Chem. Eng. 1999, 23, 667–682. [Google Scholar] [CrossRef]
- Kumar, A.; Sah, B.; Singh, A.R.; Deng, Y.; He, X.; Kumar, P.; Bansal, R. A review of multi criteria decision making (MCDM) towards sustainable renewable energy development. Renew. Sustain. Energy Rev. 2017, 69, 596–609. [Google Scholar] [CrossRef]
- Chow, V.T. Open-Channel Hydraulics; McGraw-Hill Book Company, Inc.: New York, NY, USA, 1959. [Google Scholar]
- van Overloop, P.J. Drainage control in water management of polders in the Netherlands. Irrig. Drain. Syst. 2006, 20, 99–109. [Google Scholar] [CrossRef]
- Breckpot, M.; Agudelo, O.; Moor, B.D. Flood Control with Model Predictive Control for River Systems with Water Reservoirs. J. Irrig. Drain. Eng. 2013, 139, 532–541. [Google Scholar] [CrossRef]
- Xu, M.; van Overloop, P.; van de Giesen, N. On the study of control effectiveness and computational efficiency of reduced Saint-Venant model in model predictive control of open channel flow. Adv. Water Resour. 2011, 34, 282–290. [Google Scholar] [CrossRef]
- Xu, M.; Negenborn, R.; van Overloop, P.; van de Giesen, N. De Saint-Venant equations-based model assessment in model predictive control of open channel flow. Adv. Water Resour. 2012, 49, 37–45. [Google Scholar] [CrossRef]
- Tian, X. Model Predictive Control for Operational Water Management: A Case Study of the Dutch Water System. Ph.D. Thesis, Delft University of Technology, Delft, The Netherlands, 2015. [Google Scholar]
- Xu, M. Real-Time Control of Combined Water Quantity & Quality in Open Channels. Ph.D. Thesis, Delft University of Technology, Delft, The Netherlands, 2013. [Google Scholar]
- Stelling, G.S.; Duinmeijer, S.P.A. A staggered conservative scheme for every Froude number in rapidly varied shallow water flows. Int. J. Numer. Method Fluids 2003, 1354, 1329–1354. [Google Scholar] [CrossRef]
- Marler, R.; Arora, J. Survey of multi-objective optimization methods for engineering. Struct. Multidiscip. Optim. 2004, 26, 369–395. [Google Scholar] [CrossRef]
- Giuliani, M.; Castelletti, A. Is robustness really robust? How different definitions of robustness impact decision-making under climate change. Clim. Chang. 2016, 135, 409–424. [Google Scholar] [CrossRef]
- McMahon, T.A.; Adeloye, A.J.; Zhou, S.L. Understanding performance measures of reservoirs. J. Hydrol. 2006, 324, 359–382. [Google Scholar] [CrossRef]
- Zatarain Salazar, J.; Reed, P.M.; Quinn, J.D.; Giuliani, M.; Castelletti, A. Balancing exploration, uncertainty and computational demands in many objective reservoir optimization. Adv. Water Resour. 2017, 109, 196–210. [Google Scholar] [CrossRef]
- Deltares. SOBEK 2.15 User Manual; Technical Report; Deltares: Delft, The Netherlands, 2016. [Google Scholar]
- Raso, L. Optimal Control of Water Systems Under Forecast Uncertainty. Ph.D. Thesis, Delft University of Technology, Delft, The Netherlands, 2013. [Google Scholar]
Figure 1.
Flowchart of Multi-Objective Model Predictive Control.

Figure 2.
Sittaung river basin (locations of reservoirs are represented with the red diamonds and a flood control point (Taungoo city) is shown with a green dot.).
Figure 2.
Sittaung river basin (locations of reservoirs are represented with the red diamonds and a flood control point (Taungoo city) is shown with a green dot.).

Figure 3.
(a–c) Two dimensional Pareto front and selected solutions using different decision criteria, (d) Three dimensional Pareto front and selected solutions using different decision criteria (The objective costs are normalized and the black arrows indicate the direction of increasing preference of each objective.The circle’s size and colour indicate performance of each alternative in terms of all objective).

Figure 4.
(a–c) Two dimensional Pareto front and selected solutions using different decision criteria, (d) Three dimensional Pareto front and selected solutions using different decision criteria (The objective costs are normalized and the black arrows indicate the direction of increasing preference of each objective. The circle’s size and colour indicate performance of each alternative in terms of all objective).

Figure 5.
(a–d) Inflows, outflows and water levels of reservoirs 1 (a), 4 (b), 8 (c) and 9 (d) under DR-1.
Figure 5.
(a–d) Inflows, outflows and water levels of reservoirs 1 (a), 4 (b), 8 (c) and 9 (d) under DR-1.

Figure 6.
Water level at the downstream control point.

Figure 7.
(a–c) Total generated hydropower under DR 1 (a), 2 (b) and 3 (c).

Figure 8.
Parallel line plot for the eight decision rules(Each line represents the overall performance of the three objectives with respect to a particular decision rule and the black arrows indicate the direction of good preference.).
Figure 8.
Parallel line plot for the eight decision rules(Each line represents the overall performance of the three objectives with respect to a particular decision rule and the black arrows indicate the direction of good preference.).


Table 1.
Parameters of NSGA-II.
| NSGA-II Parameters | Setting Value |
|---|---|
| Population size | 200 |
| Maximum number of generations in each run | 1000 |
| Crossover rate | 0.80 |
| Mutation rate | 0.35 |
| Stopping criteria | 1. The average change in the spread of the Pareto front over generation (=100) is less than or equal to function tolerance (. |
| 2. The maximum number of generations is reached. |
Table 2.
Decision rules used in this study.
| Decision Rule | Method | w |
|---|---|---|
| DR-1 | weighted-sum | [1,0,0] |
| DR-2 | weighted-sum | [0,1,0] |
| DR-3 | weighted-sum | [0,0,1] |
| DR-4 | weighted-sum | [0.6,0.2,0.2] |
| DR-5 | weighted-sum | [0.2,0.6,0.2] |
| DR-6 | weighted-sum | [0.2,0.2,0.6] |
| DR-7 | maximin | - |
| DR-8 | maxisum | - |
Table 3.
Performances of the system under alternative operating rules.
| Decision Rule (Weight) | Indicator | Overall Performance (Average) | ||
|---|---|---|---|---|
| Reliability of Meeting Storage Capacity V (%) | Reliability of Meeting Flood Control E (%) | Reliability of Maximizing Hydropower Generation P (%) | ||
| DR-1 (1,0,0) | 93 | 54 | 74 | 74 |
| DR-2 (0,1,0) | 50 | 100 | 68 | 73 |
| DR-3 (0,0,1) | 0 | 0 | 100 | 33 |
| DR-4 (0.6.0.2.0.2) | 92 | 50 | 74 | 72 |
| DR-5 (0.2,0.6.0.2) | 67 | 60 | 82 | 69 |
| DR-6 (0.2,0.2,0.6) | 25 | 9 | 97 | 44 |
| DR-7 | 62 | 22 | 85 | 56 |
| DR-8 | 62 | 23 | 82 | 56 |
© 2020 by the authors. Licensee MDPI, Basel, Switzerland. This article is an open access article distributed under the terms and conditions of the Creative Commons Attribution (CC BY) license (http://creativecommons.org/licenses/by/4.0/).
Share and Cite
MDPI and ACS Style
Myo Lin, N.; Tian, X.; Rutten, M.; Abraham, E.; Maestre, J.M.; van de Giesen, N. Multi-Objective Model Predictive Control for Real-Time Operation of a Multi-Reservoir System. Water 2020, 12, 1898. https://doi.org/10.3390/w12071898
AMA Style
Myo Lin N, Tian X, Rutten M, Abraham E, Maestre JM, van de Giesen N. Multi-Objective Model Predictive Control for Real-Time Operation of a Multi-Reservoir System. Water. 2020; 12(7):1898. https://doi.org/10.3390/w12071898
Chicago/Turabian StyleMyo Lin, Nay, Xin Tian, Martine Rutten, Edo Abraham, José M. Maestre, and Nick van de Giesen. 2020. "Multi-Objective Model Predictive Control for Real-Time Operation of a Multi-Reservoir System" Water 12, no. 7: 1898. https://doi.org/10.3390/w12071898
Note that from the first issue of 2016, this journal uses article numbers instead of page numbers. See further details here.