Article

Rapid Sampling of Suspended and Floating Microplastics in Challenging Riverine and Coastal Water Environments in Japan

1
Graduate School of Environmental and Information Studies, Tokyo City University, Tsuzuki Ward, Yokohama, Kanagawa 224-0015, Japan
2
Pirika Inc., 1 Chome-7-2, Ebisu, Shibuya City, Tokyo 150-6018, Japan
3
Department of Civil Engineering, Faculty of Science and Technology, Tokyo University of Science, Chiba 278-8510, Japan
*
Author to whom correspondence should be addressed.
Water 2020, 12(7), 1903; https://doi.org/10.3390/w12071903
Submission received: 30 May 2020 / Revised: 23 June 2020 / Accepted: 30 June 2020 / Published: 3 July 2020
(This article belongs to the Special Issue Microplastics in Aquatic Environments and Wastewater Treatment )

Abstract

:
Environmental sampling plays an important role in quantitative and qualitative investigation of plastic pollution. Rivers are a major source, carrying plastic litter into the oceans. Microplastic sampling in riverine and coastal environments is often a challenging task due to limited access, time taken, costs, human resources, etc. Our present study evaluated the performance of newly developed sampling devices (Albatross Mark 5 and 6 (AM-5 and AM-6)) that were suitable to collect floating and suspended microplastic samples in challenging freshwater and coastal environments (95 locations). Our observations indicated a similar magnitude of microplastic concentrations with AM-5 and AM-6 sampling compared to conventional plankton nets. The sampling duration, originally 10–60 min (by plankton net), was reduced to 3 min (AM-5 and AM-6) for sampling water volumes of approximately 10 m3. The developed AM-6 device was used to collect samples from riverine and coastal environments in Japan. The microplastic particle polymer composition (using Fourier transform infrared spectrophotometry (FT-IR)), size, and shape (microscopic images) were investigated. The observations showed a statistically significant particle size reduction from the riverine to coastal areas. The dominant polymer types detected were polyethylene (PE) and polypropylene (PP). The observations were complied with the coastal microplastic observations that were reported for previous studies in Japanese water environments.

Graphical Abstract

1. Introduction

Aquatic plastic pollution is considered to be one of the most challenging global environmental issues. The longevity of plastic is estimated to be hundreds to thousands of years. Hence, the plastics released into the environment will remain for hundreds of years [1]. The adverse effects of plastic litter in the environment have been widely discussed in the literature [2,3]. Plastic contaminants in freshwater are a threat to the ecosystem and a potential health hazard to humans [4,5,6]. Apart from that, freshwater resources (i.e., rivers) carry plastic litter into marine environments. Then, local and regional plastic pollution become a global concern. Besides, rivers are considered to be a primary contamination pathway of microplastics to reach the oceans. It is estimated that between 1.15 and 2.41 million tons of plastic waste currently enters the ocean every year from rivers [7]. According to Schmidt et al. [8], 80–90% of plastic that reaches oceans comes from rivers. Major sources of the marine plastic litter that is transported through rivers originate from improper waste management practices, wastewater treatment plant effluent, and inland transportation related activities [9]. Due to the long half-life of plastic polymers, the plastic concentration in oceans is increasing. It is predicted that, within the next 50 years, in some oceanic regions, the microplastic concentrations will exceed 1 g/m3 [10]. Thus, further research on plastic litter in riverine environments is important to mitigate the aquatic (both freshwater and marine) plastic pollution.
Based on size, plastics are categorized into macro- (>25 mm), meso- (25–5 mm), micro- (5 mm–0.1 μm), and nano-plastics (<0.1 μm) [11]. Microplastics are divided into two categories, primary and secondary, based on the origin. Primary microplastics enter the environment directly as microplastics. Secondary microplastics derive from the breakdown of larger plastics in the environment [12]. The environmental degradation of plastic is governed by a synergic effect of photo- and thermo-oxidative degradation, abrasion, and biological activities [1,13].
Microplastics in a riverine environment can be sub-categorized into several groups, such as floating plastic, suspended plastic, plastic on the riverbed, plastic in the sediment, and plastics in biota [14]. This depends on the hydraulics of the waterbody and properties of plastic, such as composition, specific gravity (SG), and shape [15]. Plastic particles change in size and SG by degradation, aggregation, or by the growth of biofilms [16], and flow turbulences move these particles through inter- and intra-river sub-compartments.
Considering the SG range of various plastic polymers, floating and suspended plastics are dominated by polyethylene (PE) and polypropylene (PP) due to the lower specific gravities. Moreover, PE and PP are the highest released plastic polymers from land-based sources to the environment [9]. However, as mentioned previously, due to river flow currents and the association with air bubbles, biofilms, etc., higher SG polymer microplastics could also exist in riverine environments as suspended or floating particles.
Quantitative information of microplastics in freshwater and coastal water environments is useful for a number of applications, including plastic litter fate assessments [10] and risk assessment studies [17]. Environmental sampling plays an important role in assessing the plastic concentration in aquatic environments. Several studies have been conducted to quantify microplastic contamination in riverine environments [7,18].
Essentially, there are two types of sampling for marine and freshwater environments, grab samples of smaller volumes and on-site filtration sampling with comparatively large volumes. Grab sampling is mostly focused on sediment sampling; however, some studies focused on floating and suspended microplastics sampling [19,20]. The onsite filtration sampling of floating and suspended microplastics can be subdivided into several methods based on the kind of devices used. Simple plankton nets (also referred to as manta nets) with mesh opening sizes about 100 and 300 µm comprised the basic method used by many researchers [21,22,23]. Often, plankton net sampling requires supporting infrastructure, such as a trawl/boat or, in the case of river sampling, a bridge or a solid riverbank. Sometimes, the water body is not deep enough to be sampled using a boat, and the filtered quantity cannot be measured accurately [24]. Furthermore, the filtered volume estimation in microplastic sampling with trawling net method often uses the boat speed and the opening area of the net [21,22,23]. The lack of accuracy of this sample volume calculation effects the expressed concentration. Additionally, sampling with nets (suspended from a bridge) using the natural river flow takes long durations [25]. Hence, the lack of standard methods for sampling, concentration calculation, and reporting make comparison difficult. For example, if coastal and riverine sampling methods are different and affect the accuracy of observations differently, the comparison of observations is less meaningful. Therefore, development of a method suitable for multiple environmental conditions is required.
Several studies focused on pumping followed by a filtration method for sampling in rivers. In this case, water is pumped out of the river, and then the water is filtered through a series of filters [24]. The complexity of submerged pumps, lower pump flowrates, the difficulties of using the bridges, and a large amount of equipment to carry are restrictions for wide applications of this method. However, Li et al. [26] reported a suction pump coupled with a submerged net acting as an in-situ filtration tray, which is different in the structure of the previously reported studies. The sampling methods and the devices are evolving, as riverine and coastal environments are diverse. There are challenging field situations and various objectives of sampling. As highlighted previously, riverine environments are more diversified, and applications of simple trawling-based methods are limited. Whereas, in marine environments, both trawling and pumping based methods are applicable. However, in coastal environments including ports and bays, there are limitations of trawling. Additionally, microplastics have various compositions (polymer, color, shape, etc. [27]). Hence, to obtain representative environmental samples, a larger volume needs to be filtered. However, the bridge suspended nets with natural environmental flow require longer durations (especially when the river flow velocities are low), and in the tidal backflow influential zones, the mounted nets are inapplicable for proper functioning [25]. Hence, considering the applicability in the field and the uniformity of the observations, we would like to emphasize the studies focusing on the development of microplastic sampling devices.
Microplastic sampling in many freshwater locations faces challenging conditions, such as access limitations, restricted budget, a lack of human resources, and time limitations. Riverine and coastal samplings are subjected to time limitations due to several reasons. For instance, urban waterways with boat/freight traffic sampling devices suspended from the bridges cannot remain unattained. There is a need for a reliable, easy, time saving, and affordable sample collection method to expand the microplastic related information in water environments. With the objectives of developing a pragmatic rapid sampling process applicable in both freshwater and coastal areas, we compared a developed sampling device with a conventional sampling plankton net. This developed method was tested under several conditions to determine the suitability for environmental sampling. Then, the collected samples were purified and analyzed to determine the particle size distribution and the polymer composition of the collected microplastics.

2. Materials and Methods

To collect microplastics in challenging riverine and coastal water environments, the microplastic sampling device “Albatross” was developed. The development of “Albatross” sampling device was conducted under a project initiated in 2015. A series of testing and device modifications were conducted in Japanese riverine and coastal water environments. This history and additional information can be accessed at https://en.plastic.research.pirika.org/. The performances of the two latest versions of this sampling device (Albatross Mark 5 (AM-5) and Albatross Mark 6 (AM-6)) were compared to a conventional plankton net (or manta net). Previous studies reported both terms, manta net and plankton net, which refer to a similar device in terms of microplastic sampling studies. Hereafter, in this manuscript, the term plankton net is used for uniformity. The initial step of the study focused on the comparison of these three devices in riverine environments to collect floating and suspended microplastics (mesh sizes 100 and 300 µm with all three sampling devices). The second step focused on microplastic sampling in Japanese riverine and coastal water environments with the AM-6 (mesh size 300 µm). In a considerable amount of the sampling locations, it was challenging to collect samples using conventional sampling methods (i.e., bridge suspended nets and trawling nets). These challenging field conditions included limited riverbank access due to constructions, height from the bridge to the river surface over 10 m, tidal flow influenced zones, limited access from boats due to shallowness or security reasons, etc. (Supplementary Material Figure S1 provides a few examples for sampling locations).

2.1. Sampling Process

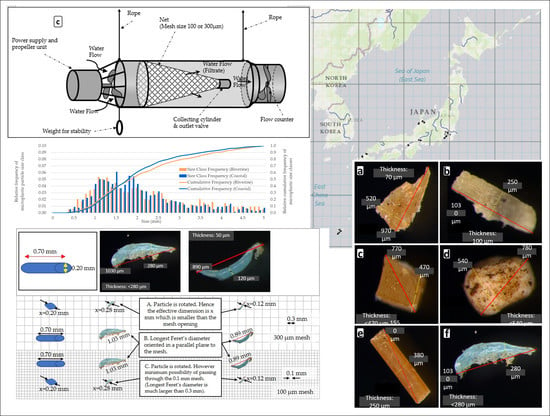
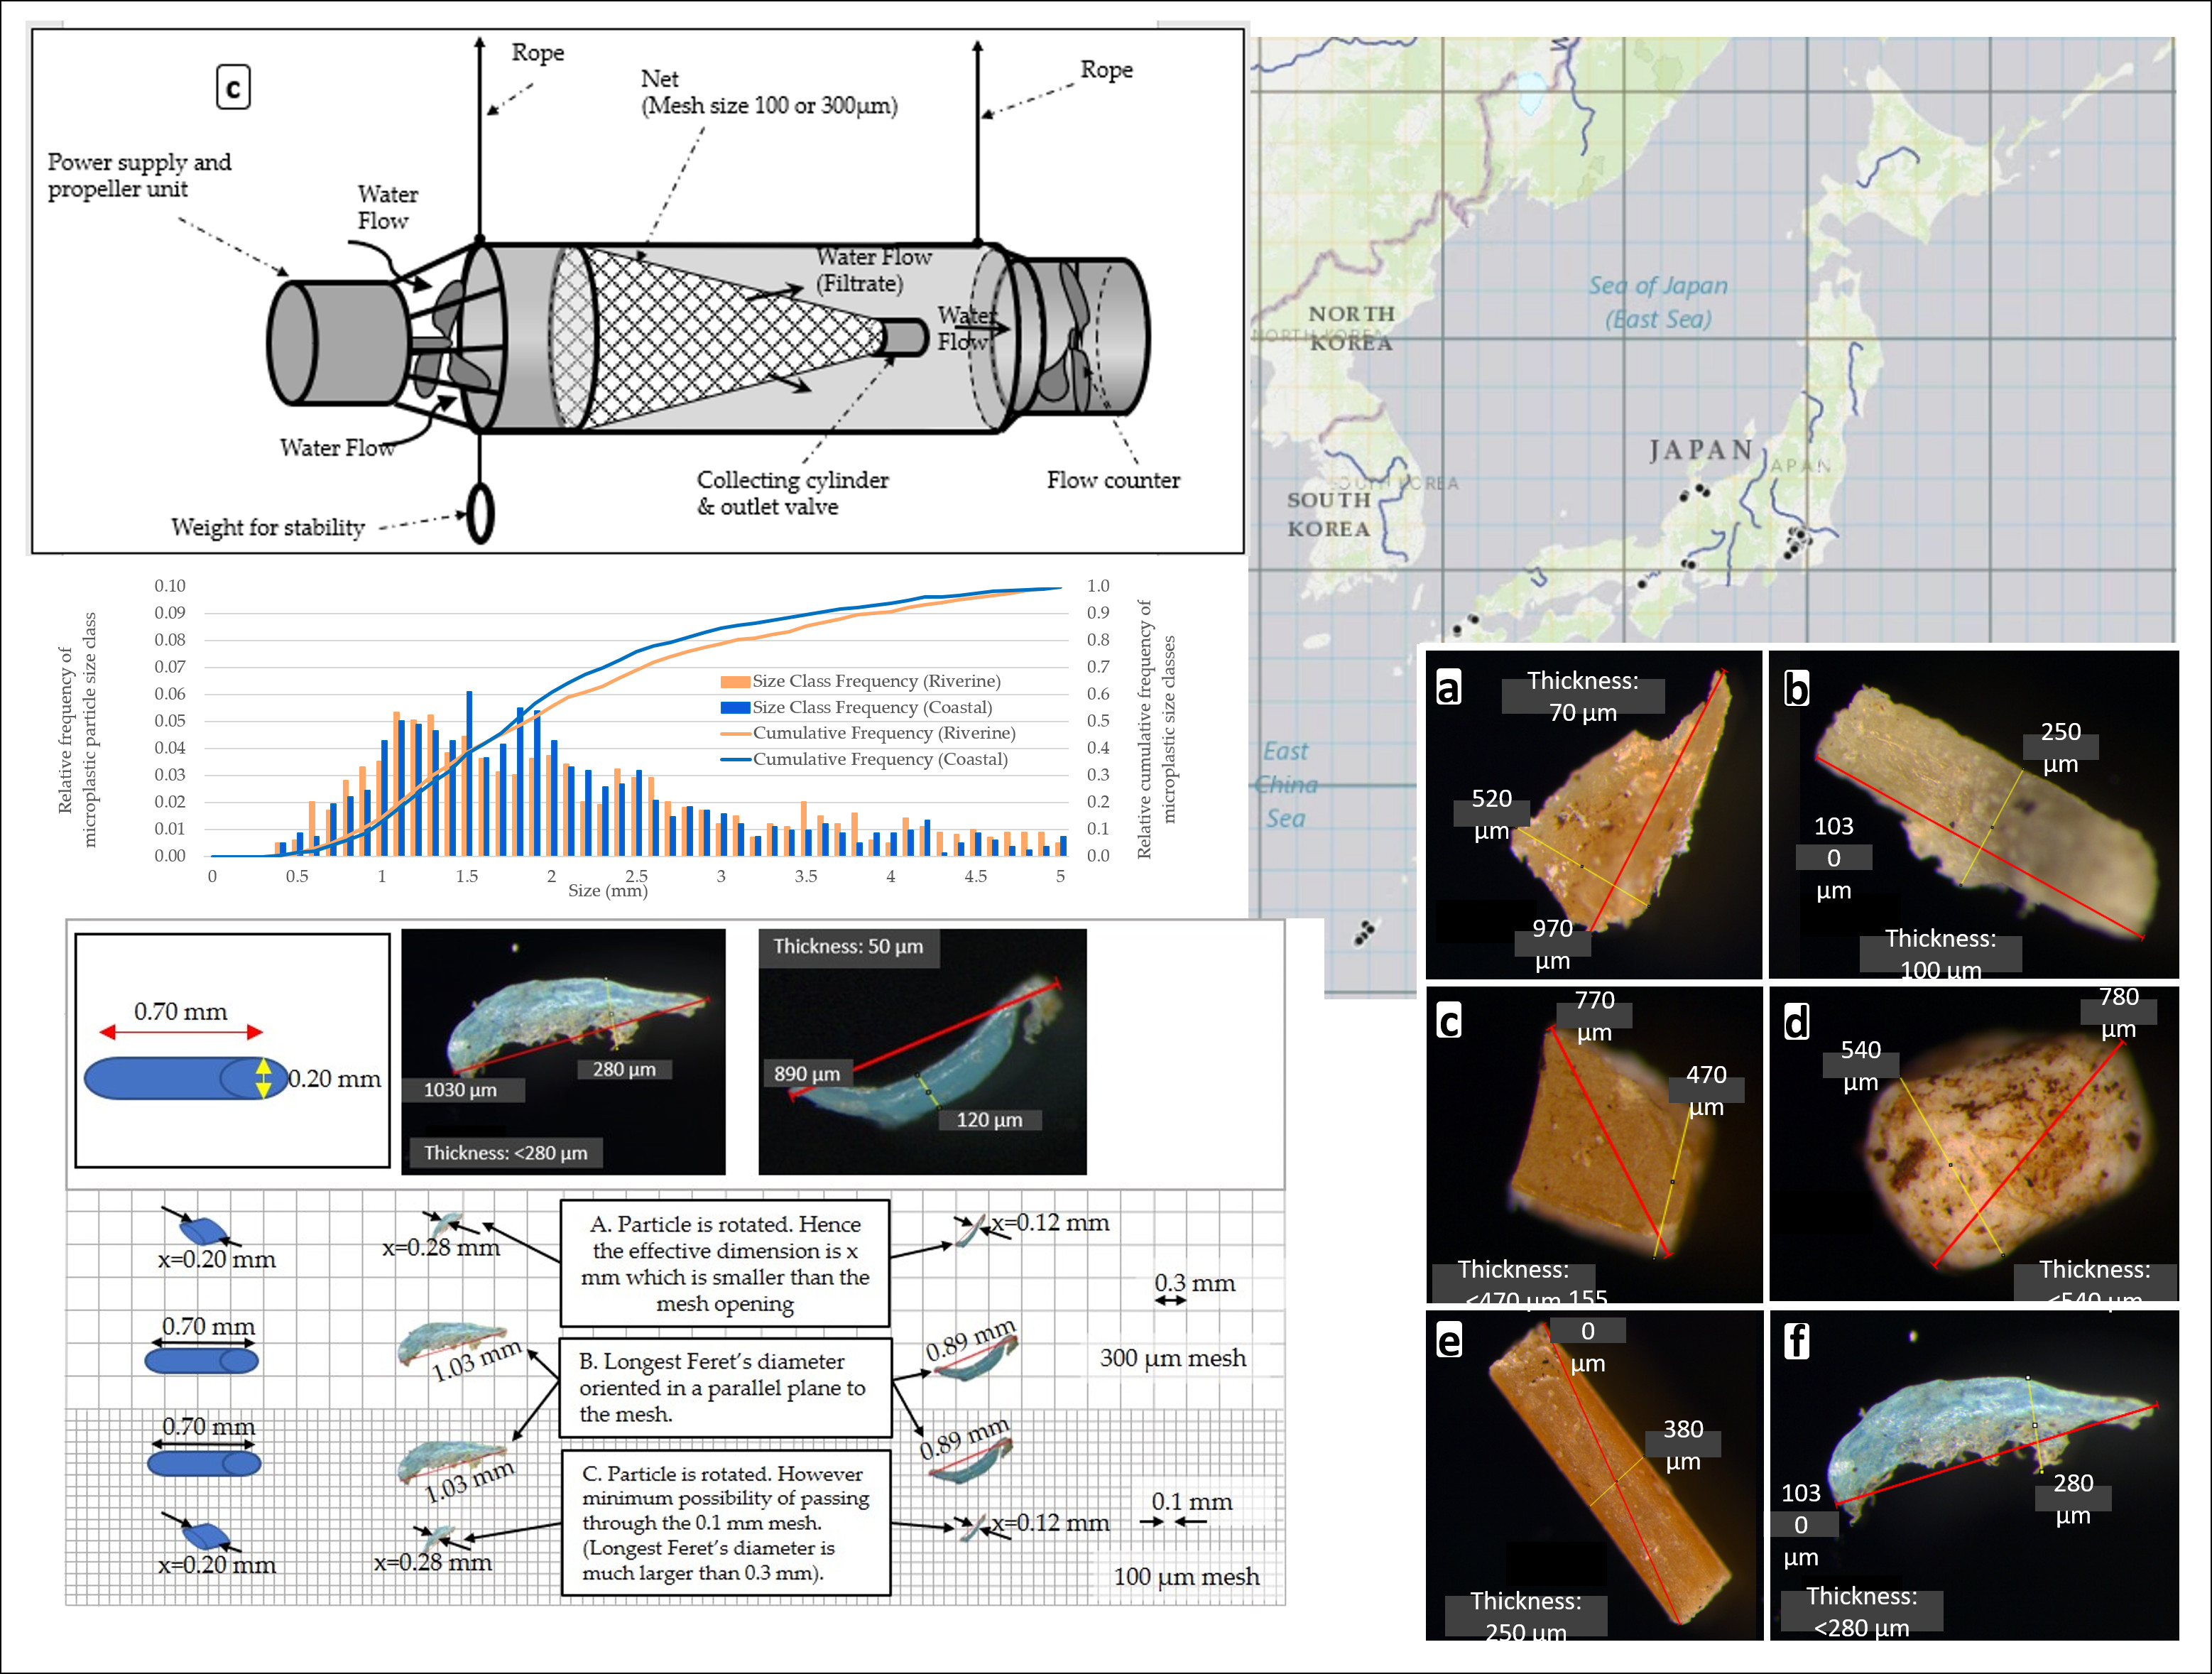
2.1.1. Sampling Devices

AM-5 and AM-6 are microplastic sampling devices developed by Pirika Inc (Tokyo, Japan). Figure 1b,c illustrate the basic components of AM-5 and AM-6. AM-5 consists of a plankton net with a mouth diameter of 24 cm (length 750 cm). A submersible waterproof power supply unit with a propeller (RDS200, Yamaha, Japan) pumped water into the net. A flow counter (GO-2030 R6, General Oceanics, Miami, FL, US) recorded the number of rotations. The filtered volume was calculated using Equation (1). The plankton net filtered the water and retained the particles larger than the mesh openings.
In AM-6, the flow counter was moved to the back of the plankton net. An additional tube was introduced to collect the water passing through the net. This tube governed the water through the flow counter. The impeller diameter of the flow counter (GO-2030 R6, General Oceanics, Miami, FL, US) was set up to be the same as the diameter of the end of the tube (18 cm). Hence, the total flow in the tube was influenced by the counter reading in AM-6, whereas in AM-5, the central flow was mainly counted at the front end of the net. The filtered volume of the AM-6 was calculated using Equation (1). The bridge suspended plankton net (BS-PN) components are illustrated in Figure 1a. In the case of BS-PN, the plankton net was hung on the bridge over the water stream with the intention of fully submerging near the surface of the river, as described in detail in Kataoka et al. [25]. The weights hung in each device were to provide stability during the operation (i.e., to keep the device submerged and to reduce unintentional movements with high flow currents). Both AM-5 and AM-6 were operated for approximately 3 min during this study. However, during the initial optimization period, AM-5 and AM-6 were operated for variable durations from 2 min to 8 min. Yet, considering sample collection duration, battery life, and mesh clogging factors, the suitable operational duration was selected as 3 min. Thus, a 3 min sampling time was applied during this study. Sampling duration of BS-PN was kept between 5 and 90 min. First, the river flow rate was measured, and then the sampling duration was decided to collect an approximate volume of 10 m3.

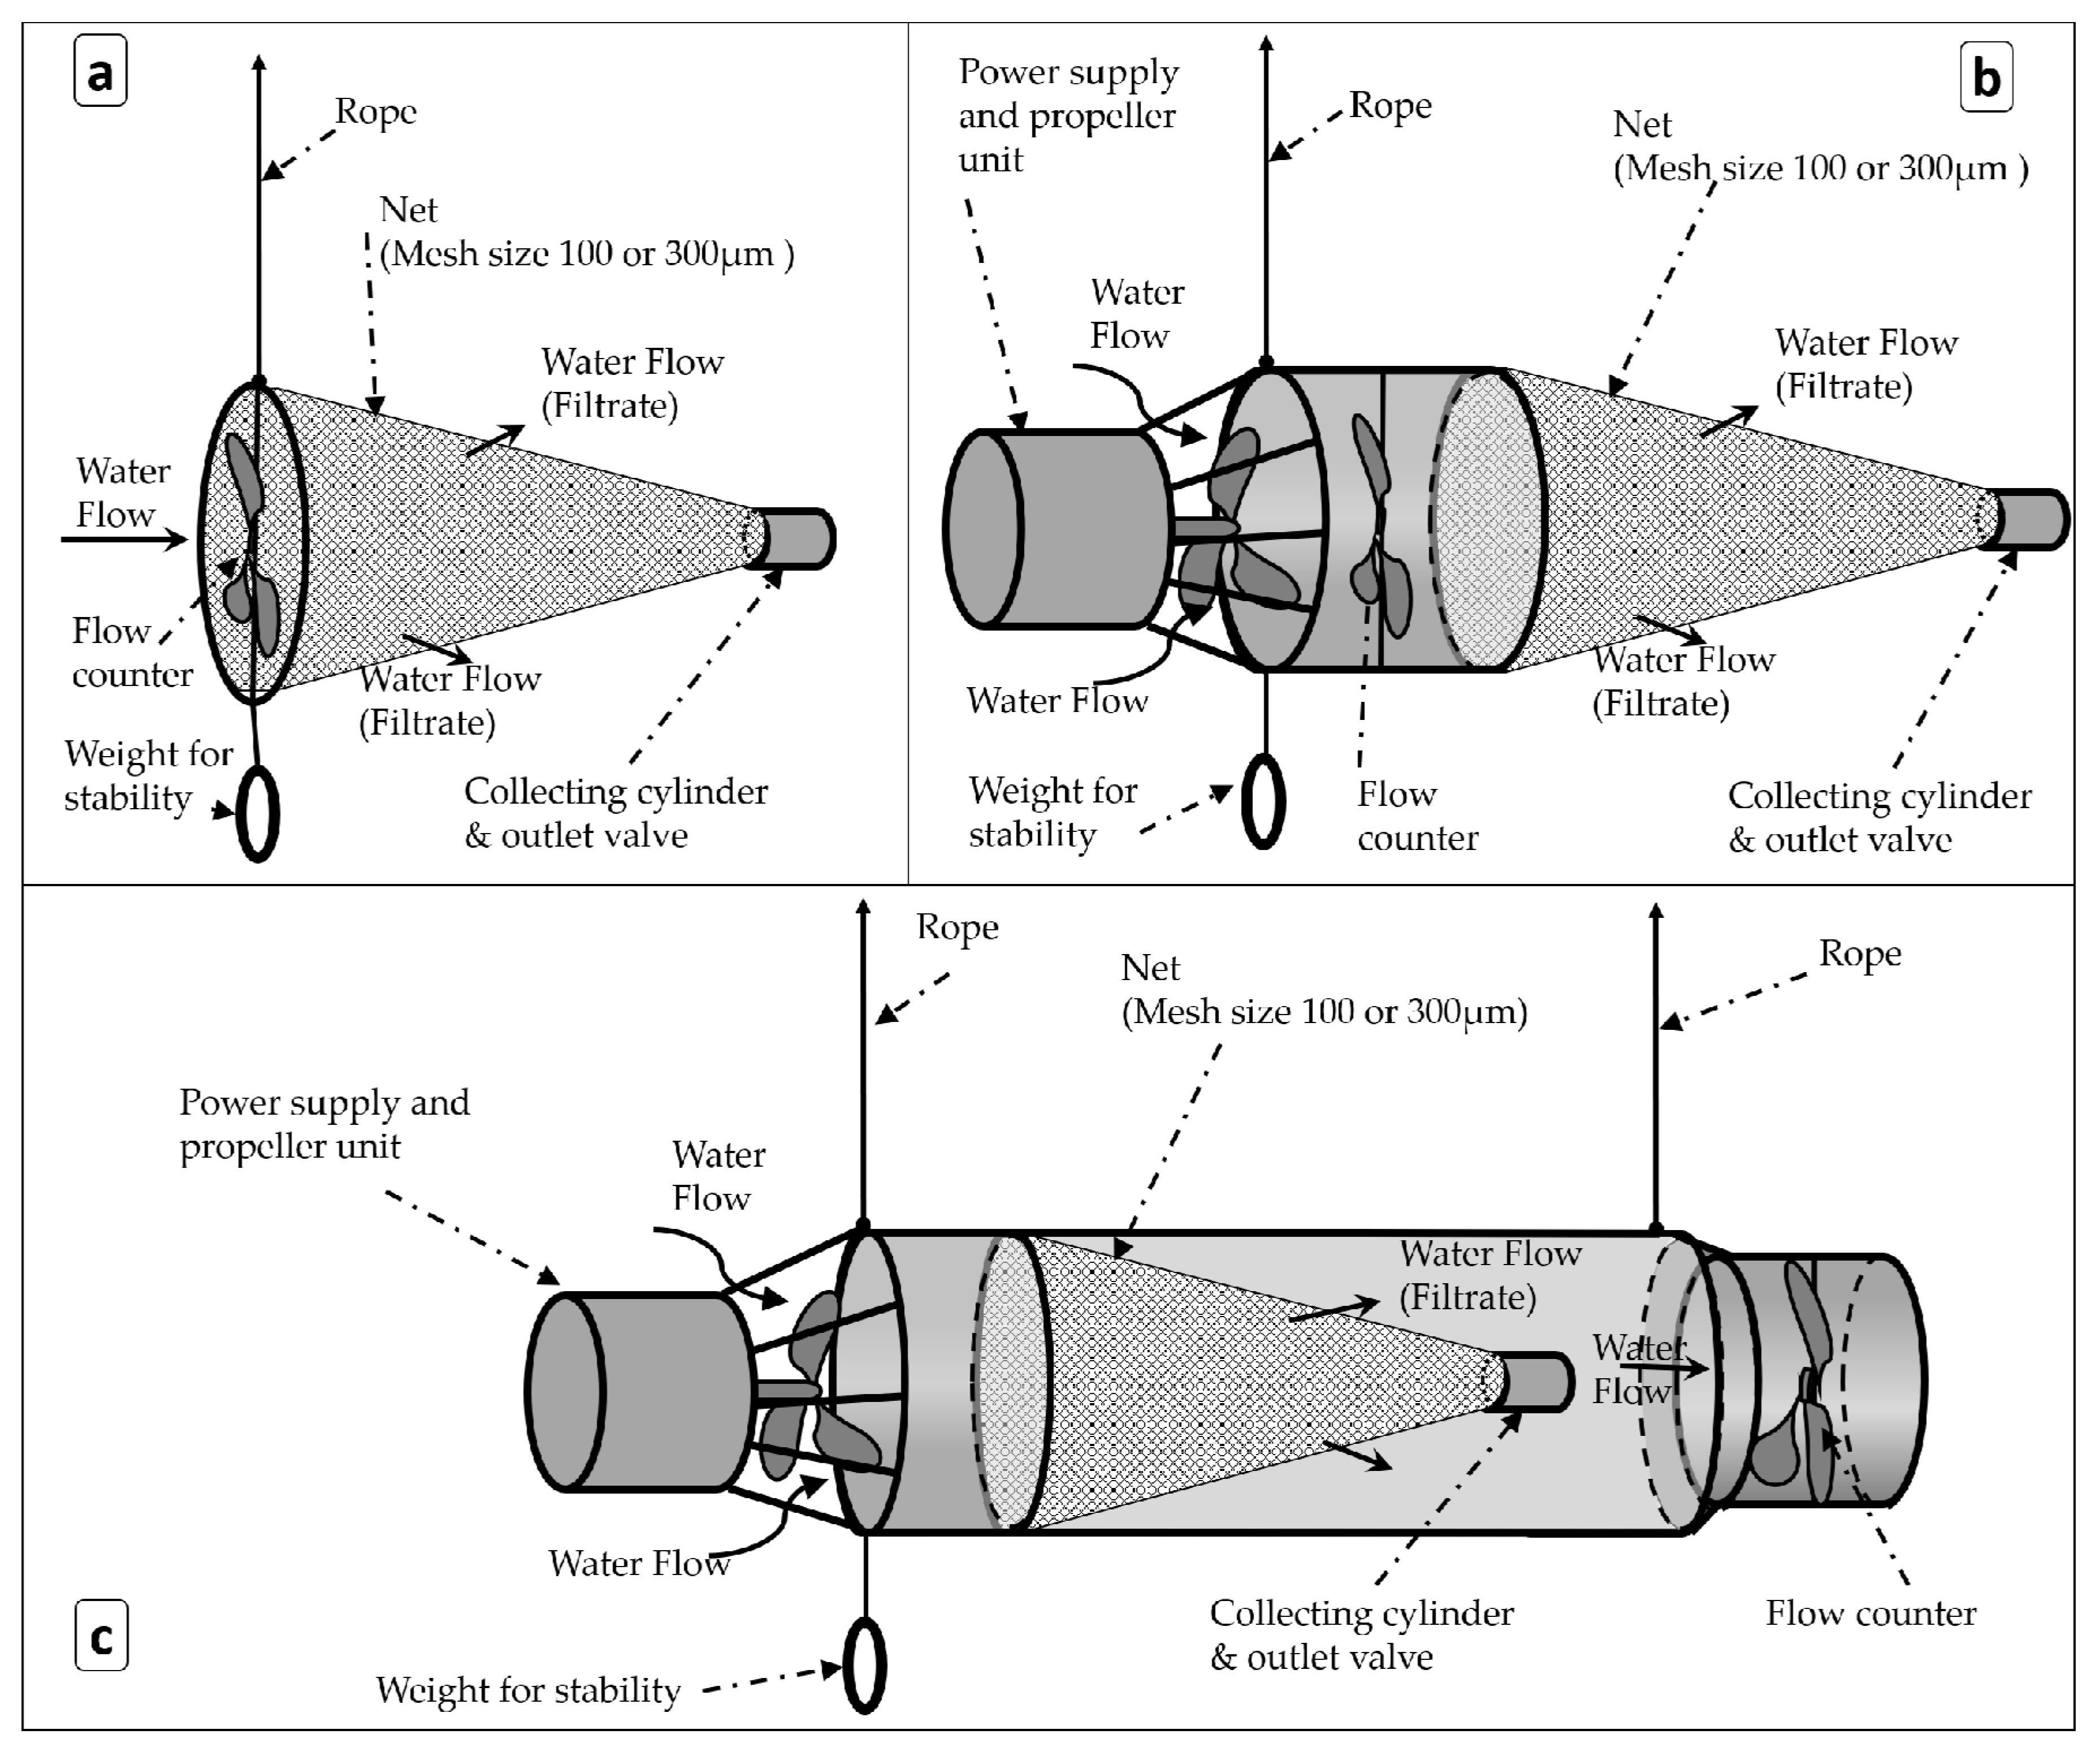
2.1.2. Sampling Locations

Sampling was conducted in 2018 and 2019 at a total number of 95 (61 riverine and 34 coastal) sampling locations in Japan (Figure 2). All the samples were single replicates. The sampling locations fell into two categories: 1. riverine sampling, rivers where there were no tidal effect and inland canals connecting rivers and lakes; 2. coastal sampling, with river mouths including bay areas with tidal effects and ports. For the initial comparison study of the three units (AM-6, AM-5, and BS-PN), 11 riverine sampling locations were selected. The selection of 11 locations was based on the availability of facilities such as bridges and access to the location from Tokyo during the initial project stage. No coastal sampling locations were used for comparison, as the BS-PN sampling in coastal zones was unfeasible due to the lack of river flow. All three units were used with 100 and 300 µm meshes separately during the comparison. In the second stage of the study, the sampling locations were selected in both riverine and coastal areas to compare particle size distribution, polymer composition, and morphology of microplastics. Moreover, the sampling locations were selected in different topographical areas in Japan with a wide range of land use patterns. Application of single sampling method (AM-6 with 300 µm net) at different locations including challenging conditions to conventional methods was conducted for proper comparison of above-mentioned parameters. The second stage observations include the 83 sampling locations conducted after the first stage and the initial 11 locations (total 95 locations).

2.2. Analytical Process

2.2.1. Sample Extraction and Purification

Microplastics collection from the nets was conducted by rinsing the net with prefiltered water. However, the complete collection of small sized particles from the 100 µm net was not achieved by rinsing the net (hence, 100–300 µm range was not considered within the scope of the study). The collected samples were pre-purified in the laboratory using a filtered (0.45 µm, glass fiber filter) sodium chloride solution (by dissolving 35.9 g NaCl per 100 mL of water: SG = 1.2) to separate the plastics from the heavier non-polymeric material particles (i.e., suspended sand and clay) collected due to water turbulences. This process was expected to extract only particles with an SG of less than 1.2. This group includes microplastics (i.e., polyethylene (PE; SG 0.92–0.97), polypropylene (PP; SG 0.90), and polystyrene (PS; SG 1.05)) and non-plastic low SG particles (i.e., humus). Microplastics with a higher SG (e.g., polyethylene terephthalate (PET; SG 1.40) and polyvinyl chloride PVC; SG 1.40 [26]) are not typically recovered using this process. Yet, environmental plastic samples may present as composites, air trapped, or in weathered conditions. Hence, the SG of the sampled plastic pieces could be altered compared to the SG of the virgin polymer. Therefore, during the polymer analysis process, the attention was not limited to the low SG polymers but included the high SG polymers as well. Then, the floating microplastic pieces were extracted using a vacuum suction respirator (Supplementary Document Figure S6 illustrates this separation process). Next, the organic matter in the suspension was degraded by heating at 60 °C for 8 h with a 2 M HCL solution. Thereafter, the samples were washed with prefiltered water on a 2 μm glass fiber filter to remove any salt precipitations (Supplementary Document Figure S8 illustrates the setup), which would interfere in the next analytical steps. After that, the filtered samples were transferred into glass petri dishes with lids. Then, the samples were dried at 105 °C in an oven for 2 h. Finally, the particles were picked up with stainless-steel forceps by visual observation based on their color and shape [25,28].

2.2.2. Contamination Control

Contamination control procedures were conducted with great care to minimize the probability of microplastic contamination from outside during sample collection, preparation, and laboratory analysis. Potential contaminations due to the plastic components of the AM-6 and the AM-5 were minimized. Reusing the plankton nets was avoided within a single sample collection visit. When more than one sample was collected within a visit, the net was replaced with a clean net to avoid the cross-contamination at different sampling locations. Nets were cleaned at the laboratory with the prefiltered tap water (2 μm glass fiber filter). In AM-6, the pre-exposure to the flow counter impeller was avoided since the counter was placed behind the plankton net. Furthermore, color, stability, and surface appearance of the three devices used in the study were closely investigated before and after the sampling. There were no missing plastic pieces from the devices identified by visual inspection. Moreover, collected samples were compared with the plastic components of the devices (AM-5, AM-6, and BS-PN) based on color and polymer. The color and polymer type of plastic components of the devices are given in Table S1 (Supplementary Material). The polymer types of the parts of the devices were polyvinyl chloride (PVC), polycarbonate, polyoxymethylene, and nylon. Plastic pieces matching those colors and polymer types were not observed in the collected samples. There were no blank control samples taken during the sampling process.
Glass jars (cleaned with dilute HNO3 and rinsed thoroughly with deionized water) were used to contain the samples collected for further processing in the laboratory. Glassware and stainless-steel apparatuses were used during the sample processing, and aluminum foil was used to cover the samples to minimize contamination from airborne particles [29]. In the present study, the considered sizes of microplastic particles were larger than 300 µm. Hence, the probability of airborne contaminations of the same scale particles was very low. A laboratory coat and nitrile gloves were always worn while the work was carried out in an enclosed laboratory. Microscopic examination and Fourier transform infrared spectrophotometry (FT-IR) analysis were carried out in a laboratory designed with sealed windows, and passage through the lab was restricted to minimize airborne contamination, as described by Rose and Webber [29].

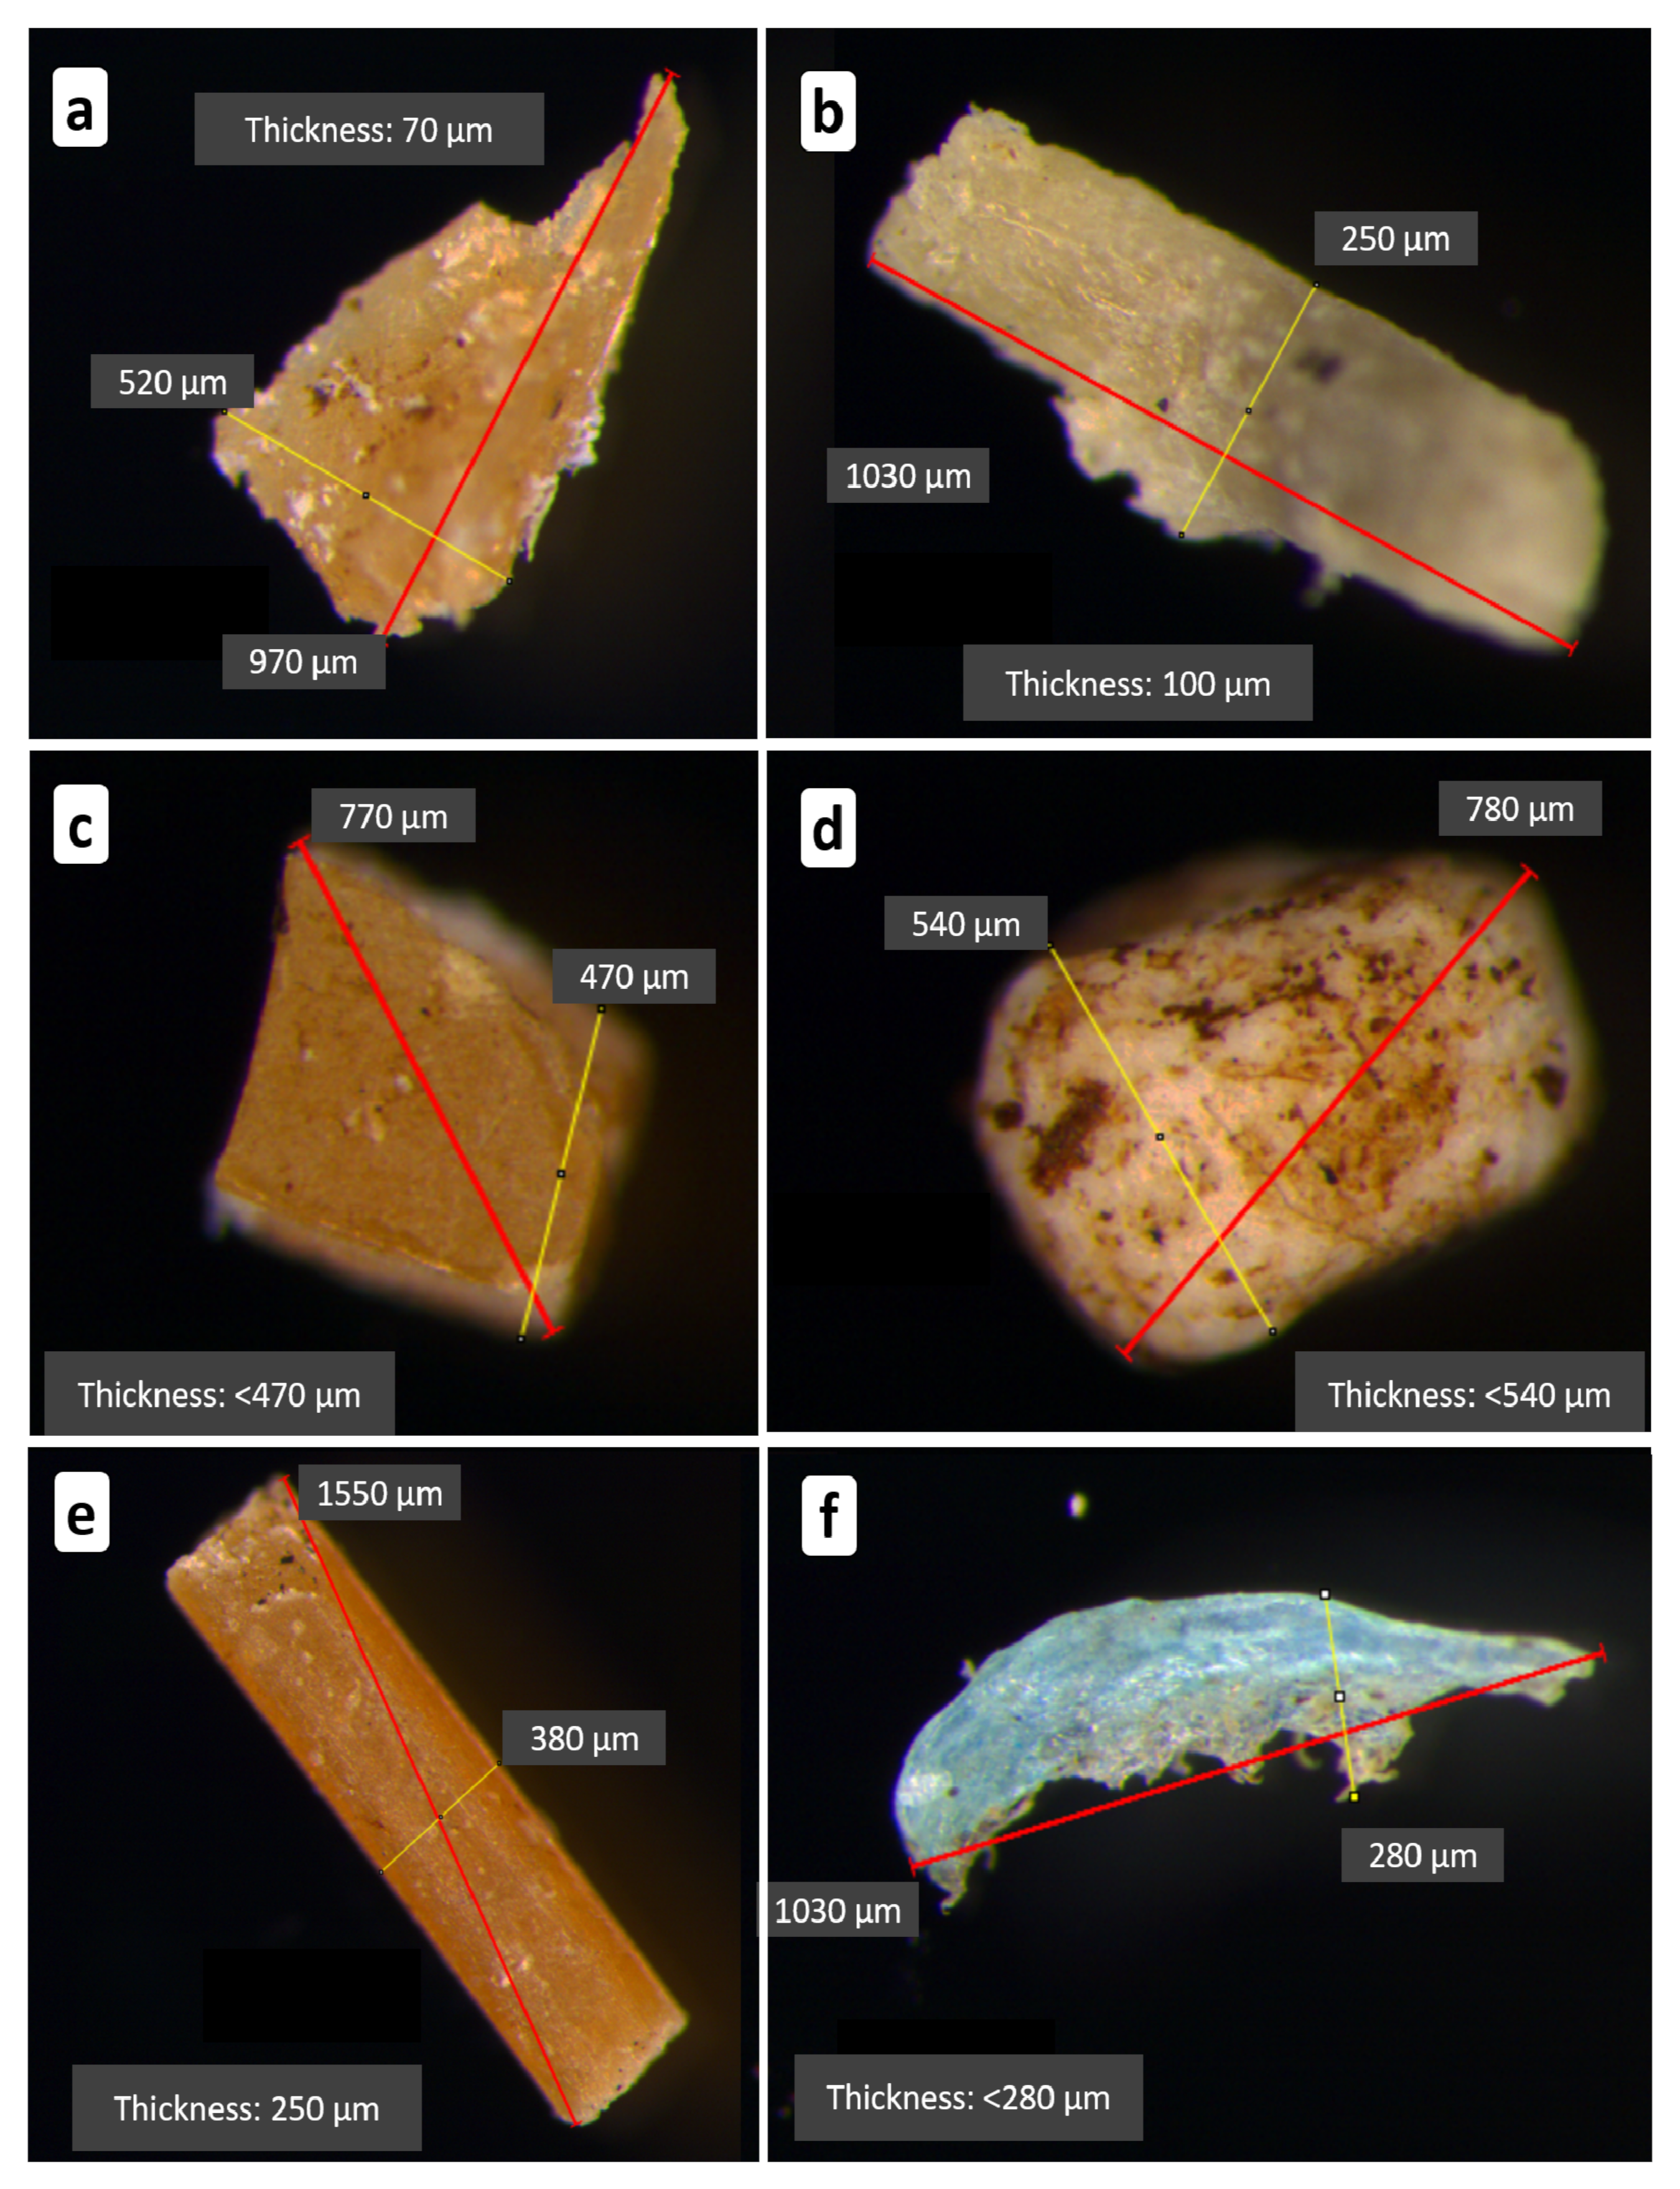
2.2.3. Size Measurement and Polymer Confirmation

Each particle was then processed following three steps. First, the size of each particle was measured by analyzing a picture of the particle taken by a stereoscopic microscope (M165C, Leica microsystems) installed with a USB camera (Leica DFC290, Wetzlar, Germany) using image processing software (ImageJ, downloaded from http://imagej.nih.gov) [25]. The Feret’s diameter, the longest distance between any two points along the selection boundary, also known as maximum caliper and shortest caliper, was measured for each particle (number of particles (N):1811). Second, the shape of the particles was recorded (fiber, fragment, pellet, sheet, or sphere). Third, the compositions of the particles were identified using FT-IR (Nicolet iN10, Thermo Scientific, Waltham, MA, US). The particles were analyzed in transmission mode at a speed of 5 Hz, within the wavenumber range of 4000–600 cm−1. The resulting spectra were processed in the accompanying “OMNIC” specta software and were compared with the pristine FT-IR spectra of common polymers (PE, PP, PS, nylon, PVC, PET, etc.) as specified in Rose and Webber [29]. Finally, the particle thicknesses were measured using a digital Vernier caliper (SHINWA 19974 digital Vernier caliper with Hold Function; least count 10 µm; Shinwam Niigata, Japan).

2.3. Calculations

2.3.1. Calculation of the Flow-Volume through the Devices

The flow-volumes through the devices were calculated using the following equation. Operated average flow rates were calculated by dividing the sampling volume by sampling duration.
V = a b D 2 4 π
V
volume passed through the net,
D
net mouth or tube diameter (for BS-PN: D = 24 cm, AM-5: D = 22 cm and for AM-6: D = 18 cm),
a
flow counter reading,
b
conversion coefficient (manufacturers value for the corresponding impellers; in this case for the impellers used for BS-PN, AM-5, and AM-6: b = 5.12),
π 
= 3.14.

2.3.2. Microplastic Particle Size Distribution

Microplastic particle size (Feret’s diameters) distribution studies were conducted at 95 sampling locations using AM-6(300). The particle sizes considered for this study were ranged from 0.3 to 5 mm. Particle sizes were divided into size classes with 100 µm class intervals. Relative frequency of each size class was calculated according to the Equation (2). The total number of microplastic particles (N) considered in this study was 1811.
f x = n x N
fx
relative frequency of microplastic particles in size class x
nx
number of microplastic particles in size class x
N
total number of microplastic particles
For the comparison between riverine and coastal particle size distributions, the particles were divided into two data sets. The riverine data set included 817 particles (Nr = 817), and the coastal data set included 994 particles (Nc = 994). The calculations of relative frequencies of microplastic particles in each data set were done with the modified Equation (2) (Supplementary Material Equations (S1) and (S2)).

2.4. Statistical Analyses

Statistical analyses were performed with SPSS (IBM SPSS Statistics, IBM Corp., Endicott, NY, US). A one-way ANOVA test was performed to compare the measured concentrations with different sampling devices. The significant difference between the measured riverine microplastic particle sizes and coastal microplastic particle sizes was tested using independent samples t-test. The t value calculation is given in Equation (3).
t = M r M c s r 2 N r + s c 2 N c
t
the ratio of the departure of the estimated value of mean particle size from its hypothesized value to its standard error
Mr
mean particle size of riverine microplastic
Mc
mean particle size of coastal microplastic
sr
standard deviation for riverine microplastics
sc
standard deviation for coastal microplastics
Nr
total number of riverine microplastic particles
Nc
total number of coastal microplastic particles

3. Results

3.1. Operational Conditions of the Sampling Devices

Table 1 compares the operated flowrate range, sampling duration, human resource requirement, and filtrate volume measuring accuracy of the three devices. Both AM-5 and AM-6 were operated for approximately 3 min during the comparison period. Based on the water quality, the net clogging rate varied. The operated filtration rate found for AM-5 and AM-6 was between 2.5 and 7.0 m3/min. Operation at this flowrate for 3 min filtered water volumes ranged from 7.5 to 21 m3. However, during AM-5 and AM-6 development stages, the devices were operated at variable durations to observe the suitable operating conditions. The operation of shorter to longer durations than 3 min (2 min to 8 min) was possible with both devices. Yet, when the duration became longer, net clogging occurred, and the effective filtration through the net decreased. In the field conditions, for multiple samplings, battery power and time were also limiting factors. With battery power discharge, after several samplings, the pump speed decreased. The operation was limited to five samplings (with 3 min sampling duration) for one fully charged battery.
The BS-PN sampling duration depended on the flowrate of the river. With a higher river flow velocity, shorter durations were required to filter a substantial volume. The river flow velocities of the 11 sampling locations of the comparative study varied from 0.25 to 1.5 m/s. However, due to the resistance to water flow through the plankton net, the flow through velocity was typically six times lower than the river flow velocity for the 300 µm mesh size [25]. Hence, filtering approximately 10 m3 of water through the BS-PN took 10 to 60 min. With a 100 µm mesh size, the time period increased due to increasing resistance to the flow through the smaller openings of the mesh.

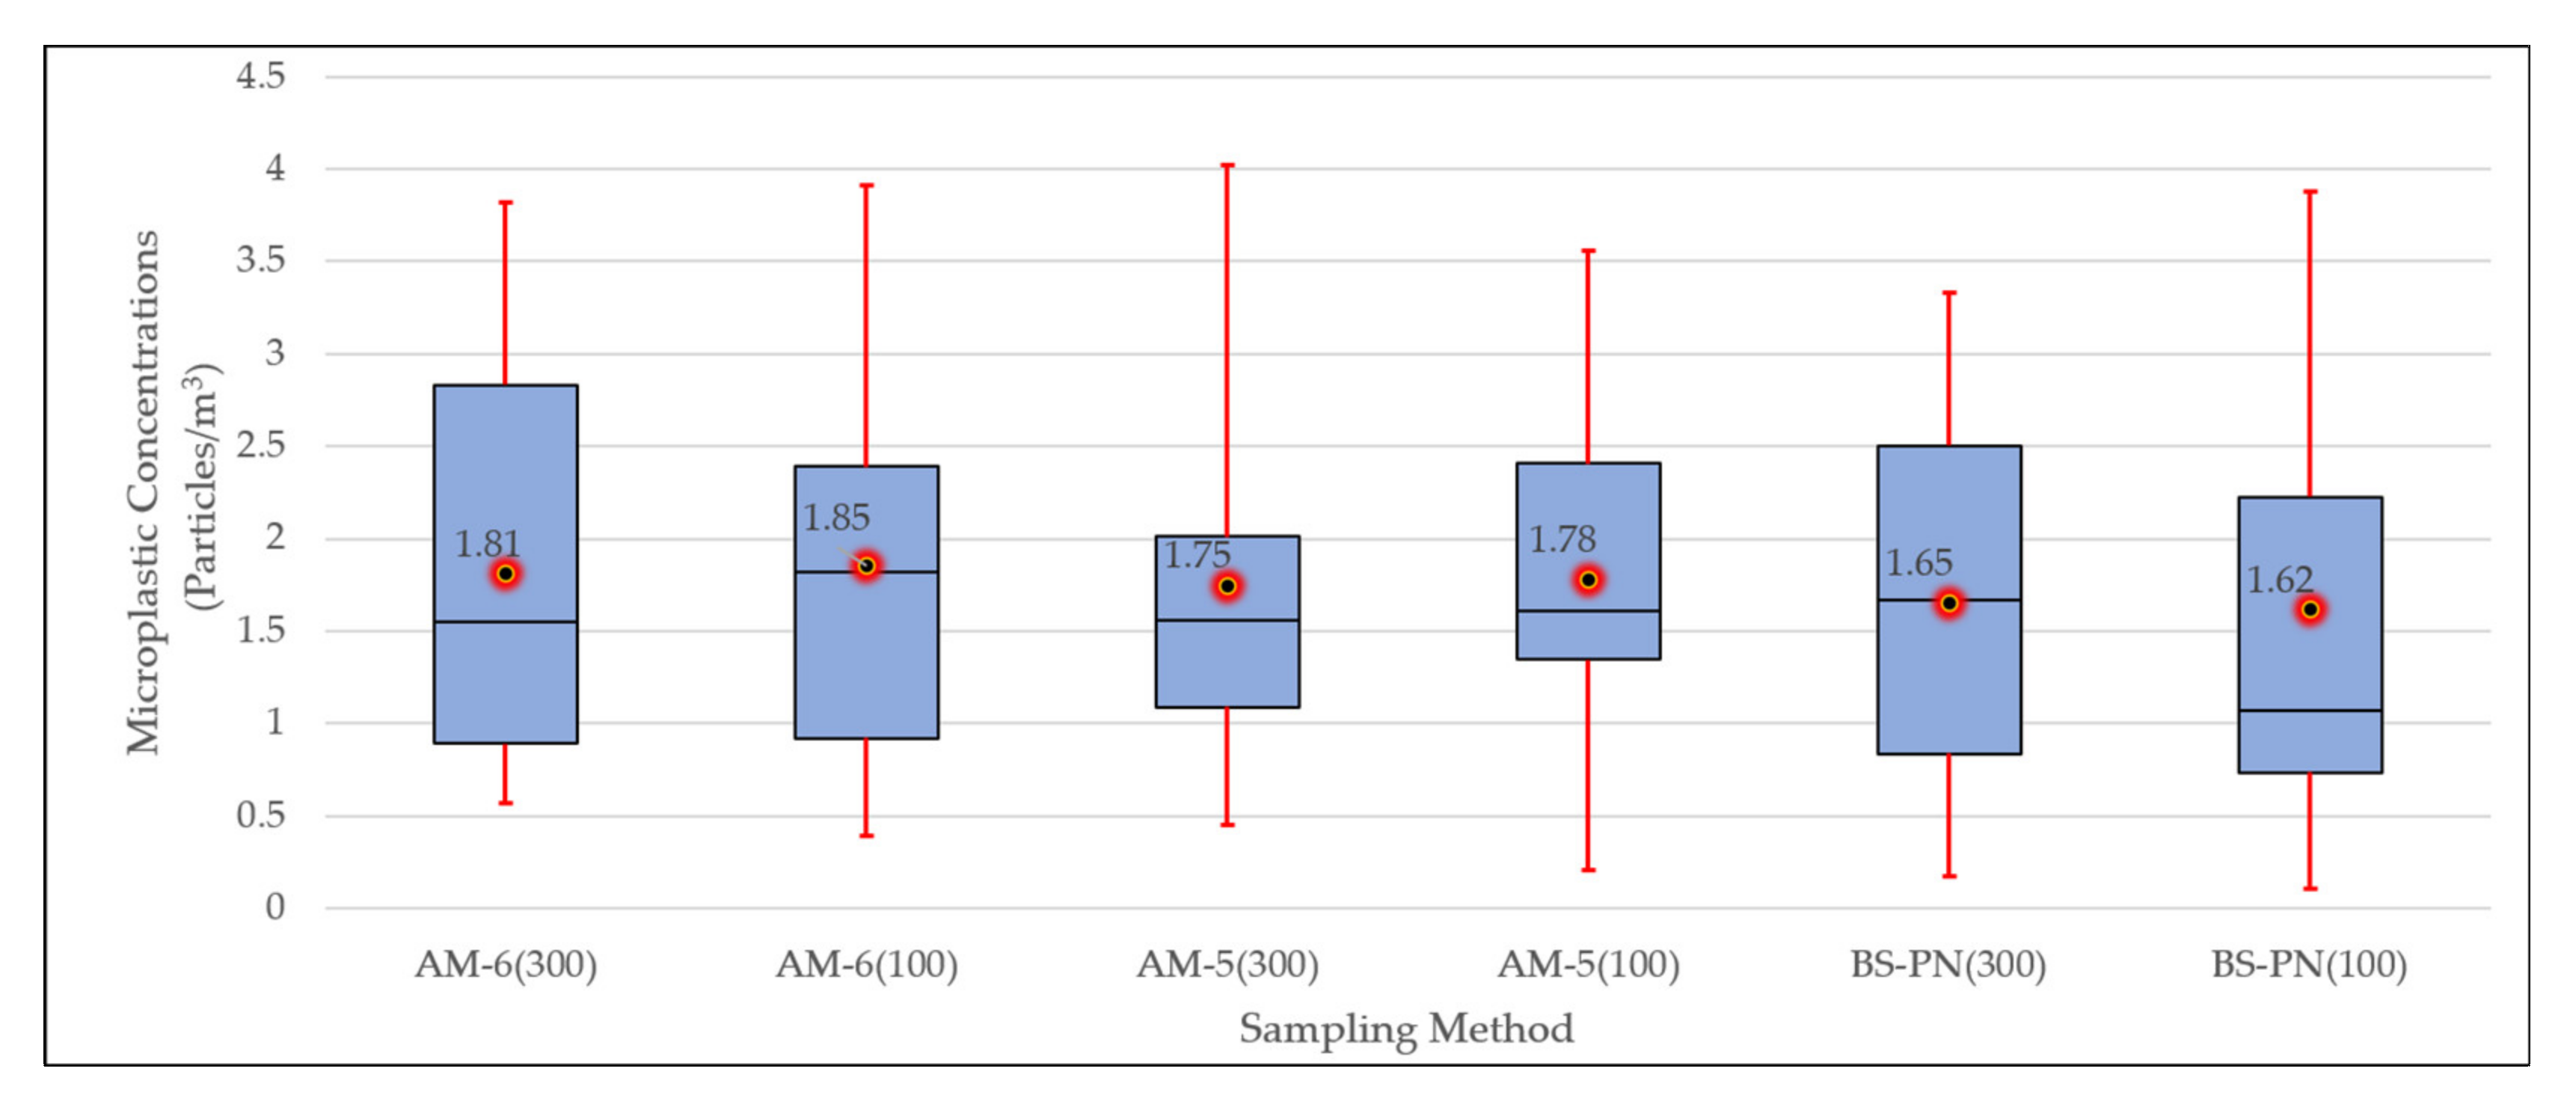
3.2. Microplastic Concentrations Measured with Different Sampling Devices

Microplastic concentrations measured at 11 different sampling locations for comparison of the three sampling devices are presented in Figure 3. Concentrations of the 100 µm mesh samples were calculated using only the particle sizes greater than 300 µm for comparison with 300 µm mesh samples. The mean concentration values for all six methods were in the same range (minimum 1.62 and maximum 1.85 pieces/m3). ANOVA results indicated no significant difference of measured concentrations with different devices (Supplementary Material Figure S10 provides the ANOVA test output). Yet, there was a slight reduction of the mean values from 100 µm mesh to 300 µm mesh for AM-5 and AM-6. Those differences were 0.04 and 0.03 pieces/m3 for AM-6 and AM-5, respectively. Yet, for BS-PN, the mean value was reduced by 0.03 pieces/m3. From AM-5 to AM-6, the mean concentrations increased by 0.07 and 0.06 pieces/m3 for the 100 µm and the 300 µm mesh sizes. From the BS-PN to AM-6 devices, the mean values increased by 0.23 and 0.16 pieces/m3 for the 100 µm and the 300 µm mesh openings, respectively (12.8% and 9% increments, respectively).

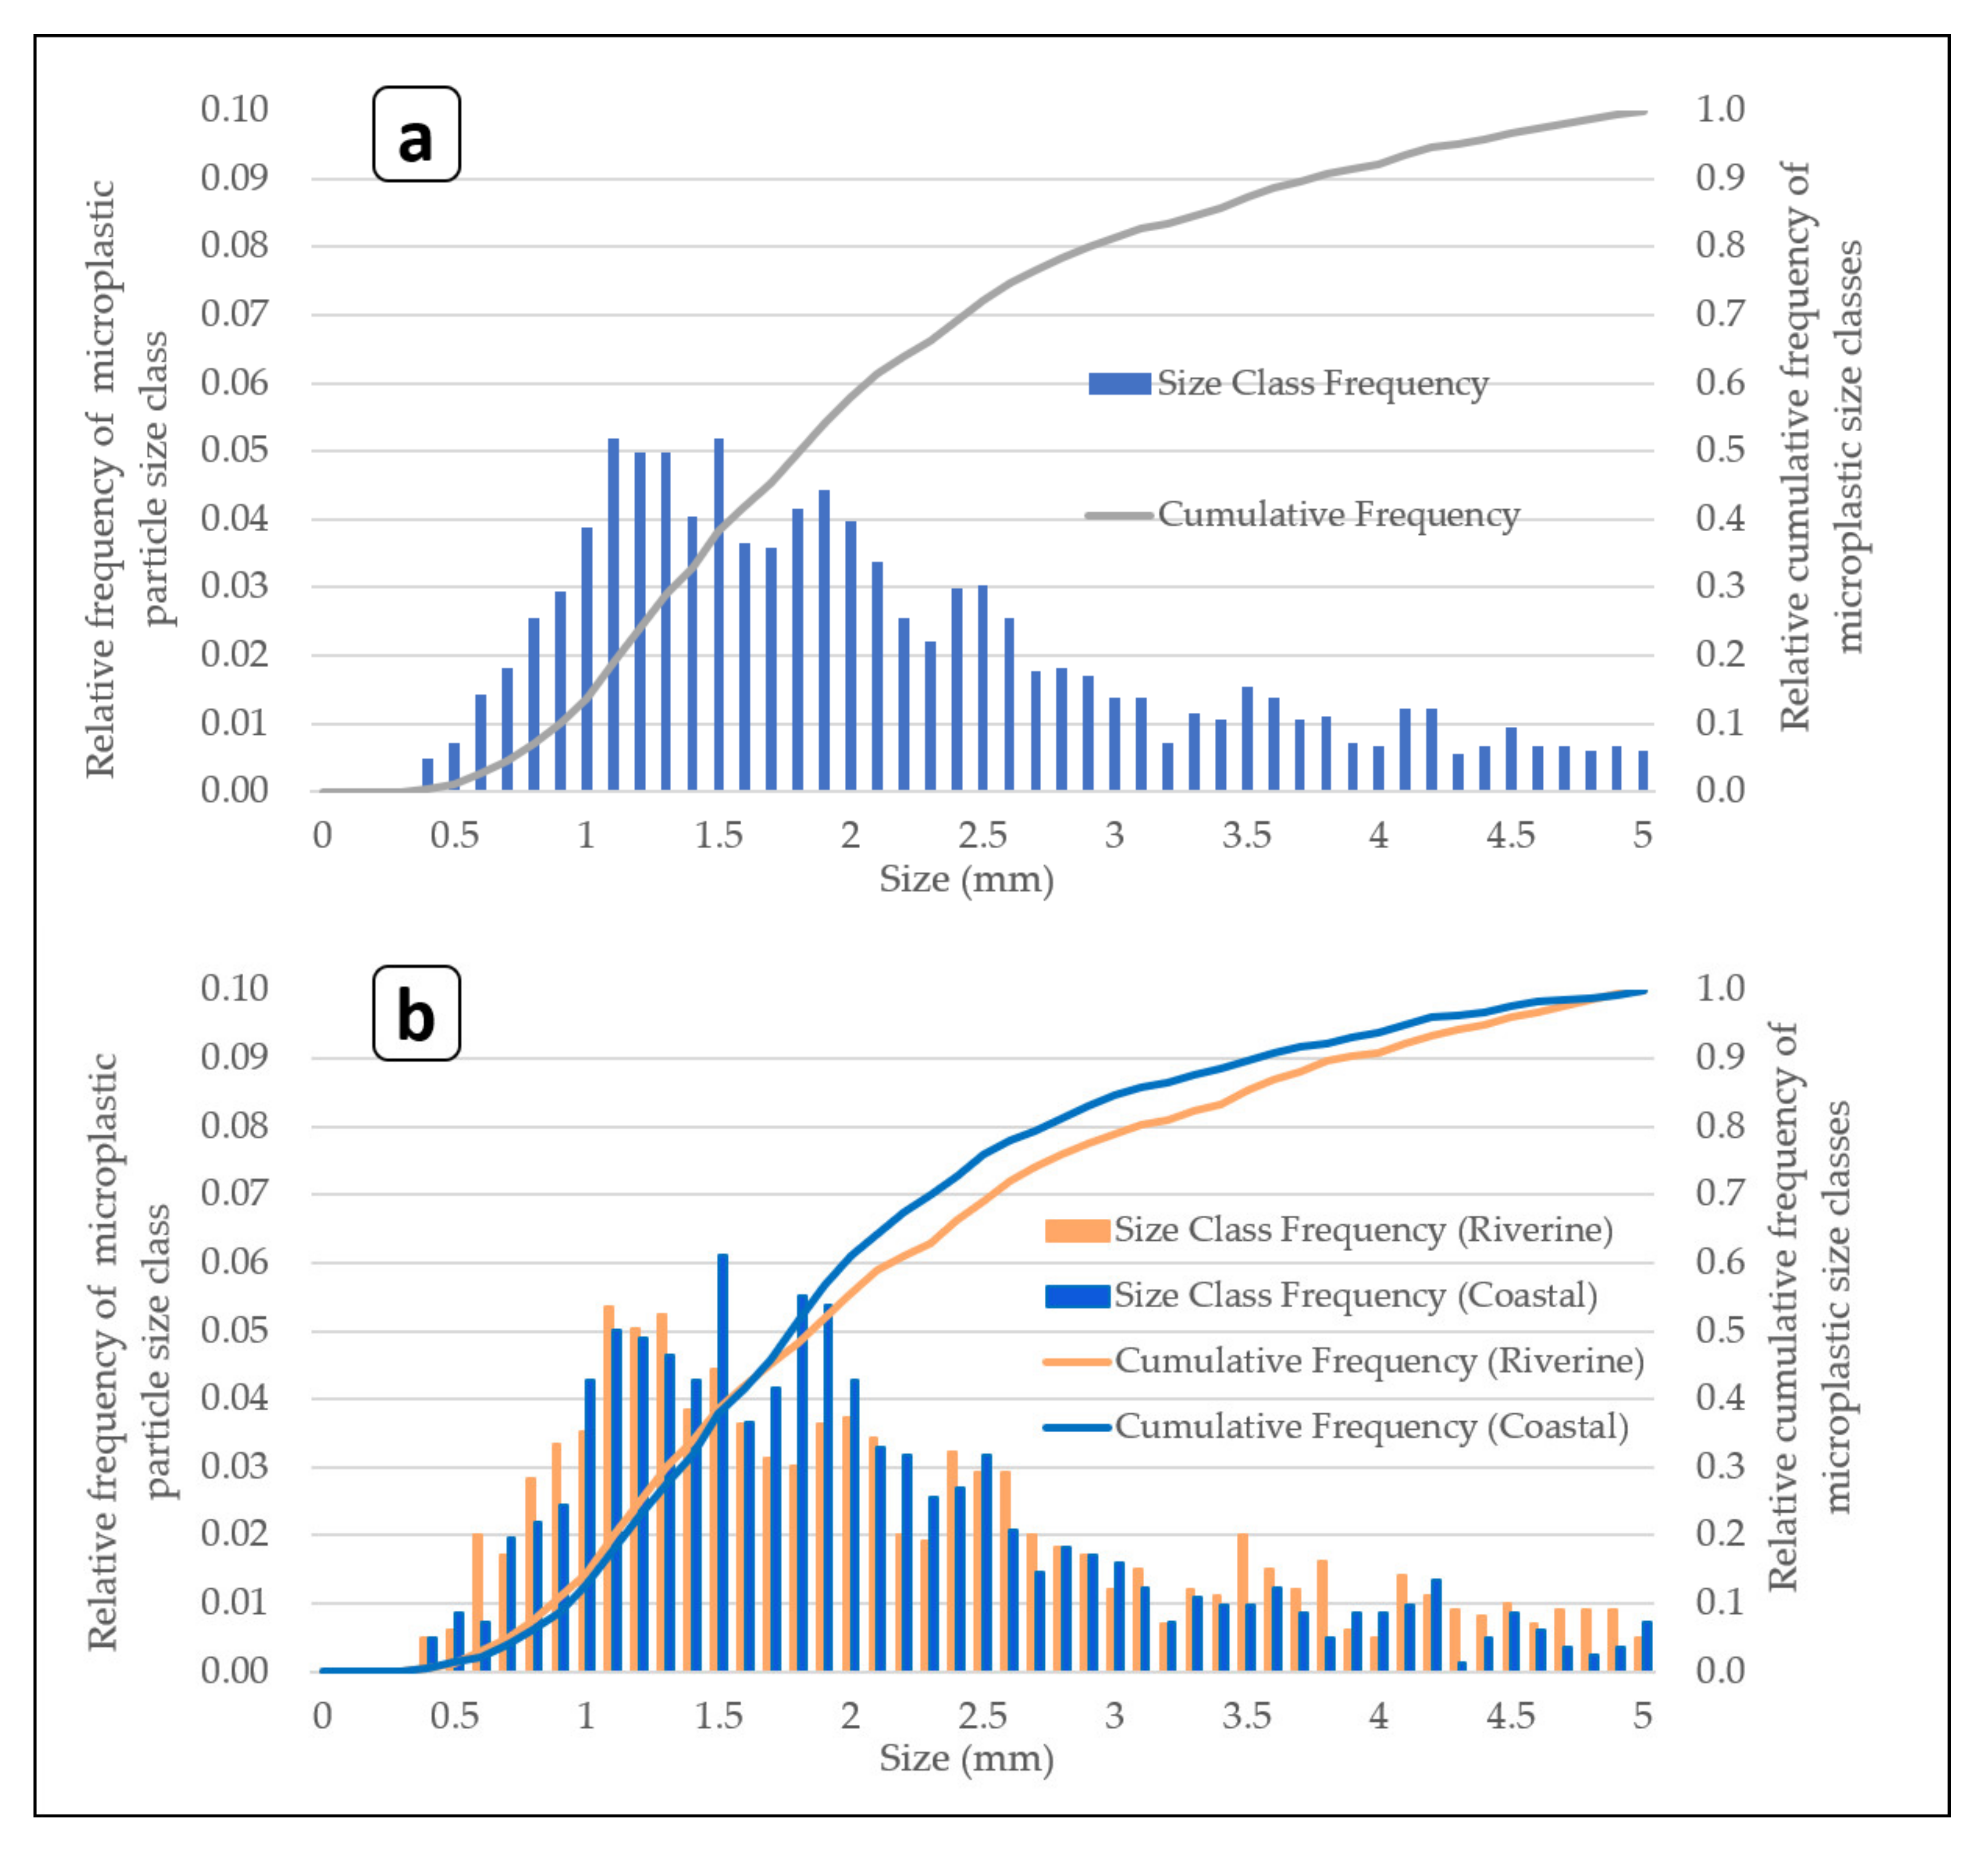
3.3. Microplastic Particle Size Distributions for the Sampling in Japanese Riverine and Coastal Environments Using AM-6(300)

Sampling was conducted at 95 sampling locations using AM-6(300) for the microplastic particle size distribution studies. Distribution of relative frequency of microplastic particles in each size class is illustrated in Figure 4a. Figure 4b compares riverine and coastal microplastic particle size distributions. Apart from the distribution per size class, the cumulative size variations are illustrated in the same graphs (secondary axis). The relative frequency of particle size class increased monotonically as the sizes decreased up to the range of 1–2 mm. Thereafter, a rapid reduction in the frequency of particles per size class occurred. Generally, larger sized plastic litter gradually degrades and breaks into smaller pieces in water environments. Therefore, the monotonic increment up to a 1–2 mm range is acceptable. The particle frequency reduction with a further reduction of size class shall be understood with the sampling procedure and the particle shape. The sizes measured and expressed in this study were the longest length (longest Feret’s diameter) of the particle (selected microplastic pieces observed in this study are given in Figure 5).
The t test revealed a statistically significant difference between the mean diameter of riverine microplastic particles (Mr = 2.103 mm, sr = 1.133) and the mean diameter of coastal microplastic particles (Mc = 1.981 mm, sc = 0.999). The observed t = 2.389, p = 0.017, with the significance level (α) = 0.05 (t-test output is given in Figure S9, Supplementary Material).
Riverine and coastal microplastic particle size distribution (Figure 4b) indicated a statistically significant reduction of the particle sizes from riverine environments to coastal environments.

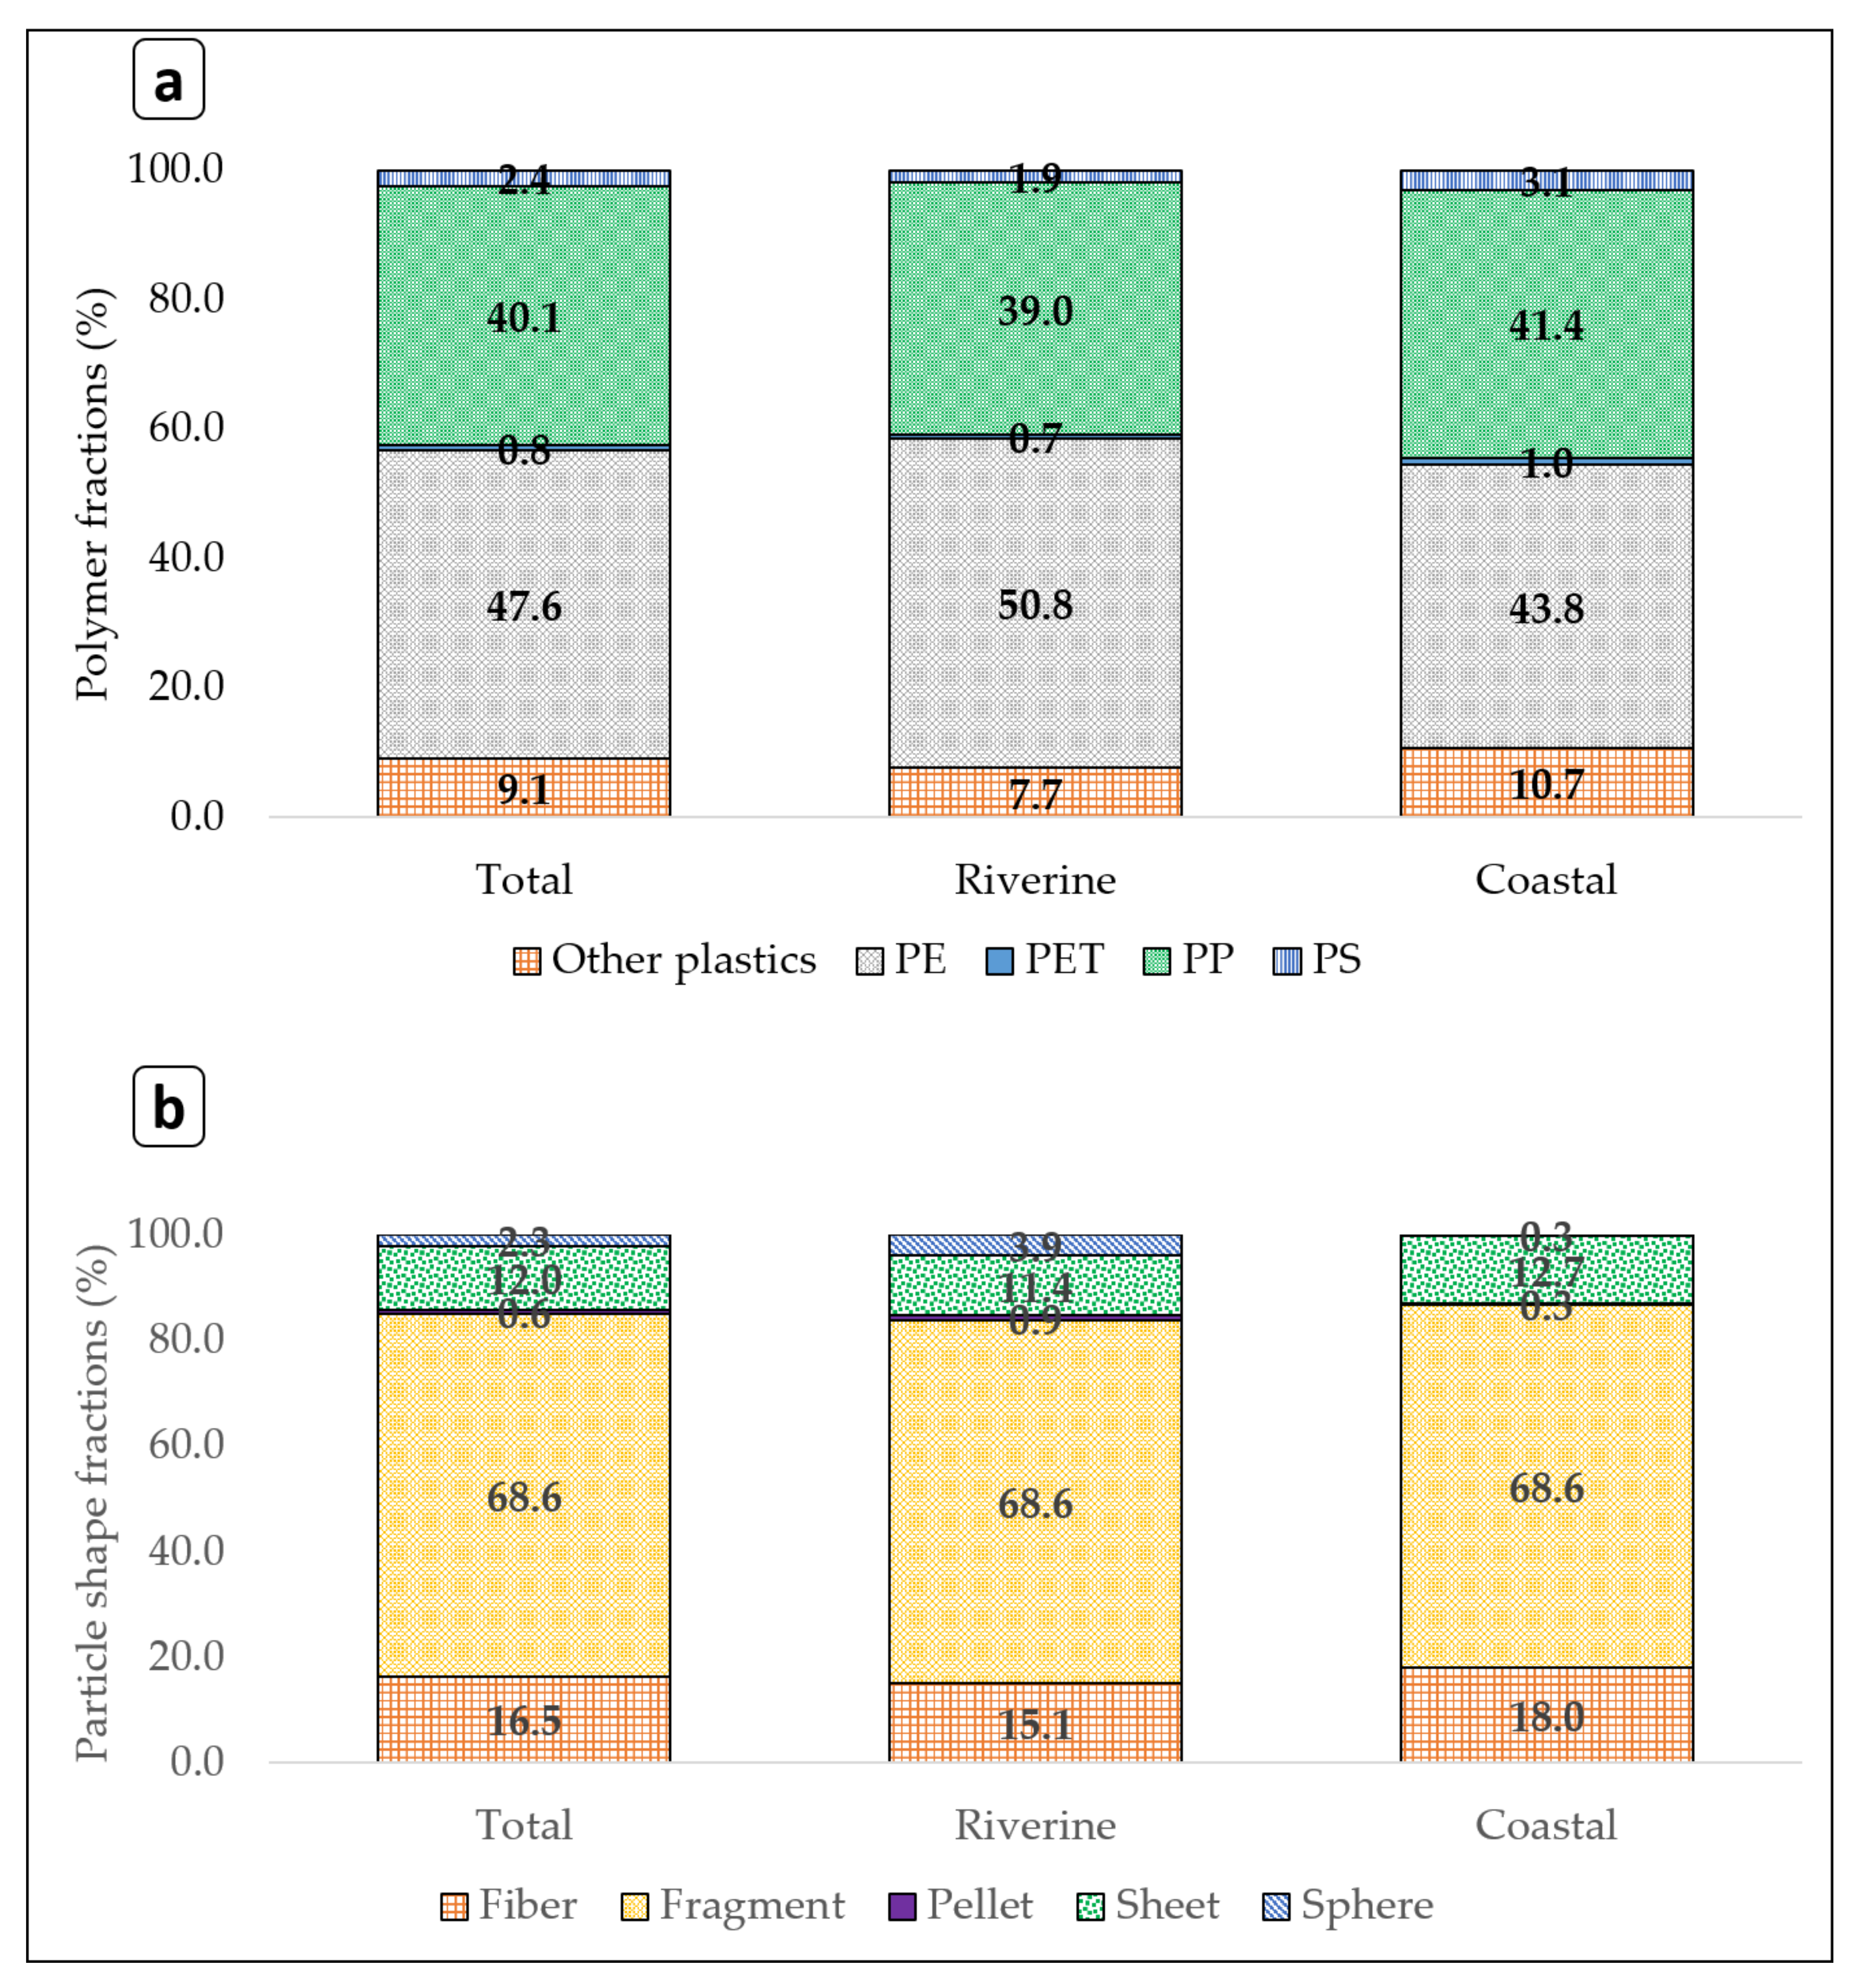
3.4. Plastic Polymer Compositions in River and Coastal Areas of Japan

Figure 6a indicates the polymer composition distribution of the microplastics collected. The dominant polymer types observed in the floating and the suspended microplastics collected in this study were PE (48%) and PP (40%). Yet, PS, PET, and other kinds of polymers were also detected in small amounts. The PE percentage decreased from riverine environments to the coastal environments. However, the PP percentage increased slightly from riverine environments to coastal environments. The SG values of PE, PP, PS, and PET were 0.92–0.97, 0.90, 1.05, and 1.40, respectively. The sampling was carried out near the surface of the water body. The rotation of the propeller pumped the water into the net from the surroundings. This included the water from the surface (floating) and from inside (suspended in) the river. Hence, the sampled microplastics were likely to consist more of lower SG polymers.
The application of HCl and a higher temperature than 60 °C could have affected the detectability of the polymers. The undetectable particle percentage in FT-IR was 4% (Supplementary material Figure S7). Figure 6b illustrates the shape distribution comparison. Fragments are the dominant shape of microplastics collected. Fibers, sheets, spheres, and pellets were also presented in the collected samples (Figure 5 and Figure S4).

4. Discussion

4.1. Operational Conditions of the Sampling Devices

Compared to the conventional BS-PN sampling device, the developed devices used in this study (AM-5 and AM-6) could collect samples in smaller canals, places without suitable structures to fix the nets, locations with lower river flowrates, locations with rapid water level variations, etc. (Supplementary Material Figure S1 indicates several locations where conventional sampling methods are hardly applicable. We describe these types of conditions as challenging conditions for conventional sampling). Both sampling devices, AM-5 and AM-6, were capable of sampling microplastics in challenging aquatic environments, such as rivers, bays areas, canals, and coastal areas, despite the flowrate of the water body or the space availability for a boat traveling. During the comparison stage of the study, sampling at these kinds of challenging locations was not possible due to the inapplicability of BS-PN. However, with AM-6 during the second stage of the study, sample collection was conducted. This was one basic advantage of the developed sampling devices.
Sampling of larger volumes (from 7.5 to 21 m3) within a short period of time (3 min) is an advantage compared to the studies reported with smaller sample volumes [24,31]. According to Table 1, there were several advantages of sampling with AM-5 and AM-6 in terms of the sampling duration. Water level variations create errors in sampling due to partially submerged nets. Depending on the water quality, the net clogging rate varies. Furthermore, there are operational difficulties with BS-PN, such as the decision regarding the sampling duration. When maintaining a longer time, if the net becomes clogged, the flowrate measurements could be inaccurate. The effect of net clogging due to longer sampling durations was reported [25] in riverine environments. Sampling volume calculation errors due to partially submerged BS-PNs were reported [25]. If the BS-PNs lifts within a short period of time, the filtered water volume might be not enough to obtain a representative sample. On the other hand, if the BS-PNs are kept for a longer time in the river, the net might become clogged, and a back-flow situation may occur. For increased sampling durations such as 5 min, this net clogging, and back-flow situation occurs with the developed devices (AM-5 and AM-6) as well. Reduction of mesh opening size from 300 to 100 µm makes this net clogging and back-flow impact higher (numerical data not given; authors observed this during the sampling). This back-flow creates a situation where the water passes through the flow counter, which is located at the center or next to the net. Yet, part of the water passing the flow counter returns without passing through the mesh. Observations during the study indicated several occasions where the water level of the stream varied within 10–20 min due to the upstream conditions.
Moreover, with the progressive clogging of the BS-PN, the resistance to the filtration flow increased. Hence, the upper side of the net frame tended to lift above the river surface. This net lifting overestimated the filtered water volume because the water flow was not completely across the mouth of the net. This was not observed with the developed sampling devices. We assume the pump operation kept the device submerged (pump is continuously sucking the water). Moreover, even with the BS-PN, by providing enough counterweight, the net lifting can be controlled. This includes the improvement of the strength of the net mouth to withstand the forces. This may provide an improved BS-PN with less potential volume measurement errors due to net lifting.
There are special research objectives where the sampling must be done during floods, rainfall events, etc., where water level variations occur. AM-5 and AM-6 are applicable during these kinds of situations, as the method is applicable under varying water levels. As the sampling time is 3 min (or less), the collection of samples at a variable river within a short period is possible, and the evaluation of such kinds of variations is also possible. With AM-5 and AM-6, the depth of the sample collection location is adjustable during the sampling process. Hence, making the samples represent a larger section of the water body can be achieved by changing the sampling location in horizontal and vertical directions.
Certain methods, such as suction pump-based methods [26], are inoperable where the access from riverbanks and trawls/boats is challenging. When the overhead bridges are too tall (such as move than 10 m), suction pumps are inapplicable. Among the sample collection locations, the sample location (Figure S1) located at the bridge over the river had a height of more than 12 m. These places are highly challenging for methods such as suction pumping due to the limitations of suction pressure.
Considering the human resources for the sample collection, BS-PN, and AM-5 can be operated even with only one person. Yet, AM-6 requires a minimum of two people to operate. However, usually during water sample collection research activities, due to safety issues, more than one person is participating. Hence, the available human resources for the operation of all three devices are comparable. However, the sampling equipment handling could be slightly negative from the researchers’ perspectives with the AM-6 compared to AM-5 and BS-PN. Yet, sample collection duration was reduced with both the AM-5 and the AM-6 compared to the BS-PN. Compared to the previously established methods such as trawling a manta net [22,30], which requires both humans and support with boats, the devices discussed in this study can be handled with fewer human resources and supportive services.

4.2. Microplastic Concentrations Measured with Different Sampling Devices

Smaller sized mesh openings (100 µm) were expected to capture a higher number of microplastics than the larger (300 µm) mesh. This higher capture was expected in the considered range of particles from 300 µm to 5 mm. Figure 7 illustrates the higher potential of particle retention with 100 µm compared to 300 µm mesh within the considered range of particles. Comparison of particle size distributions of the 100 and the 300 µm meshes (Figure S3, supplementary material) show that there is a higher frequency of particles in the smaller sized range for 100 µm mesh compared to 300 µm mesh. This supports the retention mechanism expressed in Figure 7. However, the observations did not indicate such a tendency. The microplastic concentrations measured at 11 locations did not indicate an advantage of using a 100 µm mesh sized net (Figure 3). A possible reason for this could be associated with progressive net clogging and back-flow. This clogging is faster in smaller mesh openings since smaller meshes retain a larger range of suspended matter in water. This situation creates a faster back-flow situation. With back-flow, some of the microplastics could escape from the net. Moreover, the retention probability could reduce (Supplementary Material Figure S11 illustrates the back-flow). However, the present study did not confirm the reason. Further studies are to be done to confirm this phenomenon.
Table 2 summarizes several selected microplastic sampling studies conducted with 300 µm and 100 µm net-like sampling devices. Clogging in the riverine environments with 100 µm nets was reported in previous studies [25,32]. Kapp and Yeatman [33] reported that, with a 100 µm mesh, river sampling durations over 2 min tended to clog the nets. The average volume filtered without clogging in one study [31] was 3.04 m3. Hence, even the filtration duration was as low as 3 min, and—depending on the river water quality—net clogging could occur. In the case of net clogging, as described previously, the volumes could be overestimated, and part of the microplastics could be flushed out from the mouth of the net.
A study conducted with BS-PN [25] reported volume measurement errors of 5%–10% due to the partial submerged net frame during the sampling. Partial submergence occurs with the increased force from river flow due to net clogging. Hence, the filtered water volume in the present study may also have been overestimated due to the same reason. This could be a reason for the lower estimation of microplastic concentrations with the BS-PN sampling. Therefore, the reported lower microplastic concentrations with the 100 µm net could be due to net clogging. There were practical difficulties of 100% recovery of samples from the 100 µm net due to the attachment of the plastic particles to the net. However, the optimum size of the mesh depends on the objectives of the research. For example, there is capable analytical equipment for smaller microplastics, and risk assessment related studies require smaller sized particle sampling. Hence, there are limitations of applications of the devices developed in this study for the range of 1–100 µm sampling. In such cases, the common practice is to use grab sampling methods and laboratory sifting with a series of sieves.
Microplastic concentrations in marine environments vary by three orders of magnitude, whereas in freshwater resources, including riverine environments, the variation is five orders of magnitude [35]. The review study of Koelmans et al. [17] reported a variation of microplastic concentrations in riverine environments over a large range. These orders of magnitude differences in two environments might be due to better mixing and/or representativeness of the sampling in the marine environment with less mixing and a larger variability of litter sources and flow conditions for freshwater environments. Besseling et al. [35] described the positive impact of sampling with a trawling net over several hundreds of meters in open water over the pointwise grab sampling with a bucket or flask. This is an advantage of trawling net sampling due to the improved representativeness over pointwise grab sampling. This advantage is applicable where the trawling is possible. However, the accuracy of the sample volume and other practical situations need to be considered.
The concentration values reported in this study are within the values reported in the previous studies. However, the comparison of concentrations in different environments requires a comprehensive analysis of various aspects. Hence, correlating the observed concentrations in different environments to the sampling devices’ efficiency is inappropriate. There was only one study found in the literature for Japanese riverine environments [25]. This study indicated 1.6 ± 2.3 pieces/m3, which is within the same range of the values observed in this study.

4.3. Relative Particle Size Distribution of Microplastic Pieces Sampled Using AM-6 in Japanese Riverine and Coastal Environments

The particle distribution (Figure 4a) indicated a similar variation pattern with the reported microplastic particle size distributions in freshwater [25] and oceanic environments [30,36,37].
The frequency of size class was getting smaller from the river to the ocean (Figure 4b). This is the first reporting of the comparison of the size distribution of microplastics in both riverine and coastal environments. Plastic litter degradation occurs in riverine environments as well. Hence, the plastics could break into smaller particles from river to bay areas. Even though rivers are not the only microplastic source to the oceans, a potential reason for the significant particle size reduction reported in this study could be due to degradation during the river flow and the additional degradation in the coastal areas. Comparison of the size distribution values of the East Asian seas surrounding Japan [30] with the values reported in this study (Supplementary material Figure S2) indicated a progressive size reduction from rivers to the ocean. This could be considered as supportive evidence of the size reduction (fragmentation) of microplastics in water environments (from rivers to oceans).

4.4. Plastic Compositions in River and Coastal Areas of Japan

The study of Isobe et al. [38] reported that the dominant polymer types of microplastics reported in floating in East Asian seas (seas around Japan) were PE, PP, and PS. Kataoka et al. [25] also reported PE, PP, and PS as the dominant microplastic polymer types identified in Japanese riverine environments. The above two studies and the present study were focused on floating and suspended microplastic samples. Considering the SGs of the plastic polymers, it is understandable that the plastics with lower SG than water were abundant in water suspensions. However, the litter sources were also a governing factor to decide the polymer composition. The highest percentage of PE and PP are used in the packaging industry (over 60% and 49%, respectively), while PS is commonly used both in packaging and building construction (30% and 29%, respectively [9]). Materials used in items that last several decades, such as in buildings and construction with alternative disposal methods, unlike PE and PP, have a lower probability of entering water environments. That could be the reason for detecting less PS compared to PE and PP in this study.
The PE fraction decreased from riverine to coastal environments, while the PP percentages increased slightly (Figure 6a; numerical percentage decreased from 50.8 to 43.8%). This could have been due to several reasons, such as degradation rate variation or litter input variations in riverine and coastal environments. A weight-based concentration (mg/m3) analysis would provide a better understanding of the litter input characteristics rather than a particle number-based concretion (particles/m3) analysis.
Even though the SG of PET is about 1.4 (higher than the SG of freshwater), some samples included PET particles. In moving water, microplastics are subject to turbulent transport, settling, aggregation, biofouling, resuspension, and burial [39]. This results in particle movement within and between the water for different compartments of riverine environments [39]. This explains the potential reason for a PET presence in suspension, as the river flow turbulences could bring the higher SG particles into the suspension. In a water environment, the particles are associated with air bubbles and biofilms. Hence, the SGs could be altered from the SG of pure polymers. Hence, the presence of PET floating and in suspension could be understood.
Considering the structure of the sampling device (net with a 300 µm mesh opening), fragments and spheres had the least possibility of escape. However, the shapes including fibers and sheets could escape from a square shaped opening even if the maximum dimension exceeded the 300 µm. The morphology of microplastics is important in the recognition of the pollutant source [27]. The microplastic shape distribution in freshwater in Italy showed the dominating occurrence of fragments (73.7%; [40,41]), which agrees with the present study. As previously mentioned, shape influences on the retained particles within the net. Fiber-like microplastics and sheet-like microplastics tend to escape more compared to pellets, spheres, and fragments. Considering the morphology, the study of Dris, et al. [42] discussed that targeting water environmental sampling of fibers required a smaller mesh opening than for other shapes. The use of an 80 µm mesh had a 250-times higher probability of sampling fibers compared to a 330 µm mesh. Hence, the detected fiber composition could be less than the actual relative presence in the water in this study.

5. Conclusions

Both the AM-5 and the AM-6 enhanced the floating and the suspended microplastics sample collection ability of researchers in challenging riverine and coastal environments. They allowed sample gathering in places where surface traveling was limited. The sample collection time was reduced to durations of three minutes or less. This gives an advantage to a researcher to be able to cover a larger number of sampling locations within a short period of time. The microplastic concentrations and compositions found were in line with the conventional samples where comparison was possible. The observations supported a significant particle size reduction from rivers to coastal areas. PE and PP were the dominant microplastic polymer types floating and in suspension in riverine and coastal water environments of Japan. The observations complied with the coastal microplastic observations reported by previous researchers.

Supplementary Materials

The following are available online at https://www.mdpi.com/2073-4441/12/7/1903/s1, Figure S1: Several sampling locations, and “Albatross” sampling device, Figure S2: Comparison between this study and Isobe et al., 2015 [30] (East Asian Seas around Japan). The concentration values reported by Isobe et al. [30] were converted to relative size class frequencies for the comparison with the present study, Figure S3: 300 vs. 100 µm mesh (particles larger than 300 µm only), Figure S4: Microscopic images of selected microplastic pieces analyzed during the study, Figure S5: IR spectrum of selected microplastic pieces given in Figure 6, Figure S6: Vacuum suction of microplastics/microplastic like particles in the NaCl solution, Figure S7: The breakdown of plastic detectability by FR-IR in the present study, Figure S8: Deposited slat removal by washing on 2 µm glass fiber filter, Figure S9: t-test for Riverine and Coastal particle size data sets, Figure S10: ANOVA test for the comparison of different sampling devices (1 to 6 is same order presented in Figure 3: AM-6:300, AM-6:100, AM-5:300, AM-5:100, BS-PN:300 and BS-PN:100), Figure S11: Clogging of nets and the back-flow. Potential escape of microplastics from the net with back-flow. Table S1: Color and polymer type of plastic components of the devices used in the study.

Author Contributions

Conceptualization, F.K. and A.A.; methodology, all; validation, A.A., F.K., N.I. (Norihiro Itsubo) and N.I. (Nobuhiro Ito); formal analysis, A.A.; investigation, A.A. and F.K.; resources, F.K., N.I. (Norihiro Itsubo), N.I. (Nobuhiro Ito) and Y.M.; data curation, A.A.; writing—original draft preparation, A.A.; writing—review and editing, A.A., N.I. (Norihiro Itsubo), F.K. and Y.F.; supervision, N.I. (Norihiro Itsubo) and Y.N.; project administration, F.K.; funding acquisition, F.K., Y.M. and N.I. (Norihiro Itsubo). All authors have read and agreed to the published version of the manuscript.

Funding

This research was funded by NIPPON FOUNDATION (grant number 2018492884), Japan and ENVIRONMENTAL RESTORATION AND CONSERVATION AGENCY (2019-H-A8), Japan. The grants were from “subsidy of the ocean and Japan project” and “subsidy of the Japan fund for global environment” respectively.

Acknowledgments

Authors would like to acknowledge H. Nakamura, A. Satoda, R. Iribata, S. Inoue, and others who were involved in “Albatross sampler development project” starting from Albatross Mark 1 to Albatross Mark 6 and sampling works.

Conflicts of Interest

The authors declare no conflict of interest. The funders had no role in the design of the study; in the collection, analyses, or interpretation of data; in the writing of the manuscript, or in the decision to publish the results.

References

  1. Thompson, R.C.; Barnes, D.K.A.; Galgani, F.; Barlaz, M. Accumulation and fragmentation of plastic debris in global environments. Philos. Trans. R. Soc. B Biol. Sci. 2009, 364, 1985–1998. [Google Scholar]
  2. Horton, A.A.; Jürgens, M.D.; Lahive, E.; van Bodegom, P.M.; Vijver, M.G. The influence of exposure and physiology on microplastic ingestion by the freshwater fish Rutilus rutilus (roach) in the River Thames, UK. Environ. Pollut. 2018, 236, 188–194. [Google Scholar] [CrossRef] [PubMed]
  3. Bellasi, A.; Binda, G.; Pozzi, A.; Galafassi, S.; Volta, P.; Bettinetti, R. Microplastic contamination in freshwater environments: A review, focusing on interactions with sediments and benthic organisms. Environments 2020, 7, 30. [Google Scholar] [CrossRef] [Green Version]
  4. Jemec, A.; Horvat, P.; Kunej, U.; Bele, M.; Kržan, A. Uptake and effects of microplastic textile fibers on freshwater crustacean Daphnia magna. Environ. Pollut. 2016, 219, 201–209. [Google Scholar] [CrossRef] [PubMed]
  5. Redondo-Hasselerharm, P.E.; Falahudin, D.; Peeters, E.T.; Koelmans, A.A. Microplastic effect thresholds for freshwater benthic macroinvertebrates. Environ. Sci. Technol. 2018, 52, 2278–2286. [Google Scholar] [CrossRef] [PubMed]
  6. Su, L.; Cai, H.; Kolandhasamy, P.; Wu, C.; Rochman, C.M.; Shi, H. Using the Asian clam as an indicator of microplastic pollution in freshwater ecosystems. Environ. Pollut. 2018, 234, 347–355. [Google Scholar] [CrossRef] [PubMed]
  7. Lebreton, L.C.M.; van der Zwet, J.; Damsteeg, J.-W.; Slat, B.; Andrady, A.; Reisser, J. River plastic emissions to the world’s oceans. Nat. Commun. 2017, 8, 15611. [Google Scholar] [CrossRef]
  8. Schmidt, C.; Krauth, T.; Wagner, S. Export of plastic debris by rivers into the sea. Environ. Sci. Technol. 2017, 51, 12246–12253. [Google Scholar] [CrossRef]
  9. Ryberg, M.; Laurent, A.; Hauschild, M.Z. Mapping of Global Plastic Value Chain and Plastic Losses to the Environment: With a Particular Focus on Marine Environment; United Nations Environment Programme: Nairobi, Kenya, 2018. [Google Scholar]
  10. Isobe, A.; Iwasaki, S.; Uchida, K.; Tokai, T. Abundance of non-conservative microplastics in the upper ocean from 1957 to 2066. Nat. Commun. 2019, 10, 417. [Google Scholar] [CrossRef] [Green Version]
  11. Cozzolino, L.; Nicastro, K.R.; Zardi, G.I.; Carmen, B. Species-specific plastic accumulation in the sediment and canopy of coastal vegetated habitats. Sci. Total Environ. 2020, 723, 138018. [Google Scholar] [CrossRef]
  12. Microplastics. Encyclopædia Britannica. Available online: www.britannica.com/technology/microplastic (accessed on 8 May 2020).
  13. Hakkarainen, M.; Albertsson, A.C. Environmental Degradation of Polyethylene. In Long Term Properties of Polyolefins, 1st ed.; Albertsson, A.C., Ed.; Springer: Berlin/Heidelberg, Germany; New York, NY, USA, 2004; Volume 169, pp. 177–200. [Google Scholar]
  14. Van Emmerik, T.; Schwarz, A. Plastic debris in rivers. Wires Water 2020, 7, 1398. [Google Scholar] [CrossRef] [Green Version]
  15. Anderson, J.C.; Park, B.J.; Palace, V.P. Microplastics in aquatic environments: Implications for Canadian ecosystems. Environ. Pollut. 2016, 218, 269–280. [Google Scholar] [CrossRef] [PubMed] [Green Version]
  16. Kowalski, N.; Reichardt, A.M.; Waniek, J.J. Sinking rates of microplastics and potential implications of their alteration by physical, biological, and chemical factors. Mar. Pollut. Bull. 2016, 109, 310–319. [Google Scholar] [CrossRef] [PubMed]
  17. Koelmans, A.A.; Nor, N.H.M.; Hermsen, E.; Kooi, M.; Mintenig, S.M.; De France, J. Microplastics in freshwaters and drinking water: Critical review and assessment of data quality. Water Res. 2019, 155, 410–422. [Google Scholar] [CrossRef] [PubMed]
  18. Van Emmerik, T.; Kieu-Le, T.C.; Loozen, M.; Oeveren, K.; Strady, E.; Bui, X.T.; Egger, M.; Gasperi, J.; Lebreton, L.; Nguyen, P.D.; et al. A methodology to characterize riverine macroplastic emission into the ocean. Front. Mar. Sci. 2018, 5, 372. [Google Scholar] [CrossRef]
  19. Scircle, A.; Cizdziel, J.V.; Missling, K.; Li, L.; Vianello, A. Single-Pot Method for the Collection and Preparation of Natural Water for Microplastic Analyses: Microplastics in the Mississippi River System during and after Historic Flooding. Environ. Toxicol. Chem. 2020, 39, 986–995. [Google Scholar] [CrossRef]
  20. Alam, F.C.; Sembiring, E.; Muntalif, B.S.; Suendo, V. Microplastic distribution in surface water and sediment river around slum and industrial area (case study: Ciwalengke River, Majalaya district, Indonesia. Chemosphere 2019, 224, 637–645. [Google Scholar] [CrossRef]
  21. Lima, A.R.A.; Barletta, M.; Costa, M.F. Seasonal distribution and interactions between plankton and microplastics in a tropical estuary. Estuar. Coast. Shelf Sci. 2015, 165, 213–225. [Google Scholar] [CrossRef]
  22. Zhang, L.; Liu, J.; Xie, Y.; Zhong, S.; Yang, B.; Lu, D.; Zhong, Q. Distribution of microplastics in surface water and sediments of Qin river in Beibu Gulf, China. Sci. Total Environ. 2020, 708, 135176. [Google Scholar] [CrossRef]
  23. Maes, T.; van der Meulen, M.D.; Devriese, L.I.; Leslie, H.A.; Huvet, A.; Frère, L.; Vethaak, A.D. Microplastics baseline surveys at the water surface and in sediments of the North-East Atlantic. Front. Mar. Sci. 2017, 4, 135. [Google Scholar] [CrossRef] [Green Version]
  24. Bordós, G.; Urbányi, B.; Micsinai, A.; Kriszt, B.; Palotai, Z.; Szabó, I.; Hantosi, Z.; Szoboszlay, S. Identification of microplastics in fishponds and natural freshwater environments of the Carpathian basin, Europe. Chemosphere 2019, 216, 110–116. [Google Scholar] [CrossRef] [PubMed]
  25. Kataoka, T.; Nihei, Y.; Kudou, K.; Hinata, H. Assessment of the sources and inflow processes of microplastics in the river environments of Japan. Environ. Pollut. 2019, 244, 958–965. [Google Scholar] [CrossRef] [PubMed]
  26. Li, Y.; Lu, Z.; Zheng, H.; Wang, J.; Chen, C. Microplastics in surface water and sediments of Chongming Island in the Yangtze Estuary, China. Environ. Sci. Eur. 2020, 32, 15. [Google Scholar] [CrossRef] [Green Version]
  27. Rochman, C.M.; Brookson, C.; Bikker, J.; Djuric, N.; Earn, A.; Bucci, K.; Athey, S.; Huntington, A.; McIlwraith, H.; Munno, K.; et al. Rethinking microplastics as a diverse contaminant suite. Environ. Toxicol. Chem. 2019, 38, 703–711. [Google Scholar] [CrossRef] [PubMed] [Green Version]
  28. Hidalgo-Ruz, V.; Gutow, L.; Thompson, R.C.; Thiel, M. Microplastics in the marine environment: A review of the methods used for identification and quantification. Environ. Sci. Technol. 2012, 46, 3060–3075. [Google Scholar] [CrossRef] [PubMed]
  29. Rose, D.; Webber, M. Characterization of microplastics in the surface waters of Kingston Harbour. Sci. Total Environ. 2019, 664, 753–760. [Google Scholar] [CrossRef] [PubMed]
  30. Isobe, A.; Uchida, K.; Tokai, T.; Iwasaki, S. East Asian seas: A hot spot of pelagic microplastics. Mar. Pollut. Bull. 2015, 101, 618–623. [Google Scholar] [CrossRef] [PubMed]
  31. Kapp, K.J.; Yeatman, E. Microplastic hotspots in the Snake and Lower Columbia rivers: A journey from the Greater Yellowstone Ecosystem to the Pacific Ocean. Environ. Pollut. 2018, 241, 1082–1090. [Google Scholar] [CrossRef]
  32. Briggs, E.; de Moura, E.A.B.; Furusawa, H.A.; Cotrim, M.E.B.; Oguzie, E.E.; Lugao, A.B. Microplastics: A novel method for surface water sampling and sample extraction in Elechi Creek, Rivers State, Nigeria. In Characterization of Minerals, Metals, and Materials; Springer International Publishing: Cham, Switzerland, 2019; pp. 269–281. [Google Scholar]
  33. Naidoo, T.; Glassom, D.; Smit, A.J. Plastic pollution in five urban estuaries of KwaZulu-Natal South Africa. Mar. Pollut. Bull. 2015, 101, 473–480. [Google Scholar] [CrossRef]
  34. McEachern, K.; Alegria, H.; Kalagher, A.L.; Hansen, C.; Morrison, S.; Hastings, D. Microplastics in Tampa Bay, Florida: Abundance and variability in estuarine waters and sediments. Mar. Pollut. Bull. 2019, 148, 97–106. [Google Scholar] [CrossRef]
  35. Besseling, E.; Redondo-Hasselerharm, P.; Foekema, E.M.; Koelmans, A.A. Quantifying ecological risks of aquatic micro-and nanoplastic. Crit. Rev. Environ. Sci. Technol. 2019, 49, 32–80. [Google Scholar] [CrossRef] [Green Version]
  36. Jung, M.R.; Horgen, F.D.; Orski, S.V.; Rodriguez, V.; Beers, K.L.; Balazs, G.H.; Jones, T.T.; Work, T.M.; Brignac, K.C.; Royer, S.J.; et al. Validation of ATR FT-IR to identify polymers of plastic marine debris, including those ingested by marine organisms. Mar. Pollut. Bull. 2018, 127, 704–716. [Google Scholar] [CrossRef] [PubMed]
  37. Enders, K.; Lenz, R.; Stedmon, C.A.; Nielsen, T.G. Abundance, size and polymer composition of marine microplastics ≥10 μm in the Atlantic Ocean and their modelled vertical distribution. Mar. Pollut. Bull. 2015, 100, 70–81. [Google Scholar] [CrossRef] [PubMed]
  38. Isobe, A.; Uchiyama-Matsumoto, K.; Uchida, K.; Tokai, T. Microplastics in the Southern Ocean. Mar. Pollut. Bull. 2017, 114, 623–626. [Google Scholar] [CrossRef]
  39. Lambert, S.; Wagner, M. Microplastics are contaminants of emerging concern in freshwater environments: An overview. In Freshwater Microplastics: Emerging Environmental Contaminants; Wagner, M., Lambert, S., Eds.; Springer International Publishing: Cham, Switzerland, 2018; pp. 1–23. [Google Scholar]
  40. Sighicelli, M.; Pietrelli, L.; Lecce, F.; Iannilli, V.; Falconieri, M.; Coscia, L.; Di Vito, S.; Nuglio, S.; Zampetti, G. Microplastic pollution in the surface waters of Italian Subalpine Lakes. Environ. Pollut. 2018, 236, 645–651. [Google Scholar] [CrossRef]
  41. Campanale, C.; Stock, F.; Massarelli, C.; Kochleus, C.; Bagnuolo, G.; Reifferscheid, G.; Uricchio, V.F. Microplastics and their possible sources: The example of Ofanto river in Southeast Italy. Environ. Pollut. 2020, 258, 113284. [Google Scholar] [CrossRef]
  42. Dris, R.; Gasperi, J.; Rocher, V.; Tassin, B. Synthetic and non-synthetic anthropogenic fibers in a river under the impact of Paris Megacity: Sampling methodological aspects and flux estimations. Sci. Total Environ. 2018, 618, 157–164. [Google Scholar] [CrossRef] [Green Version]
Figure 1. Sampling devices used for the sampling activities. (a) Bridge suspended plankton net (BS -PN); (b) Albatross Mark (AM)-5 and (c) AM-6. The second phase of the sampling (95 locations) was conducted only by AM-6 coupled with a 300 µm net (AM-6(300)).
Water 12 01903 g001
Figure 2. Sampling locations. The red color dots were the 11 locations used for the comparison study. Both red and black dots were the 95 sampling locations of AM-6(300) used in the second stage of the study.
Water 12 01903 g002
Figure 3. The microplastic concentrations measured at 11 sampling locations for comparison of the devices (for the nets with 100 µm mesh, the concentrations presented are particles larger than 300 µm size). The top edge of the box is the upper quartile. The bottom edge of the box is the lower quartile. Hence, the box spans the interquartile range. The median is marked by a horizontal line inside the box. The whiskers represent the highest and the lowest observations. The point marker with the number is the mean value.
Water 12 01903 g003
Figure 4. The relative frequency of particle size class distribution (N = 1811) of the microplastics collected at all survey sites using AM-6(300). (a): The distribution of total sampling locations. (b): The distribution separately plotted for riverine environments and coastal environments. Comparison of the Japanese riverine and coastal environments (present study, given in Figure 4a with East Asian seas surrounding Japan [30] is given in Figure S2, supplementary material).
Water 12 01903 g004
Figure 5. Dimensions of selected microplastic pieces. (a): Other plastic; (b,e): polypropylene (PP); (c): polyethylene (PE); (d): polystyrene (PS); (f): combination of PE and PS (listed under another polymer). Red lines indicate the Feret’s diameters while the yellow lines indicate a length, which would be effective for retaining the microplastic particle if the yellow line was oriented parallel direction to the mesh. The IR spectra of the microplastics are given in Figure S5.
Water 12 01903 g005
Figure 6. The morphology and composition of microplastic samples from 95 sampling locations by AM-6(300). (a): Polymer compostion comparison. (b): Fractional particle shape comparison (percentile values of each component is labled).
Water 12 01903 g006
Figure 7. Effect of particle orientation on the retention by 100 and 300 µm meshes.
Water 12 01903 g007
Table 1. Comparison of the operational conditions of the three sampling devices during the comparison stage of the study.
ScenarioBS-PNAM-5AM-6
Parameter 100 µm300 µm100 µm300 µm100 µm300 µm
Operated flowrate range (m3/min)0.11 to 0.67 a0.17 to 1.00 a2.5 to 7.0 b2.5 to 7.0 b2.5 to 7.0 b2.5 to 7.0 b
Sampling duration (min)15–9010–603333
Minimum human resources required
(# people)
1–21–21–21–22–32–3
Effect of net clogging on flow volume measurementThe difference between river flowrate and filtration rate increases.
Partial tilt-up the net. Volume measurement errors.
Flow counter at the center moves along with the forced inflow. Volume measurement errors.Flow counter is located at the filtrate side. It measures only the filtered volume. Minimum volume measurement errors.
a: Operated flow rates in this wide range were due to the river flow velocity variation from sampling location to location, and the observed range of river flow velocities was from 0.25 to 1.5 m/s. b: Flowrate through the net was independent of the river flow velocity (depended on the pump flowrate and flow resistance due to net clogging). BS-PN: bridge suspended plankton net.
Table 2. Previous studies on sampling floating and suspended microplastic in freshwater and coastal environments (focusing on the sampling mesh opening sizes larger than 100 µm).
Device and Method FactsSampling EnvironmentConcentration (Particles/m3)Reference
Trawling a 300 µm net.
(Sampling volume = 100 m3).
Estuary, Brazil0.1[21]
Trawling 333 µm net.River, China0.1–5.6[22]
Trawling a 333 µm net.Channel, UK0–1.5[23]
Jet pump and external power supply unit (sampling volume ≈ 1.5 m3). Complex system due to the requirement of the crew to carry equipment, boat travel, pumping out, and filtration through the sieves.Riverine, Hungary3.52–32.05[24]
Bridge suspended net (300 µm); 5 to 30 min sampling durations. Capable only with rivers with high flow velocity and overhead bridges.Riverine, Japan1.6 ± 2.3[25]
Vertically immersed filter with suction pump form the bottom 300 µm; 8 to 13 min taken for volume 0.1 m3 sampling.Estuary, China67.5[26]
Trawling a 300 µm net.Riverine, Nigeria0–0.2[32]
100 µm net kept across the river flow (1–2 min duration). (V = 3.2 m3). Longer sampling led to issues of clogging with organic matter. Capable only with rivers with high flow velocity.Riverine, Wayni, USA0–13.7[31]
Trawling a 300 µm net
Sampling volume = 10 m3.
Estuary, South Africa1–7[33]
Trawling a 330 µm net.Bay, USA4.5 ± 2.3[34]

