Article

Improving Representation of Decision Rules in LUCC-ABM: An Example with an Elicitation of Farmers’ Decision Making for Landscape Restoration in Central Malawi

by
Ida Nadia S. Djenontin
1,2,*,
Leo C. Zulu
1 and
Arika Ligmann-Zielinska
1
1
Department of Geography, Environment and Spatial Sciences, Michigan State University, East Lansing, MI 48824, USA
2
Environmental Science and Policy Program, Michigan State University, Michigan State University, East Lansing, MI 48824, USA
*
Author to whom correspondence should be addressed.
Sustainability 2020, 12(13), 5380; https://doi.org/10.3390/su12135380
Submission received: 2 June 2020 / Revised: 29 June 2020 / Accepted: 29 June 2020 / Published: 3 July 2020
(This article belongs to the Special Issue Modelling and Simulation of Human-Environment Interactions)

Abstract

:
Restoring interlocking forest-agricultural landscapes—forest-agricscapes—to sustainably supply ecosystem services for socio-ecological well-being is one of Malawi’s priorities. Engaging local farmers is crucial in implementing restoration schemes. While farmers’ land-use decisions shape land-use/cover and changes (LUCC) and ecological conditions, why and how they decide to embrace restoration activities is poorly understood and neglected in forest-agricscape restoration. We analyze the nature of farmers’ restoration decisions, both individually and collectively, in Central Malawi using a mixed-method analysis. We characterize, qualitatively and quantitatively, the underlying contextual rationales, motives, benefits, and incentives. Identified decision-making rules reflect diverse and nuanced goal frames of relative importance that are featured in various combinations. We categorize the decision-making rules as: problem-solving oriented, resource/material-constrained, benefits-oriented, incentive-based, peers/leaders-influenced, knowledge/skill-dependent, altruistic-oriented, rules/norms-constrained, economic capacity-dependent, awareness-dependent, and risk averse-oriented. We link them with the corresponding vegetation- and non-vegetation-based restoration practices to depict the overall decision-making processes. Findings advance the representation of farmers’ decision rules and behavioral responses in computational agent-based modeling (ABM), through the decomposition of empirical data. The approach used can inform other modeling works attempting to better capture social actors’ decision rules. Such LUCC-ABMs are valuable for exploring spatially explicit outcomes of restoration investments by modeling such decision-making processes and policy scenarios.

1. Introduction

Restoring forest-agricscapes to address various environmental threats such as land degradation, deforestation, climate change, and to sustainably supply ecosystem services for socio-ecological well-being is increasingly embraced in Sub-Saharan Africa (SSA). Forest-agricscapes capture natural landscapes made of interspaced agricultural and forested lands—typical of rural areas in SSA—that should be managed holistically for landscape-scale restoration. Researchers stress that engaging local farmers and landowners is necessary for a successful implementation of forest-agricscape restoration schemes [1]. Local farmers’ engagement with restoration occurs at both individual and collective levels and is often taken for granted or assumed to occur spontaneously. Yet, there is evidence of a low take-up of forest and land restoration by farmers [2,3,4]. This renders efforts in promoting restoration technologies and practices inefficient, even though these remain a means to boosting restoration. While farmers’ land-use decisions contribute to shaping the associated environmental and ecological conditions [5], the role of their decision making on forest-agricscapes restoration remain overlooked [6].
In Malawi, 39% of the total land area holds opportunities for household-level restoration on allocated or privately-owned customary lands. Another eight percent (8%) is suitable for collective restoration on unallocated communal lands and in woodlands to help meet food security, climate resilience, poverty alleviation, and energy needs [7,8]. It is, therefore, essential to understand why (or why not) and how farmers decide to embrace restoration activities individually or collectively. Insights into these socio-environmental behaviors are key for farmer-centered restoration efforts. Focusing on socio-political and cultural considerations and choices that shape behaviors toward restoration [9] is necessary to understand farmers’ needs in effective policy attempts to increase their engagement.
The goal of this study is to analyze the nature of the decisions to engage in restoration at individual (farm-household) level and in collective actions (community-level) in Central Malawi. We use a mixed-method approach with qualitative data from seven focus group discussions and role-playing games, and quantitative data from a household survey of 480 participants in Dedza and Ntchisi districts. We examine the rationales, motives, benefits, and incentives that underlie farmers’ restoration activities in selected forest-agricscapes. We characterize the restoration decision-making rules using combined insights from both qualitative and survey data. Emergent decision-making rules appear to be very diverse, with nuanced goal frames reflecting environmental problems, livelihood needs and gains, constraints, socio-political influences, morals, values, and risk attitudes, all featured in various combinations.
Findings on the contextual reasons and the nature of the goal frames central to undertaking restoration practices and activities can offer insights for policy and programming on entry points to boost restoration efforts from a demand-side management perspective. Further, farmers’ restoration decision-making rules constitute an important input for representing agents’ decisions in computational agent-based models (ABMs) that explore outcomes of restoration investments by simulating such social processes. The identified decision-making rules linked to the corresponding social actors’ actions (specific restoration activities and practices) provide the overall decision-making processes to encode into a land-use/cover and change (LUCC)-ABM. These rules can substitute the often ad hoc representation of human decisions in LUCC-ABMs. Crooks et al. [10] previously stressed such challenges and Groeneveld et al. [11] discovered that out of 134 LUCC-ABMs reviewed worldwide, 83 did not ground the representation of the socio-behavioral processes in theory or in empirical observations. Earlier reviews of ABM applications have also pointed to such challenges [12]. In this paper, we offer a conceptual approach, with methodological application, to decompose empirical data to inform such representation.
For the remainder of the paper, we elaborate, in Section 2, on the theoretical perspectives to capturing human environmental behavior for computational modeling and our guiding framework to generate the restoration decision-making rules. We also describe the data collection and analysis methods. We present our findings in Section 3. In Section 4, we discuss the findings, including the translation of the decision-making rules into a LUCC-ABM. We conclude the paper in Section 5 with implications and suggestions for future work.

2. Materials and Methods

2.1. Modeling Human–Environmental Behaviors and Decision Processes

Understanding environmental decision making has remained critical in the management of common resources [13]. Environmental behavior can be shaped by both demand-side and supply-side management approaches. Practical demand-side interventions in resource management have often ignored the behaviors of local resource managers and how these contribute to desired environmental and ecological conditions. Understanding these environmental behaviors is particularly important for contemporary landscape restoration efforts. We draw on the goal-framing theory (GFT) on environmental behavior rooted in social psychology literature and its utility for modeling.
The GFT is appropriate to understand environmental behavior and its impacts as it allows for consideration of several heterogeneous and concurrent goal frames [14]. “A goal frame is, …, the way in which people process information and act upon it. … When it is activated or focal, a goal is a combination of a motive and an activated knowledge structure, especially causal knowledge related to means–end relationships concerning the goal … A goal frame is a focal goal together with its framing effects …” [14] (p. 118). A goal-framing perspective suggests that environmental behavior is shaped by diverse goal frames (conflictual or not) categorized as hedonic (level of pleasure/pain), profit, or normative. These goals represent the determinants of environmental decisions and their encoded or expressed behaviors, and are usually a mixture of motives, logic (causal reasoning or rationales), and other potentially influential factors in relation to the goal. Groeneveld et al. [11] listed six such other influential factors of environmental behaviors: economic, social influence, social impact, environmental-altruistic, non-economic benefits, and spatial accessibility. Etienne [15] argued that the GFT also aligns with the advocated paradigm of bounded rationality, which postulates that a human’s decision making is constrained by limited information mediated by social, cognitive, economic, and temporal factors [11]. Such considerations can inform the computational modeling of human decisions within a socio-ecological system as an approach to improve the management and governance of commonly held environmental resources [16].

Representation of Human–Environmental Decisions in Agent-Based Computational Modeling

Computational modeling approaches that emphasize socio-ecological interactions, specifically those that contribute to enhanced understanding of LUCC dynamics, have been widely used in recent decades [17,18]. An example is agent-based models (ABMs), which help to account for the agency of individual social actors of the socio-ecological system and their interactions with and impacts on the shared biophysical environment. The focus is on capturing actors’ heterogeneity, resource constraints, interconnectedness, and interactions that conjointly constitute their decision making [19,20,21]. Recent large review studies of ABMs have focused on the representation and characterization of human (agent) decision making, including implementation frameworks for the decision architecture, generically [21,22], at the narrow farm level as potential complements to traditional farm models in policy analysis [23], and specifically to LUCC-ABMs [11,21]. We draw on these reviews which concur that understanding and representation of human decision making, including in collective action settings, in ABMs remain underexplored. Huber et al. [21] specifically decry the reduced efforts to model farmers’ emotions, values, learning, risk and uncertainty, or social interactions as part of decision-making elements.
The main reasons advanced for such underexploration include the lack of context-appropriate socio-economic data and variables, and the challenging use of frameworks to parameterize those social/human behaviors properly and accurately. First, to formulate an appropriate context for the decision-making component, researchers use data from social surveys, role-playing games, semi-structured interviews, surveys, and expert knowledge to characterize and parameterize the behavioral aspects [11,18,24,25,26]. Smajgl and Barreteau [25], in particular, offer a generic characterization and parameterization (CAP) framework “that allows for a structured and unambiguous description of the characterization and parameterization process” (p. 29), and demonstrate its use in several modeling situations. However, their framework does not illustrate explicitly how to decompose the various types of data into decisions rules and their types and how to integrate them into empirical ABMs. The provided guiding options (e.g., steps M3 and M4b in particular) remain theoretical. Second, to incorporate a relevant framework, many human decision heuristics have been employed [11,26,27,28]. Nine types of decision models are mostly used in modeling human decisions in ABMs [26]. These include microeconomic models, space-theory-based models, psychosocial and cognitive models, institution-based models, experience/preference-based models, participatory agent-based modeling, empirical/heuristic rules, evolutionary programming, and assumption- and/or calibration-based rules. Some of these frameworks have been used in combination [26]. Balke and Gilbert [27] categorized 14 agent decision-making models along five main dimensions that incorporate: cognitive processes, affective aspects, social dimensions, norms, and learning. Groeneveld et al. [11] further investigated the use of theories to implement human decision making in LUCC-ABMs. They concluded that in cases where theories are used, preference is mostly given to the expected utility theory within a rational or a bounded rational paradigm. These authors suggested considering psychological theories and blending both cognitive and affective dimensions following the categories advanced by Balke and Gilbert [27]. While the challenge of behavioral theoretical grounding in LUCC-ABMs is an identified gap and barrier for the broader reusability and policy relevance of such ABMs, this study responds to the first specific need for enhancement of empirical ABM—the elicitation of decision rules from empirical multi-type data. This can contribute to easing the representation of the behavioral components.
We use insights from the GFT and the literature reviewed above to build a conceptual approach that allows us to systematically and comprehensively process and analyze data gathered from multiple sources to capture the decision making of human agents in LUCC-ABMs. Specifically, we use the approach to develop locally informed representations of farmers’ restoration decision making for a future simulation of associated socio-ecological outcomes at a higher (aggregate) forest-agricscape scale in Central Malawi using an ABM. While this study is part of a larger and growing body of research on participatory modeling ranging from the effective capture of human behavior in models on socioecological problems generically [29,30] to the capture of such behavior among farmers and other environment-related land managers [31,32,33], a detailed examination of participatory modeling for ABM is beyond the scope of this paper. As explained, the focus of this paper is only on our empirical-based approach to depicting the behavioral rules.

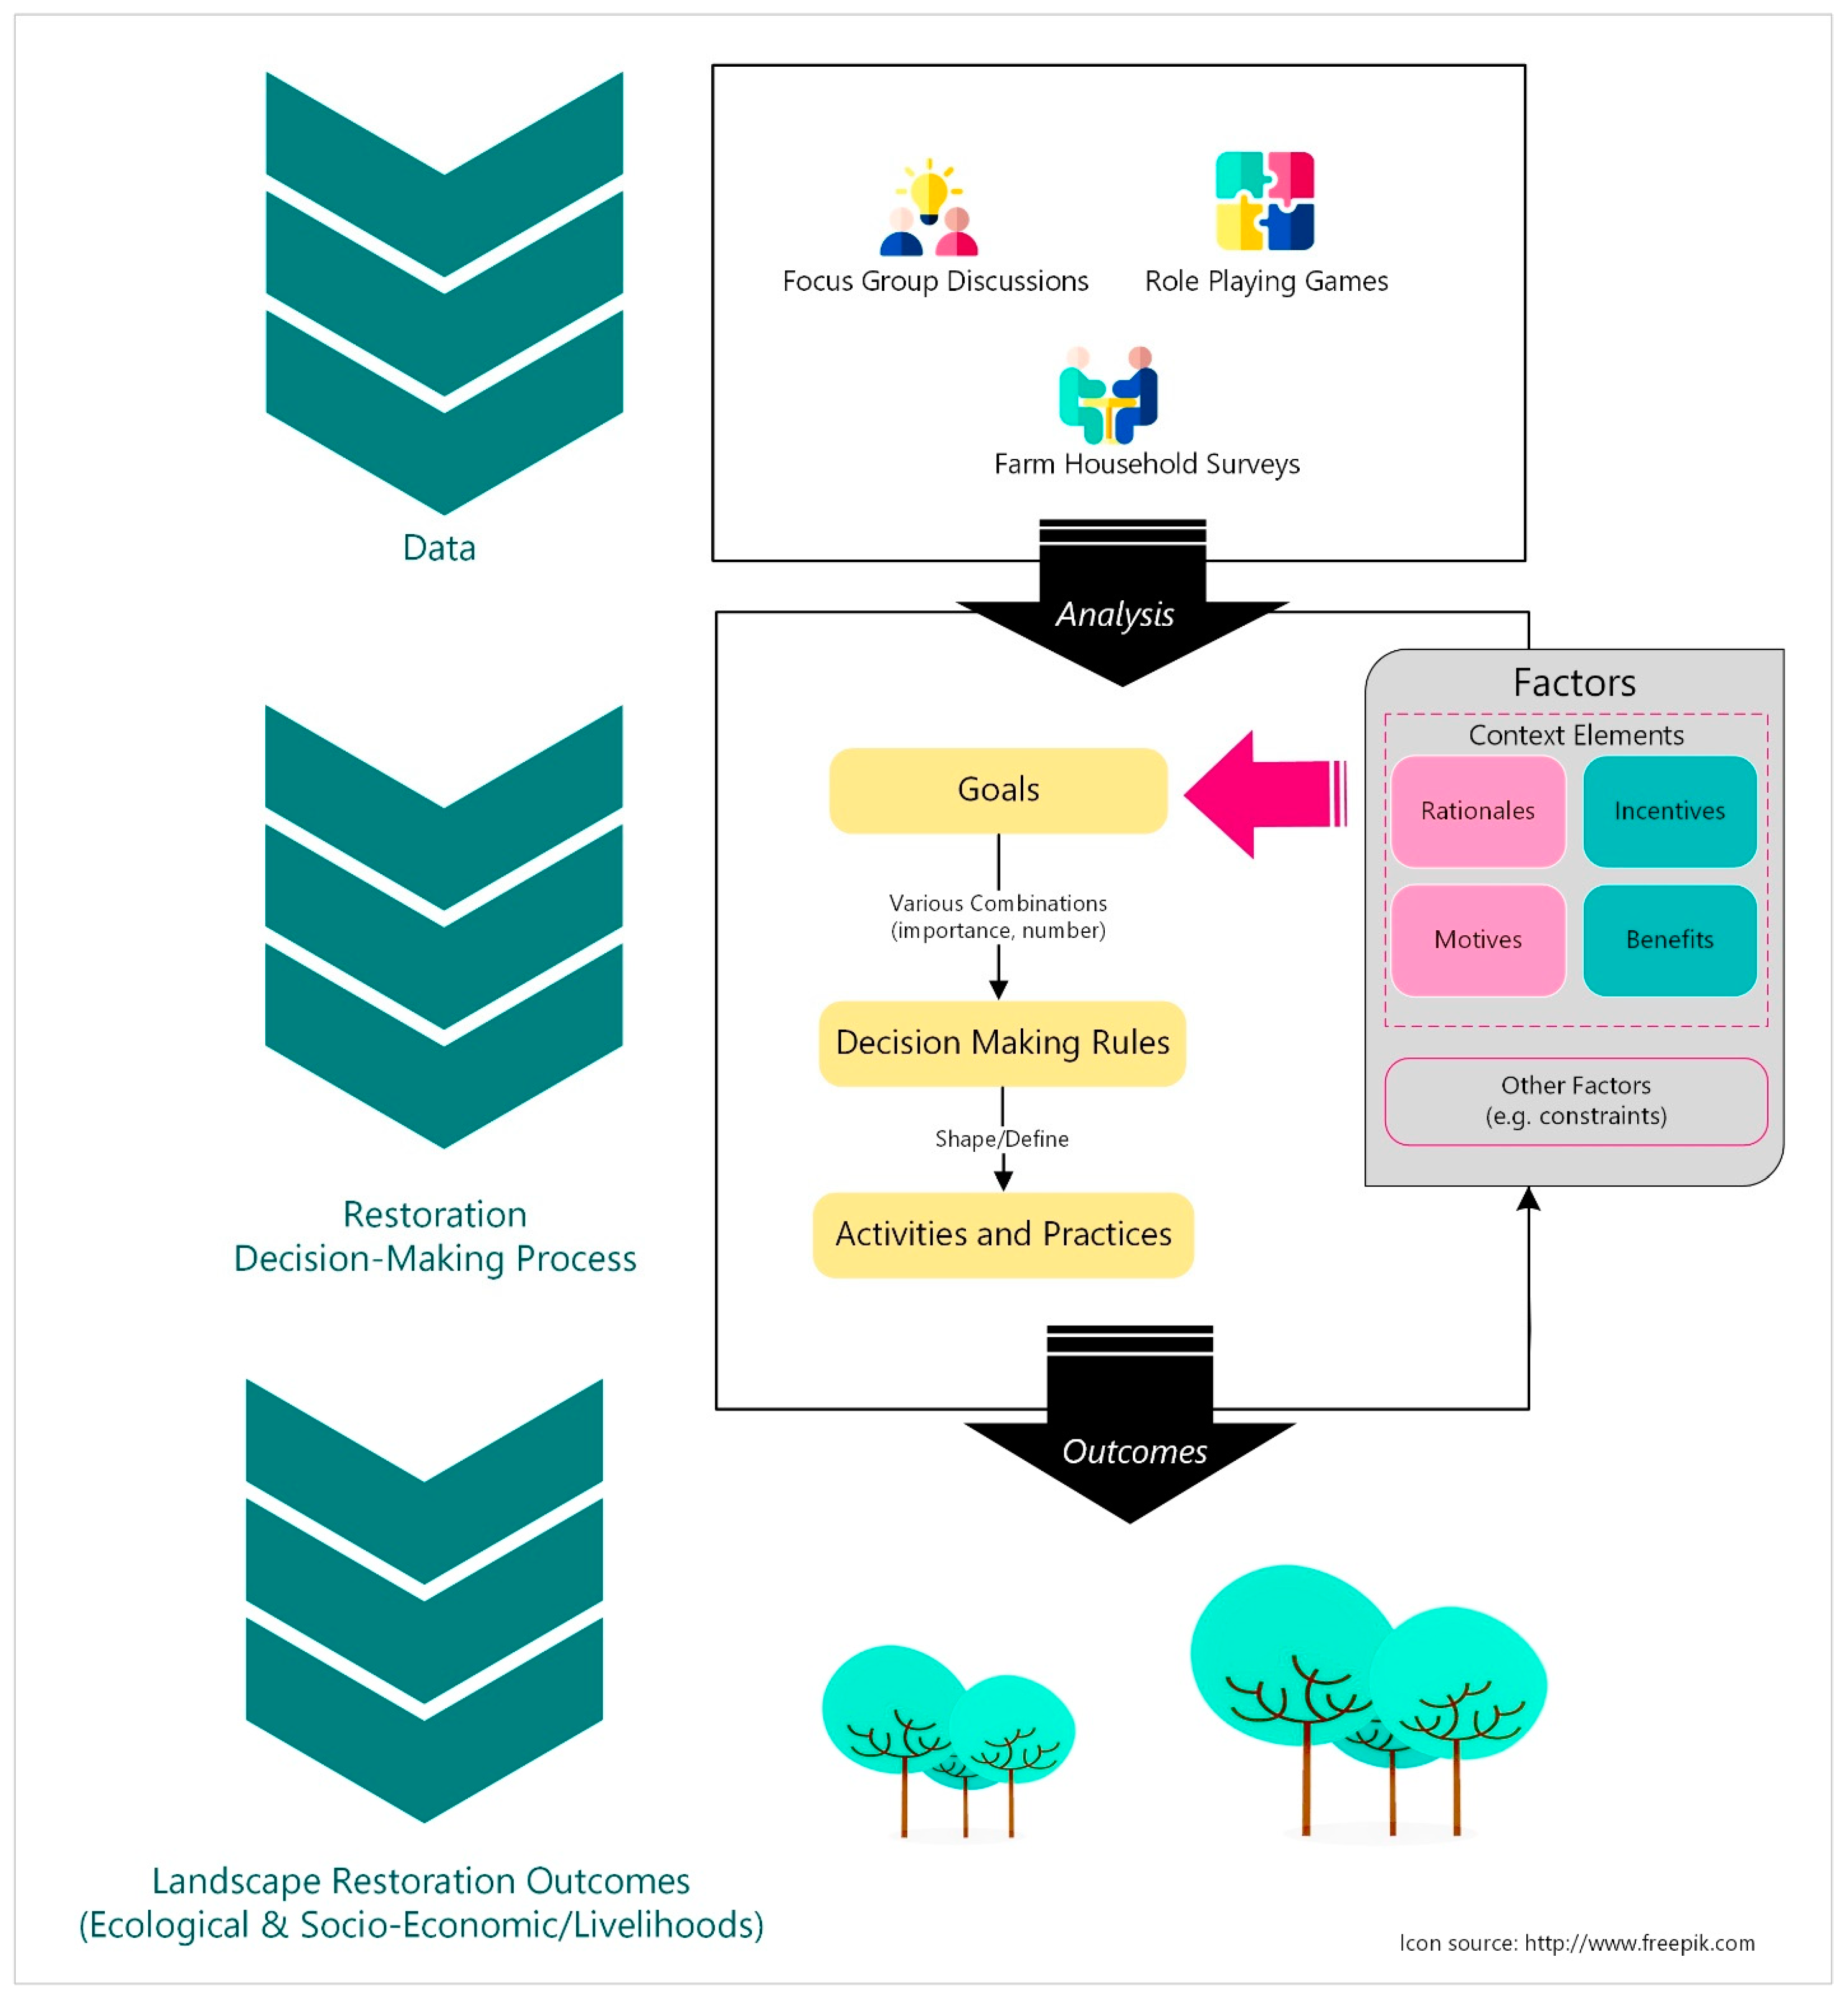
2.2. Conceptual Approach to Develop Restoration Decision Rules

We elaborate below on the approach (Figure 1) that we followed to arrive at the restoration decision rules (RDRs, rules for short) to use later in a future empirical LUCC-ABM (not part of this article) that simulates the restoration processes in the study area.
Data used in our study come from three different sources: focus group discussions (FGDs or discussions), participatory role-playing games (RPGs or games), and a farm-household survey (FHH, survey for short). Such a mixed-method approach, detailed further below, enables us to harness the analytical power of integrating data-gathering methods, data types, and data analyses to cross-validate the findings [34]. Data from discussions and games provide in-depth qualitative contextual information for the RDRs (rules); the survey furnishes numerical variables and parameters needed in the future LUCC-ABM.
To arrive at well-defined rules, we first depict the broader mechanisms in which the rules are embedded. We call these decision-making processes (DMPs, aka processes). We define them as explicit constructs that synthesize the overarching information on decision making for forest-agricscape restoration in the study area. These processes (DMPs) are executed through rules (RDRs), which we define as procedures that result in the implementation of specific restoration activities and practices. The rules are, therefore, the drivers of the observed restoration landscape.
To provide the context for the processes, we identified four groups of reasons that justify the undertaking of the various forest-agricscape restoration activities and practices: rationales, motives, benefits, and incentives. Restoration rationales are drivers of the rules that stem from logical reasoning (rational thinking). Restoration motives are more implicitly guided by worldviews, beliefs, and emotions. Benefits and incentives constitute rewards from a course of action. Benefits are endogenous (self-directed)—what individuals perceive as rewards that they generate if they undertake a specific restoration activity (e.g., economic, environmental). Incentives are exogenous—these are rewards obtained from outside sources—mainly gains (monetary and non-monetary) obtained from government programs or non-government organizations (NGO).
Separately from the context for the processes, we generated the rules from the data provided by farmers. The rules synthesize the articulated decision-making factors (factors), which we first grouped into categories representing the decision-making goal frames (goal frames). For example, Problem Solving constitutes a goal frame that reflects rational thinking to address perceived environmental problems with actions (cognitively imagined) that are adequate to meet the specified goal.
In this section, we have introduced our conceptual approach, unavoidably including many abbreviations for the constructs. In the consecutive sections, however, we use the alternative—simpler names provided in italics in the parentheses.

2.3. Study Area, Data Collection, and Analysis
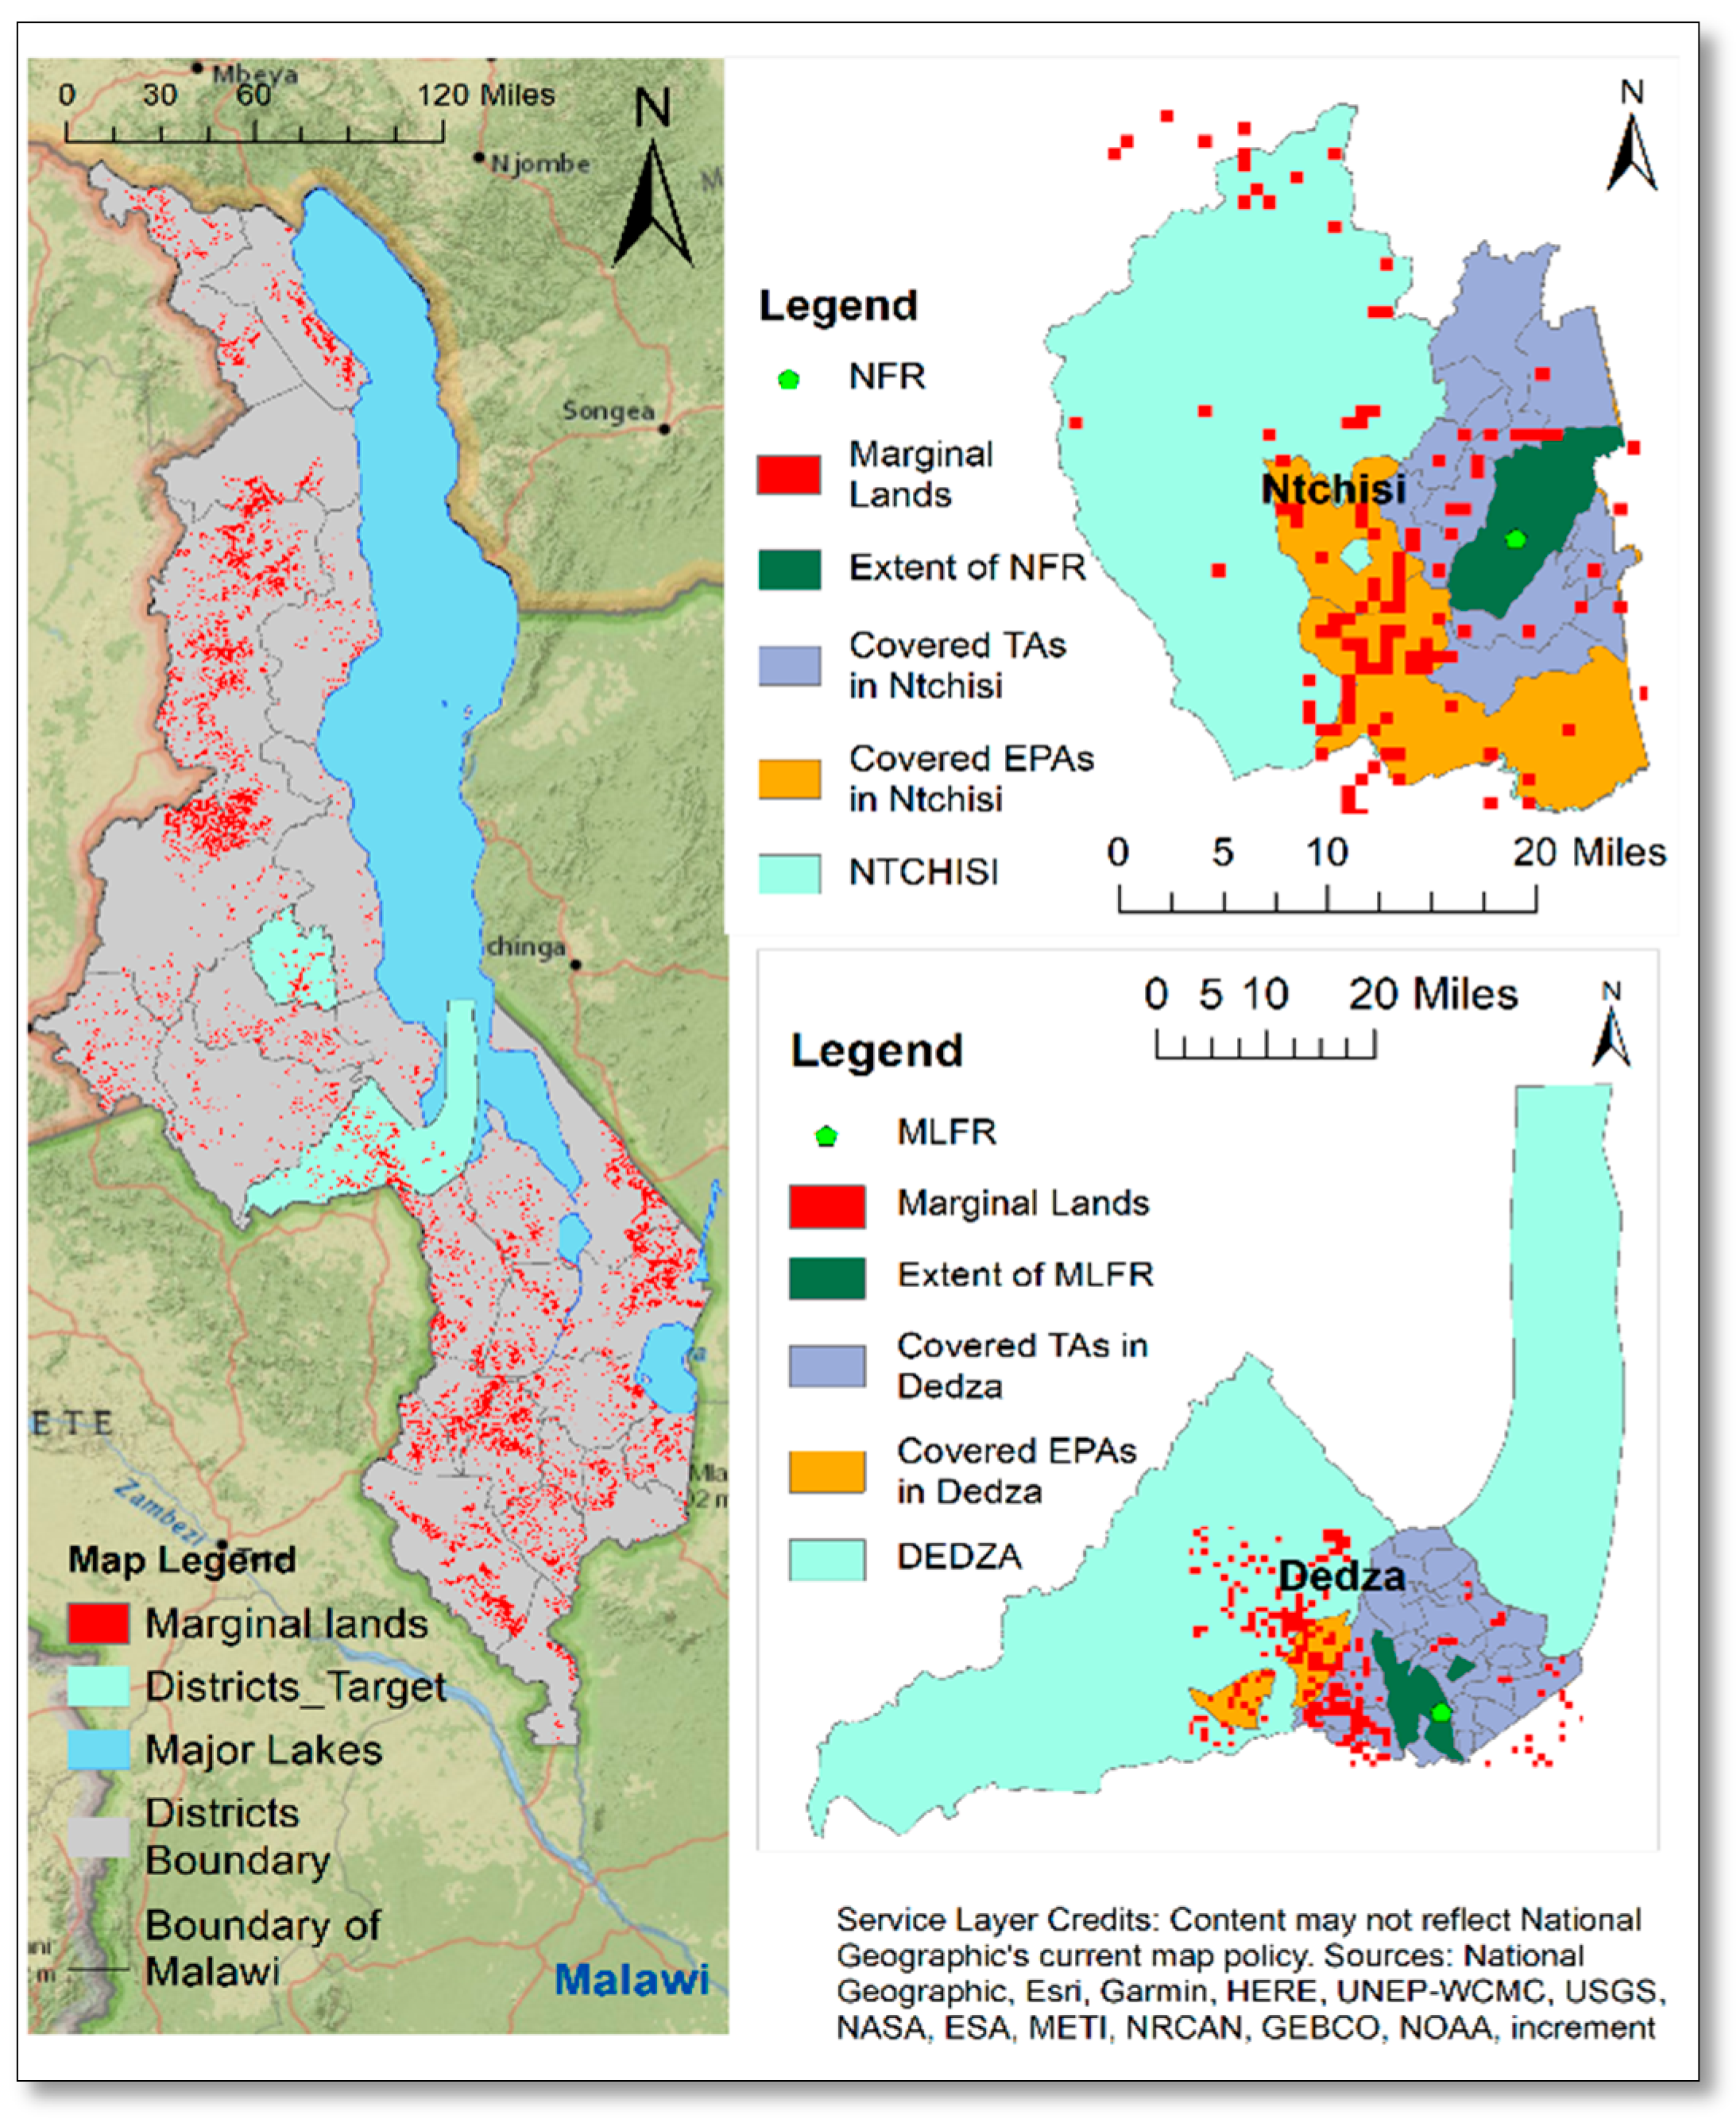
2.3.1. Study Area

We selected one research site in Ntchisi and one in Dedza districts in Malawi’s Central Region. The sites are forest-agricscapes defined by a forest reserve (Ntchisi Forest Reserve (NFR, 9720 ha) for Ntchisi district and Mua-Livulezi Forest Reserve (MLFR, 12,147 ha) for Dedza district); the adjacent community woodlots, including formally designated village forest areas (VFAs); and the adjacent agricultural lands on customary lands. On a jurisdictional level, we cover three traditional authority areas (TAs) in Ntchisi and two TAs in Dedza (Figure 2). The current environmental condition and potential future trajectory of each site is different, as are the underlying socio-political, cultural, and economic factors [35,36]. Both districts are part of ongoing national restoration efforts.

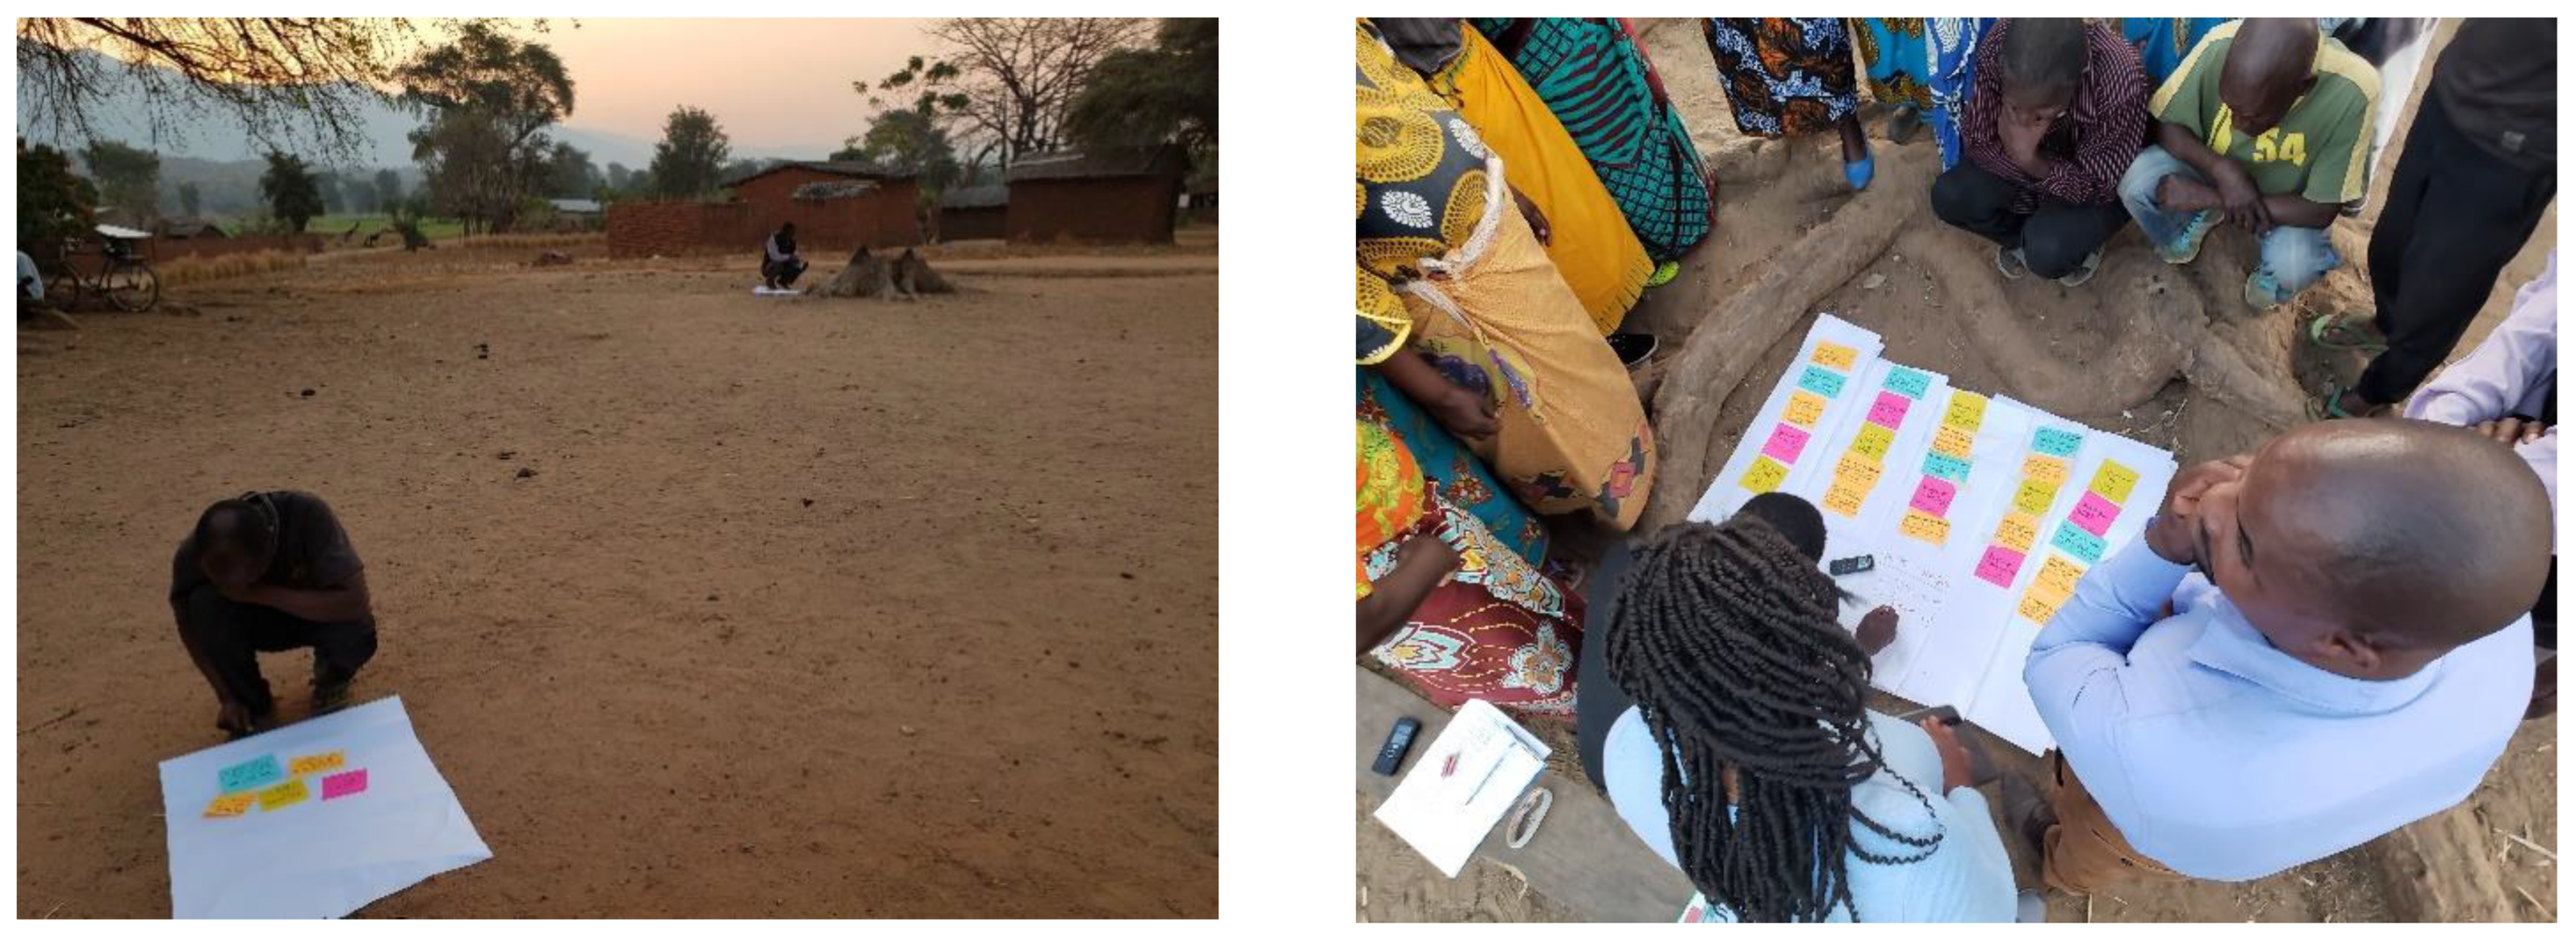
2.3.2. Data Collection

We conducted seven discussions of 15–20 participants to capture the rules underlying engagement in forest-agricscape restoration. We sought four discussions per district, two with representatives of collective resource-management groups and two with representatives of farmers engaged in restoration at farm-household level in separate venues. However, in Ntchisi district one of the discussions combined the two types of representatives (hence, seven discussions in total), with distinguished questions for individual and collective restoration. We selected the participants purposely with the help of local extension agent.
During the discussions, we used open-ended questions to gain insights into the general context for the development of the rules for both individual and collective restoration activities. Specifically, we sought farmers’ perceptions of environmental restoration, the (frequency of the) restoration practices and activities they use, and the reasons underlying the restoration behaviors. Since these narratives are more reflective than actionable, we also introduced games [37,38] where the participants were actively engaged in realistic restoration action-situations to express their behaviors. Through games, we could observe and gain insights on the “whys” and the “hows” behind farmers’ decisions to embark on individual and collective restoration activities under real-world circumstances. After listing their factors on colored cards, farmers ordered them by level of importance on flip charts. Sub-groups of 5–6 farmers then simulated their rules using the colored cards for ten minutes, separate from the others. The simulated rules were then subjected to plenary discussions where all the participants commented and discussed similarities or differences (Figure 3). Finally, farmers were asked if they would change the rules in case of extreme weather events such as floods and droughts, or when government policies (affecting environmental degradation) change.
Finally, we conducted a survey of 480 participants using a questionnaire entered into the Qualtrics software and administered in offline mode through tablets [39]. Data collected included farmers’ sociodemographic characteristics, engagement (or not) in restoration and associated practices, as well as underlying rationales, motives, benefits, and incentives. We also gathered farmers’ self-identified mental rules for engaging in individual-level restoration practices and for considering participation in collective action restoration activities.

2.3.3. Data Analysis

Our holistic analytical approach consists of complementing and cross validating the qualitative information from the discussions and games with the survey data. First, using Nvivo 12 pro, we code the text data to reveal themes related to local understandings of restoration; practices and activities; the rationales, motives, benefits, and incentives for restoration; and the restoration rules.
Second, using Stata 15, we describe the respondents’ socio-demographics as reported in Appendix A Table A1. We also perform descriptive analyses of variables representing the diverse restoration rationales, motives, benefits, and incentives. We compare them by gender, education level, and geographic location (i.e., TAs covered in the study) to show any statistically significant patterns. For this, we use non-parametric statistical tests of group-mean comparison including Student’s t-tests or one-way ANOVAs, where relevant. For the one-way ANOVA, we check for not only independence and normality, but also for variance homogeneity to guide appropriate post hoc multiple comparison tests. Specifically, we refer to the Scheffe test when the assumption of variance homogeneity is met following Bartlett’s test, and the Games and Howell test when the assumption is not met, to show differences among groups being compared.
Third, we combine the qualitative insights with the survey data to enhance our analyses of the restoration factors and rules at two levels. On one hand, we categorize the factors into goal frames. We start with the goal frames generated from the discussions and account for any new goal frames included in the survey. On the other hand, we link the rules drawn from the games (Figure 4 and Table 1) to the ones captured through the survey and estimate their occurrence. We note that most farmers in the survey emulated only one main mental rule for each restoration approach, although they were given three possibilities. We thus consider their main mental rules for eliciting the potential rules from the survey.
The rules simulated during the games showcase various combinations of 3–4 goal frames on average. Similarly, the individual mental rules from the survey are based on 2–4 goal frames on average (Table 2).
Overall, the crossed insights from the games and the survey suggest that the absence or presence of the goal frames creates distinctive rules. Therefore, in accounting for all possible rules from both types of data, we create variables consisting of 2–4 goal frames for which we fix, alternatively, the most recurrent goal frames.

3. Results

3.1. Forest-Agricscape Restoration and Restoration Activities and Practices

We uncovered five different ways local farmers understand restoration of degraded forest-agricscapes, including the activities and the practices they implement (Table 3). An important observation was the connections farmers made with afforestation/reforestation, soil, and water conservation, and addressing land degradation and soil fertility decline to illustrate complementarity of restoration activities for soil, water, and forest resources.
Restoration practices were both vegetation-based and non-vegetation-based. For the former, mostly implemented for afforestation/reforestation and soil-fertility improvement, farmers cited: planting vetiver grass; practicing agroforestry with fertilizer trees; planting indigenous trees in bare areas and along rivers/stream banks; managing natural regeneration (pruning); and developing woodlots. For non-vegetation-based activities, often implemented for soil and water resource conservation on farms and forest-resource management, farmers listed: making contour, marker, and box ridges; constructing swales and water-check dams; applying manure; practicing mulching and doing no or minimum tillage as part of conservation agriculture; using intercropping and crop rotation; making fire breaks; and keeping beehives.
Furthermore, the types of collective action groups that engage in restoration endeavors ranged from tree-nursery management groups, forest-reserves management groups, village forests management groups, land and water resources conservation groups, to irrigation groups, beekeeping groups, and cookstove-making groups. Forest-related collective actions were part of the formally recognized Village Natural Resources Management Committees (VNRMCs), and the other collective actions made up what is commonly referred to as Community-based Natural Resources Management Committees and resource users’ groups. Activities implemented in collective actions are illustrated below.
“We do swales making, conservation agriculture with mulching and minimum tillage, tree planting and management, vetiver planting, construction of check dams, making and applying of manure. For example, in manure making, we conduct trainings to encourage people to make and use manure. In tree management, we make tree nurseries, prepare land for tree planting; we do actual planting of trees, making firebreaks to prevent trees from uncontrolled fire.”
(FGD, Bwanali Community, Kachindamoto, Dedza)
“As VNRMC, we do a lot of things to protect and manage trees through encouraging community members to have individual forests and protect the trees as we were trained by PERFORM [a forest project]. We also make sure that people are collecting firewood sustainably as trained by PEFORM. We also do patrols to check whosoever is illegally harvesting trees. We also use firewood-saving cookstoves as a way of reducing firewood that we use to cook.”
(FGD, Ntchisi)
These activities epitomize and exemplify the nexuses in the restoration and management of lands, water, trees, and forests.

3.2. Farmers’ Restoration Rationales, Motives, Benefits, and Incentives in Central Malawi

Farmers evoked several reasons justifying why they undertake restoration activities and practices. These provided a contextual understanding of the complex factors involved in their restoration decision making.

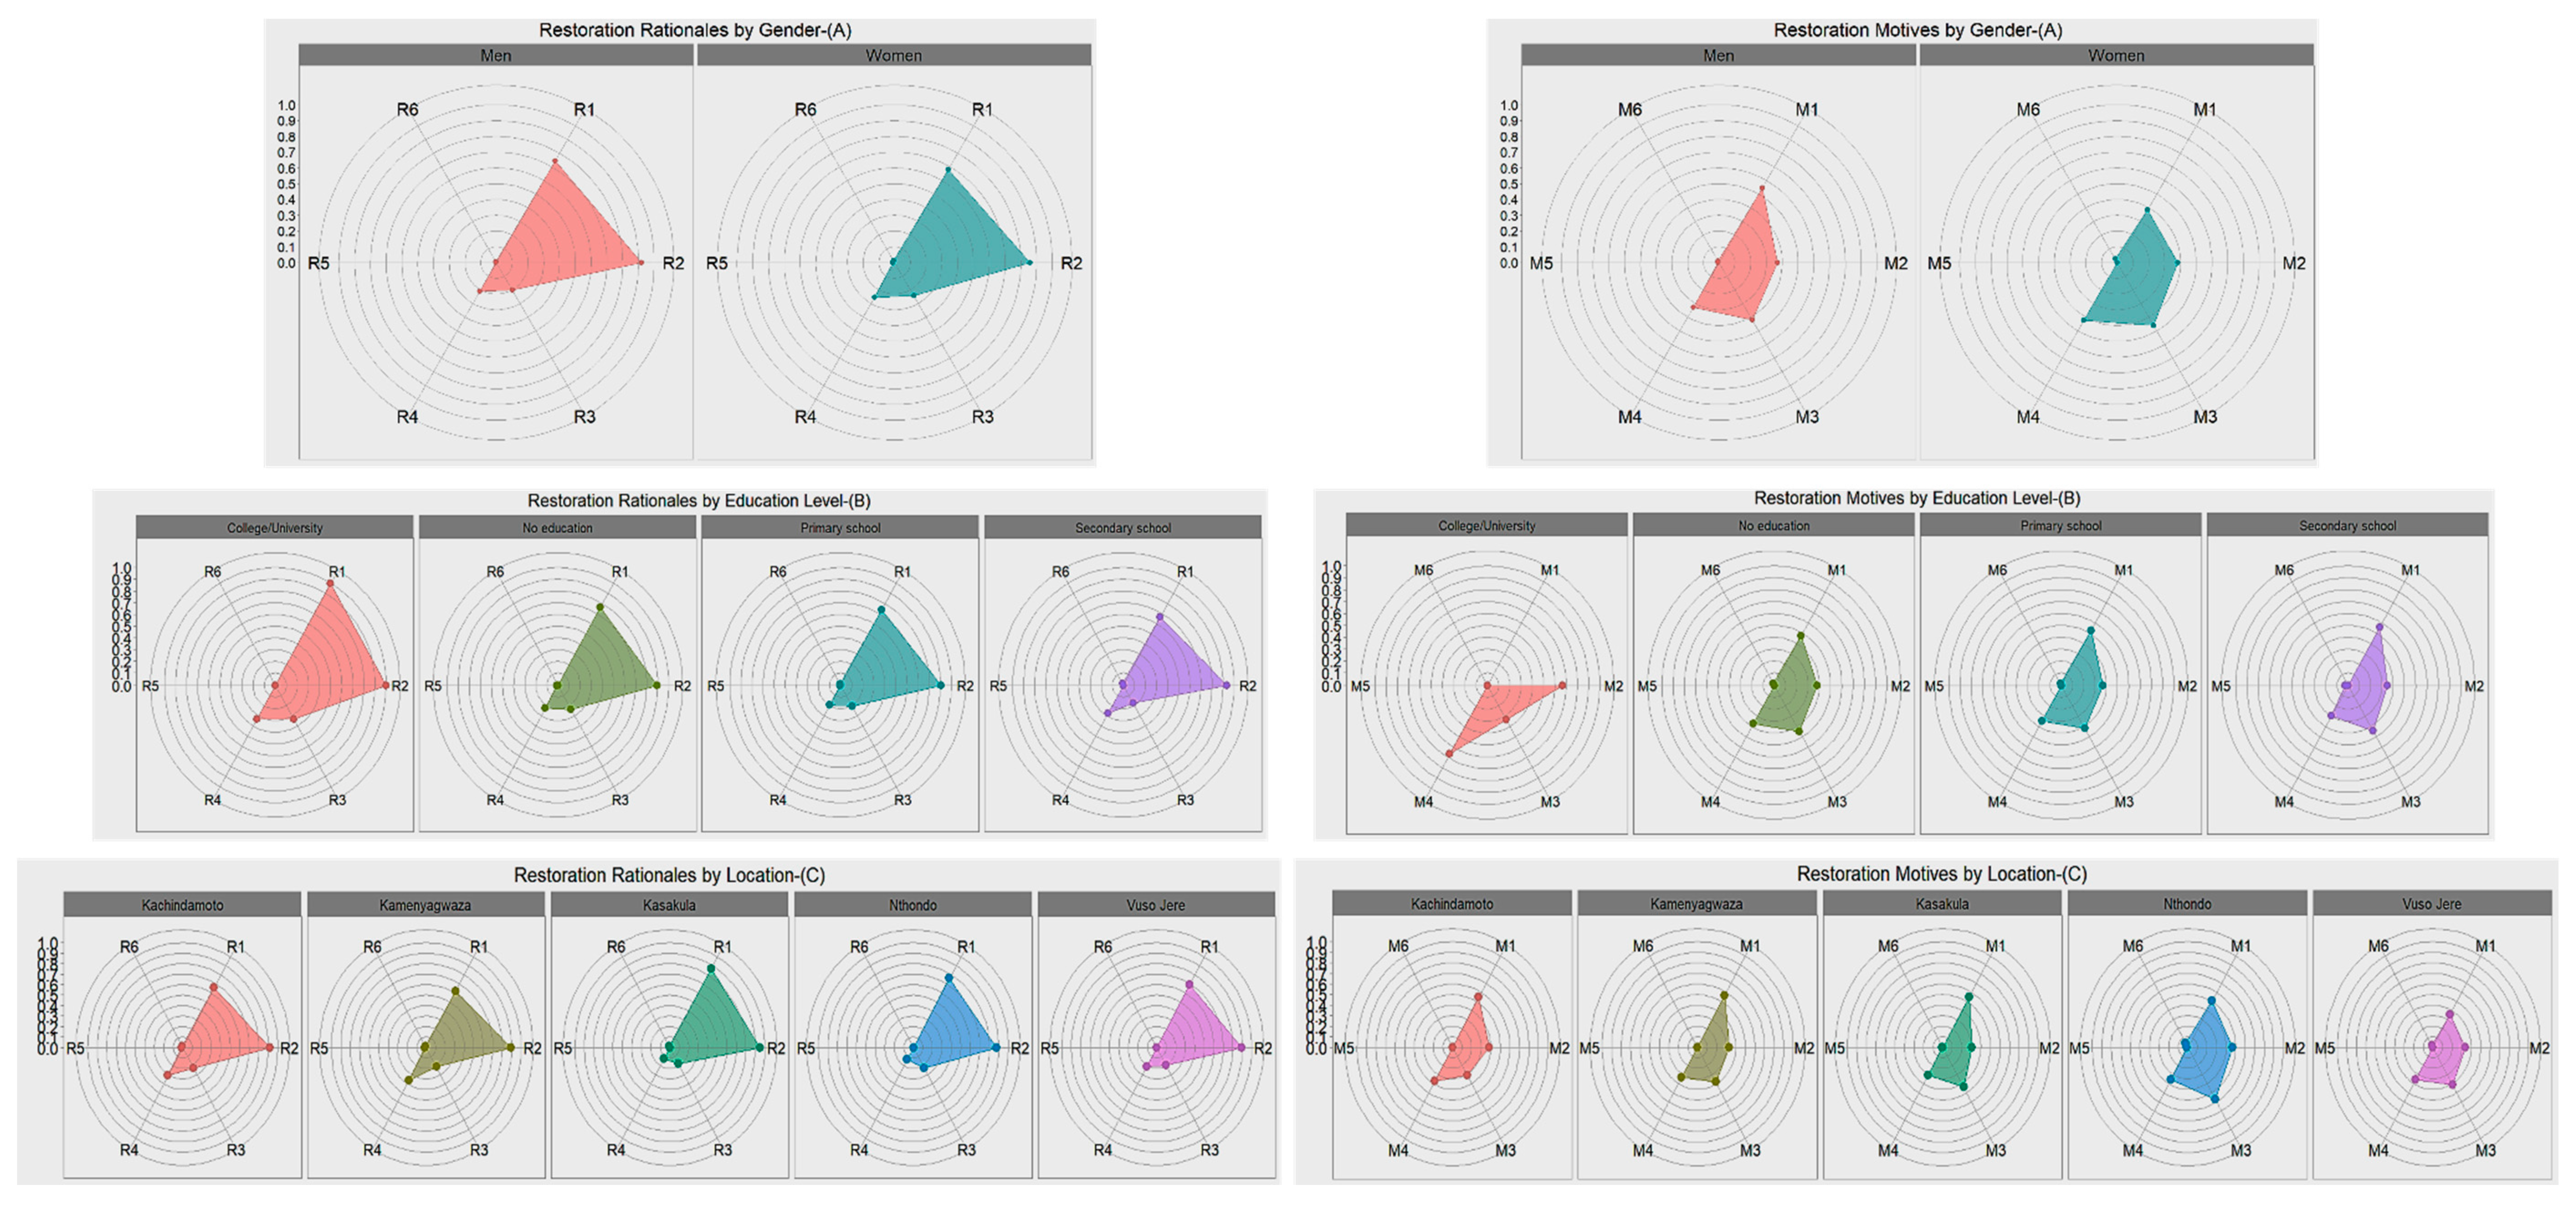
3.2.1. Farmers’ Restoration Rationales and Motives

Farmers’ rationales for restoration at the individual level included concerns for environmental degradation and its adverse impacts on people’s lives, severe soil erosion, wind-induced destruction in treeless landscapes, changing climate, and declining soil fertility that reduces crop yields. Therefore, the aspirations and actions prescribed by logical reasoning to address those issues included keeping trees to reduce land erosion/degradation caused by runoff, improving soil fertility to harvest higher yields by using adequate fertility-enhancement farming methods, and growing trees that also served as windbreaks to protect houses and prevent other property destruction. Some farmers from both Ntchisi and Dedza (Kapenuka and Bwanali communities) illustrated these logics: “before starting restoration activities, I was experiencing heavy soil erosion but after planting vetiver grass, soil from my field has stopped eroding”; “before I started conservation agriculture, I was harvesting little”; and “with increased population growth and inadequate farmlands, this has made us to change to new farming methods that improve soil fertility, and we are restoring soil fertility to maximize yields […] I practice crop rotation to maximize yields.” Further illustrations of restoration rationales include: “we have realized that climate has changed, for instance we are receiving unreliable rains […]”.
At the collective level, objective arguments boiled down to the need to protect the environment, maintain reliable rains, conserve trees for the next generation given growing tree scarcity, sustainably use forest resources by reducing demand on forest products along with using efficient cookstoves that demand less firewood, and conserving soil and water resources that are being degraded. In terms of forest resources, farmers referred to both state-owned and community forests. The following excerpts are illustrative.
“People have interest in tree planting both individually and collectively because of scarcity of firewood and to maintain reliable rains that come when the forest is intact. We also want to conserve trees for our generation. With the pace [at which] trees are being cut down, our children will not have the chance to know some tree species, for example ‘Mbawa’ [Pterocarpus angolensis].”
(FGD, Kapenuka Community, Kamenyagwaza, Dedza)
“We get involved in community work because we have similar objectives of protecting and restoring the environment that is being degraded. We have the same purpose of forest protection [because] trees provide fresh air and can host our beehives, and people do not cut trees where there is beehive as they are afraid of bees.”
(FGD, Kabulika Community, Kachindamoto, Dedza)
Restoration motives included influences from peers, encouragement and incitation from local authorities, and sensitization from NGOs, projects, and project funders. In both districts and across the discussions, some individuals affirmed these restoration motives in language such as: “I was also influenced by my friend who is in the scheme. I admired her harvesting more yields and she had food all the year”; and “forest officers in coordination with local leaders [Traditional Authorities and Group Village Headmen] urge us to plant trees and conserve soil.” Concerning sensitization, one farmer’s views from Ntchisi were representative: “People have been sensitized by NGOs on importance of restoring the environment. They tell us to conserve soil by making contour lines.” The narratives were similar for collective-level restoration motives among farmers from the Kabulika community, emphasizing awareness raising by external actors: “we receive many motivations from NGOs; EU gave us beehives first before World Vision came also with beehives”, observed one. Another farmer from Kapenuka voiced the widespread reliance on extension workers, along with NGOs: “we are encouraged by extension workers to work in collective action and we are also motivated by projects that require people to work in groups.”
We observed that the line setting apart restoration rationales and motives is not always crisp—these two underlying reasons are often interrelated. For instance, farmers from Bwanali community in Dedza explained during a discussion that “we were experiencing floods but after being trained to dig water check dams, we are able to control runoff that causes erosion also. Water is also conserved and controlled through swales and contour ridges.”

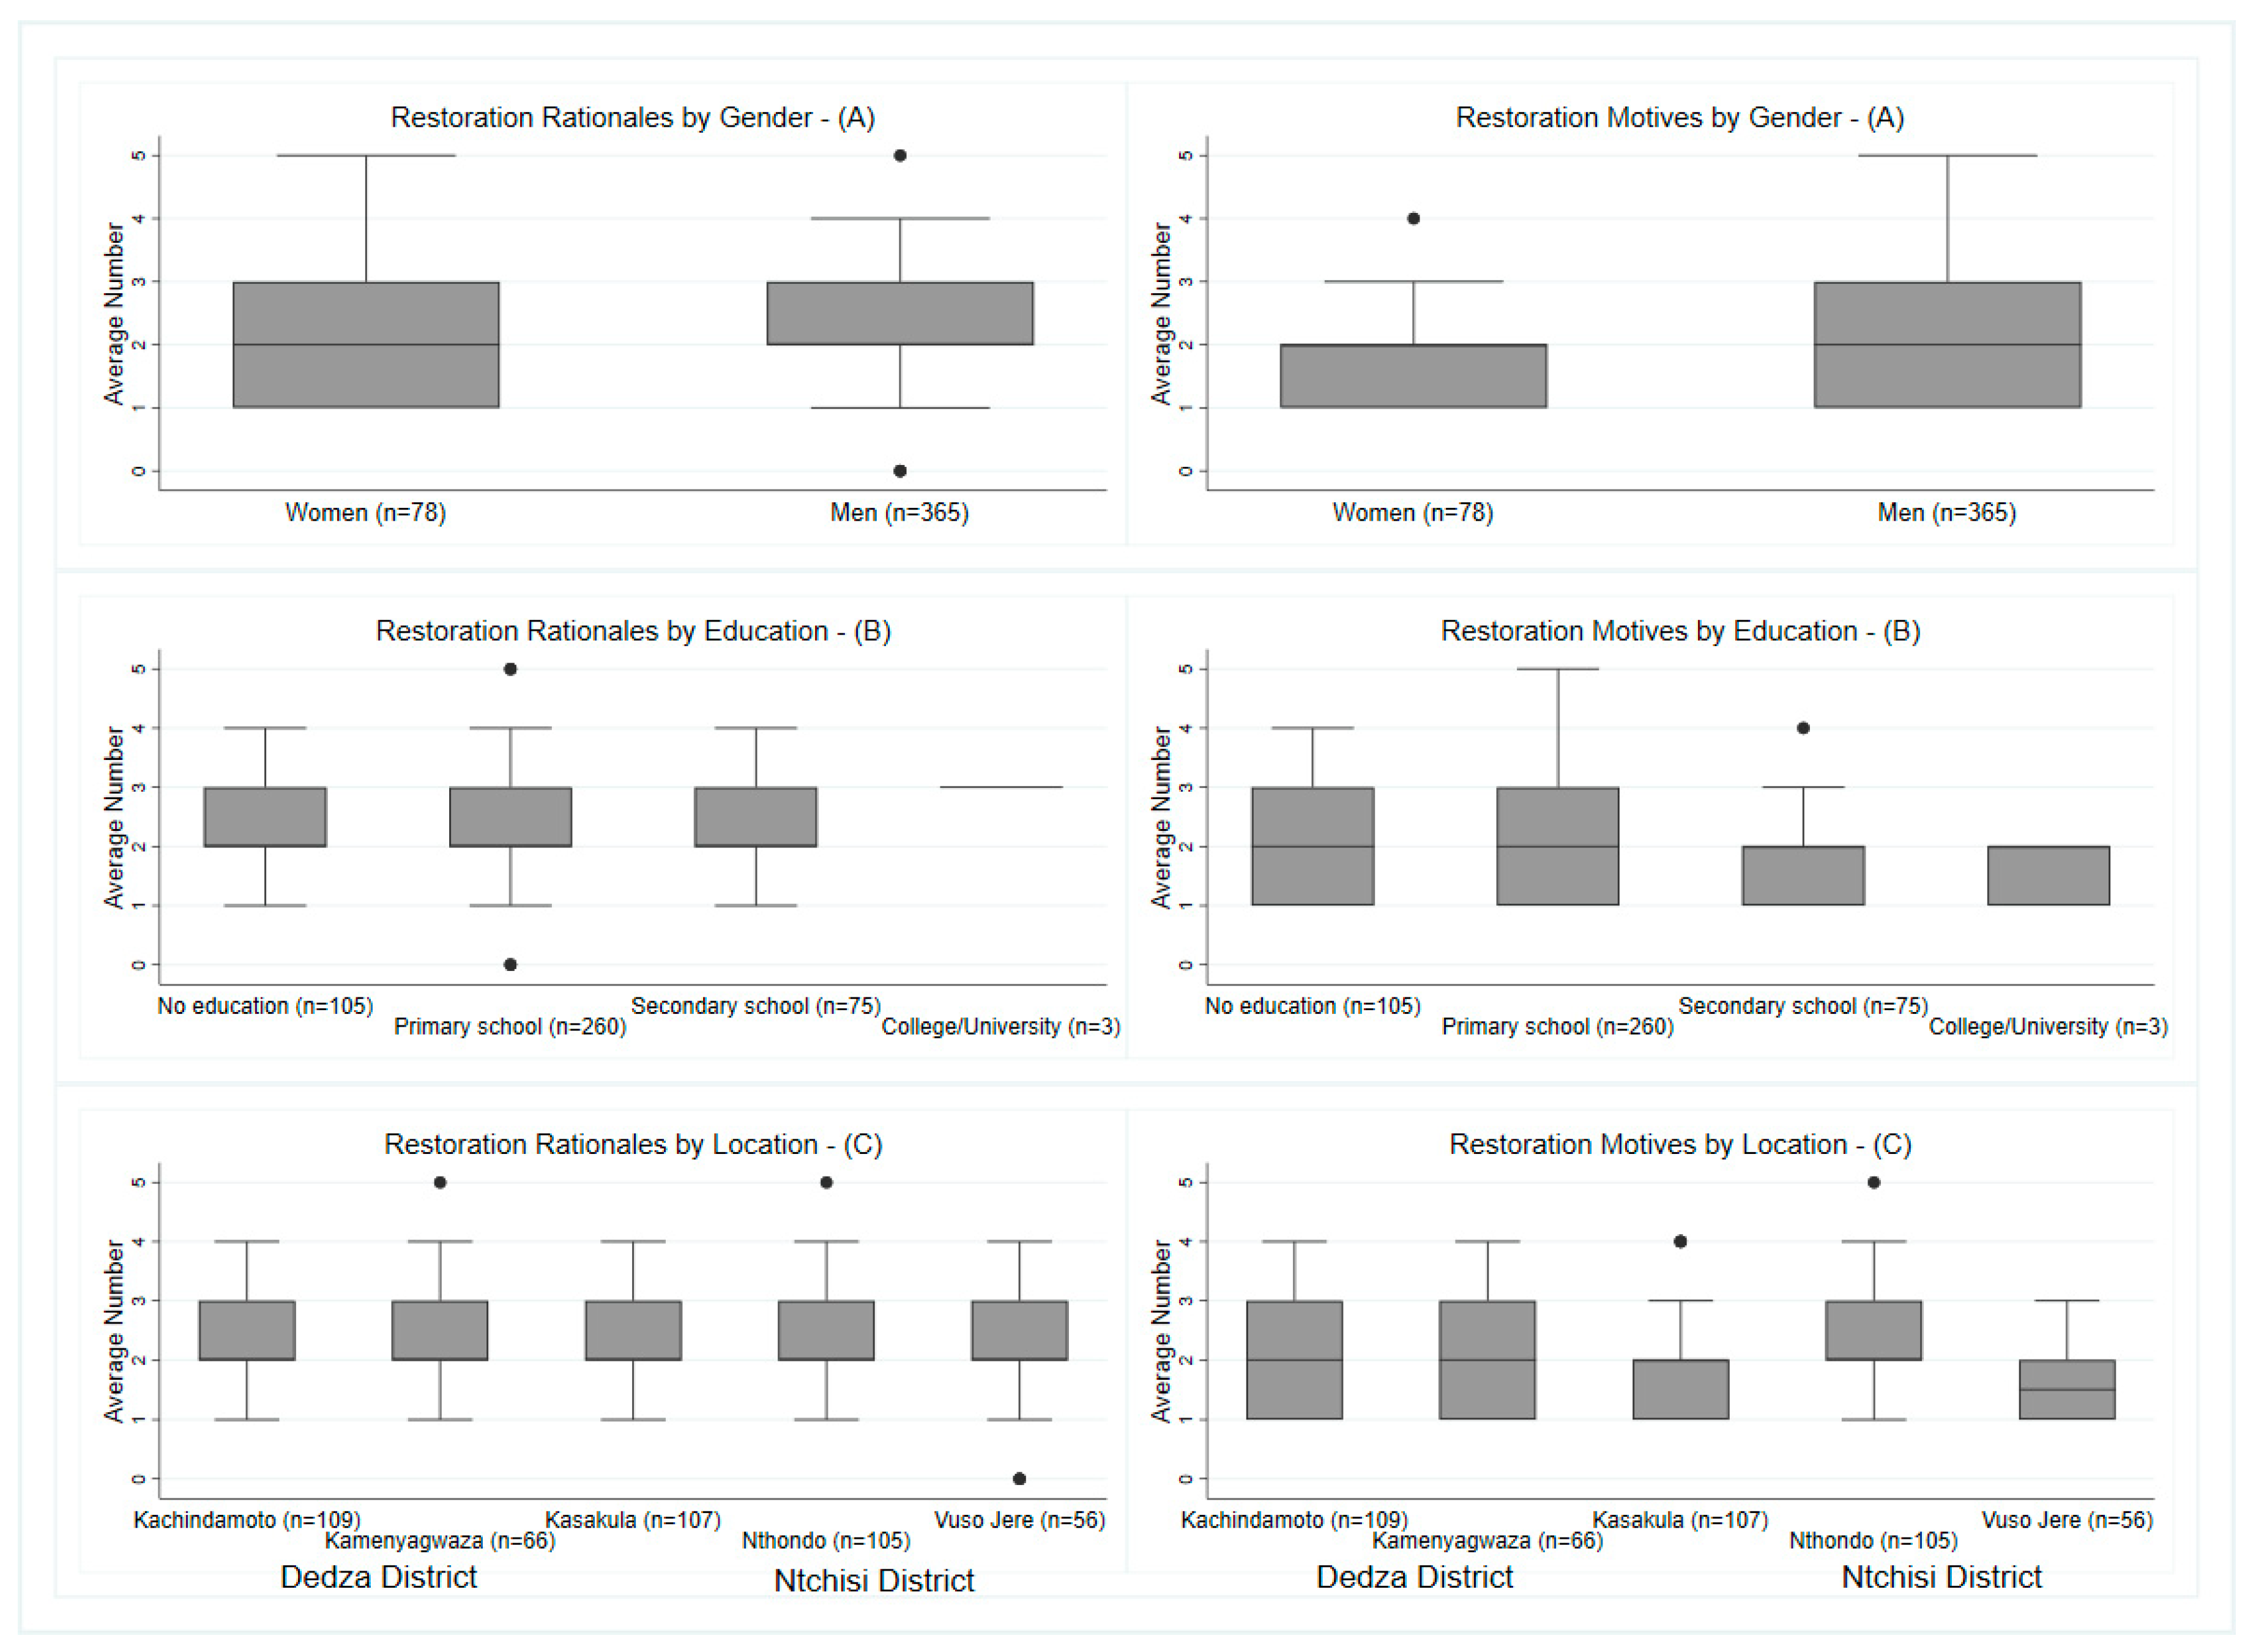
Importance and Variability of Restoration Rationales and Motives by Gender, Education, and Location

The survey data reinforced the qualitative findings and revealed such interchangeability between restoration rationales and motives. On average, farmers considered 2 ± 0.9 rationales and ≈2 ± 0.9 motives. Specifically, the two most important restoration rationales were the acuteness of observed land degradation (soil erosion and formation of gullies) and low soil fertility (perceived as driving low crop yields), as mentioned by 91% and 73% of responding farmers, respectively. Other less important rationales were the difficult provision of biomass energy due to scarce firewood and scarce trees to produce charcoal (22%), and the awareness of and sensitivity to biodiversity loss (21%). The most critical restoration motives were project-based motivations, either through incentives from NGOs or government programs (52%), or through the demonstrated leadership, encouragement, and support of local authorities—the Traditional Authority—for their community (43%). Influences from either peers and friends or the media (37%), and altruistic behaviors or environmental civism in the context of scarce resources (35%) were next in importance. Specific rationales that were interchangeably considered as motives (mostly in Nthondo and Vuso Jere TAs) included severe soil erosion and land degradation, low yields, deforestation, and rainfall scarcity.
When compared by gender, education levels, and locations (Appendix A Table A2), gender did not show any statistically significant difference in terms of average numbers of rationales or motives applied. On average, both men and women consistently considered two rationales and motives each (Figure 5, panel A). Their rationales and motives for engaging with restoration activities are like the ones described above, with similar relative importance levels (Figure 6, panel A). Likewise, there was no statistically significant difference in the average numbers of restoration rationales and motives among the education levels attained (Figure 5, panel B). The typical motives and rationales described above are also applicable across the different education levels (Figure 6, panel B).
In contrast, for the locations there are some statistically significant differences (p = 0.0106) for the average number of restoration motives, but not for the average number of restoration rationales advanced (Figure 5, panel C). That the restoration motives are different across the locations is vital to underscore, and such differences lie at two levels as suggested by the post hoc comparison tests. First, across all the five TAs, farmers in Vuso Jere consider fewer motives (<2) than their peers from the other four TAs (≥2), and this is strongly apparent when compared with TA Nthondo. The second difference centers on how some motives varied in importance from one location to another (Appendix A Table A2). One prominent example is the “leadership, encouragement, and support of local authority (M3)” when compared between TA Nthondo in Ntchisi District and TAs Kachindamoto and Kamenyagwaza in Dedza District (Figure 6, panel C). During the discussions in Ntchisi, farmers from Nthondo emphasized how their traditional authority encourages them and holds strong and respected leadership for addressing environmental degradation.

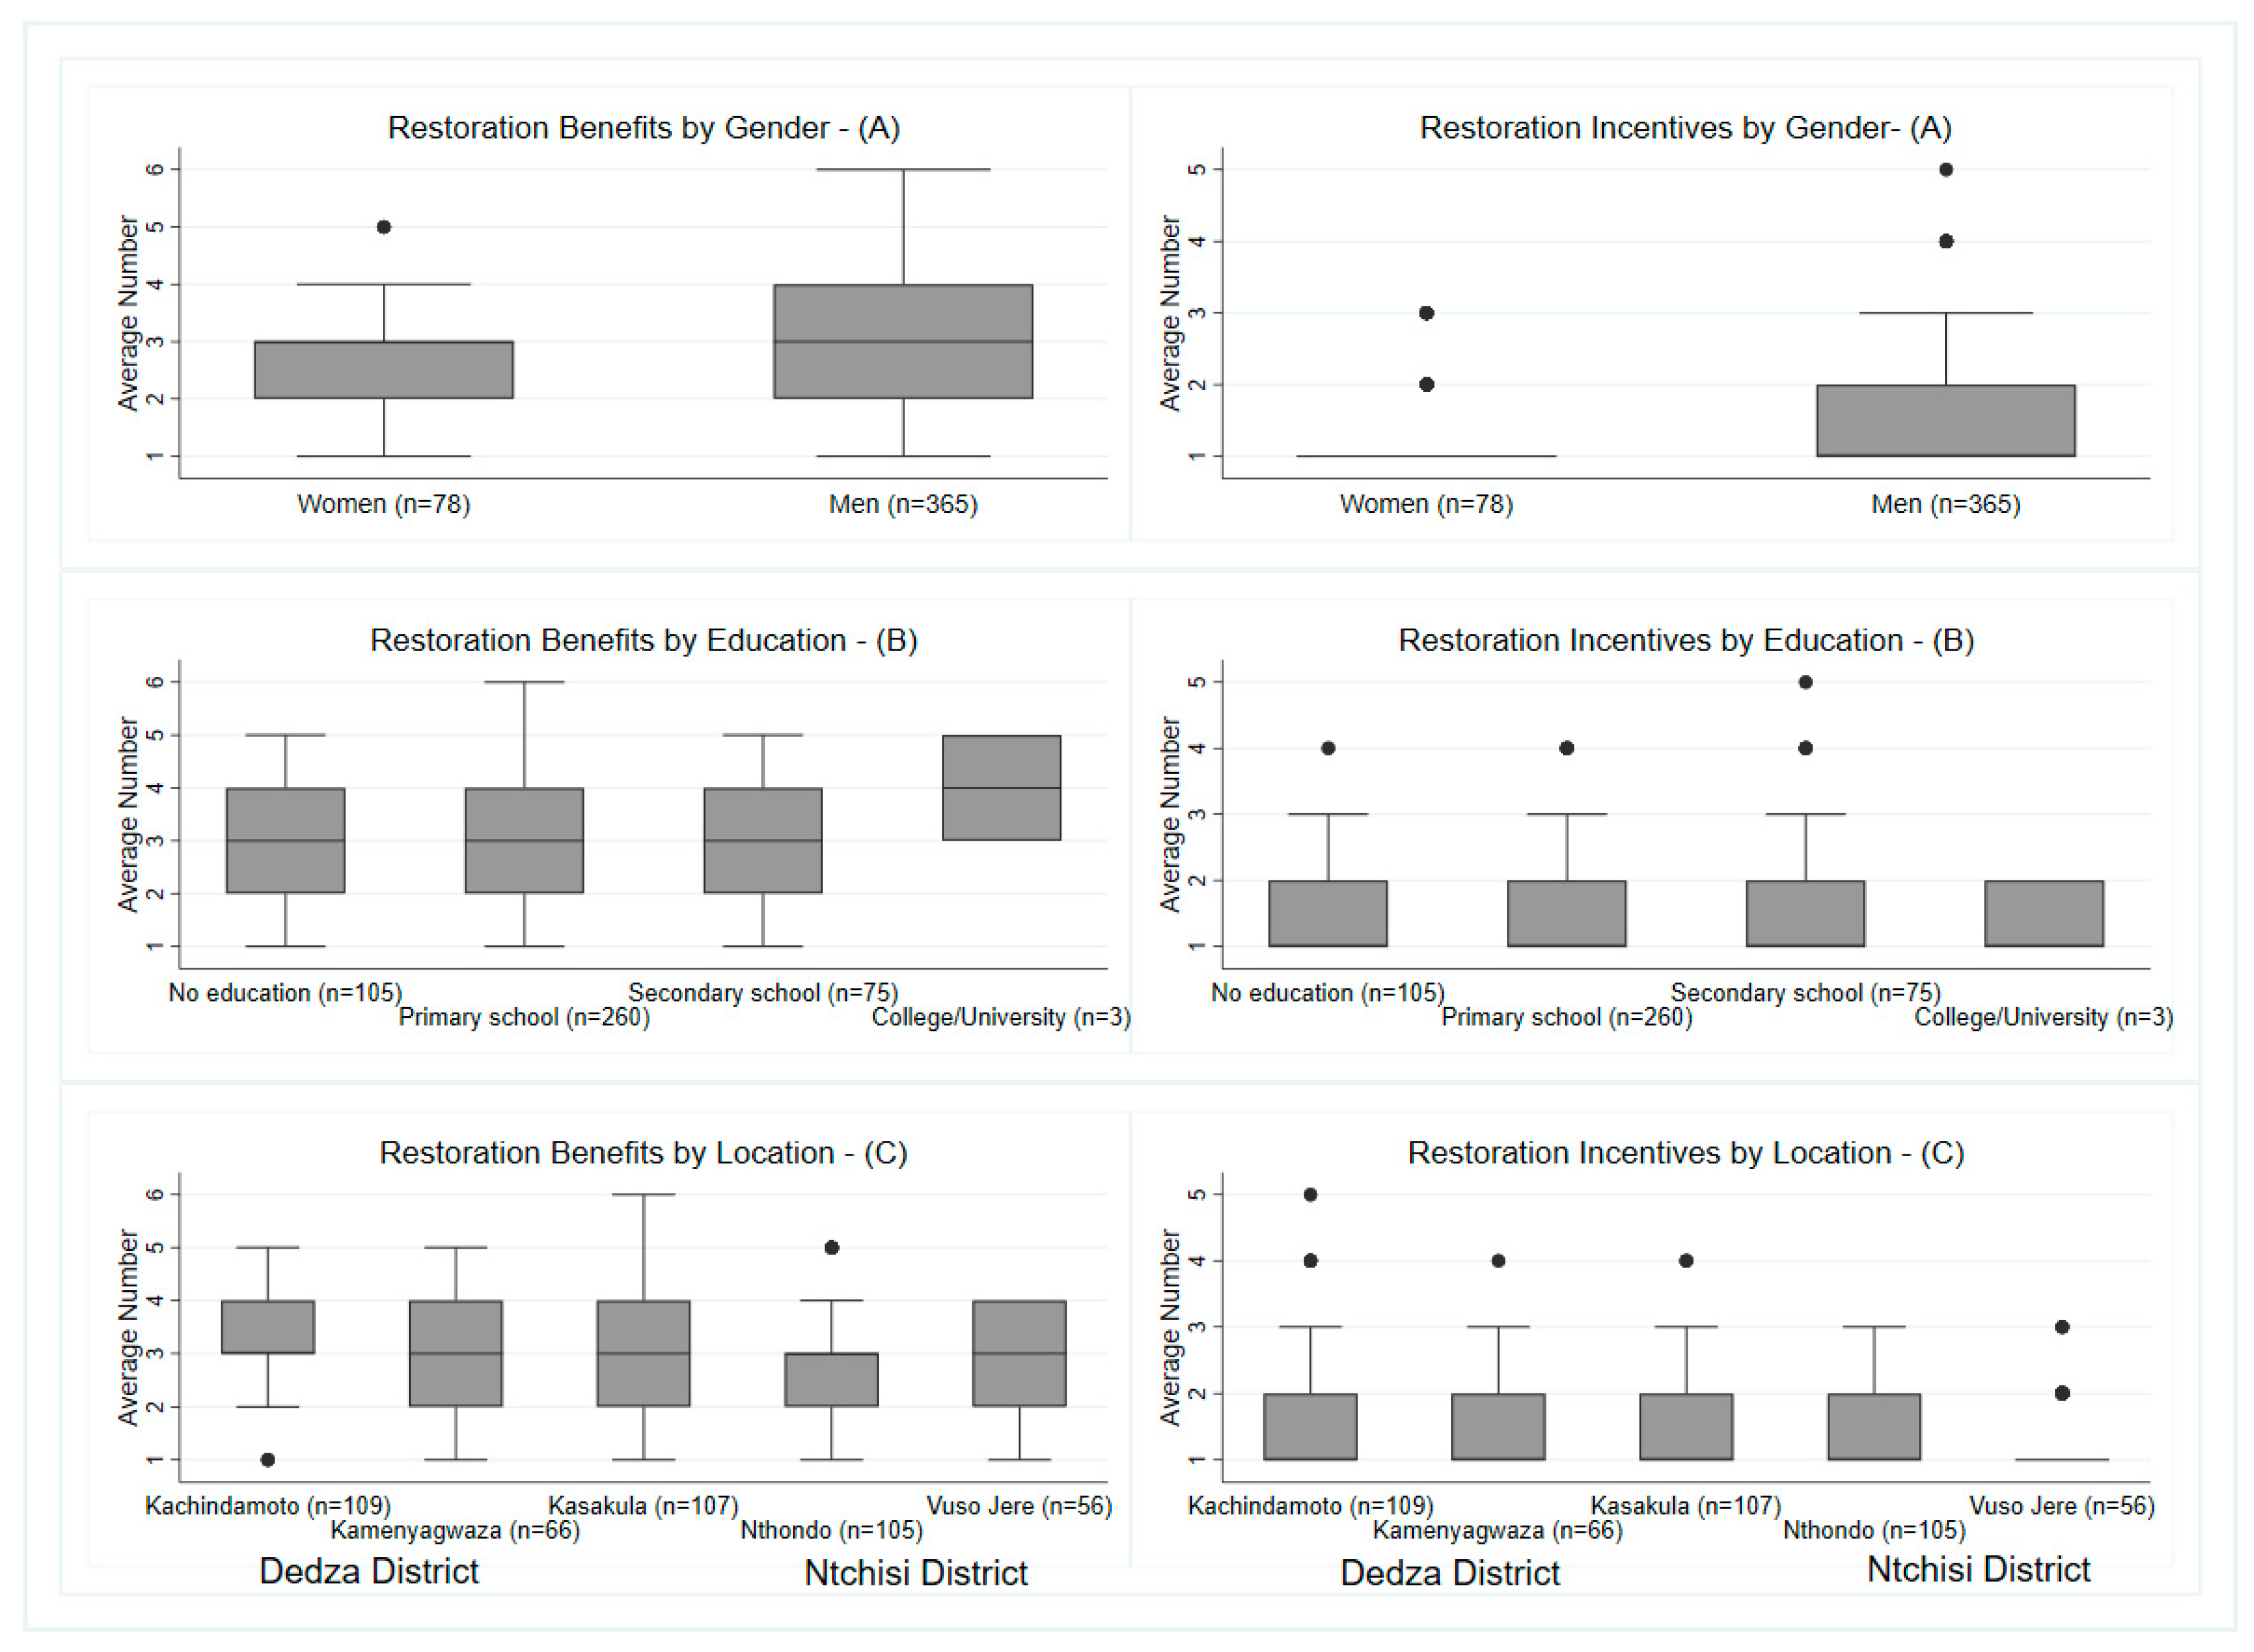
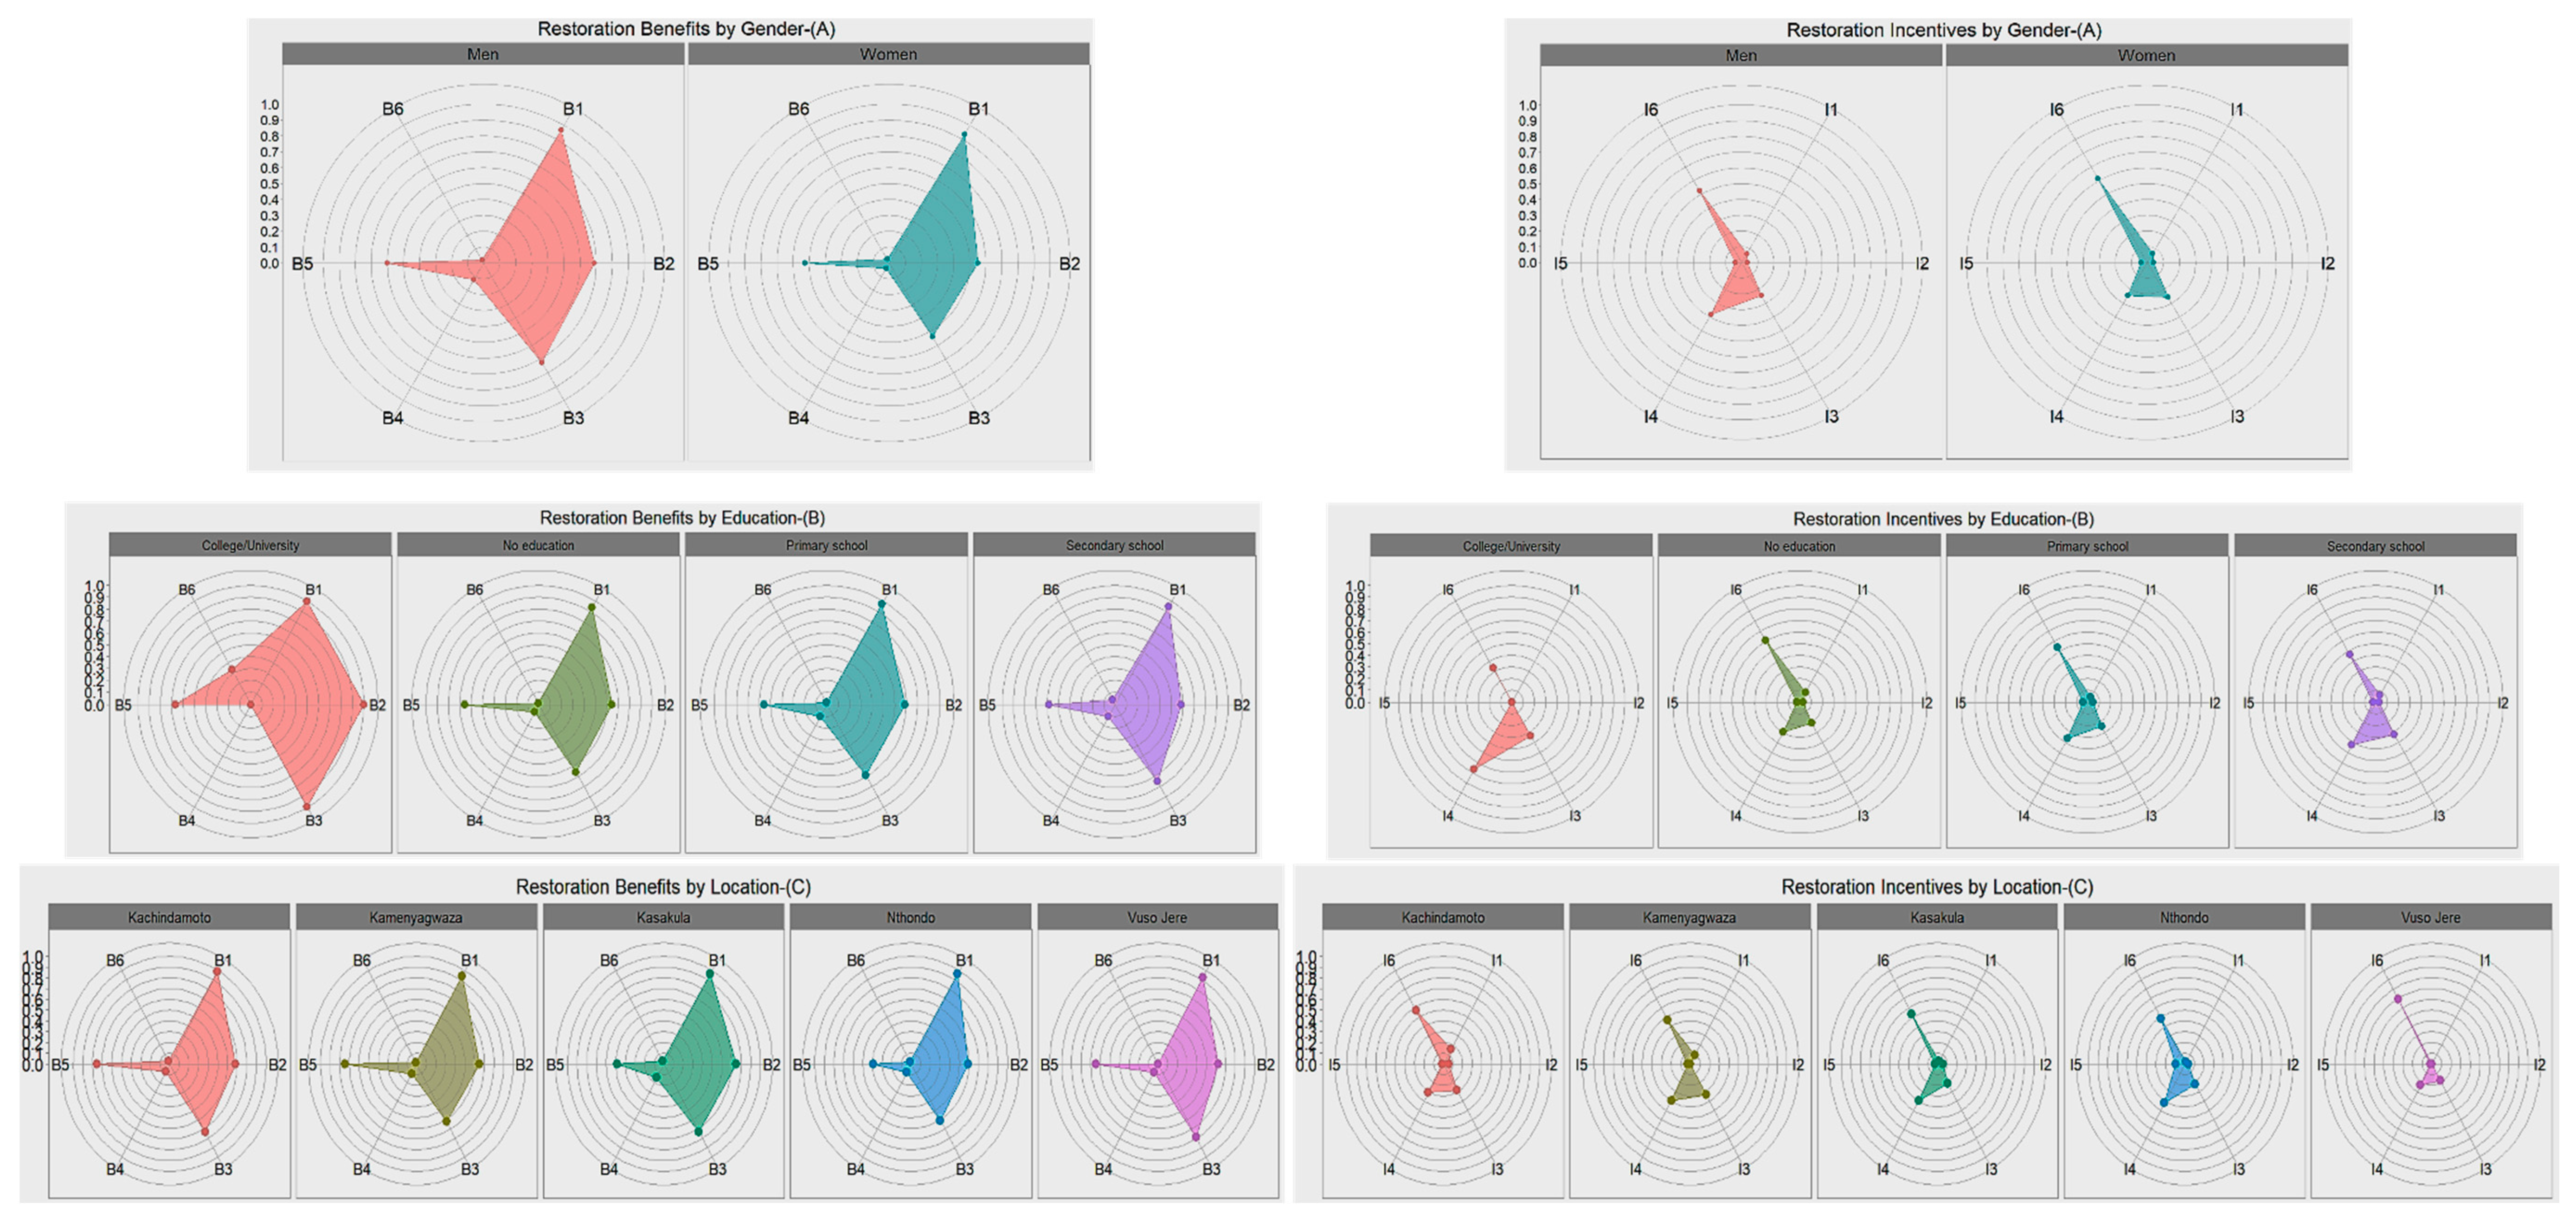
3.2.2. Farmers’ Restoration Benefits and Incentives

Discussion participants underscored several restoration benefits and incentives. Benefits were mainly economic (honey produced and sold from beehives put in trees, timbers, selling of crops yield surplus), environmental (moisture and nutrient added to the soil, fresh air and temperature regulation, good and reliable rains), and altruistic (care for future generation and natural trees). Other benefits are food-related (fruits from trees, high crops yield), non-economic and utility-oriented (poles for constructions, coffins, firewood for cooking, and medicinal plants), and socio-cultural (sharing of tree seedlings, access to free firewood during funerals). Illustrative perspectives include:
“… trees are used as poles for construction and are used for domestic activities such as firewood for cooking, and this reduces pressure on state-owned forest reserves.”
(FGD, Bwanali Community, Kachindamoto, Dedza)
“Through conservation-agriculture practices, higher yields are harvested since mulching conserves moisture and adds nutrients to the soil.”
(FGD, Kapenuka Community, Kamenyagwaza, Dedza)
“Forest and trees regulate temperature; it feels cold in hot season and it feels fresh always. I have a water point that runs from my forest. We receive reliable rains because we have more trees. [Also,] trees improve soil fertility in our fields and conserve moisture. We get manure from the tree leaves. If we plant trees, vetiver, and make contour ridges we make our lands fertile. […] Trees act as wind break and our houses are protected from severe winds. In the end, the benefits of trees are what motivate us.”
(FGD, Ntchisi)
Farmers participating in collective-level restoration in Kabulika community noted economic benefits and explained that “we also sell poles from the forest and we do this in collaboration with the chief. This is about our village forest which has both exotic and natural trees; people also get timber from the forest at agreed fees, poles are also harvested at a fee.” In reference to social benefits, some illustrated that “we collect firewood from the forest when there is a funeral; for instance, there was a funeral in our village and women came to ask me as chairperson of the tree nursery management committee if they can go into the forest to collect firewood [and] I told the chief and we granted them permission to go and collect firewood.” Another farmer added they also “share tree seedlings that [they] plant on [their] farms and house compounds, and people are motivated.” In Ntchisi, farmers bundled restoration benefits that motivate them, as one illustrates:
“We do receive good rains because our forest is intact and that is one reason that motivates us. [Also], we get firewood for cooking. Other people who do not have trees in their areas use clothes and sacks for heating and cooking. [Moreover], we are motivated by a lot of water that our mountain and forest conserve and we use the water for irrigation.”
(FGD, Ntchisi)
Incentives and rewards in the areas varied. For individual-level restoration, many farmers indicated being recipients of both in-kind and money-based incentives from NGOs and government-led programs. One explained: “at first, people were receiving food and materials such as soybean flower, cooking oil and beans, tree seeds, hoes, and such, and after some time United Purpose started giving us money.” Adding to that, another farmer noted: “MASAF was also giving us money, MK7200 [≈$9.52] for two weeks; then payment rose from MK7200 [≈$9.52] to MK21600 [≈$28.57].” Many considered the training they received on restoration matters and the perception of restoration practices as non-labor intensive, as forms of incentives.
“We have been trained before in environment restoration [and] these restoration activities are cheap. For instance, manure making does not demand monetary costs as compared to inorganic fertilizers. […] Mulching also reduces labor; we do not make ridges and we do not go and weed because weeds do not grow in a field where ridges were not made. […]”
(FGDs, Bwanali and Kapenuka Communities, Dedza)
“We received training in beekeeping, and we are making money out of bee farming. Discovery project trained us in cookstoves making; we have also been trained in briquettes making and we are making money from those activities. We received training in bamboo planting although not enough. We received training from World Vision, EU, CADECOM in environment management and restoration. For example, CADECOM trained us in local tree seedlings production and we can produce own seedlings locally.”
(FGD, Kabulika Community, Kachindamoto, Dedza)
Beside these testimonials, farmers argued why training is a critical incentive, as one farmer wrapped it up:
“For us to do our work properly we need to be trained and when we are trained, we can easily pass knowledge to all the people in the community. Training is very important for a common approach and strategy to restoration activities. We can all have one common idea of the technology and there cannot be confusion. Local knowledge is not universal; some people know things differently from other people.”
(FGD, Bwanali Community, Kachindamoto, Dedza)
Restoration incentives are not always required by farmers, and some indicated that their ongoing restoration efforts precede the renewed momentum in forest-agricscape restoration.
“… some of us started doing restoration activities in 2015 and 2016 when there were no projects [while] others started a long time ago when there was a project by ICRAF. Now people are used to these restoration activities and we are doing these without being paid or expecting to be paid.”
(FGD, Bwanali Community, Kachindamoto, Dedza)
In contrast, the lack of incentives is associated with complaints. A farmer participating in collective action restoration in Ntchisi expressed long-standing resentment at such lack of incentives:
“We do lots of work to conserve the forest and people come to see it because we are managing it perfectly. Unfortunately, communities are not benefiting. For instance, we do not have potable water in our community yet our forest conserves water. People from Blantyre, Mzuzu, and all over the country and even abroad come here to see this place just because the forest is well-conserved and managed, but the communities are not benefiting anything apart from good rains we receive. […] We work in dangerous environments with no protective gear, yet we do not receive anything.”
(FGD, Ntchisi)
Hence, many farmers made a case for incentives. They also suggested operational resources and materials as well as training and exchange visits for restoration activities as incentives. For instance, during the discussion in Kapenuka in Dedza, one farmer elaborated that “we don’t receive incentives, but we would prefer being given operational resources”; another that “there has to be incentives such as fertilizer.” In Ntchisi, a farmer was also specific: “incentives we need are soft loans with very low interest [and] energy-saving stoves that reduce pressure on forest resources.” Other forms of suggested incentives include money as allowance for collective action tasks, such as patrolling, or in the form of recurrent salary, an important element for restoration sustainability.
“With the amount of work that we do, we are supposed to receive something in the form of money. I want to remove some perception that organizations have … they think on our behalf and they think we cannot conserve or manage forests if they give us money. […] The money should be in the form of allowance and not salary. Whenever you go to patrol or do forest management activities, you should get an allowance, which is MK900 [≈$1.19] according to the government’s rate.”
(FGD, Ntchisi)
Here also, benefits and incentives for both individual farmer and collective action are intertwined and folded into the restoration motives. For instance, one farmer from the discussion in Kapenuka in Dedza advanced that “we are also motivated by the high yields we are harvesting from fields where we are practicing soil-conservation technologies. For instance, where we apply manure and use fertilizer trees, we harvest more.” Some farmers from the discussions in Bwanali and Ntchisi also stressed that “benefits we realize from restoration activities are already incentives on their own […] for example, food, firewood and water supply […] and also the activities such as money from sales of trees and from yield surplus.” An unusual perspective was underscored as follows, citing group learning and labor pooling: “working in a group is incentive already because we learn from the group and implement on our farms; for instance, planting trees and making contour ridges. It is also less laborious when working in a group [because] it reduces time and labor demand as we share responsibilities and knowledge in a group. We can easily make manure and apply on our farms.”

Importance and Differences in Restoration Benefits and Incentives by Gender, Education, and Location

While substantiating the qualitative findings, the survey data depict the relative importance farmers attribute to restoration benefits and incentives. On average, farmers considered 3 ± 1 benefits and ≈1 ± 1 incentive. Specifically, crop yield improvement (96%), sustainable supply of biomass energy (firewood provision and charcoal production) (69%), positive environmental effects of reforestation (66%), and adaptation strategies to climate change impacts (59%) are the most critical benefits cited. Sustainable provision of non-timber forest products (NTFPs) was mentioned less (11%). When asked what incentives they received, “no incentives” was the most reported response (54%) by farmers, confirming the limited existence of restoration incentives in the area. The two most important incentives mentioned were knowledge and information support from extension services such as training on sustainable land management practices and supply of information on restoration matters (36%), and free or subsidized inputs such as tree seedlings and agricultural fertilizers (25%). Incentive schemes such as cash for work and credit/loan provision were less cited (6%).
The mean number of restoration benefits was significantly different (p = 0.0001) between men and women, but restoration incentives were not (Appendix A Table A3). On average, male farmers reported enjoying more benefits (>3) than female farmers (<3) (Figure 7, panel A).
Among the typical benefits described above, men perceived very strongly the positive environmental effects of reforestation and were more likely to report sustainable firewood provision and charcoal production than women. Men also referred to the sustainable provision of NTFPs as part of restoration benefits, which women barely pointed to (Figure 8, panel A). Likewise, the average number of restoration benefits was statistically different (p = 0.0003) by location, but restoration incentives were not (Figure 7, panel C). Farmers from TA Nthondo reported fewer benefits from restoration (=2) than farmers from the other TAs, who reported more (≥3). Restoration as a coping strategy for climate change and as contributing to a sustainable supply of biomass energy was not emphasized in the TAs of Ntchisi as it was in the TAs of Dedza (Figure 8, panel C). In contrast, no statistically significant difference is observed for the number of restoration benefits and incentives across education levels (Figure 7, panel B). Both types of benefits and incentives are similar across the different education levels (Figure 8, panel B).

3.3. Farmers’ Restoration Decision-Making Processes

We followed two steps to develop the overarching restoration decision-making processes in a table/matrix format. These include the depiction and description of the goal frames, and the identification and characterization of the different rules.

3.3.1. Restoration Decision-Making Goal Frames

We identified a total of 17 goal frames representing different categories of the registered factors (Table 4). We first identified 10 goal frames from the discussions. Further, we drew 15 goal frames from the survey that included eight of the previous goal frames uncovered from the qualitative data, thus adding seven new goal frames to the list. Together, the 17 goal frames indicate a mixture of the restoration rationales, motives, benefits, and incentives described above, to which new elements, indicating factors reflecting concerns and constrains, are added. We report their respective incidences in individual and collective-level restoration.

3.3.2. Restoration Decision-Making Rules

We draw out 21 distinctive rules for individual-level restoration and 19 rules for collective-level restoration. All but two rules from the discussions match those from the survey. The rules reflect how the goal frames are ordered. The highly occurring rules are displayed in Table 5 (full list in Table A4 and Table A5).
Following their root goal frames, the rules that influence farmers’ restoration behaviors are: problem-solving oriented, resources/materials-constrained, benefits-driven, incentive-driven, peers/leaders-influenced, knowledge-dependent, altruistic-oriented, rules/norms-constrained, economic capacity-dependent, awareness-dependent, and risk averse-oriented. The main root goal frames for rules at the individual level were problem solving, resource/material constraints, incentives, knowledge, and benefits. When considering rules in collective actions, leadership of local authority, problem solving, benefits, and incentives stood out as highly critical root goal frames, followed by resource/material constraints.

3.3.3. Restoration Decision-Making Processes

We construct the processes as a matrix table linking each rule with the vegetation-based and/or non-vegetation-based restoration practices/activities (Table 6 and Table 7; see details of their occurrences in Appendix A Table A6 and Table A7). On average, the total number of restoration practices farmers applied is 3-4 (mean 3.59) and 4–5 (mean 4.53) for individual-level and collective-level restoration, respectively. Many restoration practices/activities are common across the rules.
At the individual farm-household level, common vegetation-based restoration activities include agroforestry, farmer-managed natural regeneration (FMNR), and vetiver grass (Chrysopogon zizanioides) planting. Farmers aligned with rules #8 implement vegetation-based restoration to a lower extent. Those applying rules #12 and #18 implemented only one practice, FMNR and vetiver grass planting, respectively. Farmers associated with rules #11, #13, #20, and #21 engage with only two of the vegetation-based practices. Most recurrent non-vegetation-based restoration activities are manure application, mulching, and construction of contours ridges. For farmers following rules #8, #18, and #20 mulching comes first ahead of manure application, in contrast to the common trend. Secondary implemented practices include intercropping, swales making, markers/box ridges construction, and minimum or no tillage. Farmers utilizing rules #12, #16, and #19 strongly engage with intercropping, and a fair number of farmers following rules #11 and #18 construct swales.
At the collective-action level, vegetation-based restoration activities center on tree planting and natural regeneration in forest areas. All types of rules greatly reflect those restoration activities, except rule #13 which leads to less engagement in such activities. Farmers following rule #19 plant trees also for riverbank protection. The non-vegetation-based restoration activities most encountered are activities involving firebreaks in communally held forest areas, awareness against tree cutting and deforestation in the community, and other forest protection activities such as patrolling and monitoring. Construction of swales is observed to a lower extent on communal lands. Additionally, farmers following rule #19 are involved in gully reclamation.
Key:Vegetation-based restoration practices:a = Agroforestry on farms or active tree planting in forest areas; b = Farmer-managed natural regeneration on farms or Natural Regeneration in forest areas; c = Pits planting (Zai) on farms or on communal lands; d = Vetiver grass/other grasses on farms or on communal lands; e = Improved fallow on farms; q = Riverbank planting for protection of rivers/streams.
Non-vegetation-based restoration practices:f = Crop association/intercropping on farms; g = Mulching + crop residue incorporation on farms; h = No or minimum tillage on farms, i = Manure making and application on farms or on communal lands; j = Swales on farms or on communal lands; k = Contour ridges on farms; l = Marker/box ridges on farms or on communal lands; m = Rotation on farms; n = Fire-breaks in forest areas; o = Awareness against tree cutting and deforestation in the community; p = Other forest protection activities in forest areas; r = Gully reclamation on community lands.

4. Discussion

4.1. Local Perspectives on Landscape Restoration

Our findings on the local farmers’ perspectives on landscape restoration reflect concerns over both adverse ecological and socioeconomic/livelihood conditions that need concurrent improvement. This dual consideration shapes the practices and activities used for restoration. These findings align with the perspective of the contemporary restoration movement, especially codified in the forest landscape restoration (FLR) paradigm being promoted widely in SSA, including Malawi. Indeed, the new wave of restoration has departed from pure eco-centric perspectives, as seen with ecological restoration, to accommodate more social dimensions, especially with regard to socio-economic well-being to which ecosystem services are a major contributor [40]. As reflected in the commonly used definition of FLR (a planned process aimed at regaining ecological integrity and functions to enhance human well-being in deforested or degraded forest landscapes, [41]), emphasis is put on social, economic, and ecological goals and outcomes.
Moreover, in a previous review, Djenontin et al. [6] pointed to considerations of local contextual factors and aspirations in defining the objectives and goals of such landscape-scale restoration as well as in choosing and promoting technological packages. In that regard, our findings can inform efforts to operationalize FLR goals and practices in mosaic forest-agricscapes, without obscuring the embedded socio-cultural context, to achieve more meaningful and sustainable outcomes. Puspitaloka et al. [42] recently attempted such contextual operationalization by rearticulating restoration in peatland ecosystems in Indonesia, following an empirical assessment of the definitions, goals, and practices of peatland restoration across four restoration interventions in Central Kalimantan.

4.2. Landscape Restoration Rationales, Motives, Benefits, and Incentives

Our study reveals that while the boundary between restoration rationales and motives remains fuzzy, their nature differs. The former follows the line of logical/causal reasoning while the latter follows affective/emotional action. The distinction is worth making as it has implications on the proper specification of behavioral paradigms and subsequent parameterizations of decision rules in modeling restoration behaviors, as we discuss below. Moreover, our findings provide justification for treating benefits and incentives as extensions of restoration motives. Benefits and incentives were regarded as personal advantages and gains, and they considerably shape restoration behaviors at individual farm-household and collective-action levels. This study confirms, empirically, the need to consider them in restoration programs and policies as observed with benefits/incentives-based interventions in enhancing restoration behaviors.
Furthermore, the motives and benefits vary significantly by location and gender. Notably, having strong leadership from local authorities who support and encourage their community members through self-engagement and exemplary actions has emerged as an integral motivational element. Ntchisi district, exemplified by TA Nthondo, holds that advantage over Dedza district. This finding confirms previous evidence of the importance of strong, engaged, and inspiring leadership in collectively addressing environmental degradation [43,44]. Further, while there were many types of perceived or actual benefits from restoring forest-agricscapes, the gender and locational differences regarding environmental and energy supply-related benefits are important to note in planning restoration interventions. Specifically, this finding can inform the design of restoration programs as to what place-specific and gender-inclusive motives to leverage, and benefits to enhance or promote.

4.3. Landscape Restoration Decision Making and Behavior

Our findings indicate that restoration rules show various combinations of goal frames, the most important ones making up the roots for the rules. This nature of rules confirms that environmental behaviors are the result of multiple goal frames with some dominating ones. This means that one or more goal frames shift to become focal goal(s) over the others in the process of cognitively constructing the decision-making rules. This corroborates the postulate of the GFT [14,15].
Furthermore, insights on the defining constituents of the goal frames themselves indicate that incentives, benefits, and knowledge could be assimilated with the gain and hedonic goal framings, following [14]. These factors also compare with some of the factors influencing land-use and environmental-management decision making, notably the consideration of economic and non-economic benefits [11]. In our study areas, incentives and benefits were primarily not expressed in monetary terms, but more as in-kind (both soft, like training incentives, and concrete, like crop yields, poles, and other tree-resource benefits), a departure from the widespread over-reliance on cash incentives in collective conservation or restoration policies and strategies (see [44]).
However, problem solving, resource constraints, and leadership of local authorities stand out as contextual types of goal frames associated with restoration behaviors. From the perspective of the GFT [14], these elements do not reflect nor qualify as normative, gain, or hedonic goal framings. Rather, they refer to environmental concerns, capability, and political impulsion. The latter is of interest as the leadership of local authorities greatly influences collective action restoration decisions. These findings underscore the need to ground understanding of restoration behaviors within their local contexts.

4.4. Representation of Restoration Decision Rules in a LUCC-ABM

We have developed a conceptual approach to depict restoration decision-making processes based on our effort to empirically depict farmers’ decision-making rules and the corresponding vegetation-based and non-vegetation-based restoration practices and activities in Central Malawi. This effort is similar to Keshavarz and Karami’s [45] effort to identify farmers’ decision making and actions for drought management in Iran. It can serve as an input into future ABM-based restoration modeling aimed at simulating farmers’ restoration behaviors, underlying decisions, and the spatially explicit socio-ecological outcomes at a higher (aggregate) forest-agricscape scale in Central Malawi. This approach can also be replicated elsewhere for similar studies attempting to ground social actors’ decision rules in empirical data.
Significantly, we have uncovered that farmers incorporate both rationally grounded and motive-based goal frames in their critical decision making on using different restoration practices or getting involved in collective action restoration activities. This implies that when exploring landscape restoration using an ABM with a focus on farmers’ restoration decision rules, one cannot solely espouse a rational behavior paradigm. Rather, one should also consider the role of motivational factors, including benefits and incentives. Groeneveld et al. [11] argued that the importance of such non-rational factors influencing land-use and environmental management decisions had significantly been overlooked in LUCC-ABMs, whereas they are appropriately emphasized in behavioral economics. In this regard, our findings support the adoption of a bounded rational behavior paradigm in such future modeling of restoration behaviors.
In addition, we encourage adopting a process-based decision-making model to represent human decision making and circumvent the difficulties of applying theories following previous studies [26,46]. Insights suggest that blending ideas of experience/preference-based decision models with empirical/heuristic decision rules [26] would be an appropriate decision framework for exploring the future impact of landscape restoration in Central Malawi. Thus, our empirically grounded restoration-decision rules and processes are relevant to inform the parameterization of decision rules and representation of restoration actions for such an ABM. The occurrence of the rules could inform their respective probability distribution in the ABM and the restoration practices and activities would inform the actual actions taken by the farmer-agents.
Finally, methodologically, this study contributes to testing or putting into practice relevant recommendations on data gathering methods and processes to improve the representation of human decision making in empirical ABMs and enhance their analytical and policy value [11,18,23,24,25,47]. Adopting mixed social science data collection methods, including semi-structured interviews through discussions and games, and a structured interview via surveys, appears useful. They can enhance understanding of the decision making underlying farmers’ behaviors to characterize decision rules for further modeling processes.

5. Conclusions

This study sought to analyze the nature of the decisions to engage in forest-agricscape restoration through individual and collective actions in Central Malawi using a mixed-method approach to data collection and analysis. The study uncovers local farmers’ perceptions of forest-agricscape restoration, and the nature of the influential factors considered when deciding to engage in restoration efforts. Furthermore, it reveals how these factors generate diverse goal frames determining restoration decision making, and ultimately the observed restoration practices and activities. Specifically, the study finds that the decision-making rules leading to restoration behaviors appear to be very diverse. They are made of goal frames that reflect nuanced considerations of environmental problems, livelihood needs and gains, constraints, socio-political influences, morals, values, and attitude to risks; all featured in diverse combinations. These restoration goal frames are categorized as problem-solving oriented, resources/materials-constrained, benefits-oriented, incentive-based, peers/leaders-influenced, knowledge/skill-dependent, altruistic-oriented, rules/norms-constrained, economic capacity-dependent, awareness-dependent, and risk averse-oriented. Improved understanding of the goal frames underscoring restoration decision-making rules is critical to inform potential management and policy mechanisms to boost restoration delivery. Finally, the study contributes a conceptual approach, with methodological application, to elicit restoration decision-making processes that associate various decision rules with the vegetation-based and non-vegetation-based restoration practices and activities undertaken by farmers. This will contribute to empirically ground the design and parameterization of farmers’ restoration behaviors in an ABM that will explore effective governance modalities and spatially explicit policy options to boost landscape restoration in Malawi. Beyond that, this approach can be replicated elsewhere for similar studies attempting to ground social actors’ decision rules in empirical data.

Author Contributions

I.N.S.D. and L.C.Z. conceived of the study; I.N.S.D. designed the data collection, with constructive suggestions from L.C.Z., and A.L.-Z.; I.N.S.D. collected the data, with initial supervision by L.C.Z.; I.N.S.D. analyzed the data; A.L.-Z. and I.N.S.D. elaborated the analytical framework; All I.N.S.D., L.C.Z., and A.L.-Z. wrote the paper. All authors have read and agreed to the published version of the manuscript.

Funding

This research was partly funded by the Research Scholars Award from the College of Social Sciences of Michigan State University (MSU). It was also financially supported by the Environmental Science and Policy Program of MSU and the Graduate Women International (GWI) under the GWI Recognition Award.

Acknowledgments

We are grateful to the Department of Geography, Environment, and Spatial Sciences of MSU for its various institutional support. The first author thanks particularly all members of her research team in Malawi for their invaluable support in collecting the data for this research in the framework of her PhD dissertation.

Conflicts of Interest

The authors declare that they have no conflict of interest.

Appendix

Table A1. Sample Characteristics Across the Study Area.
Locations (TAs)Kachindamoto
(n = 120)
Kamenyagwaza
(n = 72)
Kasakula
(n = 120)
Nthondo
(n = 108)
Vuso Jere
(n = 60)
Total
(n = 480)
VariablesPercentages
AGE (Min = 19; Max = 92)50.6246.4245.2244.6743.246.37
AGE GROUP
Young Farmers30.8037.5041.7044.4045.0039.40
Adult Farmers69.2062.5058.3055.6055.0060.60
Pearson’s chi2(4) = 5.9957 Pr = 0.199
GENDER
Women20.0020.8016.7017.6011.7017.70
Men80.0079.2083.3082.4088.3082.30
Pearson’s chi2(4) = 2.5082 Pr = 0.643
ETHNICITY
Chewa48.3025.00100.0098.10100.0075.40
Ngoni42.5075.000.000.900.0022.10
Other Ethnicities9.200.000.000.900.002.50
Pearson’s chi2(8) = 262.0546 Pr = 0.000
RELIGION
Christian89.2098.6093.3093.50100.0094.00
Muslim6.700.000.000.000.001.70
Animist0.800.002.502.800.001.50
No religion3.301.404.203.700.002.90
Pearson’s chi2(12) = 32.3978 Pr = 0.001
MARITAL STATUS
Bachelor0.001.401.702.803.301.70
Married76.7080.6085.0083.3085.0081.90
Widow12.508.306.707.4010.009.00
Divorced8.306.902.504.601.705.00
Separated2.502.804.201.900.002.50
Pearson’s chi2(16) = 16.3779 Pr = 0.427
EDUCATION LEVEL
No Education30.8015.3023.3021.3025.0023.80
Primary School57.5066.7055.8056.5065.0059.20
Secondary School10.8018.1020.0021.3010.0016.50
College/University0.800.000.800.900.000.60
Pearson’s chi2(12) = 14.0138 Pr = 0.300
LITERACY
No37.5025.0030.8026.9028.3030.40
Yes62.5075.0069.2073.1071.7069.60
Pearson’s chi2(4) = 4.6242 Pr = 0.328
PRACTICING ENVIRONMENTAL RESOURCES RESTORATION
No9.208.3010.802.806.707.70
Yes90.8091.7089.2097.2093.3092.30
Pearson’s chi2(4) = 5.8276 Pr = 0.212
Table A2. Differences in the Number of Restoration Rationales and Motives by Gender, Education, and Location.
Dependent VariableT or F aProb. a
Gender as Factor 1
Restoration Rationales (Continuous [0–5])−1.24030.2155
Restoration Motives (Continuous [1–5])−1.38130.1679
Education as Factor 2
Restoration Rationales (Continuous [0–5])0.620.5992
Restoration Motives (Continuous [1–5])0.200.8961
Location (Traditional Authority Area) as Factor 3
Restoration Rationales b (Continuous [0–5])0.720.5801
Restoration Motives (Continuous [1–5])3.330.0106
M1: Project-Based Motivations: Government Requirement/Promotion (Dummy [0–1])2.210.0669
M3: Leadership of Local Authority/Encouragement/Support (Dummy [0–1])4.000.0034
M4: Altruistic Behaviors and Environmental Civism: Altruist Behavior (Dummy [0–1])2.150.0738
a Student’s t-test or one-way ANOVA test of variables ‘‘Restoration Rationales’’ and ‘‘Restoration Motives” with either equal or unequal variances; b Variable violates the Bartlett’s test (homogeneity of variances): assumption of homogeneity of variance is not met. Only the Games and Howell post comparison test is robust then, compared to the Scheffe Test. We consider the multiple comparison tests only for variables with significant t or F test.
Table A3. Differences in the Number of Restoration Benefits and Incentives by Gender, Education, and Location.
Dependent VariableT or F aProb. a
Gender as Factor 1
Restoration Benefits (Continuous [1–6])−4.08660.0001
B2: Reforestation and Environmental Benefits (Dummy [0–1])−2.32310.0206
B3: Sustainable Provision of Fuelwood and production of Charcoal (Dummy [0–1])−3.29230.0011
B4: Sustainable Provision of NTFPs (Dummy [0–1])−2.14310.0327
Restoration Incentives (Continuous [0–5])−1.28040.2011
Education as Factor 2
Restoration Benefits (Continuous [1–6])0.930.4264
Restoration Incentives (Continuous [0–5])1.160.3230
Location (Traditional Authority Area) as Factor 3
Restoration Benefits b (Continuous [1–6])5.350.0003
B3: Sustainable Provision of Fuelwood and Production of Charcoal (Dummy [0–1])2.220.0658
B5: Cope with Climate Change Impacts (Dummy [0–1])11.110.0000
Restoration Incentives b (Continuous [0–5])1.620.1672
a Student’s t-test or one-way ANOVA test of variables ‘‘Restoration Benefits’’ and ‘‘Restoration Incentives” with either equal or unequal variances; b Variable violates the Bartlett’s test (homogeneity of variances): assumption of homogeneity of variance is not met. Only the Games and Howell post comparison test is robust then, compared to the Scheffe Test. We consider the multiple comparison tests only for variables with significant t or F test.
Table A4. All Types of Decision-Making Rules for Individual-Level Restoration Elicited from FDGs and the Survey.
NoRules aAbbreviation aPercentage b
(n = 436) *
Three Main Goal Frames as Base Plus One Alternative
1Problem Solving—Resource/Material Constraints—IncentivesKnowledge—Benefits—Economic CapacityPsMcInc_KBEc11.7%
2Problem Solving—Resource/Material Constraints—KnowledgeBenefits—Economic Capacity—Extension Service—Influence of PeersPsMcK_BEcExtIf11.2%
3Problem Solving—Resource/Material Constraints—BenefitsOutcomes—Economic Capacity—Leadership of Local Authority—Morality/Community LoyaltyPsMcB_OEcLaMo3.7%
4Problem Solving—Incentives—BenefitsKnowledge—Outcomes—Economic Capacity—Leadership of Local AuthorityPsIncB_KOEcLa6.4%
5Problem Solving—Knowledge—BenefitsEconomic Capacity—Risk Averse—Government promotionPsKB_EcRGo (10 similar cases from the FGDs)2.1%
Two Main Goal Frames as Base Plus One/Two Alternatives
6Problem Solving—Resource/Material ConstraintsMedia Awareness—Extension Service—Influence of Peers—Economic Capacity—Leadership of Local Authority—Bequest/Altruist ValuePsMc_MaExtIfEcLaAl13.1%
7Problem Solving—IncentivesKnowledge—Morality/Community Loyalty—Media Awareness—Risk Averse—Extension Service—Influence of Peers—Leadership of Local Authority—Economic Capacity—Bequest/Altruist ValuePsInc_KMoMaRExtIfLaEcAl18.8%
8Problem Solving—KnowledgeExtension Service—Economic CapacityPsK_ExtEc5.0%
9Problem Solving—BenefitsRisk Averse—Influence of PeersPsB_RIf (1 similar case from the FGDs)4.4%
10Resource/Material Constraints—IncentivesBenefits—Extension Service—Economic CapacityMcInc_BExtEc2.3%
11Resource/Material Constraints—KnowledgeExtension Service—Media Awareness—Influence of Peers—Risk AverseMcK_ExtMaIfR1.4%
12Resource/Material Constraints—Influence of PeersRisk Averse—Leadership of Local AuthorityMcIf_RLa1.1%
13Incentives—Benefits—Risk AverseIncB_R0.5%
14Incentives—KnowledgeBequest/Altruist Value—Extension ServiceIncK_AlExt0.9%
One Main Goal Frame as Base Plus One Alternative
15Problem SolvingResource/Material Constraints—BenefitsPs_McB10.8%
16Influence of PeersProblem Solving—Incentives—Knowledge—Benefits—Time efficiency—OutcomesIf_PsIncK_BTO (6 similar cases from the FGDs)2.3%
17Extension ServiceProblem Solving—Resource/Material ConstraintsExt_PsMc1.4%
18Morality/Community LoyaltyProblem Solving—IncentivesMo_PsInc0.5%
19Bequest/Altruist ValueProblem Solving—Resource/Material Constraints—KnowledgeAl_PsMcK0.9%
20Risk AverseProblem Solving—Resource/Material Constraints—Media AwarenessR_PsMcMa0.5%
21Leadership of Local AuthorityProblem Solving—Resource/Material ConstraintsLa_PsMc1.1%
a Bold denotes related goal frames as base/root for the rules; Italics denotes the related secondary goal frames, which are either absent or present in the rules, alternatively; b Number of times the rule emerged (whether with the goal frames in same order or not): expressed as % of survey sample; *Seven respondents, among the 443 who claimed to restore land at individual level, did not provide any factors and rules.
Table A5. All Types of Decision-Making Rules for Collective Action Restoration Elicited from FDGs and the Survey.
NoRules aAbbreviation aPercentage b
(n = 266) *
Three Main Goal Frames as Base Plus One Alternative
1Leadership of Local Authority—Problem Solving—BenefitsKnowledge—Risk Averse—Rules of Collective/Community WorkLaPsB_KRRu11.7%
2Leadership of Local Authority—Problem Solving—IncentivesBenefits—Risk AverseLaPsInc_BR10.5%
3Leadership of Local Authority—Problem Solving—Morality/Community LoyaltyBenefits—Risk AverseLaPsMo_BR3.8%
4Leadership of Local Authority—Problem Solving—Resource/Material ConstraintsIncentives—Knowledge—BenefitsLaPsMc_IncKB3.4%
5Leadership of Local Authority—Resource/Material Constraints—IncentivesKnowledge—Benefits—Risk AverseLaMcInc_KBR10.2%
6Problem Solving—Benefits—KnowledgeInfluence of Peers—Time Efficiency—OutcomesPsBK_IfTO
(11 cases from the FGDs only)
Two Main Goal Frames as Base Plus One/Two Alternatives
7Leadership of Local Authority—Resource/Material ConstraintsBenefits—Knowledge—Extension Service—Influence of PeersLaMc_ BKExtIf9.0%
8Leadership of Local Authority—BenefitsKnowledge –Risk Averse—Bequest/Altruist ValueLaB_KRAl9.0%
9Leadership of Local Authority—Morality/Community LoyaltyBenefits—Extension ServiceLaMo_BExt4.9%
10Leadership of Local Authority—IncentivesBenefits—Risk Averse—Morality/Community LoyaltyLaInc_BRMo4.5%
11Leadership of Local Authority—Problem SolvingRisk Averse—Influence of Peers—Extension ServiceLaPs_RIfExt3.0%
12Problem Solving—IncentivesMorality/Community Loyalty –Influence of Peers—Benefits—Risk Averse—Economic CapacityPsInc_ MoIfBREc7.1%
13Problem Solving—BenefitsMorality/Community Loyalty—Risk Averse—Influence of Peers—Time efficiency—Bequest/Altruist Value—Rules of Collective/Community WorkPsB_ MoRIfT_AlRu
(9 similar cases from the FGDs)
5.3%
14Problem Solving—Resource/Material ConstraintsKnowledge—Incentives—BenefitsPsMc_KIncB1.9%
15Benefits—IncentivesRisk Averse—Resource/Material Constraints—Morality/Community LoyaltyBInc_RMcMo2.3%
One Main Goal Frame as Base Plus One Alternative or Not
16Leadership of Local Authority OR Rules of Collective/Community WorkResource/Material Constraints—Economic CapacityLa_Ru_McEc8.3%
17BenefitsBequest/Altruist Value—Influence of Peers—Extension Service—Economic CapacityB_AlIfExtEc3.4%
18Risk Averse—Incentives—Leadership of Local AuthorityR_IncLa1.1%
19Morality/Community LoyaltyProblem Solving—Benefits—Risk AverseMo_PsBR0.8%
a Bold denotes related goal frames as base/root for the rule; Italics denotes the related secondary goal frames, which are either absent or not in the rules, alternatively; b Number of times the rule emerged (whether with the goal frames in same order or not): expressed as % of survey sample “;“ * Two respondents, among the 268 who claimed to restore land at collective level, did not provide any factors and rules.
Table A6. Occurrence (%) of Restoration Practices for Different Decision-Making Rules for Individual-Level Restoration in the Study Areas.
Rules
Restoration Practices
1 (n = 51)2 (n = 49)3 (n = 16)4 (n = 28)5 (n = 9)6 (n = 57)7 (n = 82)8 (n = 22)9 (n = 19)10 (n = 10)11 (n = 6)12 (n = 5)13 (n = 2)14 (n = 4)15 (n = 47)16 (n = 10)17 (n = 6)18 (n = 2)19 (n = 4)20 (n = 2)21 (n = 5)
Agroforestry (a)453338434425492353403305075281050050040
FMNR (b)613975898949562784500600503420330755020
Pits Plant on Farms (c)2067025011000002000000
Vetiver (d)4545445767425427374033050501730335025500
Improved Fallow (e)02001100011000000000000
Intercropping (f)181601811231323212017600251940005000
Mulching (g)5349567910042657342103340100505560501005010020
No Tillage (h)41204052951002005021000000
Manure Application (i)8684818610086826884906760501006470835075500
Swales (j)1620257111110516033000610050000
Contour Ridges (k)47575657053501837805040505032103350505080
Marker/Box Ridges (l)101861409200161033005090335005040
Rotation (m)200002000000000000000
Average Number of practices [Min-Max]3.9
[1–8]
3.8
[1–7]
3.9
[1–7]
4.6
[1–8]
4.3
[3–6]
3.5
[1–7]
4.0
[1–9]
2.7
[1–5]
4.2
[2–5]
3.5
[2–5]
3
[2–4]
2.8
[1–5]
3
[2–4]
5
[3–7]
2.7
[1–4]
2.6
[1–4]
3.2
[1–6]
3.5
[3–4]
3.8
[2–5]
3.5
[3–4]
2
[1–3]
Bold and Underline = restoration practices applied by at least half of the respondents; Bold and Italics = restoration practices applied by at least 40% of the respondents.
Table A7. Occurrence (%) of Restoration Activities for Different Decision-Making Rules for Collective-Level Restoration in the Study Areas.
Rules
Restoration Activities
1 (n = 31)2 (n = 28)3 (n = 10)4 (n = 9)5 (n = 27)6 (n = 11)7 (n = 24)8 (n = 24)9 (n = 13)10 (n = 12)11 (n = 8)12 (n = 19)13 (n = 14)14 (n = 5)15 (n = 6)16 (n = 22)17 (n = 9)18 (n = 3)19 (n = 2)
Active Tree Planting in Forest (a)7793808978 887992837584574010082100100100
Natural Regeneration in Forest (b)97798010067 6371928375847180678289670
Pits Planting on Communal Lands (c)233930110 0088050000000
Vetiver grass Planting (d)62510220 80080000051100
Riverbank Planting (q)614000 000800000003350
Firebreak in Forest Areas (n)9493100100100 1009292100100100931001009110010050
Awareness Against (0)
Tree Cutting/Deforestation
5886608978 7133696706821808332446750
Forest Protection (p)979310010093 881009292100957910010010010010050
Manure Application (i)63203311 80080500170000
Swales (i)03620117 40833021001700330
Marker/Box Ridges (l)04000 000800020170000
Gully Reclamation (r)0140224 40080000000050
Average Number of Activities
[Min-Max]
4.6
[3–7]
6.1
[2–11]
4.8
[3–7]
5.8
[3–8]
4.4
[2–6]
4.3
[3–7]
3.8
[2–5]
4.5
[2–6]
5.1
[3–12]
3.5
[3–4]
4.6
[3–6]
3.2
[0–4]
4.2
[3–5]
5
[3–7]
3.9
[2–6]
4.4
[3–6]
5
[4–7]
3.5
[3–4]
Bold and Underline = restoration practices applied by at least 75% of the respondents; Bold and Italics = restoration practices applied by at least 50% of the respondents. The specific restoration activities and their occurrence could not be elicited for Rule#6 as this rule was depicted from the games only and not from the survey.

References

  1. Mansourian, S. Governance and forest landscape restoration: A framework to support decision-making. J. Nat. Conserv. 2017, 37, 21–30. [Google Scholar] [CrossRef]
  2. Galabuzi, C.; Eilu, G.; Mulugo, L.; Kakudidi, E.; Tabuti, J.R.S.; Sibelet, N. Strategies for empowering the local people to participate in forest restoration. Agrofor. Syst. 2014, 88, 719–734. [Google Scholar] [CrossRef] [Green Version]
  3. Meijer, S.S.; Catacutan, D.; Ajayi, O.C.; Sileshi, G.W.; Nieuwenhuis, M. The role of knowledge, attitudes and perceptions in the uptake of agricultural and agroforestry innovations among smallholder farmers in sub-Saharan Africa. Int. J. Agric. Sustain. 2015, 13, 40–54. [Google Scholar] [CrossRef]
  4. Cordingley, J.E.; Snyder, K.A.; Rosendahl, J.; Kizito, F.; Bossio, D. Thinking outside the plot: Addressing low adoption of sustainable land management in sub-Saharan Africa. Curr. Opin. Environ. Sustain. 2015, 15, 35–40. [Google Scholar] [CrossRef]
  5. Villamor, G.B.; van Noordwijk, M.; Djanibekov, U.; Chiong-Javier, M.E.; Catacutan, D. Gender differences in land-use decisions: Shaping multifunctional landscapes? Curr. Opin. Environ. Sustain. 2014, 6, 128–133. [Google Scholar] [CrossRef] [Green Version]
  6. Djenontin, I.; Foli, S.; Zulu, L. Revisiting the Factors Shaping Outcomes for Forest and Landscape Restoration in Sub-Saharan Africa: A Way Forward for Policy, Practice and Research. Sustainability 2018, 10, 906. [Google Scholar] [CrossRef] [Green Version]
  7. Ministry of Natural Resouces Energy and Mining. Forest Landscape Restoration Opportunities Assessment for Malawi; Ministry of Natural Resouces Energy and Mining: Lilongwe, Malawi, 2017.
  8. Ministry of Natural Resouces Energy and Mining. National Landscape Restoration; Ministry of Natural Resouces Energy and Mining: Lilongwe, Malawi, 2017.
  9. Wilson, S.J.; Cagalanan, D. Governing restoration: Strategies, adaptations and innovations for tomorrow’s forest landscapes. World Dev. Perspect. 2016, 4, 11–15. [Google Scholar] [CrossRef] [Green Version]
  10. Crooks, A.; Castle, C.; Batty, M. Key Challenges in Agent-Based Modelling for Geo-Spatial Simulation. Comput. Environ. Urban Syst. 2008, 32, 417–430. [Google Scholar] [CrossRef] [Green Version]
  11. Groeneveld, J.; Müller, B.; Buchmann, C.M.; Dressler, G.; Guo, C.; Hase, N.; Hoffmann, F.; John, F.; Klassert, C.; Lauf, T.; et al. Theoretical foundations of human decision-making in agent-based land use models e A review. Environ. Model. Softw. 2017, 87, 39–48. [Google Scholar] [CrossRef] [Green Version]
  12. Matthews, R.B.; Gilbert, N.G.; Roach, A.; Polhill, J.G.; Gotts, N.M. Agent-based land-use models: A review of applications. Landsc. Ecol. 2007, 22, 1447–1459. [Google Scholar] [CrossRef] [Green Version]
  13. Vlek, C.A.J.; Steg, L. Human behavior and environmental sustainability: Problems, driving forces, and research topics. J. Soc. Issues 2007, 63, 1–19. [Google Scholar] [CrossRef]
  14. Lindenberg, S.; Steg, L. Normative, gain and hedonic goal frames guiding environmental behavior. J. Soc. Issues 2007, 63, 117–137. [Google Scholar] [CrossRef] [Green Version]
  15. Etienne, J. Compliance theory: A goal framing approach. Law Policy 2011, 33, 305–333. [Google Scholar] [CrossRef] [Green Version]
  16. Jager, W.; Mosler, H.J. Simulating Human Behavior for Understanding and Managing Environmental Resource Use. J. Soc. Issues 2007, 63, 97–116. [Google Scholar] [CrossRef]
  17. Gilbert, N. Agent-Based Models; SAGE Publications, Inc.: Thousand Oaks, CA, USA, 2008; ISBN 9781412949644. [Google Scholar]
  18. Rounsevell, M.D.A.; Robinson, D.T.; Murray-Rust, D. From actors to agents in socio-ecological systems models. Philos. Trans. R. Soc. B Biol. Sci. 2012, 367, 259–269. [Google Scholar] [CrossRef] [Green Version]
  19. Miller, J.H.; Page, S.E. Complex Adaptive Systems: An Introduction to Computational Models of Social Life; Princeton University Press: Princeton, NJ, USA, 2007; ISBN 9781400835522. [Google Scholar]
  20. Kelly, R.A.; Jakeman, A.J.; Barreteau, O.; Borsuk, M.E.; ElSawah, S.; Hamilton, S.H.; Henriksen, H.J.; Kuikka, S.; Maier, H.R.; Rizzoli, A.E.; et al. Selecting among five common modelling approaches for integrated environmental assessment and management. Environ. Model. Softw. 2013, 47, 159–181. [Google Scholar] [CrossRef]
  21. Huber, R.; Bakker, M.; Balmann, A.; Berger, T.; Bithell, M.; Brown, C.; Grêt-Regamey, A.; Xiong, H.; Le, Q.B.; Mack, G.; et al. Representation of decision-making in European agricultural agent-based models. Agric. Syst. 2018, 167, 143–160. [Google Scholar] [CrossRef] [Green Version]
  22. DeAngelis, D.L.; Diaz, S.G. Decision-making in agent-based modeling: A current review and future prospectus. Front. Ecol. Evol. 2019, 6, 237. [Google Scholar] [CrossRef] [Green Version]
  23. Kremmydas, D.; Athanasiadis, I.N.; Rozakis, S. A review of Agent Based Modeling for agricultural policy evaluation. Agric. Syst. 2018, 164, 95–106. [Google Scholar] [CrossRef]
  24. Smajgl, A.; Brown, D.G.; Valbuena, D.; Huigen, M.G.A. Empirical characterisation of agent behaviours in socio-ecological systems. Environ. Model. Softw. 2011, 26, 837–844. [Google Scholar] [CrossRef]
  25. Smajgl, A.; Barreteau, O. Framing options for characterising and parameterising human agents in empirical ABM. Environ. Model. Softw. 2017, 93. [Google Scholar] [CrossRef]
  26. An, L. Modeling human decisions in coupled human and natural systems: Review of agent-based models. Ecol. Modell. 2012, 229, 25–36. [Google Scholar] [CrossRef]
  27. Balke, T.; Gilbert, N. How do agents make decisions? A survey. Jasss 2014, 17, 1. [Google Scholar] [CrossRef]
  28. Kennedy, W.G. Modelling Human Behaviour in Agent—Based Models. In Agent-Based Models of Geographical Systems; Heppenstall, A., Crooks, A., See, L., Batty, M., Eds.; Springer: Dordrecht, The Netherlands, 2012; pp. 167–179. [Google Scholar]
  29. Jordan, R.; Gray, S.; Zellner, M.; Glynn, P.D.; Voinov, A.; Hedelin, B.; Sterling, E.J.; Leong, K.; Olabisi, L.S.; Hubacek, K.; et al. Twelve Questions for the Participatory Modeling Community. Earth’s Future 2018, 6, 1046–1057. [Google Scholar] [CrossRef]
  30. Voinov, A.; Jenni, K.; Gray, S.; Kolagani, N.; Glynn, P.D.; Bommel, P.; Prell, C.; Zellner, M.; Paolisso, M.; Jordan, R.; et al. Tools and methods in participatory modeling: Selecting the right tool for the job. Environ. Model. Softw. 2018, 109, 232–255. [Google Scholar] [CrossRef] [Green Version]
  31. Mehryar, S.; Sliuzas, R.; Schwarz, N.; Sharifi, A.; van Maarseveen, M. From individual Fuzzy Cognitive Maps to Agent Based Models: Modeling multi-factorial and multi-stakeholder decision-making for water scarcity. J. Environ. Manag. 2019, 250, 109482. [Google Scholar] [CrossRef]
  32. Giabbanelli, P.J.; Gray, S.A.; Aminpour, P. Combining fuzzy cognitive maps with agent-based modeling: Frameworks and pitfalls of a powerful hybrid modeling approach to understand human-environment interactions. Environ. Model. Softw. 2017, 95, 320–325. [Google Scholar] [CrossRef]
  33. Davis, C.W.H.; Giabbanelli, P.J.; Jetter, A.J. The Intersection of Agent Based Models and Fuzzy Cognitive Maps: A Review of an Emerging Hybrid Modeling Practice. In Proceedings of the 2019 Winter Simulation Conference (WSC), National Harbor, MD, USA, 8–11 December 2019; pp. 1292–1303. [Google Scholar]
  34. Creswell, J.W. A Concise Introduction to Mixed Methods Research; SAGE Publications Inc.: Los Angeles, CA, USA, 2014; ISBN 9781483359045. [Google Scholar]
  35. Chinangwa, L.; Sinclair, F.; Pullin, A.S.; Hockley, N. Can co-management of government forest reserves achieve devolution? Evidence from Malawi. For. Trees Livelihoods 2016, 25, 41–58. [Google Scholar] [CrossRef]
  36. Senganimalunje, T.C.; Chirwa, P.W.; Babalola, F.D.; Graham, M.A. Does participatory forest management program lead to efficient forest resource use and improved rural livelihoods? Experiences from Mua-Livulezi Forest Reserve, Malawi. Agrofor. Syst. 2016, 90, 691–710. [Google Scholar] [CrossRef] [Green Version]
  37. Anderies, J.M.; Janssen, M.A.; Bousquet, F.; Cardenas, J.-C.; Castillo, D.; Lopez, M.-C.; Tobias, R.; Vollan, B.; Wutich, A. The challenge of understanding decisions in experimental studies of common pool resource governance. Ecol. Econ. 2011, 70, 1571–1579. [Google Scholar] [CrossRef]
  38. Vieira Pak, M.; Castillo Brieva, D. Designing and implementing a Role-Playing Game: A tool to explain factors, decision making and landscape transformation. Environ. Model. Softw. 2010, 25, 1322–1333. [Google Scholar] [CrossRef]
  39. Leisher, C. A comparison of tablet-based and paper-based survey data collection in conservation projects. Soc. Sci. 2014, 3, 264–271. [Google Scholar] [CrossRef] [Green Version]
  40. Djenontin, I.N.S.; Zulu, L.C.; Etongo, D. Ultimately, what is FLR in practice? Embodiments in Sub-Sahara Africa and Implications for Future FLR Design. Environ. Manag. under review.
  41. IISD Summary of the International Expert Meeting on Forest Landscape Restoration 27–28 February 2002. Sustain. Dev. 2002, 71, 1–8.
  42. Puspitaloka, D.; Kim, Y.S.; Purnomo, H.; Fulé, P.Z. Defining ecological restoration of peatlands in Central Kalimantan, Indonesia. Restor. Ecol. 2020, 28, 435–446. [Google Scholar] [CrossRef]
  43. Zulu, L.C. Community forest management in Southern Malawi: Solution or part of the problem? Soc. Nat. Resour. 2008, 21, 687–703. [Google Scholar] [CrossRef]
  44. Zulu, L. Bringing People Back into Protected Forests in Developing Countries: Insights from Co-Management in Malawi. Sustainability 2013, 5, 1917–1943. [Google Scholar] [CrossRef] [Green Version]
  45. Keshavarz, M.; Karami, E. Farmers’ decision-making process under drought. J. Arid Environ. 2014, 108, 43–56. [Google Scholar] [CrossRef]
  46. Villamor, G.B.; Van Noordwijk, M.; Troitzsch, K.G.; Vlek, P.L.G. Human decision making for empirical agent-based models: Construction and validation. In Proceedings of the International Environmental Modelling and Software Society (iEMSs) 2012 International Congress, Leipzig, Germany, 1–5 July 2012; pp. 2529–2536. [Google Scholar]
  47. Elsawah, S.; Guillaume, J.H.A.; Filatova, T.; Rook, J.; Jakeman, A.J. A methodology for eliciting, representing, and analysing stakeholder knowledge for decision making on complex socio-ecological systems: From cognitive maps to agent-based models. J. Environ. Manag. 2015, 151. [Google Scholar] [CrossRef]
Figure 1. Conceptual approach.
Sustainability 12 05380 g001
Figure 2. Research areas showing the forest-agricscapes. Notes: NFR = Ntchisi Forest Reserve; MLFR = Mua-Livulezi Forest Reserve; TAs = traditional authority territories; EPAs = extension planning areas.
Sustainability 12 05380 g002
Figure 3. Illustrations of farmers simulating their restoration rules and participating in plenary discussion.
Sustainability 12 05380 g003
Figure 4. Illustration of the rules simulated during role-playing games—the one of the left is from Dedza and the one on the right is from Ntchisi.
Sustainability 12 05380 g004
Figure 5. Differences in the average number of restoration rationales and motives by gender, education, and location among farmers engaged in restoration (N = 443). Note: Each box-and-whisker diagram depicts the quartile-based distribution of the number of rationales/motives per group/factor of comparison. The boxes indicate the interquartile range; the lines (whiskers) show the minimum and maximum range outside the quartiles; and the dots are extreme values (outliers).
Sustainability 12 05380 g005
Figure 6. Types of restoration rationales and motives by gender, education, and location. Notes: Radar charts comparing the mean value (on a scale of 0–1) of each type of rationale/motive among the different groups/factors. Rationales: R1 = Severe land erosion and gully formation; R2 = Low soil fertility/low crop yield; R3 = Awareness of biodiversity loss; R4 = Difficult provision of biomass energy (scarce firewood and tree scarcity limits charcoal making); R5 = Water resource scarcity (siltation of rivers and scarce water from catchment); R6 = Other restoration rationales. Motives: M1 = Project-based motivations (NGOs incentives and government-promoted programs); M2 = Influences from peers/friends and the media; M3 = Leadership, encouragement, and support of local authority; M4 = Altruistic behaviors and environmental civism (bequest/altruist behavior and civic morality/community loyalty); M5 = Other restoration motives; M6 = Rationales elements (soil erosion/land degradation, low yield, deforestation, and rainfall scarcity).
Sustainability 12 05380 g006
Figure 7. Differences in the average number of restoration benefits and incentives by gender, education, and location among farmers engaged in restoration (N = 443). Note: Each box-and-whisker diagram depicts the quartile-based distribution of the number of benefits/incentives per group/factor of comparison. The boxes indicate the interquartile range; the lines (whiskers) show the minimum and maximum range outside the quartiles; and the dots are extreme values (outliers).
Sustainability 12 05380 g007
Figure 8. Types of restoration benefits and incentives by gender, education, and location. Notes: Radar charts comparing the mean value (on a scale of 0–1) of each type of benefit/incentive among the different groups/factors. Benefits: B1 = Crops yield improvement; B2 = Reforestation and its environmental benefits; B3 = Sustainable provision of firewood and production of charcoal; B4 = Sustainable provision of NTFPs; B5 = Cope with climate change impacts; B6 = Increase tourism/income source/other benefits. Incentives: I1 = Cash for work incentives schemes and credit/loan provision schemes; I2 = Free improved cookstoves; I3 = Free/subsidized seedlings for nurseries and agricultural fertilizers; I4 = Training on SLM practices and supply of agricultural information; I5 = Granted land/tree use rights/training allowances/in-kind incentives/other incentives; I6 = No incentive.
Sustainability 12 05380 g008
Table 1. Illustration of Two Rules Depicted During Role-Playing Games, Showing the Initial Decision-Making Factors.
Factor 1Factor 2Factor 3Factor 4Factor 5Factor 6
Dedza
Level of Deforestation in the Forest ReserveBenefits of Trees (Firewood)Lack of FirewoodTime Saving When CookingMoney After Selling TimberTraining by Extension Workers
Ntchisi
Scarcity of Water Resources (Drying of Rivers)Fearing Impacts of Environmental DegradationBenefits of Restoration (Wind Break and Shade)Level of Degradation (Soil Fertility Loss)Government PolicyTraining, e.g., Knowledge in Tree Management
Factor = decision-making factors, the initial (raw) factors that respondents use in articulating their restoration decision-making rules. (Extracted from Figure 4 above).
Table 2. Number of Goal Frames Included in the Individual Mental Decision-Making Rules from the Survey.
Number of Goal Frames Considered0 a12345
Rules for Individual-Level RestorationMain Rule (n = 443)1.5810.3836.7939.059.033.16
Secondary Rule (n = 23)94.810.231.352.710.9-
Tertiary Rule (n = 3)99.32--0.68--
Rules for Collective-Level RestorationMain Rule (n = 268)0.758.2117.5445.5223.884.1
Secondary Rule (n = 14)94.78-1.121.872.24-
Tertiary Rule (n = 1)99.63-0.37---
a 0 represents respondents who stated that they did not consider any element for restoration decision making.
Table 3. Local Perspectives on Environmental Resource Restoration in Dedza and Ntchisi Communities.
Local References to Resources RestorationExamples of Narratives a
Planting More Trees to Attract Reliable Rains“Planting more trees to attract reliable rains, and where we have cut trees, we are supposed to replace them by planting some more trees. Trees also help in preventing our buildings from heavy wind by acting as wind breaks.”
Using Agroforestry Systems, Including Intercropping to Restore Soil Fertility“For us agroforestry people, restoration is using fertilizer trees to conserve and improve soil fertility. Not using inorganic fertilizer that degrades soil fertility further.”
[…] In the past, our parents were cultivating with no fertilizer, but they were harvesting higher yields and we want to turn our soils back to that state.”
“Planting trees helps to ensure we are receiving reliable rains that help crops that we grow on improved soils to grow well. Some other trees act as both fertilizer trees and when they grow, they act as forests, for instance, Gliricidia.”
Biodiversity Recovery“Making sure that wildlife like birds, hares, and grasshoppers are back into the environment by planting trees. There were more wildlife animals in the past because there were more trees.”
Forest Management and Protection Through Beekeeping“Restoration is about protection of forests by keeping bees and doing all bee keeping activities; for instance, killing pests and applying oil. […] Beehives in both village forests and forest reserves help to protect trees because people are afraid of bees.”
Managing Natural Regeneration“…after cutting down trees by making fire breaks and pruning; where there are natural regenerants, we make sure we manage.”
a Excerpts from all focus group discussions (FGDs).
Table 4. Restoration Decision-Making Goal Frames and Their Occurrence in the Focus Group Discussions and the Survey.
#Types of Goal FramesDescription (From Initial Factors)Occurrence in Discussions a
(Count)
Occurrence in Survey (%) b
Individual Level (n = 443)Collective Action (n = 268)
1Problem SolvingLand Degradation Level; Scarcity of Water; Deforestation; Avoidance/Control of Soil Erosion; Low Fertility Rate/Improve Soil Fertility; Low yield/Increase Crop Yield; Insufficient food2689.39%47.01%
2BenefitsAccess to/Free Firewood, Poles, Non-Timber Food Products, and other Materials Benefits from Trees Resources3020.54%54.48%
3KnowledgeSkills/Knowledge on Land Restoration1824.15%9.70%
4Risk AversionAvoiding Climate Change Effects91.58%19.40%
5Influence of PeersInfluenced by Peers/Friends/Wives139.26%2.24%
6OutcomesImpacts and Outcomes91.13%0.37%
7Time-EfficiencySaving on Labor Time9N/AN/A
8Bequest/Altruist ValueInterest in Conserving the Environment41.58%1.87%
9Rules of Collective/ Community WorkRules and Laws Associated with Collective Action/Community-Village work301.49%
10Resource/Material ConstraintsAccess to Resources for Manure Making; Affording to Buy Fertilizer; Access to Water Source; Access to Tree Seedlings; Availability of/Access to Resources/Materials; Labor DemandN/A45.6%25.37%
11IncentivesTraining/Knowledge Benefits from Extension Workers/NGOs; Incentives from projects; Cash/Food for WorkN/A40.41%36.57%
12Government Promotion or RequirementGovernment-Led/Required Programs with or without Schemes of Rewards4N/AN/A
13Leadership of Local AuthorityGood and Strong Leadership of Local AuthorityN/A2.93%77.24%
14Morality/Community LoyaltyCommunity Involvement/Participation
Civic Education/Community Responsibility
N/A1.81%15.30%
15Media AwarenessInformation/Awareness from MediaN/A1.81%0
16Extension ServiceAdvice/Encouragement from Extension Services/NGOsN/A6.77%2.99%
17Economic CapacityEconomic CapacityN/A6.09%1.87%
a: A simple count of the number of times the goal frame was registered from all the focus group discussions. b: The percentage value denoting the occurrence of the goal frames among the survey respondents; Bold: The most important goal frames. Italics: Common goal frames in the discussions and the survey.
Table 5. Most Commonly Occurring Decision-Making Rules Drawn from Both Focus Group Discussions and the Survey.
NoRules aAbbreviation aPercentage b
Individual-Level Restoration (n = 436) *
Three Main Goal Frames as Base Plus One Alternative
1Problem Solving—Resource/Material Constraints—IncentivesKnowledge—Benefits—Economic CapacityPsMcInc_KBEc11.7%
2Problem Solving—Resource/Material Constraints—KnowledgeBenefits—Economic Capacity—Extension Service—Influence of PeersPsMcK_BEcExtIf11.2%
Two Main Goal Frames as Base Plus One/Two Alternative(s)
6Problem Solving—Resource/Material ConstraintsMedia Awareness—Extension Service—Influence of PeersEconomic Capacity—Leadership of Local Authority—Bequest/Altruist ValuePsMc_MaExtIfEcLaAl13.1%
7Problem Solving—IncentivesKnowledge—Morality/Community Loyalty—Media Awareness—Risk Averse—Extension Service—Influence of PeersLeadership of Local Authority—Economic Capacity—Bequest/Altruist ValuePsInc_KMoMaRExtIfLaEcAl18.8%
One Main Goal Frame as Base Plus One or No Alternative
15Problem SolvingResource/Material Constraints—BenefitsPs_McB10.6%
Collective-level Restoration (n = 266) #
Three Main Goal Frames as Base Plus One Alternative
1Leadership of Local Authority—Problem Solving—BenefitsKnowledge—Risk Averse—Rules of Collective/Community WorkLaPsB_KRRu11.7%
2Leadership of Local Authority—Problem Solving—IncentivesBenefits—Risk AverseLaPsInc_BR10.5%
5Leadership of Local Authority—Resource/Material Constraints—IncentivesKnowledge—Benefits—Risk AverseLaMcInc_KBR10.2%
Two Main Goal Frames as Base Plus One/Two Alternative(s)
7Leadership of Local Authority—Resource/Material ConstraintsBenefits—Knowledge—Extension Service—Influence of PeersLaMc_ BKExtIf9.0%
8Leadership of Local Authority—Benefits—Knowledge –Risk Averse—Bequest/Altruist ValueLaB_KRAl9.0%
12Problem Solving—IncentivesMorality/Community Loyalty –Influence of Peers—Benefits—Risk Averse—Economic CapacityPsInc_ MoIfBREc7.1%
One Main Goal Frame as Base Plus One or No Alternative
16Leadership of Local Authority OR Rules of Collective/Community WorkResource/Material Constraints—Economic CapacityLa_Ru_McEc8.3%
a Bold denotes related goal frames as base/root for the rules; Italic denotes the related secondary goal frames, which are either absent or present in the rules, alternatively; b Number of times the rules emerged (whether with the goal frames in same order or not) expressed as % of the survey sample; * Seven respondents, among the 443 who claimed to restore land at the individual level, did not provide any factors and rules; # Two respondents, among the 268 who claimed to restore land at the collective level, did not provide any factors and rules.
Table 6. Decision-Making Processes for Individual Restoration of Forest-Agricscapes in the Study Areas.
Rules123456789101112131415161718192021
Vegetation-based restoration practicesa
b
d
c
a
b
d
e
a
b
d
c
a
b
d
c
a
b
d
e
a
b
d
c
a
b
d
c
a
b
d
a
b
d
c
e
a
b
d
a
d
ba
d
a
b
d
a
b
d
c
a
b
d
a
b
d
da
b
d
b
d
a
b
Non-vegetation-based restoration practicesg
i
k
f
h
j
l
m
g
i
k
f
h
j
l
g
i
j
k
l
g
i
k
f
h
j
l
g
i
f
j
f
g
i
k
h
j
l
m
g
i
k
l
f
h
j
f
g
i
k
h
j
f
g
i
k
h
j
l
f
i
k
g
h
l
g
i
k
j
l
f
f
g
h
i
k
g
i
k
f
g
h
i
k
l
g
i
k
f
h
j
l
f
g
i
h
j
k
g
i
k
l
g
i
j
k
l
f
g
i
k
g
i
k
l
g
k
l
Bolded letters refer to restoration practices applied by at least half of the respondents who display the specific rule; letters in italics represent related restoration practices with very low occurrence (<20%).
Table 7. Decision-Making Processes for Collective Restoration of Forest-Agricscapes in the Study Areas.
Rules12345678910111213141516171819
Vegetation-Based Restoration Activitiesa
b
c
d
q
a
b
c
d
q
a
b
c
d
a
b
c
d
a
b
a
b
d
a
b
a
b
c
a
b
c
d
q
a
b
a
b
c
a
b
a
b
a
b
a
b
d
a
b
d
a
b
q
a
q
Non-Vegetation-Based Restoration Activitiesn
o
p
n
o
p
r
n
o
p
n
o
p
r
n
o
p
r
n
o
p
r
n
o
p
n
o
p
n
o
p
r
n
p
n
o
p
n
o
p
n
o
p
n
o
p
n
o
p
n
o
p
n
o
p
n
o
p
r
Bolded letters refer to restoration activities applied by at least 75% of the respondents who display the specific rule; letters in italics represent related restoration activities with a relatively low occurrence (<40%). The specific restoration activities and their magnitude could not be elicited for Rule#6 as this rule was identified only from the games and not from the survey.

