Scalable Life-Cycle Inventory for Heavy-Duty Vehicle Production
by
 , and
, and
Sebastian Wolff
* ,
,
Moritz Seidenfus
, 
Karim Gordon
,
Sergio Álvarez
,
Svenja Kalt
and
Markus Lienkamp
Institute of Automotive Technology, Technical University of Munich, Boltzmannstraße 15, 85748 Munich, Germany
*
Author to whom correspondence should be addressed.
Sustainability 2020, 12(13), 5396; https://doi.org/10.3390/su12135396
Submission received: 3 June 2020
/
Revised: 3 June 2020
/
Accepted: 25 June 2020
/
Published: 3 July 2020
(This article belongs to the Special Issue 2020 Perspectives on Electric Mobility Research, What’s Next?)
Abstract
:The transportation sector needs to significantly lower greenhouse gas emissions. European manufacturers in particular must develop new vehicles and powertrains to comply with recent regulations and avoid fines for exceeding emissions. To answer the question regarding which powertrain concept provides the best option to lower the environmental impacts, it is necessary to evaluate all vehicle life-cycle phases. Different system boundaries and scopes of the current state of science complicate a holistic impact assessment. This paper presents a scaleable life-cycle inventory (LCI) for heavy-duty trucks and powertrains components. We combine primary and secondary data to compile a component-based inventory and apply it to internal combustion engine (ICE), hybrid and battery electric vehicles (BEV). The vehicles are configured with regard to their powertrain topology and the components are scaled according to weight models. The resulting material compositions are modeled with LCA software to obtain global warming potential and primary energy demand. Especially for BEV, decisions in product development strongly influence the vehicle’s environmental impact. Our results show that the lithium-ion battery must be considered the most critical component for electrified powertrain concepts. Furthermore, the results highlight the importance of considering the vehicle production phase.
1. Introduction
The Paris Climate Agreement requires drastic reductions of carbon dioxide emissions for industry and private sectors [1]. The transportation sector is responsible for 27% of European greenhouse gas emissions (GHG), of which road transportation accounts for 71.7%. Despite international agreements, emissions from road transportation keep increasing, due to increasing transportation demand [2]. For example, the German Ministry of Transport predicts an increase in road transportation of 30% by the year 2030 [3]. Furthermore, globalization leads to stronger connected markets and consequently a higher transportation demand. Additionally, e-commerce has been growing rapidly, and is expected to further increase road transportation [4]. Long-distance or heavy-duty trucks handle the largest share (68.2%) of transport performance [5,6]. It is evident that heavy-duty trucks will remain an integral part of transportation in the future. Due to their high share (50%) of (fossil) energy consumption, vehicles with gross weights of more than 15 tons each have substantial leverage over lower anthropogenic GHG [7]. Therefore, the European Union tightened limits for emissions for passenger cars in 2018 and expanded these limits to include light and heavy-duty vehicles in 2019 [8,9].
The reduction of emissions presents new challenges for the transportation and commercial vehicle sector. Therefore, the current trend of e-mobility for passenger cars continues in the commercial vehicle sector. To reduce emissions and avoid fines, original equipment manufacturers (OEMs) are exploring new powertrain technologies. In addition to battery electric vehicles (BEV), hybrid electric vehicles (HEV) offer energy and thus savings.
BEV have zero tailpipe (tank-to-wheel) emissions but require electric energy for charging. Thus, a holistic assessment must consider the production and transformation of electricity (well-to-tank). In addition to their energy supply, BEV components and their respective production processes change. The energy-intense production of lithium-ion batteries in particular has been the focus of recent discussions [10,11,12]. Commercial vehicles require up to ten times larger batteries than passenger cars, rendering this topic even more important [13].
2. Technical Background
The general requirements for commercial vehicles are dominated by economic aspects. Optimizing payload or useful volume and optimizing energy consumption are the main design requirements for commercial vehicles ([14] p. 11). Further requirements include safety and reliability, including environmental aspects such as pollution and noise emissions ([15] p. 6). These requirements and the maximum allowed vehicle dimension [16] define the design and technical features of modern commercial vehicles [15]. This section gives a brief summary of vehicle concepts and components for heavy-duty vehicles. The examined vehicle concepts are explained in detail.
2.1. Heavy-Duty Vehicles for Road Transportation
The European union defines heavy-duty vehicles (HDV) as vehicles with more than tons gross vehicle weight (GVW), including trucks, buses and coaches [17]. Long-haul trucks for road freight transportation with three or four axles and GVWs of more than 12 tons are categorized as class 8 in the United States or N3 in Europe [14,18]. These trucks typically travel a daily distance exceeding 150 km. Improvements in battery technology and decreasing automotive battery prices enable new vehicle concepts. Tesla announced a fully battery-powered electric long-haul class 8 tractor in 2017 [13]. However, this concept is still in prototype phase and not commercially available. Additionally, hybrid or plug-in hybrid vehicles could potentially lower energy consumption [19]. However, only a few models with hybrid drive are commercially available [20,21]. Beyond that, several other designed or prototype vehicles with alternative powertrains exist. For details, we refer to Moultak et al. (2017) and Hoffmann (2018) [18,21].
Although battery electric vehicles have different powertrains than conventional internal combustion engine (ICE) trucks, the platform (Section 2.2) and trailer are the same. To enhance the comparability of the powertrain concept, we therefore divide the vehicles into gliders and conventional ones, and electrical powertrain ones. Figure 1 shows the typical package of N3 truck components and the applied classification, which are further explained in Section 2.2 and Section 2.3. Section 2.4 outlines the final assembly process which is assumed to be identical for all vehicle concepts.
2.2. Glider
The glider (Figure 2) describes the vehicle without its powertrain components and energy sources. The definition of the powertrain includes the engine and all drivetrain components, whereas a drivetrain only consists of components necessary for converting and transmitting torque from the engine to the wheels ([22] p. 845). Drivetrain components usually include transmission, clutch, differential and suspension. Consequently, our definition of a vehicle glider includes some drivetrain components, because the axles, differential and suspension, are assumed to be independent of the power and energy source. The glider includes all components that are common between the vehicle concepts:
- Chassis, including saddle coupling;
- Front and rear axle, including suspension;
- Cab and interior;
The chassis or frame is the central supporting chassis element and consists of two U-profile longitudinal beams ([14] p. 127). Besides the powertrain and the suspension; basic components are attached to the frame. These components include the fuel tank; battery; compressed air tank; tool box; spare wheel; exhaust system; underride guard; trailer coupling; and in the case of vehicles for swap bodies, the side protection device ([15] p. 195). The life-cycle inventory (LCI) of the chassis also includes weld blanks and fasteners, and the saddle clutch.
The truck suspension is also independent of the powertrain concept and therefore included in the generic glider. Heavy-duty trucks are typically equipped with a rigid rear axle and a steerable front axle ([15], p. 170 and [23], p. 253). The suspension system consists of mechanical or pneumatic springs and hydraulic dampers. Since pneumatic springs are becoming more commonly used than mechanical springs ([15] p. 187), this suspension type is used for the inventory. We assume that the rear axle—including differential, axle housing and braking system ([15], p. 170 and [24], p. 557)—is used by all vehicle concepts. The steering system is assumed to be a hydraulically assisted Ackermann steering system that is state-of-the-art for two track vehicles ([15], p. 170).
For the presented inventory, the tires and wheels are also included in the vehicle glider. Heavy-duty vehicle rims are linked to the tire width and load-bearing index. The rims are assumed to be 22.5 inch, two-piece disc wheels made from steel. This tire and rim combination is commonly used for long-haul vehicles ([15] p. 212). Chrome-plated rims for decoration are not considered.
The driver’s cab is connected to the chassis frame via two bearing points in the front area, around which it can be pivoted forward for maintenance and repair work on the engine ([15] p. 195). The rear bearing points are spring-loaded and damped. The cab forms the interior space which the truck operators occupy while driving the vehicle. Besides the driving task, the cabin is also the living and sleeping area, which is often required in long-distance hauling. [25]. The dashboard and steering wheel of a modern truck are comparable to those of a conventional vehicle. The main difference consists of several storage compartments and one or more sleeping facilities. The interior consists of the seating and restraints, including bunks, the steering wheel, glass, the instrumental panel, trim and insulation, door modules, interior electrical components and the heating, ventilation and an air conditioning system [26].
2.3. Powertrain and Electrical Components
The central powertrain component is the engine or the electric machine. In heavy-duty applications, diesel engines are used almost exclusively (97%), especially because of their higher efficiency and energy density of diesel as compared to gasoline ([7,15] p. 9 and [24] p. 95). For combustion engine vehicles, transmissions with 6 to 16 gears and a high durability convert the engine torque and ensure a valid operating point ([22] p. 845 and [24], p. V, 59). Fully electric powertrains require fewer gears due to the torque curve of the electric machine. Current concept vehicles feature direct-drive (one gear) or two to three gears [21]. A steel shaft connects the transmission output to the differential of the driven axle. The standard powertrain topology of heavy-duty vehicles is a longitudinally aligned front engine with rear-wheel drive (Figure 3) ([14] p. 18, [15] p. 23 and [24] p. 144). Heat generated during combustion is dissipated into the ambient air via an aluminum radiator ([15] p. 939).
In the case of hybrid vehicles, an electric machine is added. Multiple possible topologies for hybrid powertrains exist. For extended information on hybrid topologies, we refer to Douba and Lohse-Busch (2016) and Reif et al. (2012) [27,28]. Because of its high potential for long-haul application, this study only considers P2-hybrid topology ([15] p. 530, [29] p. 194 and [30,31]). P2-hybrid topology places the electric machine between the engine and the transmission, enabling four operating conditions: (1) diesel only, (2) electric boosting, (3) electric only and (4) ICE load-point control. Electrical machines are either asynchronous (ASM) or permanent magnet synchronous machines (PSM). Regarding the life-cycle inventory, the main difference is in the permanent magnets used for PSM. Nordelöf et al. (2018) presented a detailed gate-to-gate life-cycle inventory of an automotive permanent synchronous machine [32].
Although technically not part of the powertrain, we include the fuel tank as equivalent to the lithium-ion battery in the definition because it is a major difference between powertrain concepts. Lithium-ion batteries are the key component in a battery electric drivetrain. Their large weight and volume together with relatively poor fast-charging abilities compared to diesel show the importance of the battery for the vehicle concepts [18,33]. The trade-off between range and payload is critical for battery electric heavy-duty vehicles. Therefore, automotive batteries are well represented in scientific debate. Romare and Dahllhöf (2017) assessed greenhouse gas emissions of automotive lithium-ion batteries in 2017 [10]. Emilsson and Dahllhöf (2019) reevaluated greenhouse gas emission based on the life-cycle assessment by Dai et al. (2019), which also forms the basis of this study [12,34]. Berg et al. (2015) and Miller et al. (2015) showed the state-of-the-art of automotive traction batteries and outlined their technological potential [35,36]. Additionally, environmental impact and technological potential, costs for traction batteries have been studied intensively. For detailed information, we refer studies conducted by Fries et al. (2017), Cano et al. (2018) and Wentker et al. (2019) [33,37,38].
2.4. Assembly
To optimize the cost-efficiency of the vertical depth of manufacturing and due to complex supply chains, the production of single components and final assembly of the vehicle is often not carried out at the same production facility ([15] p. 309, [25] p. 447 and [39] p. 54). Consequently, all components must be transported to the final assembly facility. Because just-in-time or just-in-sequence production is the common mode of production for commercial vehicles, high flexibility in the supply-chain is required, and thus road transportation with trucks is often used for the supply of the assembly sites ([39] p. 54, 288).
The variety of customer requirements leads to a high variance in vehicle production and assembly [40]. To handle this complexity, the final assembly is mostly manual work. However, body-in-white production and paint shop processes are automated ([25] p. 448).
Table 1 summarizes the generic vehicle configuration of the internal combustion engine, hybrid electric and battery electric vehicles. Different vehicle concepts, such as plug-in hybrid or short and long range BEV, can be obtained by scaling the components (Section 3.2).
2.5. Purpose
A variety of research has been conducted to compare alternative with conventionally powered (i.e., diesel powered) vehicles. Gaines et al. (1998) conducted the first life-cycle assessment of heavy-duty trucks and analyzed alternative fuels and lightweight construction [41]. Rupp et al. (2018) compared hybrid heavy-duty trucks to conventional internal combustion engines (ICE) [42]. Sen et al. (2017) reviewed the current state-of-the-art in the context of LCA for HDV. Further, they compared ICE, hybrid and electric trucks [43]. Table 2 summarizes previous research and classifies the respective goal and scope. The mentioned studies lack detailed or accessible data of the LCI. Furthermore, heavy-duty vehicles are insufficiently covered. In particular, data on European commercial vehicles are missing.
In the early development phase, the concept defining vehicle parameters is set. Upfront, multiple parameters need to be tested in order to optimize the final concept. Consequently, an LCI used for concept development must represent a variety of concepts. Therefore, this work compiles a scalable life-cycle inventory on the component level for a European heavy-duty tractor.
3. Life-Cycle Inventory
In compliance with ISO14040, we start with the goal and scope definition (Section 3.1) and develop the life-cycle inventory (Section 3.2). The inventory is applied to five different vehicle concepts with conventional and alternative powertrains to obtain the respective material compositions (Section 4.2). As an example of environmental impact, global warming potential (GWP) and primary energy demand are addressed in detail (Section 4.2).
3.1. Goal and Scope Definition
The goal of this work is to fill the presented gap of research (Table 2) and develop a complete, accessible LCI for heavy-duty trucks. Given the scarcity or lack of primary data, for example, by OEMs or suppliers, we rely on secondary sources. We summarize data for single components of passenger or heavy-duty vehicles. Detailed industry inventories and reports regarding materials, masses and processes were used whenever these were available, but the use of companies’ internal (i.e., not published) LCIs with confidential, manufacturer-specific data was avoided as far as possible. Additionally, we used accessible data from OEMs, published in non-financial business or corporate social responsibility reports. To verify the approach, we discussed data quality with experts from different European commercial vehicle manufacturers.
The resulting life-cycle inventory provides mass compositions and manufacturing data for ICE, hybrid and battery electric vehicles (Section 2). Representative vehicle models are resolved at the component level and divided into common and individual components, which allows each component to be scaled individually. The presented LCI and resulting material mix can easily be modeled in any LCA software combined with different databases (thinkstep professional, ecoinvent, etc.). If company-specific data for components or processes is available, the data can be integrated and used in combination with this LCI.
The intended use of the life-cycle inventory is utilized during the concept-and-product-development phase of the vehicle design process. At this stage, the final vehicle is yet to be defined, and decisions influencing economic and environmental impacts of the final product must be made. A cradle-to-grave system boundary (Figure 4) includes the use-phase and the end of life or recycling of the vehicle. However, the use phase is dependent on mission profiles and the intended purpose of the customer and cannot directly be influenced by engineering decisions [6,52]. This is especially important for commercial vehicles, for which load profiles and thus use phase emissions vary strongly depending on the respective use cases [6]. Therefore, the system boundary of this study is defined as cradle-to-gate (CtG), as shown in Figure 4, and the use-phase and end of life are neglected. In contrast to a complete product life-cycle, cradle-to-gate “ends at the gate of the factory where the studied product is produced” ([53] p. 102). The LCI includes the process chain from raw material extraction and the processing and manufacturing of vehicle parts and components through final assembly. Each upstream process step can be regarded as another CtG ending at the respective gate until the manufacturing of the final product. Vehicle use phase, also known as tank-to-wheel; end of life; and the fuel life-cycle (well-to-tank) are excluded.
3.2. Inventory Compilation
In the life-cycle inventory, materials and energy data for each component are bundled and aggregated to obtain a complete vehicle. Weight models [54] link the mass to key performance indicators of the respective components. This ensures the application of the inventory in engineering practice: For example, an engineer will design the battery capacity based on the required vehicle range. The capacity correlates with the battery mass and consequently its material composition. The resulting material composition is used to model the upstream processes of material extraction. This step is carried out using ecoinvent V3.3(2017) [55] as a background dataset in addition to thinkstep database 6.115 (2017) [56] provided with the LCA software GaBi [57]. The methodology is shown in Figure 5.
Material composition and energy inputs and heat for material processing of the vehicle glider are scaled using the results of the GREET model and Hawkins et al. (2013) [26,44,50]. Table 3 summarizes the life-cycle inventory for the generic vehicle glider. To obtain data for cradle-to-gate energy use, the production process is modeled with GaBi. Because the exact metal processing steps are unknown, average European manufacturing processes were used for metal working with the respective raw material input. These processes include machine and factory operation (electricity, water, process heat, etc.) [60]. For cast iron an average milling process is assumed and the required electricity is listed separately as energy. Aggregated processes were utilized wherever possible, to rely on the data provided with the two background databases and avoid assumptions on upstream processes. The complete glider LCI is given in Appendix A and the open-source code is available on Github [61].
The inventory of a powertrain with an internal combustion engine is also a scaled version of GREET and the results of Hawkins et al. [44]. Table 4 summarizes the production and assembly inventory data of an ICE powertrain. Additional data on energy demand and emission from the production of a diesel engine by Li et al. is used [48]. The amount of lubricant for engine, transmission and differential is taken from the 2019 version of the MAN maintenance and operating instructions [64]. The same applies for the cooling agent.
Material composition and energy inputs of the lithium-ion battery were taken from Dai et al. [12], who provided state-of-the-art inventory data for automotive applications. The electric machine inventory utilizes the material composition by Nordelöf et al. [32]. Additionally, energy consumption of the preceding processes is modeled with GaBi to adapt the cradle-to-gate system boundary of this study.
We assume the components are manufactured in different locations and then transported to the final assembly by road and diesel truck with a generic distance of 100 km. The energy required for final vehicle assembly is provided by data from a European truck OEM [66]. The data refer to energy and water consumption used at a facility for final vehicle assembly where no additional production processes take place. Table 5 summarizes the LCI data for vehicle assembly.
4. Results
Following the vehicle concept definition in Table 1, configuration parameters for further analysis are defined. Table 6 summarizes the configuration parameters of the reference diesel vehicle, two battery electric vehicles (BEV1 and BEV2), one hybrid vehicle (HEV) and one plug-in hybrid vehicle (PHEV) respectively. The two BEVs have differently sized batteries in order to represent a shorter range of 450 km (BEV1) and a long range of approximately 600 km (BEV2). Mährle et al. (2017) collected data of ten vehicles used for long-haul transportation [68]. They showed that on average, the vehicles traveled 400 km to 600 km per day. Consequently, the analyzed vehicles represent the lower and upper boundaries of the collected vehicle data. The HEV configuration is based on the results of Fries et al., who used an evolutionary algorithm to optimize costs and transport efficiency of a vehicle for long-haul applications [58]. The same approached was used to obtain the PHEV configuration [20]. Fries et al. limited the electric-only speed of both hybrid vehicles to 50 km/h, resulting in low electrical torque and power requirements [59]. All concepts meet the required ranges and are therefore suitable for long-haul transportation. The mass models are implemented in the LOTUS simulation model [54,59,61].
4.1. Inventory Analysis
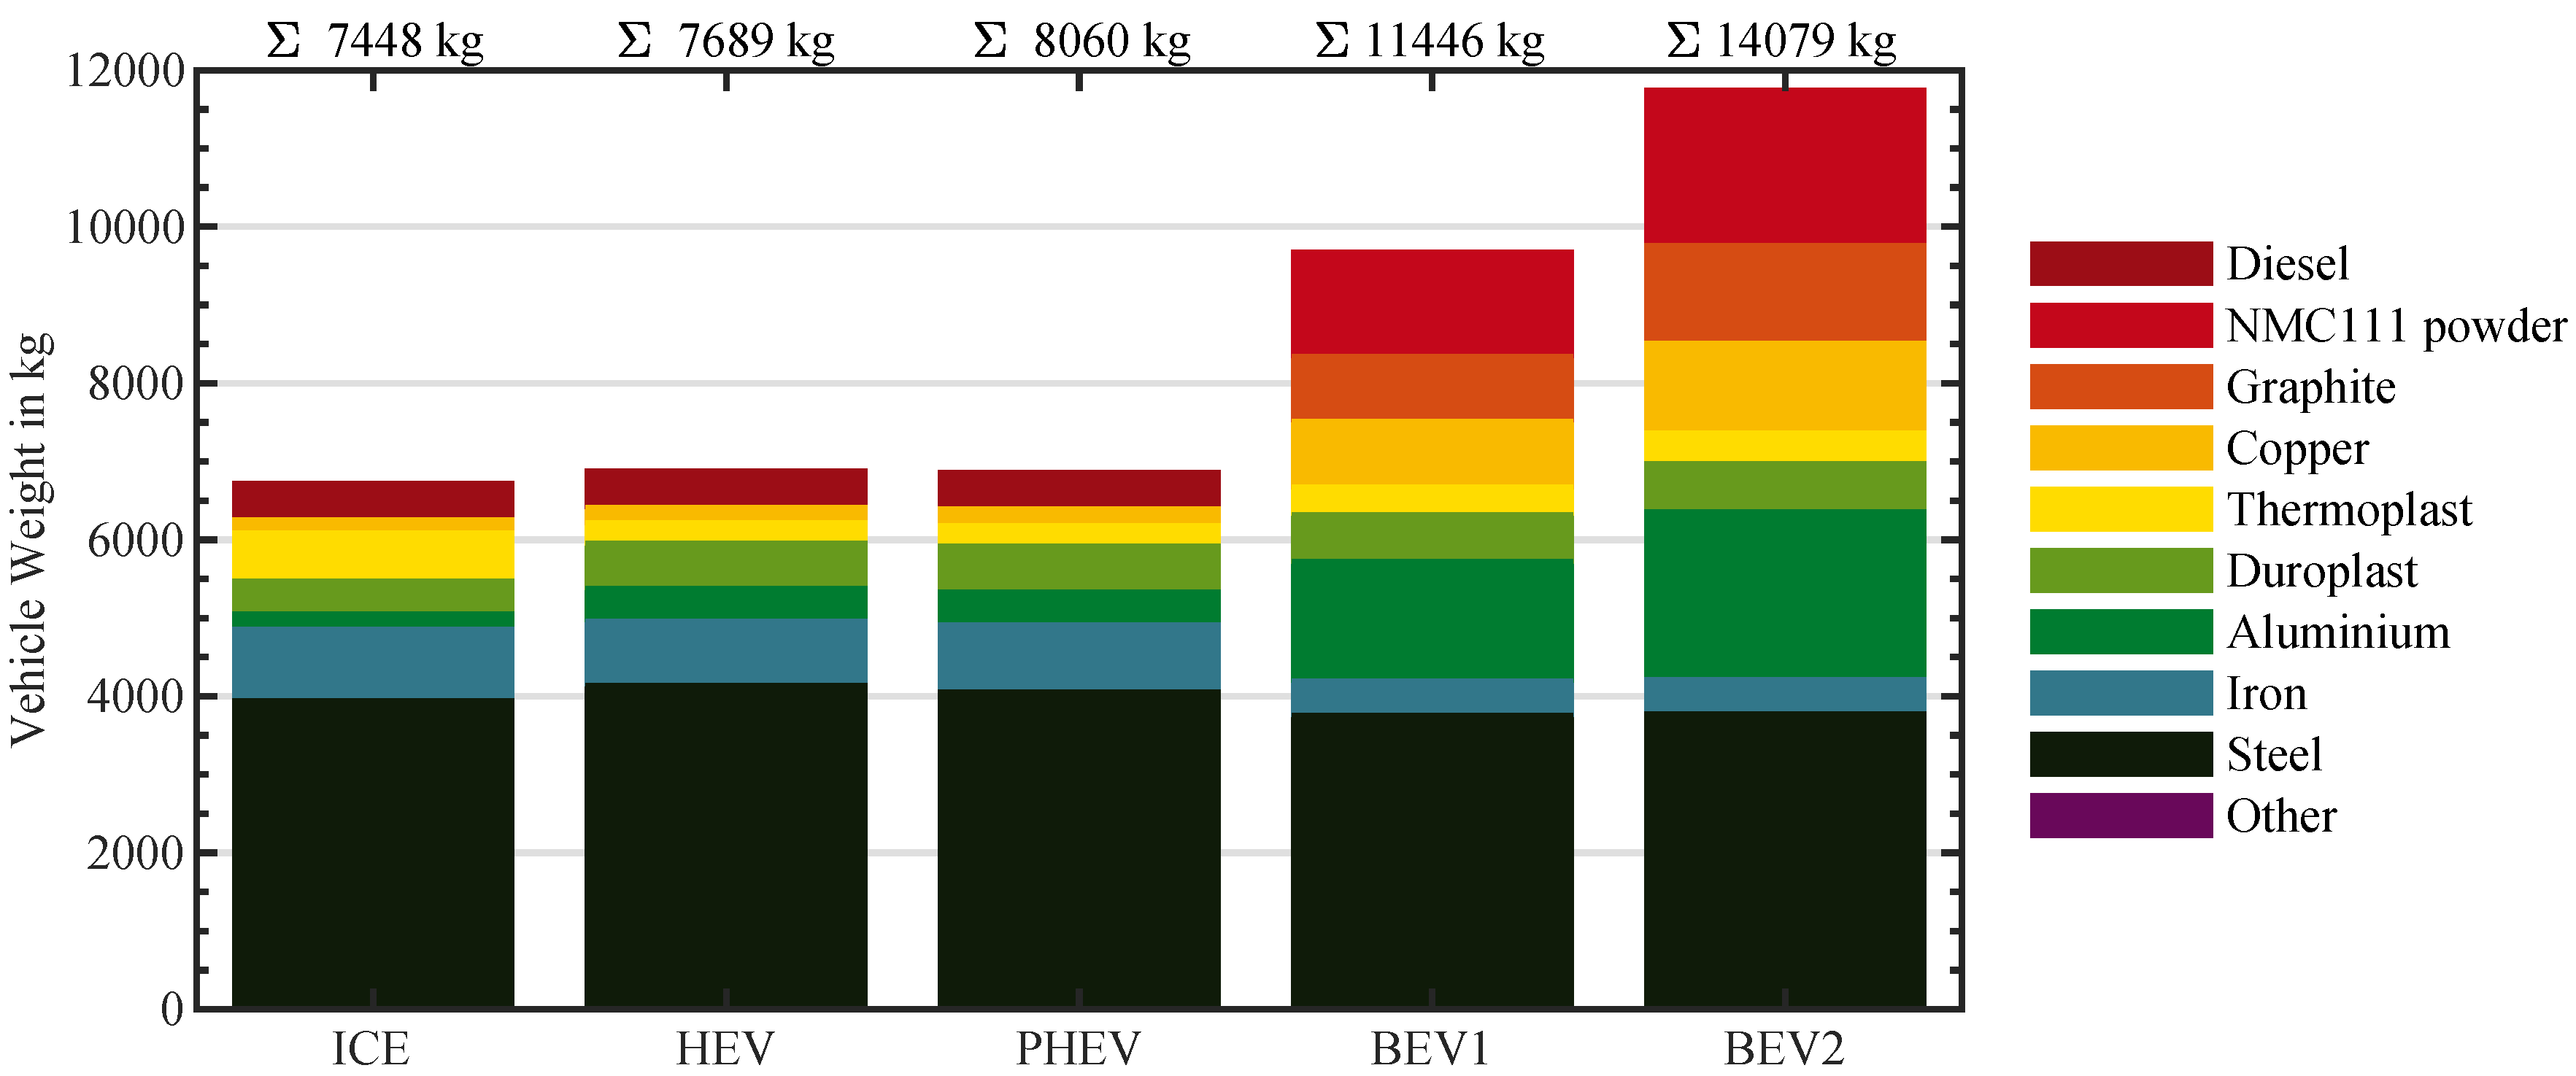
Figure 6 shows the material mix of the concepts and highlights the change in material mix. The diesel and two hybrid concepts only show a small deviation regarding used materials. Steel and iron—used for the frame and ICE—are the most prominent materials. The total weight of the hybrid vehicles is 3% to 8% higher and thus comparable to the diesel vehicle: Down-sizing the internal combustion engine saves 229 kg to 310 kg and compensates the additional weight of the electrical components. This is in line with the findings of Fries et al. (2017), who observed net weight savings due to engine downsizing of approximately 220 [58]. Rupp et al. results confirm the additional weight of approximately 500 kg of the HEV [42].
Due to the battery, the material mix of both battery electric vehicles is significantly different to that of the vehicles equipped with combustion engines. On a component scale, the differences in the material mix become evident. The mass of steel is mainly located in the glider, and consequently almost constant among the vehicles (relative standard deviation: 3.78%). Due to the omission of the combustion engine, the proportion of iron materials in the BEV is reduced by half, with the remaining iron being due to the suspension and transmission (431 ). The mass of aluminum increases the mass of the materials most of all. Compared to the ICE vehicle (197 ), the two BEV concepts show an increase of aluminum by a factor of 7–10 or 1525 kg and 2153 respectively. The increase is mainly due to the lithium-ion battery pack which is responsible for 82.3–87.5% of the BEV aluminum. With a total weight of 5265 kg and 7897 , the battery comprises 46–56% of the total tractor weight. This results in a net payload loss of the BEV of 3.998 t and 6.630 t compared to a conventional ICE vehicle.
4.2. Impact Assessment
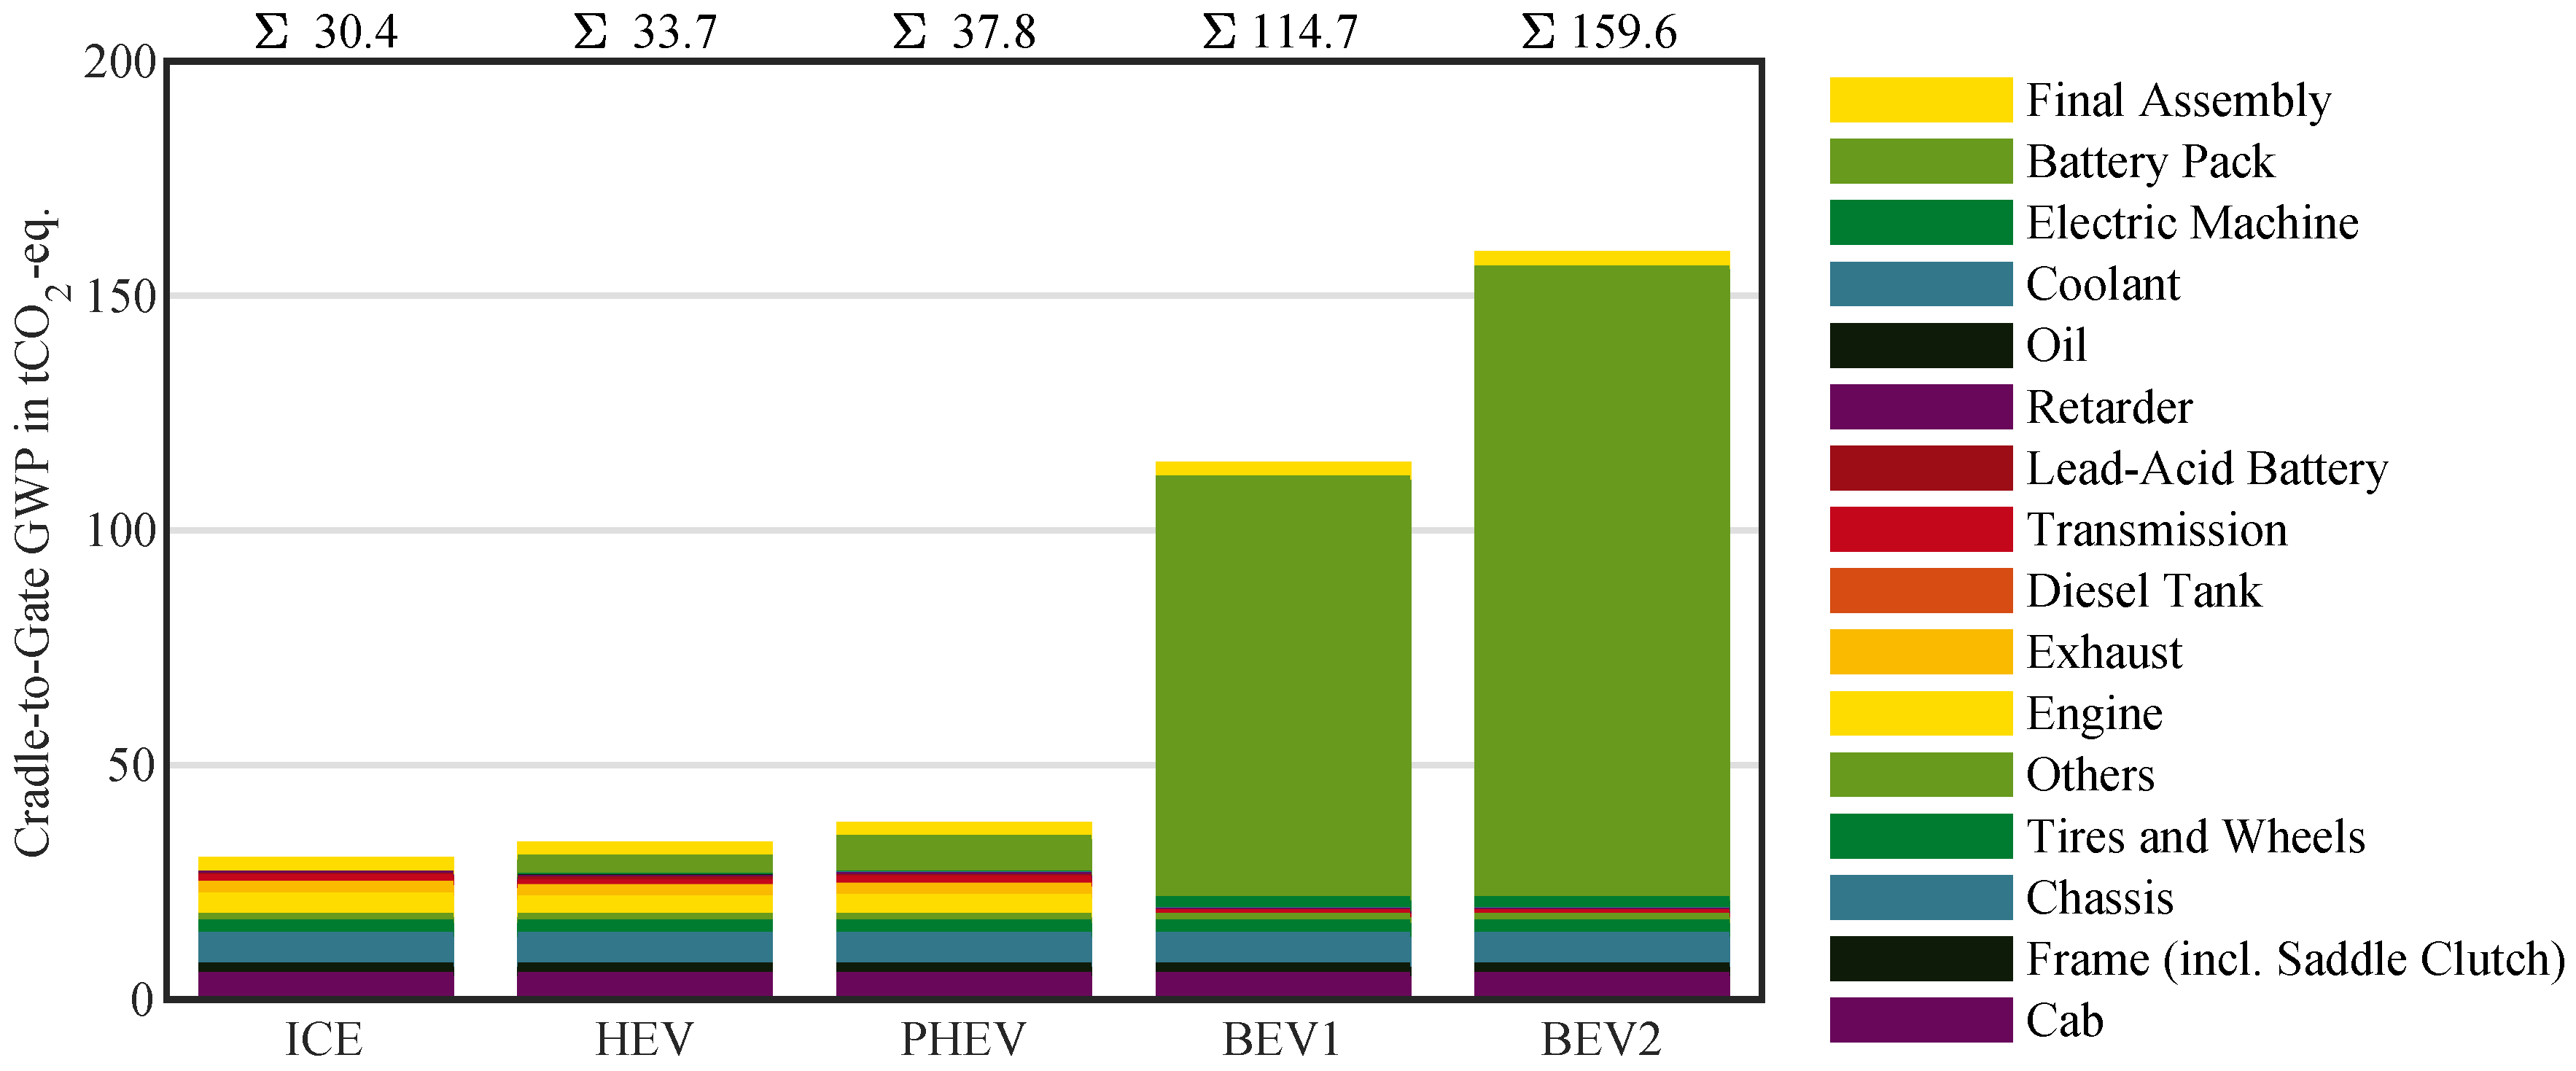
Greenhouse gas emissions, foremost emissions, are the main driver of global warming and climate change [70]. Global primary energy consumption is largely responsible for rising emissions. A consideration of the primary energy is therefore an important component in order to replace fossil energy sources with renewable ones [71]. Because of this, we assess the environmental impact using primary energy, and global warming potential as an example of environmental impact. Other impacts categories, such as acidification or land use, are not regarded in this study but can be modeled with the presented LCI and any LCA software. It must be noted that primary energy demand includes the efficiency of electricity production. For this study we model the average 2019 European energy mix with GaBi, resulting in 336 gCO2/kWh ([72] p. 93) and an average efficiency of 31%. The chassis is the main contributor of the vehicle glider, with approximately one third of the energy demand. Figure 7 shows the total cradle-to-gate primary energy demand for each vehicle concept divided into components. The strong increase in energy demand by a factor of 5 to 7 of the BEV compared to ICEV is mainly due to the lithium-ion battery, accounting for 84–89% of the total energy.
The global warming potential with a timescope of 100 years is determined following the recommendations of the International Reference Life Cycle Data System (ILCD) and obtained directly from GaBi [73]. Thus, the results represent the midpoint (i.e., emissions released into the atmosphere) level and therefore do not directly indicate specific damage caused to the environment or human health, which would be the case for endpoint level. As Figure 8 shows, GWP develops analogously to primary energy demand. However, the increase caused by the lithium-ion battery by a factor of 4 to 5 is lower compared to the primary energy demand.
The results show that regardless of the component, the electricity consumption during production is the main contributor to primary energy demand. In the case of the lithium-ion battery, 85% of the GWP is due to electricity consumption. Under the Kyoto Protocol, these emissions are categorized as scope 2 [74]. Scope 1 emissions, or direct air emissions, are of minor influence with regard to GWP.
5. Discussion and Conclusions
In order to perform an environmental impact assessment in the early concept development phase, it is necessary to estimate material composition and primary energy demand. While use phase or tank-to-wheel emissions are adequately represented by longitudinal dynamic simulations, there is a lack of data regarding the preceding processes. The presented life-cycle inventory provides generic mass compositions and primary energy demands for the assembly and manufacturing steps of a European heavy-duty tractor. The inventory is scalable and component based, so that different vehicle and powertrain concepts can be modeled. An OEM can apply the life-cycle inventory in the early concept phase to assess different vehicle concepts and powertrain configurations by scaling the components provided in the LCI. This way, vehicle KPIs such as maximum torque or battery capacity can easily be altered to optimize the concept vehicle. If the user has detailed information on particular materials, processes or components, for example, from an existing LCA model, those data can complement the generic LCI.
To set the GWP into context, we estimate the use-phase for an ICE and a BEV: On average, an European diesel trucks emits 850 tCO2 to 1161 tCO2 during their use-phase (tank-to-wheel) [6,75]. Assuming a consumption of kWh/km for the BEV and the European energy mix, the BEV emits 448 tCO2 to 700 tCO2 (well-to-wheel)—approximately half of the diesel truck—in the same time. This means that the battery production alone amounts to 13% to 30% of the well-to-wheel emissions, which highlights the importance of the battery production. Lithium-ion batteries in particular must be considered as critical components, rendering the other components almost obsolete regarding environmental impact. If the efficiency of the electricity production is neglected, the net process energy of the battery pack amounts to 470 kWh/kWhcapacity. Emilsson and Dahllhöf [34] estimate the net process energy with 313 kWh/kWhcapacity. On the one hand, this deviation of 50 % can be explained with different background datasets. On the other hand, Emilsson and Dahllhöf point out that older results from their 2017 report estimated process heat and electricity for cell production on pack level approximately 30% to 60% higher. We assume that these older results are more comparable to the ecoinvent V3.3 dataset from the same year.
However, the energy use and emissions from the production of automotive traction batteries decreased in recent years and further optimization is expected [11]. Furthermore, the high electricity consumption highlights the importance of renewable energy sources in order to reduce scope 2 emissions during component production, especially lithium-ion batteries. The percentage of renewable energy sources varies significantly from country to country, which means that cradle-to-grave assessments must consider varying amounts of electricity consumption for the manufacturing and use phase [76].
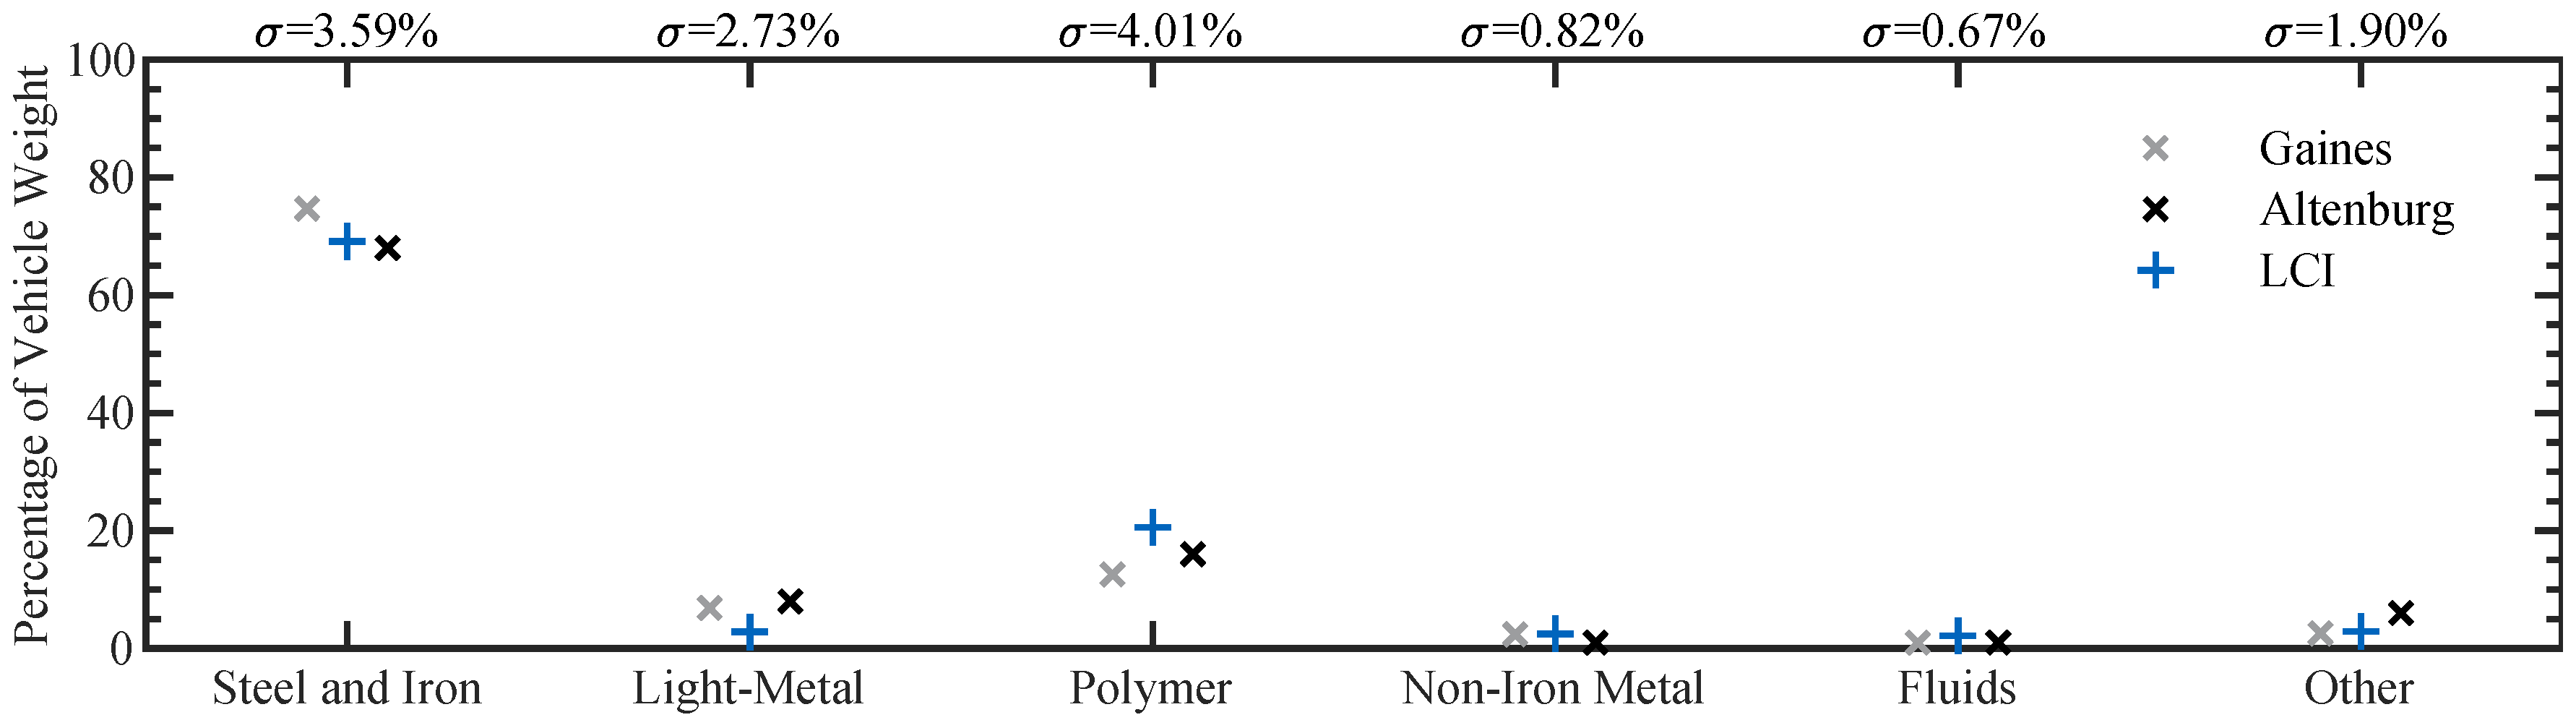
Due to the lack of primary data, secondary data and expert verification had to be used. Thus, the valid range of the life-cycle inventory must be regarded critically. The results might not be applicable to vehicle concepts that strongly deviate from the N3 tractor that is used. Smaller tractors that are, for example, common in Japan, and rigid trucks that are often used in Europe, cannot be represented with this inventory. To verify the model, we compared the results to published data at the vehicle level. The percentage of vehicle weight of the studies by Gaines et al. [41] and Altenburg et al. [77] and the standard deviation of the two and the presented study are shown in Figure 9. Since the studies have different categorizations of materials, we adapted all results to match the categories with the smallest divisions.
The relatively high deviations in steel, iron and polymer of the presented LCI compared to Gaines et al. can be explained by the different geographical locations: Gaines et al. examined US class 8 trucks. The tighter weight restrictions of approximately 36 t GVW (80,000 lbs) in the US [78] might have led to a greater use of lightweight design and materials (light-metal) than in Europe. Adapted to the categorization of Altenburg et al. [77], the presented model shows good agreement with an absolute deviation of less than 5% for all categories. However, the production’s global warming potential of 43 estimated by Altenburg et al. is 41% higher compared to our results. On the one hand, this could be attributed of the higher amount of aluminum and consequently greater energy consumption. On the other hand, the background database used for our results is most likely different from the one used by Altenburg et al. Furthermore, Altenburg et al. might have detailed information about the manufacturing processes, allowing for more precise modeling.
Given our generic approach in order to represent a variety of vehicle and powertrain concepts, the comparison with existing data shows a sufficient agreement to apply the LCI to the early concept phase. Because this contribution adds detailed information on component level to previous studies, the purpose of assessing environmental impact during concept development is sufficiently fulfilled. Nevertheless, additional data from primary data sources—especially truck OEMs—could further increase the data quality and the reliability of the results.
The presented life-cycle inventory and results extend the knowledge necessary for evaluating new, emerging powertrain technologies. Further studies could advance the presented approach by combining environmental impact with economic or social perspectives and including fuel-cell powered vehicles. These studies should include further impact categories such as emissions to water and air. Only the combined consideration of the three dimensions of sustainability will make an efficient transition to green freight transport possible.
6. Data Accessibility
The data on the component level and the presented results are provided as Supplementary Information. In addition to the Excel sheets, the LCI data and material mix are included in the LOTUS simulation model and are available in Github as open-source Matlab code [61].
Supplementary Materials
The following are available online at https://www.mdpi.com/2071-1050/12/13/5396/s1. Tables S1: Life-cycle inventory for components and presented results.
Author Contributions
Conceptualization, S.W.; methodology, S.W.; software, M.S., K.G. and S.Á.; validation, S.W., M.S., K.G. and S.Á.; formal analysis, S.W., M.S., K.G., S.Á. and S.K.; investigation, S.W., M.S., K.G., S.Á. and S.K.; resources, S.W. and M.L.; data curation, S.W., M.S., K.G. and S.Á.; writing—original draft preparation, S.W.; writing—review and editing, S.W., M.S., K.G., S.K., S.Á. and M.L.; visualization, S.W.; supervision, S.W. and M.L.; project administration, S.W. and M.L.; funding acquisition, M.L. All authors have read and agreed to the published version of the manuscript.
Funding
The research was conducted with basic research funds from the Institute of Automotive Technology, Technical University of Munich.
Conflicts of Interest
The authors declare no conflict of interest.
Abbreviations
The following abbreviations are used in this manuscript:
| ASM | Asynchronous Machine |
| BEV | Battery Electric Vehicle(s) |
| GHG | Greenhouse Gas |
| GREET | Greenhouse Gases, Regulated Emissions, and Energy Use in Transportation |
| GVW | Gross Vehicle Weight |
| GWP | Global Warming Potential |
| HDV | Heavy-Duty Vehicle(s) |
| (P)HEV | (Plug-In) Hybrid Electric Vehicle(s) |
| ICE(V) | Inter Combustion Engine (Vehicle[s]) |
| ILCD | International Reference Life Cycle Data System |
| LCA | Life-Cycle Assessment |
| LCI | Life-Cycle Inventory |
| OEM | Original Equipment Manufacturer(s) |
| PSM | Permanent Synchronous Machine |
Appendix A. Detailed Inventory Data of the Glider Components

Table A1.
Inventory data for the production and assembly of the frame (European tractor). Total mass is based on the model by Fries et al. [54,58,59]. Components are adapted and scaled based on GREET V2.7 [26] and Hawkins [44] and verified by an expert interview [63].
| Category | Frame | Unit | Value | Source |
|---|---|---|---|---|
| Total Mass | kg | 854 | [54,58] | |
| Components | Frame | kg | 366 | [26] |
| Weld Blanks, Fasteners | kg | 268.4 | [26] | |
| Saddle Clutch | kg | 219.6 | [26] | |
| Materials | Steel | kg | 719.8 | [26,44] |
| Aluminum | kg | 134.2 | [26,44] | |
| Additional Data | Surface Area | m | 16 | [63] |
| Welding Distance | m | 1.5 | [63] |
Table A2.
Inventory data for the production and assembly of a standard sleeper cab for long-haul transportation. Total mass is based on the model by Fries et al. [54,58,59]. Components are adapted and scaled based on Hawkins [44] and verified by an expert interview [63]. The amount of energy results from Hawkins [44].
| Category | Cab | Unit | Value | Source |
|---|---|---|---|---|
| Total Mass | kg | 1386.68 | [54,58] | |
| Materials | Steel Mass | kg | 609.84 | [44] |
| Rubber Mass | kg | 11.25 | [44] | |
| Aluminum Mass | kg | 18.09 | [44] | |
| Thermoset Mass | kg | 212.37 | [44,63] | |
| Thermoplastic Mass | kg | 257.15 | [44,63] | |
| Copper Mass | kg | 30.29 | [44] | |
| Magnesium Mass | kg | 0.96 | [44] | |
| Zinc Mass | kg | 0.4 | [44] | |
| Organic Materials Mass | kg | 39.82 | [44] | |
| Other Mass | kg | 0.56 | [44] | |
| Glass Mass | kg | 159.07 | [44] | |
| Paint Mass | kg | 46.86 | [44] | |
| Energy Interior | Assembly | kWh | 18.55 | [44] |
| Heat | MJ | 173.07 | [44] | |
| Energy Exterior | Assembly | kWh | 806.64 | [44] |
| Heat | MJ | 1884.65 | [44] | |
| Total Energy | Assembly | kWh | 825.19 | [44] |
| Heat | MJ | 2057.72 | [44] | |
| Additional Data | Water | m | 27.52 | [44] |
| Oxygen | kg | 0.11 | [44] | |
| Acetylene | kg | 0.01 | [44] | |
| Nitrogen | kg | 0.22 | [44] | |
| Carbon dioxide | kg | 0.47 | [44] | |
| Natural gas | kg | 3.28 | [44] |
Table A3.
Inventory data for the production and assembly of the chassis including suspension and steering system. Total mass is based on the model by Fries et al. [54,58,59]. Components are adapted and scaled based on GREET V2.7 [26] and verified by an expert interview [63]. The amount of energy results from Hawkins [44].
| Category | Suspension | Unit | Value | Source |
|---|---|---|---|---|
| Total Mass | kg | 1600 | [54,58] | |
| Components | Rear Axle | kg | 750 | [26,63] |
| Front Axle | kg | 500 | [26,63] | |
| Steering System | kg | 100 | [26,63] | |
| Suspension Front | kg | 100 | [26,63] | |
| Suspension Rear | kg | 150 | [26,63] | |
| Materials | Steel Mass | kg | 1150 | [26,63] |
| Iron Mass | kg | 400 | [26,63] | |
| Rubber Mass | kg | 50 | [26,63] | |
| Energy | Steel | kWh | 545 | [56] |
| Iron milling | kWh | 59.2 | [56] |
Including brakes, differential, driveshaft and housing; including brakes.
Table A4.
Inventory data for the production and assembly of the tires (315/70R22.5) and wheels (22.5 inch). Total mass is based on the model by Fries et al. [54,58,59]. Components are adapted and scaled based on Hawkins [44] and verified by an expert interview [63]. The amount of energy results from Hawkins [44].
| Category | Tires & Wheels | Unit | Value | Source |
|---|---|---|---|---|
| Total Mass | kg | 658.8 | [54,58] | |
| Materials | Low-alloyed Steel Mass | kg | 331.21 | [26,44] |
| Chromium Steel Mass | kg | 108.1 | [26,44] | |
| Rubber Mass | kg | 109.74 | [26,44] | |
| Acrylonitrile Mass | kg | 109.74 | [26,44] | |
| Energy | Assembly | kWh | 279.3 | [44] |
| Heat | kWh | 1145 | [44] | |
| Additional Data | Compressed Air 6 bar | m | 69.82 | [44] |
| Compressed Air 12 bar | m | 125.7 | [44] | |
| Oxygen | kg | 0.08 | [44] | |
| Acetylene | kg | 0.014 | [44] | |
| Carbon dioxide | kg | 1.718 | [44] | |
| Natural gas | kWh | 3.98 | [44] | |
| Water | m | 13.5 | [44] |
Table A5.
Inventory data for the other components of the vehicle glider. Total mass is the result of the components which were adapted from GREET V2.7 [26] and Hawkins [44]. The amount of fluid is in compliance with technical recommendations of a manufacturer of lubricants [65]. The total mass is the result of the components mass.
| Category | Others | Unit | Value | Source |
|---|---|---|---|---|
| Total | kg | 825.6 | ||
| Components | Powertrain Thermal | kg | 261.6 | [26] |
| Powertrain Electrical | kg | 108.6 | [26] | |
| Emission Control Electronics | kg | 108.6 | [26] | |
| Exterior electrical | kg | 108.6 | [26] | |
| Rear Underride Guard | kg | 130 | [26] | |
| Tool Kit | kg | 25 | [26] | |
| Material | Transmission Oil | kg | 10.3 | [65] |
| Differential Oil | kg | 12.6 | [65] | |
| Steering Oil | kg | 6.0 | [65] | |
| Ethylene Glycol (Coolant) | kg | 54.3 | [65] | |
| Steel | kg | 285.78 | [26] | |
| Plastic | kg | 323.0 | [26] | |
| Primary Copper | kg | 113.5 | [26,44] | |
| Secondary Copper | kg | 20.0 | [26,44] |
Appendix B. List of Materials
Table A6.
List of materials included in the life-cycle Inventory.
| Category | Material |
|---|---|
| Metal | Steel |
| Iron | |
| Aluminum | |
| Copper | |
| Platinium | |
| Magnesium | |
| Zinc | |
| Boron | |
| Nickel | |
| Non-metal | Ceramic |
| Glass | |
| Organic | |
| Other | |
| Paint | |
| Fiberglass | |
| Graphite | |
| Electrolyte | |
| NMC111 powder | |
| Blinder | |
| Insulation | |
| Plastic | Rubber |
| Duroplast | |
| Thermoplast | |
| Impregnation Resin | |
| Silicon | |
| Fluid | Diesel |
| Lubricating Oil | |
| Cooling | |
| Rare Earth Metal | Neodynium |
| Other | Electronic Parts |
References
- European Commission. Paris Agreement—Climate Action; European Commission: Paris, France, 2019. [Google Scholar]
- European Environment Agency. Greenhouse Gas Emissions from Transport in Europe; European Environment Agency: Copenhagen, Denmark, 2019. [Google Scholar]
- Schubert, M. Verkehrsverflechtungsprognose 2030. Zusammenfassung der Ergebnisse. 2014, 11, 2014. [Google Scholar]
- Shell Nutzfahrzeug-Studie: Diesel oder Alternative Antriebe—Womit Fahren LKW und Bus Morgen? Shell: Hamburg, Germany, 2016.
- Röhling. Gleitende Mittelfristprognose für den Güter- und Personenverkehr: Mittelfristprognose Winter 2015/2016; Transport Consulting International Röhling: Waldkirch, Germany, 2016. [Google Scholar]
- ACEA. CO2 Emissions from Heavy—Duty Vehicles: Preliminary CO2 Baseline (Q3–Q4 2019) Estimate; ACEA: Brussels, Belgium, 2020. [Google Scholar]
- International Energy Agency. The Future of Trucks; IEA: Paris, France, 2017. [Google Scholar] [CrossRef]
- European Comission Mobility and Transport. Regulation of the European Parliament and of the Council Setting CO2 Emission Performance Standards for New Heavy-Duty Vehicles; European Commission Mobility and Transport: Brussels, Belgium, 2018. [Google Scholar]
- VDA. CO2 Regulation of Passenger Cars and Light Commercial Vehicles in Europe; Verband der Automobilindustrie (VDA): Berlin, Germany, 2018. [Google Scholar]
- Romare, M.; Dahllf, L. The Life Cycle Energy Consumption and Greenhouse Gas Emissions from Lithium-Ion Batteries. Stockholm. Zugriff am 2017, 2017, 23. [Google Scholar]
- Philippot, M.; Alvarez, G.; Ayerbe, E.; van Mierlo, J.; Messagie, M. Eco-Efficiency of a Lithium-Ion Battery for Electric Vehicles: Influence of Manufacturing Country and Commodity Prices on GHG Emissions and Costs. Batteries 2019, 5, 23. [Google Scholar] [CrossRef] [Green Version]
- Dai, Q.; Kelly, J.C.; Gaines, L.; Wang, M. Life Cycle Analysis of Lithium-Ion Batteries for Automotive Applications. Batteries 2019, 5, 48. [Google Scholar] [CrossRef] [Green Version]
- Tesla Press Information. Available online: https://www.tesla.com/presskit (accessed on 30 June 2020).
- Haken, K.L. Grundlagen der Kraftfahrzeugtechnik: Mit 36 Tabellen; 2., Akualisierte Und erw. Aufl. ed.; Fahrzeugtechnik, Hanser: München, Germany, 2011. [Google Scholar] [CrossRef]
- Hoepke, E.; Appel, W.; Brähler, H.; Dahlhaus, U. Nutzfahrzeugtechnik; ATZ/MTZ-Fachbuch; Springer Fachmedien: Wiesbaden, Germany, 2010. [Google Scholar]
- European Parliament. Directive (EU) 2015/ 719 of the European Parliament and of the Council—of 29 April 2015—Amending Council Directive 96/53/EC Laying down for Certain Road Vehicles Circulating within the Community the Maximum Authorised Dimensions in National and International Traffic and the Maximum Authorised Weights in International Traffic: Directive (EU) 2015/719; European Parliament: Strasbourg, France, 2015. [Google Scholar]
- European Comission (Ed.) Questions and Answers on the Commission Strategy for Reducing Heavy-Duty Vehicles’ (HDVs) Fuel Consumption and CO2 Emissions; European Comission: Brussels, Belgium, 2014. [Google Scholar]
- Moultak, M.; Lutsey, N.; Hall, D. Transitioning to Zero-Emission Heavy-Duty Freight Vehicles; The International Council on Clean Transportation: Washington, DC, USA, 2017. [Google Scholar]
- Fries, M.; Kruttschnitt, M.; Lienkamp, M. Multi-objective optimization of a long-haul truck hybrid operational strategy and a predictive powertrain control system. In Proceedings of the Twelfth International Conference on Ecological Vehicles and Renewable Energies (EVER), Monte Carlo, Monaco, 11–13 April 2017; pp. 1–7. [Google Scholar] [CrossRef]
- Wolff, S.; Fries, M.; Lienkamp, M. Technoecological analysis of energy carriers for long–haul transportation. J. Ind. Ecol. 2019, 49, 6402. [Google Scholar] [CrossRef]
- Hoffmann, J. In den letzten Zügen. Eurotransport 2018, 8, 12–14. [Google Scholar]
- Robert Bosch GmbH. Electronic Automotive Handbook; Bentley Publishers: Cambridge, MA, USA, 2004. [Google Scholar]
- Heißing, B.; Ersoy, M.; Gies, S. Fahrwerkhandbuch; Springer Fachmedien Wiesbaden: Wiesbaden, Germany, 2013. [Google Scholar] [CrossRef]
- Naunheimer, H.; Bertsche, B.; Lechner, G.; Ryborz, J. Fahrzeuggetriebe: Grundlagen, Auswahl, Auslegung und Konstruktion; 2., Bearb. und erw. Aufl. ed.; Springer: Berlin/Heidelberg, Germany, 2007. [Google Scholar] [CrossRef]
- MAN. Grundlagen der Nutzfahrzeugtechnik: Basiswissen Lkw und Bus; MAN: Munich, Germany, 2007.
- Burnham, A.; Wang, M.Q.; Wu, Y. Development and Applications of GREET 2.7—The Transportation Vehicle-CycleModel; Argonne National Lab: Oak Ridge, TN, USA, 2006. [Google Scholar] [CrossRef] [Green Version]
- Duoba, M.; Lohse-Busch, H. Advanced Vehicle Performance Assessment. In Advanced Hybrid and Electric Vehicles; Nikowitz, M., Ed.; Lecture Notes in Mobility; Springer International Publishing: Cham, Switzerland, 2016; pp. 65–85. [Google Scholar]
- Reif, K.; Noreikat, K.E.; Borgeest, K. Kraftfahrzeug-Hybridantriebe: Grundlagen, Komponenten, Systeme, Anwendungen; ATZ/MTZ-Fachbuch, Vieweg+Teubner Verlag: Wiesbaden, Germany, 2012. [Google Scholar] [CrossRef]
- Nikowitz, M.; Boyd, S.; Vezzini, A.; Kunz, I.; Duoba, M.; Gallagher, K.; Drage, P.; Simic, D.; Timofeeva, E.; Singh, D.; et al. System Optimization and Vehicle Integration. In Advanced Hybrid and Electric Vehicles; Nikowitz, M., Ed.; Lecture Notes in Mobility; Springer International Publishing: Cham, Switzerland, 2016. [Google Scholar]
- Gao, Z.; LaClair, T.J.; Smith, D.E.; Daw, C.S. Exploring Fuel-Saving Potential of Long-Haul Truck Hybridization. Transp. Res. Rec. J. Transp. Res. Board 2015, 2502, 99–107. [Google Scholar] [CrossRef]
- Gao, Z.; Finney, C.; Daw, C.; LaClair, T.J.; Smith, D. Comparative Study of Hybrid Powertrains on Fuel Saving, Emissions, and Component Energy Loss in HD Trucks. SAE Int. J. Commer. Veh. 2014, 7, 414–431. [Google Scholar] [CrossRef]
- Nordelöf, A.; Grunditz, E.; Tillman, A.M.; Thiringer, T.; Alatalo, M. A scalable life cycle inventory of an electrical automotive traction machine—Part I: Design and composition. Int. J. Life Cycle Assess. 2018, 23, 55–69. [Google Scholar] [CrossRef] [Green Version]
- Cano, Z.P.; Banham, D.; Ye, S.; Hintennach, A.; Lu, J.; Fowler, M.; Chen, Z. Batteries and fuel cells for emerging electric vehicle markets. Nat. Energy 2018, 3, 279–289. [Google Scholar] [CrossRef]
- Emilsson, E.; Dahllöf, L. Lithium-Ion Vehicle Battery Production; IVL Swedish Environmental Research Institute: Stockholm, Sweden, 2019. [Google Scholar]
- Berg, E.J.; Villevieille, C.; Streich, D.; Trabesinger, S.; Novák, P. Rechargeable Batteries: Grasping for the Limits of Chemistry. J. Electrochem. Soc. 2015, 162, A2468–A2475. [Google Scholar] [CrossRef]
- Miller, B.P. Automotive Lithium-Ion Batteries. Johns. Matthey Technol. Rev. 2015, 59, 4–13. [Google Scholar] [CrossRef]
- Fries, M.; Kerler, M.; Rohr, S.; Schickram, S.; Sinning, M.; Lienkamp, M. An Overview of Costs for Vehicle Components, Fuels, Greenhouse Gas Emissions and Total Cost of Ownership Update 2017. Res. Gate 2017. [Google Scholar] [CrossRef]
- Wentker, M.; Greenwood, M.; Leker, J. A Bottom-Up Approach to Lithium-Ion Battery Cost Modeling with a Focus on Cathode Active Materials. Energies 2019, 12, 504. [Google Scholar] [CrossRef] [Green Version]
- Göpfert, I.; Braun, D.; Schulz, M. Automobillogistik; Springer Fachmedien Wiesbaden: Wiesbaden, Germany, 2017. [Google Scholar] [CrossRef]
- Stocker, J.; Schmidt, M.; Kreimeyer, M.; Lienkamp, M. Development of Market-Oriented Architectural Standards by Means of Standardized Vehicle Layouts; Technical University of Munich: Munich, Germany, 2016. [Google Scholar]
- Gaines, L.; StodoIsky, F.; Cuenca, R. Lifecycle-analysis for heavy vehicles. In Proceedings of the 91st Air and Waste Management Association Meeting and Exhibition, San Diego, CA, USA, 14–18 June 1998. [Google Scholar]
- Rupp, M.; Schulze, S.; Kuperjans, I. Comparative Life Cycle Analysis of Conventional and Hybrid Heavy-Duty Trucks. World Electr. Veh. J. 2018, 9, 33. [Google Scholar] [CrossRef] [Green Version]
- Sen, B.; Ercan, T.; Tatari, O. Does a battery-electric truck make a difference? - Life cycle emissions, costs, and externality analysis of alternative fuel-powered Class 8 heavy-duty trucks in the United States. J. Clean. Prod. 2017, 141, 110–121. [Google Scholar] [CrossRef]
- Hawkins, T.R.; Singh, B.; Majeau-Bettez, G.; Strømman, A.H. Comparative environmental life cycle assessment of conventional and electric vehicles. J. Ind. Ecol. 2013, 17, 53–64. [Google Scholar] [CrossRef]
- Leuenberger, M.; Frischknecht, R. Life Cycle Assessment of Battery Electric Vehicles and Concept Cars; ESU-Services Ltd.: Uster, Switzerland, 2010. [Google Scholar]
- Ma, H.; Balthasar, F.; Tait, N.; Riera-Palou, X.; Harrison, A. A new comparison between the life cycle greenhouse gas emissions of battery electric vehicles and internal combustion vehicles. Energy Policy 2012, 44, 160–173. [Google Scholar] [CrossRef]
- Boureima, F.S.; Messagie, M.; Matheys, J.; Wynen, V.; Sergeant, N.; van Mierlo, J.; de Vos, M.; de Caevel, B. Comparative LCA of electric, hybrid, LPG and gasoline cars in Belgian context. World Electr. Veh. J. 2009, 3, 469–476. [Google Scholar] [CrossRef] [Green Version]
- Li, T.; Liu, Z.C.; Zhang, H.C.; Jiang, Q.H. Environmental emissions and energy consumptions assessment of a diesel engine from the life cycle perspective. J. Clean. Prod. 2013, 53, 7–12. [Google Scholar] [CrossRef]
- Zhou, B.; Wu, Y.; Zhou, B.; Wang, R.; Ke, W.; Zhang, S.; Hao, J. Real-world performance of battery electric buses and their life-cycle benefits with respect to energy consumption and carbon dioxide emissions. Energy 2016, 96, 603–613. [Google Scholar] [CrossRef]
- Wang, M.; Elgowainy, A.; Lee, U.; Benavides, P.; Burnham, A.; Cai, H.; Dai, Q.; Hawkins, T.; Kelly, J.; Kwon, H.; et al. Summary of Expansions and Updates in GREET 2019; Argonne National Lab: Argonne, IL, USA, 2019.
- Frischknecht, R.; Jungbluth, N.; Althaus, H.J.; Doka, G.; Dones, R.; Heck, T.; Hellweg, S.; Hischier, R.; Nemecek, T.; Rebitzer, G.; et al. The ecoinvent Database: Overview and Methodological Framework (7 pp). Int. J. Life Cycle Assess. 2005, 10, 3–9. [Google Scholar] [CrossRef]
- Rexeis, M.; Quaritsch, M.; Hausberger, S.; Silberholz, G.; Kies, A.; Steven, H.; Goschütz, M.; Vermeulen, R. VECTO Tool Development: Completion of Methodology to Simulate Heavy Duty Vehicles’ Fuel Consumption and CO2 Emissions: Upgrades to the Existing Version of VECTO and Completion of Certification Methodology to be Incorporated into a Commission Legislative Proposal; Graz University of Technology: Graz, Austria, 2017. [Google Scholar]
- Hauschild, M.Z.; Rosenbaum, R.K.; Olsen, S.I. Life Cycle Assessment; Springer International Publishing: Cham, Switzerland, 2018. [Google Scholar] [CrossRef]
- Fries, M.; Lehmeyer, M.; Lienkamp, M. Multi-criterion optimization of heavy-duty powertrain design for the evaluation of transport efficiency and costs. In Proceedings of the IEEE ITSC 2017, Yokohama, Japan, 16–19 October 2017; IEEE: Piscataway, NJ, USA, 2017; pp. 1–8. [Google Scholar] [CrossRef]
- Wernet, G.; Bauer, C.; Steubing, B.; Reinhard, J.; Moreno-Ruiz, E.; Weidema, B. The ecoinvent database version 3 (part I): Overview and methodology. Int. J. Life Cycle Assess. 2016, 21, 1218–1230. [Google Scholar] [CrossRef]
- thinkstep AG. Professional Database 2017; thinkstep AG: Stuttgart, Germany, 2017. [Google Scholar]
- thinkstep AG. GaBi; thinkstep AG: Stuttgart, Germany, 2017. [Google Scholar]
- Fries, M.; Wolff, S.; Lienkamp, M. Optimization of Hybrid Electric Drive System Components in Long-Haul Vehicles for Evaluation of Transport Efficiency and TCO. In Proceedings of the 2017 IEEE 12th International Conference on Power Electronics and Drive Systems (PEDS), Honolulu, HI, USA, 12–15 December 2017; IEEE: Piscataway, NJ, USA, 2017; pp. 1141–1146. [Google Scholar] [CrossRef]
- Fries, M. Maschinelle Optimierung der Antriebsauslegung zur Reduktion von CO2-Emissionen und Kosten im Nutzfahrzeug. Ph.D. Thesis, Technical University of Munich: Munich, Germany, 2018. [Google Scholar]
- Steiner, R.; Frischknecht, R. Metals Processing and Compressed Air Supply: Ecoinvent Report No. 23; ESU-services Ltd.: Uster, Switzerland, 2007. [Google Scholar]
- Wolff, S. LOTUS-Long-Haul Truck Simulation: Longitudinal Dynamic Simulation for Heavy Duty Vehicles; Technical University of Munich: Munich, Germany, 2019. [Google Scholar] [CrossRef]
- Fries, M.; Sinning, M.; Lienkamp, M. Virtual Combination of Commercial Vehicle Modules (Virtual Truck) for characterization of future Concepts. In Proceedings of the Conference on Future Automotive Technology, Fürstenfeldbruck, Germany, 28–29 April 2015. [Google Scholar]
- Wolff, S.; (Technical University of Munich, Munich, Germany); Anonymous; (Former Leading Management Position in R & D and Procurement at MAN SE, Munich, Germany). Material Composition of MAN Trucks. Personal communication, March 2019. [Google Scholar]
- MAN. MAN Wartungs und Betriebsstoffvorschrift 2018; MAN Truck & Bus SE: Munich, Germany, 2018. [Google Scholar]
- Kroon-Oil. MAN TGX Euro 6 TGX 18.440 (4x2) EGR SCR Euro 6 (2012 and after). Available online: https://www.kroon-oil.com/de/produktberatung/lkw-und-omnibusse-75t/man/tgx-euro-5/tgx-18440-4x2-scr-euro-5-eev/46461/387941/#!/component:387941/ (accessed on 18 January 2020).
- Gordon, K.; Alvarez, S. Energy Required for Truck Assembly. E-Mail 2019, unpublished. [Google Scholar]
- MAN. Corporate Responsibility bei MAN; MAN SE Corporate Responsibility: Munich, Germany, 2017. [Google Scholar]
- Mährle, C.; Härtl, M.; Wachtmeister, G.; Fries, M.; Sinning, M.; Lienkamp, M.; Wilden, W.; Frenkler, F.; Gänßbauer, B.; Bick, W. Bayerische Kooperation für Transporteffizienz - Truck2030: Status Report 2016; Technical University of Munich: Munich, Germany, 2017. [Google Scholar] [CrossRef]
- Verbruggen, F.; Rangarajan, V.; Hofman, T. Powertrain design optimization for a battery electric heavy-duty truck. In Proceedings of the 2019 American Control Conference (ACC), Philadelphia, PA, USA, 10–12 July 2019; IEEE: Piscataway, NJ, USA, 2019; pp. 1488–1493. [Google Scholar] [CrossRef]
- IPCC. Global Warming of 1.5 °C; Intergovernmental Panel on Climate Change: Geneva, Switzerland, 2018. [Google Scholar]
- International Energy Agency. Global Energy and CO2 Status Report 2018; International Energy Agency: Paris, France, 2019. [Google Scholar]
- European Comission DG Energy. EU Energy in Figures: Statistical Pocketbook 2019; Publications Office of the European Union: Luxembourg, 2019. [Google Scholar]
- European Commission, Joint Research Center. International Reference Life Cycle Data System (ILCD) Handbook: General Guide for Life Cycle Assessment: Provisions and Action Steps, 1st ed.; EUR, Scientific and Technical Research Series; Publications Office: Luxembourg, Germany, 2011; Volume 24571. [Google Scholar]
- Ranganathan, J.; Daviet, F. The Greenhouse Gas Protocol: The GHG Protocol for Project Accounting; World Business Council for Sustainable Development and World Resources Institute: Geneva, Switzerland, 2005. [Google Scholar] [CrossRef]
- Meszler, D.; Delgado, O.; Rodríguez, F.; Muncrief, R. European Heavy Duty Vehicles: Cost-Effectiveness of Fuel-Efficiency Technologies for Long-Haul Tractor-Trailers in the 2025–2030 Timeframe; International Council on Clean Transportation: Washington, DC, USA, 2018. [Google Scholar]
- Tranberg, B.; Corradi, O.; Lajoie, B.; Gibon, T.; Staffell, I.; Andresen, G.B. Real-time carbon accounting method for the European electricity markets. Energy Strategy Rev. 2019, 26, 100367. [Google Scholar] [CrossRef]
- Altenburg, S.; an der Mauer, A.; Labinsky, A.; Eckert, S.; Faltenbacher, M.; Reuter, B. Nullemissionsnutzfahrzeuge: Vom ökologischen Hoffnungsträger zur ökonomischen Alternative; e-mobil BW GmbH: Stuttgart, Germany, 2017. [Google Scholar]
- Federal Highway Administration. Compilation of Existing State Truck Size and Weight Limit Law—Appendix A: State Truck Size and Weight Laws—FHWA Freight Management and Operations; United States Department of Transportation: Washington, DC, USA, 2019.
Figure 1.
Package of an exemplary European heavy-duty vehicle with a hybrid powertrain. ![Sustainability 12 05396 i001]() Glider including drivetrain,
Glider including drivetrain, ![Sustainability 12 05396 i002]() conventional powertrain, tank and exhaust system,
conventional powertrain, tank and exhaust system, ![Sustainability 12 05396 i003]() electrical components. For better visibility, the cabin is not shown.
electrical components. For better visibility, the cabin is not shown.
 Glider including drivetrain,
  conventional powertrain, tank and exhaust system,
  electrical components. For better visibility, the cabin is not shown.
Figure 1.
Package of an exemplary European heavy-duty vehicle with a hybrid powertrain. ![Sustainability 12 05396 i001]() Glider including drivetrain,
Glider including drivetrain, ![Sustainability 12 05396 i002]() conventional powertrain, tank and exhaust system,
conventional powertrain, tank and exhaust system, ![Sustainability 12 05396 i003]() electrical components. For better visibility, the cabin is not shown.
electrical components. For better visibility, the cabin is not shown.
Glider including drivetrain, conventional powertrain, tank and exhaust system, electrical components. For better visibility, the cabin is not shown.
Figure 2.
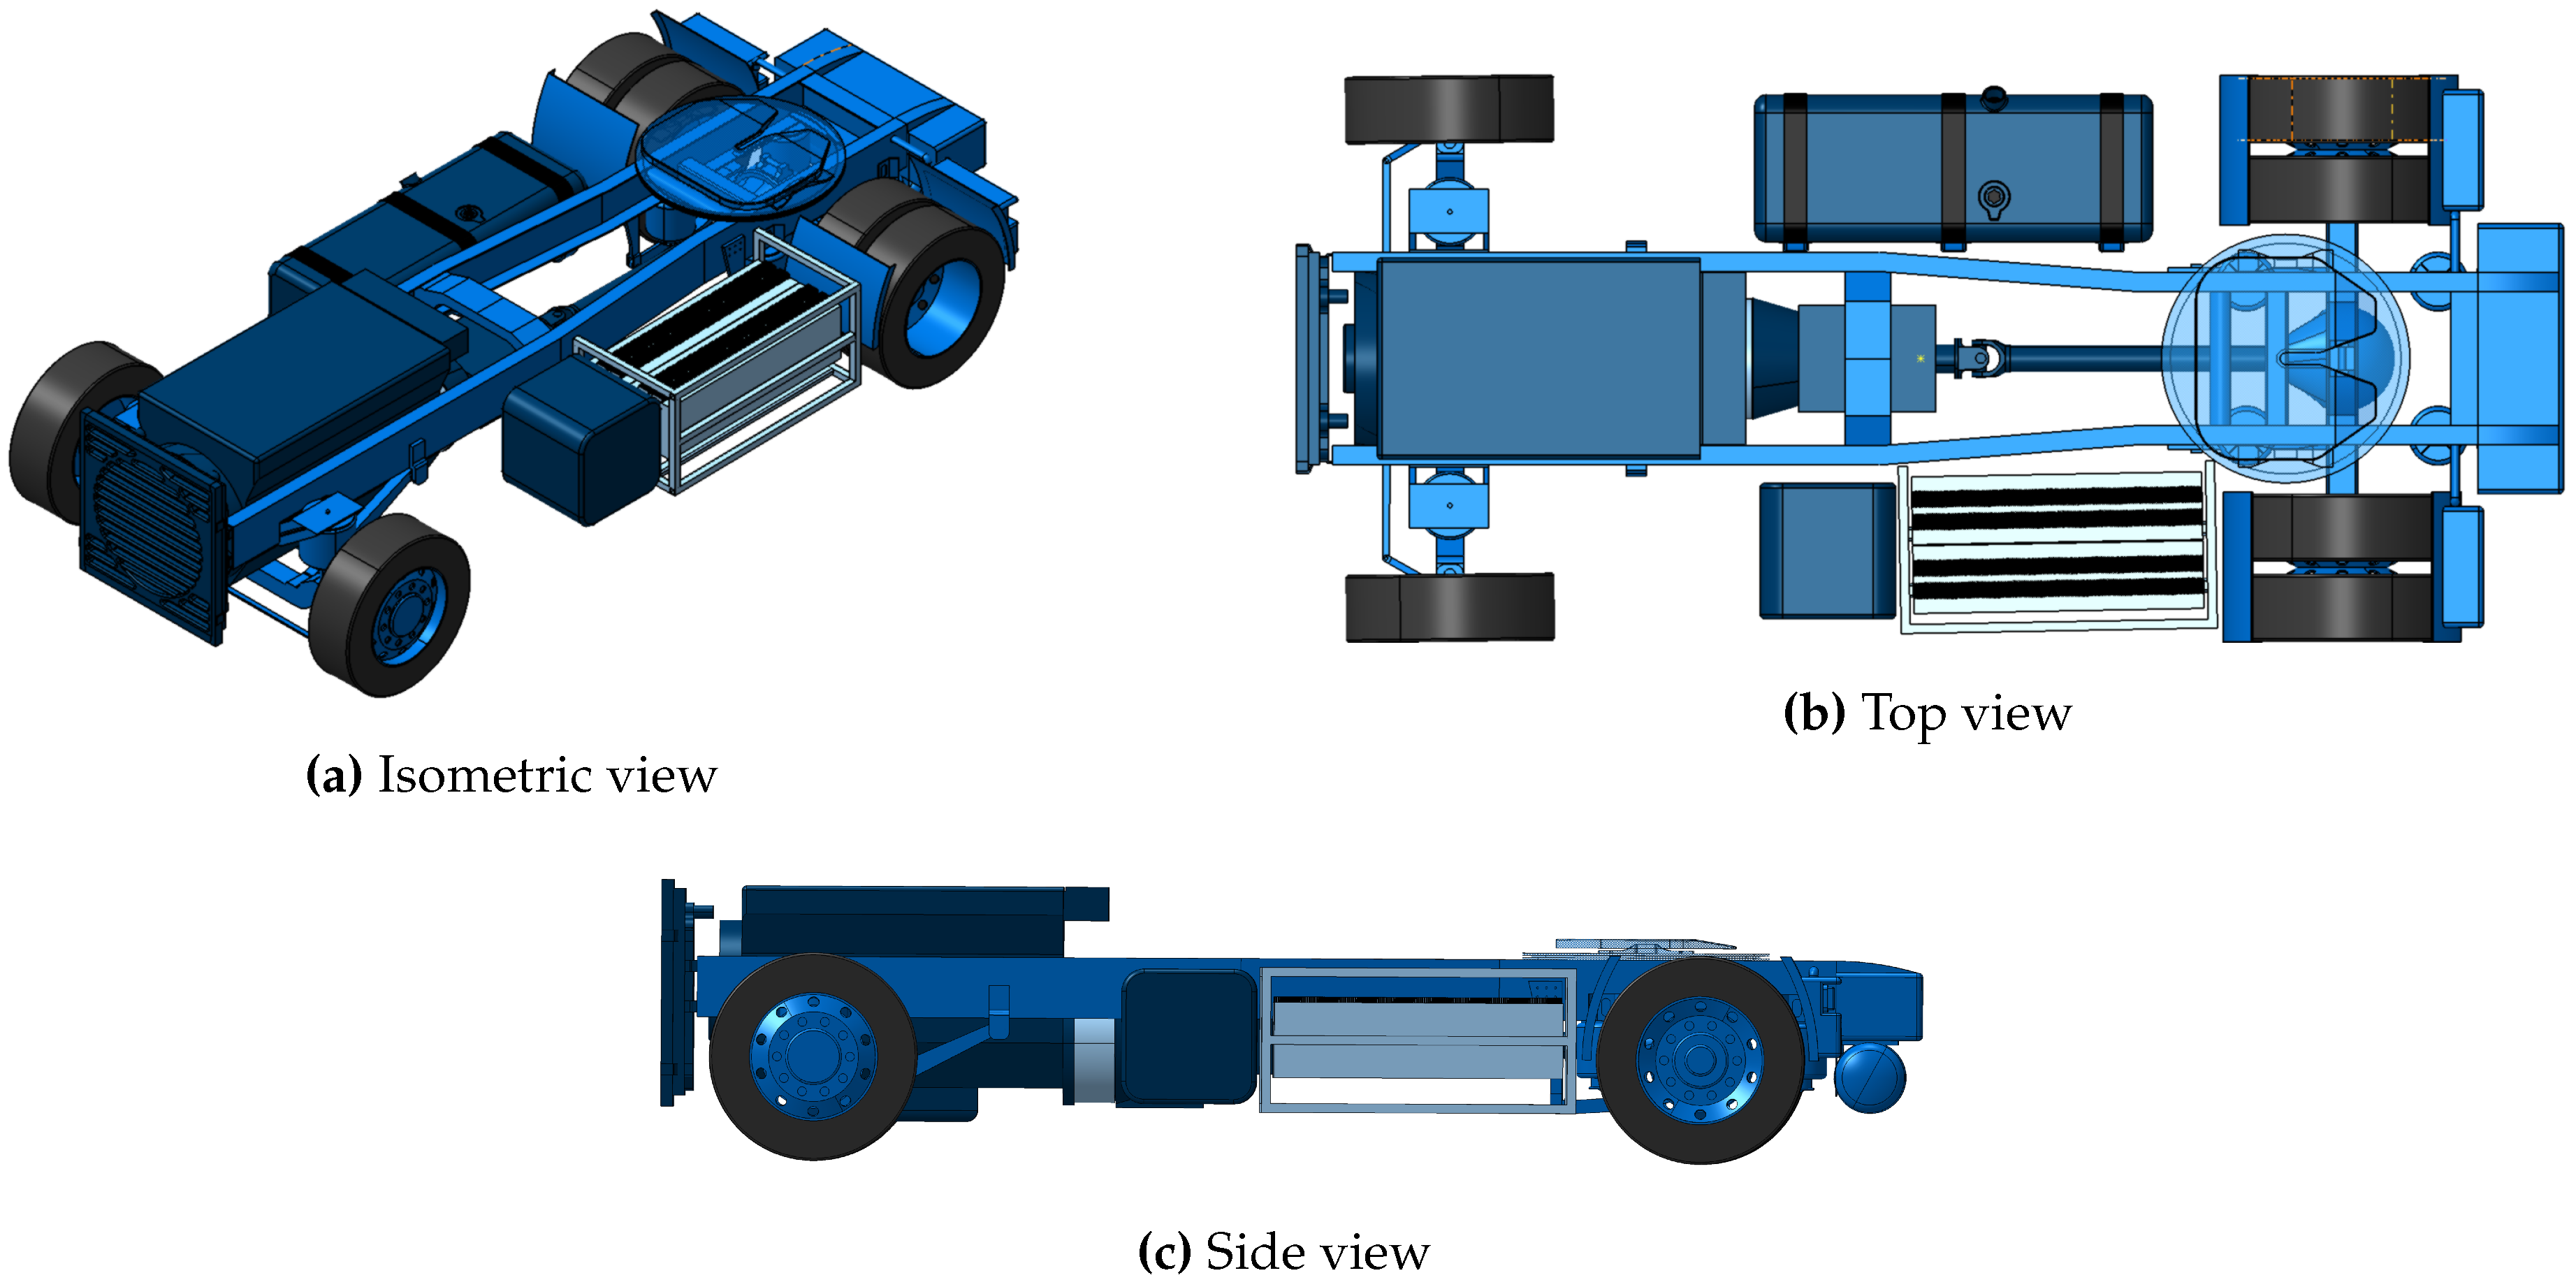
Generic vehicle glider and attached components without cab for a typical European tractor.
Figure 2.
Generic vehicle glider and attached components without cab for a typical European tractor.

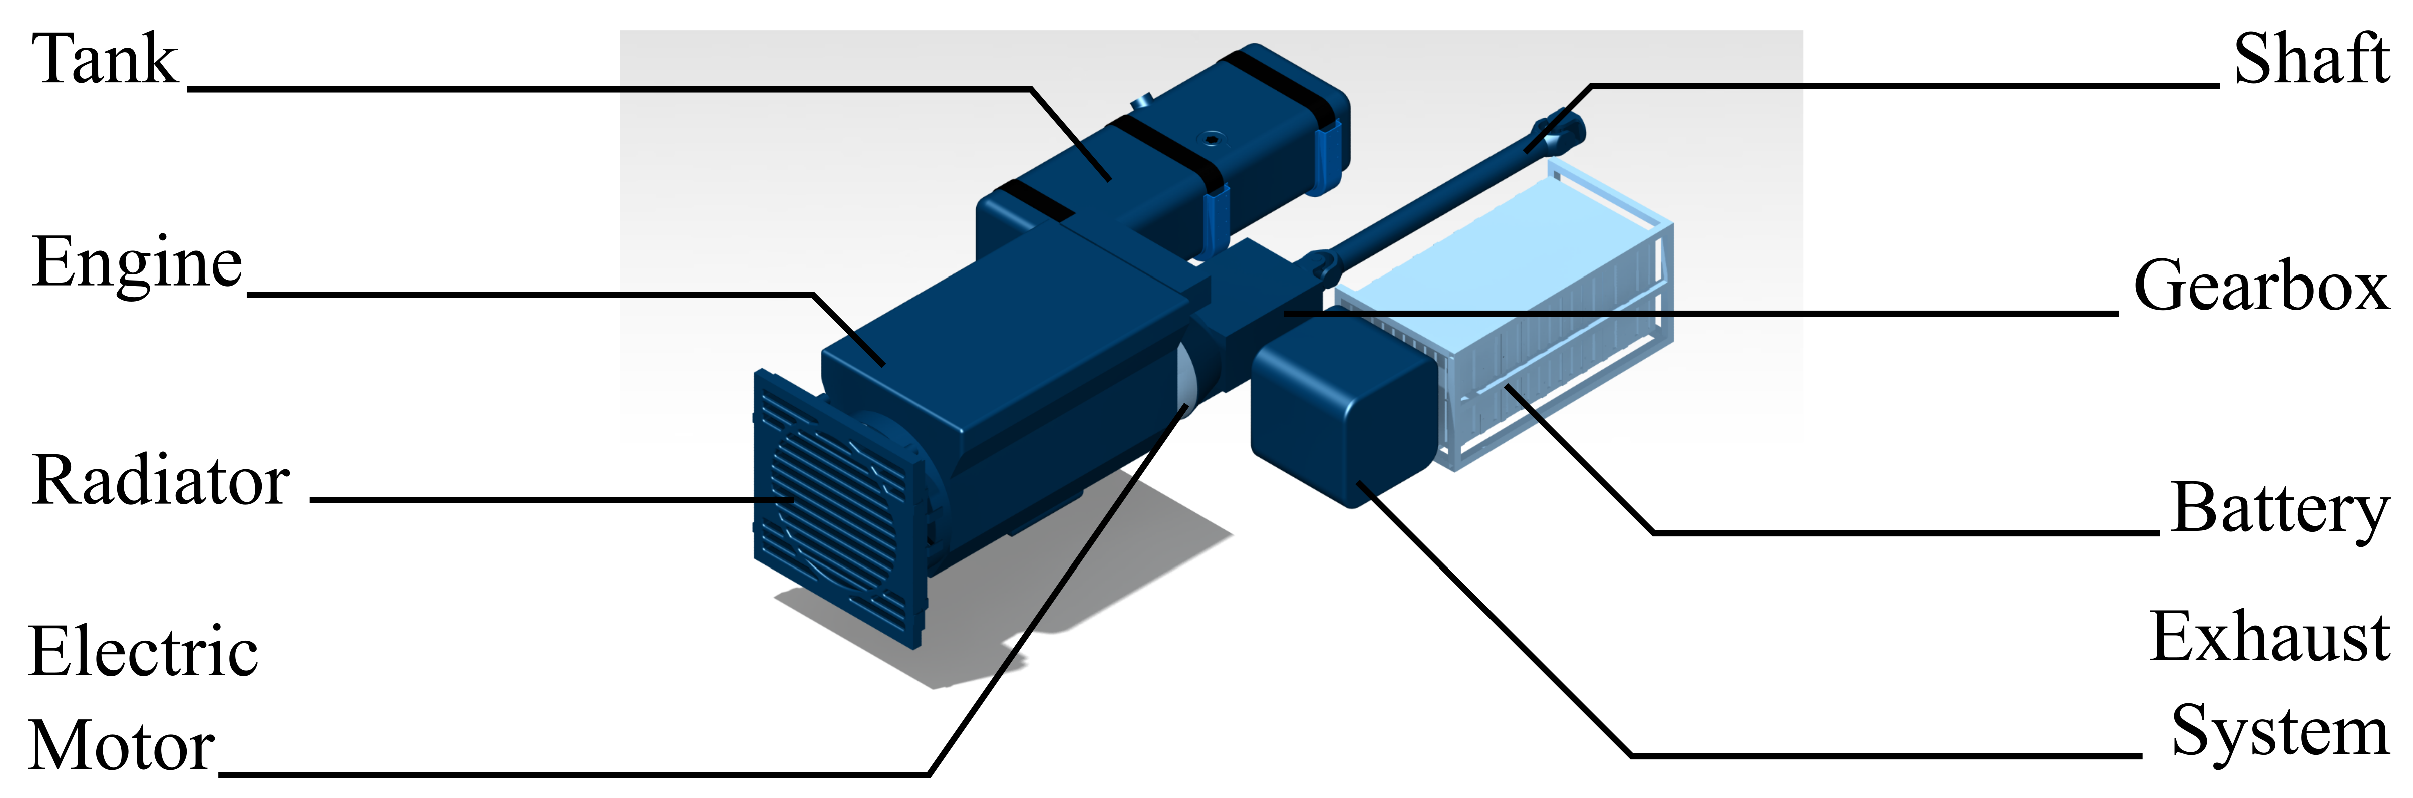
Figure 3.
Hybrid powertrain including tank and exhaust system with ![Sustainability 12 05396 i004]() conventional and
conventional and ![Sustainability 12 05396 i005]() electrical components.
electrical components.
 conventional and
  electrical components.
Figure 3.
Hybrid powertrain including tank and exhaust system with ![Sustainability 12 05396 i004]() conventional and
conventional and ![Sustainability 12 05396 i005]() electrical components.
electrical components.
conventional and electrical components.
Figure 4.
Simplified overview of different system boundary definitions according to Hauschild et al. ([53] p. 102). The four product life-cycle phases are shown with respective material and energy inputs ( ![Sustainability 12 05396 i006]()
![Sustainability 12 05396 i007]() ) and waste and emission outputs (
) and waste and emission outputs ( ![Sustainability 12 05396 i008]()
![Sustainability 12 05396 i009]() ). The fuel life-cycle (well-to-tank) is regarded as use-phase input and thus not explicitly shown. Fuel life-cycle and use-phase are regarded as well-to-wheel. The size of a symbol does not resemble the amount of input or output.
). The fuel life-cycle (well-to-tank) is regarded as use-phase input and thus not explicitly shown. Fuel life-cycle and use-phase are regarded as well-to-wheel. The size of a symbol does not resemble the amount of input or output.

 ) and waste and emission outputs (
 ). The fuel life-cycle (well-to-tank) is regarded as use-phase input and thus not explicitly shown. Fuel life-cycle and use-phase are regarded as well-to-wheel. The size of a symbol does not resemble the amount of input or output.
Figure 4.
Simplified overview of different system boundary definitions according to Hauschild et al. ([53] p. 102). The four product life-cycle phases are shown with respective material and energy inputs ( ![Sustainability 12 05396 i006]()
![Sustainability 12 05396 i007]() ) and waste and emission outputs (
) and waste and emission outputs ( ![Sustainability 12 05396 i008]()
![Sustainability 12 05396 i009]() ). The fuel life-cycle (well-to-tank) is regarded as use-phase input and thus not explicitly shown. Fuel life-cycle and use-phase are regarded as well-to-wheel. The size of a symbol does not resemble the amount of input or output.
). The fuel life-cycle (well-to-tank) is regarded as use-phase input and thus not explicitly shown. Fuel life-cycle and use-phase are regarded as well-to-wheel. The size of a symbol does not resemble the amount of input or output.
) and waste and emission outputs ( ). The fuel life-cycle (well-to-tank) is regarded as use-phase input and thus not explicitly shown. Fuel life-cycle and use-phase are regarded as well-to-wheel. The size of a symbol does not resemble the amount of input or output.
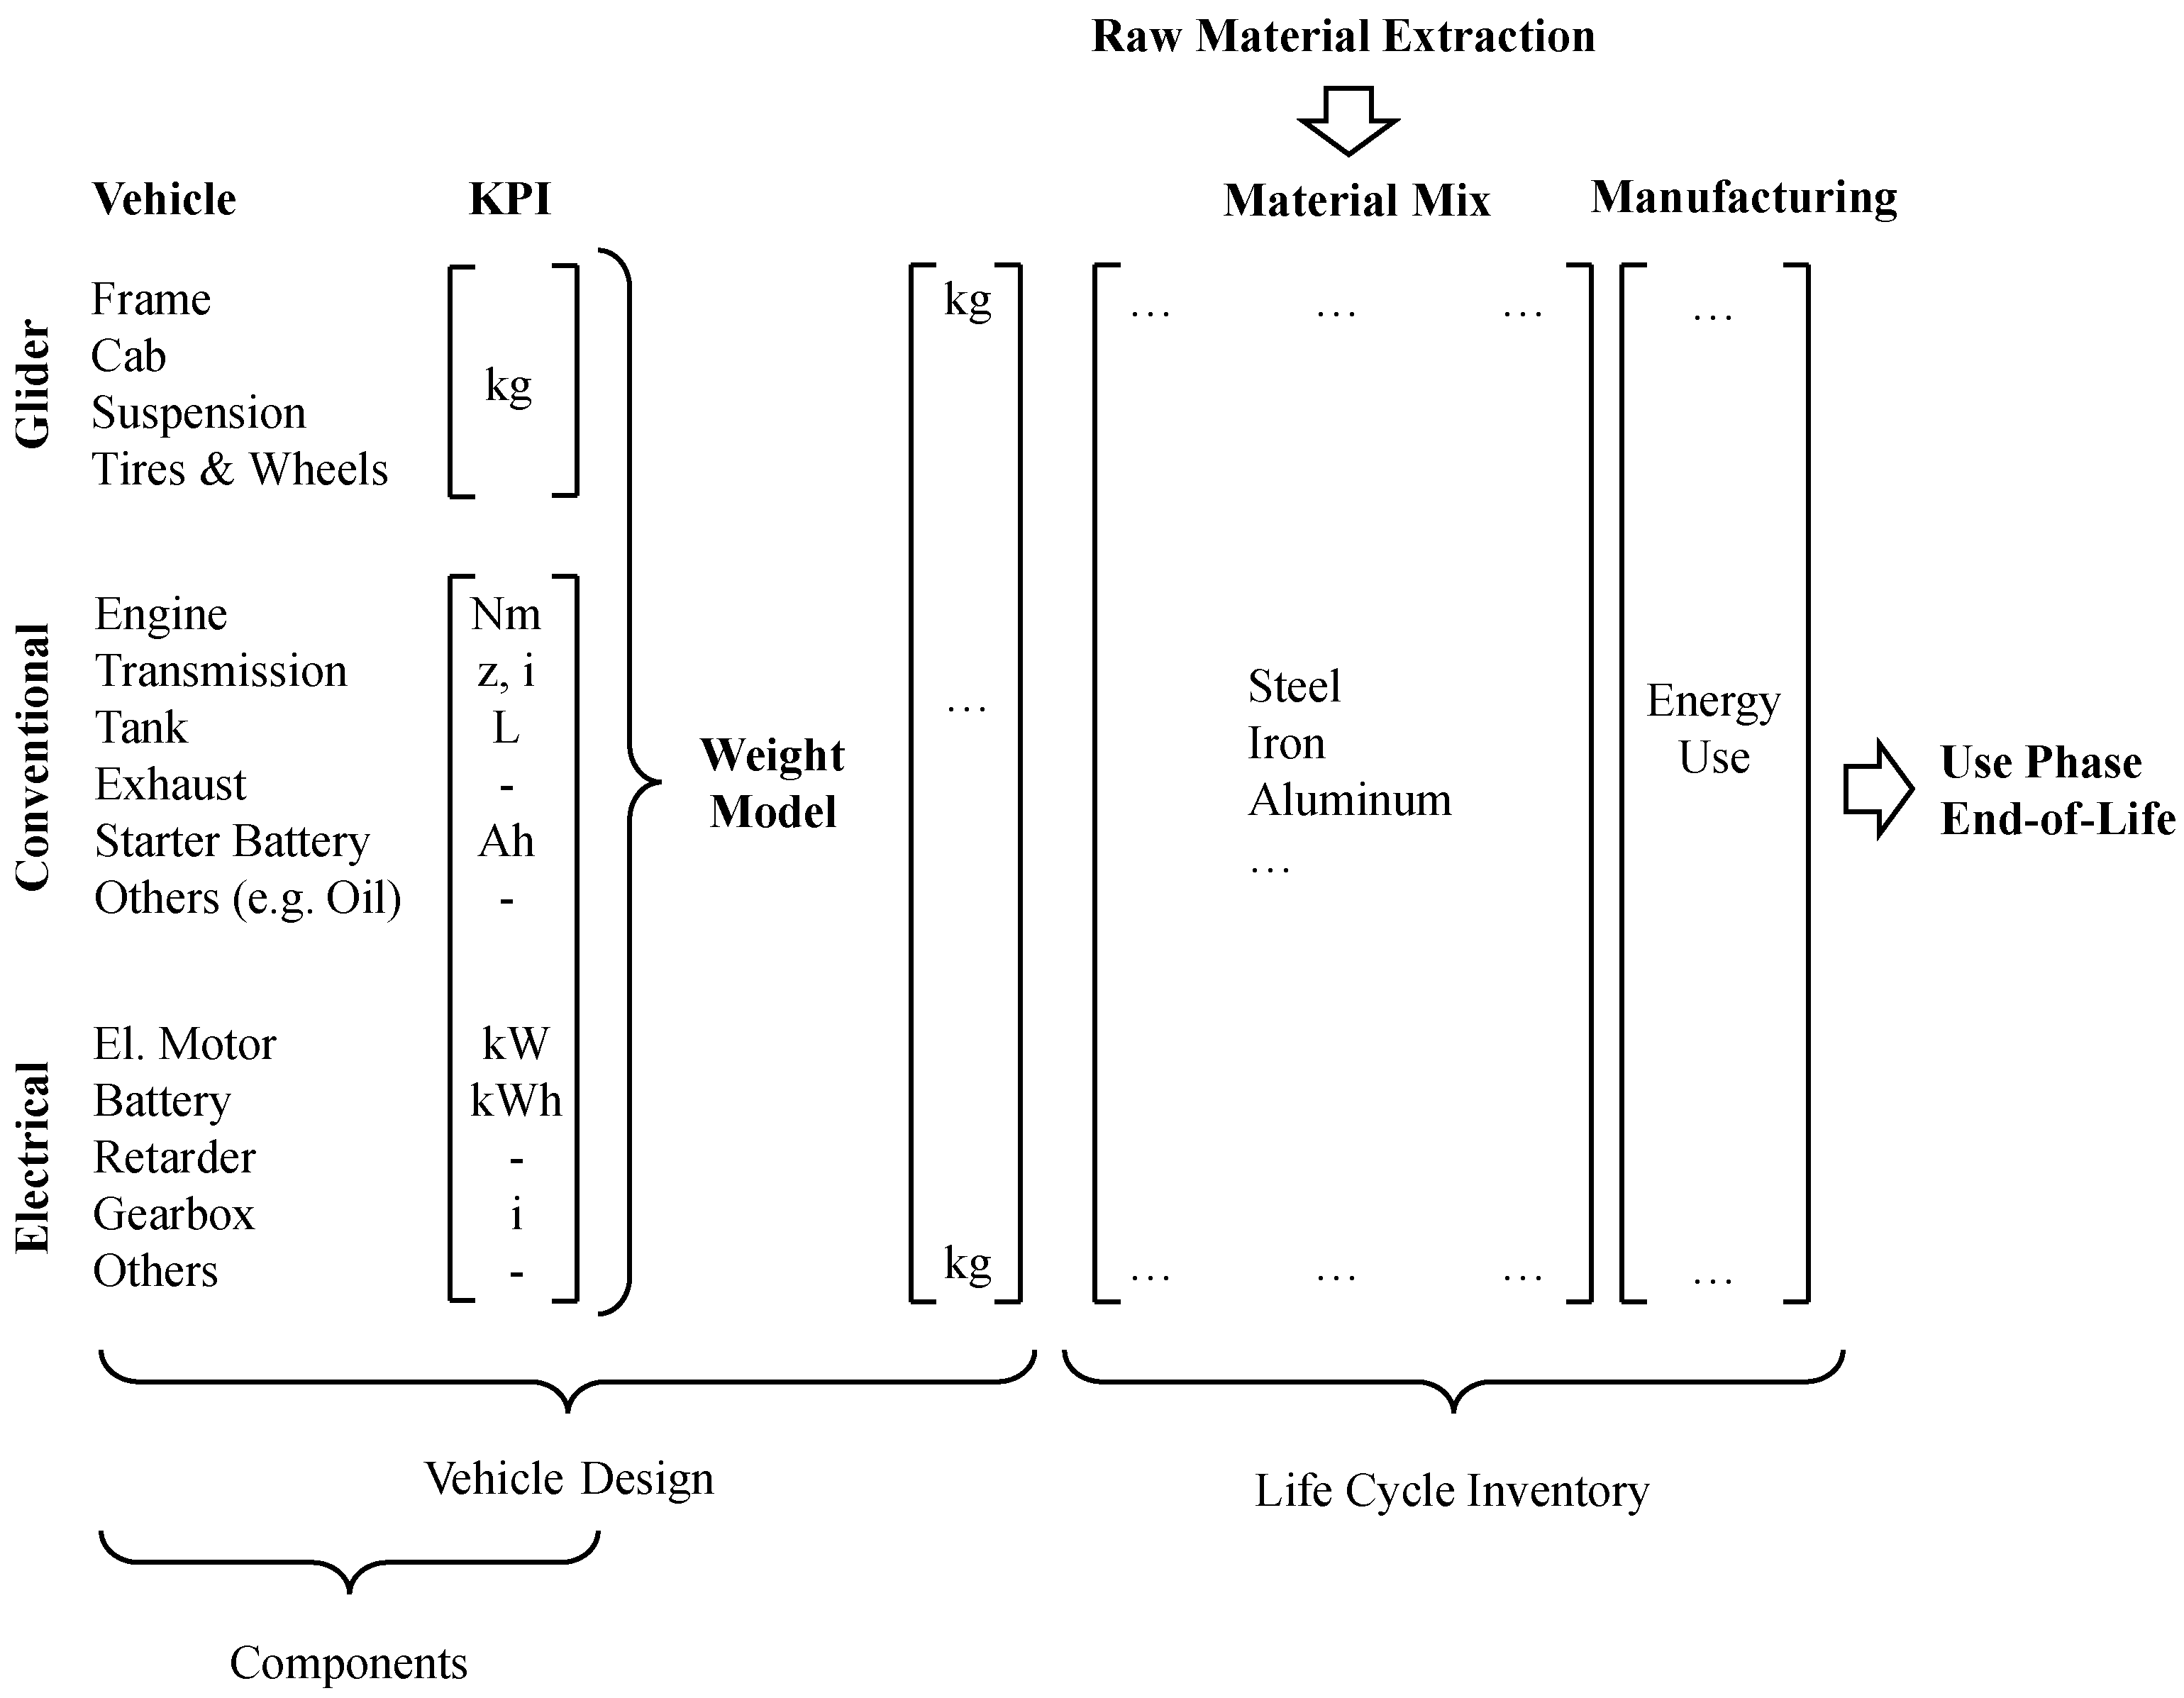
Figure 5.
Process diagram of the methodology for the life-cycle inventory compilation. The vehicle concept design parameters are transferred to mass models by Fries et al. [54,58,59] which provide the LCI input to scale components by their weight. (KPI: key performance indicator).

Figure 6.
The life-cycle inventory analysis of the material mix in total vehicle weight shows decreases of steel and iron materials and an increase of battery related materials (NMC111 powder, graphite and aluminum) for BEV concepts. Only materials >5% are shown. A complete list of materials is given in Table A6. Diesel is only present in ICE and (P)HEV, while NMC111 powder and graphite are only relevant for BEV. (Note: NMC: nickel manganese cobalt; ICE: internal combustion engine; (P)HEV: (plug-in) hybrid electric vehicle; BEV: battery electric vehicle).

Figure 7.
The total life-cycle impact assessment shows an increase of cradle-to-gate primary energy demand (net caloric value) for the BEV concepts by a factor of 5–7 compared to ICE and (P)HEV. The energy demand of each vehicle concept is scaled by component size and based on thinkstep professional 2017 and ecoinvent V3.3 databases [55,56]. Engine, Exhaust, Lead Acid Battery and Diesel Tank are only relevant for ICE and (P)HEV. Battery Pack and Electric Motor are scaled and considered for (P)HEV and BEV. Assembly was assumed to be the same for all vehicle concepts. (ICE: internal combustion engine; (P)HEV: (plug-in) hybrid electric vehicle; BEV: battery electric vehicle).

Figure 8.
The Life-cycle impact assessment for cradle-to-gate global warming potential (GWP; ILCD Recommendation [73]) shows the major influence of the lithium-ion battery on total GWP with an European energy mix. The GWP for each vehicle is concept scaled by component size and based on thinkstep professional 2017 and ecoinvent V3.3 databases [55,56]. Engine, Exhaust, Lead Acid Battery and Diesel Tank are only relevant for ICE and (P)HEV. Battery Pack and Electric Motor are scaled and considered for (P)HEV and BEV. Assembly is assumed to be the same for all vehicle concepts. (ICE: internal combustion engine; (P)HEV: (plug-in) hybrid electric vehicle; BEV: battery electric vehicle).

Figure 9.
Percentage of vehicle weight and standard deviation of the scalable life-cycle inventory for the ICE vehicle compared to the studies of Gaines et al. (1998) and Altenburg et al. (2017). The material mix of the presented model and of Gaines et al. are adapted analogously to Altenburg et al. [41,77]. Lightmetal includes cast and wrought aluminum, and magnesium. Polymer includes rubber, thermoplast and duroplast. Non-Iron Metals are copper, platinum, zinc and lead. Fluids are all types of oil and cooling fluids. Glass, ceramic and organic materials are considered others.

Table 1.
Overview of the components for the three vehicle concepts. (ICEV: internal combustion engine vehicle; HEV: hybrid electric vehicle; EV: battery electric vehicle).
Table 1.
Overview of the components for the three vehicle concepts. (ICEV: internal combustion engine vehicle; HEV: hybrid electric vehicle; EV: battery electric vehicle).
| Category | Component | ICEV | HEV | BEV |
|---|---|---|---|---|
| Glider | Cab | ● | ● | ● |
| Frame | ● | ● | ● | |
| Chassis | ● | ● | ● | |
| Tires and Wheels | ● | ● | ● | |
| Others (e.g., underride guard) | ● | ● | ● | |
| Conventional Components | Engine | ● | ● | ○ |
| Exhaust | ● | ● | ○ | |
| Diesel Tank | ● | ● | ○ | |
| Transmission | ● | ● | ○ | |
| Lead-Acid Battery | ● | ● | ○ | |
| Retarder | ● | ● | ○ | |
| Others (e.g., engine oil) | ● | ● | ○ | |
| Electrical Components | Electric Motor | ○ | ● | ● |
| Li-Battery | ○ | ● | ● | |
| Others (e.g., exterior electrical) | ● | ● | ● |
Table 2.
Overview of data sources. ○ Not mentioned; ◐ mentioned in Context; ● explicitly mentioned. (HDV: heavy-duty vehicle; LCI: life-cycle inventory).
Table 2.
Overview of data sources. ○ Not mentioned; ◐ mentioned in Context; ● explicitly mentioned. (HDV: heavy-duty vehicle; LCI: life-cycle inventory).
| Source | HDV | Production | Use-Phase | End-of-Life | LCI Accessible |
|---|---|---|---|---|---|
| Burnham et al. [26] * | ○ | ● | ● | ● | ● |
| Gaines et al. [41] | ● | ○ | ● | ○ | ○ |
| Rupp et al. [42] | ● | ◐ | ● | ○ | ◐ |
| Sen et al. [43] | ● | ◐ | ● | ◐ | ○ |
| Hawkins et al. [44] | ○ | ● | ● | ● | ● |
| Leuenberger and Frischknecht [45] ** | ○ | ● | ● | ● | ◐ |
| Ma et al. [46] | ○ | ● | ● | ● | ○ |
| Boureima et al. [47] | ○ | ● | ● | ● | ○ |
| Li et al. [48] | ○ | ● | ○ | ○ | ● |
| Zhou et al. [49] | ○ | ○ | ● | ○ | ○ |
Table 3.
Production and assembly inventory data for materials, assembly energy and material processing heat of a generic vehicle glider. Detailed inventory and respective sources for the components are given in Table A1, Table A2, Table A3, Table A4 and Table A5.
| Category | Glider | Unit | Value | Source |
|---|---|---|---|---|
| Total Mass | kg | 5133.2 | [62] | |
| Frame | kg | 854.0 | [26,44,55,56,63] | |
| Tires + Wheels | kg | 658.8 | [26,44,55,56,63] | |
| Components | Suspension | kg | 1600.0 | [26,44,55,56,63] |
| Cab | kg | 1386.7 | [26,44,55,56,63] | |
| Others | kg | 633.7 | [26,44,55,56,63] | |
| Steel Mass | kg | 3204.8 | ||
| Iron | kg | 400.0 | ||
| Rubber | kg | 280.7 | ||
| Aluminum | kg | 152.3 | ||
| Duroplast | kg | 471.3 | ||
| Thermoplast | kg | 257.2 | ||
| Materials | Copper | kg | 119.3 | |
| Glass | kg | 159.1 | ||
| Organic | kg | 39.8 | ||
| Magnesium | kg | 1.0 | ||
| Zinc | kg | 0.4 | ||
| Other | kg | 0.6 | ||
| Paint | kg | 46.9 | ||
| Assembly | kWh | 1917.47 | ||
| Energy | Iron milling | kWh | 59.20 | |
| Heat | MJ | 2974.08 | ||
| Others | Water | m | 41.04 | |
| Oxygen | kg | 0.19 | ||
| Acetylene | kg | 0.15 | ||
| Nitrogen | kg | 0.22 | ||
| Carbon dioxide | kg | 2.19 | ||
| Natural gas | kg | 3.98 | ||
| Surface area | m | 16.00 | ||
| Welding distance | m | 1.50 | ||
| Compressed air 6 bar | m | 69.82 | ||
| Compressed air 12 bar | m | 125.7 |
Table 4.
Production and assembly inventory data for materials, and assembly energy of the internal combustion engine (2100 Nm). Total mass is based on the model by Fries et al. [54]. Materials were adapted and scaled based on GREET V2.7 [26] (Hawkins [44]) and verified by an expert interview [63]. The amount of energy results from Li [48]. (HCL: hydrochloric acid; BOD: biochemical oxygen demand; COD: chemical oxygen demand).
| Category | Engine | Unit | Value | Source |
|---|---|---|---|---|
| Materials | Total Mass | kg | 1206 | [54,58] |
| Steel Mass | kg | 342 | [26] | |
| Iron Mass | kg | 513 | [26] | |
| Rubber Mass | kg | 51.3 | [26] | |
| Aluminum Mass | kg | 171 | [26] | |
| Plastic Mass | kg | 51.3 | [26] | |
| Primary Copper Mass | kg | 9.69 | [26,44] | |
| Secondary Copper Mass | kg | 1.71 | [26,44] | |
| Oil | kg | 36.02 | [65] | |
| Energy | Assembly | kWh | 735.51 | [48] |
| Iron milling | kWh | 75.9 | [55,56] | |
| Additional Data | Surface area | m | 18 | [63] |
Table 5.
Life-cycle inventory data for the final assembly of a European heavy-duty tractor. Total energy amount was based on personal communication with a European truck’s original equipment manufacturer (OEM) [66]. Water usage and emissions are based on MAN’s CSR report in relation to vehicles produced [67]. (Note: VOC = volatile organic compounds).
| Category | Assembly | Unit | Value | Source |
|---|---|---|---|---|
| Energy | Electricity | kWh | 751 | [66] |
| Heat | MJ | 4892.8 | [66] | |
| Water Usage | Fresh Water | m | 42.07 | [67] |
| Sea Water | m | 2.09 | [67] |
Table 6.
Configuration parameters of the powertrain for five different vehicle concepts for long haul transportation. The capacity indicates the total capacity. Depths-of-discharge of 17.5% for HEV, 31% for PHEV and 80% for both BEV were assumed [20,58,69]. (Note: ICE = internal combustion engine; BEV = battery electric vehicle; HYB = hybrid electric vehicle; PHEV = plug-in hybrid electric vehicle).
| Configuration | Unit | ICE | BEV1 | BEV2 | HEV | PHEV |
|---|---|---|---|---|---|---|
| Internal Combustion Engine | ||||||
| Maximum Power | kW | 352 | - | - | 260 | 320 |
| Maximum Torque | Nm | 2100 | - | - | 1700 | 1900 |
| Transmission | ||||||
| No. Of Gears | - | 12 | 1 | 1 | 8 | 10 |
| Electric Machine | ||||||
| Nominal Power | kW | - | 774 | 774 | 145 | 94 |
| Nominal Torque | Nm | - | 1720 | 1720 | 1258 | 678 |
| Battery | ||||||
| Capacity | kWh | - | 675 | 1000 | 6.5 | 71.5 |
© 2020 by the authors. Licensee MDPI, Basel, Switzerland. This article is an open access article distributed under the terms and conditions of the Creative Commons Attribution (CC BY) license (http://creativecommons.org/licenses/by/4.0/).
Share and Cite
MDPI and ACS Style
Wolff, S.; Seidenfus, M.; Gordon, K.; Álvarez, S.; Kalt, S.; Lienkamp, M. Scalable Life-Cycle Inventory for Heavy-Duty Vehicle Production. Sustainability 2020, 12, 5396. https://doi.org/10.3390/su12135396
AMA Style
Wolff S, Seidenfus M, Gordon K, Álvarez S, Kalt S, Lienkamp M. Scalable Life-Cycle Inventory for Heavy-Duty Vehicle Production. Sustainability. 2020; 12(13):5396. https://doi.org/10.3390/su12135396
Chicago/Turabian StyleWolff, Sebastian, Moritz Seidenfus, Karim Gordon, Sergio Álvarez, Svenja Kalt, and Markus Lienkamp. 2020. "Scalable Life-Cycle Inventory for Heavy-Duty Vehicle Production" Sustainability 12, no. 13: 5396. https://doi.org/10.3390/su12135396
Note that from the first issue of 2016, this journal uses article numbers instead of page numbers. See further details here.