3. Methods
Oral History and Field Measurements: We used an interdisciplinary approach that combined interviews, field measurements, remote sensing, and flood modeling to reconstruct the history of GLOF occurrence there. Oral histories and in-depth interviews with local inhabitants were conducted during the initial approach to Nangama glacial lake, following open, in-depth interview techniques outlined in Bernard (2002) [
15] and oral history research methods described in Yow (1997) [
16] and Sommer and Quinlan (2018) [
17]. Although oral history as a research method has some limitations (e.g., recall inaccuracy, selective memories, biases), it has proven to be a useful and credible tool for historical research, especially in places where records do not exist or data collection is not possible (Sommer and Quinlan 2018 [
17], Trimble et al. 2016 [
18]). Older respondents with a knowledge of the region’s history and memories of GLOF events were specifically sought out, using a chain referral technique [
19] that identified a primary sampling size of nine individuals between the ages of 49 and 88 (average age = 71 years) in seven different villages (
Table 1). Casual conversations with younger inhabitants also helped locate the older and more historically knowledgeable individuals throughout the region. All interviews were in-depth and open-ended, and focused on the participants’ recollections of the (a) 1980 Nangama flood, (b) other GLOFs and floods that had occurred in the region, either before or after Nangama, (c) the sources and types of the other floods that had occurred, (d) flood characteristics (e.g., flood warning signs, sounds, smells), (e) flood damage, (f) general climate and climate change observations within the region over the past 50 years, (g) the likelihood of future floods occurring in the region, and (h) cultural and/or spiritual significance of the glacial lakes in question.
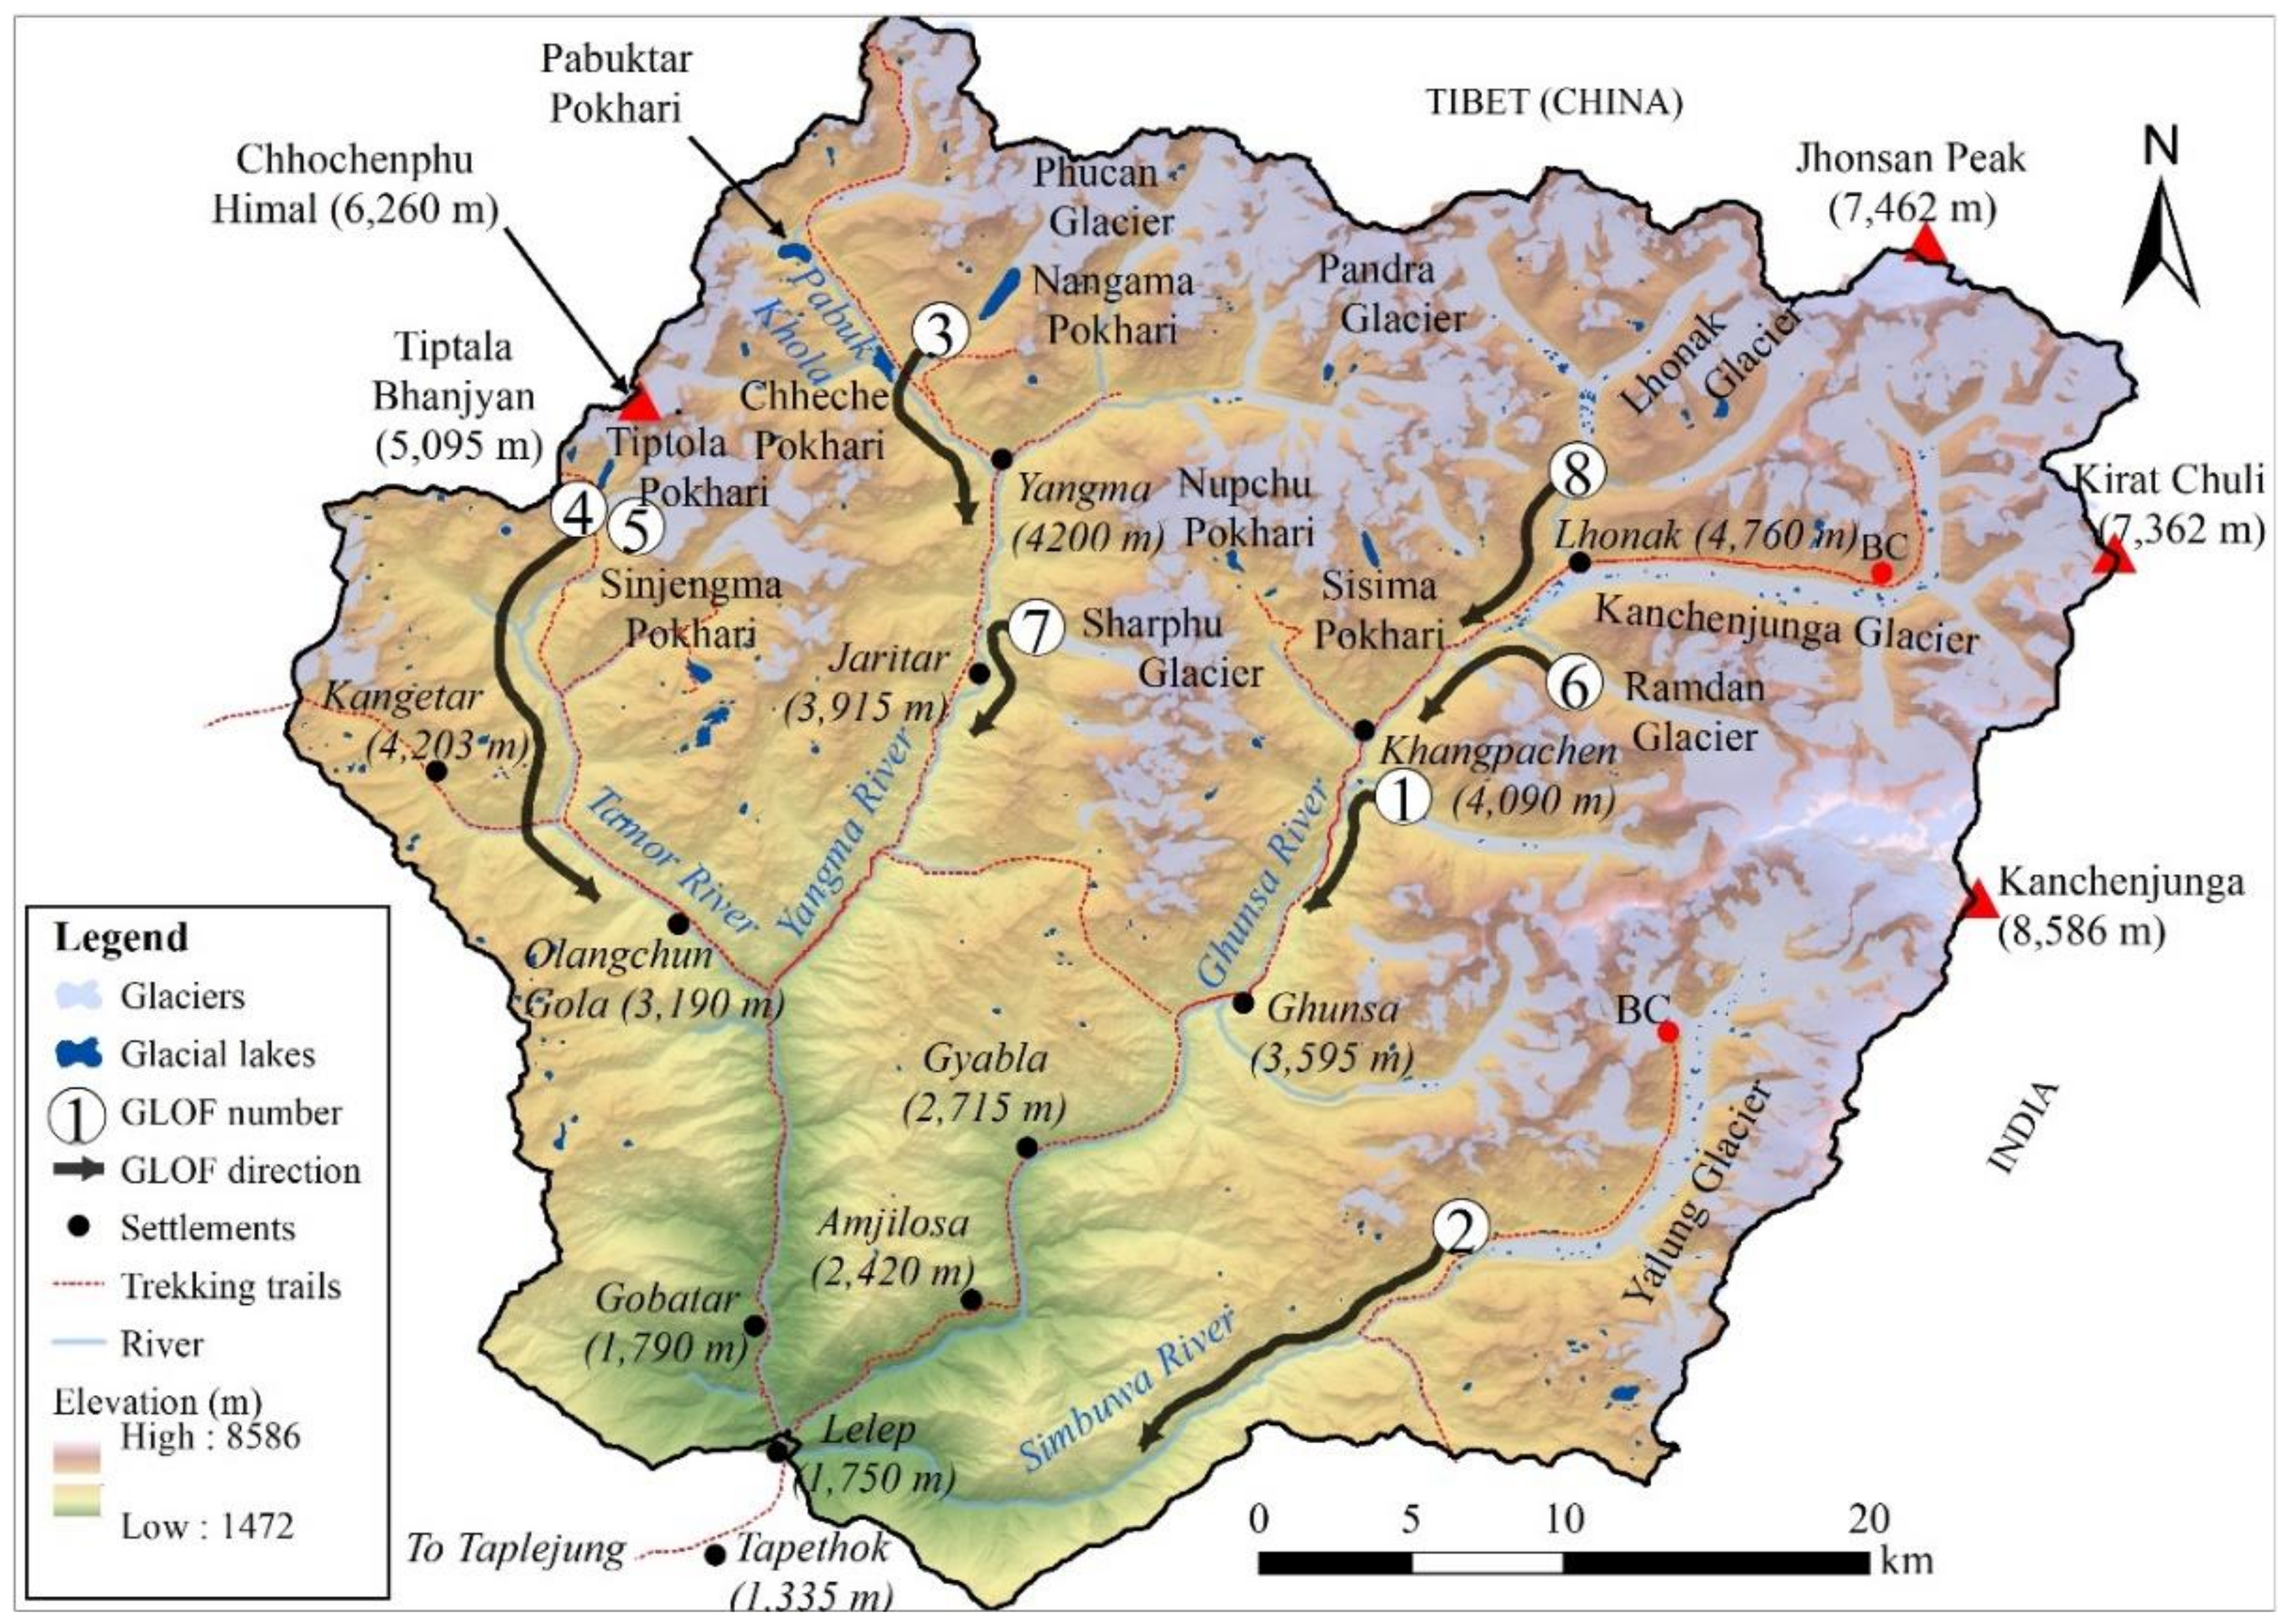
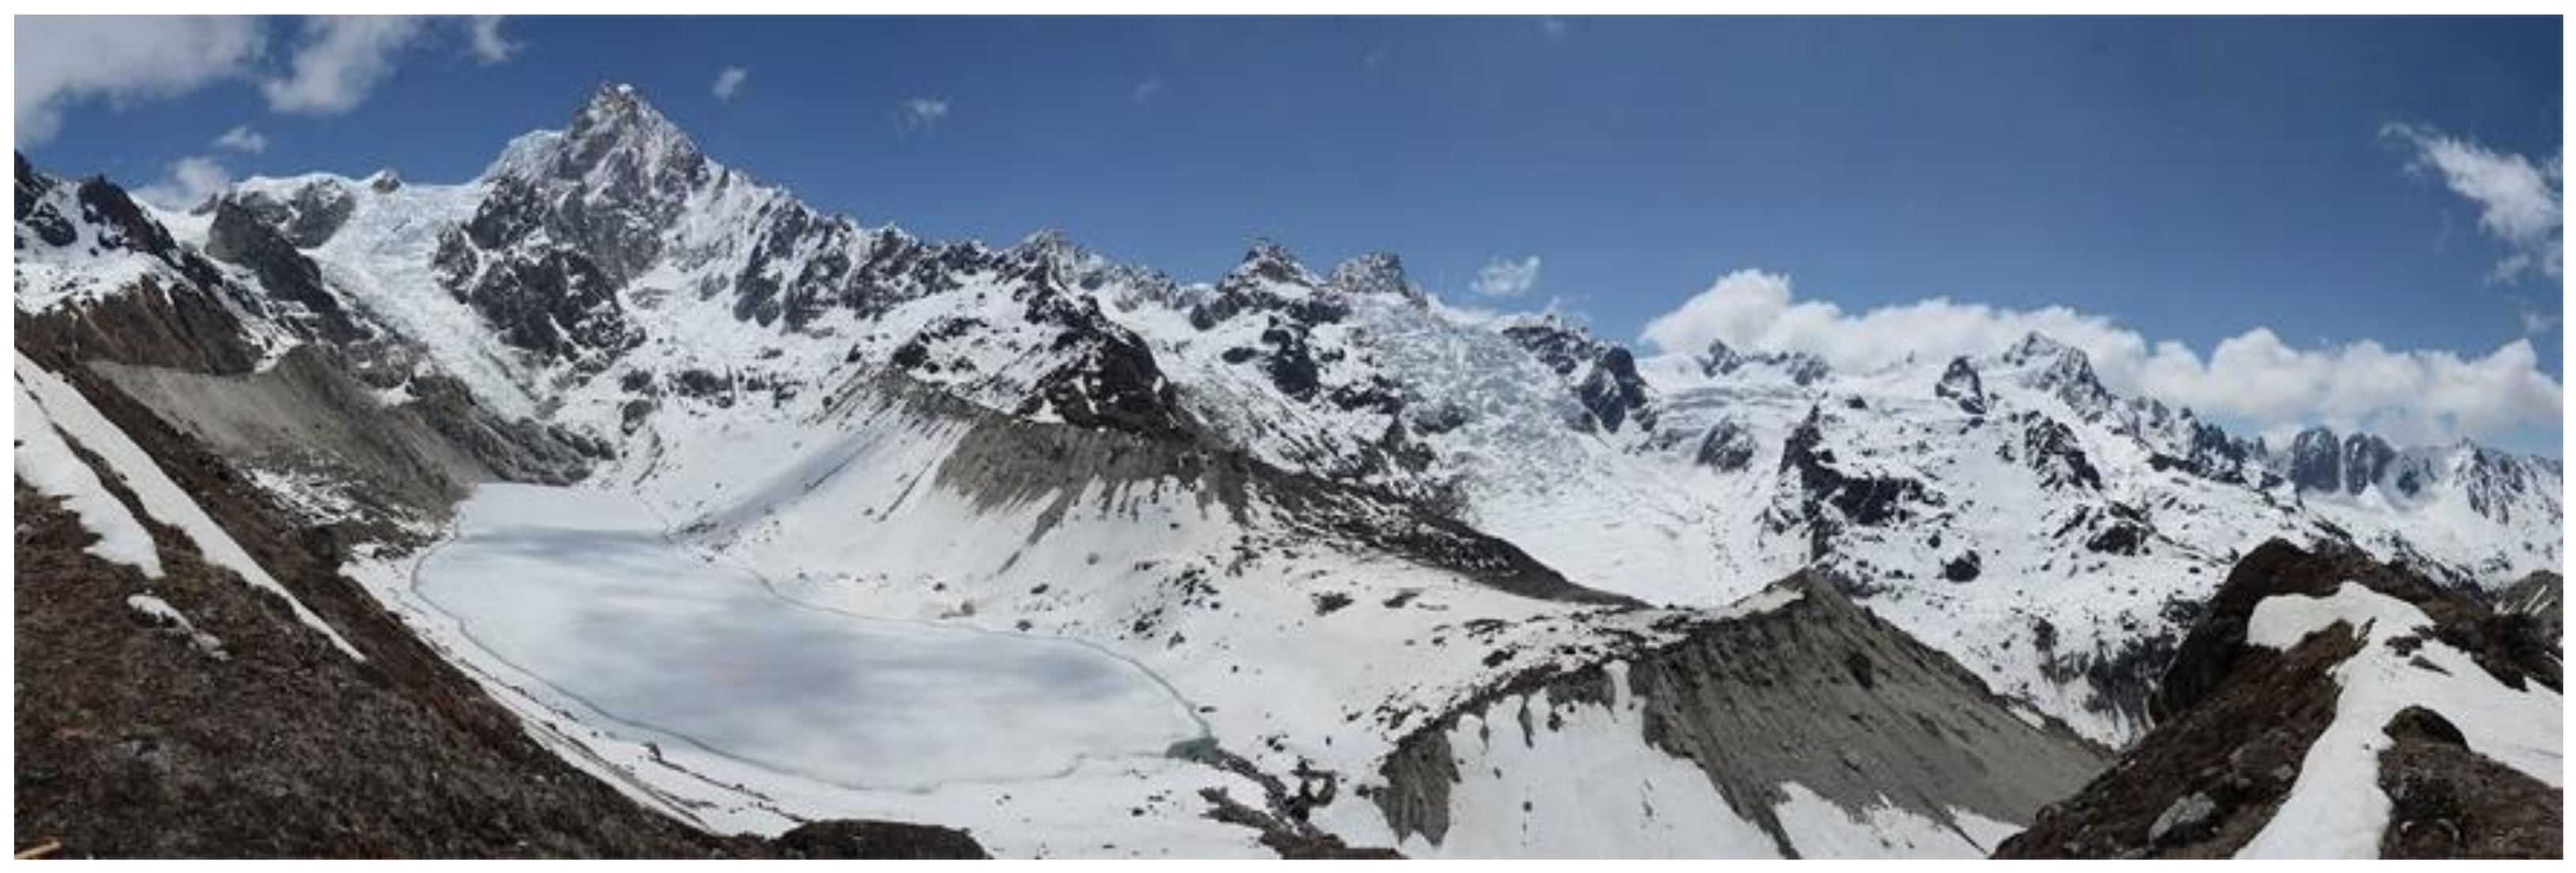
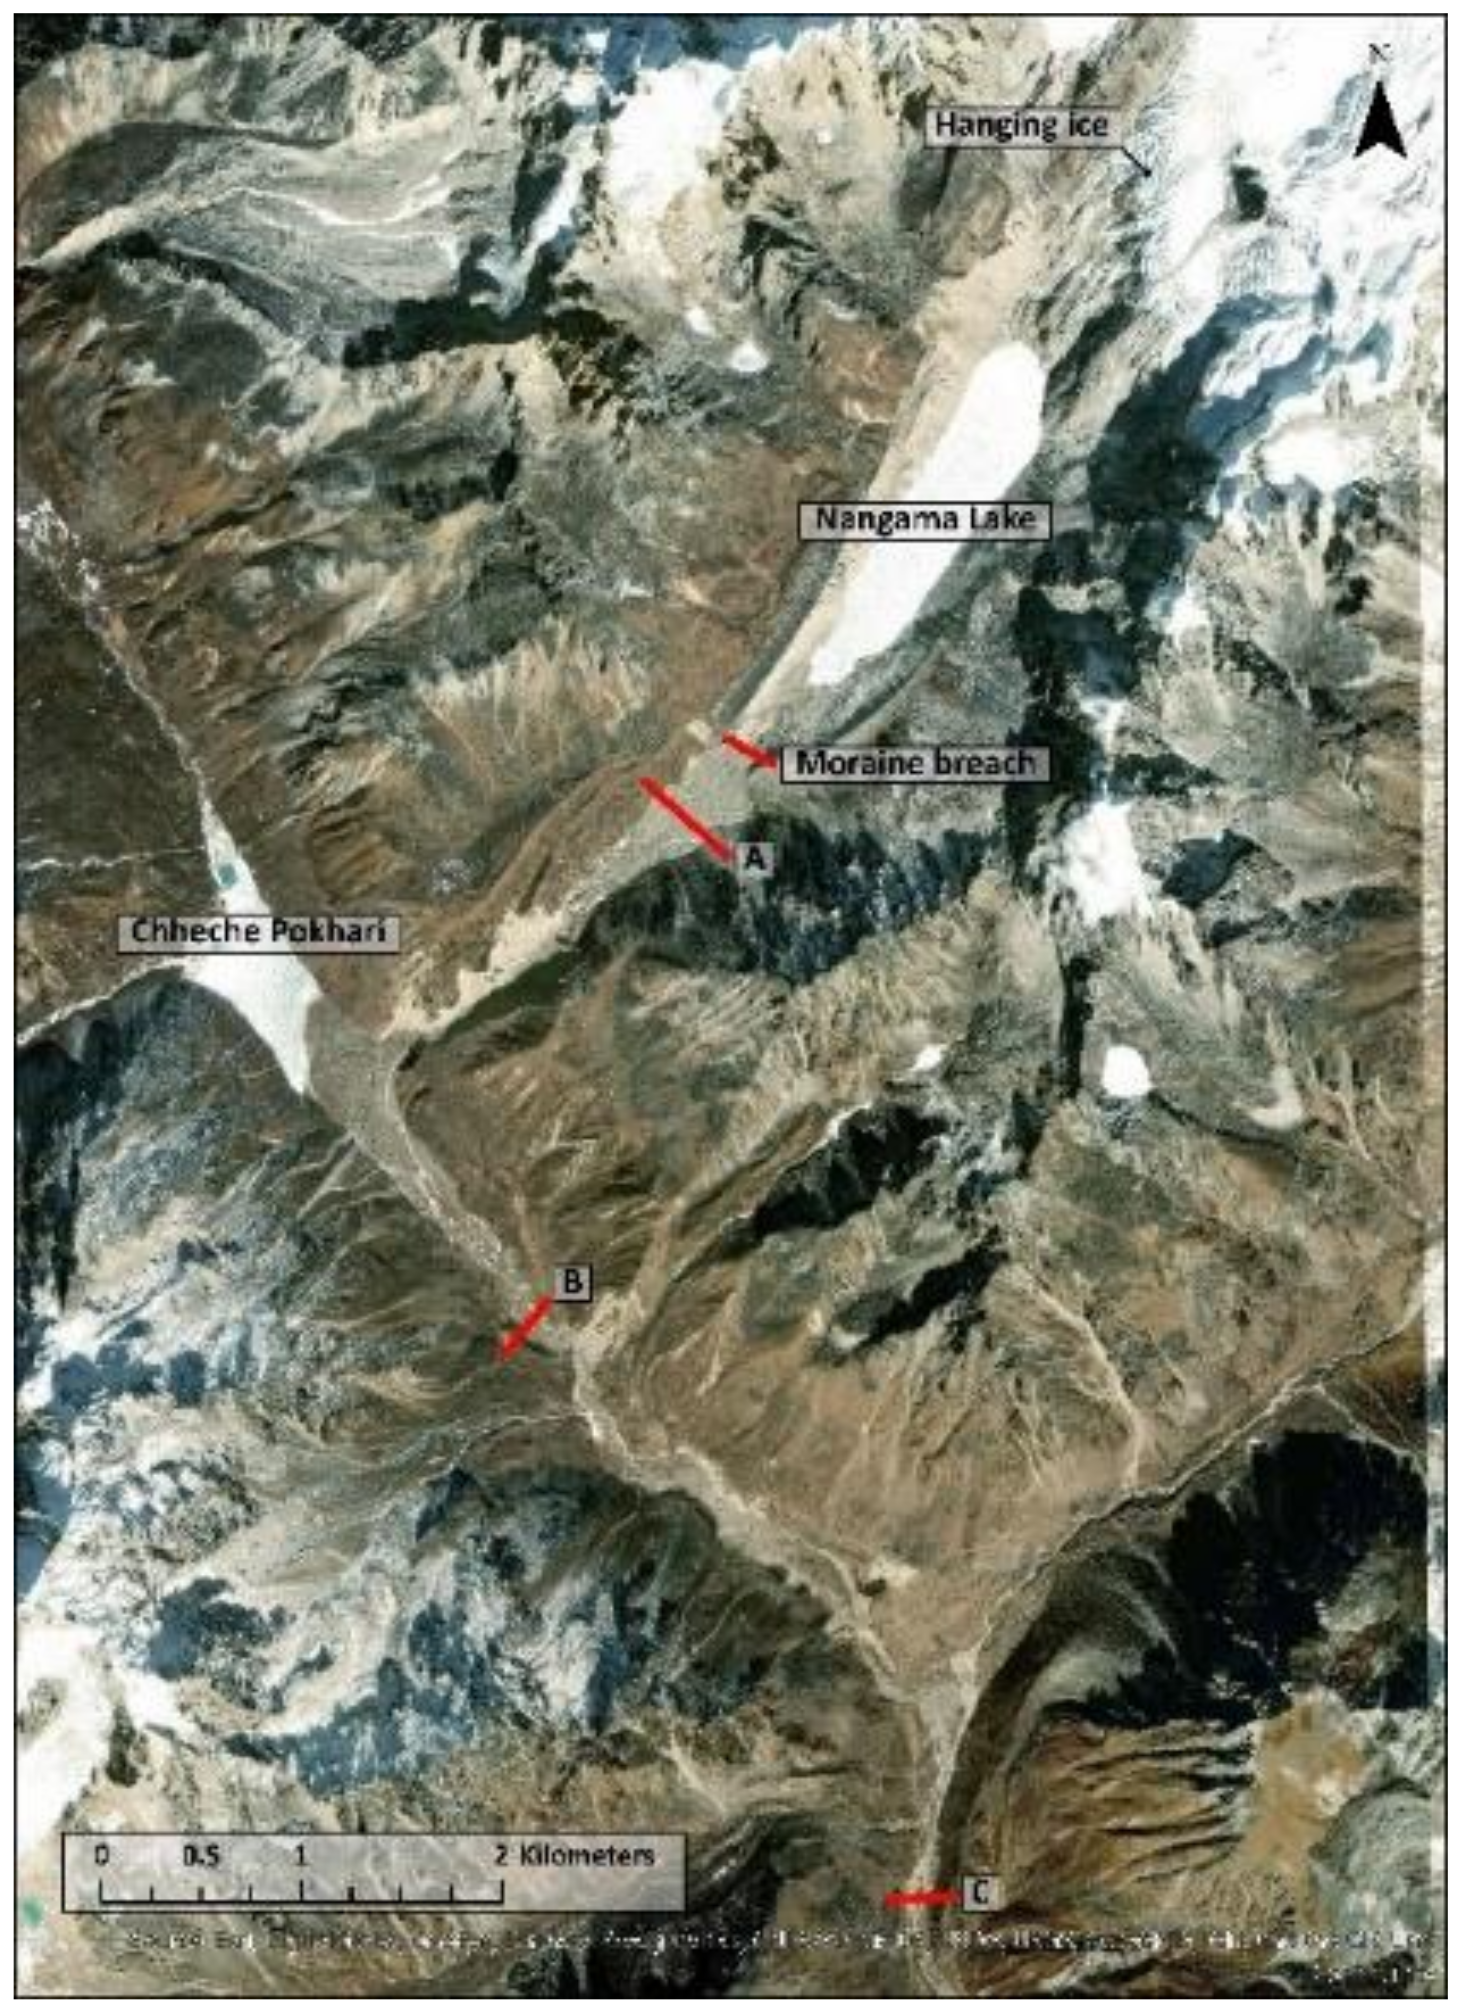
Field methods included on-site measurements of the Nangama terminal moraine breach geometry, high water marks, and other flood features of interest using a laser rangefinder, GPS, compass, and altimeter. Photopoint stations were established (latitude/longitude/altitude) for each of the lakes visited, which included Tiptola (
Figure 2), Chheche, Pabuktar, Nangama (
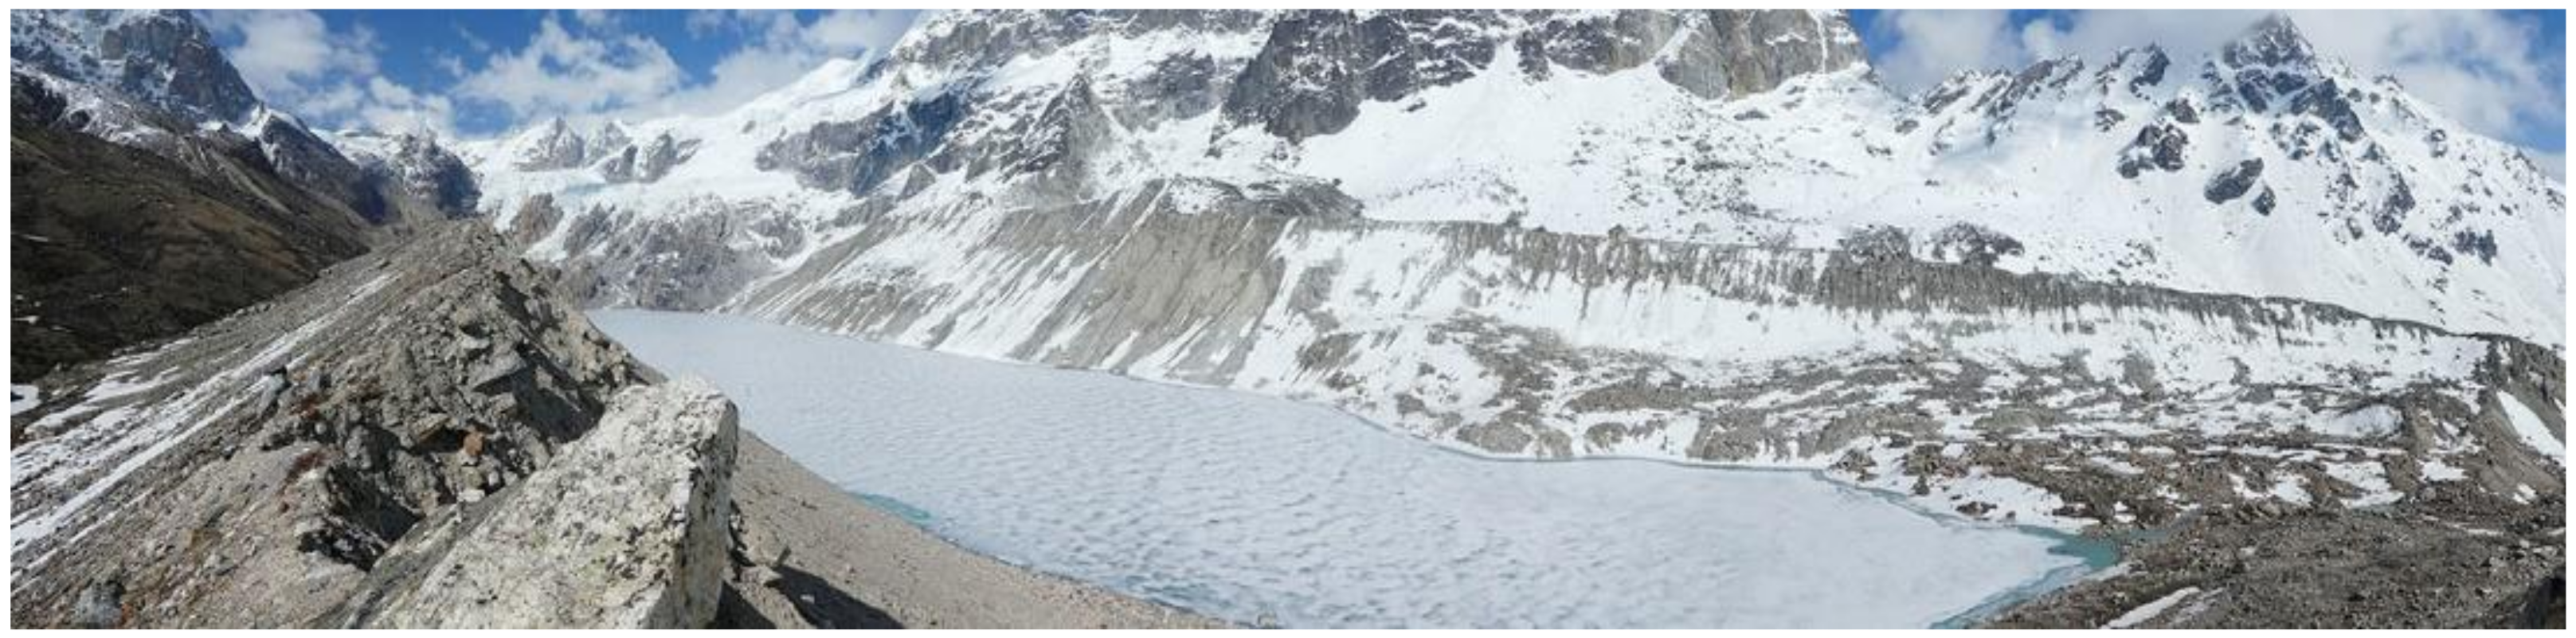
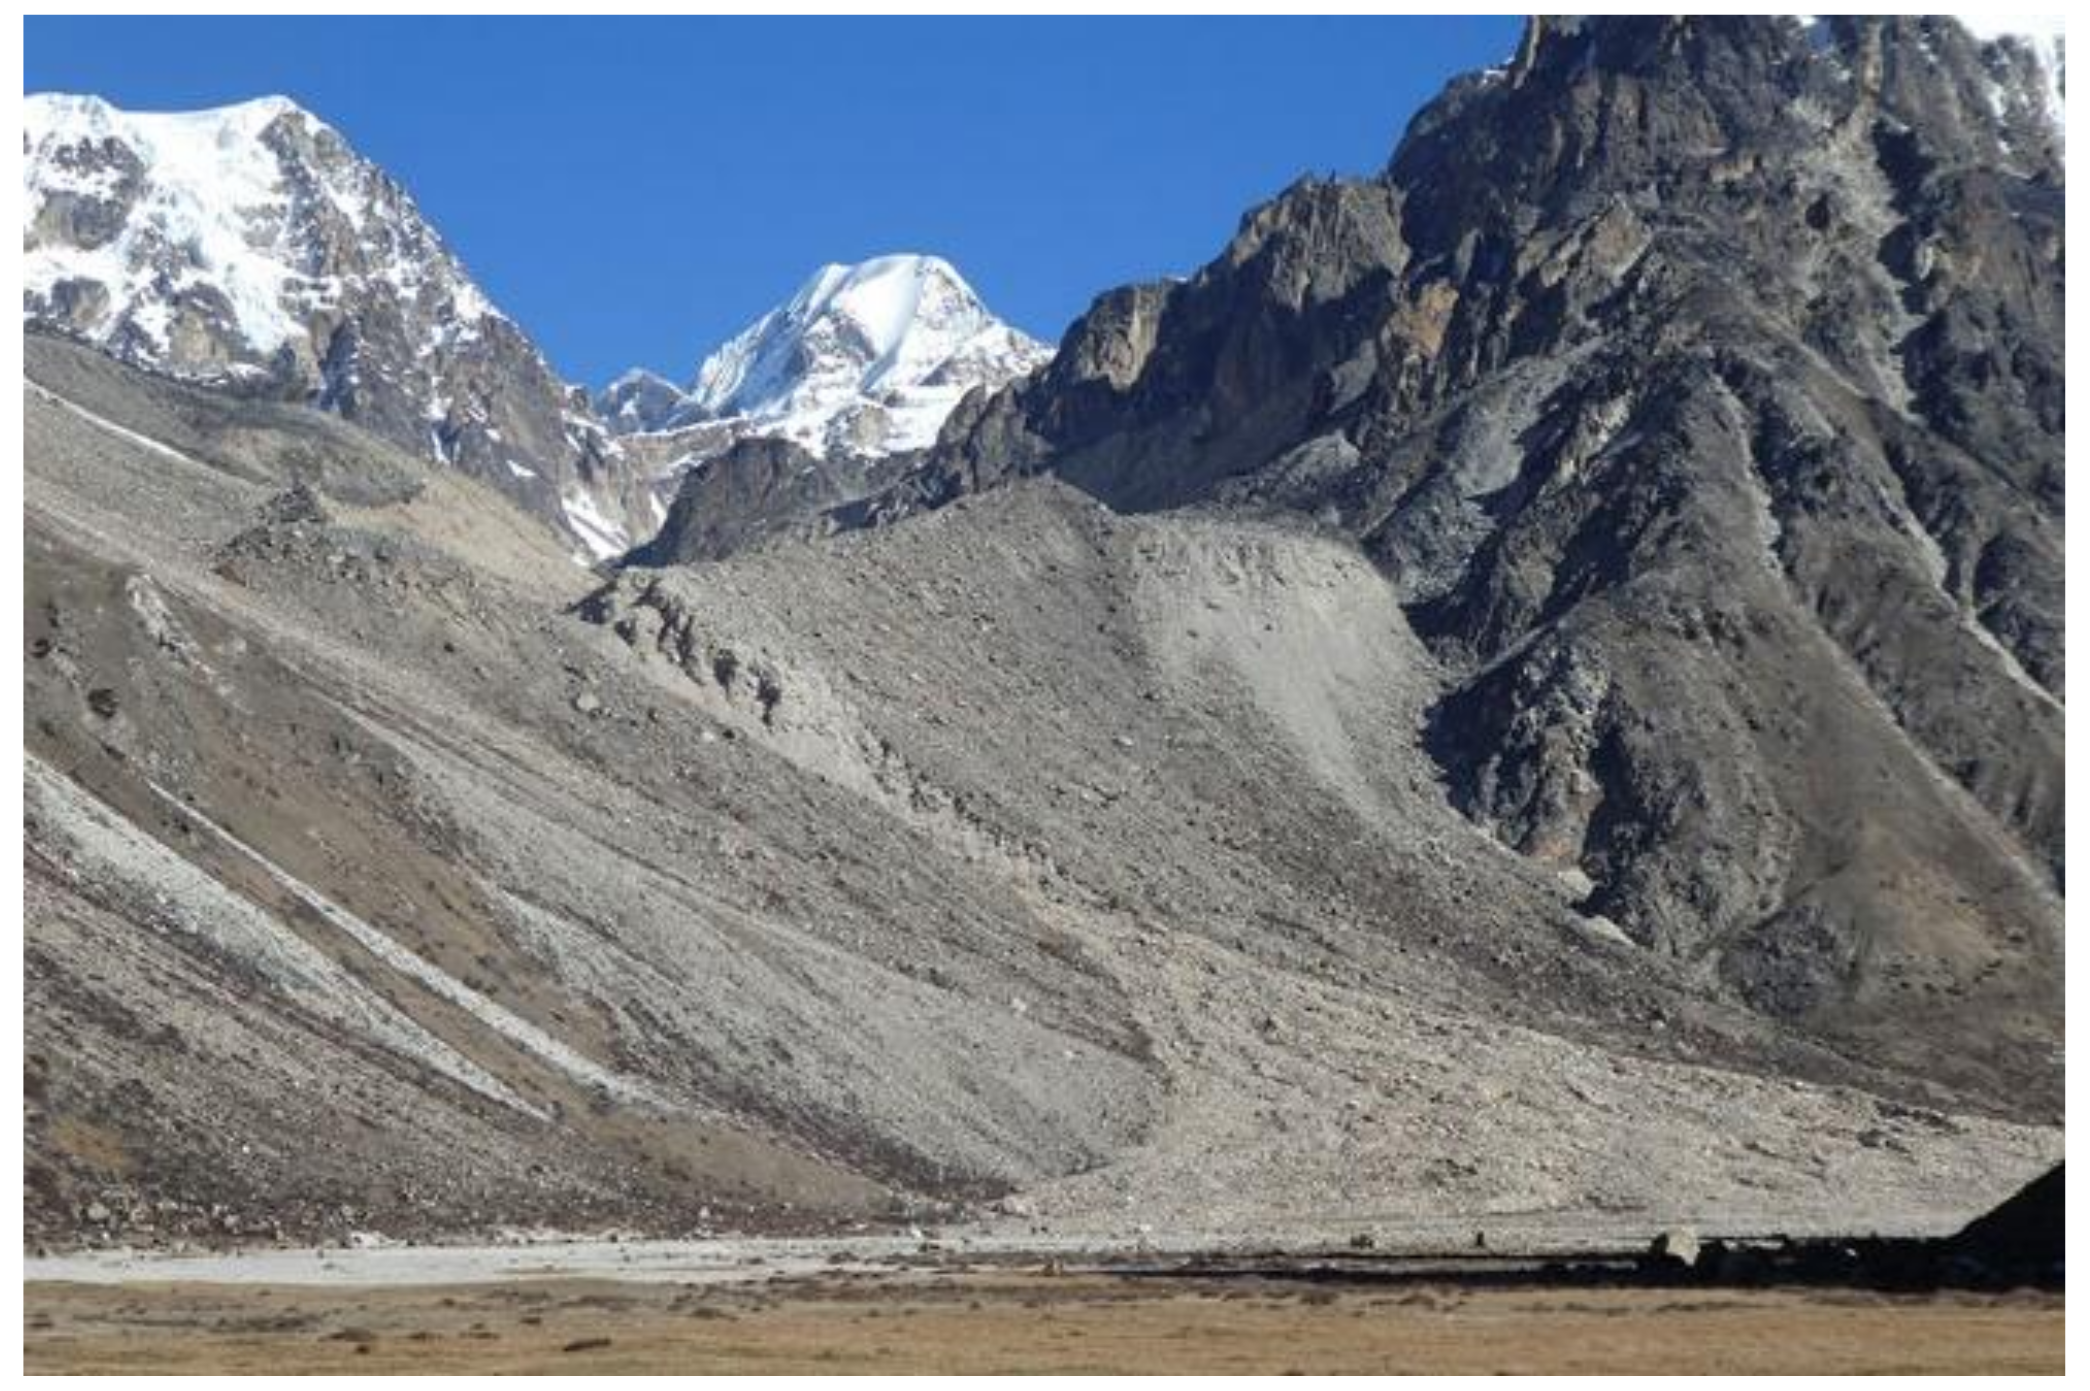
Figure 3), and Lhonak glacial lakes (
Figure 4) (see:
Figure 1). Potential landslide features on the Nangama lateral moraines of concern to other scientists (e.g., Reynolds International 2019 [
20]) were noted, photographed, and described from a field perspective. All interviews were recorded electronically and transcribed by hand within several hours.
Remote Sensing: A remote sensing analysis using CORONA and Landsat 2 and 5 data platforms was conducted after the field phase to determine if flood-related landscape features could either support or challenge the oral reports of contemporary and historical flood occurrence. Analyses were based upon the before and after presence or absence of erosional and depositional features, breached terminal moraines, lake volumes, visible water lines, and comparative time lapse imagery. Likewise, oblique repeat photography was used in the case of Nangama glacial lake to better understand the magnitude of the flood and its impacts, thanks to the availability of historic aerial photography [
2,
21].
CORONA data for the period of 1962–1980 were used with a spatial resolution of 2.76 m to 10 m in the panchromatic band [
22] to identify possible historical GLOFs and for mapping glacial lakes during the 1960s. Landsat and Sentinel-2 images were also used for GLOF analysis and to prepare an inventory of the glacial lakes from 1975 to 2018. The objectives of the remote sensing component were to (a) inventory all glacial lakes within the study region, (b) determine any changes in lake development that had occurred since the 1960s, and (c) identify those lakes that had likely experienced a GLOF, based upon the presence of geomorphic features such as erosion, deposition, breached terminal moraines, changes in lake volume, and others.
CORONA images are single band images without geographic referencing, and geometric correction was therefore required for adequate mapping of the lakes. Geometric correction of CORONA images is difficult, as calibration parameters (e.g., fiducial coordinates, lens distortion coefficients, and principal point coordinates) are not available [
23,
24,
25]. Image-to-image registration was therefore applied for geometric corrections necessary for the present study.
The imagery was registered to orthorectified Sentinel-2 images of 10-m spatial resolution using clear and stable ground features as ground control points [
25]. Between 10 and 20 manually selected control points were used for geo-referencing and geometric correction purposes. Thereafter, the CORONA images were projected to Universal Transverse Mercator (UTM) map coordinates (Zone 45, WGS 1984) of Sentinel-2 images, where second- and third-order polynomial transformations were applied. The accuracy of the geometrically corrected images was considered to be within acceptable levels (i.e., with a horizontal displacement of <10 m), and for the purposes of mapping glacial lakes and for determining past GLOF events.
For the glacial lake inventory, satellite images from different sensors and different spatial resolutions were used to prepare a long-term decadal inventory of the glacial lakes from 1964 to 2018. The CORONA images used were of single band, thus automatic methods using band metrics (such as the Normalized Difference Water Index) could not be applied. Automatic delineation of the glacial lakes caused significant false classification of the lakes [
26], and manual editing improved the results significantly [
27,
28,
29]. Manual delineation of the glacial lakes was therefore carried out to prepare their accurate mapping. The boundaries of lakes were checked visually within the study area, including all pure pixels of water bodies and about half of the pixels that surrounded the pure pixels. All glacial lakes were mapped with a threshold of 5000 m
2 for making consistent decadal inventories. However, a threshold of 500 m
2 was also applied separately for the year of 2018 in order to achieve the latest high-resolution inventory of glacial lakes with the higher spatial resolution (10 m) Sentinel-2 images. Past GLOF activity, and specifically those before the 1980s, was documented using CORONA images (KH-4, KH-4A, KH-4B, and KH-9). Landsat images were also used as supplementary data for the post-1980s period (after 1975). Results of the interviews regarding past GLOF activity were of great value in the preliminary identification of likely GLOF source points, e.g., map symbols 1–4 and 7 on
Figure 1. Erosion and depositional features, river bed conditions, and terminal moraine conditions were used to pinpoint possible GLOF events.
Numeric Modeling: Because the Nangama GLOF—triggered by an avalanche that entered the lake and generated a large impulse wave—was among the largest of the GLOF events to have occurred in the region, a numerical simulation of the flood was performed in order to develop estimates related to triggering mechanisms, wave amplitude, and total flood volume. The Basic Simulation Environment for Computation of Environmental Flow and Natural Hazard Simulation (BASEMENT) model [
30] was used for this purpose, incorporating a range of direct measurements of the Nangama terminal moraine and breach characteristics that included feature height, width, altitude, high water marks, glacier terminus condition, and new potential flood triggers. BASEMENT is a hydrodynamic model based on the 2D shallow water equations with additional capabilities for sediment transport and erosion modeling [
30]. Validation of BASEMENT’s wave generation and propagation procedure was achieved by additionally employing an empirical model (the “Heller-Hager model” [
31]), which uses basic morphological attributes of the lake and surrounding slopes to characterize avalanche-induced impulse waves in lakes. BASEMENT’s capabilities make it ideal for GLOF modeling [
32], and a combination of BASEMENT simulations with calibration via the Heller-Hager model has been carried out on a variety of GLOFs, both for historic reconstruction and to evaluate future hazard [
33,
34,
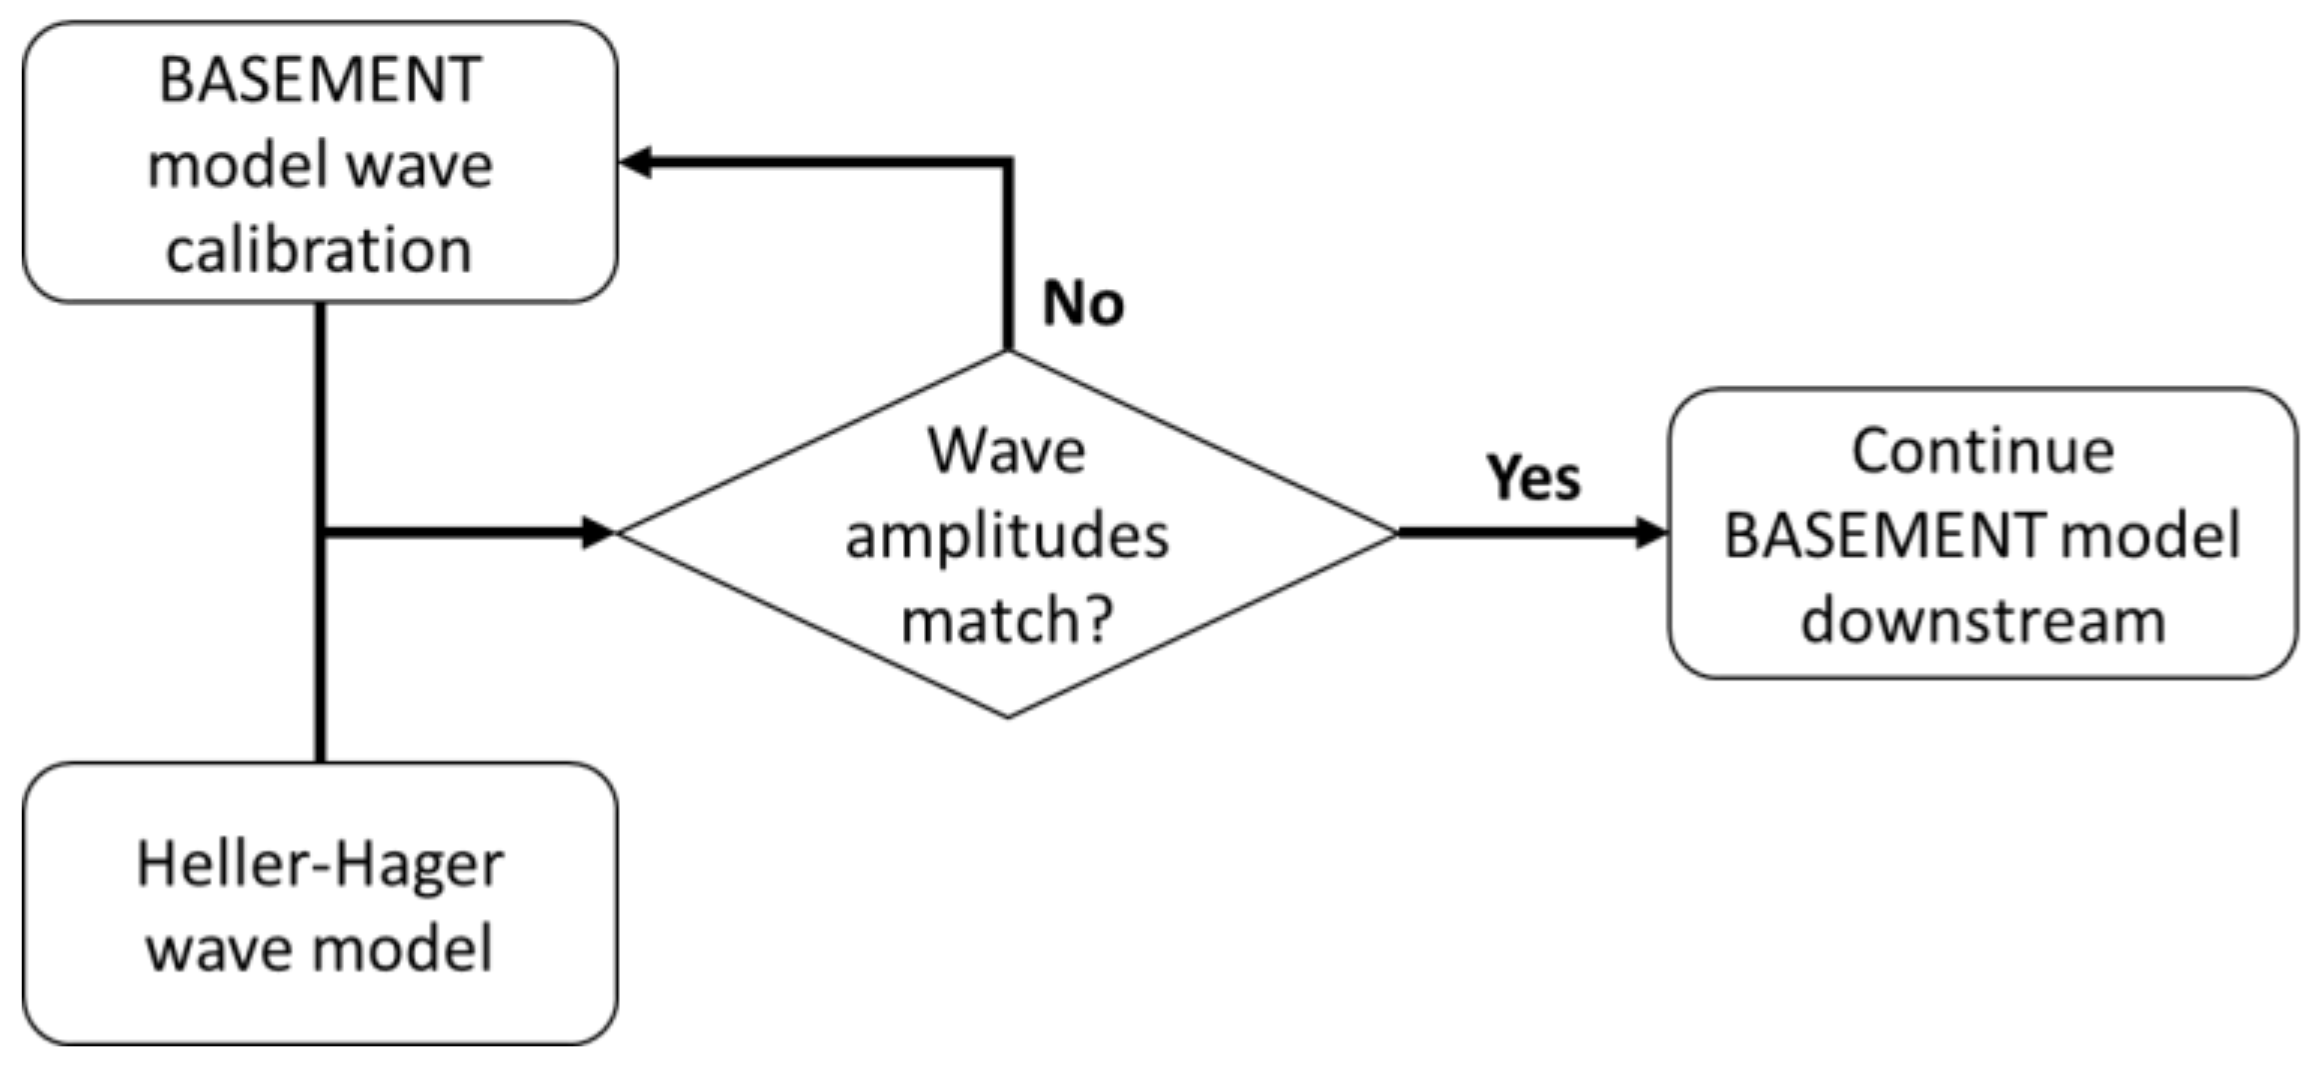
35]. The model process chain followed the following steps: (1) using the Heller-Hager model, estimating the mass of the avalanche given the wave height and morphology of the lake; (2) iteratively setting inflow conditions for the BASEMENT model to characterize the transfer of energy from the avalanche to the wave, until the wave amplitude matched that of the Heller-Hager model; (3) continuing BASEMENT model downstream under various sediment transport models to characterize moraine erosion and downstream discharge.
Figure 5 depicts this process chain in a brief flow chart.
A digital elevation model (DEM) of the region was taken from the High Mountain Asia 8-meter DEM Mosaics Derived from Optical Imagery, Version 1 [
36], which has an absolute horizontal and vertical accuracy of <0.5 m. Data gaps were filled using the mean of neighboring cells within an eight-cell radius; sinks of less than 10 m depth were also filled to prepare the DEM for hydraulic modeling. Because the DEM was produced from imagery taken in 2017, and due to a lack of bathymetric data for Nangama Lake, the DEM had to be manually adjusted to recreate the morphology of the moraine and lake pre-GLOF. Judging from a combination of aerial imagery before and immediately after the GLOF [
2], recent imagery [
37], and field data collected by the authors, it was determined that the lake level was approximately 13 ± 1 m higher in 1980 than its current level, and that the terminal moraine was approximately 20 ± 2 m higher than the current lake level, and thus approximately 7 m above the lake in 1980. The DEM estimated the current lake level at 4881 m.a.s.l.; therefore, the elevations of the pre-GLOF lake and terminal moraine were manually adjusted in the DEM to 4894 m.a.s.l. and 4901 m.a.s.l., respectively. Lake depth was estimated from an empirical analysis of area-depth-volume relationships developed by Cook and Quincey (2015) [
38]; given a lake level of 4894 m.a.s.l., the pre-GLOF area of the lake was approximately 1.1 km
2 and the average depth was estimated at 38 m. While this is a rough estimate (±10 m for a lake of Nangama’s size), the Heller-Hager model produced very similar wave heights (8.0 m versus 8.3 m amplitude for a depth of 28 m or 48 m, respectively) and thus 38 m was deemed acceptable for modeling purposes. Further uncertainty in the lake depth was considered by estimating bathymetry in two ways—either the entire lake was set to a depth of 38 m, or the main body of the lake was set to 38 m and the last ~420 m before the terminal moraine sloped upwards gradually to a depth of 6 m immediately upstream of the terminal moraine. This was done to investigate potential effects of varying bathymetry on wave runup at the terminal moraine. Finally, once the DEM was finalized, it was converted into a triangulated irregular network mesh in QGIS [
39] for use in BASEMENT.
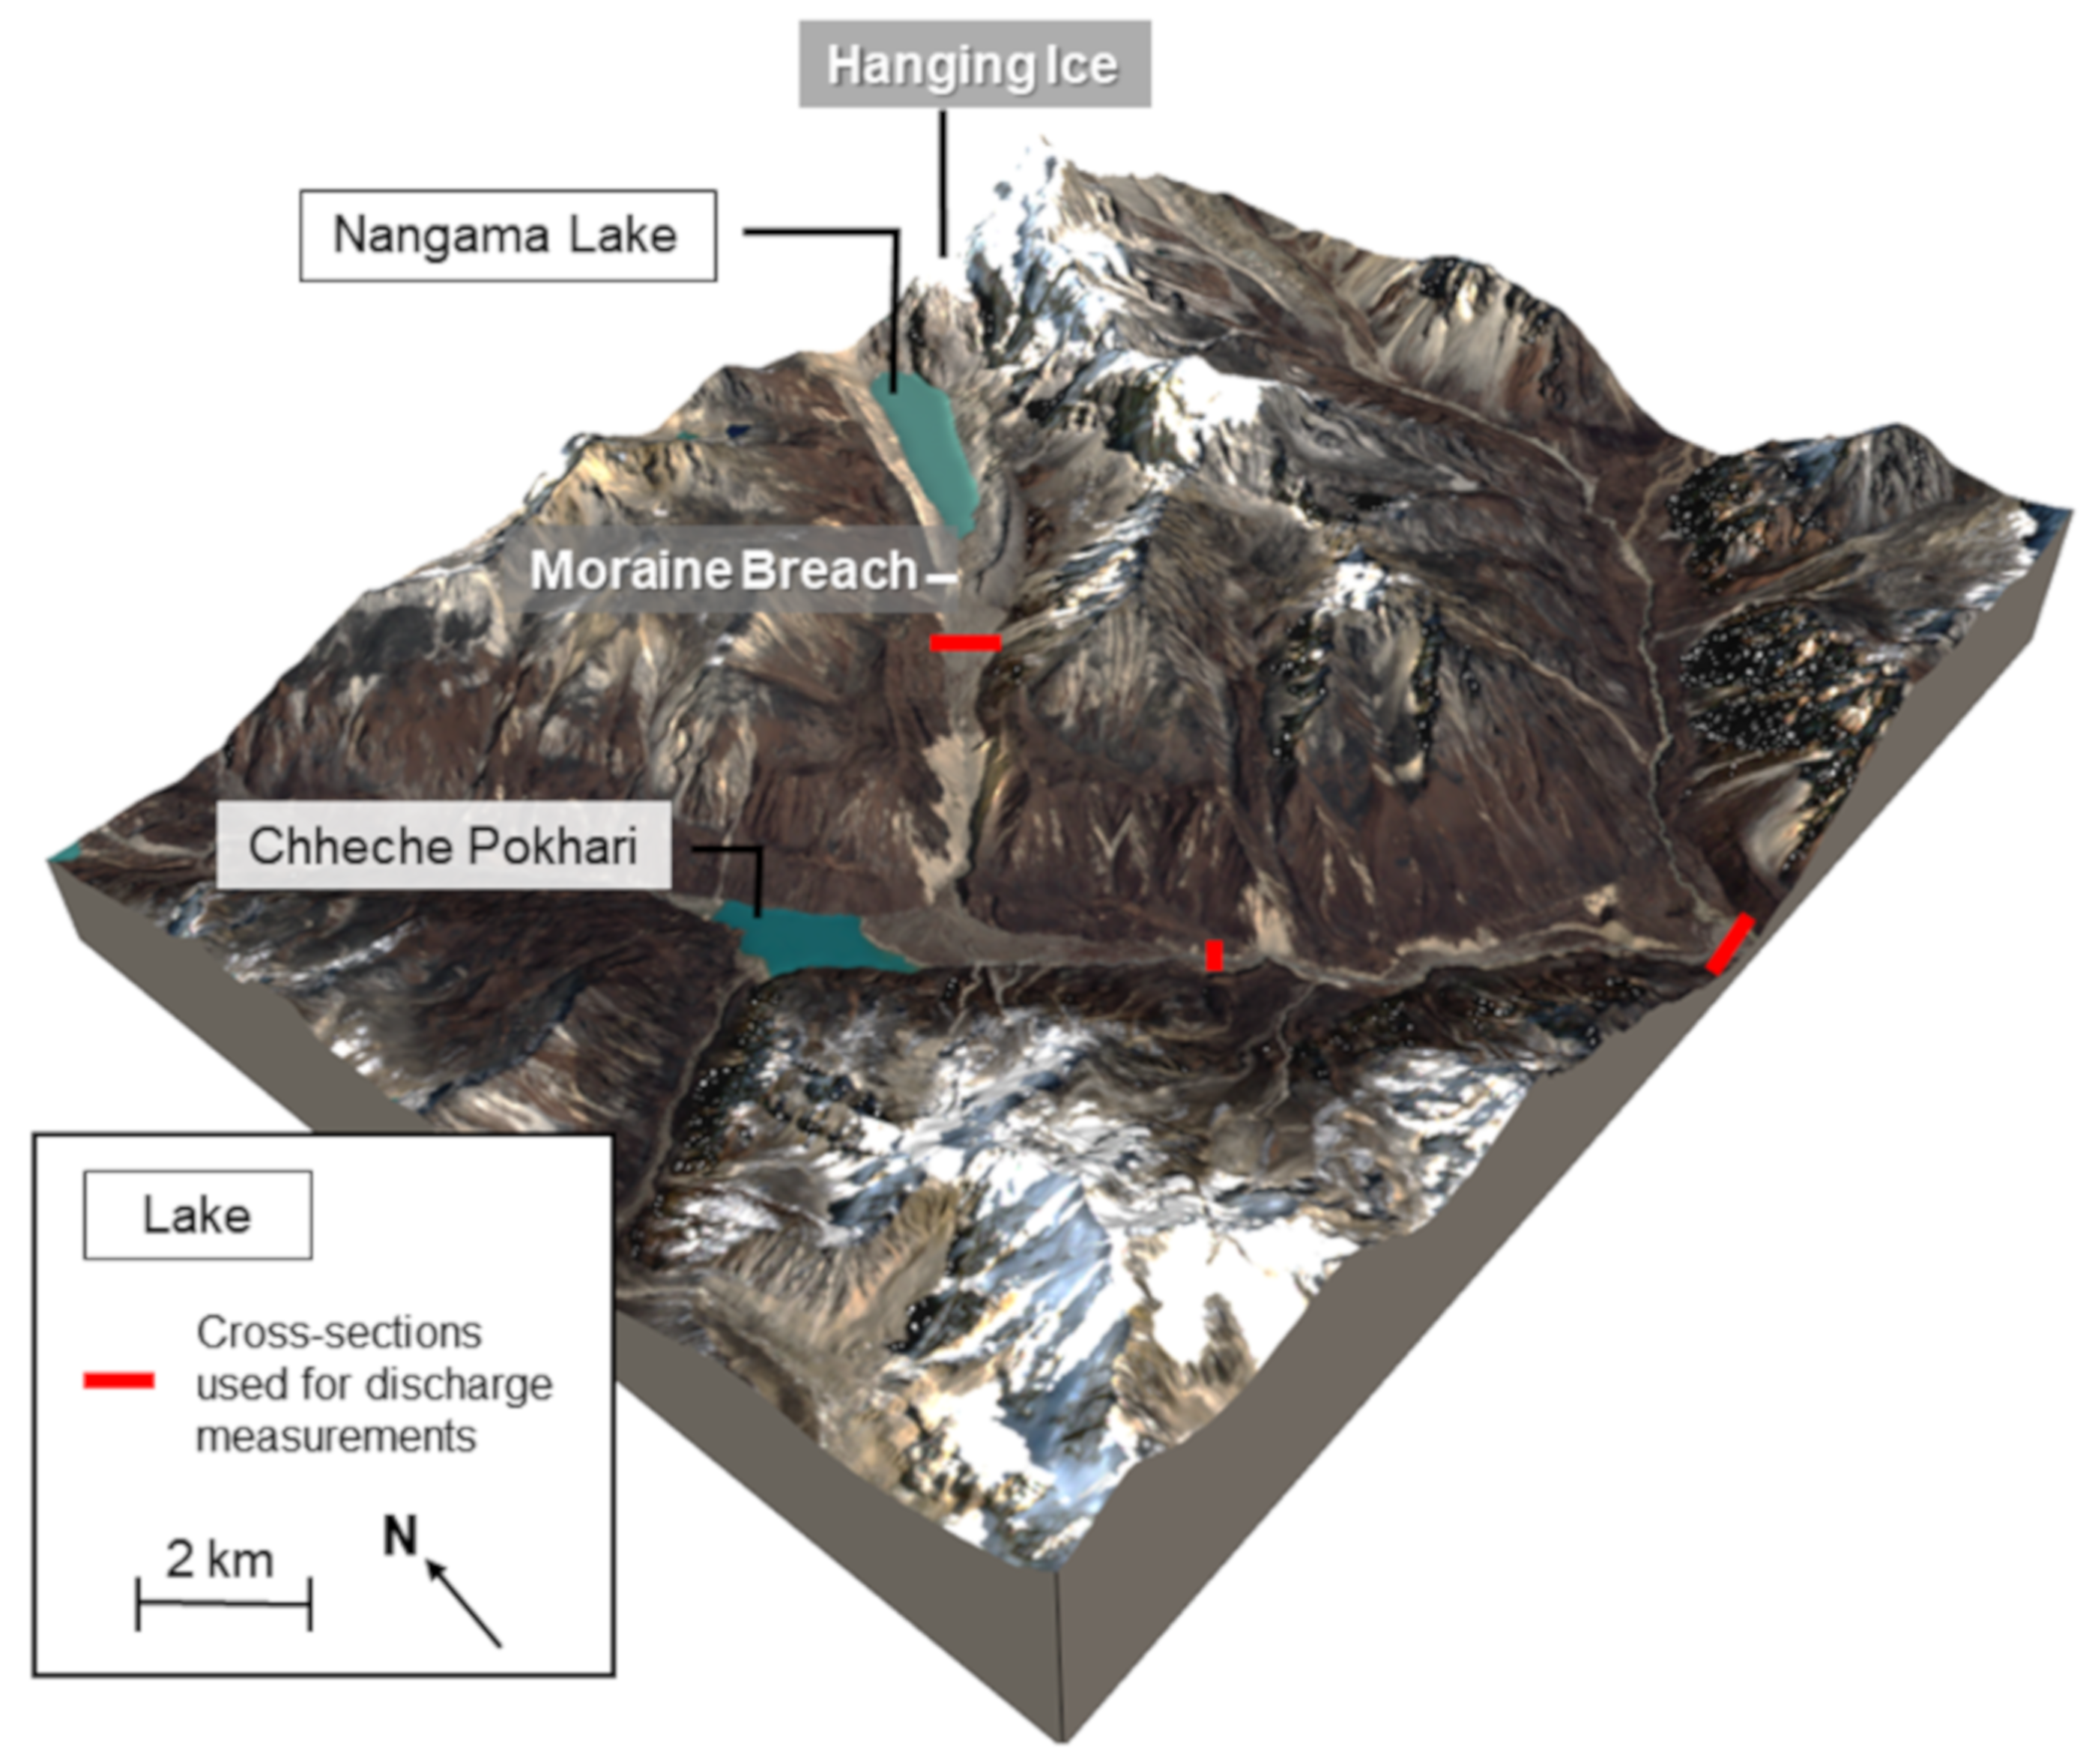
Very little is known about the avalanche that triggered the GLOF. The volume of debris carried downstream suggests it was very large, as do reports of “fountains” (most likely wave crests) visible over the moraines by yak herders in the area following the avalanche. Judging from imagery and field visits, there was no evidence of a wave overtopping the lateral moraines, suggesting a wave height under 10 m but greater than 7 m to overtop the terminal moraine. Assuming the avalanche started from hanging ice approximately 1 km northeast of the lake (
Figure 6 and
Figure 7), the Heller-Hager model estimates an avalanche volume of 800,000 m
3, based on the height of the ice and slope angle between the ice and lake, to generate a wave height of 8 m (see
Supplementary Materials for calculations). Lacking firsthand evidence, the rate of entry of the avalanche into the lake was adapted from a similar modeling study of Imja Tsho, a glacial lake 90 km west of Nangama [
35]. The entry time series from Imja Tsho was based on a snow and ice avalanche of approximately 720,000 m
3 with a density of 1000 kg m
−3. The avalanche material at Nangama was estimated to have a slightly higher rock and debris content (~75% snow and ice and ~25% rock and debris); assuming a density of 1000 kg m
−3 for ice and snow-dominated avalanches [
33,
40] and a density of 2000 kg m
−3 for rockslides [
41,
42] yields an estimated density of 1250 kg m
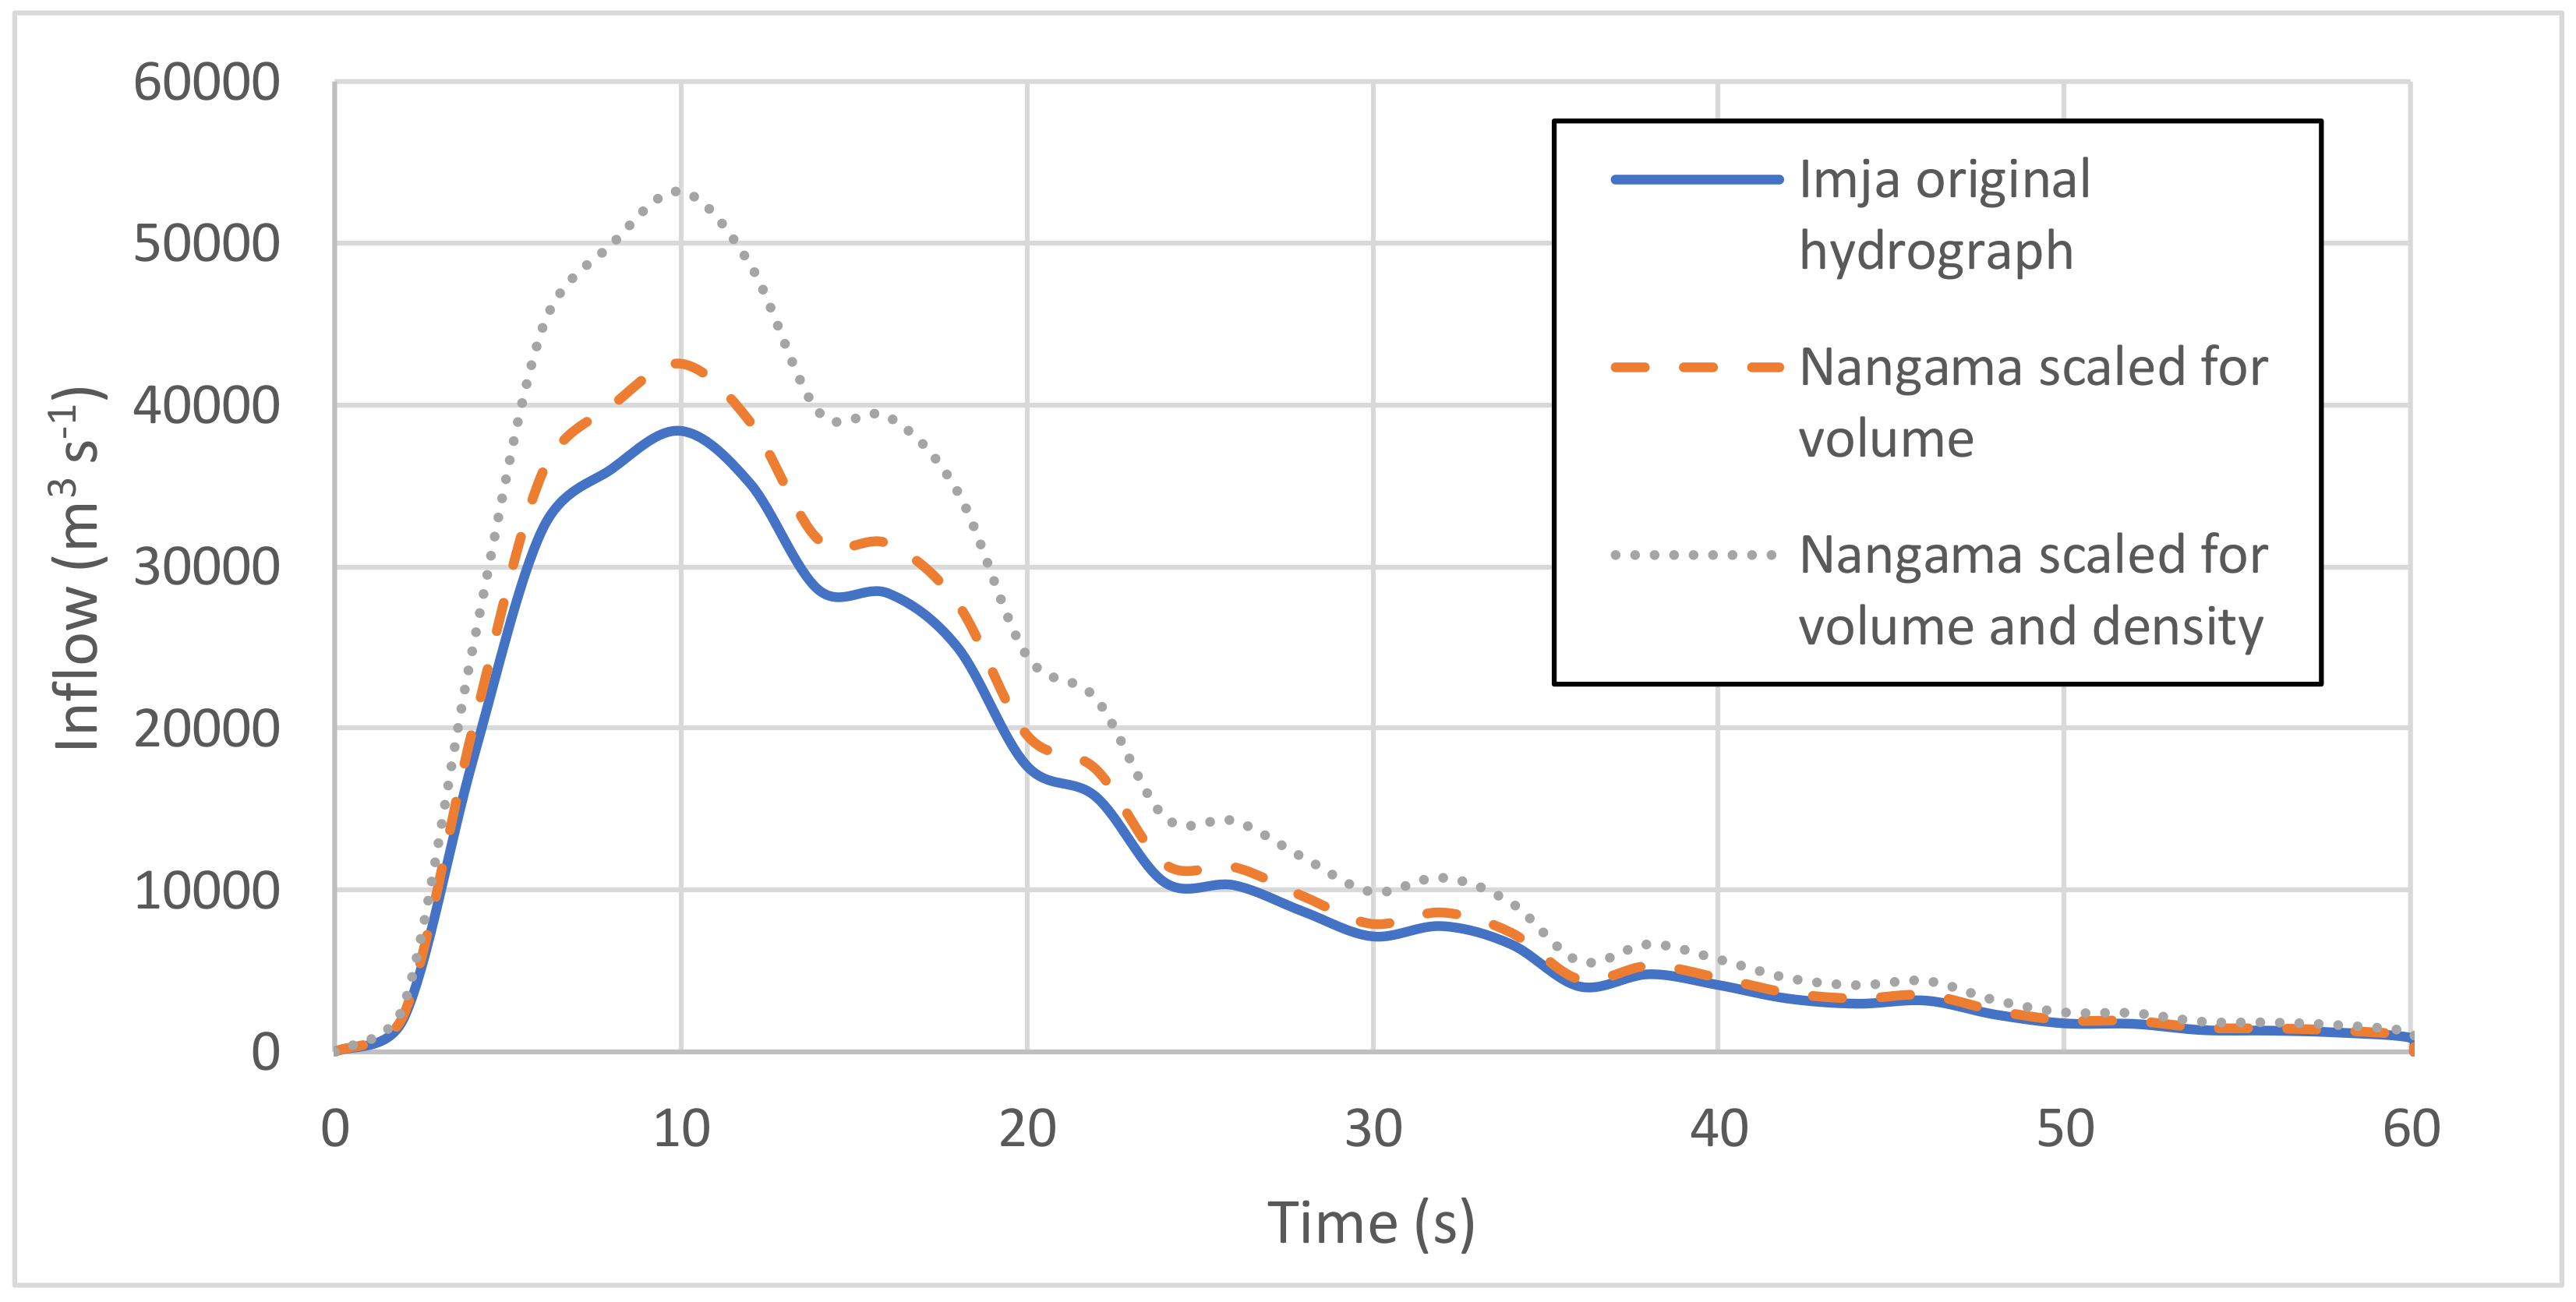
−3 for the Nangama avalanche. Because BASEMENT only accepts water as inflow, this difference in density was considered by simply increasing the Imja Tsho entry rate by a factor of 1.25, in addition to another scaling factor of 1.1 to account for the ratio of the Nangama avalanche’s volume to that of Imja Tsho’s (
Figure 8).
Characteristics of the moraine material were estimated from two studies. Density and porosity (1800 kg m
−3 and 30%, respectively) were taken from the Imja Tsho study [
35]; however, the grain sizes taken from Imja were deemed to be too fine to be used in this study; hence, the grain size distribution was instead taken from an inventory of glacial lakes in the Indian Himalaya ([
32];
Table 2) that had performed well in recreating previous Nepal GLOFs. Despite uncertainty in the actual grain size distribution, a similar GLOF modeling study in the Barun Valley [
34] found little difference in simulated moraine erosion between the grain size distributions listed in Worni et al. (2013) [
32]. No melt ponds or other evidence of an ice core were found on the moraine, suggesting it was comprised solely of debris. Previous studies suggest that the altitude of the moraine is located below the permafrost zone [
14,
43]. BASEMENT characterizes sediment transport using the Meyer-Peter and Müller (MPM) equations [
30], which estimate suspended and bed load fluxes by calculating shear stresses within the flow through a modified Shields parameter [
43]. Soil mechanics parameters (i.e., critical slope angles for dry, wetted, and deposited sediment) required by the MPM equations were estimated from a number of studies in the Nepal Himalaya and elsewhere based on both soil samples and visual observations of slopes [
35]. The original MPM equations were designed for a single grain size and tend to overestimate erosion, since they do not consider hiding or armoring processes, whereas a revised form of the MPM equations (MPM-Multi) accounts for both multiple grain sizes and hiding and armoring. Considering the wide range of uncertainties within this study, the BASEMENT simulations were run using both sediment transport models to estimate upper and lower bounds for erosion and downstream discharge.
4. Results
Oral history: The preliminary results of the oral history component suggested that at least five GLOFs had occurred in the region, i.e., that were within the living memory of some of its older residents. This is consistent with what Berkes (2007) [
44] calls "social memory", and its significance is especially high in "traditional communities" where other forms of institutional memory (e.g., news, film, archives, research) are limited or non-existent. In fact, there are a number of examples within the disaster risk field of communities developing adaptive measures based upon the experiences of past events (e.g., hurricane, tsunami, or floods), essentially developing a social memory that can be used to avoid or mitigate the impacts of future events [
45].
Figure 1 and
Table 3 present a list of GLOFs, date of occurrence, source, and location as recorded by the oral testimony component. In addition to the 1980 Nangama GLOF (map symbol 3), participants identified an additional five GLOFs that had occurred in the region since 1921 (map symbols 1, 2, 4, 5, and 8). Map symbols 6 and 7 refer to two additional flood events that were identified by the remote sensing component, but not mentioned by informants.
Several key respondents reported that they had witnessed or heard about “many small floods in the region” occurring in their lifetimes, but that the 1963 Olangchun Gola 2 (map symbol 4), 1968 Olanchun Gola 1 (map symbol 5), Gola 2 (map symbol 4), and 1980 Nangama GLOFs (map symbol 3) were by far the largest. One lodge owner in the village of Gobatar, who lost his home and property in the 1963 Olangchun Gola 2 flood, reported:
“…the flood could be felt (from the heavy winds) and heard long before it arrived, with the land ‘shaking like an earthquake’ that made the livestock cry in fear, and rattled the pots and pans in the houses.”
At the Olangchun Gola
gompa, the flood was reportedly preceded by:
…“a cloud of dust, then the flood along with a muddy, gunpowder smell,” accompanied by “sounds like thunder…”
These descriptions and characteristics are similar to those documented by eyewitnesses for more recent floods in the Barun valley [
34] and Khumbu regions [
46] to the west. Interestingly, several respondents attributed the “small rocks smashing against each other” heard during the 1963 Olangchun Gola 1 flood (map symbol 5) as the cause of a forest fire near the junction of the Takpa Khola and Tamor rivers. The fire was reportedly caused by sparks created by the rocks striking one another, and was a phenomenon of large floods that was mentioned by other informants as well.
Eyewitnesses to the 1980 Nangama flood were grazing their yaks in what had been three distinct pasture areas covering approximate 4.5 km
2 below the terminal moraine. They reported hearing a deafening noise and a large dust cloud descending from the lake area, followed by a wave that rose above the high-water mark, “like a fountain”, and accompanied by “strange sounds”. Water then began to slowly emerge from the terminal moraine, growing larger and larger by the minute in terms of discharge. The flood that followed was “big, muddy, with stones clashing against each other”. Floodwaters periodically lowered and became clear of debris, only to surge again sometime later, indicating the pulse-like nature reported for GLOFs elsewhere [
34]. Chheche Pokhari, located at the foot of the Nangama valley, was formed from the blockage of the Pabuk Khola by flood sediments and debris (
Figure 1).
Another interpretation of the events leading to the Nangama GLOF is that the lake had been inhabited by a local deity or spirit (
Khangba), similar in appearance to a giant turtle, who became angry with humans and caused GLOFs and other natural disasters. The presence of spirits at high altitude lakes, springs, and other natural features is a common belief among Himalayan communities influenced by Bón (animist) culture, including the belief that the spirit will depart from the lake when human activities disrupt or defile it in some way (see: Bjønness (1984) [
47] and Stevens (1994) [
48] for examples from Khumbu, and Sherry and Curtis (2017) [
49] for similar examples from Rowaling). In the case of Nangama, just before the flood “strange sounds” were heard that presumably came from the
Khangba, which then floated down valley in the flood waters until it reached the bridge at Yangma village. Refusing to go under the bridge, the turtle’s body blocked the flood water, resulting in a temporary lake upstream that damaged hillslopes and grazing land, but which drained when it decided to continue downriver. The flood was also linked by religious leaders to the fact that “modern people have become wicked, so bad things happen”, a frequently heard lament and correlation in highland Nepal that links greed, the erosion of traditional practices, and lack of respect for gods, deities, and spirits with negative consequences, both physical (e.g., earthquakes, floods) and social (e.g., death, suffering) [
48,
49,
50].
Respondents linked the cause of the 1963 and 1968 Olangchun Gola floods (map symbols 5 and 4) to icefall from Chhochenphu Himal (6260 m) (
Figure 1), which fell into Tiptola glacial lake and caused a surge wave that then breached the terminal moraine. Most respondents agreed that other floods could be expected to come in the future, although it was frequently added that it is “better not to talk about such things”. People’s reluctance to discuss negative phenomena (e.g., floods, death, misfortune) is common among Buddhist-Bón communities throughout the Himalayas, as this is viewed as representing an invitation to their actual occurrence [
51]. Other informants, however, expressed little concern about the possibility of future floods.
While early reports claimed that the 1980 Yangma (Nangama) flood (map symbol 3) was responsible for destroying “….all the houses in Olangchung Gola village” [
1], it was in fact the 1963 Olangchun Gola 1 flood (map symbol 5) that caused the damage to the village. Two different interpretations regarding the causes of the destruction were given: (a) rapid undercutting of the bank caused the collapse of the banks upon which approximately 45 houses within lower Olangchun Gola were situated, and (b) downstream blockage by debris caused the formation of a temporary lake, which rose to an elevation sufficient to destroy the houses before eventually draining. As the total number of houses within upper and lower Olangchun Gola prior to the event numbered approximately 100, with a population of 500, the flood destroyed nearly half of the settlement and represented a major catastrophic event. Most of the people who lost their homes and property moved to Kathmandu, i.e., if they were relatively wealthy and had the means to do so. Informants from all flood events tended to be aware of the floods fatalities only within their immediate area (e.g., two children were killed downstream at Jaritar, two people were killed near Jongin, two to three cattle from Olangchun Gola perished), but had little knowledge regarding the flood’s cumulative damage within the watershed.
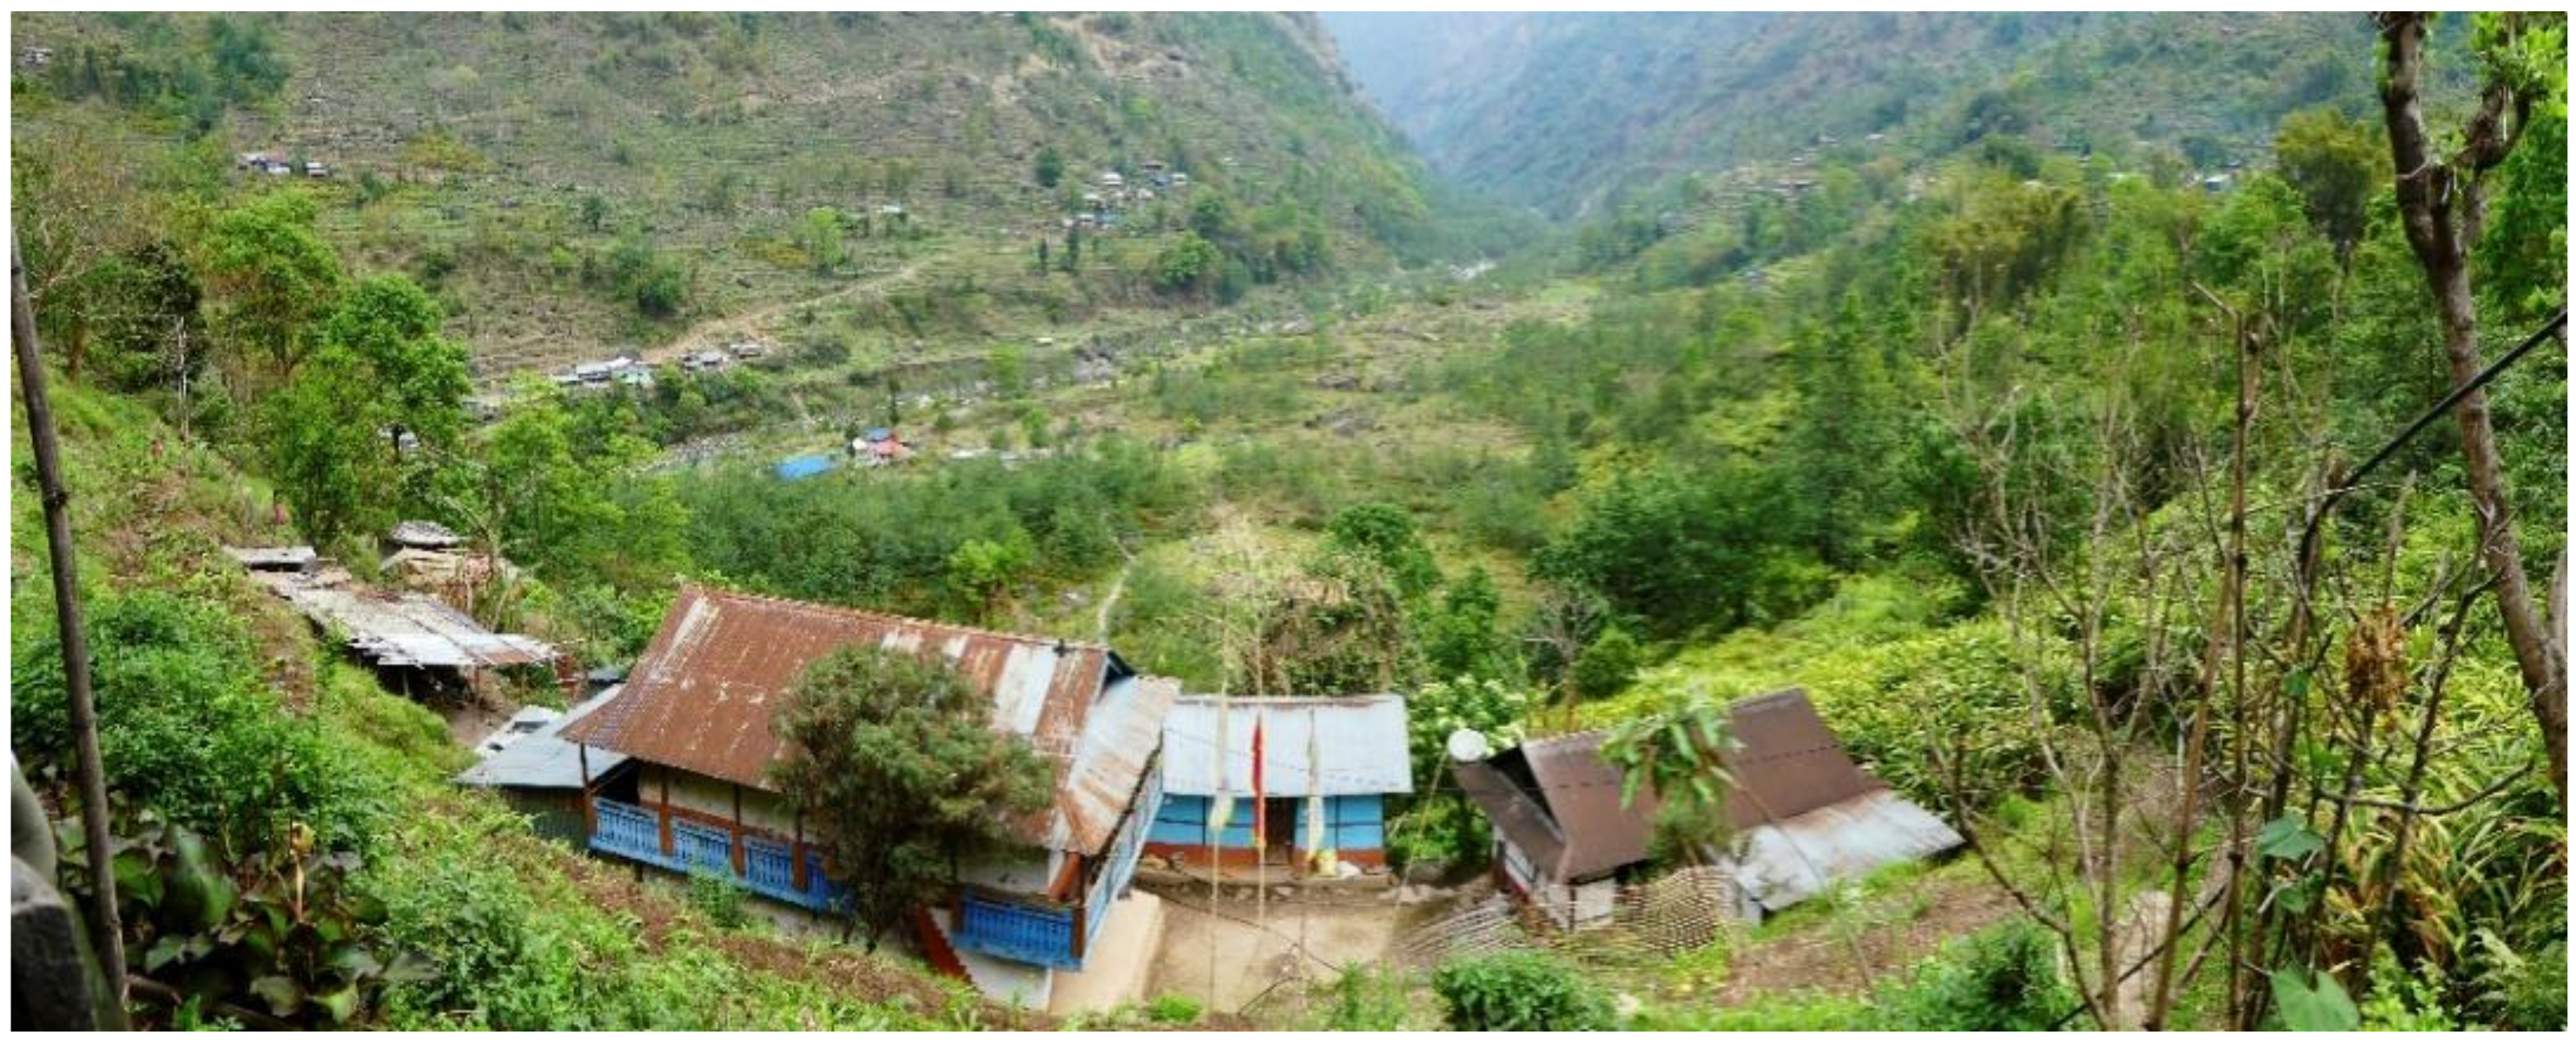
Other informants in the downstream village of Tapetok also confirmed that the 1963 Olangchun Gola 1 flood was by far the largest in their memory, nearly reaching their houses some 100 m above the river (
Figure 9). Of additional interest is that while the 1963 flood destroyed cropland situated upon river terraces, leaving behind a layer of rubble, the 1980 Nangama flood (map symbol 3) left behind thick layers of black soil, which informants philosophically attributed to the fact that “some floods bring rocks, and some floods bring fertile soil”.
The 1921 Ghunsa GLOF (map symbol 8) is of interest because, 79 years after its occurrence, it is still frequently referred to by people throughout the Tamor watershed. One 88-year-old informant at Ghunsa said that his ancestors had come from Tibet and settled at Khangpachen some 500 years ago, where they farmed and herded yak until the flood destroyed all of their fields in 1921. This forced his grandfather, whose wife was among the fatalities of the flood, to move to Ghunsa, where the family has lived ever since.
This informant also reported that another small flood of the Ghunsa river had occurred in “either August or September” of 2011, the approximate time that a deadly earthquake (6.9 magnitude) centered in the Kanchenjunga region occurred that killed an estimated 111 people [
52]. The source of the flood is unknown, but may have been a glacier outburst flood from the Ramdam or other glacier to the northeast, similar to those reported for the Lhotse glacier in Khumbu for the years 2015 [
9] and videoed in 2016 [
53]. As opposed to GLOFs, which in the Himalayas are usually triggered by catastrophic ice avalanches and resultant moraine dam breaching and collapse [
4,
54], water sources from glacier outburst floods originate within the glacier itself, i.e., from its inner system of englacial conduits and supraglacial ponds that are often inter-connected [
53,
55,
56,
57,
58].The sudden and rapid drainage of a large meltwater pond can trigger the release of water stored within conduits and other surficial ponds located further down the glacier, collectively forming a potentially dangerous flood downstream (see:
https://www.youtube.com/watch?v=UM0UnoDGEAc).
In general, however, little concern was expressed by informants regarding future GLOFs in the region. The one exception was the Nupchu Pokhari above Khangpachen (
Figure 1), singled out by informants as a growing and potentially dangerous glacial lake that should be avoided (
Figure 1).
In summary, a total of six GLOF events within the Tamor watershed were remembered by informants as having occurred during the past 100 years. Five out of six of these events have occurred since 1963, the sixth having occurred in 1921.
Remote Sensing: The results of the project’s interview component suggested that a surprisingly large number of GLOFs had occurred in the Kanchenjunga region over the past 60 years, events that had not been recorded in either the scientific literature or popular press. The pattern reflects that of glacial lake development and GLOF frequency found elsewhere in the Himalayas, usually linked to contemporary changes in local, regional, and global climate [
59]. In this section, we examine the results of the project’s remote sensing component, which used comparative satellite imagery of the project region to identify geomorphic indicators of possible and recent GLOF activity. The objective of the exercise was to use the remote sensing results to either support or challenge the claims of regional GLOFs documented during the interview process.
Glacial Lake Inventory:
Table 4 and
Table 5 show the results of the glacial lake inventory and trend assessment component. As can be seen, within the six sub-basins of the Kanchenjunga watershed region there are, at present, a total of 138 supraglacial lakes, 3 proglacial lakes, and 232 lakes unconnected to glaciers, which also can be seen in the
Figure 1. The number of lakes greater than 5000 m
2 in size has grown significantly in the past half century, from 31 in 1964 to 157 in 2018 (
Table 4). For comparison, in 1998 Watanabe et al. (1998) [
2] documented 118 lakes in the region, dividing them into two types: (a) “lakes with no present glaciers upstream” (fed by rainwater, located between 3960 m and 5460 m) and (b) “…lakes on and by present glaciers” (fed by glacier meltwater, located between 4836 and 4996 m).
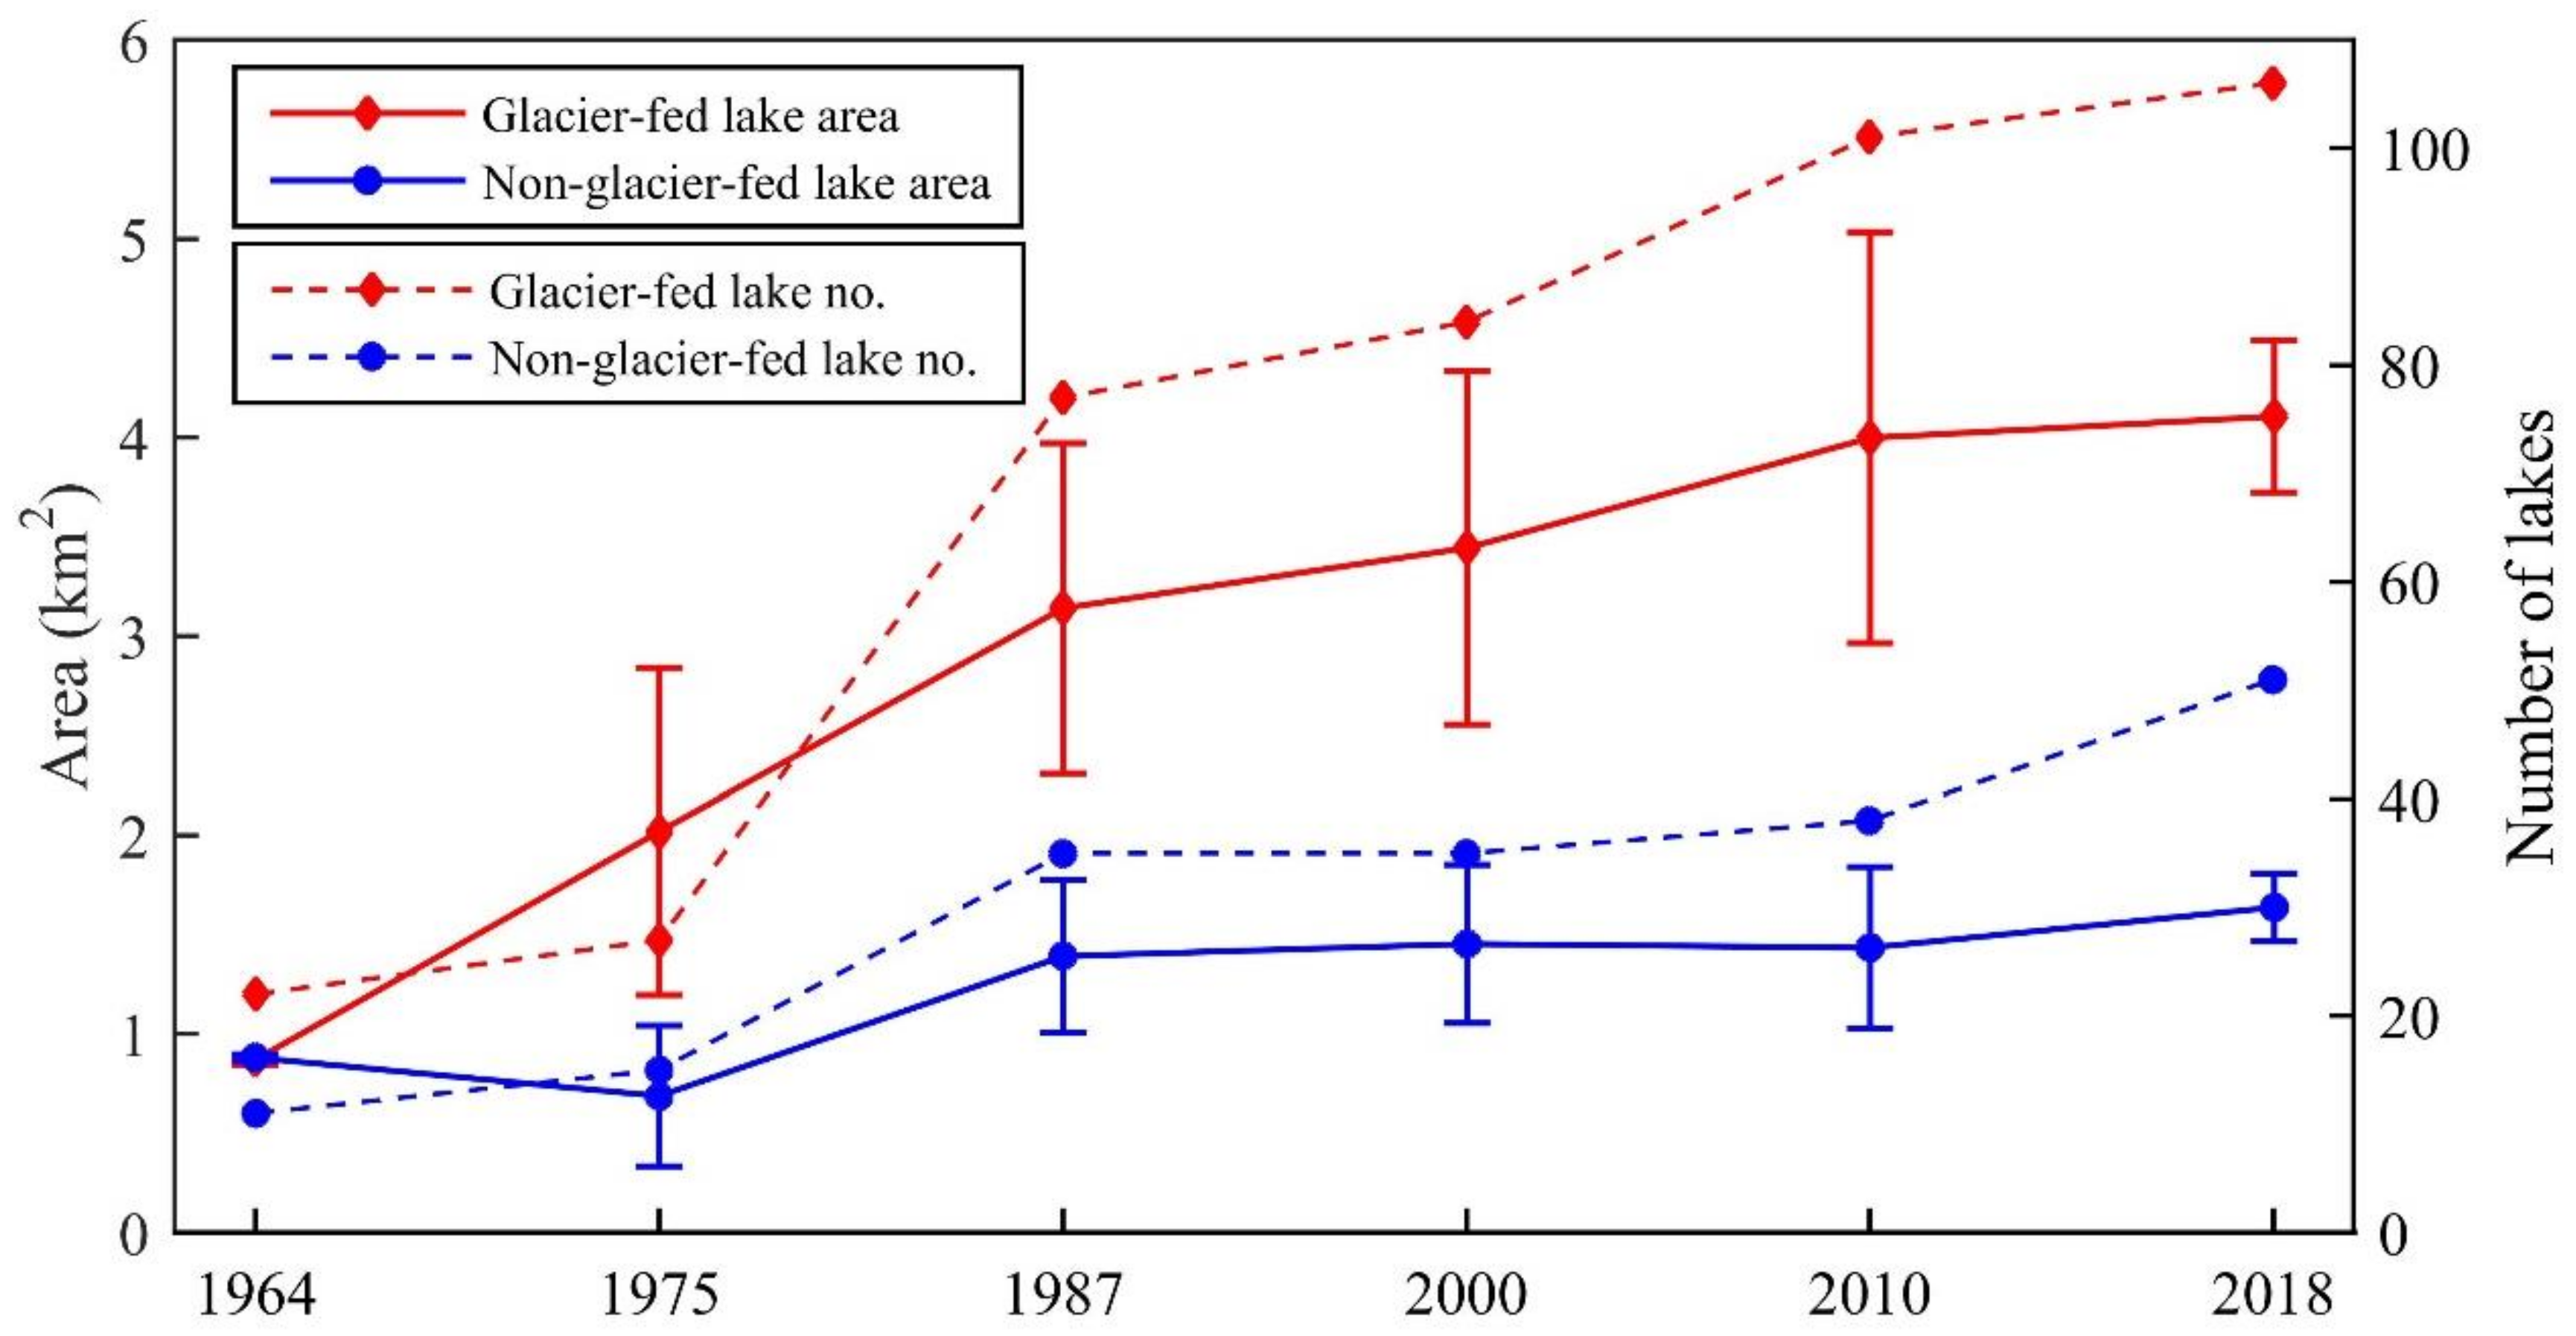
Figure 10 illustrates several trends over time in glacier-fed and non-glacier-fed lake development and expansion. Between 1964 and 2018 the number of glacial lakes >5000 m
2 in size increased from 31 to 157, with total lake area increasing from 1.74 km
2 to 5.74 km
2 during the same period. While both are increasing in number and area, glacier-fed lakes are doing so more rapidly than the non-glacier-fed lakes because of contemporary warming trends and accelerations in glacial melt [
56,
60]. However, during the same time period, non-glacier-fed lakes have increased more quickly in number and area because of the transformation of many glacier-fed lakes to non-glacier-fed lakes, and subsequent loss of glacier area.
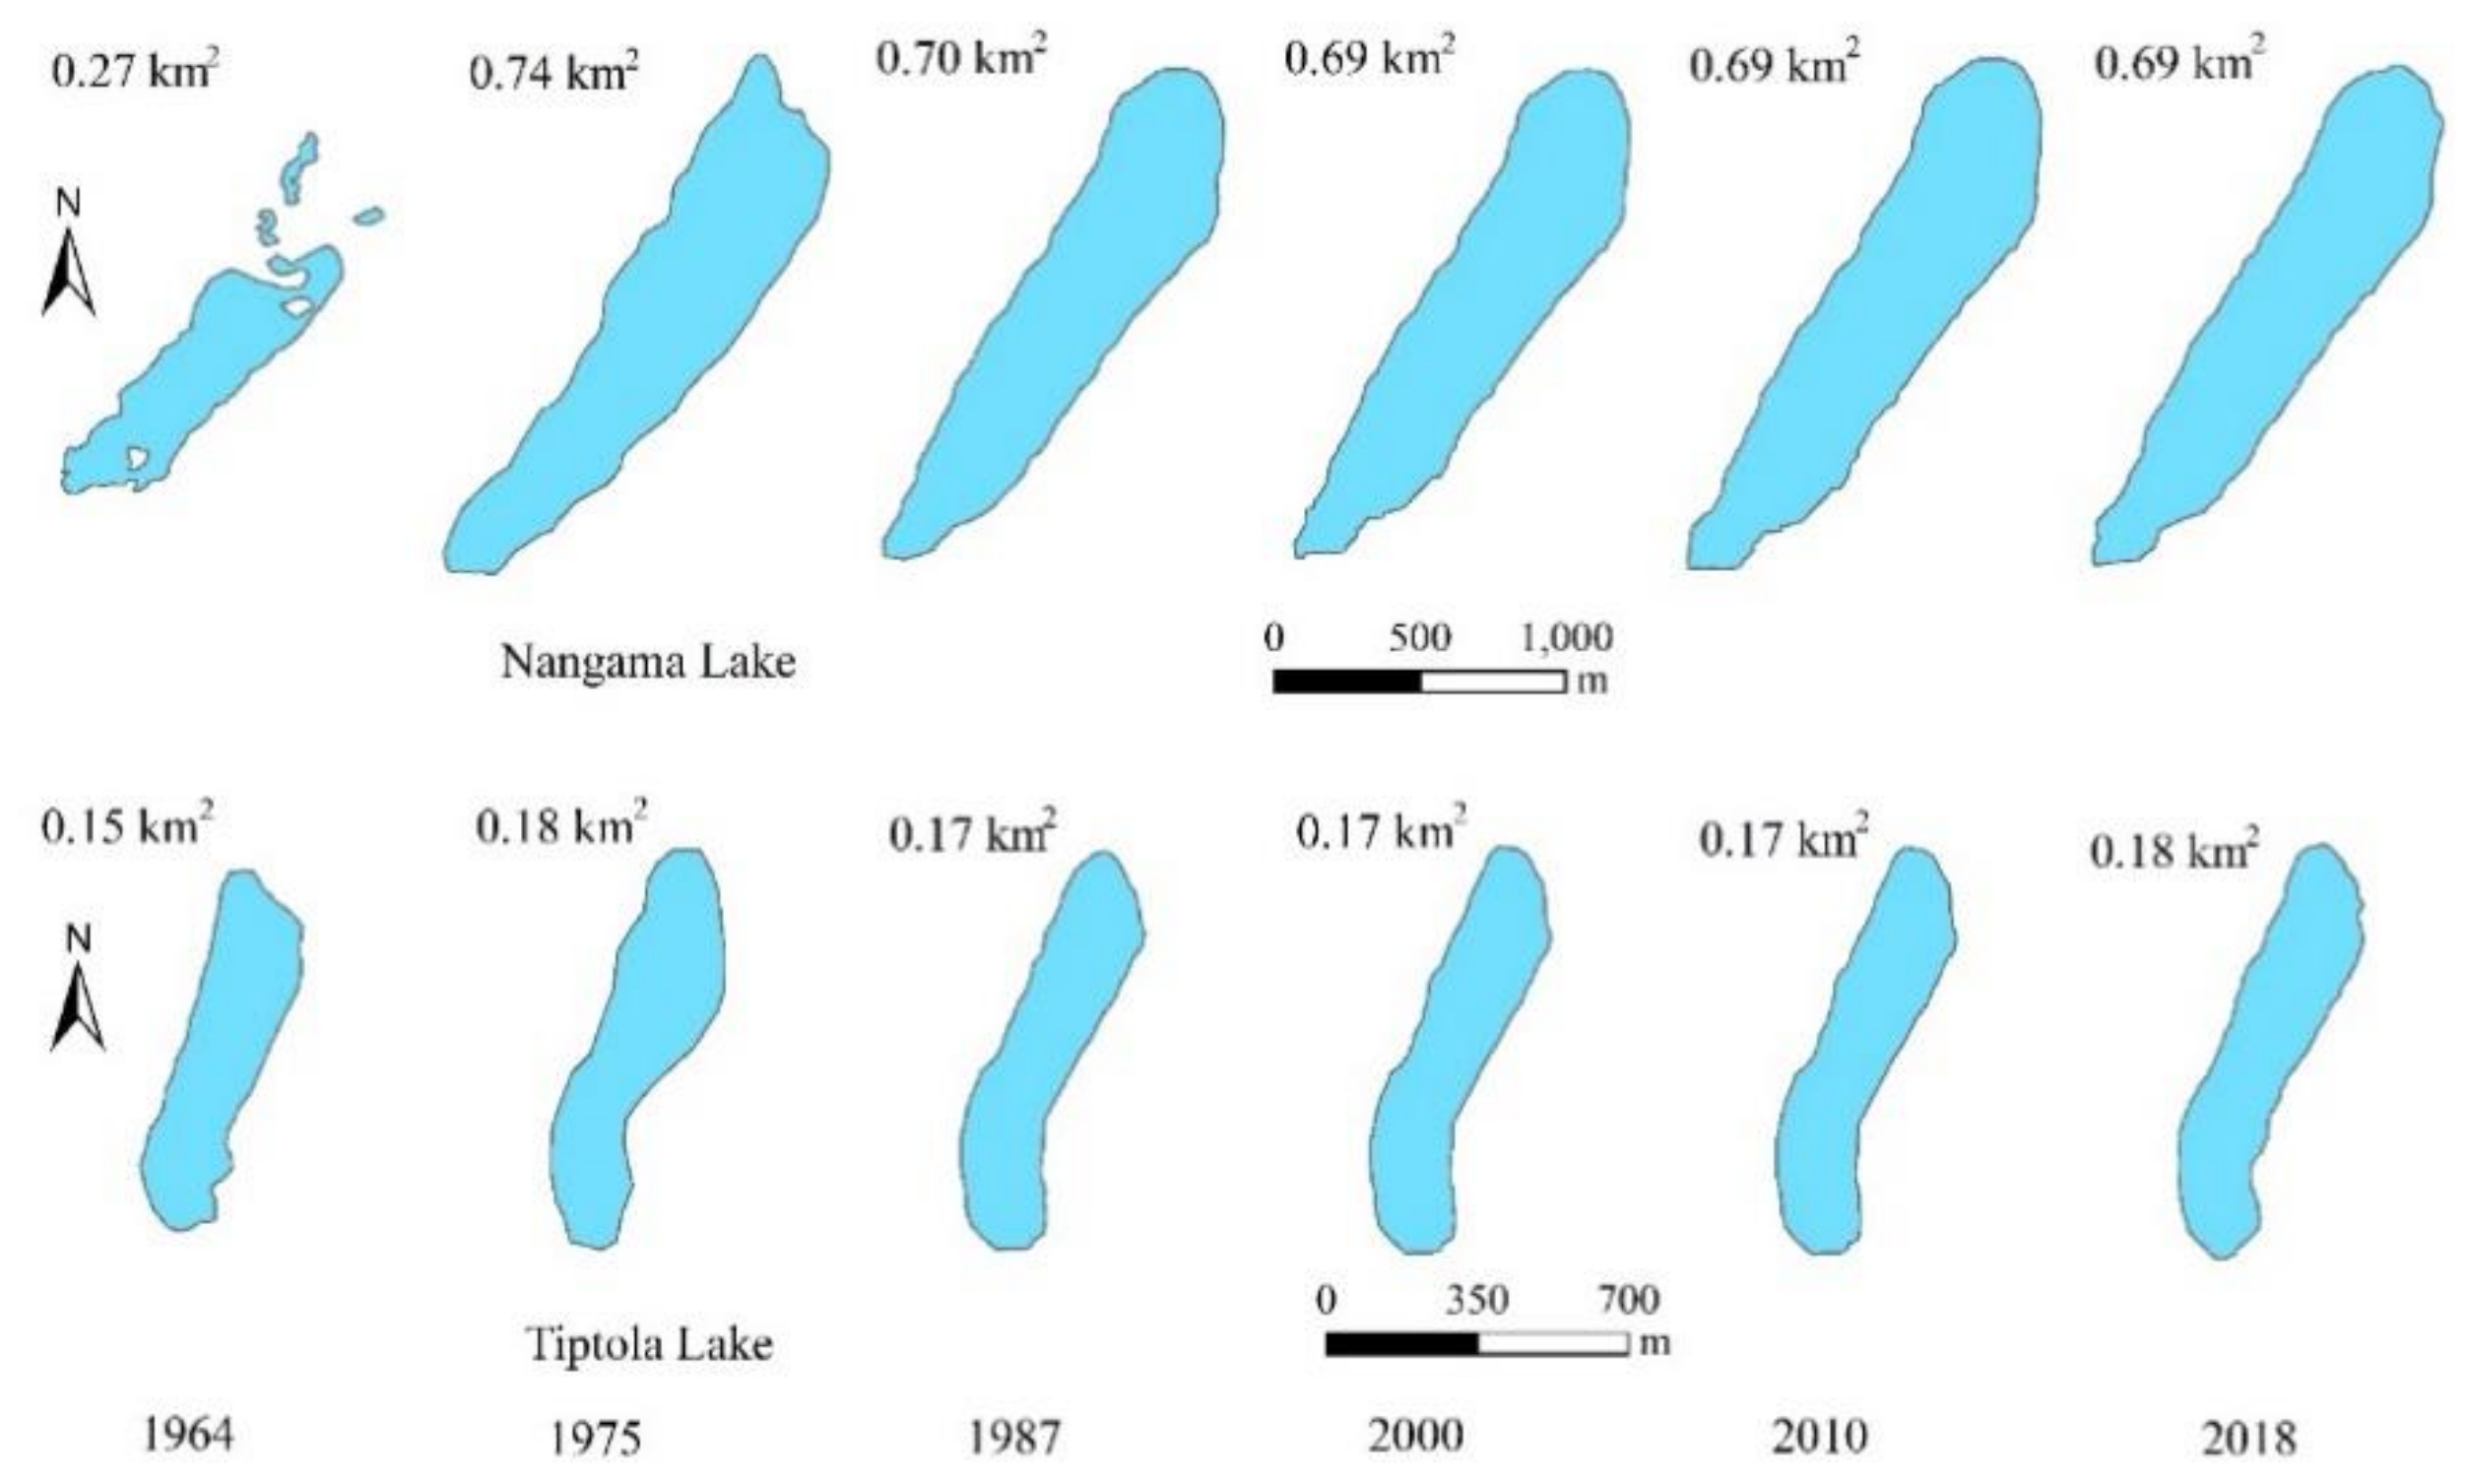
Figure 11 traces the development of Nangama and Tiptola glacial lakes from 1964 to 2018, the sources of the three floods that arguably caused the most damage within the Tamor watershed during the past century. Between 1964 and 1975, Nangama glacial lake nearly tripled its 1964 area of 0.27 km
2 to 0.74 km
2. The growth of Nangama glacial lake prior to the 1980 GLOF is even larger when including Watanabe et al.’s (1998) 1978 lake area estimate of ca. 0.93 km
2, and this paper’s pre-GLOF estimate of 1.1 km
2. Seven years after the 1980 GLOF, which presumably drained a large percentage of its water volume, the lake nevertheless covered an area of 0.70 km
2, which has remained relatively stable ever since. Judging from remaining parts of the moraine and spillway that were not affected by the GLOF, the terminal moraine rose above the bottom of the spillway (~4820 m.a.s.l.) by approximately 80 m and over a distance of 130 m, for a slope of approximately 30°.
Tiptola glacial lake, source of the 1963 and 1968 Olangchun Gola floods, has likewise remained remarkably stable in size since 1975, with only a 0.03 km2 increase between the 1968 event and 1975 satellite image. Because the Olangchun Gola 1 flood occurred in 1963, it is not possible to discern the growth patterns from before that time.
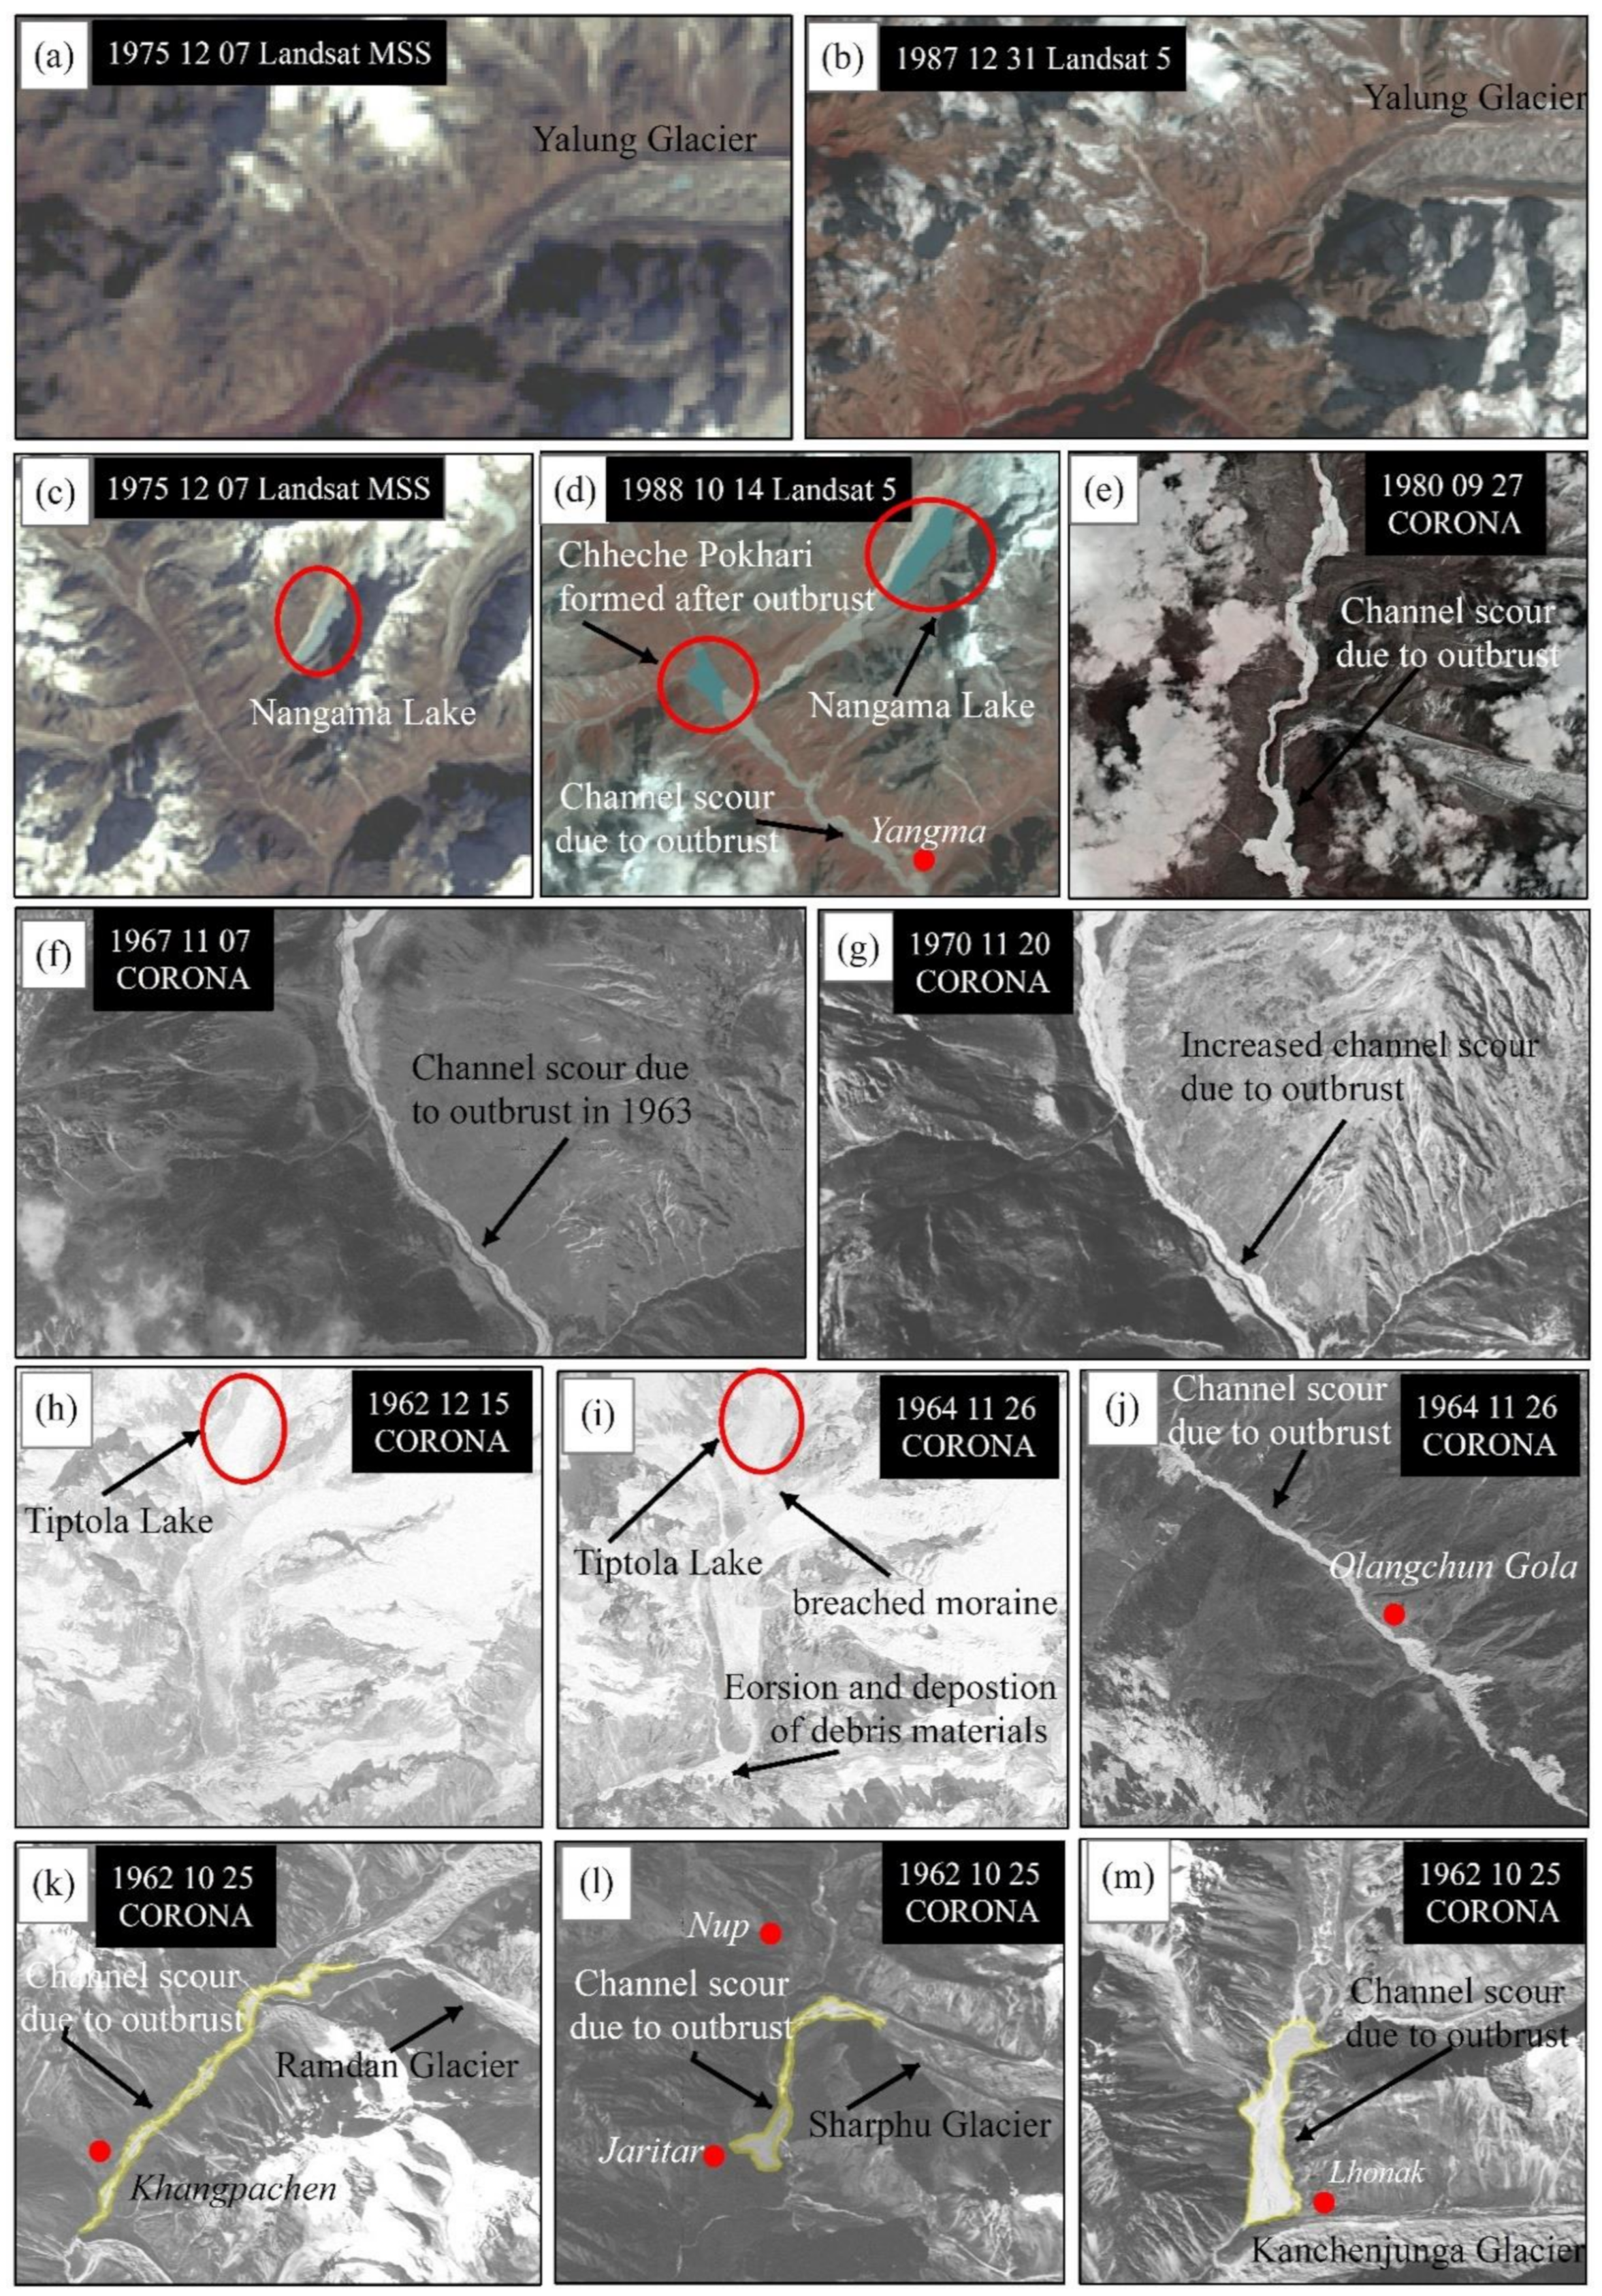
Sources of contemporary GLOFs: CORONA and Landsat imagery from 1962 was used to either confirm or challenge the existence of GLOFs as identified by local informants. Interpretations were based upon the before-and-after existence of palaeohydrological features such as breached terminal moraines, flood plains, and newly debris-dammed lakes (
Table 2,
Figure 12).
As mentioned previously, the 2011 Ghunsa 2 flood occurred at approximately the same time as the magnitude 6.9 earthquake that struck north-eastern Nepal at 18:10 on 19 September, 2011.
However, because the exact dates of the flood are not available, a definitive correlation between the two events is not possible. As no evidence of a major flood could be detected from the remote sensing analyses, the flood must have been relatively small in terms of geomorphic and/or structural damage.
Likewise, the 1986 Simbuwa GLOF left little evidence of geomorphic change, as can be seen when comparing
Figure 12a (1975) and
Figure 12b (1987). A fairly large meltwater pond present in the 1975 image, however, suggests that the origins of the flood may have been linked to englacial conduit processes mentioned earlier.
Evidence of the 1980 Nangama flood is quite obvious when comparing the pre-GLOF images (
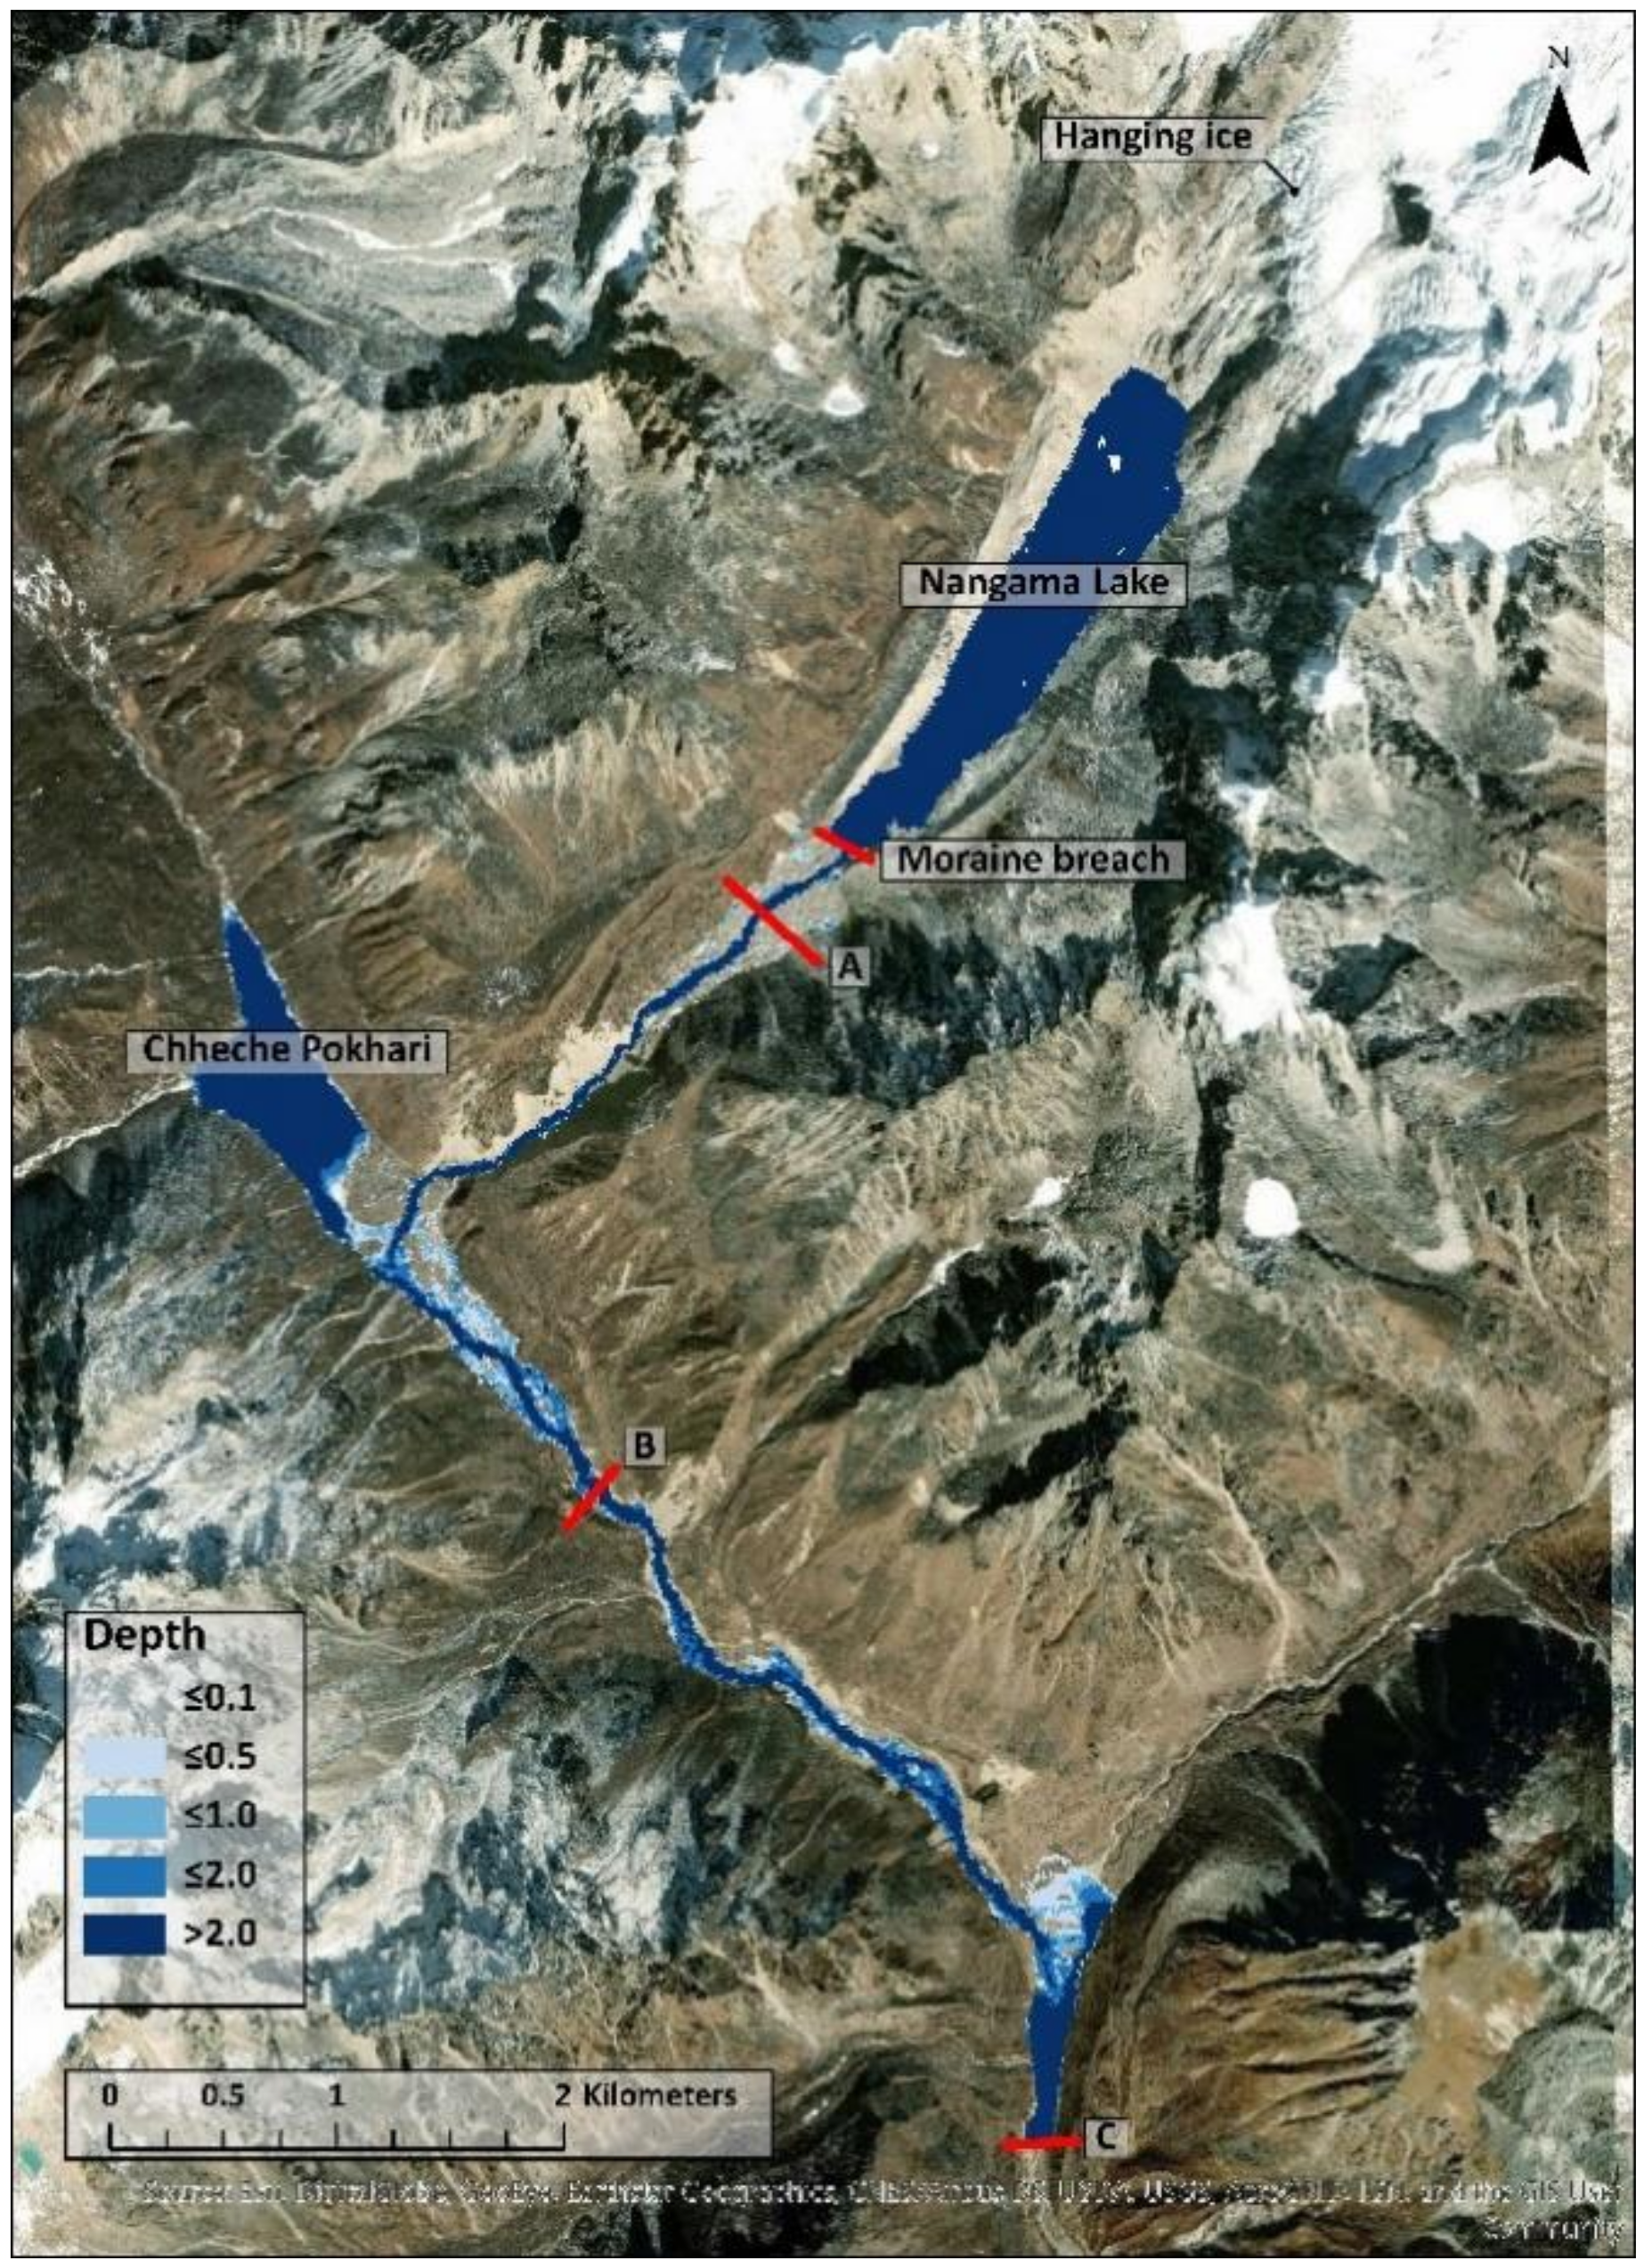
Figure 12c) with post-GLOF images (
Figure 12d,e) of the region. The deposition of debris below Nangama Lake, formation of Chheche Pokhari due to the damming of the Pabuk Khola, and widening of the riverbed between Chheche Pokhari and Yangma village are clearly evident in the two images (
Figure 12c,d). Channel scouring due south of Yangma can be seen in
Figure 12e, which also shows the two large pasture areas (top and bottom of image) that may have played a role in further flood attenuation.
What appears to be major channel scouring from the 1963 Olangchun Gola 1 GLOF along the Tamor Nadi can be seen in
Figure 12f, which increased as a result of the 1968 Olangchun Gola 2 GLOF (
Figure 12g). The source of both floods, Tiptola Lake, can be seen in its pre- (
Figure 12h) and post-GLOF states (
Figure 12i), the latter including evidence of the breached moraine, erosion, and deposition of debris materials.
Figure 12j shows the significant levels of river channel scouring both above and below the village of Olangchun Gola, which suffered the loss of nearly half its houses during the 1963 event.
Figure 12k,l show evidence of the pre-1962 Khangpachen and Jaritar GLOFs, primarily in the form of river scouring, debris splays, and likely source of origin. Since little evidence of pre-GLOF glacial lakes exists in either image, the floods were most likely caused by some form of glacier outburst flood activity, although further field-based research would be required for verification.
Finally, evidence of the 1921 Lhonak GLOF is abundant in
Figure 12m, primarily in the form of the breached terminal moraine, massive channel scour, and deposition of debris to the north-east of the seasonal settlement of Lhonak. This particular flood is of note because of the fact that it is still remembered by people throughout the Kanchenjunga region, perhaps a testimony to both its size and amount of damage inflicted. Interestingly, reference to this event has yet to appear in any study to date that includes a table of historic GLOF evens in Nepal (e.g., [
5]).
In summary, the oral histories and remote sensing imagery of contemporary and historical GLOFs within the Kanchenjunga region tended to be mutually supportive. A total of six GLOFs were mentioned by informants, four of which could be identified on the remotely sensed imagery. Four of the major floods (Ghunsa 1, Olangchun Gola 1 and 2, Nangama) had clear glacial lake origins, and two (Ghunsa 2 and Simbuwa) were most likely linked to other glacier flood processes, such as some form of glacier outburst flood. Two pre-1962 floods (Khangpachen and Jaritar) were identified by the remote sensing analyses that were not mentioned by informants, probably because they occurred in remote regions and caused little damage.
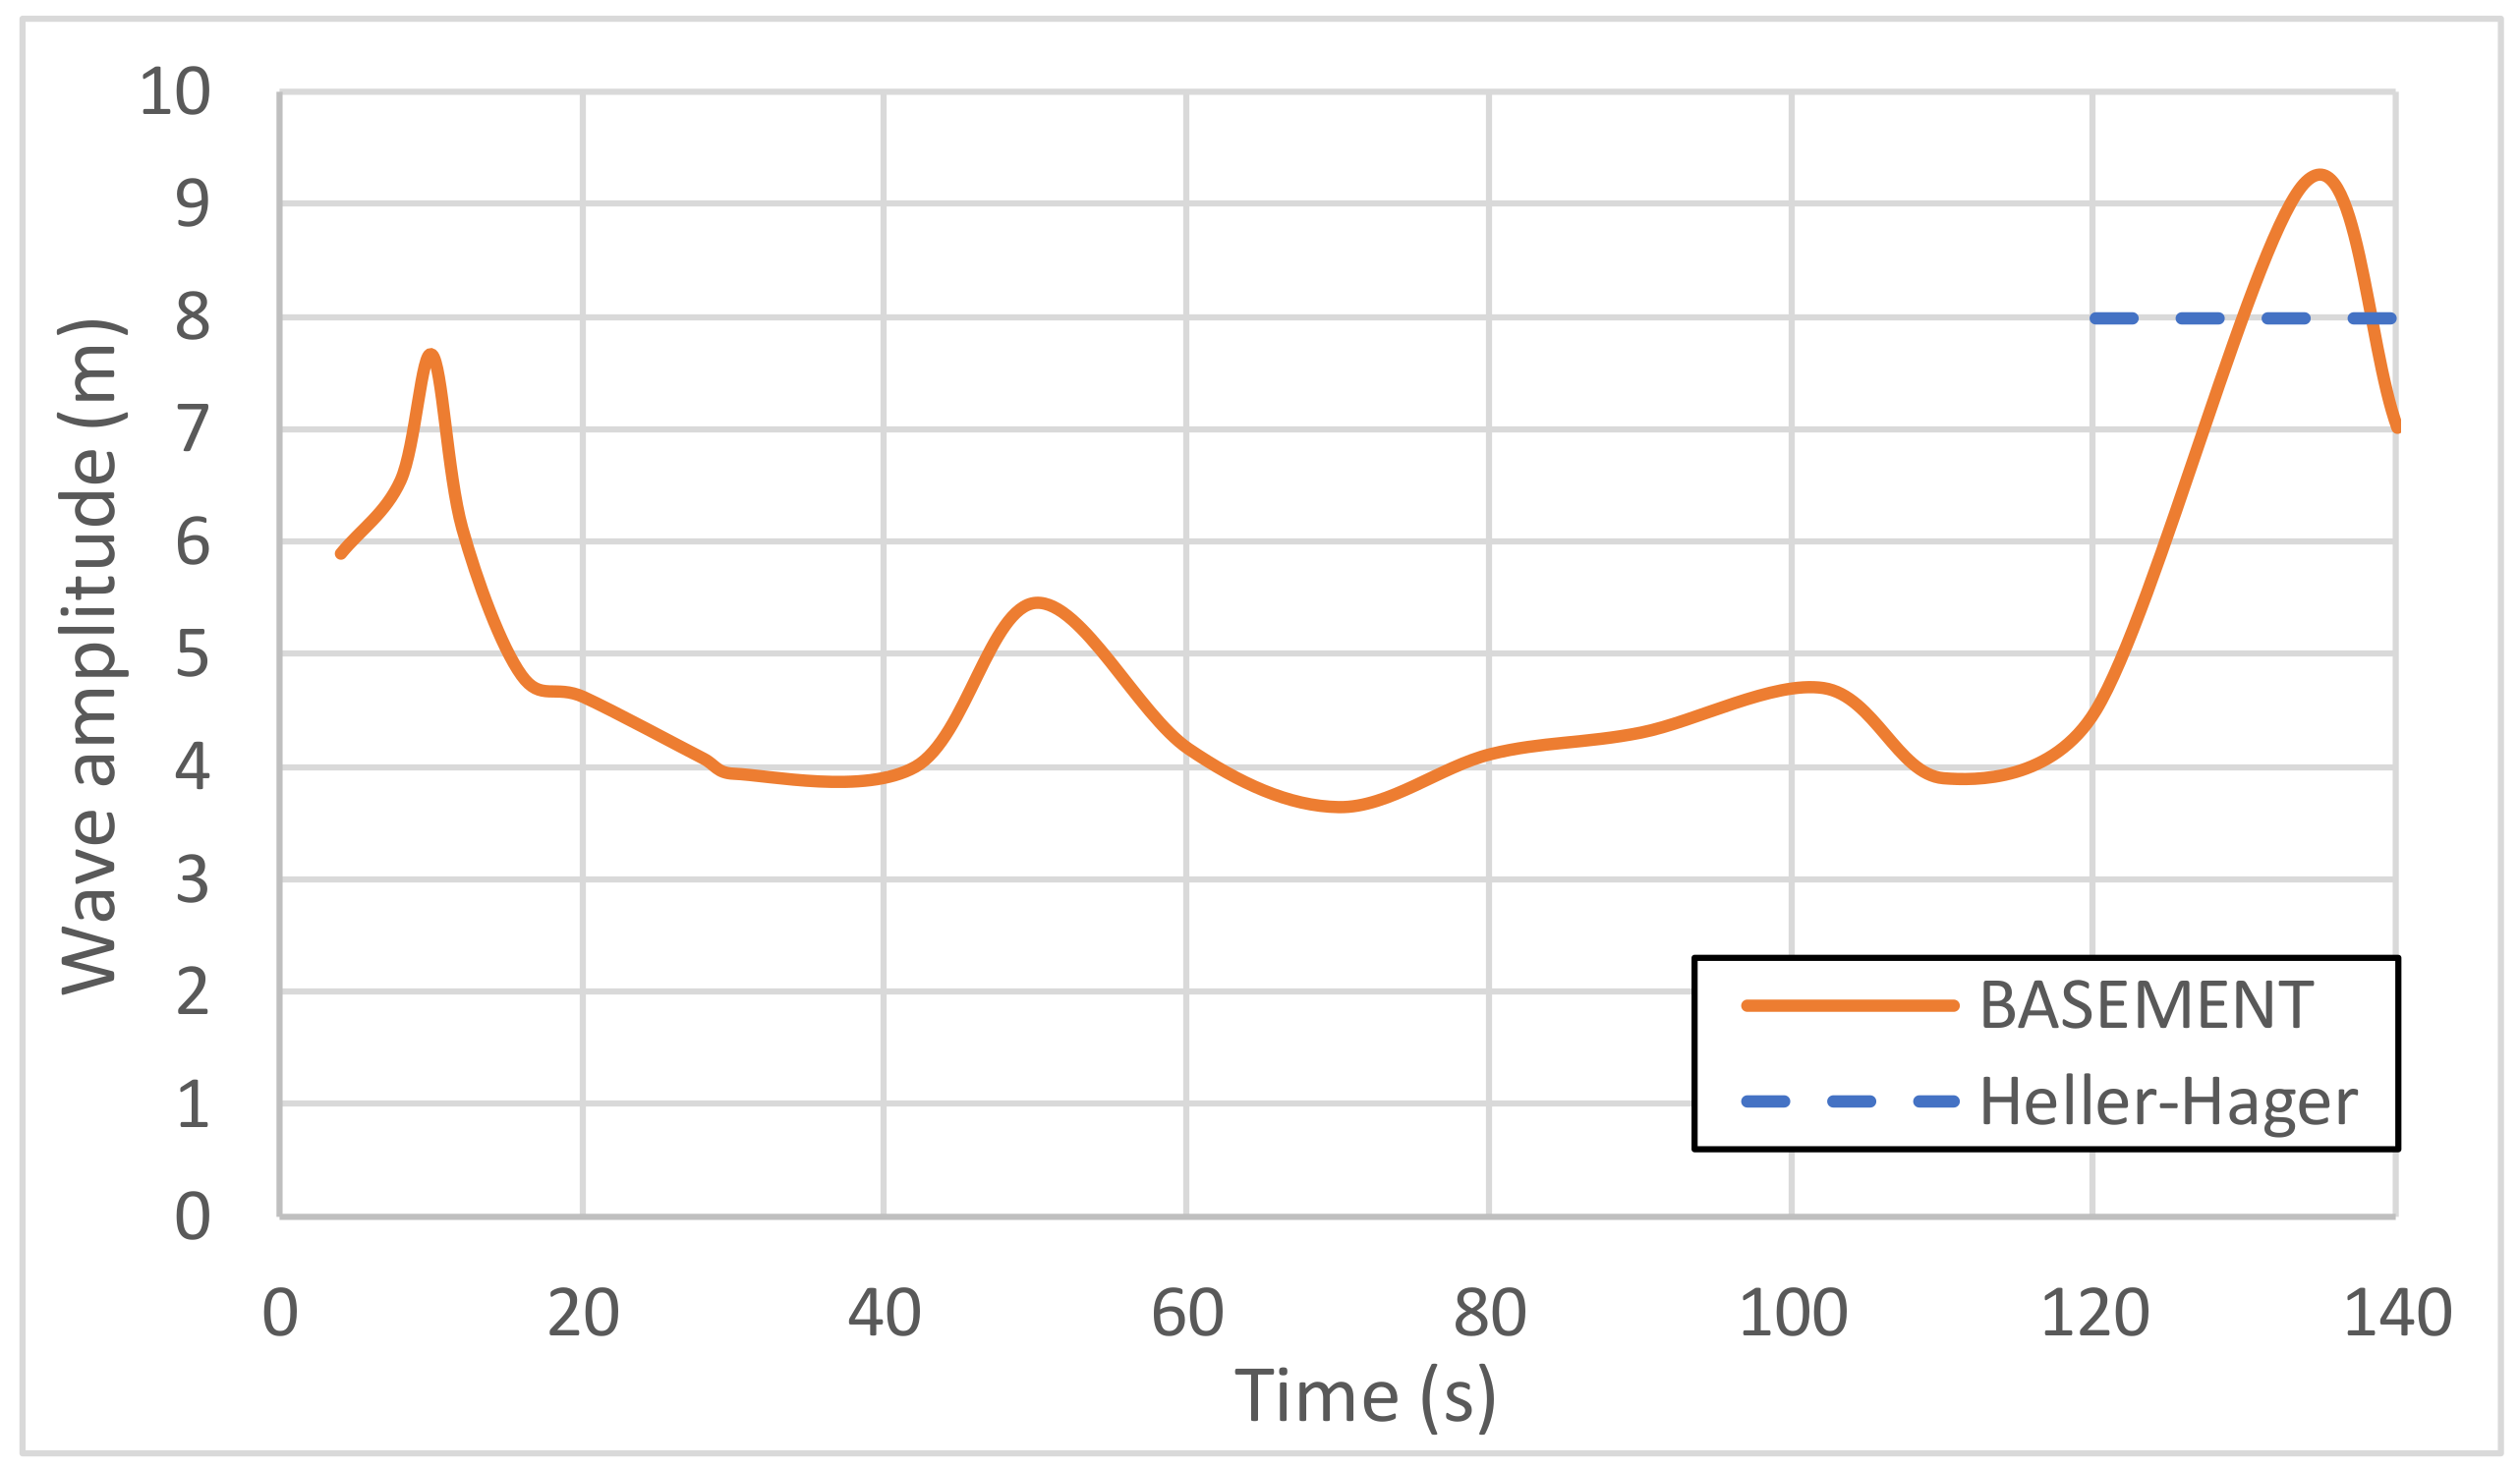
Numeric Modeling: Wave amplitudes within the lake agreed well between BASEMENT and the Heller-Hager model, with a peak wave amplitude of 9.2 m in BASEMENT and 8.0 m in Heller-Hager—both within the range of 7 to 10 m estimated from field observations of the lateral moraines (
Figure 13). This was true for both lake bathymetries considered; the slightly sloping lakebed increased wave height by less than 0.04 m relative to the flat lake bed.
Although varying lake bathymetry did not notably affect wave height, it did affect overtopping volume as well as overall erosion of the terminal moraine. Depending on the sediment transport model and bathymetry used, erosion of the terminal moraine at its deepest point (
Figure 4 and
Figure 14) ranged from 23 m to nearly 70 m (
Figure 15). The MPM-Multi scenario with a sloping lakebed did not result in sufficient erosion for a GLOF; hence, it was omitted from this study.
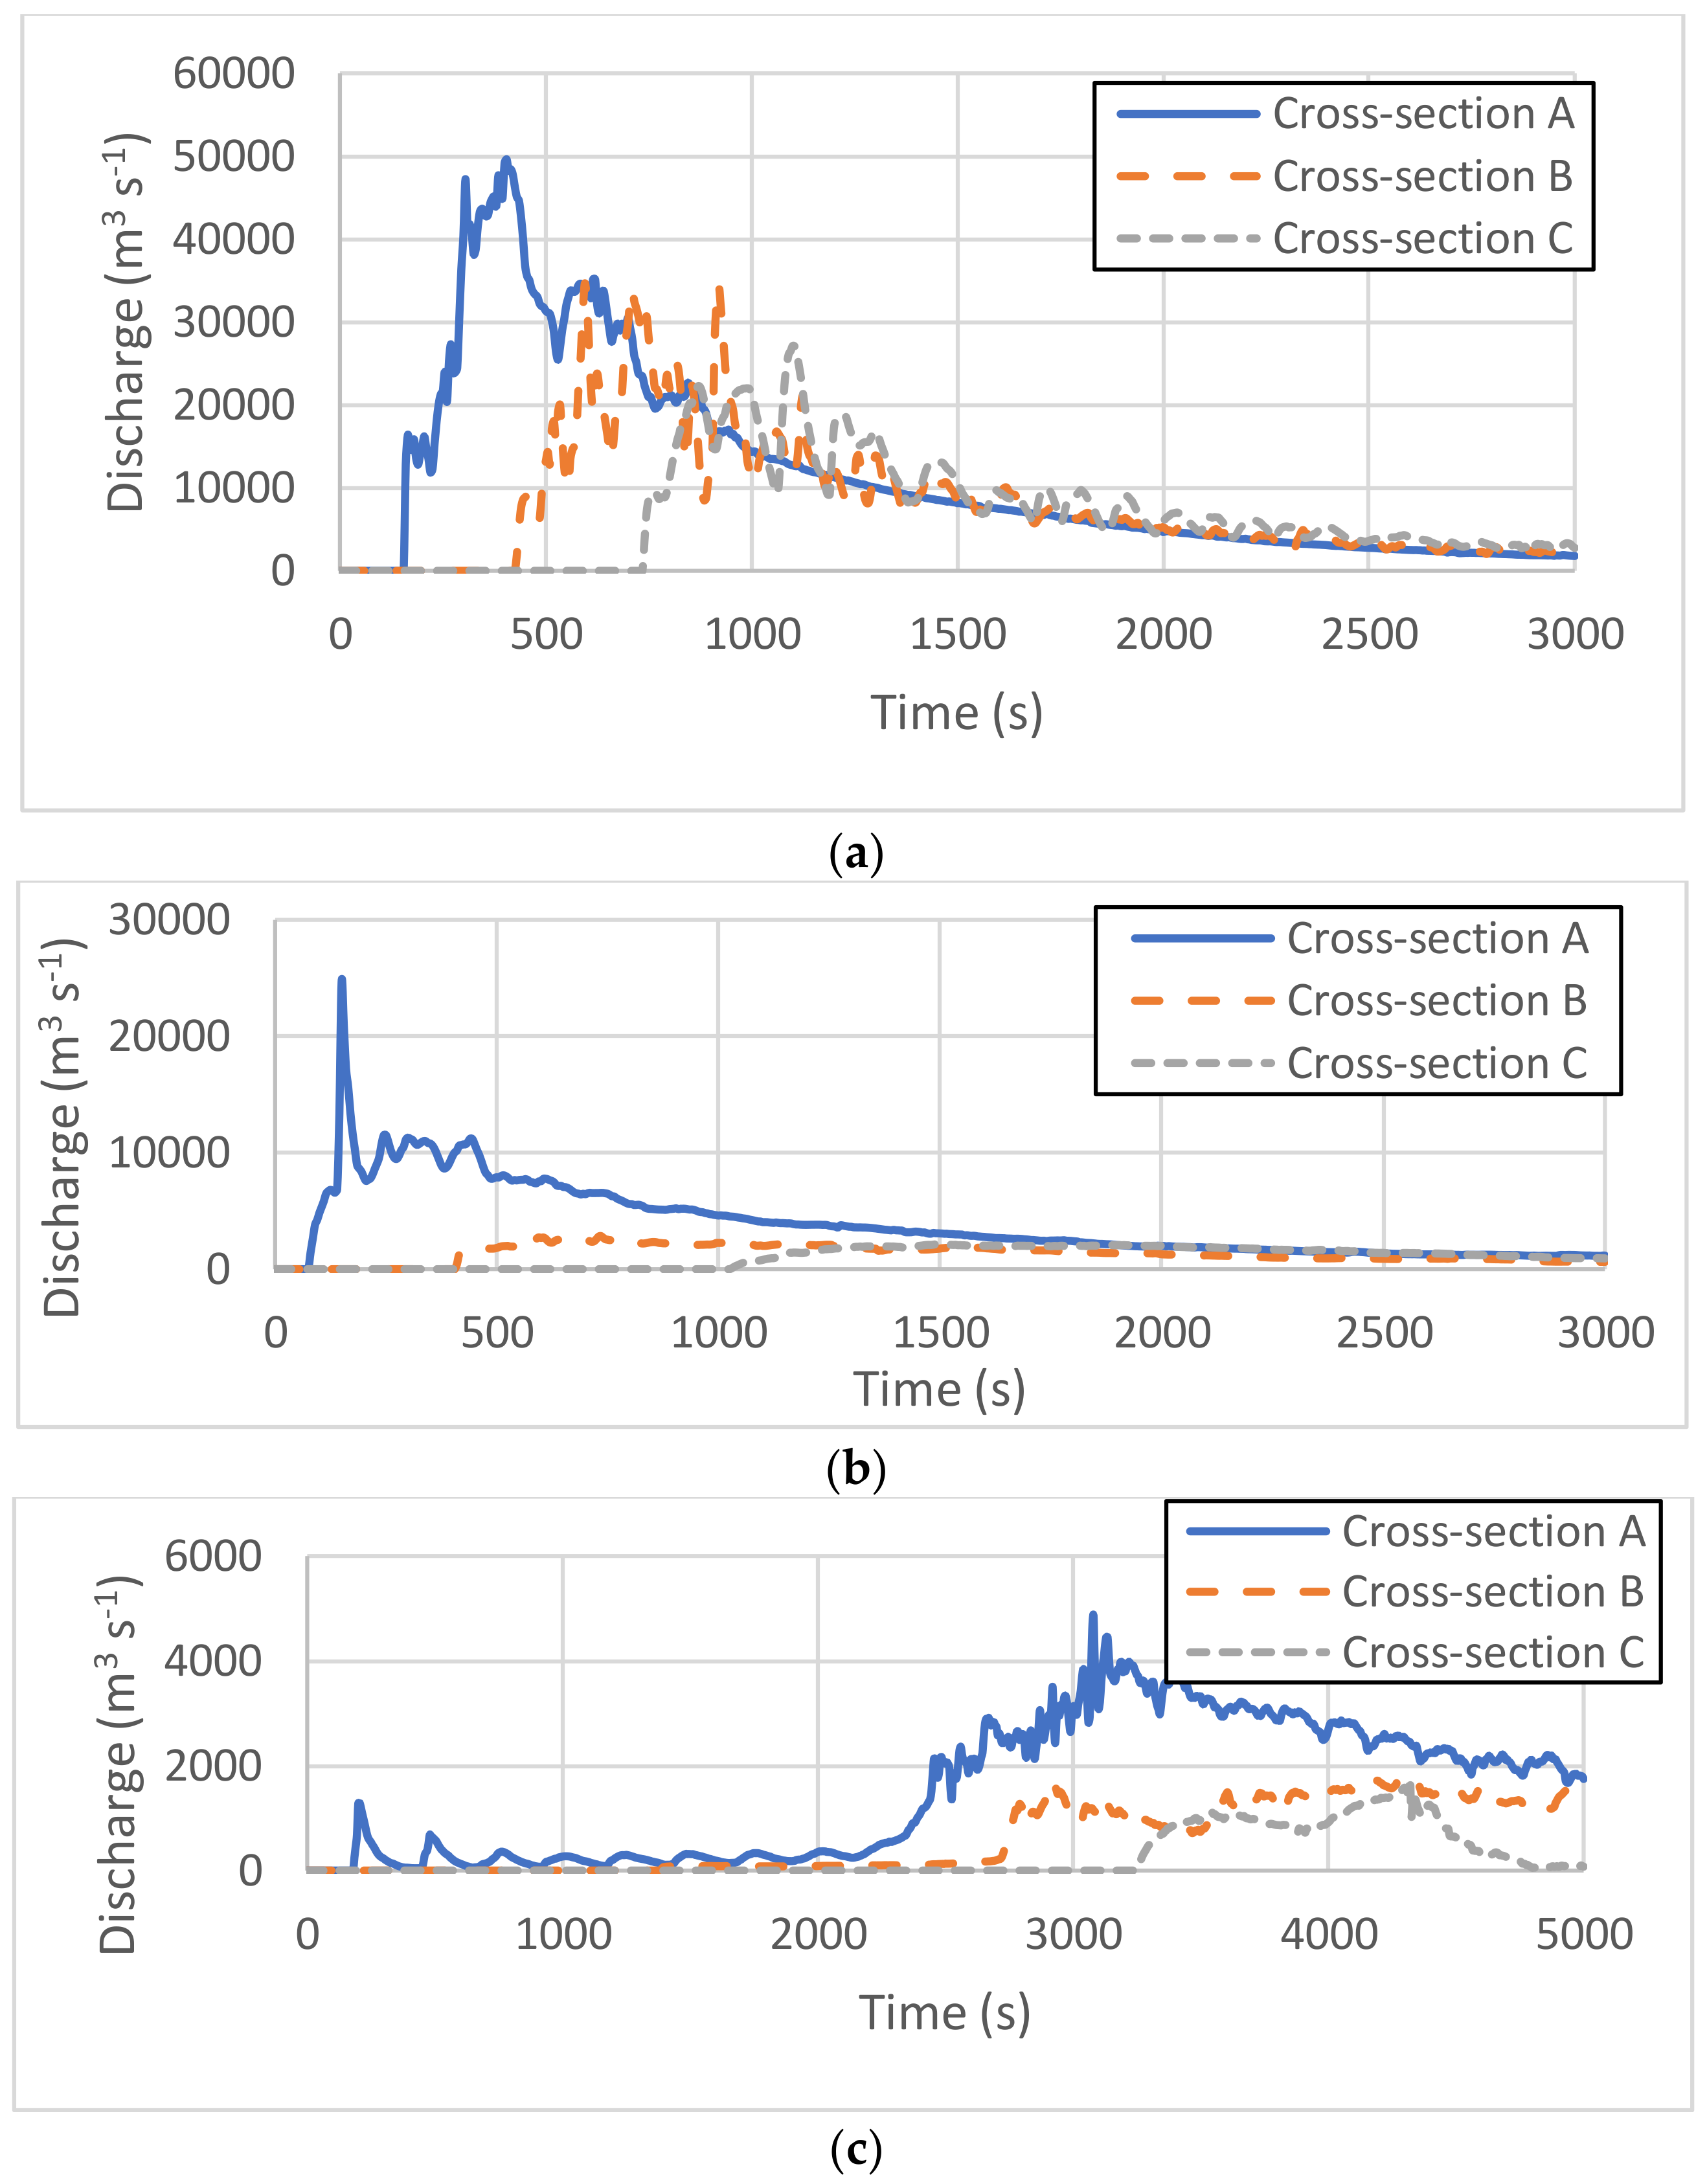
Inundation downstream also varied depending on the scenario simulated (
Figure 16). Peak discharge was highest for the flat bathymetry, MPM scenario, which had the greatest erosion; the sloping bathymetry, MPM scenario had a much lower peak discharge that occurred much later in the simulation, suggesting a gradual erosion of the terminal moraine over time rather than a large initial blow.
The total volume of the flood was calculated as the product of the difference in pre- and post-GLOF lake height (13 m) times the average surface area (0.86 km) for an estimated 11.2 × 10
6 ± 1.4 × 10
6 m
3 of water. For comparison, this amount was nearly twice that of the famous 1985 Langmoche “flash flood” in Khumbu [
47], but half that of the 1998 Tama Pokhari in the Hinku valley of Makalu-Barun National Park and Buffer Zone [
60].
All three scenarios resulted in the creation of Chheche Pokhari (lake) (see
Figure 17) through flooding of its basin and subsequent damming via sediment deposition, granting some level of confidence to the results. The DEM, however, was not altered downstream of the terminal moraine (i.e., channel scouring was not filled in, and the bathymetry of Chheche Lake was left undetermined), which may have influenced inundation results as well as the shape of the discharge curves.
Three of the four scenarios considered in the numerical modeling resulted in GLOFs and the creation of Chheche Pokhari, suggesting that the actual GLOF likely conformed to one or more of them. Erosion and discharge, however, varied widely between scenarios. Although the MPM model tends to overestimate erosion, the shape of the terminal moraine after the MPM scenarios more closely matched the deep cut of the actual terminal moraine, whereas the MPM-Multi scenarios resulted in more evenly distributed erosion. Although the sloping lake bed may have contributed to a greater initial overtopping volume, the flat lake bed scenarios resulted in more overall erosion to the terminal moraine, likely because the sudden increase in depth upstream of the moraine resulted in very steep slopes that catastrophically failed. This is further supported by the delay in peak discharge for the sloping lakebed scenario, suggesting that the flat bed scenarios resulted in rapid moraine failure, while the sloping bed scenario resulted in a slow but steady incision into the moraine.
5. Discussion
Combining results from the project’s oral history and remote sensing components, the evidence suggests that there have been between five and seven GLOFs in the Kanchenjunga region since the 1960s. Including the 1921 Ghunsa 1 event nearly 100 years ago brings the total to between six and eight GLOF events. Evidence of most of the GLOFs identified during the oral testimony component had also been identified prior to this study by recent remote sensing studies of the Kanchenjunga region [
61]. However, estimating their date of occurrence from satellite imagery alone was not possible, which argues for the inclusion of an oral testimony component within the design of glacier, natural hazard, and/or disaster management research [
10]. While similar approaches have been tested recently in the Himalayas and Andes [
7,
8,
10,
62] they nevertheless remain relatively uncommon within the climate change and glacier research literature.
Two GLOF events (Khangpachen and Jaritar “before 1962” floods) were not mentioned by the informants interviewed, even though physical evidence of their occurrence could be detected within the satellite imagery reviewed. This is most likely because the floods were (a) much smaller than the others mentioned, (b) they occurred in remote and high-altitude regions, and/or (c) the damage inflicted was minimal. Parallels can be drawn between these unknown and/or unreported floods in the Kanchenjunga region and those experienced during the past 15 years by residents of the upper Imja Khola valley in Sagarmatha (Mt. Everest) National Park and Buffer Zone to the west (
Table 6) [
34,
53]. The majority of these floods appear to have their origins from within the glacier itself, e.g., from meltwater ponds and/or englacial conduits or water-filled caves [
53,
55,
56], and while capable of considerable local damage are rarely reported to Kathmandu-based authorities [
9]. The 2011 Ghunsa 2 flood is one such example, most likely a glacier outburst flood large enough to be remembered but resulting in little damage to fields or infrastructure. More research is indicated in order to better understand these events, especially since they appear to be increasing in frequency [
9].
Field observations and modeling results support oral history reports that the 1980 Nangama GLOF flood was a particularly large event. It was triggered by an ice/debris avalanche of some 800,000 m
3 of material, which in turn released a total flood discharge of 11.2 × 10
6 m
3 ± 1.4 × 10
6 m
3. This is nearly twice the size of the famous 1985 Langmoche (Dig Tsho) GLOF in Khumbu [
47], which killed five people, destroyed a nearly completed hydropower station, and washed away bridges and other infrastructure for at least 80 km downstream. The sheer size of Nangama’s terminal moraine breach is testimony to the magnitude of the event, as what had once been fertile pastures immediately below the terminal moraine were destroyed, with flood plain deposits exceeding 50 m in depth.
Approximately 26 GLOF events have occurred in Nepal, most since the 1960s [
9]. Of note is the fact that only the Nangama GLOF from the Kanchenjunga region is known and reported within the GLOF literature [
63], in spite of the fact that between five and seven other major events have occurred in the region since the 1960s. This suggests that the total number of recorded GLOFs within Nepal and throughout the Himalayas may also be significantly underreported as well.
As mentioned previously, most GLOFs are triggered by snow or ice/debris avalanches cascading into the lake, which in turn create surge waves capable of breaching the fragile terminal moraines which contain the lake water [
4]. GLOFs are capable of causing enormous downstream damage to villages, agricultural land, and hydropower plants [
64], and they too are expected to increase in frequency throughout the 2020s and into the 21st century [
65]. Permafrost thaw is another triggering mechanism of growing concern [
66], as it can catalyze destabilization of high-altitude rock/ice peaks, that in turn lead to major rockfall or landslide-induced avalanches. The presence of newly-formed glacial lakes at the foot of such slopes can result in major GLOF events and catastrophic downstream damage [
9,
63,
67]. The Kanchenjunga region is likewise susceptible to such de-stabilizing factors that could very well contribute to future GLOF events in the region.
Likewise, although Nangama glacial lake today falls within the “Minimal Hazard” category as defined by Reynolds (2014) [
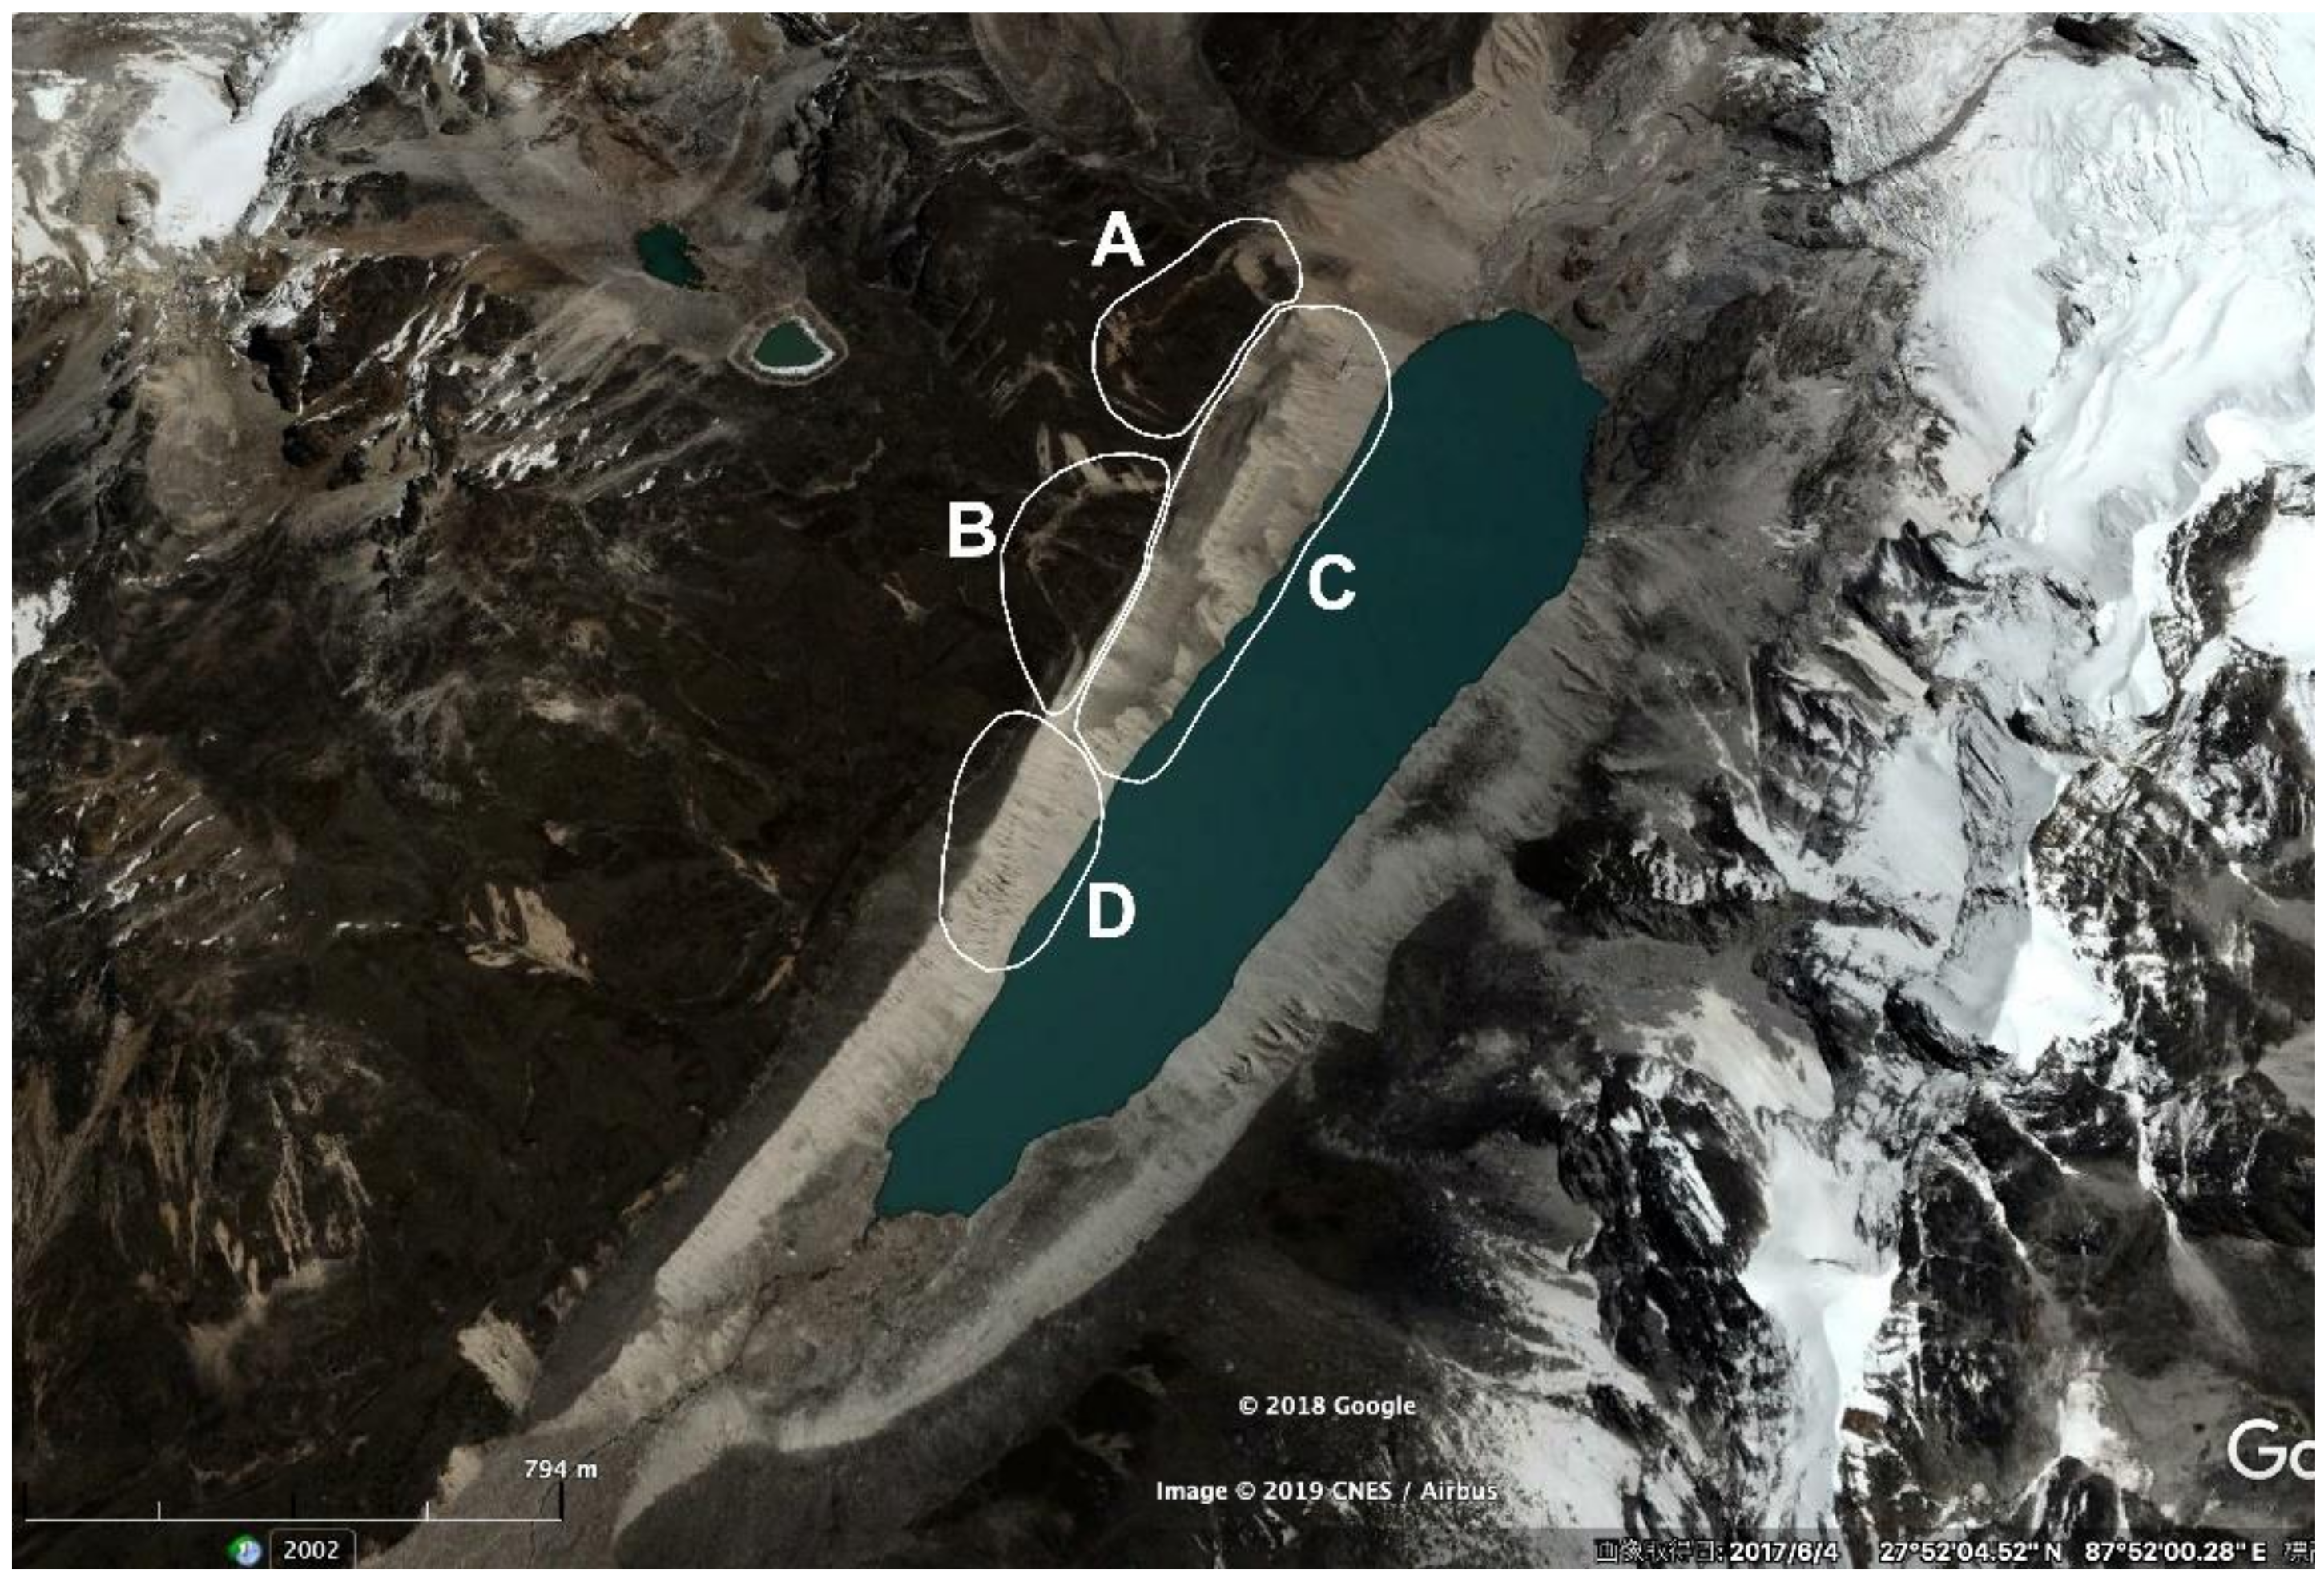
68], some concern has been expressed about prospective landslide activity on the right lateral moraine of the lake and its prospective role in catalyzing a future GLOF (
Figure 18; [
20,
69]). One report states that “…avalanche push seiche waves originating from debris slides and/or ice avalanched from cornices at the north-eastern edge of the glacier system interfluve” could overtop the existing terminal moraine breach, resulting in a destructive downstream flood. Such phenomena have been documented for various glaciers in the Peruvian Andes [
70,
71], and suggest that regular monitoring of Nangama, Tiptola, and other glacial lakes in the region be conducted. Monitoring activities should also include smaller lakes less than 0.1 km
2, as in spite of their small size they have been shown to be capable of flooding and causing enormous downstream damage [
34,
68].


 ,
, 


