Differential Effects of the Valence and Volume of Online Reviews on Customer Share of Visits: The Case of US Casual Dining Restaurant Brands


1
Doctor of Business Administration Program, Goldey-Beacom College, Wilmington, DE 19808, USA
2
Department of Integrated Resort and Tourism Management, University of Macau, Macao SAR, China
*
Author to whom correspondence should be addressed.
Sustainability 2020, 12(13), 5408; https://doi.org/10.3390/su12135408
Submission received: 5 June 2020
/
Revised: 26 June 2020
/
Accepted: 3 July 2020
/
Published: 3 July 2020
(This article belongs to the Special Issue Explore Online Hospitality Management: Price and Reputation)
Abstract
:Online customer reviews increasingly influence customer purchase decisions. Indeed, many customers have highlighted the significance of online reviews as an influential source of information. This study reports an investigation of the differential effects of online reviews, such as valence and volume, on the customer share of visits. Our findings suggest that valence (i.e., star rating) had more effect, giving a higher average check size to restaurants on the share of visits, while number reviews (volume) did not drive the share of visits to restaurants regardless of the average check size. Therefore, the ideal for casual dining restaurant brands would be to manage highly positive ratings to retain their customers.
1. Introduction
Customer loyalty is generally used as a proxy for customer attitudes and purchase behavior. Although customer loyalty often leads to higher retention rates, revisit and repurchase intentions may not correctly reflect the profitability of retained customers [1]. Recent studies have suggested that people increasingly divide their purchases among several brands or companies in most industries, indicating that customer loyalty is not a sufficient explanation of customer purchase behavior [2,3]. The concept of “customer share” is defined as “the ratio of a customer’s purchases of a particular category of products or services from supplier X to the customer’s total purchases of that category of products or services from all suppliers.” [1]. As such, customer share may be a better indicator for explaining customer purchase behavior in a competitive marketing environment. Undoubtedly, many studies have been focused on enhancing the understanding of how customer share is allocated in a service or product category and using customer shares to develop an effective marketing strategy to increase customer spending. For example, knowing customer share helps marketers and brand managers to obtain a more significant share of customers’ spending within the product category and consequently increase potential profits from customers [4,5]. Besides, changes in customer share would have a higher impact on firms’ revenue than customer retention rates [3]. With this practical relevance, this study aims to understand the customer share of visits in a restaurant context.
The characteristics of products and services in the hospitality industry (i.e., nonreturnability, intangibility, and perishability) make online reviews an important information channel for customers to anticipate the quality of products and services before consumption [6,7,8]. Customers often write online reviews regarding their whole experience and certain aspects using a quantitative measure (i.e., review rating) and a quantitative evaluation (i.e., review contents) [9]. These evaluations on customer review websites (e.g., TripAdvisor, Booking.com, or Yelp) enable customers to reduce uncertainty and the perceived risk of buying service products [10,11]. Even loyal customers can easily reevaluate their favorite products and services at any time using online reviews, enabling them to consider buying and consuming other brands. The effect of online information (e.g., reviews) would be even more critical for less frequent visitors, as they could visit customer review websites more often than loyal customers. Customers seek heuristic information cues (e.g., star ratings and the number of reviews) to simplify the decision because of limited cognitive capacity [12]. Thus, this study considered star ratings and number of reviews as vital heuristic elements in deciding on a restaurant.
Considering the practical importance of customer share, this study reports on the investigation of the differential effects of online review (i.e., electronic word of mouth, or eWOM, valence, and volume) on the customer share of visits. To do so, this study used a multilevel analytic design based on the restaurant context. Most brands have more than one branch with different locations in a restaurant franchise system. Thus, the overall goal of this study is to explain how information (e.g., valence and volume) on online review websites influences the customer share of restaurant visits. More specifically, this study examined (1) the effect of Yelp scores and the number of reviews on the customer share of visits at the restaurant branch level and (2) the moderating effect of the average check size for restaurant brands on these relationships. This study should expand our knowledge about eWOM and customer share by providing a more precise test of eWOM effects on customer share by product/service type. Besides, our findings will help restaurant owners and managers to understand the importance of CSV and online reputation in managing their restaurant brands sustainably.
2. Conceptual Background
2.1. Online Reviews and eWOM
Online reviews are a popular form of eWOM, so customers use them to share information about products and services. Nowadays, information from online reviews has a critical effect on customer purchase decisions and attitudes toward a particular service/product [13]. Customers often seek suggestions posted by other customers on social media, which allow them to imagine possible offerings from the restaurant without actual experience [14]. Therefore, online reviews indeed contribute to the formation of customers’ attitudes and perceptions toward hospitality companies or brands. Consequently, many scholars have investigated various aspects of social media—i.e., experience and perception—by analyzing review contents, determinants of usefulness/helpfulness of reviews, and the effect on profitability [8,9,14,15]. These studies repeatedly show the effectiveness of social media analytics in the tourism and hospitality industry.
Most online review websites feature two parts: overall product assessment (i.e., ratings) and a written review [16,17]. For example, travel websites like TripAdvisor require customers to provide detailed comments about their experience and an overall rating of the hotel or restaurant service using a 5-star rating system. In customer review websites, more detailed information about each property/branch is available, including location, menus, photos, and comments. However, most people cannot process all possible information on online review websites due to their limited capacity [12]. This implies that most customers prefer processing summarized information for an overall assessment when choosing a restaurant; non-content cues are used subjectively in heuristic information processing [18]. Previous studies have consistently found that online reviews with star ratings, rich reviews, the number of reviews, and compressive visual cues are more effectively processed than other content as customers decide where to dine out [17].
2.2. Customer Share
In consumer research, customer relationships and loyalty are essential topics and practices to maintain the profitability and sustainability of a firm and a brand [1]. While customer satisfaction and retention have been applied in many business contexts, recent studies have emphasized customer share’s role as another essential metric for practitioners [3,19]. Indeed, some scholars and practitioners argued that the twenty-first century is “the century of customer share” [20]; firms focus on retaining current customers and increasing their share of existing customer spending [4]. Unlike the previous assumption that customers are loyal to a particular brand and repeatedly purchase a product from the brand, customers in a competitive market could be increasingly loyal to several brands in most industries, and thus customer retention rates are part of business performance [21]. Conceptually, customer share would be similar to a particular type of brand loyalty. In a conventional category, customer share is a consequence of behavior loyalty, indicating that, behaviorally, loyal customers would have a higher chance of visiting a specific restaurant or purchase a service again [5,22]. In a more recent study, authors categorized brand loyalty into three types—i.e., head, heart, and hand loyalty [23]. Among these three types of brand loyalty, customer share is indeed close to the concept of hand loyalty, which is a regular repurchase behavior with less emotional or cognitive commitment. In this regard, customer share as a behavioral component is also significant in a restaurant context, as dining out nowadays reflects not only “eating outside” as an ordinary behavior but also connecting with others and sharing an experience with others in an impromptu manner [24].
Customer share is measured using two different methods: share of wallet and share of visits. Both are highly correlated but cannot be used interchangeably [19]. Share of wallet refers to how much customers spend in a category, company, product, and service over a given amount of time [2,5]. Customer share of wallet would be the dimension of ultimate interest to a firm and is more important financially than customer retention [22]. On the other hand, the effect of the share of visits may be even more significant than the share of wallet, and whatever influences the share of visits would be an antecedent of the share of wallet [19]. Customer share of visits is a frequency-based approach similar to behavioral loyalty. The share of visits is defined as the repeated purchase of particular products or services for a certain period of time from all companies/products/services. In restaurants, customer spending is typically limited to one meal per visit (i.e., a reasonably constant amount per visit), whereas customers can spend much more in retail stores. Hence, the customer share of visits would be a reasonable proxy for customer share in a restaurant setting.
2.3. Hypotheses Development
The information from online reviews affects customer purchase decisions significantly. Nowadays, online reputation, which is mostly based on social media and customer review websites, is therefore a core factor for companies and brands to compete with other companies and brands [25]. Customers can access a large amount of online information almost in real-time and without any restriction in the pre-consumption stage, which became an essential source of eWOM [8,9]. Online reviews affect consumer behaviors, i.e., purchase intention and product purchasing [26] and increased hotel booking sales [27,28]. Customer exposure to online reviews increases the awareness of a hotel and amplifies consideration [29]. In this process, the consumer may come across various online reviews to fully anticipate the possible consequences of purchasing service goods or products [10,11]. Among all the possible information on customer review websites, this study includes two summary statistics—e.g., averaged review rating (valence) and the total number of reviews (volume) for a specific branch of a restaurant. More specifically, high review rating and high volume could be a good signal of a consistently high-quality service/food and the popularity of a restaurant [30,31]. Therefore, both features of eWOM—higher star ratings and a larger number of reviews on a review website—may enhance customer share.
Hypothesis 1.
Higher star ratings (valence) and more reviews (volume) increase eWOM and thus the customer share of visits.
Moreover, especially in the restaurant industry, franchise systems tend to dominate, which means that different people own many branches/properties in diverse locations for a specific brand. In the restaurant franchise system, as more locations open, the brand grows quickly, and the franchisor makes more money. Moreover, restaurant brands are segmented by an average menu price (upscale/fine dining, casual dining, fast-food restaurant) and by service type (limited-service restaurant, full-service restaurant)). Therefore, depending on the restaurant segment, people may be more or less susceptible to the opinions on online review websites. Thus, a restaurant’s average check size may alter its eWOM on the customer share of visits.
Hypothesis 2.
The relationship between eWOM and the customer share of visit differs according to a restaurant’s average check size.
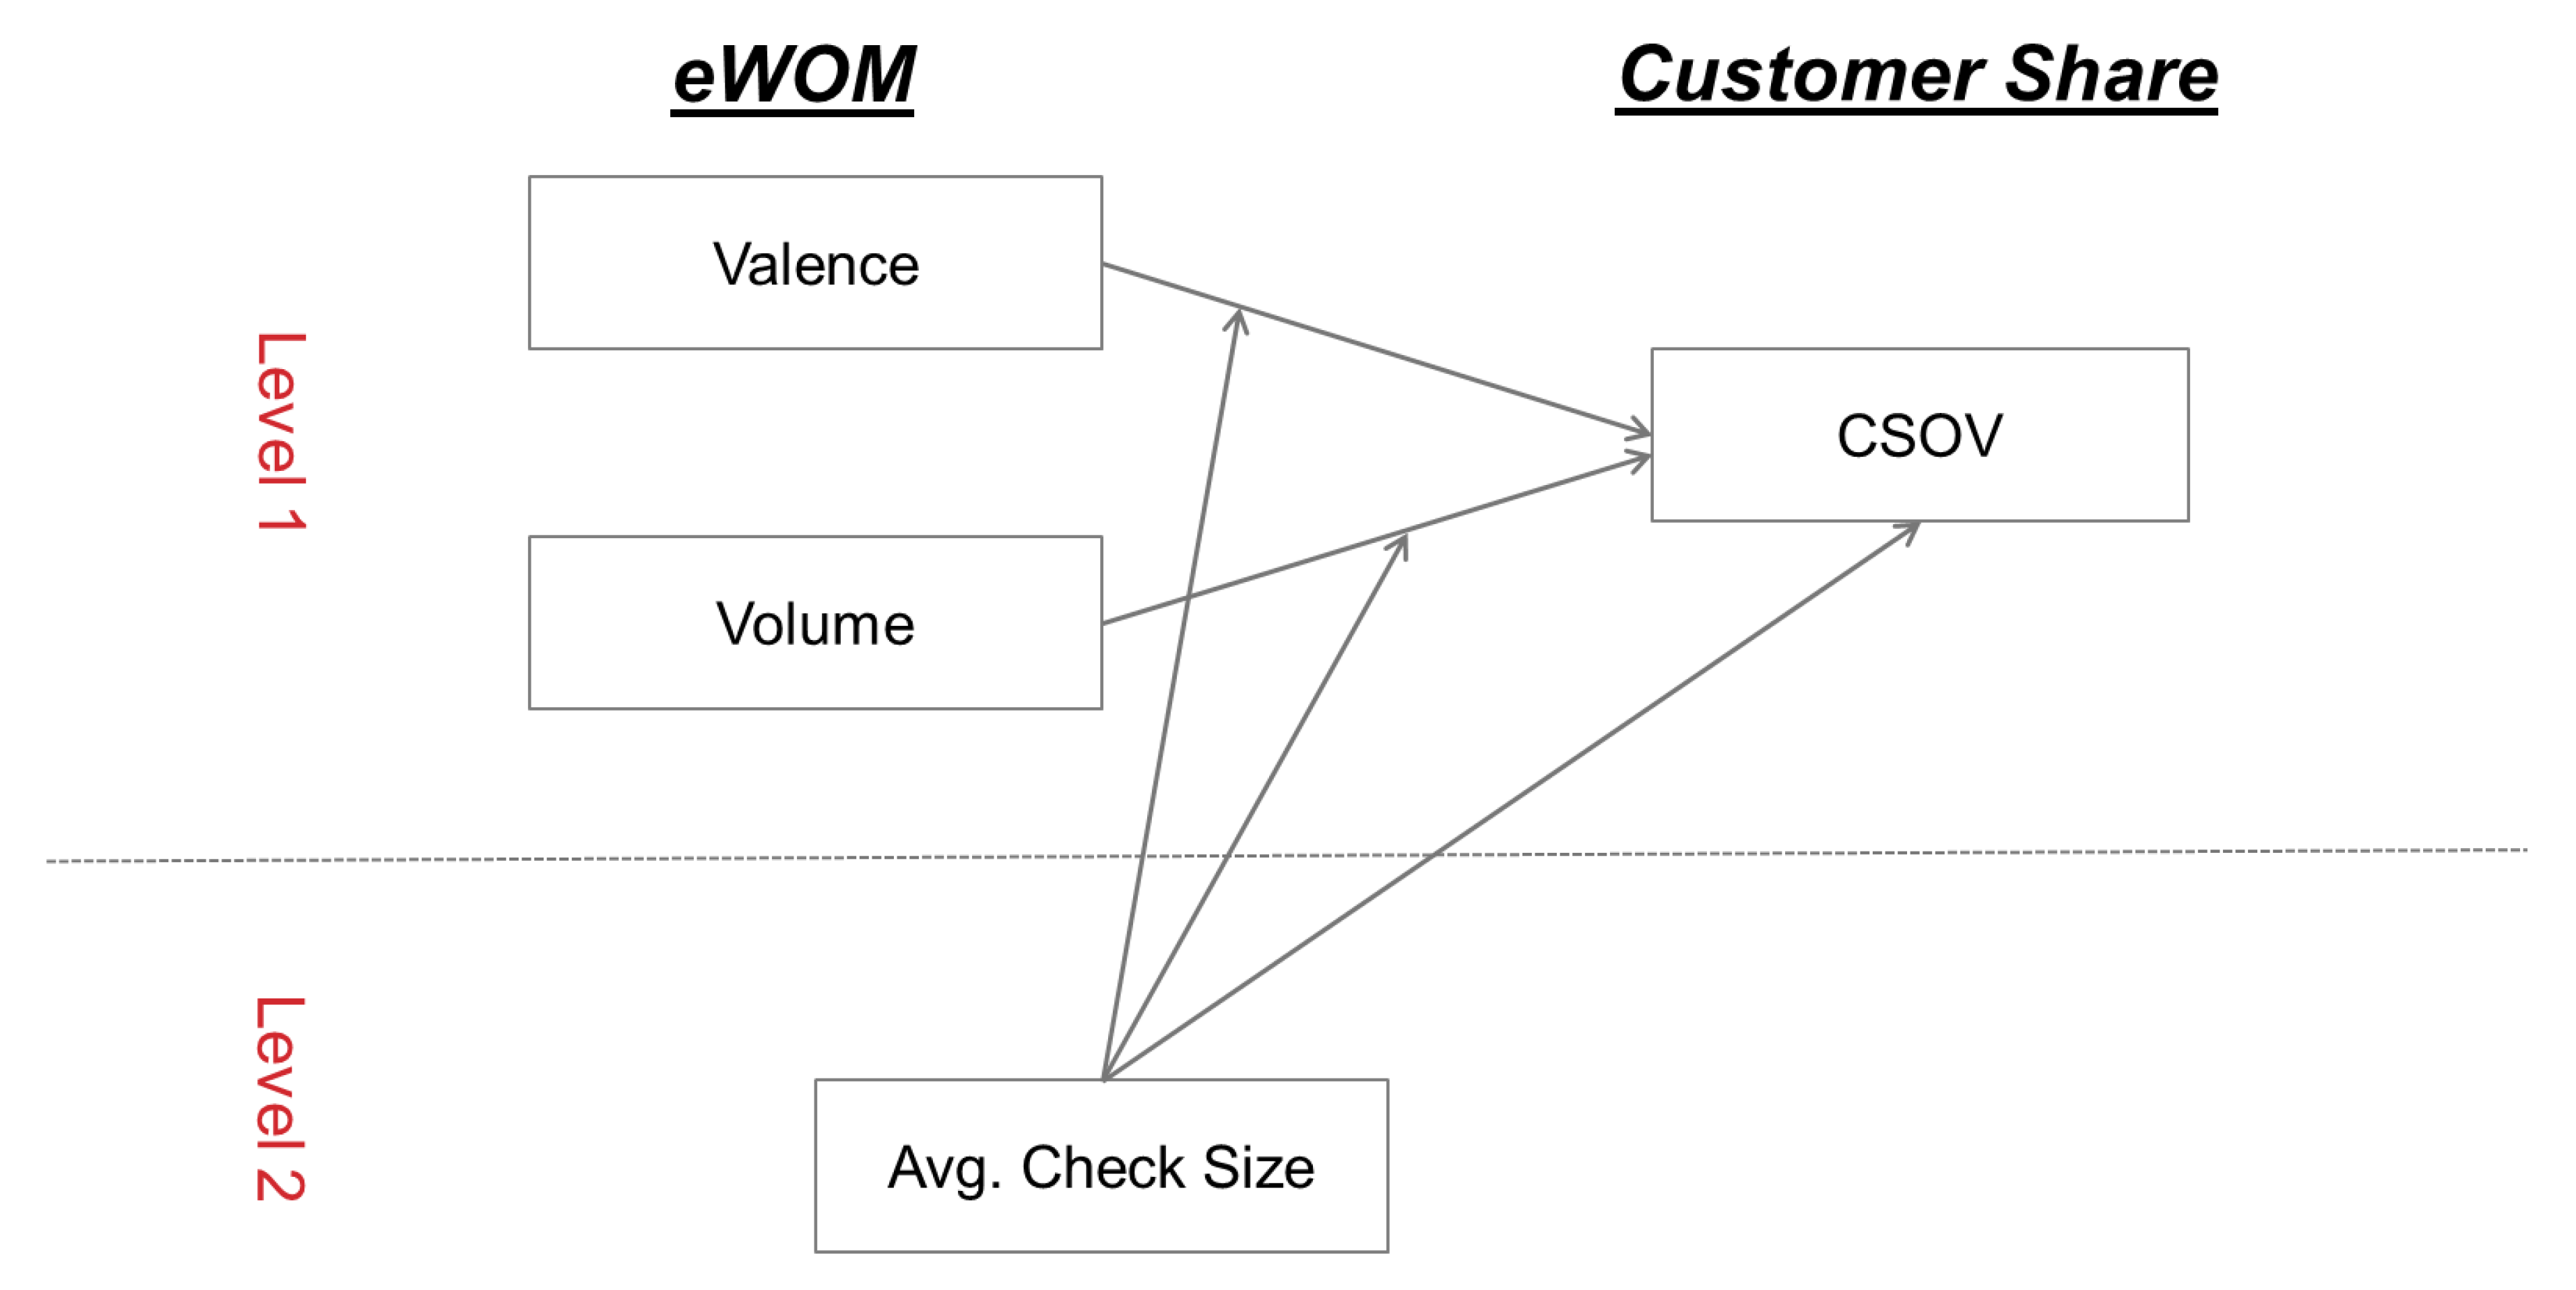
Based on the two hypotheses, this study proposes the following conceptual model (Figure 1).
3. Methods
3.1. Samples and Data
This study employed two different data collection methods. First, a self-administered survey was used to collect the information about restaurant visit patterns (e.g., the share of visits, most recently visited restaurants, average check size, etc.) and demographic variables (e.g., age, gender, highest education obtained, and household income). A questionnaire was distributed to 2800 full-service restaurant customers in the U.S. through an online survey company. From these samples, 480 customers participated in the survey (17.1% response rate). Of the 480 participants, only 243 respondents (8.7% valid response rate) were included for hypothesis testing because of disqualified respondents (i.e., most recent restaurant visits, length of visit, incomplete responses, and inconsistent responses regarding the share of visits). In this study, we considered the casual dining restaurant to fully-capture the concept of share of visits. The casual dining restaurant is more popular and accessible for customers who eat out often and periodically, as it provides more moderate and decent-priced meal selections when compared to the fine dining sector. Second, in this study, we included both restaurant star ratings (i.e., valence) and the number of reviews (i.e., volume) from the restaurant review website (Yelp.com) based on the location of individual restaurant branches obtained from the survey data. We chose Yelp.com as our main data source for online review information because Yelp is one of the most popular review sites on restaurants and contained over 205 million reviews at the end of 2019. The first author of this study manually checked and collected online review information (e.g., average review rating and the number of reviews) based on the survey response from each respondent; then, both authors double-checked some branches randomly to ensure the consistency of the data collected from the restaurant review website. As a result, the final sample for further data analyses included 243 respondents and 41 restaurant brands.
3.2. Operationalization and Measurement
This study employed a multilevel analysis, which requires independent variables for both level 1 (individual branch level) and level 2 (brand level). The independent variables for level 1 predictors are the two dimensions of eWOM (valence and volume). To operationalize the level 1 predictors, we extracted information from user-generated content like the reviews on Yelp.com. The eWOM valence of each restaurant property was adapted from the five-star rating score provided by Yelp.com (i.e., five stars were highly satisfactory, while one star was highly unsatisfactory). The eWOM volume was then extracted from the number of reviews posted on Yelp.com for each restaurant branch. For the brand-level variable (level 2), the key measure was calculated using the average check size per person from the online survey data. In a survey questionnaire, respondents were asked to indicate their approximate average “dinner” check size for the most recent visited restaurant.
The dependent variable is the customer share of visits, which was based on the number of visits (frequencies) during the previous three months among the total times the respondent dined out. To measure a respondent’s customer share of visits to a restaurant, the questionnaire directly asked how many times a respondent had visited a particular restaurant over the past three months. To obtain more accurate responses to this question, this study included survey respondents who had visited a full-service restaurant in the previous month and a particular restaurant they named in the previous three months.
Lastly, this study included several measures of customer relationships with casual dining restaurant brands as control variables, to avoid any potential confounding effects. All these control variables (i.e., the average frequency of dining out, number of restaurants in the consideration set, relationship duration, and restaurant preference) were necessary for customer loyalty and relationship management [4,32,33]. In this study, customers’ self-reported responses using an online survey were used to measure each control variable. For example, we directly asked how many different casual dining restaurant brands they consider when dining out, how many times they dined out in the past three months, and how long the respondent had been customers. As for brand preference, this study measured three items (e.g., when I make a dining out decision, I consider this restaurant a viable choice very often) used in earlier studies [4,34].
3.3. Data Analysis
The goal of this study is to understand how eWOM influences the customer share of visits in a restaurant context. To do so, we hypothesized the relationship between eWOM characteristics (i.e., valence and volume), the customer share of visits at the individual level, and how the average check of each brand restaurant influences those relationships. To test the hypotheses, we used hierarchical linear modeling (HLM) with SPSS 23. This method is particularly applicable to this study because individual restaurant branches are strictly nested within the restaurant brand under the restaurant franchise system. Thus, applying multilevel modeling can help identify the level-specific difference (in this study, the average check size and eWOM characteristics). More specifically, HLM allowed us to examine whether group memberships (in this study, each restaurant brand’s average check size) influenced relationships associated with level 1 variables (the two dimensions of eWOM on the review website and customer share of visits). Thus, this analytic approach could help us consider both the individual and brand levels simultaneously, which in turn allowed us to determine whether and how the relationships between eWOM and CSOV customer share of visits (level 1) vary by brands (level 2). For the sample size of the multilevel modeling technique, Maas and Hox [35] emphasized the importance of level 2 sample size in estimating regression coefficients and variances without bias and recommended 50 or more groups as an ideal sample size for level 2. However, in their study, all estimated coefficients and variances are unbiased but the second-level standard errors. As our sample for level 2 is 42, our results should be examined with caution, particularly for the second-level variable (i.e., average check size).
4. Results
4.1. Sample Characteristics
Table 1 presents the demographic characteristics of our sample. Of the 243 respondents, 54.5% are male. For the age group, the majority (77.4%) are 50 or older, followed by 30–39 (12.3%), 40–49 (7.4%), and 20–29 (2.9%). Over 60% of respondents graduated from either 4-year college/university or postgraduate studies. Lastly, slightly less than half (45.3%) indicated $40,000–$84,999 as their annual income (before taxes).
4.2. Descriptive Statistics
Table 2 provides descriptive statistics of the restaurant property and brand level and correlations among variables. The eWOM valence was not significantly associated with the customer share of visits at the individual restaurant branch level (r = 0.026). On the other hand, the correlation between eWOM volume and the customer share of visits is statically significant (r = 0.118). Both eWOM valence and volume were positively correlated with the average check size (r = 0.156) at the restaurant brand level (r = 0.292). Several control variables at the individual branch level (e.g., frequency, consideration set, and preference) were statistically related to the customer share of visits. The additional χ2 Kruskal–Wallis test indicated significant differences across the 41 brands in terms of eWOM valence (x240= 101.628, p < 0.000) and eWOM volume (x240 = 155.843, p < 0.000). Thus, eWOM valence and volume had differential effects on the customer share of visits for various restaurant brands.
4.3. Hypotheses Testing
Table 3 presents the estimates of the model coefficients and the variance components estimated for the models using HLM. First, a simplified version of the HLM (that is, a one-way analysis of variance (ANOVA) with random effects model) was estimated, where the coefficients on all property and restaurant brand characteristics were set to zero. This model can be used to check for any variation in eWOM for different restaurant branches across brands. In model 2, to explain the uncontaminated effect of eWOM on the customer share of visits, the null model includes fixed effects for individual factors as control variables. The null model with control variables explains some of the variance in the customer share of visits but also shows that some level 2 variance remained unexplained (p = 0.191). In model 2, control variables were highly correlated with the outcome, consistent with earlier studies [36,37,38]. People who dine out less often have a lower customer share of visits (β = −0.204, p < 0.001), and people who dine out at more different restaurant brands are associated with a lower customer share of visits (β = −1.170, p < 0.05). The third model, the random coefficient regression model, provides mixed support for the customer share of visits. It shows that eWOM volume is positively associated with the customer share of visits (β = 2.168, p < 0.05), while the effect of valence is not significantly related to the customer share of visits (β = 0.042, p > 0.05). Interestingly, in the third model, we found no random effect of intercepts for valence and volume on the customer share of visits. Moreover, the third model tests whether the average check size for each restaurant brand moderated the relationships between eWOM and the customer share of visits, which was not confirmed by the results.
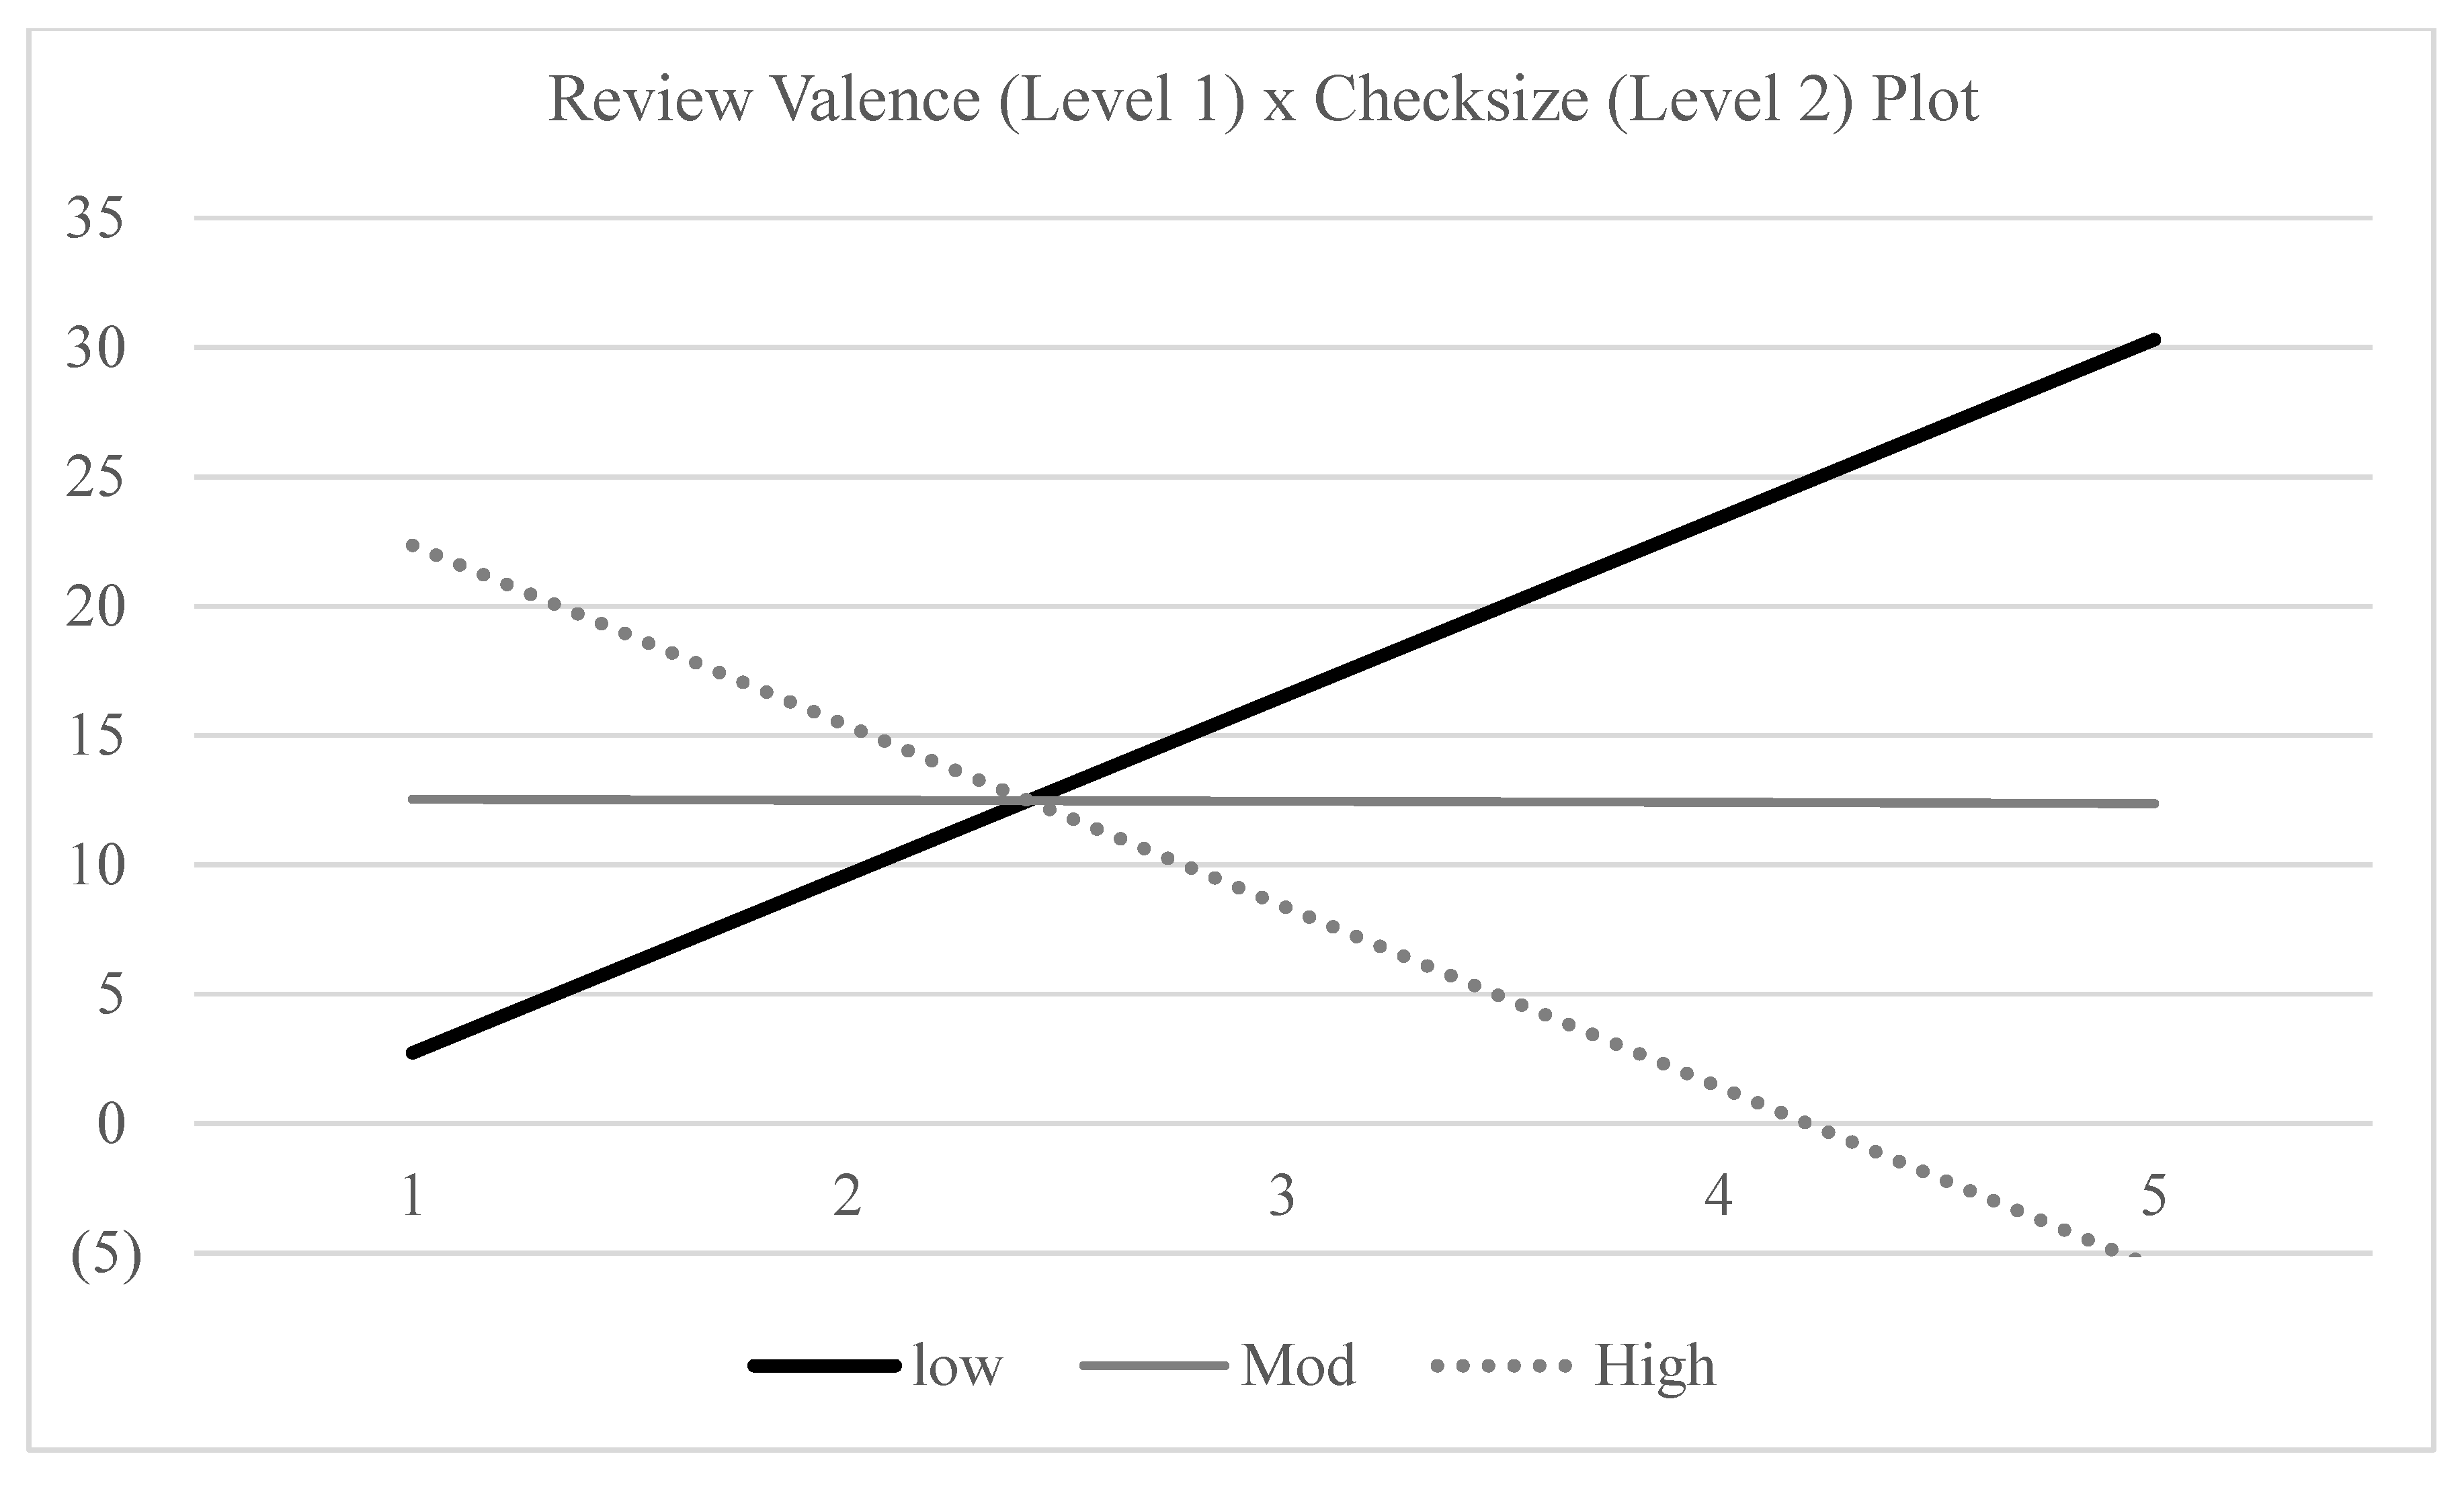
However, in model 4, we found a significant interaction effect between eWOM valence and the average check size on the customer share of visits (see Figure 2). Depending on the average check size, a restaurant brand’s sales performance (i.e., customer share of visits) is more or less sensitive to the eWOM valence (i.e., review rating score) but not to the eWOM volume (i.e., the number of reviews). A further test revealed that the effects of valence are positively associated with the customer share of visits for the casual dining restaurant brands with lower average checks (β = 3.316, p < 0.05) but negatively related to the ones with higher average checks (β = ‒8.152, p < 0.05). The effect of the eWOM valence on brand restaurants with high average checks is completely opposed to the effect on brand restaurants with low average checks. However, no significant interaction effect occurred between eWOM volume and average check size and customer share of visits (β = 0.038 for low average check size brands, β = 0.062 for high average check size brands).
5. Conclusion and Implications
The primary purpose of this study is to understand how eWOM (i.e., valence and volume) influences the customer share of visits in a casual dining restaurant context. In particular, this study employed a multilevel modeling approach to examine the direct effect of eWOM on the customer share of visits at the restaurant branch level and the moderating effect of average check size for each restaurant brand on this relationship. Methodologically, this study applied two different approaches, as compared to previous studies focusing on customer share [4,22,23,34]—(1) combining information extracted from online review websites and (2) utilizing multilevel modeling with a nested design (restaurant brand and their branches). This study provides a foundation for further research and a better understanding of eWOM and the customer share of visits. These findings certainly offer restaurant owners and managers meaningful insights into how to design online marketing and reputation management strategies to maintain the customer share of visits in a competitive market situation. Besides, the findings may help practitioners to maintain their business economically sustainable in a fast-changing environment.
This study provides several theoretical and managerial implications. First, it incorporated two different features of eWOM simultaneously, valence and volume, into restaurant choice. These findings contribute to the literature on customer share and eWOM. Unlike previous studies, which mainly focused on the hotel context in hospitality research, this study suggests that star ratings had no significant direct effect on the customer share of visits in the restaurant industry. This result could be due to the difference in consumption and choice between restaurants and hotel stays. Restaurant experiences tend to be less risky (i.e., a relatively smaller amount of money is spent on purchases) and relatively more frequent than hotel stays. In other words, dining out is an ordinary activity in our daily lives, which mitigates the potential negative impact of the risky decision and overall experience in a particular restaurant.
Second, this research offers insights into user-generated online content and its importance, particularly on Yelp, for the restaurant industry. This study goes beyond previous work [15,39,40] by showing the relative magnitude of online ratings on different restaurant brand segments. This study also found that average review ratings had a more significant effect on restaurant brands generating a larger average check size, but the volume of online reviews did not drive the customer share of visits to restaurant brands at all. Our results indicate that highly positive ratings on social media are a good proxy for customers, mainly those who visit casual dining restaurant brands. Restaurant managers may wish to address customer concerns in an accurate and timely manner and increase their restaurant review scores without necessarily aiming for more reviews. On the other hand, for upscale/fine dining restaurant brands, managers may not benefit significantly from higher star ratings. It may be that having positive scores becomes a signal that a particular restaurant is associated with higher quality. Customers for this restaurant segment may rely more on their own experiences, not the opinions of reviewers; thus, for special occasions at fine dining restaurants, personal experiences are more essential than eWOM in deciding where to dine. These inconsistent results between valence and volume imply that for casual dining restaurant brands, online reputation (e.g., review ratings as a quality signal) is more important than the online popularity (e.g., number of reviews as a popularity signal).
Third, while they were not the focus of this study, the findings related to the four control variables merit further attention. In our models, four variables (i.e., number of dining out experiences, the size of the consideration set, relationship duration, and brand preference) were included as control variables. Many previous studies found that these variables are closely associated with brand loyalty and customer share [1,22,32,33]. Contrary to our expectations, brand preference was not a significant determinant of the customer share of visits in our study. Casual dining customers in our samples were more likely habitual visitors, implying that brand preference is no longer critical. Further investigation is needed to have a clear idea of this relationship. Besides, the other three control variables turned out to be significant determinants of customer share, which is consistent with earlier studies [32,33].
The foremost limitations of this study were the variance issues in the data structure. For within-group and across-group variance, only 4% of the variance (=16.341) in the customer share of visits was due to between-group factors, while the remaining 96% of the variance (=433.607) was due to within-group factors. Therefore, including several individuals within the branch and individual factors (e.g., involvement, intrinsic variety seeking, and intrinsic inertia) should also be considered to further understand the role of eWOM on the customer share of visits. Second, in this study, data from Yelp.com were only collected for only one period. However, eWOM valence and volume are dynamic, which may influence the customer share of visits differently at different times. Therefore, a longitudinal study could help explain the time effect of eWOM on the customer share of visits. The eWOM data at one time could be used to predict outcomes in a subsequent time period, thereby providing more robust support for the conclusion that eWOM does have brand-level effects. Lastly, this study focused only on customers in the United States; therefore, our study’s results may not apply to other regions, areas, and countries. Future studies should validate the results of the current study using other samples and data.
Author Contributions
Conceptualization, J.B.; methodology, J.B. and Y.C.; software, J.B.; validation Y.C.; formal analysis, J.B.; investigation, J.B. and Y.C.; resources, J.B. and Y.C.; data curation, Y.C.; writing—original draft preparation, J.B.; writing—review and editing, J.B. and Y.C.; visualization, J.B.; supervision, Y.C.; project administration, J.B. All authors have read and agreed to the published version of the manuscript.
Funding
This research received no external funding.
Conflicts of Interest
The authors declare no conflict of interest.
References
- Verhoef, P.C. Understanding the Effect of Customer Relationship Management Efforts on Customer Retention and Customer Share Development. J. Mark. 2003, 67, 30–45. [Google Scholar] [CrossRef]
- Cooil, B.; Keiningham, T.L.; Aksoy, L.; Hsu, M. A longitudinal analysis of customer satisfaction and share of wallet: Investigating the moderating effect of customer characteristics. J. Mark. 2007, 71, 67–83. [Google Scholar] [CrossRef] [Green Version]
- Coyles, S.; Gokey, T.C. Customer retention is not enough: Defecting customers are far less of a problem than customers who change their buying patterns. New ways of understanding these changes can unlock the power of loyalty. Mckinsey Q. 2002, 81–90. [Google Scholar]
- Kim, W.; Ok, C.; Canter, D.D. Contingency variables for customer share of visits to full-service restaurant. Int. J. Hosp. Manag. 2010, 29, 136–147. [Google Scholar] [CrossRef]
- Keiningham, T.L.; Perkins-Munn, T.; Evans, H. The impact of customer satisfaction on share-of-wallet in a business-to-business environment. J. Serv. Res. 2003, 6, 37–50. [Google Scholar] [CrossRef]
- Gursoy, D. A critical review of determinants of information search behavior and utilization of online reviews in decision making process. Int. J. Hosp. Manag. 2019, 76, 53–60. [Google Scholar] [CrossRef]
- Xiang, Z. From digitization to the age of acceleration: On information technology and tourism. Tour. Manag. Perspect. 2018, 25, 147–150. [Google Scholar] [CrossRef]
- Xiang, Z.; Gretzel, U. Role of social media in online travel information search. Tour. Manag. 2010, 31, 179–188. [Google Scholar] [CrossRef]
- Fernández-Miguélez, S.M.; Díaz-Puche, M.; Campos-Soria, J.A.; Galán-Valdivieso, F. The Impact of Social Media on Restaurant Corporations’ Financial Performance. Sustainability 2020, 12, 1646. [Google Scholar] [CrossRef] [Green Version]
- Ladhari, R.; Michaud, M. eWOM effects on hotel booking intentions, attitudes, trust, and website perceptions. Int. J. Hosp. Manag. 2015, 46, 36–45. [Google Scholar] [CrossRef]
- Melián-González, S.; Bulchand-Gidumal, J.; González López-Valcárcel, B. Online customer reviews of hotels: As participation increases, better evaluation is obtained. Cornell Hosp. Q. 2013, 54, 274–283. [Google Scholar] [CrossRef]
- Payne, J.W.; Bettman, J.R.; Johnson, E.J. Behavioral decision research: A constructive processing perspective. Annu. Rev. Psychol. 1992, 43, 87–131. [Google Scholar] [CrossRef]
- Coulter, K.S.; Roggeveen, A. Deal or no deal? J. Res. Interact. Mark. 2012, 6, 78–95. [Google Scholar] [CrossRef]
- Park, S.B.; Jang, J.; Ok, C.M. Analyzing Twitter to explore perceptions of Asian restaurants. J. Hosp. Tour. Technol. 2016, 7, 405–422. [Google Scholar] [CrossRef]
- Yang, S.-B.; Hlee, S.; Lee, J.; Koo, C. An empirical examination of online restaurant reviews on Yelp. com. Int. J. Contemp. Hosp. Manag. 2017, 29, 817–839. [Google Scholar] [CrossRef]
- Schlosser, A.E. Can including pros and cons increase the helpfulness and persuasiveness of online reviews? The interactive effects of ratings and arguments. J. Consum. Psychol. 2011, 21, 226–239. [Google Scholar] [CrossRef]
- Sparks, B.A.; Browning, V. The impact of online reviews on hotel booking intentions and perception of trust. Tour. Manag. 2011, 32, 1310–1323. [Google Scholar] [CrossRef] [Green Version]
- Baek, H.; Ahn, J.; Choi, Y. Helpfulness of online consumer reviews: Readers’ objectives and review cues. Int. J. Electron. Commer. 2012, 17, 99–126. [Google Scholar] [CrossRef]
- Mägi, A.W. Share of wallet in retailing: The effects of customer satisfaction, loyalty cards and shopper characteristics. J. Retail. 2003, 79, 97–106. [Google Scholar] [CrossRef]
- Osenton, T. Customer Share Marketing: How The World’s Great Marketers Unlock Profits from Customer Loyalty; FT Press: Upper Saddle River, NJ, USA, 2002. [Google Scholar]
- Rust, R.T.; Lemon, K.N.; Zeithaml, V.A. Return on marketing: Using customer equity to focus marketing strategy. J. Mark. 2004, 68, 109–127. [Google Scholar] [CrossRef] [Green Version]
- Perkins-Munn, T.; Aksoy, L.; Keiningham, T.L.; Estrin, D. Actual purchase as a proxy for share of wallet. J. Serv. Res. 2005, 7, 245–256. [Google Scholar] [CrossRef]
- Dapena-Baron, M.; Gruen, T.W.; Guo, L. Heart, head, and hand: A tripartite conceptualization, operationalization, and examination of brand loyalty. J. Brand Manag. 2020, 27, 355–375. [Google Scholar] [CrossRef]
- Paddock, J.; Warde, A.; Whillans, J. The changing meaning of eating out in three English cities 1995-2015. Appetite 2017, 119, 5–13. [Google Scholar] [CrossRef] [PubMed] [Green Version]
- Zaki Ahmed, A.; Rodríguez-Díaz, M. Analyzing the Online Reputation and Positioning of Airlines. Sustainability 2020, 12, 1184. [Google Scholar] [CrossRef] [Green Version]
- Lin, C.-L.; Lee, S.-H.; Horng, D.-J. The effects of online reviews on purchasing intention: The moderating role of need for cognition. Soc. Behav. Personal. Int. J. 2011, 39, 71–81. [Google Scholar] [CrossRef]
- Blal, I.; Sturman, M.C. The differential effects of the quality and quantity of online reviews on hotel room sales. Cornell Hosp. Q. 2014, 55, 365–375. [Google Scholar] [CrossRef] [Green Version]
- Hu, N.; Bose, I.; Koh, N.S.; Liu, L. Manipulation of online reviews: An analysis of ratings, readability, and sentiments. Decis. Support Syst. 2012, 52, 674–684. [Google Scholar] [CrossRef]
- Vermeulen, I.E.; Seegers, D. Tried and tested: The impact of online hotel reviews on consumer consideration. Tour. Manag. 2009, 30, 123–127. [Google Scholar] [CrossRef]
- Kwok, L.; Xie, K.L.; Richards, T. Thematic framework of online review research. Int. J. Contemp. Hosp. Manag. 2017, 29, 307–354. [Google Scholar] [CrossRef]
- Tsao, W.-C.; Hsieh, M.-T.; Shih, L.-W.; Lin, T.M.Y. Compliance with eWOM: The influence of hotel reviews on booking intention from the perspective of consumer conformity. Int. J. Hosp. Manag. 2015, 46, 99–111. [Google Scholar] [CrossRef]
- Evanschitzky, H.; Ramaseshan, B.; Woisetschläger, D.M.; Richelsen, V.; Blut, M.; Backhaus, C. Consequences of customer loyalty to the loyalty program and to the company. J. Acad. Mark. Sci. 2011, 40, 625–638. [Google Scholar] [CrossRef]
- Dagger, T.S.; Danaher, P.J.; Gibbs, B.J. How Often Versus How Long. J. Serv. Res. 2008, 11, 371–388. [Google Scholar] [CrossRef]
- Hwang, J.; Ok, C. The antecedents and consequence of consumer attitudes toward restaurant brands: A comparative study between casual and fine dining restaurants. Int. J. Hosp. Manag. 2013, 32, 121–131. [Google Scholar] [CrossRef]
- Maas, C.J.; Hox, J.J. Sufficient sample sizes for multilevel modeling. Methodology 2005, 1, 86–92. [Google Scholar] [CrossRef] [Green Version]
- Chi, C.G.-q. An examination of destination loyalty: Differences between first-time and repeat visitors. J. Hosp. Tour. Res. 2012, 36, 3–24. [Google Scholar] [CrossRef]
- Payne, A.; Storbacka, K.; Frow, P.; Knox, S. Co-creating brands: Diagnosing and designing the relationship experience. J. Bus. Res. 2009, 62, 379–389. [Google Scholar] [CrossRef]
- Prentice, C. Service quality perceptions and customer loyalty in casinos. Int. J. Contemp. Hosp. Manag. 2013, 25, 49–64. [Google Scholar] [CrossRef]
- Kim, S.; Koh, Y.; Cha, J.; Lee, S. Effects of social media on firm value for US restaurant companies. Int. J. Hosp. Manag. 2015, 49, 40–46. [Google Scholar] [CrossRef]
- Kim, W.G.; Li, J.J.; Brymer, R.A. The impact of social media reviews on restaurant performance: The moderating role of excellence certificate. Int. J. Hosp. Manag. 2016, 55, 41–51. [Google Scholar] [CrossRef]
Figure 1.
Conceptual Model. Note: CSOV (Customer Share of Visits).

Figure 2.
Interaction Effect of Review Valence (Level 1) and Check Size (Level 2).


Table 1.
Sample Characteristics (n = 243).
| Freq. 1 | Pct. 2 | Freq. | Pct | ||
|---|---|---|---|---|---|
| Gender | Annual income | ||||
| Male | 130 | 53.5 | Under $25,000 | 14 | 5.8 |
| Female | 113 | 46.5 | $25,000–$39,999 | 27 | 11.1 |
| Age | $40,000–$54,999 | 40 | 16.5 | ||
| 20–29 | 7 | 2.9 | $55,000–$69,999 | 33 | 13.6 |
| 30–39 | 30 | 12.3 | $70,000–$84,999 | 37 | 15.2 |
| 40–49 | 18 | 7.4 | $85,000–$99,999 | 27 | 11.1 |
| 50 or older | 188 | 77.4 | Over $100,000 | 65 | 26.7 |
| Highest education obtained | |||||
| Less than high school | 1 | 0.4 | |||
| High school | 31 | 12.8 | |||
| 2-year college | 50 | 20.6 | |||
| 4 year college or university | 90 | 37.0 | |||
| Postgraduate | 71 | 29.2 |
1 Frequency. 2 Percentage.
Table 2.
Descriptive Statistics and Correlations among Variables.
| M | SD | 1 | 2 | 3 | 4 | 5 | 6 | 7 | |
|---|---|---|---|---|---|---|---|---|---|
| 1. CSOV 1 | 25.33 | 21.19 | 1.00 | ||||||
| 2. eWOM Volume | 59.58 | 106.41 | 0.026 | 1.00 | |||||
| 3. eWOM Valence | 3.26 | 0.71 | 0.118 * | 0.244 ** | 1.00 | ||||
| 4. Avg. Check size | 32.11 | 36.53 | −0.020 | 156 * | 0.292 ** | 1.00 | |||
| 5. Frequency | 36.63 | 42.13 | 0.281 ** | −0.048 | -0.140 * | 0.070 | 1.00 | ||
| 6. Consideration Set | 6.98 | 3.84 | −0.269 ** | −0.034 | −0.011 | −0.070 | 0.225 | 1.00 | |
| 7. Preference | 4.79 | 1.36 | 0.076 | 0.162 * | 0.281 ** | 0.231 ** | 0.053 | −0.048 | 1.00 |
Note: CSOV (Customer Share of Visits). * p < 0.05, ** p < 0.01, *** p < 0.001.
Table 3.
The Results of Hierarchical Linear Models.
| Model 1 | Model 2 | Model 3 | Model 4 | |
|---|---|---|---|---|
| Null Model | Null Model with Control Variables | Random Coefficient Regression Models | Random Coefficient Regression Models with Interaction Terms | |
| Intercept | ||||
| Intercept | 20.823 (1.359) | 14.320 (8.452) * | 14.057 (7.324) * | 13.765 (7.282) * |
| Ave. Check size | −0.022 (0.035) | −0.035 (0.036) | ||
| eWOM Valence | ||||
| Intercept | 0.665 (1.758) | 2.108 (2.332) | 0.964 (2.414) | |
| Avg. Check size | - | - | ||
| eWOM Volume | ||||
| Intercept | 0.008 (0.012) | 0.042 (0.021) ** | 0.045 (0.021) ** | |
| Avg. Check size | - | - | ||
| eWOM Valence * Avg. Check size | −0.165 (0.097) * | |||
| eWOM Volume * Avg. Check size | 0.001 (0.001) | |||
| Control | ||||
| Average frequency of Dining-out | −0.204 (0.040) *** | −0.046 (0.035) | 3.783 (1.157) *** | |
| Number of Restaurant in Consideration Set | −1.170 (0.318) ** | −1.371 (0.339) *** | −1.339 (0.3384) ** | |
| Relationship Duration | 3.197 (1.103) ** | 4.006 (1.157) *** | 3.783 (1.157) *** | |
| Restaurant Preference | 1.196 (0.171) *** | 0.959 (0.968) | 1.115 (0.968) | |
| Variance Component | ||||
| Intercept | 402.957 (39.816) | 389.377 (35.545) | 379.888 (34.679) | |
| Level 1 | 13.0441 (20.591) | 11.209 (19.724) | - | |
| Slope for valence | - | - | - | |
| Slope for volume | - | - | - |
Note: eWOM valence and volume were group-mean centered and average check size was grand-mean centered in the various models, * < 0.05, ** < 0.01, *** < 0.001.
© 2020 by the authors. Licensee MDPI, Basel, Switzerland. This article is an open access article distributed under the terms and conditions of the Creative Commons Attribution (CC BY) license (http://creativecommons.org/licenses/by/4.0/).
Share and Cite
MDPI and ACS Style
Baek, J.; Choe, Y. Differential Effects of the Valence and Volume of Online Reviews on Customer Share of Visits: The Case of US Casual Dining Restaurant Brands. Sustainability 2020, 12, 5408. https://doi.org/10.3390/su12135408
AMA Style
Baek J, Choe Y. Differential Effects of the Valence and Volume of Online Reviews on Customer Share of Visits: The Case of US Casual Dining Restaurant Brands. Sustainability. 2020; 12(13):5408. https://doi.org/10.3390/su12135408
Chicago/Turabian StyleBaek, Jooa, and Yeongbae Choe. 2020. "Differential Effects of the Valence and Volume of Online Reviews on Customer Share of Visits: The Case of US Casual Dining Restaurant Brands" Sustainability 12, no. 13: 5408. https://doi.org/10.3390/su12135408
Note that from the first issue of 2016, this journal uses article numbers instead of page numbers. See further details here.