Monitoring Land Surface Deformation Associated with Gold Artisanal Mining in the Zaruma City (Ecuador)

 ,
,
Abstract
:1. Introduction
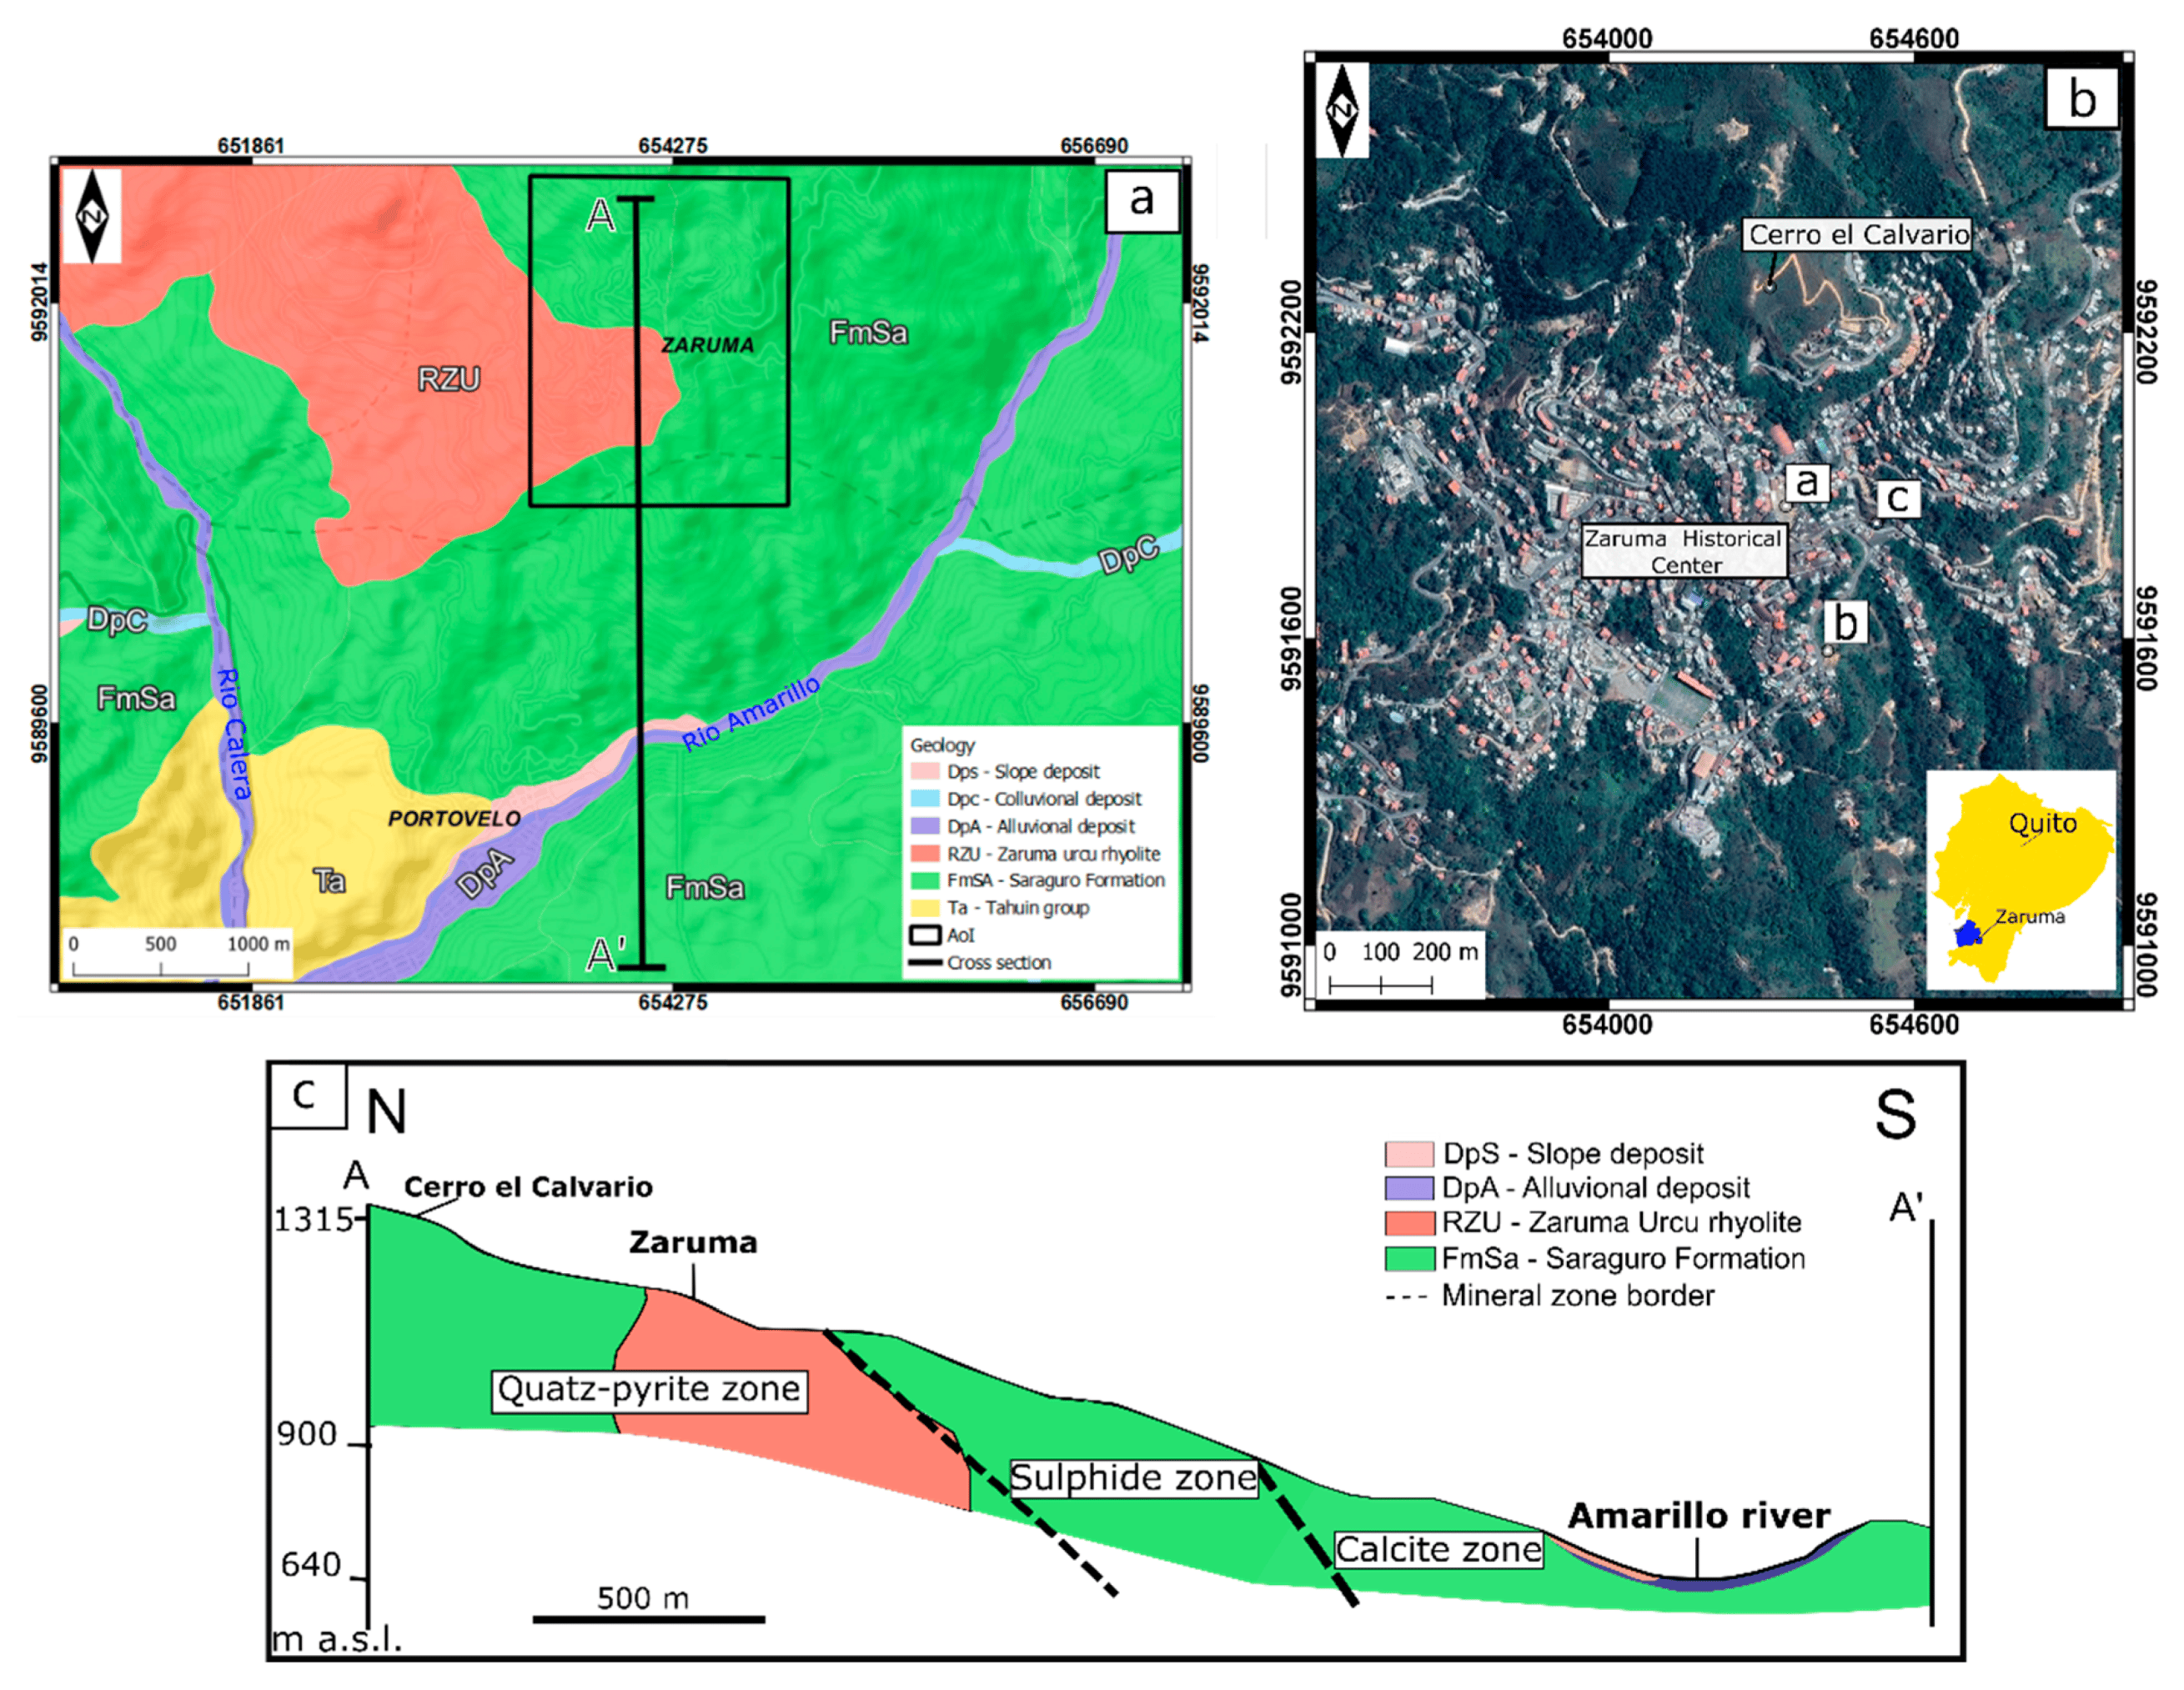
2. Zaruma Geological Setting and Mining Activity
3. Materials and Methods
- Bandwidth is the radius;
- wi is the weight;
- Li is the distance between point i and the (x, y) location.
- Min is the minimum value between the two in the interlude;
- SD is the standard distance;
- Dm is the (weighted) median distance from (weighted) the mean center;
- n is the number of points;
- xi, yi are the coordinates;
- wi is the weight.
4. Results
5. Discussion
6. Conclusions
Author Contributions
Funding
Acknowledgments
Conflicts of Interest
References
- Artisanal and Small-Scale Gold Mining. Available online: www.gold.org/goldmining/responsible-mining/artisanal-and-small-scale-mining (accessed on 11 May 2020).
- Artisanal Mining: The Dangers that Come with the Job. Available online: https://www.mining-technology.com/features/artisanal-mining-the-danger-that-come-with-the-job (accessed on 11 May 2020).
- Bell, F.; Stacey, T.; Genske, D. Mining subsidence and its effect on the environment: Some differing examples. Environ. Geol. 2000, 40, 135–152. [Google Scholar] [CrossRef]
- Gee, D.; Bateson, L.; Sowter, A.; Grebby, S.; Novellino, A.; Cigna, F.; Marsh, S.; Banton, C.; Wyatt, L. Ground motion in areas of abandoned mining: Application of the intermittent SBAS (ISBAS) to the Northumberland and Durham Coalfield, UK. Geosciences 2017, 7, 85. [Google Scholar] [CrossRef] [Green Version]
- Gutiérrez, F.; Parise, M.; De Waele, J.; Jourde, H. A review on natural and human-induced geohazards and impacts in karst. Earth-Sci. Rev. 2014, 138, 61–88. [Google Scholar] [CrossRef]
- Parise, M. A procedure for evaluating the susceptibility to natural and anthropogenic sinkholes. Georisk Assess. Manag. Risk Eng. Syst. Geohazards 2015, 9, 272–285. [Google Scholar] [CrossRef]
- Fazio, N.L.; Perrotti, M.; Lollino, P.; Parise, M.; Vattano, M.; Madonia, G.; Di Maggio, C. A three-dimensional back-analysis of the collapse of an underground cavity in soft rocks. Eng. Geol. 2017, 228, 301–311. [Google Scholar] [CrossRef]
- Fiaschi, S.; Tessitore, S.; Bonì, R.; Di Martire, D.; Achilli, V.; Borgstrom, S.; Ibrahim, A.; Floris, M.; Meisina, C.; Ramondini, M.; et al. From ERS-1/2 to Sentinel-1: Two decades of subsidence monitored through A-DInSAR techniques in the Ravenna area (Italy). GISci. Remote Sens. 2017, 54, 305–328. [Google Scholar] [CrossRef]
- Fan, H.; Gao, X.; Yang, J.; Deng, K.; Yu, Y. Monitoring mining subsidence using a combination of phase-stacking and offset-tracking methods. Remote Sens. 2015, 7, 9166–9183. [Google Scholar] [CrossRef] [Green Version]
- Przyłucka, M.; Herrera, G.; Graniczny, M.; Colombo, D.; Béjar-Pizarro, M. Combination of conventional and advanced DInSAR to monitor very fast mining subsidence with TerraSAR-X Data: Bytom City (Poland). Remote Sens. 2015, 7, 5300–5328. [Google Scholar] [CrossRef] [Green Version]
- Du, Z.; Ge, L.; Li, X.; Ng, A.H.M. Subsidence monitoring over the Southern Coalfield, Australia using both L-Band and C-Band SAR time series analysis. Remote Sens. 2016, 8, 543. [Google Scholar] [CrossRef] [Green Version]
- Pawluszek-Filipiak, K.; Borkowski, A. Monitoring mining-induced subsidence by integrating differential radar interferometry and persistent scatterer techniques. Eur. J. Remote Sens. 2020, 53, 1–3. [Google Scholar] [CrossRef]
- Pawluszek-Filipiak, K.; Borkowski, A. Integration of DInSAR and SBAS Techniques to Determine Mining-Related Deformations Using Sentinel-1 Data: The Case Study of Rydułtowy Mine in Poland. Remote Sens. 2020, 12, 242. [Google Scholar] [CrossRef] [Green Version]
- Billingsley, P. Geology of the Zaruma gold district of Ecuador. Am. Inst. Min. Metall. Eng. 1926, 74, 255–275. [Google Scholar]
- Cando Jácome, M.; Martinez-Graña, A.M.; Valdés, V. Detection of Terrain Deformations Using InSAR Techniques in Relation to Results on Terrain Subsidence (Ciudad de Zaruma, Ecuador). Remote Sens. 2020, 12, 1598. [Google Scholar] [CrossRef]
- Pilatasig, L.; Gordón, D.; Palacios, O.; Sánchez, J. Dominios Litotectónicos Del Sur Del Ecuador y Norte Del Perú; Technical Report; Proyecto Multinacional Andino Geociencias para las Comunidades Andinas-Ecuador-Perú-Canadá, 2015.
- Litherland, M. The Metamorphic Belts of Ecuador; British Geological Survey: Nottingham, UK, 1994. [Google Scholar]
- Pratt, W.; Figueroa, J.; Flores, B. Geology of the Cordillera Occidental of Ecuador between 3°00′ and 4°00′ S. World Bank Min. Dev. Environ. Control Proj. CODIGEM Rep. 1997, 1, 58. [Google Scholar]
- Vikentyev, I.; Banda, R.; Tsepin, A.; Prokofiev, V.; Vikentyeva, O. Mineralogy and formation conditions of Portovelo-Zaruma gold-sulphide vein deposit, Ecuador. Geochem. Mineral. Petrol. 2005, 43, 148–154. [Google Scholar]
- Baldock, J. Geology of Ecuador: Explanatory Bulletin of the National Geological Map of the Republic of Ecuador 1:100,000 Scale 1982; Technical Report; Ministerio de Recursos Naturales y Energéticos: San Francisco, Costa Rica, 1982.
- Van Thournout, F.; Salemink, J.; Valenzuela, G.; Merlyn, M.; Boven, A.; Muchez, P. Portovelo: A volcanic-hosted epithermal vein-system in Ecuador, South America. Miner. Dep. 1996, 31, 269–276. [Google Scholar] [CrossRef]
- Chiaradia, M.; Fontboté, L.; Beate, B. Cenozoic continental arc magmatism and associated mineralization in Ecuador. Miner. Dep. 2004, 39, 204–222. [Google Scholar] [CrossRef]
- Hedenquist, J.W.; Arribas, A.R.; Gonzalez-Urien, E. Exploration for epithermal gold deposits. Rev. Econ. Geol. 2000, 13, 45–77. [Google Scholar]
- González, A.O.O.; Pozo, A.F.R.; Amaya, R.J.G. Inestabilidad del terreno en zonas de actividad minera: Caso ciudad de Zaruma Ecuador. Redes De Ing. 2017, 8, 69–81. [Google Scholar] [CrossRef] [Green Version]
- Murillo, R. ZARUMA, Historia Minera. Identidad en Portovelo; ABYA-YALA: Quito, Ecuador, 2000; Volume 1. [Google Scholar]
- GAD ZARUMA on Twitter: “Colapsó Aula afecta por Hundimiento en la Escuela La Inmaculada. Available online: https://twitter.com/gadzaruma/status/815997958059655168 (accessed on 13 May 2020).
- URGENTE: Nuevo hundimiento en Zaruma activa al COE cantonal—MachalaMovil. Available online: https://machalamovil.com/urgente-nuevo-hundimiento-en-zaruma-activa-al-coe-cantonal/ (accessed on 13 May 2020).
- Zaruma se hunde por la minería clandestina. El Comercio. Available online: http://www.elcomercio.com/actualidad/zaruma-hundimientos-mineria-clandestina-escuela.html (accessed on 13 May 2020).
- Gobierno Nacional Presentará el Plan Zaruma—Portovelo 2022. Available online: http://www.controlminero.gob.ec/goberno-nacional-presentara-el-plan-zaruma-portovelo-2022 (accessed on 11 May 2020).
- Ludizaca Piedra, E.F.; Ochoa Briones, K.H. Propuesta Para Implementación de un Sistema Integrado de Gestión de Riesgos Por Hundimiento de Suelo en la Zona Urbana del Cantón Zaruma; Trabajo de titulación; Environmental engineering, Universidad Politécnica Salesiana: Cuenca, Ecuador, 2018. [Google Scholar]
- Franceschetti, G.; Migliaccio, M.; Riccio, D.; Schirinzi, G. SARAS: A synthetic aperture radar (SAR) raw signal simulator. IEEE Trans. Geosci. Remote Sens. 1992, 30, 110–123. [Google Scholar] [CrossRef]
- Cigna, F.; Confuorto, P.; Novellino, A.; Tapete, D.; Di Martire, D.; Ramondini, M.; Calcaterra, D.; Plank, S.; Ietto, F.; Brigante, A.; et al. 25 years of satellite InSAR monitoring of ground instability and coastal geohazards in the archaeological site of Capo Colonna, Italy. In Proceedings of the SPIE 10003, SAR Image Analysis, Modeling, and Techniques XVI, Edinburgh, UK, 18 October 2016. [Google Scholar] [CrossRef] [Green Version]
- Pappalardo, G.; Mineo, S.; Angrisani, A.C.; Di Martire, D.; Calcaterra, D. Combining field data with infrared thermography and DInSAR surveys to evaluate the activity of landslides: The case study of Randazzo Landslide (NE Sicily). Landslides 2018, 15, 1–21. [Google Scholar] [CrossRef]
- Pastor, J.L.; Tomás, R.; Lettieri, L.; Riquelme, A.; Cano, M.; Infante, D.; Ramondini, M.; Di Martire, D. Multi-Source Data Integration to Investigate a Deep-Seated Landslide Affecting a Bridge. Remote Sens. 2019, 11, 1878. [Google Scholar] [CrossRef] [Green Version]
- Pepe, S.; De Siena, L.; Barone, A.; Castaldo, R.; D’Auria, L.; Manzo, M.; Casu, M.; Fedi, M.; Lanari, R.; Bianco, F.; et al. Volcanic structures investigation through SAR and seismic interferometric methods: The 2011–2013 Campi Flegrei unrest episode. Remote Sens. Environ. 2019, 234, 111440. [Google Scholar] [CrossRef]
- Ferretti, A.; Prati, C.; Rocca, F. Permanent scatterers in SAR interferometry. IEEE Trans. Geosci. Remote Sens. 2001, 39, 8–20. [Google Scholar] [CrossRef]
- European Space Agency—ESA, Sentinels Scientific Data Hub. Available online: https://scihub.copernicus.eu (accessed on 13 May 2020).
- Mora, O.; Mallorqui, J.J.; Broquetas, A. Linear and nonlinear terrain deformation maps from a reduced set of interferometric SAR images. Geosci. Remote Sens. 2003, 41, 2243–2253. [Google Scholar] [CrossRef]
- Iglesias, R.; Mallorqui, J.J.; Monells, D.; López-Martínez, C.; Fabregas, X.; Aguasca, A.; Gili, J.A.; Corominas, J. PSI deformation map retrieval by means of temporal sublook coherence on reduced sets of SAR images. Remote Sens. 2015, 7, 530–563. [Google Scholar] [CrossRef] [Green Version]
- Silverman, B.W. Density Estimation for Statistics and Data Analysis; Chapman and Hall: London, UK, 1986. [Google Scholar]
- Lu, P.; Casagli, N.; Catani, F.; Tofani, V. Persistent Scatterers Interferometry Hotspot and Cluster Analysis (PSI-HCA) for detection of extremely slow-moving landslides. Int. J. Remote Sens. 2012, 33, 466–489. [Google Scholar] [CrossRef]
- Bonì, R.; Pilla, G.; Meisina, C. Methodology for detection and interpretation of ground motion areas with the A-DInSAR time series analysis. Remote Sens. 2016, 8, 686. [Google Scholar] [CrossRef] [Green Version]
- Di Martire, D.; Tessitore, S.; Brancato, D.; Ciminelli, M.G.; Costabile, S.; Costantini, M.; Graziano, G.V.; Minati, F.; Ramondini, M.; Calcaterra, D. Landslide detection integrated system (LaDIS) based on in-situ and satellite SAR interferometry measurements. Catena 2016, 137, 406–421. [Google Scholar] [CrossRef]
- Solari, L.; Barra, A.; Herrera, G.; Bianchini, S.; Monserrat, O.; Béjar-Pizarro, M.; Crosetto, M.; Sarro, R.; Moretti, S. Fast detection of ground motions on vulnerable elements using Sentinel-1 InSAR data. Geomatics 2018, 9, 152–174. [Google Scholar] [CrossRef] [Green Version]
- Solari, L.; Del Soldato, M.; Montalti, R.; Bianchini, S.; Raspini, F.; Thuegaz, P.; Bertolo, D.; Tofani, V.; Casagli, N. A Sentinel-1 based hot-spot analysis: Landslide mapping in north-western Italy. Int. J. Remote Sens. 2019, 40, 7898–7921. [Google Scholar] [CrossRef]
- Colesanti, C.; Wasowski, J. Investigating landslides with space-borne Synthetic Aperture Radar (SAR) interferometry. Eng. Geol. 2006, 88, 173–199. [Google Scholar] [CrossRef]
- Cascini, L.; Fornaro, G.; Peduto, D. Advanced low-and full-resolution DInSAR map generation for slow-moving landslide analysis at different scales. Eng. Geol. 2010, 112, 29–42. [Google Scholar] [CrossRef]
- Morejón, M.; Andrés, E. Aplicación de modelos teóricos para estimar la subsidencia minera que afecta el área de la Unidad Educativa “La Inmaculada Fe y Alegría” cantón Zaruma; Trabajo de titulación; Carrera de Ingeniería en Minas: Quito, Ecuador, 2019. [Google Scholar]
- En Zaruma Piden la Reapertura de su Hospital, Cerrado Hace Cinco Meses. Available online: https://www.elcomercio.com/actualidad/zaruma-reapertura-hospital-mineria-sismo.html (accessed on 13 May 2020).
- ARCOM Realizó en 5 Meses 150 Colapsos Mineros en la Zona de Exclusión de Zaruma. Available online: http://www.controlminero.gob.ec/arcom-realizo-en-5-meses-150-colapsos-mineros-en-la-zona-de-exclusion-de-zaruma. (accessed on 11 May 2020).
- Explotación Minera y Mala Planificación Urbana son los dos Riesgos de Zaruma. Available online: https://www.elcomercio.com/actualidad/zaruma-mineriailegal-planificacionurbana-secretariadegestionderiesgos-eloro.html (accessed on 13 May 2020).
- Sunwoo, C.; Song, W.K.; Ryu, D.W. A case study of subsidence over an abandoned underground limestone mine. Geosyst. Eng. 2010, 13, 147–152. [Google Scholar] [CrossRef]
- Gutiérrez, F. Sinkhole hazards. In Oxford Research Encyclopedia of Natural Hazard Science; 2016; pp. 1–92. Available online: http://oxfordre.com/naturalhazardscience/view/10.1093/acrefore/9780199389407.001.0001/acrefore-9780199389407-e-40?print=pdf (accessed on 13 May 2020).
- Rosdi, M.A.H.M.; Othman, A.N.; Abdul, M.A.M.Z.Z.; Yusoff, Z.M. Sinkhole susceptibility hazard zones using GIS and analytical hierarchical process (AHP): A case study of Kuala Lumpur and Ampang Jaya. Int. Arch. Photogramm. Remote Sens. Spat. Inf. Sci. 2017, XLII-4/W5, 145–151. [Google Scholar] [CrossRef] [Green Version]
- Taheri, K.; Shahabi, H.; Chapi, K.; Shirzadi, A.; Gutiérrez, F.; Khosravi, K. Sinkhole susceptibility mapping: A comparison between Bayes-based machine learning algorithms. Land Degrad. Dev. 2019, 30, 730–745. [Google Scholar] [CrossRef]
- Ardau, F.; Balia, R.; Bianco, M.; De Waele, J. Assessment of cover-collapse sinkholes in SW Sardinia (Italy). Geol. Soc. 2007, 279, 47–57. [Google Scholar] [CrossRef]
- Intrieri, E.; Fontanelli, K.; Bardi, F.; Marini, F.; Carlà, T.; Pazzi, V.; Fanti, R. Definition of sinkhole triggers and susceptibility based on hydrogeomorphological analyses. Environ. Earth Sci. 2018, 77, 4. [Google Scholar] [CrossRef] [Green Version]
- Todd, A.L.; Ivey-Burden, L. A method of mapping sinkhole susceptibility using a geographic information system: A case study for interstates in the karst counties of Virginia. Available online: https://ntlrepository.blob.core.windows.net/lib/55000/55200/55267/UVA_2013-04.pdf (accessed on 13 May 2020).
- Pellicani, R.; Spilotro, G.; Gutiérrez, F. Susceptibility mapping of instability related to shallow mining cavities in a built-up environment. Eng. Geol. 2017, 217, 81–88. [Google Scholar] [CrossRef]
- Parise, M.; Vennari, C. A chronological catalogue of sinkholes in Italy: The first step toward a real evaluation of the sinkhole hazard. In Sinkholes and the Engineering and Environmental Impacts of Karst. In Proceedings of the 13th Multidisciplinary Conference on Sinkholes and the Engineering and Environmental Impacts of Karst, Carlsbad, NM, USA, 6–10 May 2013; Land, L., Doctor, D.H., Stephenson, J.B., Eds.; National Cave and Karst Research Institute, 2013; pp. 383–392. [Google Scholar]


| Satellite | Orbit | Period | Nr Scenes |
|---|---|---|---|
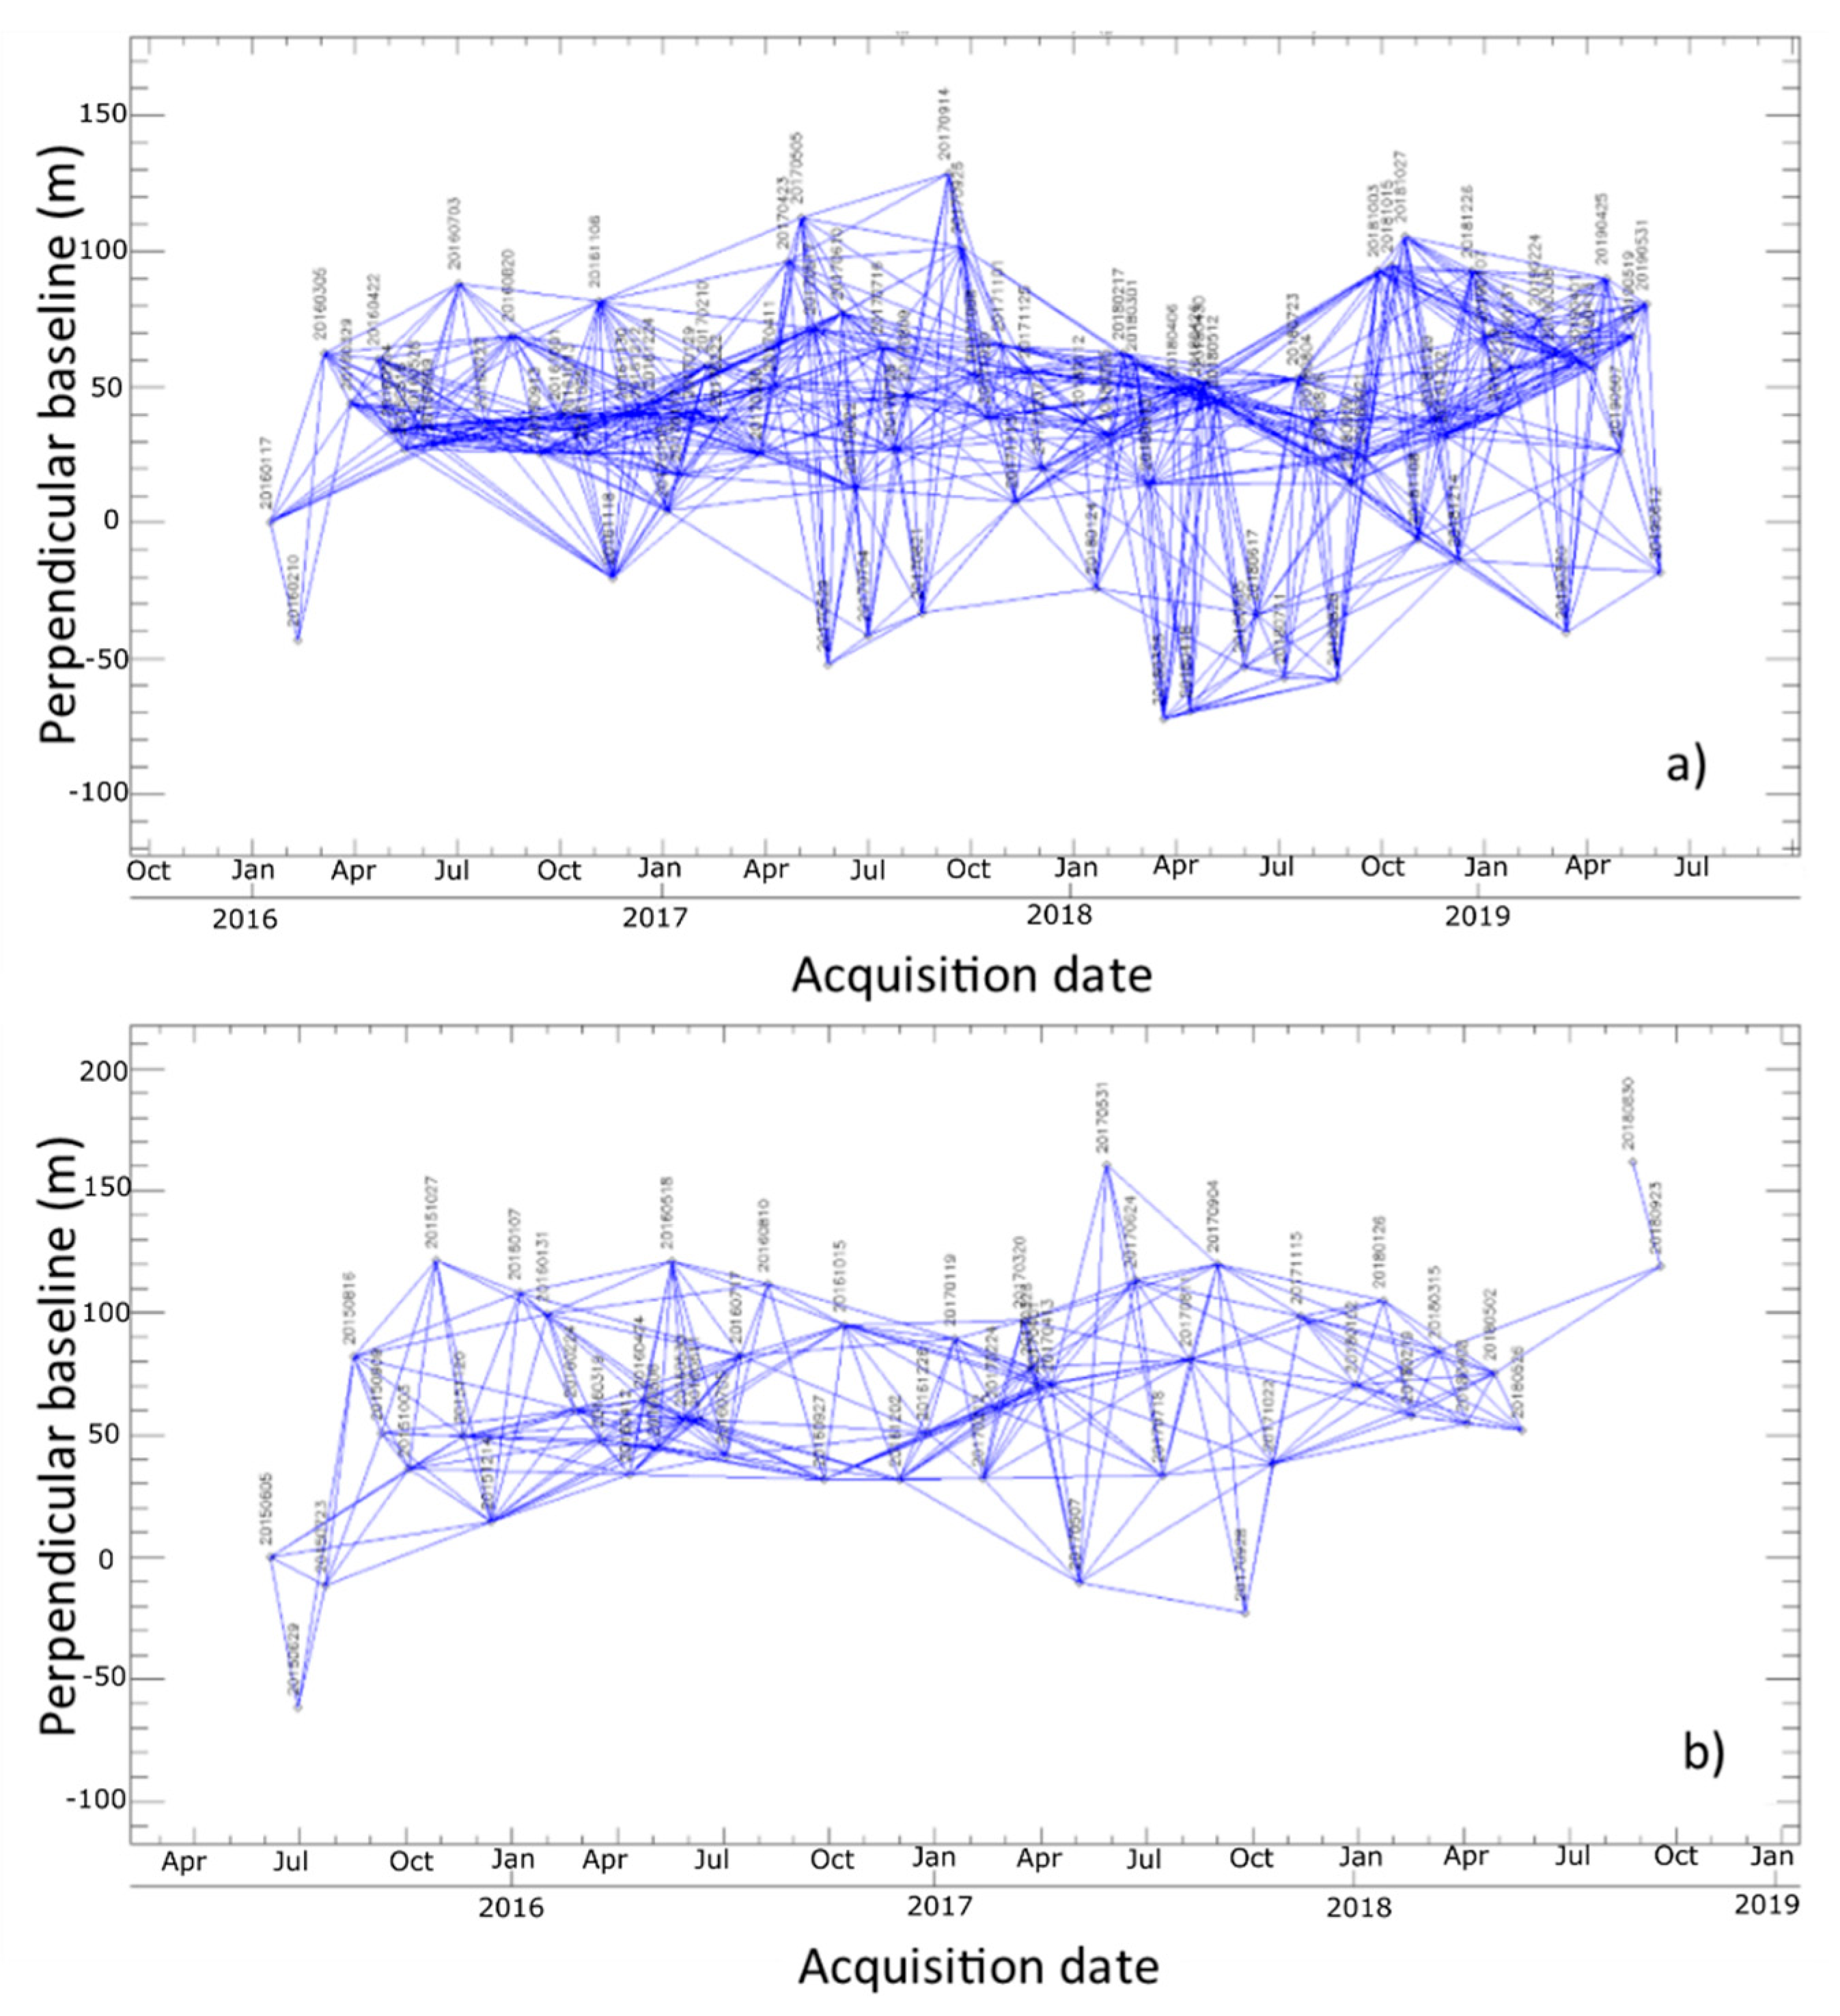
| Sentinel1 A/B | Ascending | 17/01/2016–12/062019 | 89 |
| Sentinel1 A/B | Descending | 05/062015–23/092018 | 51 |
| Unstable Area | Probable Cause |
|---|---|
| UA1 | Reported tunnels |
| UA2 | Reported tunnels |
| UA3 | Reported tunnels |
| UA4 | Unknown tunnels/Landslide |
| UA5 | Unknown tunnels/Landslide |
| UA6 | Unknown tunnels |
| UA7 | Reported and unknown tunnels |
| UA8 | Unknown tunnels |
| UA9 | Unknown tunnels |
| UA10 | Unknown tunnels |
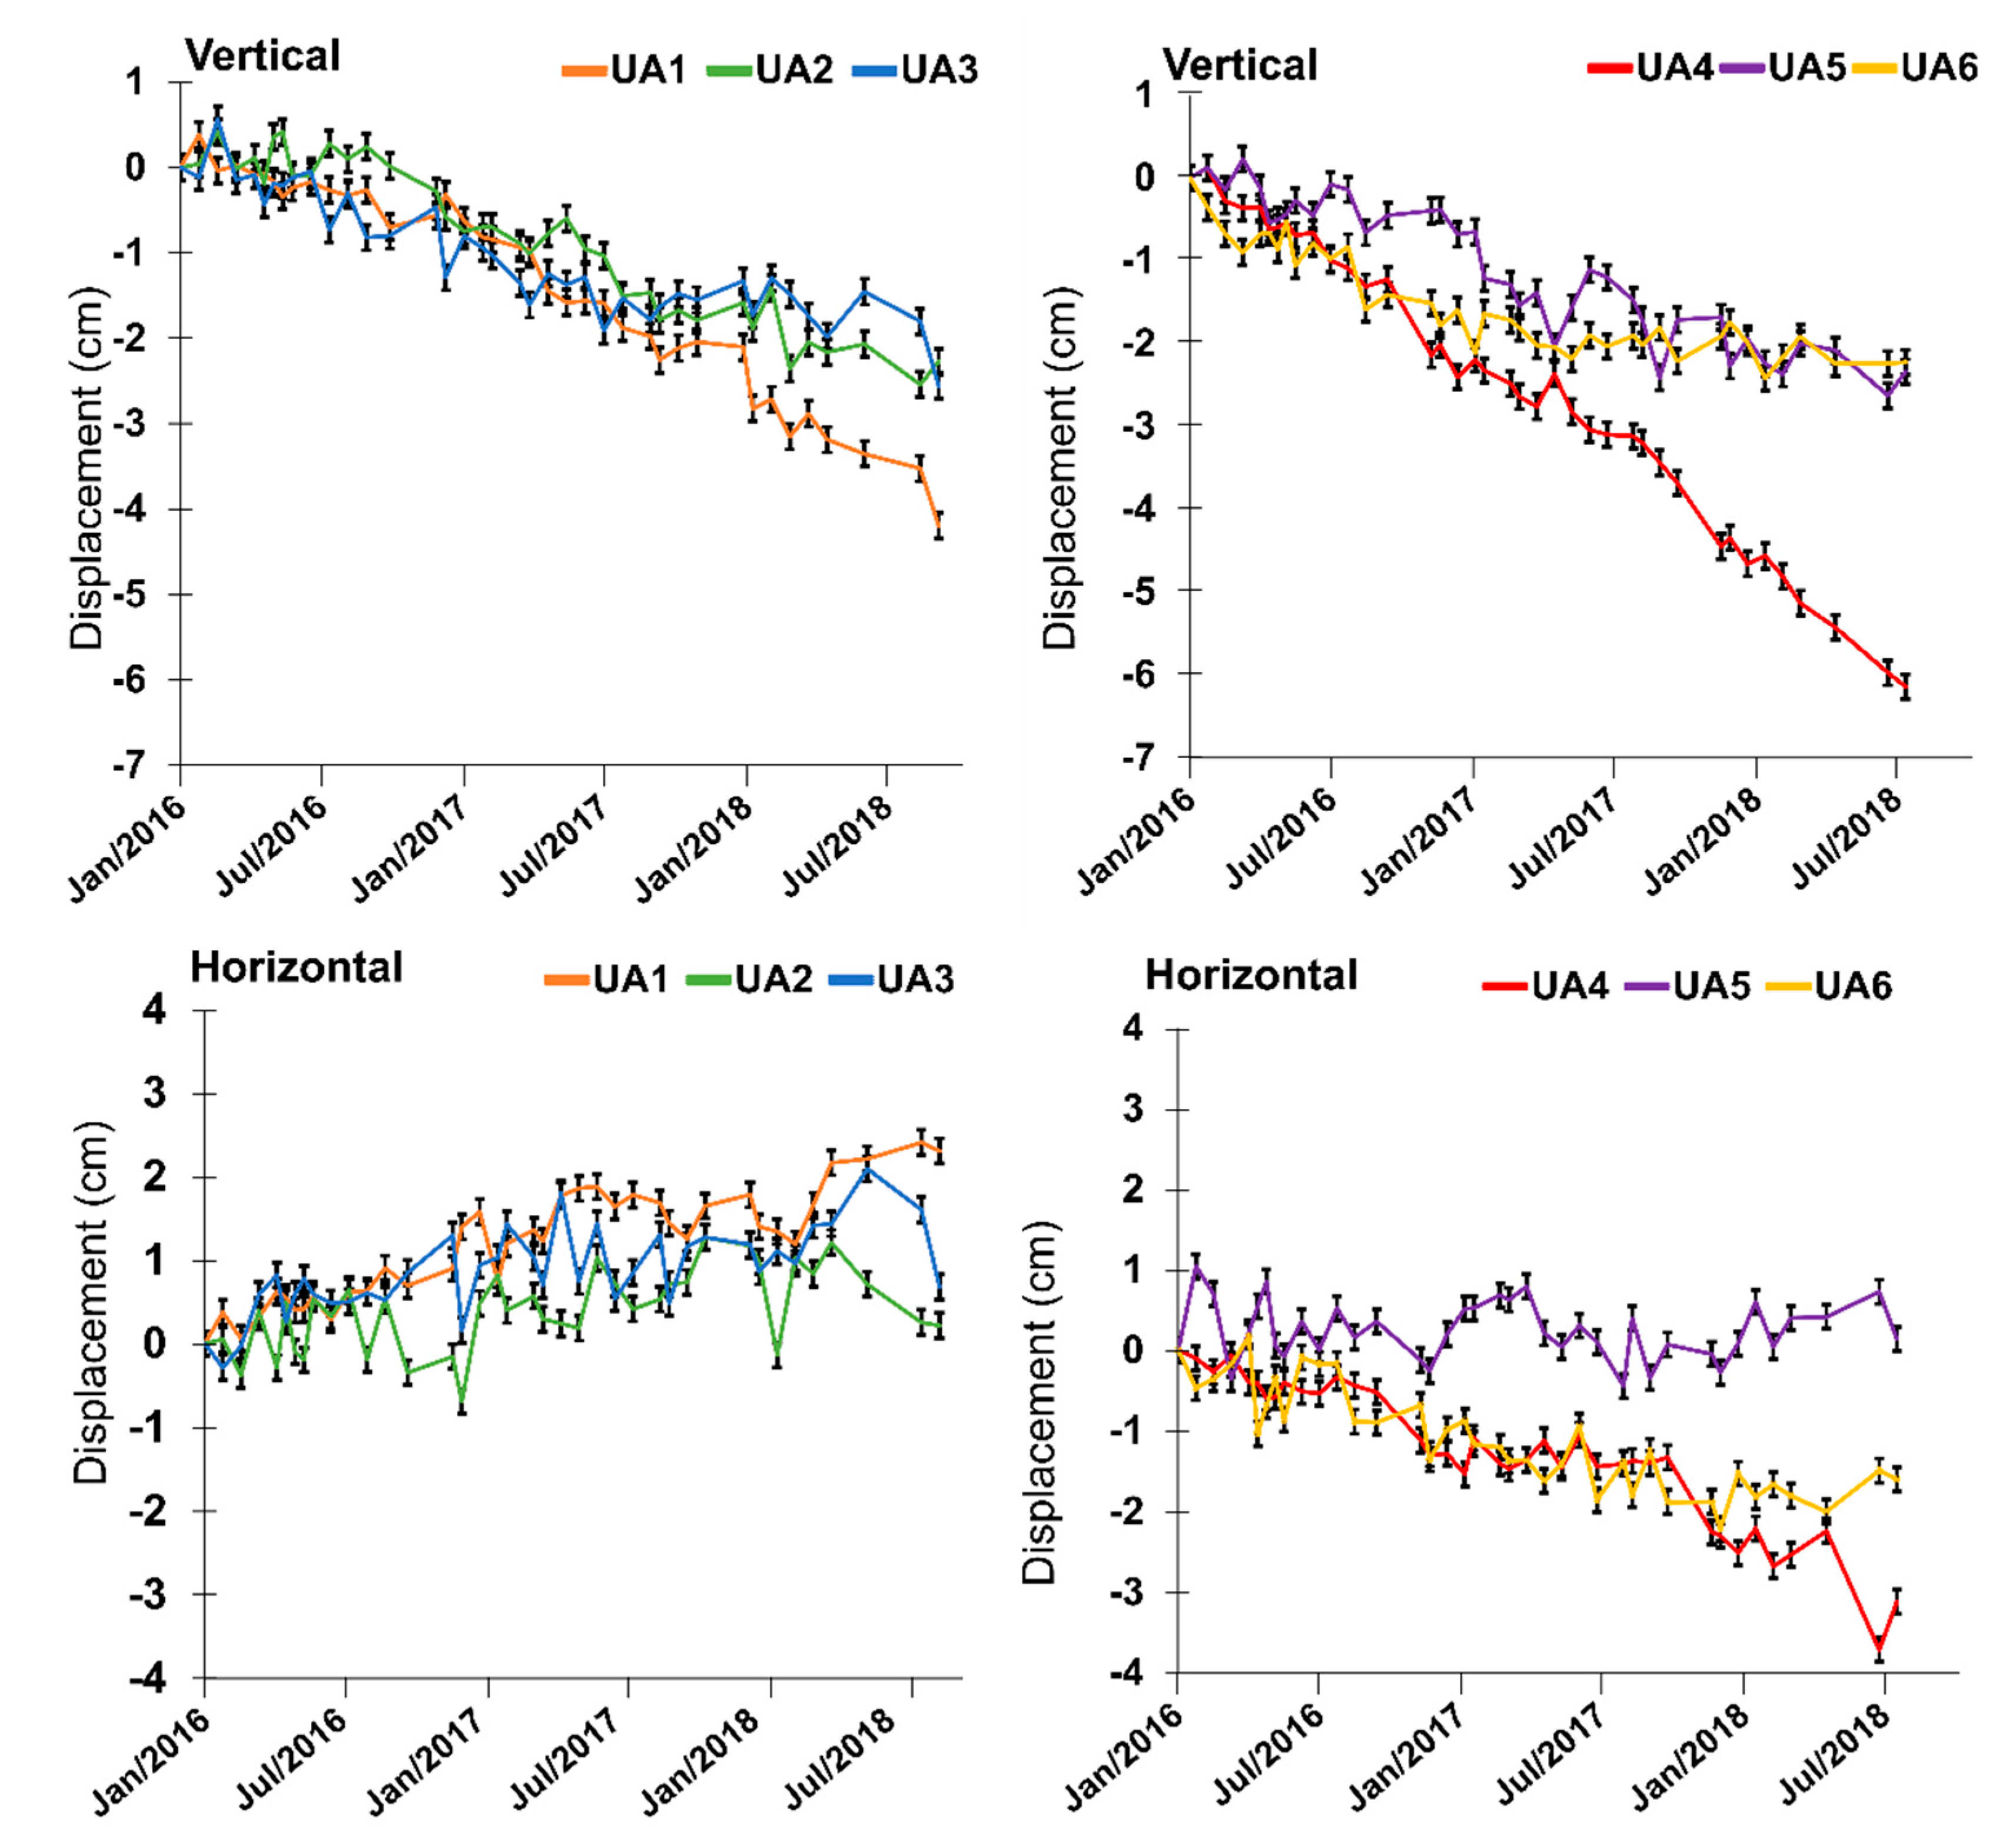
| DLoS Ascending (cm) | DLoS Descending (cm) | Dvertical (cm) | Dhorizontal (cm) | |
|---|---|---|---|---|
| UA1 | 5.0 | 3.0 | 4.0 | 2.0 |
| UA2 | 2.5 | 2.0 | 2.0 | 0.2 |
| UA3 | 3.0 | 2.0 | 2.5 | 0.5 |
| UA4 | 3.5 | 6.0 | 6.0 | 3.0 |
| UA5 | 2.0 | 2.5 | 2.5 | 0.2 |
| UA6 | 1.5 | 2.5 | 2.5 | 1.5 |
© 2020 by the authors. Licensee MDPI, Basel, Switzerland. This article is an open access article distributed under the terms and conditions of the Creative Commons Attribution (CC BY) license (http://creativecommons.org/licenses/by/4.0/).
Share and Cite
Ammirati, L.; Mondillo, N.; Rodas, R.A.; Sellers, C.; Di Martire, D. Monitoring Land Surface Deformation Associated with Gold Artisanal Mining in the Zaruma City (Ecuador). Remote Sens. 2020, 12, 2135. https://doi.org/10.3390/rs12132135
Ammirati L, Mondillo N, Rodas RA, Sellers C, Di Martire D. Monitoring Land Surface Deformation Associated with Gold Artisanal Mining in the Zaruma City (Ecuador). Remote Sensing. 2020; 12(13):2135. https://doi.org/10.3390/rs12132135
Chicago/Turabian StyleAmmirati, Lorenzo, Nicola Mondillo, Ricardo Adolfo Rodas, Chester Sellers, and Diego Di Martire. 2020. "Monitoring Land Surface Deformation Associated with Gold Artisanal Mining in the Zaruma City (Ecuador)" Remote Sensing 12, no. 13: 2135. https://doi.org/10.3390/rs12132135