Evaluation of Imaging Software Accuracy for 3-Dimensional Analysis of the Mandibular Condyle. A Comparative Study Using a Surface-to-Surface Matching Technique

 ,
,  , , ,
, , , 
Abstract
:1. Introduction
2. Materials and Methods
2.1. Step 1—3D Model Superimposition and Final Registration
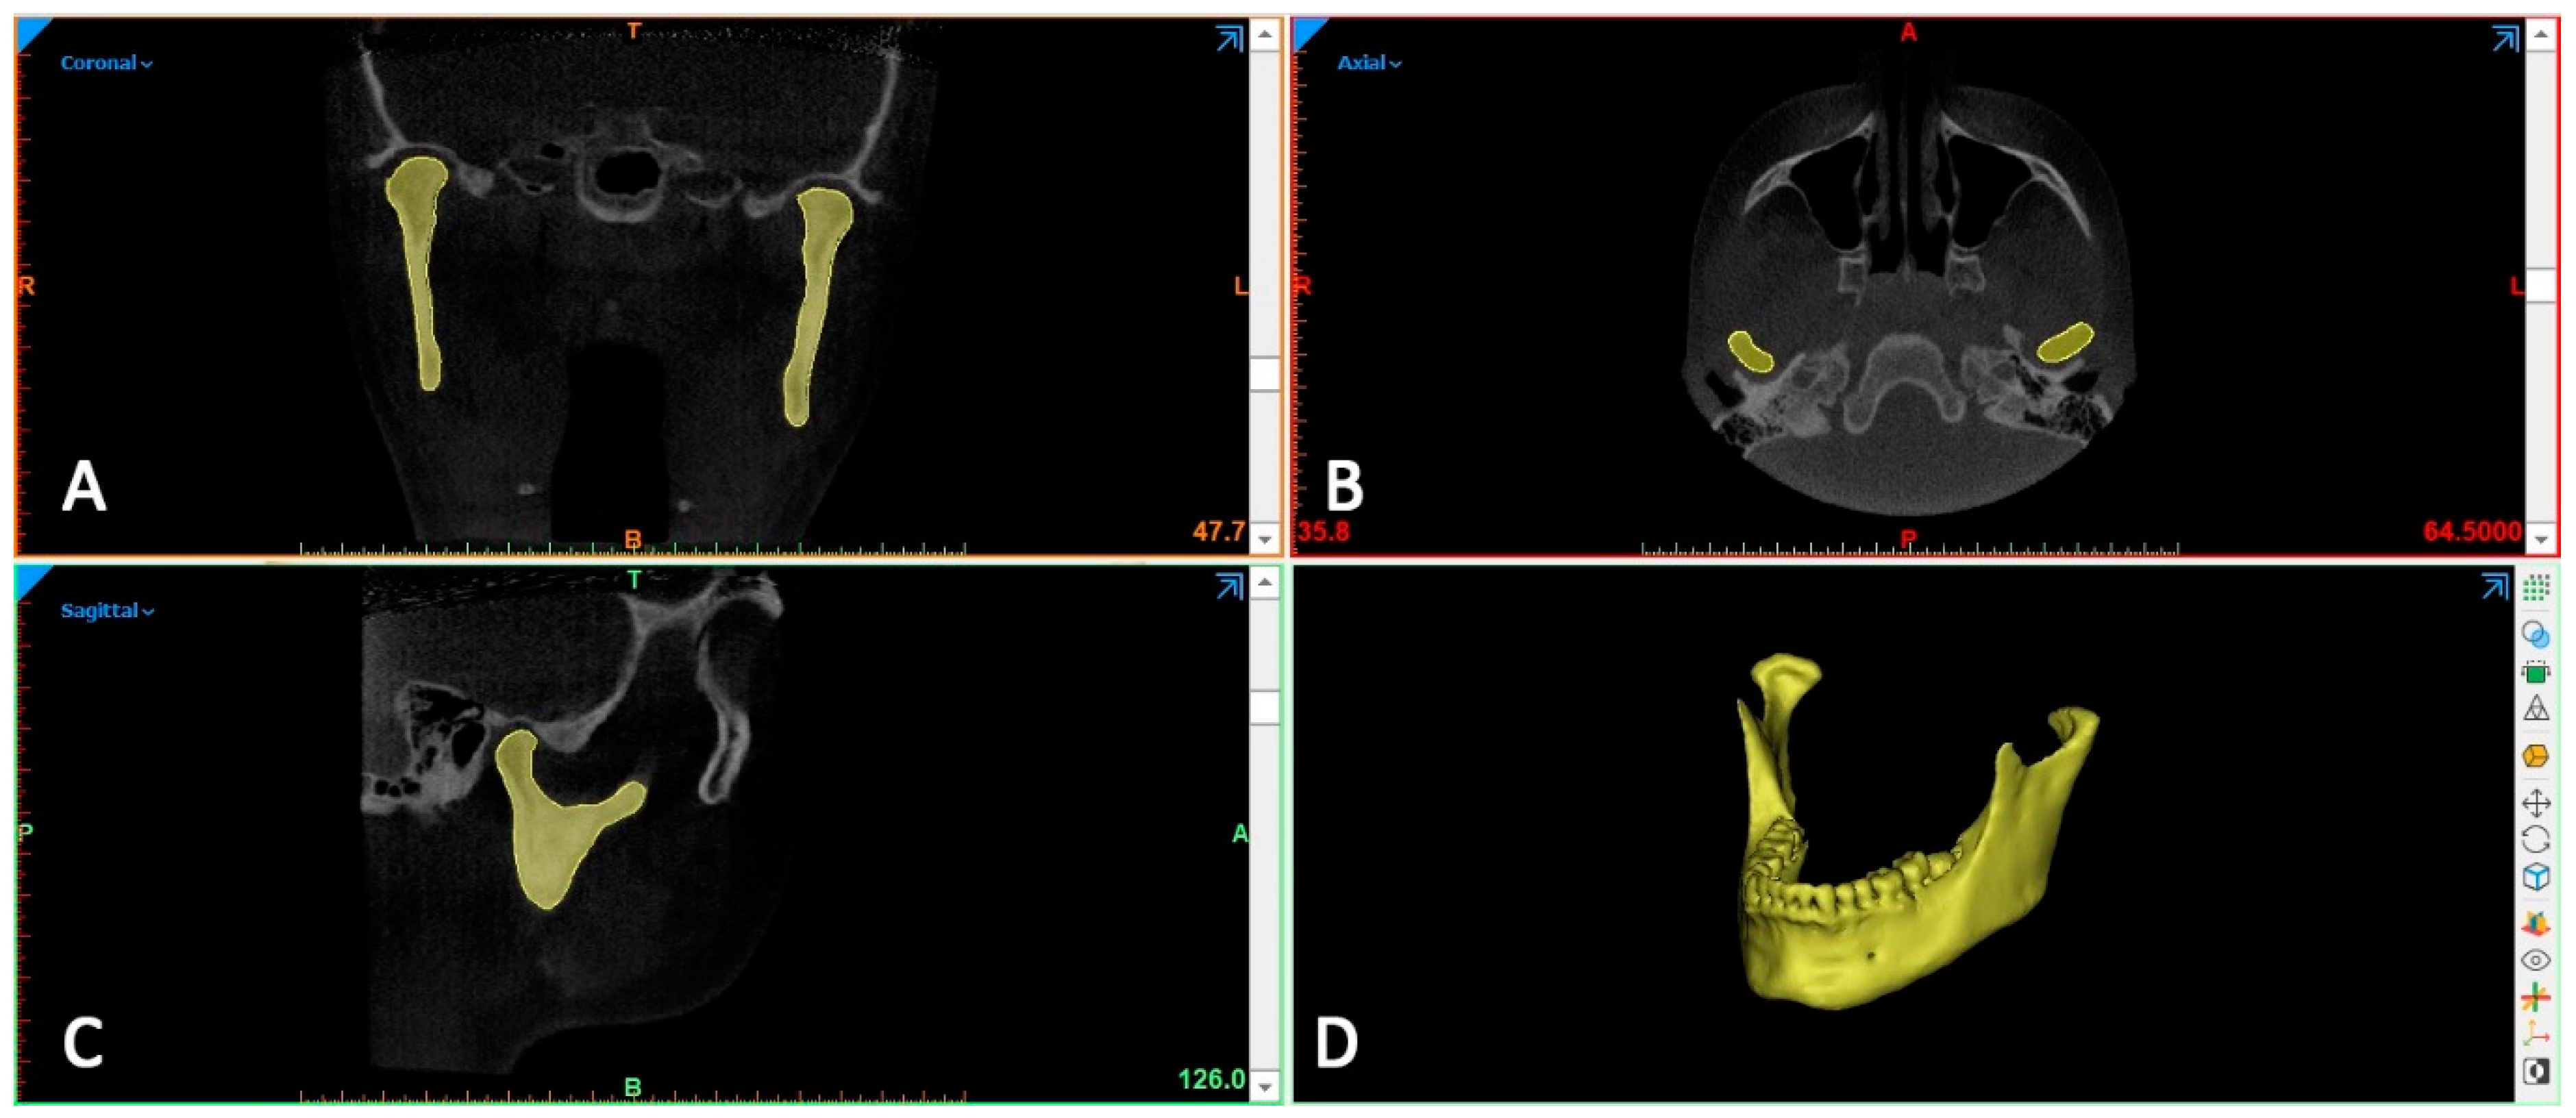
2.2. Step 2—Definition of 3D Model of the Condyle (Exclusion of the Mandible and Coronoid Process)
2.3. Step 3—Final Registration, Surface-Based.
2.4. Step 4—Matching Percentage Calculation
2.5. Statistical Analysis
3. Results
4. Discussion
5. Conclusions
Author Contributions
Funding
Conflicts of Interest
References
- Kim, J.J.; Nam, H.; Kaipatur, N.R.; Major, P.W.; Flores-Mir, C.; Lagravere, M.O.; Romanyk, D.L. Reliability and accuracy of segmentation of mandibular condyles from different three-dimensional imaging modalities: A systematic review. Dentomaxillofac. Radiol. 2019, 49, 20190150. [Google Scholar] [CrossRef]
- Tecco, S.; Saccucci, M.; Nucera, R.; Polimeni, A.; Pagnoni, M.; Cordasco, G.; Festa, F.; Iannetti, G. Condylar volume and surface in caucasian young adult subjects. BMC Med. Imaging 2010, 10, 28. [Google Scholar] [CrossRef] [PubMed]
- Nah, K.S. Condylar bony changes in patients with temporomandibular disorders: A cbct study. Imaging Sci. Dent. 2012, 42, 249–253. [Google Scholar] [CrossRef] [Green Version]
- Arnett, G.W.; Milam, S.B.; Gottesman, L. Progressive mandibular retrusion-idiopathic condylar resorption. Part ii. Am. J. Orthod. Dentofac. Orthop. 1996, 110, 117–127. [Google Scholar] [CrossRef]
- Hoppenreijs, T.J.; Freihofer, H.P.; Stoelinga, P.J.; Tuinzing, D.B.; van′t Hof, M.A. Condylar remodelling and resorption after le fort i and bimaxillary osteotomies in patients with anterior open bite. A clinical and radiological study. Int. J. Oral Maxillofac. Surg. 1998, 27, 81–91. [Google Scholar] [CrossRef]
- Nucera, R.; Lo Giudice, A.; Rustico, L.; Matarese, G.; Papadopoulos, M.A.; Cordasco, G. Effectiveness of orthodontic treatment with functional appliances on maxillary growth in the short term: A systematic review and meta-analysis. Am. J. Orthod. Dentofac. Orthop. 2016, 149, 600–611.e3. [Google Scholar] [CrossRef] [PubMed]
- Nucera, R.; Militi, A.; Lo Giudice, A.; Longo, V.; Fastuca, R.; Caprioglio, A.; Cordasco, G.; Papadopoulos, M.A. Skeletal and dental effectiveness of treatment of class ii malocclusion with headgear: A systematic review and meta-analysis. J. Evid. Based Dent. Pract. 2018, 18, 41–58. [Google Scholar] [CrossRef] [PubMed]
- Zymperdikas, V.F.; Koretsi, V.; Papageorgiou, S.N.; Papadopoulos, M.A. Treatment effects of fixed functional appliances in patients with class ii malocclusion: A systematic review and meta-analysis. Eur. J. Orthod. 2016, 38, 113–126. [Google Scholar] [CrossRef] [PubMed]
- Xia, J.J.; Gateno, J.; Teichgraeber, J.F. New clinical protocol to evaluate craniomaxillofacial deformity and plan surgical correction. J. Oral Maxillofac. Surg. 2009, 67, 2093–2106. [Google Scholar] [CrossRef] [PubMed] [Green Version]
- Leonardi, R.; Muraglie, S.; Lo Giudice, A.; Aboulazm, K.S.; Nucera, R. Evaluation of mandibular symmetry and morphology in adult patients with unilateral posterior crossbite: A cbct study using a surface-to-surface matching technique. Eur. J. Orthod. 2020. [Google Scholar] [CrossRef] [PubMed]
- Alkhader, M.; Ohbayashi, N.; Tetsumura, A.; Nakamura, S.; Okochi, K.; Momin, M.A.; Kurabayashi, T. Diagnostic performance of magnetic resonance imaging for detecting osseous abnormalities of the temporomandibular joint and its correlation with cone beam computed tomography. Dentomaxillofac. Radiol. 2010, 39, 270–276. [Google Scholar] [CrossRef] [PubMed] [Green Version]
- Scarfe, W.C.; Farman, A.G.; Sukovic, P. Clinical applications of cone-beam computed tomography in dental practice. J. Can. Dent. Assoc. 2006, 72, 75–80. [Google Scholar] [PubMed]
- Guerrero, M.E.; Jacobs, R.; Loubele, M.; Schutyser, F.; Suetens, P.; van Steenberghe, D. State-of-the-art on cone beam ct imaging for preoperative planning of implant placement. Clin. Oral Investig. 2006, 10, 1–7. [Google Scholar] [CrossRef] [PubMed]
- Cevidanes, L.H.; Hajati, A.K.; Paniagua, B.; Lim, P.F.; Walker, D.G.; Palconet, G.; Nackley, A.G.; Styner, M.; Ludlow, J.B.; Zhu, H.; et al. Quantification of condylar resorption in temporomandibular joint osteoarthritis. Oral Surg. Oral Med. Oral Pathol. Oral Radiol. Endod. 2010, 110, 110–117. [Google Scholar] [CrossRef] [PubMed] [Green Version]
- Xi, T.; van Loon, B.; Fudalej, P.; Berge, S.; Swennen, G.; Maal, T. Validation of a novel semi-automated method for three-dimensional surface rendering of condyles using cone beam computed tomography data. Int. J. Oral Maxillofac. Surg. 2013, 42, 1023–1029. [Google Scholar] [CrossRef]
- Bayram, M.; Kayipmaz, S.; Sezgin, O.S.; Küçük, M. Volumetric analysis of the mandibular condyle using cone beam computed tomography. Eur. J. Radiol. 2012, 81, 1812–1816. [Google Scholar] [CrossRef] [PubMed]
- da Silva, R.J.; Valadares Souza, C.V.; Souza, G.A.; Ambrosano, G.M.B.; Freitas, D.Q.; Sant′Ana, E.; de Oliveira-Santos, C. Changes in condylar volume and joint spaces after orthognathic surgery. Int. J. Oral Maxillofac. Surg. 2018, 47, 511–517. [Google Scholar] [CrossRef] [PubMed]
- Engelbrecht, W.P.; Fourie, Z.; Damstra, J.; Gerrits, P.O.; Ren, Y. The influence of the segmentation process on 3d measurements from cone beam computed tomography-derived surface models. Clin. Oral Investig. 2013, 17, 1919–1927. [Google Scholar] [CrossRef] [PubMed]
- Fourie, Z.; Damstra, J.; Schepers, R.H.; Gerrits, P.O.; Ren, Y. Segmentation process significantly influences the accuracy of 3d surface models derived from cone beam computed tomography. Eur. J. Radiol. 2012, 81, e524–e530. [Google Scholar] [CrossRef]
- Xi, T.; Schreurs, R.; Heerink, W.J.; Bergé, S.J.; Maal, T.J. A novel region-growing based semi-automatic segmentation protocol for three-dimensional condylar reconstruction using cone beam computed tomography (cbct). PLoS ONE 2014, 9, e111126. [Google Scholar] [CrossRef]
- Dong, T.; Xia, L.; Cai, C.; Yuan, L.; Ye, N.; Fang, B. Accuracy of in vitro mandibular volumetric measurements from cbct of different voxel sizes with different segmentation threshold settings. BMC Oral Health 2019, 19, 206. [Google Scholar] [CrossRef] [Green Version]
- El, H.; Palomo, J.M. Measuring the airway in 3 dimensions: A reliability and accuracy study. Am. J. Orthod. Dentofac. Orthop. 2010, 137, S50.e1-9; discussion S50-2. [Google Scholar] [CrossRef]
- Leonardi, R.; Lo Giudice, A.; Rugeri, M.; Muraglie, S.; Cordasco, G.; Barbato, E. Three-dimensional evaluation on digital casts of maxillary palatal size and morphology in patients with functional posterior crossbite. Eur. J. Orthod. 2018, 40, 556–562. [Google Scholar] [CrossRef] [PubMed]
- Lo Giudice, A.; Ortensi, L.; Farronato, M.; Lucchese, A.; Lo Castro, E.; Isola, G. The step further smile virtual planning: Milled versus prototyped mock-ups for the evaluation of the designed smile characteristics. BMC Oral Health 2020, 20, 165. [Google Scholar] [CrossRef] [PubMed]
- Lo Giudice, A.; Ronsivalle, V.; Grippaudo, C.; Lucchese, A.; Muraglie, S.; Lagravère, M.O.; Isola, G. One Step before 3D Printing-Evaluation of Imaging Software Accuracy for 3-Dimensional Analysis of the Mandible: A Comparative Study Using a Surface-to-Surface Matching Technique. Materials (Basel) 2020, 13, 12. [Google Scholar] [CrossRef] [PubMed]
- Leonardi, R.; Muraglie, S.; Bennici, O.; Cavallini, C.; Spampinato, C. Three-dimensional analysis of mandibular functional units in adult patients with unilateral posterior crossbite: A cone beam study with the use of mirroring and surface-to-surface matching techniques. Angle Orthod. 2019, 89, 590–596. [Google Scholar] [CrossRef] [PubMed] [Green Version]
- Katsumata, A.; Hirukawa, A.; Okumura, S.; Naitoh, M.; Fujishita, M.; Ariji, E.; Langlais, R.P. Effects of image artifacts on gray-value density in limited-volume cone-beam computerized tomography. Oral Surg. Oral Med. Oral Pathol. Oral Radiol. Endod. 2007, 104, 829–836. [Google Scholar] [CrossRef] [PubMed]
- Nicolielo, L.F.P.; Van Dessel, J.; Shaheen, E.; Letelier, C.; Codari, M.; Politis, C.; Lambrichts, I.; Jacobs, R. Validation of a novel imaging approach using multi-slice ct and cone-beam ct to follow-up on condylar remodeling after bimaxillary surgery. Int. J. Oral Sci. 2017, 9, 139–144. [Google Scholar] [CrossRef] [Green Version]
- Lo Giudice, A.; Rustico, L.; Caprioglio, A.; Migliorati, M.; Nucera, R. Evaluation of condylar cortical bone thickness in patient groups with different vertical facial dimensions using cone-beam computed tomography. Odontology 2020. [Google Scholar] [CrossRef]
- Loreto, C.; Filetti, V.; Almeida, L.E.; La Rosa, G.R.M.; Leonardi, R.; Grippaudo, C.; Lo Giudice, A. MMP-7 and MMP-9 are overexpressed in the synovial tissue from severe temporomandibular joint dysfunction. Eur. J. Histochem. 2020, 64, 3113. [Google Scholar] [CrossRef] [PubMed]
- Rosa, M.; Quinzi, V.; Marzo, G. Paediatric Orthodontics Part 1: Anterior open bite in the mixed dentition. Eur. J. Paediatr. Dent. 2019, 20, 80–82. [Google Scholar] [PubMed]
- Paniagua, B.; Cevidanes, L.; Zhu, H.; Styner, M. Outcome quantification using spharm-pdm toolbox in orthognathic surgery. Int. J. Comput. Assist. Radiol. Surg. 2011, 6, 617–626. [Google Scholar] [CrossRef] [PubMed]
- Hatamleh, M.M.; Yeung, E.; Osher, J.; Huppa, C. Novel treatment planning of hemimandibular hyperplasia by the use of three-dimensional computer-aided-design and computer-aided-manufacturing technologies. J. Craniofac. Surg. 2017, 28, 764–767. [Google Scholar] [CrossRef] [PubMed]
- Ferro, R.; Besostri, A.; Olivieri, A.; Quinzi, V.; Scibetta, D. Prevalence of cross-bite in a sample of Italian preschoolers. Eur. J. Paediatr. Dent. 2016, 17, 307–309. [Google Scholar] [PubMed]
- Isola, G.; Polizzi, A.; Iorio-Siciliano, V.; Alibrandi, A.; Ramaglia, L.; Leonardi, R. Effectiveness of a nutraceutical agent in the non-surgical periodontal therapy: A randomized, controlled clinical trial. Clin. Oral Investig. 2020, 1–11. [Google Scholar] [CrossRef]
- Isola, G.; Alibrandi, A.; Currò, M.; Matarese, M.; Ricca, S.; Matarese, G.; Ientile, R.; Kocher, T. Evaluation of salivary and serum ADMA levels in patients with periodontal and cardiovascular disease as subclinical marker of cardiovascular risk. J. Periodontol. 2020. [Google Scholar] [CrossRef] [PubMed]
- Lo Giudice, A.; Caccianiga, G.; Crimi, S.; Cavallini, C.; Leonardi, R. Frequency and type of ponticulus posticus in a longitudinal sample of nonorthodontically treated patients: Relationship with gender, age, skeletal maturity, and skeletal malocclusion. Oral Surg. Oral Med. Oral Pathol. Oral Radiol. 2018, 126, 291–297. [Google Scholar] [CrossRef]
- Lo Giudice, A.; Brewer, I.; Leonardi, R.; Roberts, N.; Bagnato, G. Pain threshold and temporomandibular function in systemic sclerosis: Comparison with psoriatic arthritis. Clin. Rheumatol. 2018, 37, 1861–1867. [Google Scholar]
- Leonardi, R. Cone-beam computed tomography and three-dimensional orthodontics. Where we are and future perspectives. J. Orthod. 2019, 46, 45–48. [Google Scholar] [CrossRef]
- Fischer, B.; Masucci, C.; Ruellas, A.; Cevidanes, L.; Giuntini, V.; Nieri, M.; Nardi, C.; Franchi, L.; McNamara, J.A., Jr.; Defraia, E. Three-dimensional evaluation of the maxillary effects of two orthopaedic protocols for the treatment of class iii malocclusion: A prospective study. Orthod Craniofac. Res. 2018, 21, 248–257. [Google Scholar] [CrossRef]
- Liang, X.; Lambrichts, I.; Sun, Y.; Denis, K.; Hassan, B.; Li, L.; Pauwels, R.; Jacobs, R. A comparative evaluation of cone beam computed tomography (cbct) and multi-slice ct (msct). Part ii: On 3d model accuracy. Eur. J. Radiol. 2010, 75, 270–274. [Google Scholar] [CrossRef] [PubMed]
- Lo Giudice, A.; Fastuca, R.; Portelli, M.; Militi, A.; Bellocchio, M.; Spinuzza, P.; Briguglio, F.; Caprioglio, A.; Nucera, R. Effects of rapid vs slow maxillary expansion on nasal cavity dimensions in growing subjects: A methodological and reproducibility study. Eur. J. Paediatr. Dent. 2017, 18, 299–304. [Google Scholar] [PubMed]
- Spagnuolo, G.; Ametrano, G.; D’Antò, V.; Rengo, C.; Simeone, M.; Riccitiello, F.; Amato, M. Effect of autoclaving on the surfaces of TiN -coated and conventional nickel-titanium rotary instruments. Int. Endod. J. 2017, 45, 1148–1155. [Google Scholar] [CrossRef] [PubMed]
- Spagnuolo, G.; Ametrano, G.; D’Antò, V.; Formisano, A.; Simeone, M.; Riccitiello, F.; Amato, M.; Rengo, S. Microcomputed tomography analysis of mesiobuccal orifices and major apical foramen in first maxillary molars. Open Dent. J. 2012, 6, 118–125. [Google Scholar] [CrossRef] [PubMed] [Green Version]
- Ametrano, G.; D′Antò, V.; Di Caprio, M.P.; Simeone, M.; Rengo, S.; Spagnuolo, G. Effects of sodium hypochlorite and ethylenediaminetetraacetic acid on rotary nickel-titanium instruments evaluated using atomic force microscopy. Int. Endod. J. 2011, 44, 203–209. [Google Scholar] [CrossRef] [PubMed]
- D’Antò, V.; Eckhardt, A.; Hiller, K.A.; Spagnuolo, G.; Valletta, R.; Ambrosio, L.; Schmalz, G.; Schweikl, H. The influence of Ni(II) on surface antigen expression in murine macrophages. Biomaterials 2009, 30, 1492–1501. [Google Scholar] [CrossRef] [PubMed]
- Isola, G.; Anastasi, G.P.; Matarese, G.; Williams, R.C.; Cutroneo, G.; Bracco, P.; Piancino, M.G. Functional and molecular outcomes of the human masticatory muscles. Oral Dis. 2018, 24, 1428–1441. [Google Scholar] [CrossRef]
- Isola, G.; Alibrandi, A.; Rapisarda, E.; Matarese, G.; Williams, R.C.; Leonardi, R. Association of vitamin d in patients with periodontal and cardiovascular disease: A cross-sectional study. J. Periodontal. Res. 2020. [Google Scholar] [CrossRef] [PubMed]
- Isola, G.; Polizzi, A.; Alibrandi, A.; Indelicato, F.; Ferlito, S. Analysis of Endothelin-1 concentrations in individuals with periodontitis. Sci. Rep. 2020, 10, 1652. [Google Scholar] [CrossRef]
- Minnema, J.; van Eijnatten, M.; Kouw, W.; Diblen, F.; Mendrik, A.; Wolff, J. Ct image segmentation of bone for medical additive manufacturing using a convolutional neural network. Comput. Biol. Med. 2018, 103, 130–139. [Google Scholar] [CrossRef] [PubMed] [Green Version]
- Zhu, Y.; Wei, R.; Gao, G.; Ding, L.; Zhang, X.; Wang, X.; Zhang, J. Fully automatic segmentation on prostate mr images based on cascaded fully convolution network. J. Magn. Reson. Imaging 2019, 49, 1149–1156. [Google Scholar] [CrossRef] [PubMed]


| Name | Developer | Country | Operating System | Type | Segmentation Options |
|---|---|---|---|---|---|
| Mimics | Materialise | Belgium | Windows | Pay per use | Manual and semi-automatic |
| Invesalius | Information Tecnology Center Renato Archer | Brasil | Windows, Mac OS X, Linux | Open-source | Semi-automatic |
| Dolphin 3D | Patterson Dental Supply | USA | Windows | Pay per use | Semi-automatic |
| ITK-Snap | University of Pennsylvania and Utah | USA | Windows, Mac OS X, Linux | Open-source | Manual and semi-automatic |
| Slicer 3D | Harvard University | United Kingdom | Windows, Mac OS X, Linux | Open-source | Manual and semi-automatic |
| Sample | Median (mm3) | SE | Intervals | Significance | ||
|---|---|---|---|---|---|---|
| Minimum | Maximum | |||||
| Mimics | 20 | 1631.00 | 35.64 | 1402 | 1882 | NS |
| Invesalius | 20 | 1662.50 | 35.84 | 1416 | 1915 | |
| Dolphin 3D | 20 | 1650.00 | 35.29 | 1427 | 1885 | |
| ITK-Snap | 20 | 1602.00 | 34.56 | 1393 | 1864 | |
| Slicer 3D | 20 | 1614.50 | 36.26 | 1384 | 1875 | |
| Sample | Median (%) | SE | Intervals | Significance | |||
|---|---|---|---|---|---|---|---|
| Minimum | Maximum | ||||||
| Tolerance A | Invesalius (a) | 20 | 65,50 (b,c,d) | 0,69 | 60,47 | 70,17 | p < 0.001 |
| Dolphin 3D (b) | 20 | 62,50 (a,c,d) | 0,61 | 59,83 | 67,28 | ||
| ITK-Snap (c) | 20 | 69,00 (a,b,d) | 0,89 | 64,32 | 74,08 | ||
| Slicer 3D (d) | 20 | 61,00 (a,b,c) | 0,75 | 57,64 | 65,10 | ||
| Tolerance B | Invesalius (a) | 20 | 80,20 (c) | 0,55 | 77,71 | 84,18 | p < 0.05 |
| Dolphin 3D (b) | 20 | 78,50 (c) | 0,91 | 74,91 | 84,1 | ||
| ITK-Snap (c) | 20 | 84,77 (a,b,d) | 0,74 | 78,94 | 87,1 | ||
| Slicer 3D (d) | 20 | 82,55 (c) | 0,66 | 76,92 | 84,83 | ||
| Sample | First Reading Median (mm3) | Second Reading Median (mm3) | Significance | |
|---|---|---|---|---|
| Mimics | 20 | 1631 | 1624 | p = 0.007 |
| Invesalius | 20 | 1663 | 1661 | NS |
| Dolphin 3D | 20 | 1650 | 1651 | NS |
| ITK-Snap | 20 | 1602 | 1612 | NS |
| Slicer 3D | 20 | 1615 | 1611 | NS |
| Sample | First Reading | Second Reading | Significance | |
|---|---|---|---|---|
| Median (mm3) | Median (mm3) | |||
| Mimics | 20 | 1631 | 1700 | p < 0.001 |
| Invesalius | 20 | 1663 | 1668 | NS |
| Dolphin 3D | 20 | 1650 | 1670 | NS |
| ITK-Snap | 20 | 1602 | 1610 | NS |
| Slicer 3D | 20 | 1615 | 1625 | NS |
| Mimics | ITK-Snap | Invesalius | Dolphin 3D | Slicer 3D | |
|---|---|---|---|---|---|
| ICC | ICC | ICC | ICC | ICC | |
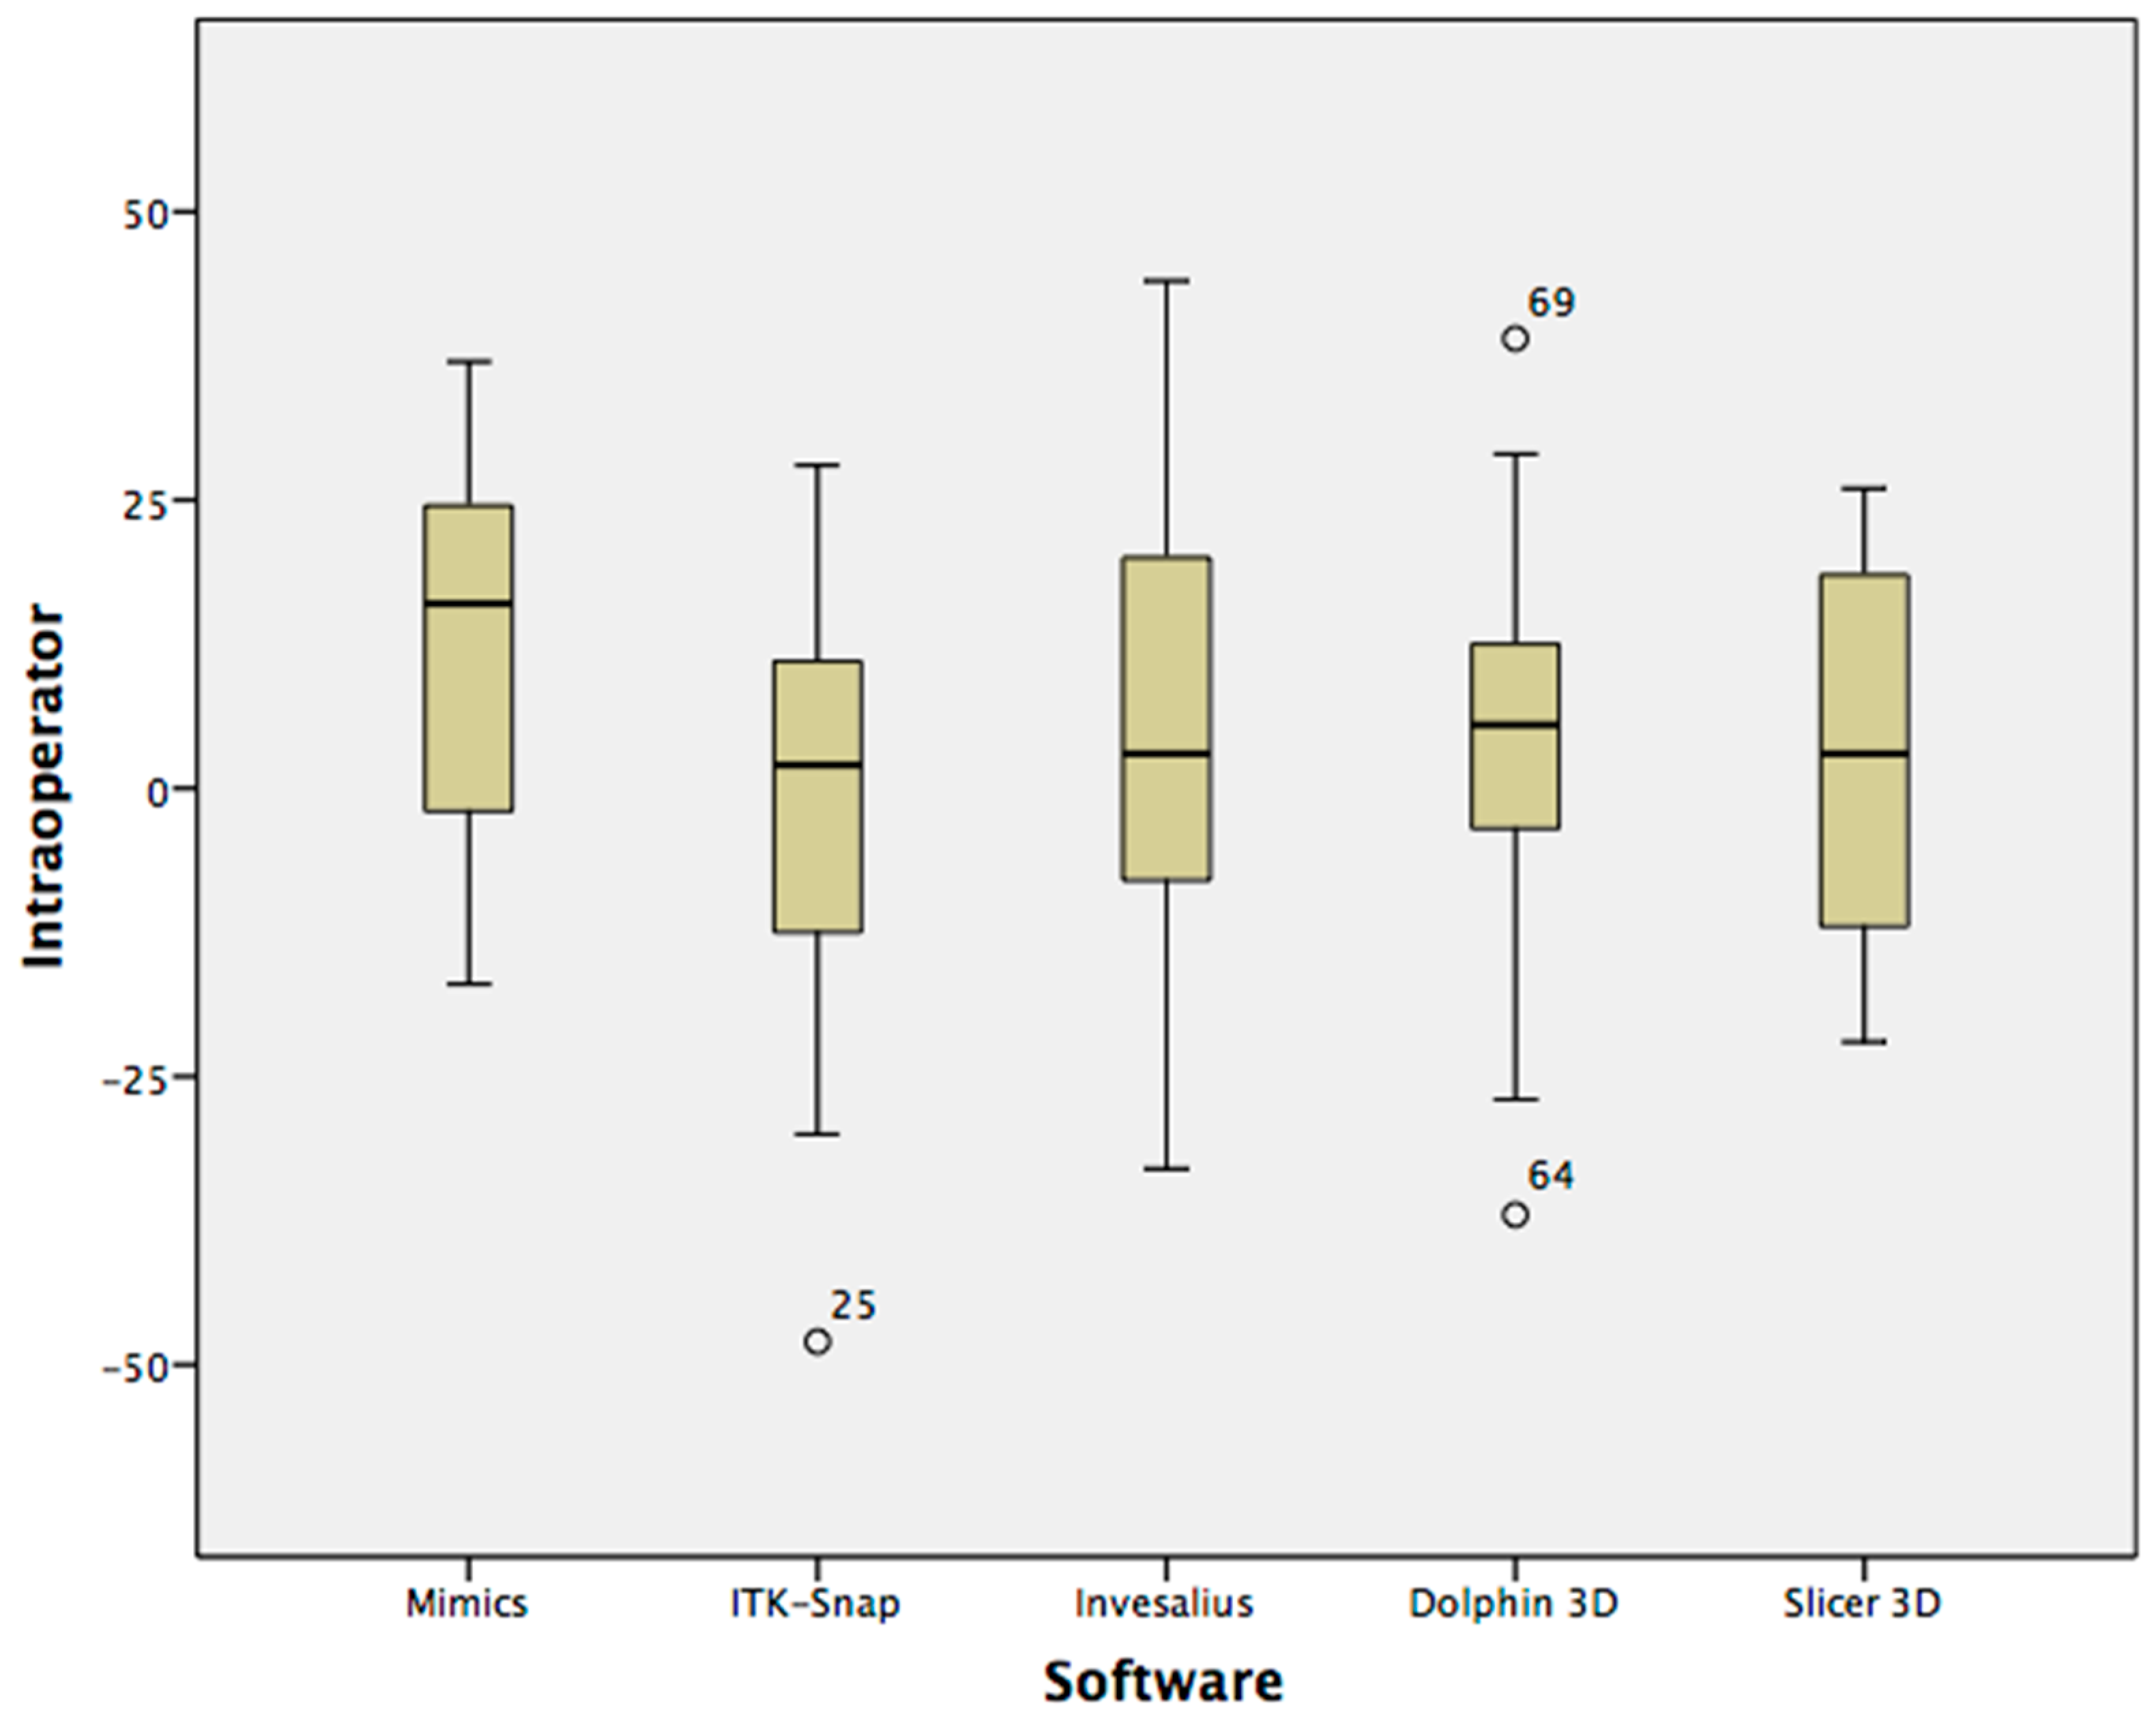
| Intra-operator | 0.933 | 0.996 | 0.996 | 0.997 | 0.997 |
| Inter-operator | 0.856 | 0.998 | 0.997 | 0.996 | 0.997 |
© 2020 by the authors. Licensee MDPI, Basel, Switzerland. This article is an open access article distributed under the terms and conditions of the Creative Commons Attribution (CC BY) license (http://creativecommons.org/licenses/by/4.0/).
Share and Cite
Lo Giudice, A.; Quinzi, V.; Ronsivalle, V.; Farronato, M.; Nicotra, C.; Indelicato, F.; Isola, G. Evaluation of Imaging Software Accuracy for 3-Dimensional Analysis of the Mandibular Condyle. A Comparative Study Using a Surface-to-Surface Matching Technique. Int. J. Environ. Res. Public Health 2020, 17, 4789. https://doi.org/10.3390/ijerph17134789
Lo Giudice A, Quinzi V, Ronsivalle V, Farronato M, Nicotra C, Indelicato F, Isola G. Evaluation of Imaging Software Accuracy for 3-Dimensional Analysis of the Mandibular Condyle. A Comparative Study Using a Surface-to-Surface Matching Technique. International Journal of Environmental Research and Public Health. 2020; 17(13):4789. https://doi.org/10.3390/ijerph17134789
Chicago/Turabian StyleLo Giudice, Antonino, Vincenzo Quinzi, Vincenzo Ronsivalle, Marco Farronato, Carmelo Nicotra, Francesco Indelicato, and Gaetano Isola. 2020. "Evaluation of Imaging Software Accuracy for 3-Dimensional Analysis of the Mandibular Condyle. A Comparative Study Using a Surface-to-Surface Matching Technique" International Journal of Environmental Research and Public Health 17, no. 13: 4789. https://doi.org/10.3390/ijerph17134789