Predicting Aggregate Degradation in Forest Roads in Northwest Oregon

1
Delta Forestry Solutions, LLC Eureka California, Eureka, CA 95501, USA
2
Norwegian Institute of Bioeconomy, Ås NO-1431, Norway
3
Forest Engineering, Resource Management, Oregon State University, Corvallis, OR 97331, USA
*
Author to whom correspondence should be addressed.
Forests 2020, 11(7), 729; https://doi.org/10.3390/f11070729
Submission received: 6 June 2020
/
Revised: 26 June 2020
/
Accepted: 28 June 2020
/
Published: 3 July 2020
(This article belongs to the Special Issue Planning, Design, and Maintenance of Forest Road Networks)
Abstract
:In the Pacific Northwest, forest roads have the potential to cause significant environmental degradation, especially to water resources due to increased sediment production. The goal of this research is to improve the understanding of road degradation during hauling by improving our understanding of the aggregate degradation process. We correlate the wear rates to standard material property tests that may allow for improved prediction of the impacts from forest roads based on the selection of aggregate surfacing. Finally, we determine the changes in stress distribution between the subgrade and aggregate interface. High-, medium-, and low-quality aggregates were used from three quarries in western Oregon for this project. These aggregates are indicative of the range of materials used on forest roads in the region. Two material property tests, namely the Los Angeles (LA) abrasion and micro-Deval tests, were used to determine their ability to predict aggregate performance during hauling by relating values for aggregate wear to these aggregate properties. Eighteen nonwoven geotextile bags were created, measuring 60 cm (two-feet long) and 20 cm (eight inches) in diameter, with a pore size equivalent to a 0.149 mm (# 100) sieve. They were filled with a known quantity and particle size distribution of aggregate and embedded into a newly constructed forest road. Stress gages were installed in the road surface between the aggregate and subgrade levels to record the changes in stress at the subgrade level. Samples were subjected to three levels of traffic (500, 950, and 1500 passes) using a loaded dump-truck that had a steering axle and one tandem drive axle, weighing 25,038 kg or 55,200 lb. The results showed that less breakage occurred with the medium- and high-quality aggregates than the low-quality aggregate. There was a correlation between the material property test (either the micro-Deval or the LA abrasion test) and the fine index, indicating the predictability of these tests in terms of aggregate performance. Finally, the higher quality aggregate was able to better distribute the stresses from the wheel better than the lower quality aggregate and was able to reduce the stress reaching the subgrade. Although the results are limited to the three types of rock used in this study, they indicate the ability of the high-quality aggregate to lessen the environmental impacts from forest roads.
1. Introduction
Forest roads serve multiple purposes, from providing access for recreation to facilitating the transport of timber products. Many of these roads are designed with an aggregate surface to allow all-season use, which is necessary in the coastal forest of the Pacific Northwest in North America due to the likelihood of rain during much of the year. The aggregate layer provides both improved traction and distributes stress created from the wheels in a manner that reduces the stresses that reach the subgrade. If these stresses exceed the bearing strength in the subgrade this can result in ruts that increase sediment production from the forest roads [1]. The reduction in subgrade stresses is vital, as most forest roads in the region do not control subgrade compaction during construction, resulting in weak subgrade or highly variable subgrade strength [2].
Road construction is one of the highest costs that occurs during forest management. In Oregon, the durable aggregate can cost between $4.6 to $19.10 per cubic meter ($6 to $25 per cubic yard), depending on the transport distance to the quarry [3]. A reduction of one inch of surface aggregate on a forest road could save over $3542 per km ($5700 per mile).
In addition to the cost, the availability of aggregate materials will likely decrease in the future as greater restrictions on aggregate extraction are imposed, especially along rivers. Thus, there is a need for road designs that account for not only the quantity of rock, but the quality as well, and which efficiently use this valuable resource. However, rock quality is often left to the manager’s choice, which is inconsistent when compared against material property tests [4]; most road managers do not test their aggregate resources and use them directly from the pit, only removing the oversized pieces. Fine sediment, defined as those particles less than 2mm in diameter; is the most detrimental to the survival of salmonid eggs [5].
Because of the potential for forest roads to impact the environment [6], there is a growing regulatory concern surrounding them. Forest roads have received significant scrutiny in recent years from the Clean Water Act and the regulation of sediment from forest roads [7]. Currently, all roads in the United States are subject to regulations from elements of both the Federal Clean Water Act and the Endangered Species Act, as well as various state forest practice rules in the United States. One method to mitigate these impacts is the use of high-quality aggregate to reduce the sediment generated from roads, which can harm sensitive fish populations by entering streams, as the sediment produced from forest roads is generally fine-grained.
The combination of the high cost for the aggregate and the potential for environmental harm suggests that there is a need to improve our understanding of the aggregate degradation process, which includes developing predictive tools that correlate the wear rates based on the material property tests.
2. Literature Review
Sediment production from the road surface is a three-stage process. The first stage is the detachment stage, where sediment is produced through degradation of the surface aggregate. Degradation can result from either physical separation or breakdown of the aggregate due to vehicle loads or chemical weathering. The second stage is the transport of the particles from the road surface, which most commonly associated with water, but can also move as airborne dust. The final step is the deposition stage, where particles can be deposited into rivers, potentially harming aquatic habitats [8].
The focus of this research is on the first stage, the detachment process, where particles are created via the degradation of forest road aggregates that occurs during hauling. Aggregate degradation occurs from three processes: (1) attrition, (2) breakage, and (3) fracturing. Attrition is the grinding of uneven surfaces, creating fine particles due to the rounding of the edges of larger particles. Breakage is when corners and protrusions break from the larger particles and create smaller particles, increasing the edges of the larger particles [9,10]. Fracturing is a more intense form of breakage, where coarse particles split apart into large particles, with increased edges created between the two remaining particles [11].
The aggregate in a forest road initially forms a skeletal structure. After spreading the aggregate with a grader, the standard practice is to compact it with a smooth-drum vibratory roller. During this phase, the skeletal structure initially experiences degradation via all three processes—fracturing, breakage, and attrition. The smaller pieces fill the void spaces in the structure, increasing the stabilization of the skeletal structure by increasing the number and length of contact points among aggregate particles. Although the time required is uncertain, once the large voids are filled due to fracturing or breakage, attrition becomes the primary degradation process [11]. Over an extended period of loading, attrition causes rounding of coarse particles and an accumulation of fine particles. These fines particles can be become the source of sediment from the surface of the road, as suggested by [12], who showed that sediment from a forest road in Oregon appeared to be generated from the road surface and not the subsurface.
There have been several attempts to predict aggregate performance. One of the first studies compared two different aggregate qualities, one rated as good and the second as moderate, using materials tests and simulated traffic in a steel frame. Overall, aggregates rated as “moderate” produced 4 to 17 times the sediment compared to “good” aggregate [13]. There results demonstrate an opportunity to reduce the impact from roads when high-quality aggregate is selected.
3. Materials and Methods
As with most forest engineering studies, this is a case study; there was no random selection of study sites on which treatments was imposed. The result is that no inferential statements can be made from these results to a larger population. The methods used to achieve the research goals are placed into four broad steps: (1) site and material selection, (2) development of the experimental site, (3) material testing, and (4) post-hauling analysis to determine the changes in gradation and subgrade stress encountered during hauling.
3.1. Site and Material Selection
The study site location was in western Oregon, Township 9 South, Range 8 West, Sections 24 and 25, Willamette Meridian, Polk County. The road was built in the summer of 2011 with a 325 CAT Excavator, a D8 Cat Dozer, and a smooth drum vibratory roller pulled behind a grader for compaction. The California bearing ratio (CBR) values for the subgrade ranged from 9.2 to 9.6 at the time of installation. The road had an aggregate surface with a depth of 25 cm (10 inches) using material from a quarry that was rated as medium quality by the area road manager.
Three qualities of aggregate were selected in the experiment, all of which were gabbro, an igneous rock common to this area of Oregon. Aggregate quality was based on the engineer’s experience and the historical performance of the aggregate on forest roads. The goal was to create a representative sample of the aggregate quality found in the central Oregon coast range; however, the manager’s expert opinion may be an unreliable estimate of the rock’s performance in material processing tests [4].
Each stockpile was similarly shaped, measuring between two and three hundred feet long and twenty to forty feet high, with a trapezoidal cross-section. The extraction locations were based on the size and shape of the stockpile [14]. Each sample was collected at least 20 cm (7.9 inches) below the surface, as fine materials are washed downwards from rain and accumulate in the lower levels of the stockpile. The samples were reblended and quartered to obtain samples of an appropriate size for use in the various tests [14].
3.2. Site Development
The eighteen field samples were placed into cylindrical geotextile bags measuring 60 cm in length and 20 cm in diameter (24 inches in length and 6 inches in width). The bags were constructed by sewing Mirafi 1100N, a nonwoven geotextile composed of polypropylene fibers with a #100 sieve equivalent apparent opening size, around a 20 cm (8 in) diameter mold. The material was 2.4 mm thick, with a tensile strength of 1134 N (250 lb.) and puncture resistance of 689 N (155 lb.), according to ASTM standard testing methods [15]. The diameter of the bags was five to six times the size of the maximum particle size, as recommended by [16], to minimize the effect of confined pressure for rigid molds. However, no tests were conducted to determine if the confined pressures from the bags significantly influenced the wear rate. The purpose of the bags was to retain the material to determine the changes in gradation after hauling. We believed that flexible bags achieved these results.
3.3. Material Tests
One goal of the research was to test whether aggregate wear can be predicted from material property tests. Test were performed for particle size [17], micro-Deval [17] and Los Angles abrasion [17] tests and were used to predict the aggregate wear. Both tested the durability of the rock by exposing it to repeated loading with steel shot—the micro-Deval test uses many small balls measuring 9.5 mm in diameter in the presence of water, while the LA abrasion test uses larger balls measuring 49 mm diameter and is performed in the absence of water. One of the response variables is change in gradation using the particle size distribution procedure [17].
Eighteen field samples were created using material that was graded, remixed, and placed into the bags. From the gradation, the percent passing a 0.420 mm (#40) sieve was recorded, as [13] identified that this level of fineness is an indicator of sediment production.
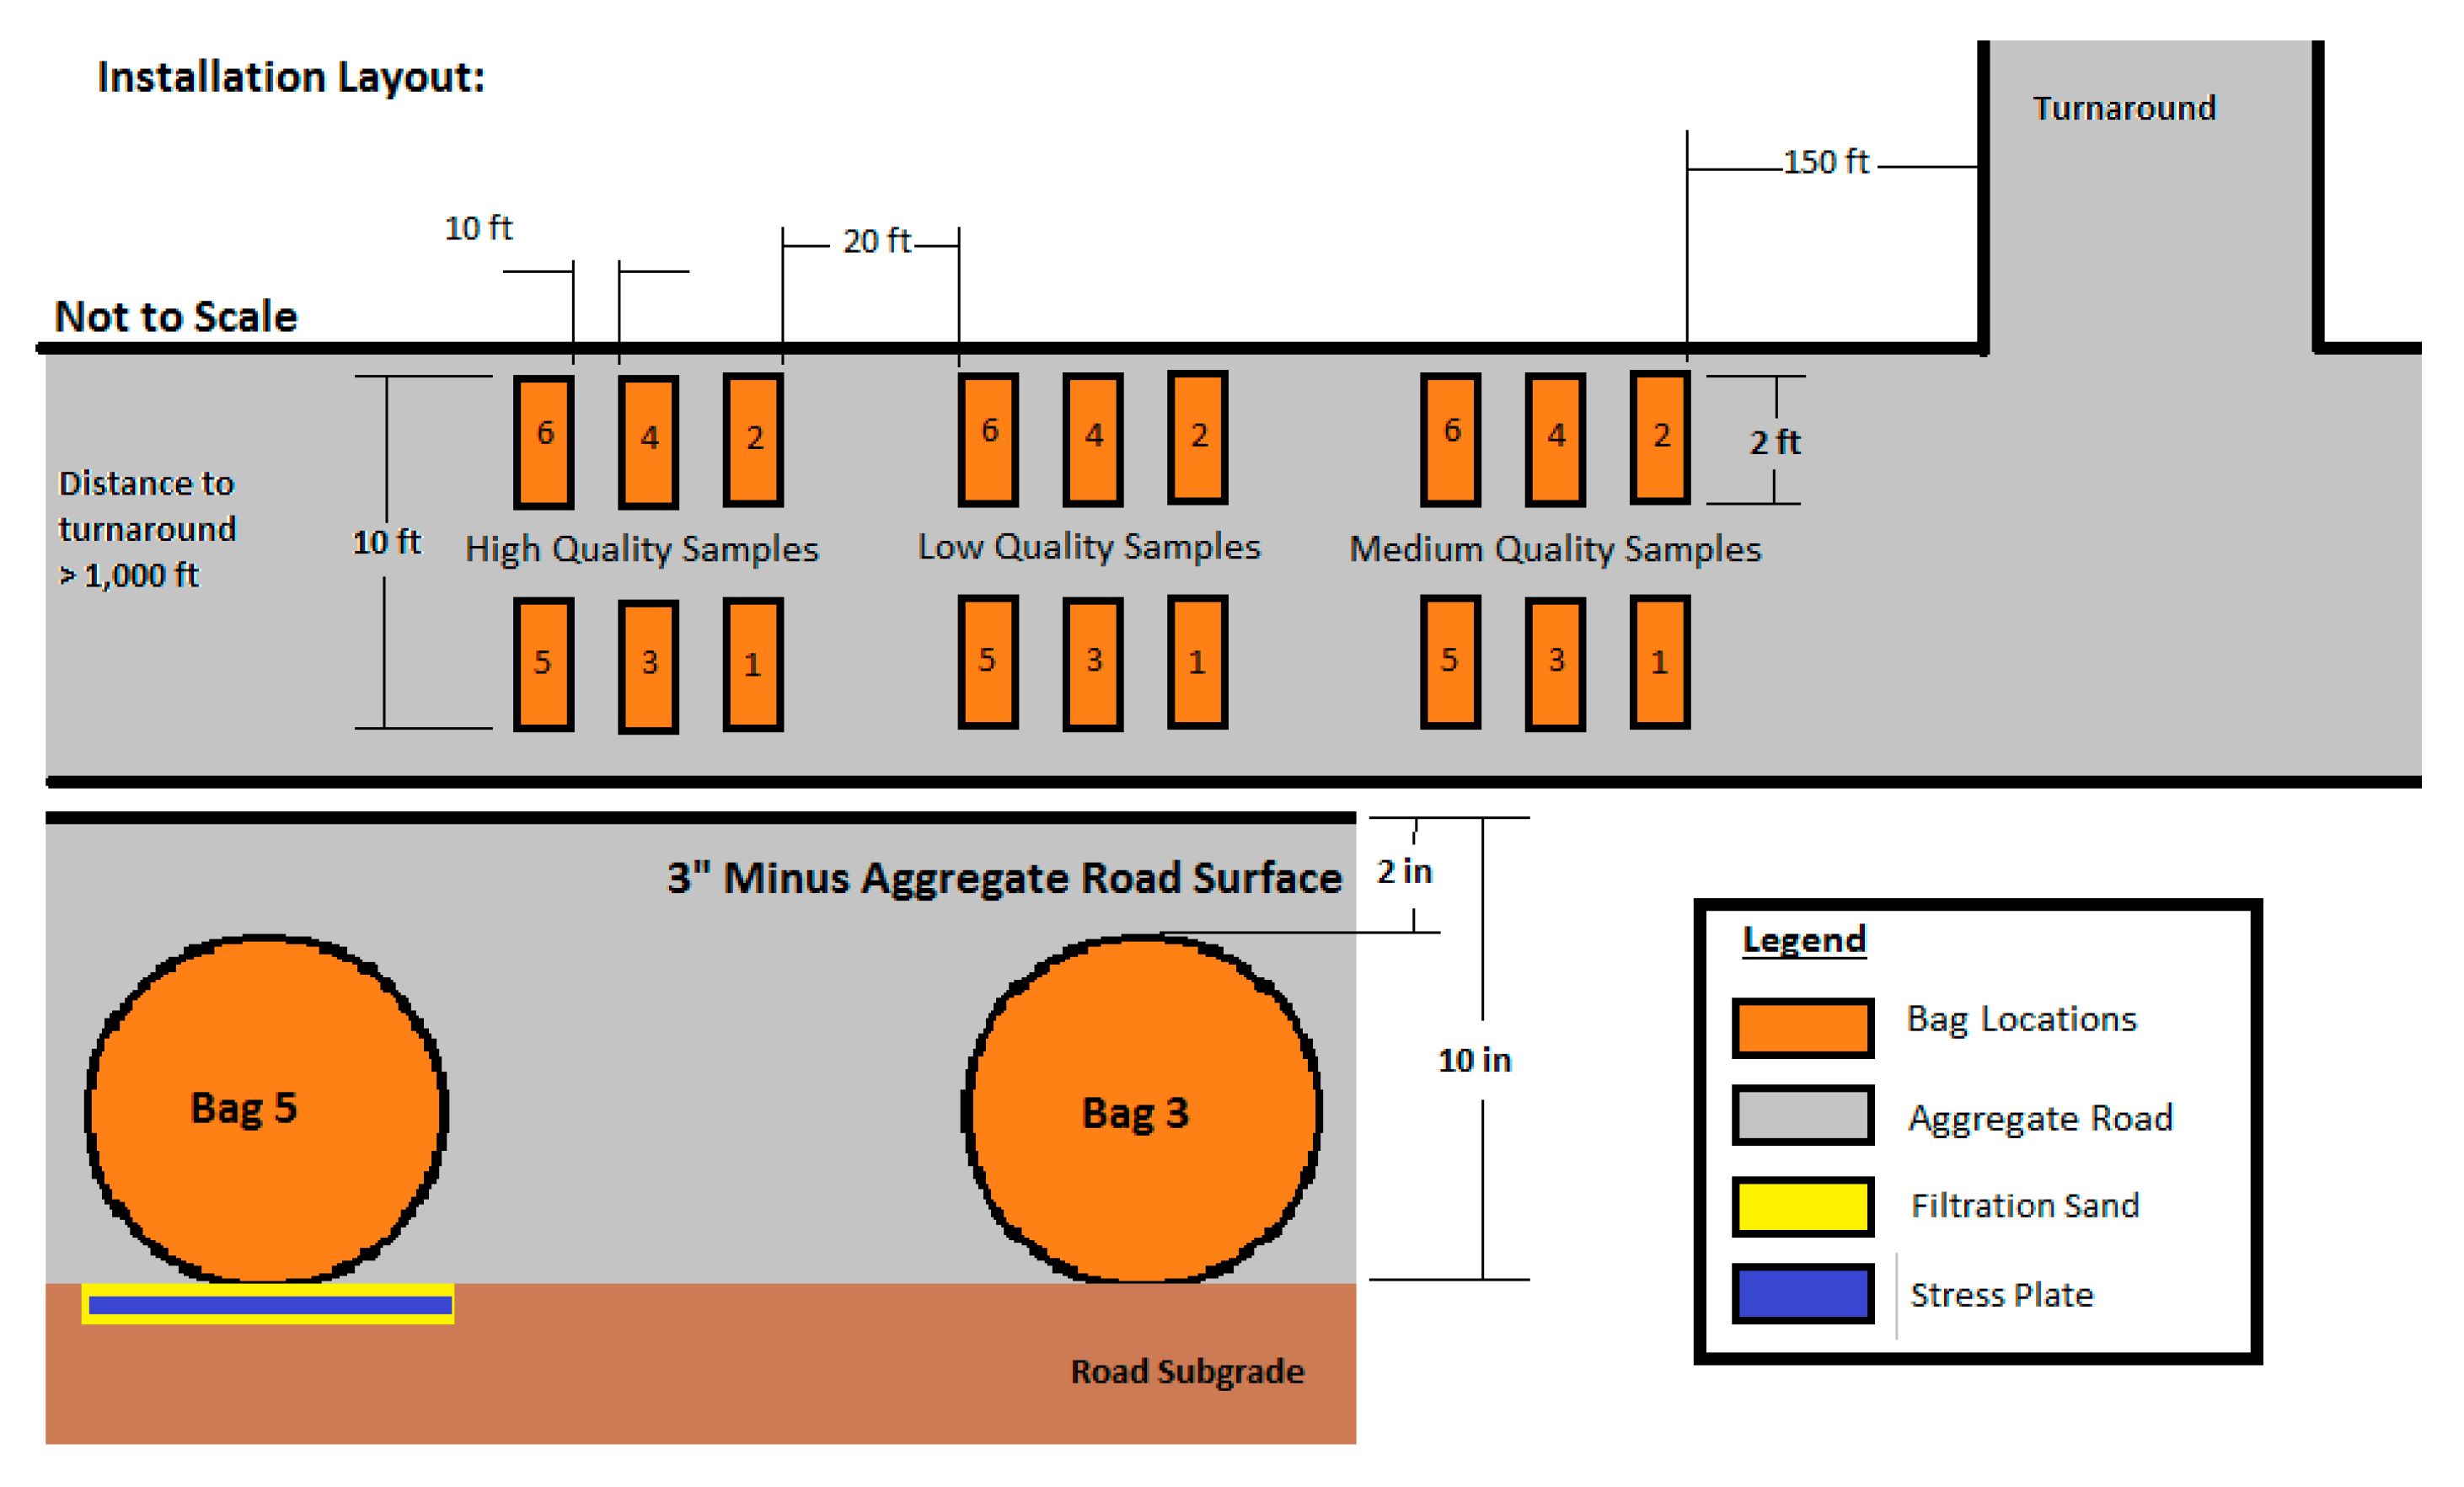
The filled bags were placed into the road by digging nine trenches in the existing road surface, as shown in Figure 1. Two bags were placed in each trench spaced the same width apart as the wheelbase of the truck’s dual axles, and a two-inch layer of the 7.6 cm (3 in) minus aggregate was placed on top of the bags to prevent the bags from being torn during hauling. Particles larger than 5 cm (2 in) that surrounded the bags were removed to reduce potential puncturing of the bags. Each sample was then compacted with a plate compactor for two minutes.
3.4. Stress Plates
Under the 5th sample of each aggregate, the trench was dug an additional 25 mm (2 in) to allow for the installation of the stress plates. Three Geokon Model 4810 VW Earth Pressure Cells attached to a Geokon Model LC 2 × 4, four-channel VW Datalogger were installed in the road to determine how the aggregate quality influenced stress distribution to the subgrade. The stress plates were installed so that when the dump truck drove in a perfectly aligned pass, the outside tire on the dual axels was centered over the plate. To reduce the likelihood of point loads from rock asperities, a 1.3 cm (0.5 in) layer of filtration sand was placed below and over the stress plates and the samples were placed over the sand. Each cell measured the stress distribution during hauling below the different types of aggregate by recording the stress on the plate every ten seconds. This constant timing for the readings may have resulted in many partial or no-load readings. The twenty highest value readings during the loading period were used to remove all of the events when the load was not on top of the load cell.
A loaded dump truck with a 25,038 kg (55,200 lb.) payload was used in this study; the weights on the front and back axles were 6440 kg and 18,598 kg (14,200 lbs. and 41,000 lbs.), with a tire pressure of 551 kPa (80 psi). This generated 2.69 equivalent single wheel loads (ESWLs) per pass of the standard single wheel load of 3.92 Mg (8.64 KIPs) at 551 kPa (80 psi) tire pressure [18]. The ESWLs from 1500 passes by the dump truck were similar to the ESWLs a road would receive from hauling the timber that was harvested from a 20 ha (50 acres) timber harvest using a five-axel log trucks with a load of 36.4 Mg (80 KIP) and 689 kPa (100 psi) tire pressure, assuming 141 m3 per ha and 10.61 m3 per truckload (60 Mbf per acre and 4.5 Mbf per truckload).
Passes were recorded with a traffic counter placed at one end of the road. The truck drove for 1500 passes between the markers, which indicated the location of the buried samples on the test road. Samples #1 and #2 of each aggregate were removed after 500 passes, #3 and #4 after 950 passes, and #5 and #6 after 1500 passes. This trial was completed in one week, without exposure to any freeze–thaw conditions that could have compounded the impacts on aggregate wear.
3.5. Post-Field-Trial Analysis
Following the removal of the bags from the roadbed, the samples were dried to a constant temperature of 110 °C for 24 h and wet sieved to determine the post-hauling particle sizes to determine the mass and post-hauling testing gradation.
Changes in gradation will be quantified. The coarse and fine indices were computed with the fine index as the percentage by mass of particles passing the 0.149 mm (#100 sieve) (fine index). In contrast, the coarse index represents the percentage of weight retained above the 2.54 cm (1 in) sieve size.
4. Results
The material property tests agreed with the manager’s recommendation, as the higher the aggregate quality, the lower the amount of fine sediment measured from either the micro-Deval or LA abrasion tests (Table 1). Tukey’s test for comparison among means creates two distinct groups. The low-quality aggregate was placed into a unique group, with the high- and medium-quality sediments placed in the other statistically significant group for both tests (Table 2). Visual inspection of samples after testing revealed that degradation was due to a combination of breakage and attrition, as there were fractured rock faces and a large number of fine particles.
4.1. Field Trial Results
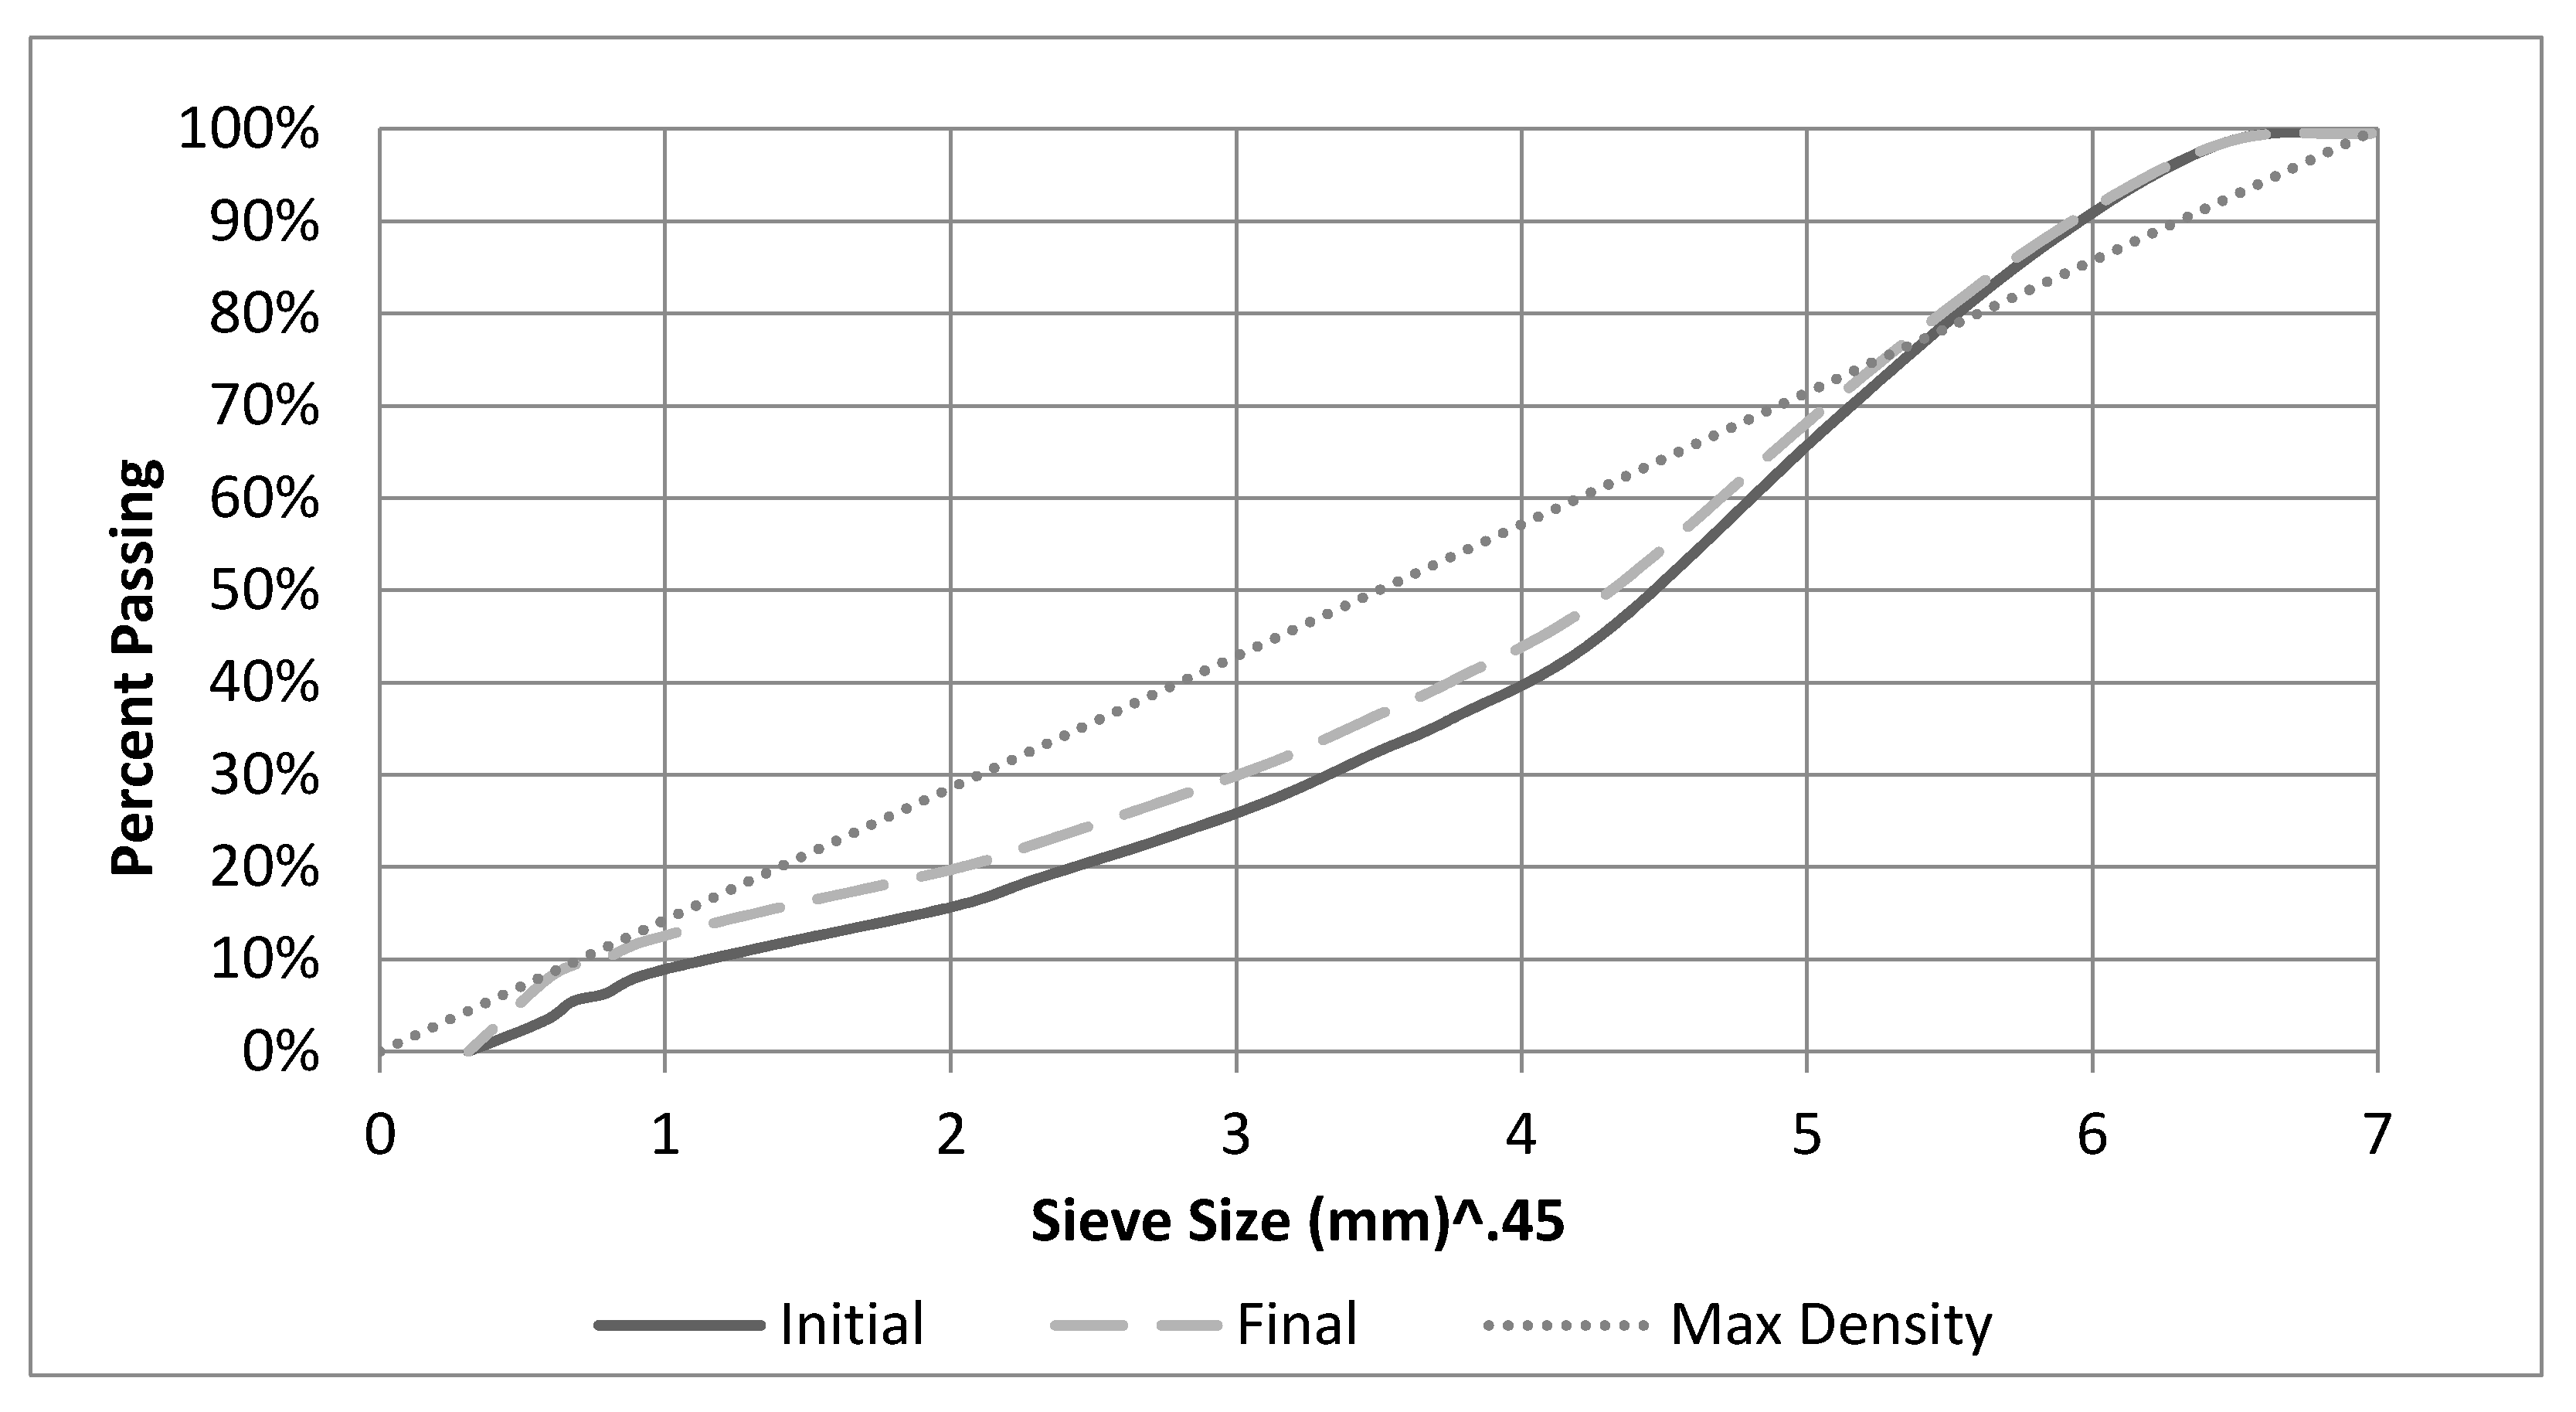
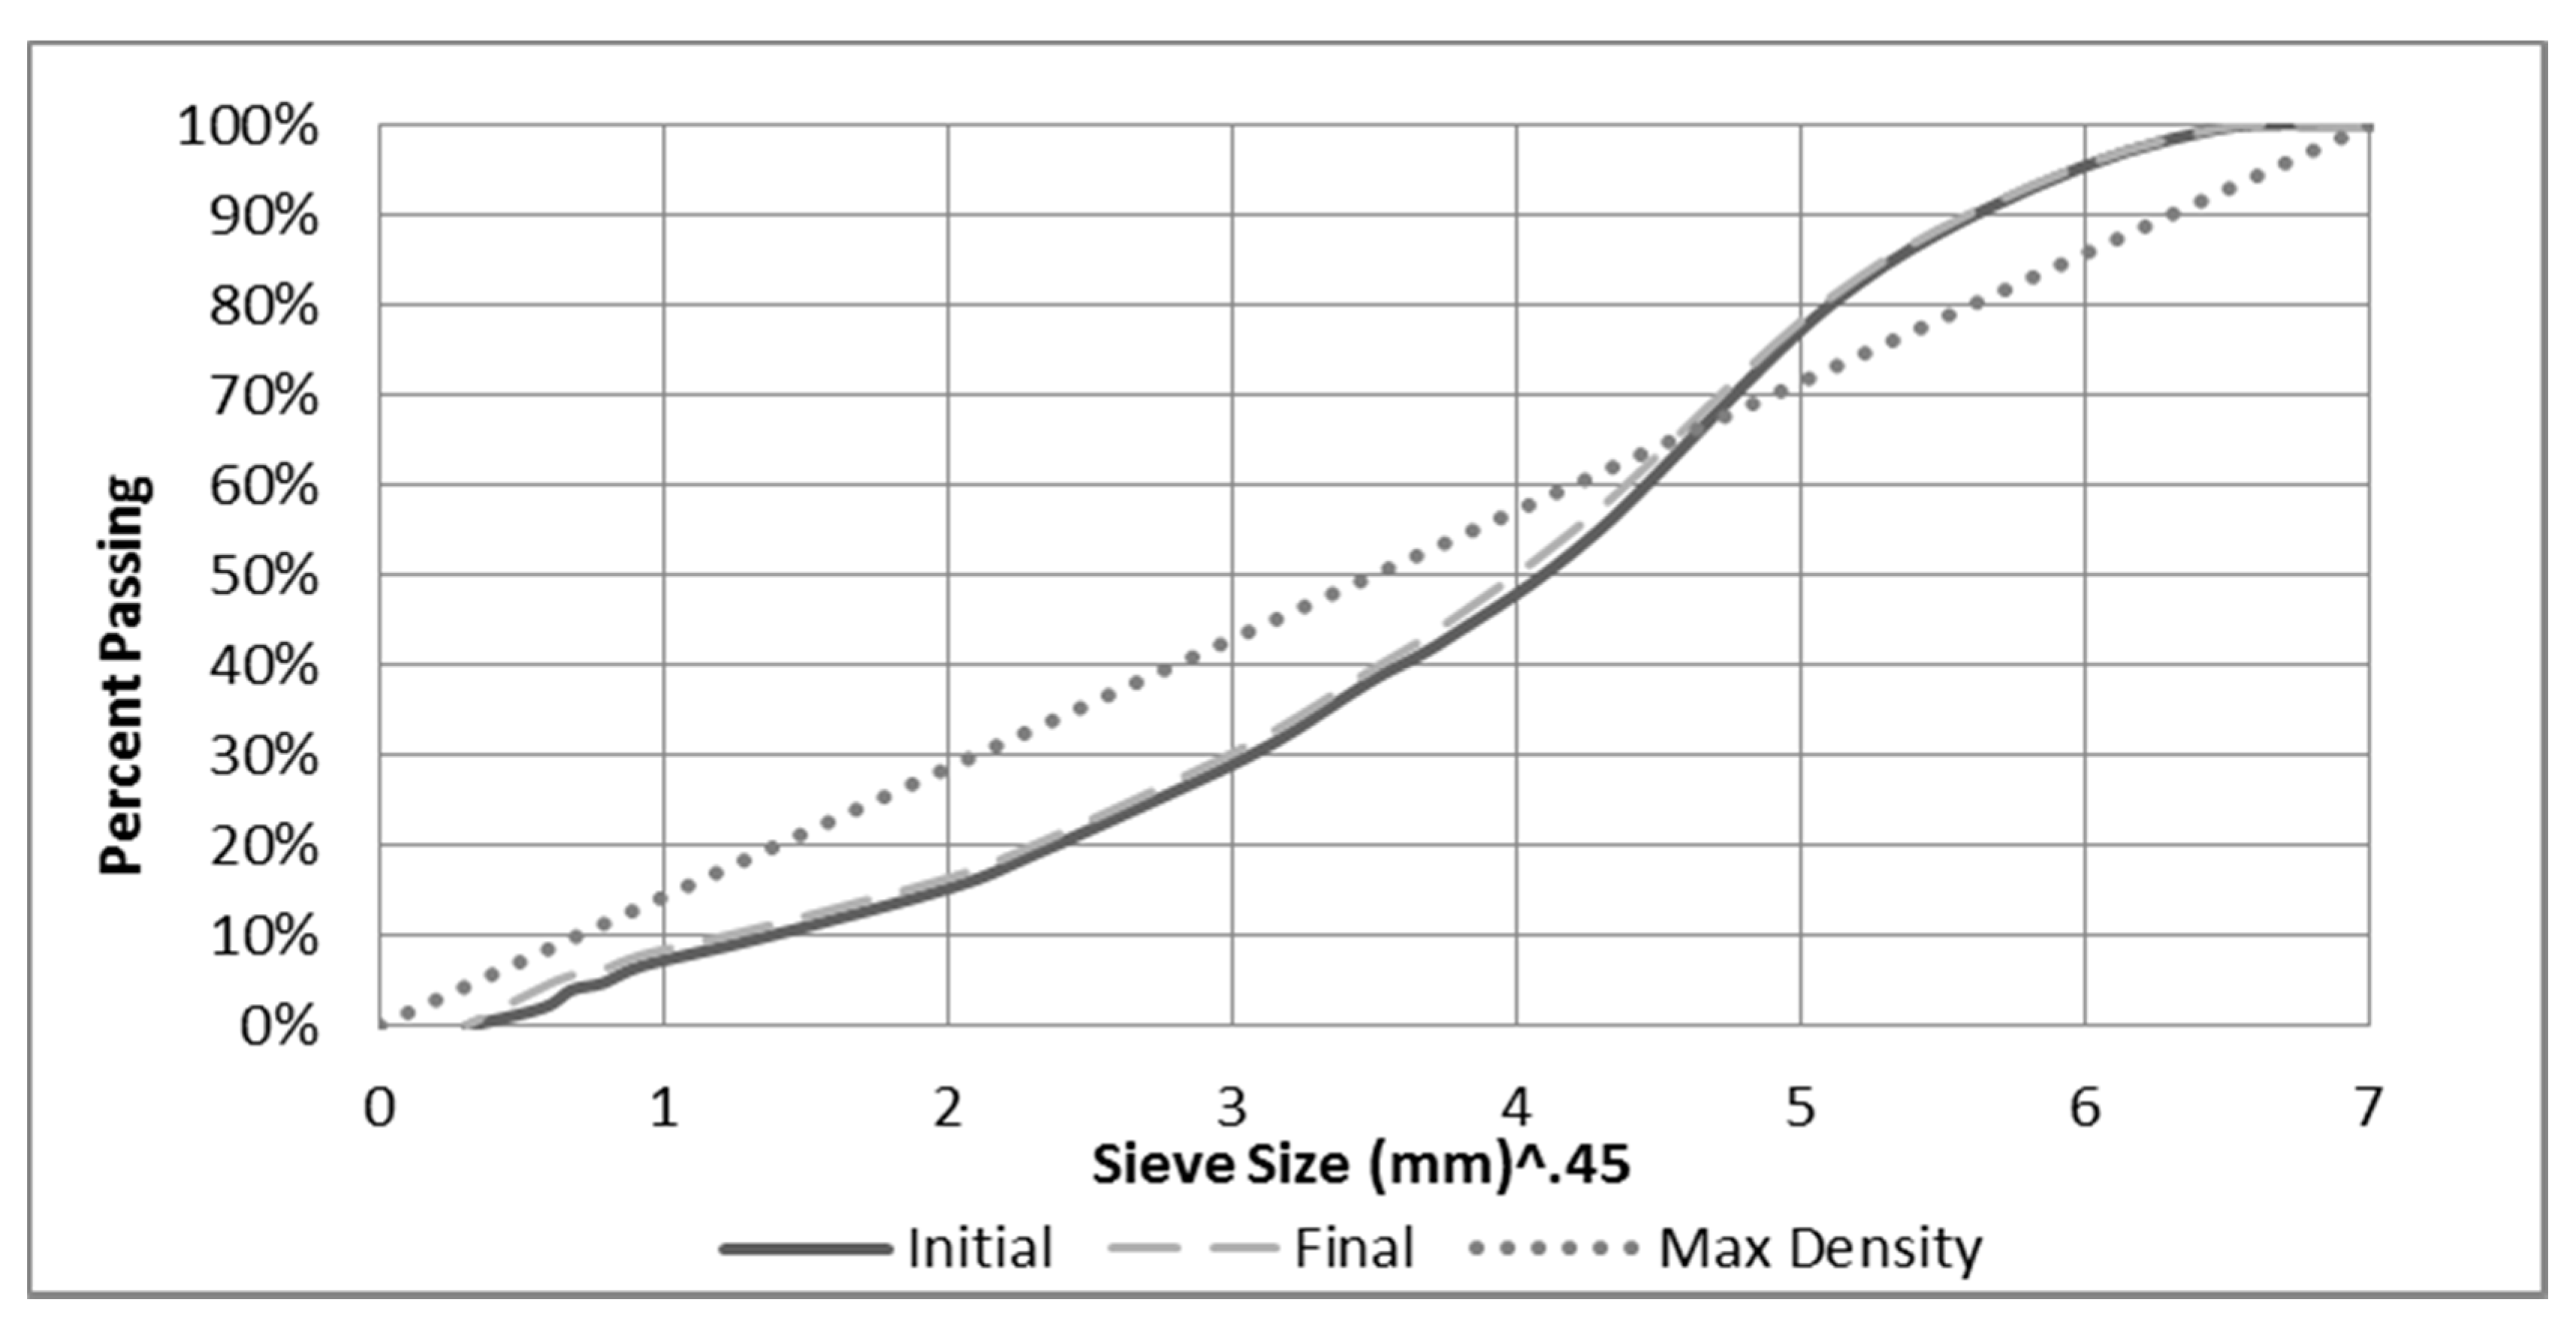
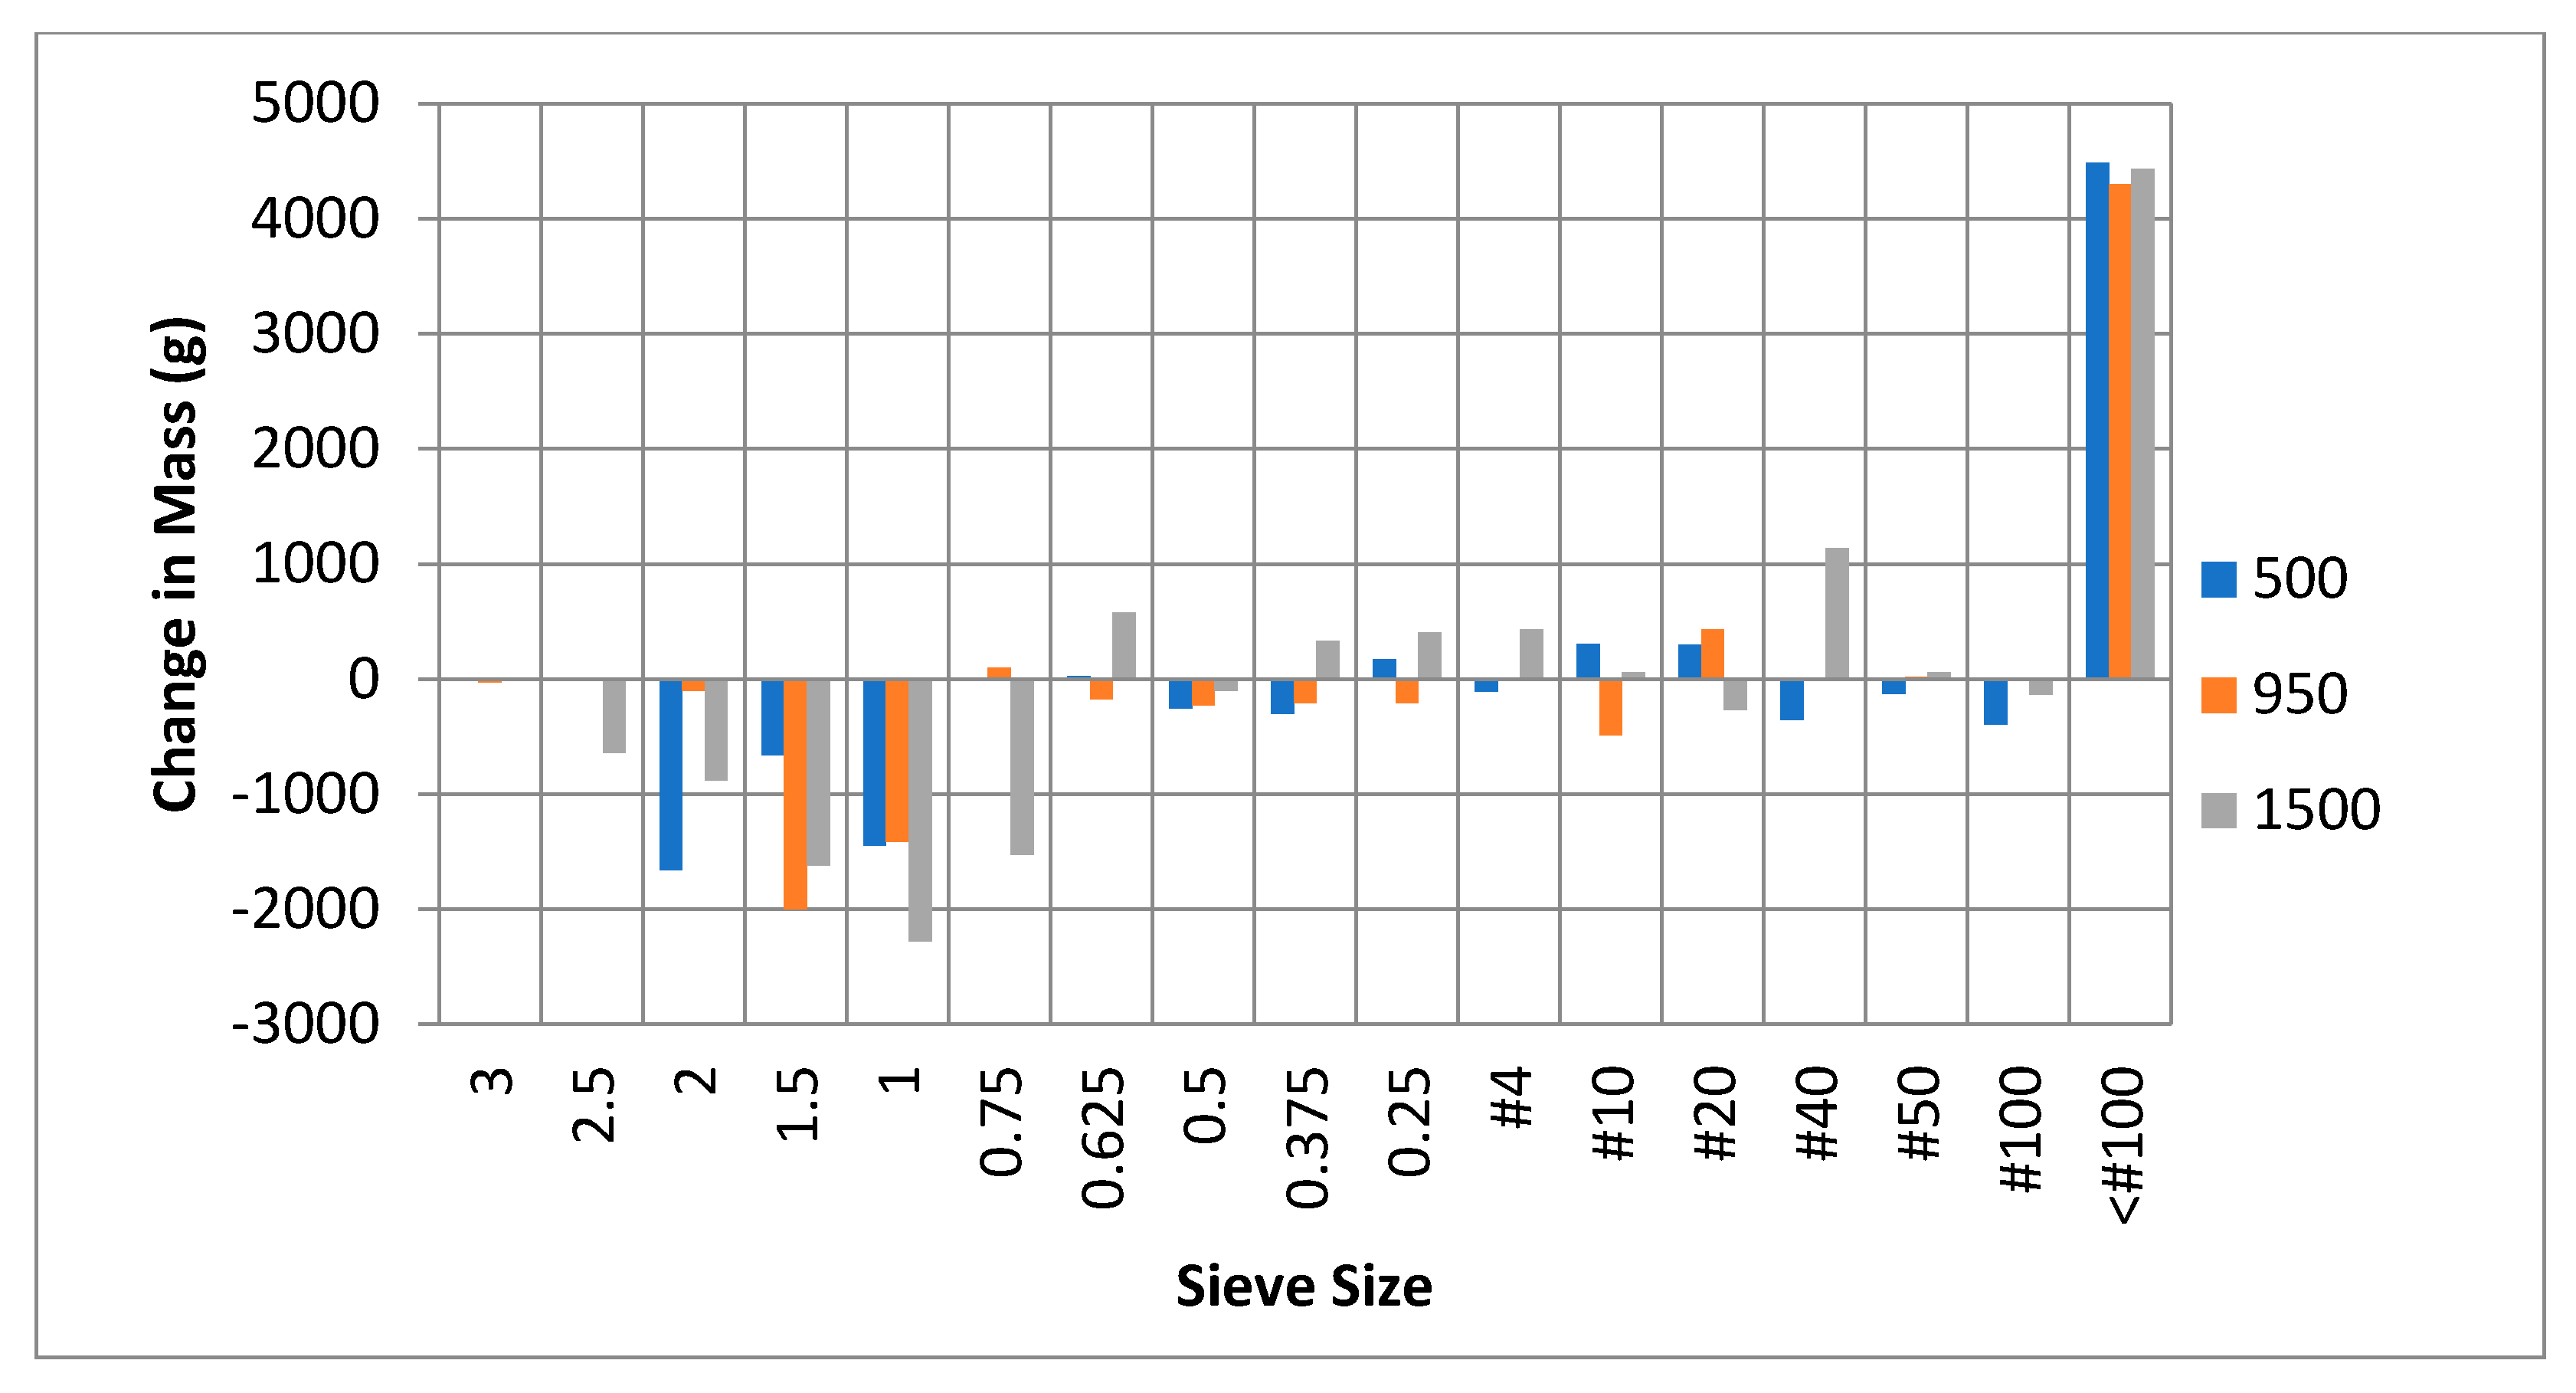
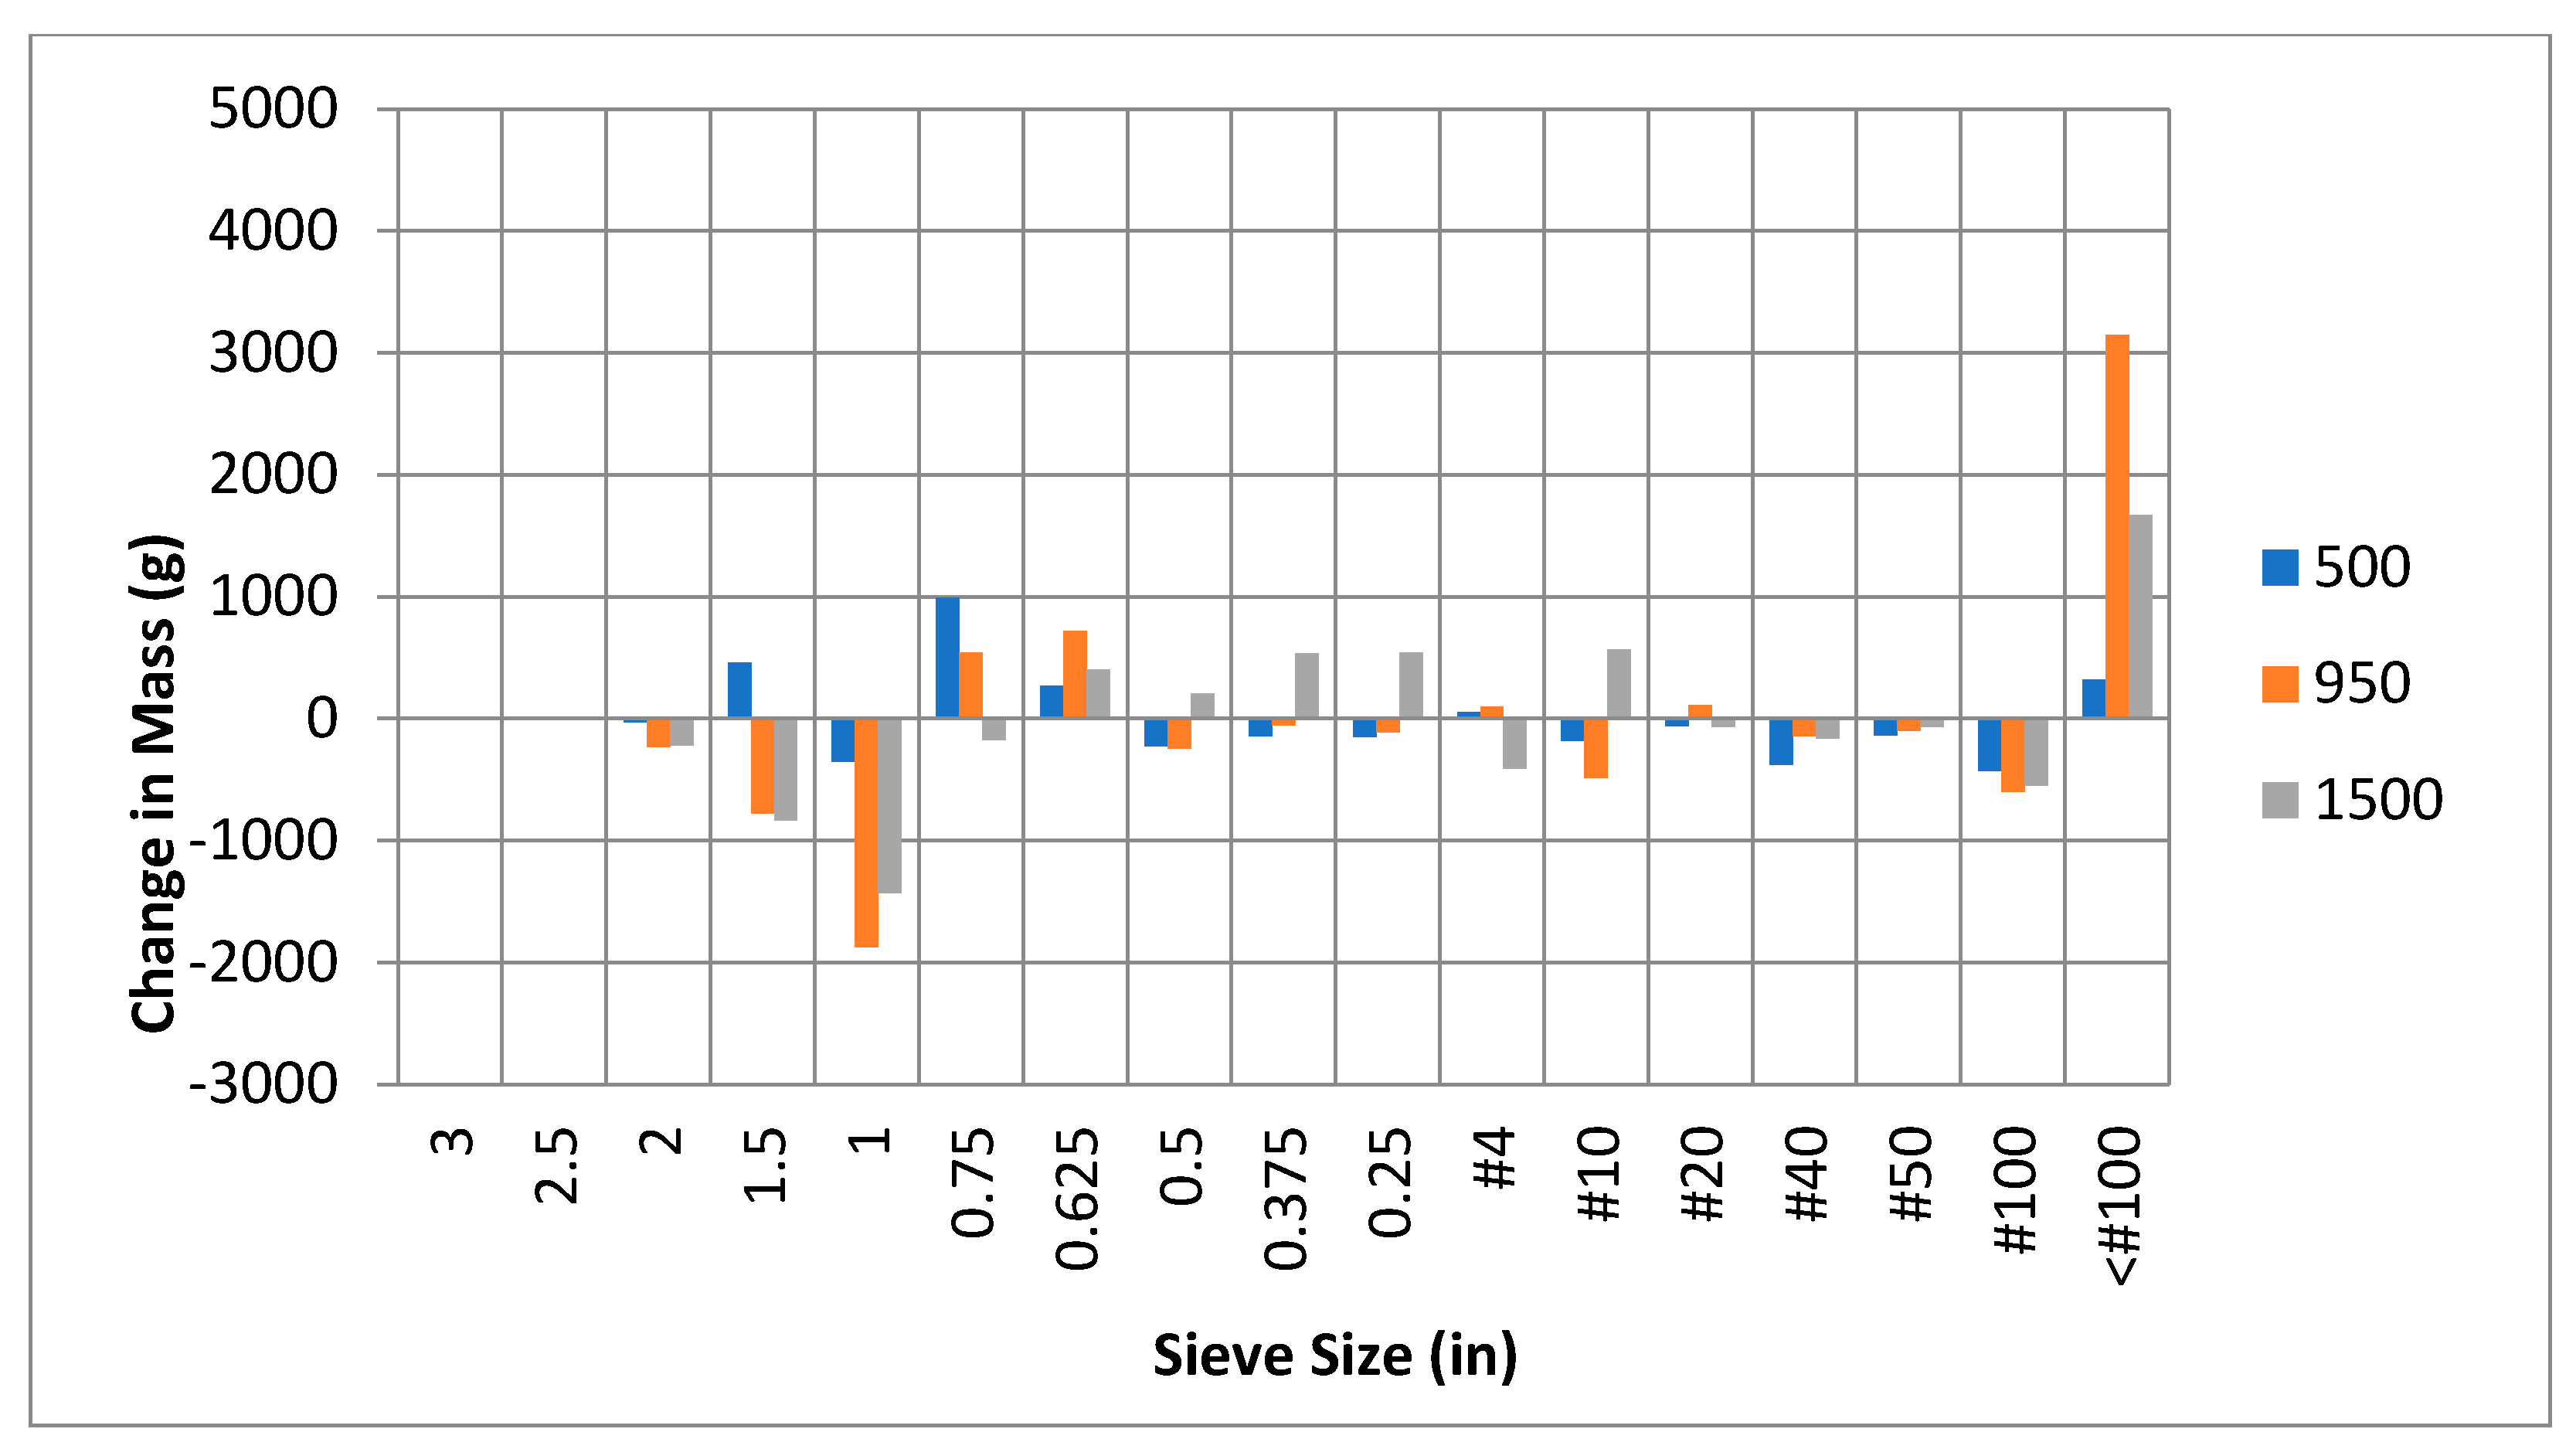
The standard gradation curves make it difficult to distinguish the changes in gradation curves (Figure 2 and Figure 3). However, the results show that the gradation curves for all three aggregates have a similar shape, and trend towards the theoretical maximum density (TMD) line after hauling occurred. However, a detailed look at the changes in mass by individual particle sizes shows reductions in the large particles, with an increase in the fine particles in all aggregate types. However, the quantity is significantly greater in the weaker aggregate (Figure 4 and Figure 5) than in the higher quality aggregates. The amounts of coarse and fine particles generated during hauling are shown in Table 3.
The loss of material was concentrated in the content sizes greater than 2.54 cm (1 inch) sieve; this decrease in mass was retained on and above the 2.55 cm (1 in) level. Mass increases were concentrated in particles passing the #100 sieve; this increase in mass is summarized into the fine index. The changes in weight in the other sieve size classes were minor, which was consistent for all three aggregate types. Additionally, visual analysis of the three painted samples gave evidence that minimal breakage occurred. The coarse index and fine index were used as measures of degradation. The coarse index and fine index results showed that degradation decreased as aggregate quality increased.
4.2. Subgrade Stress Results
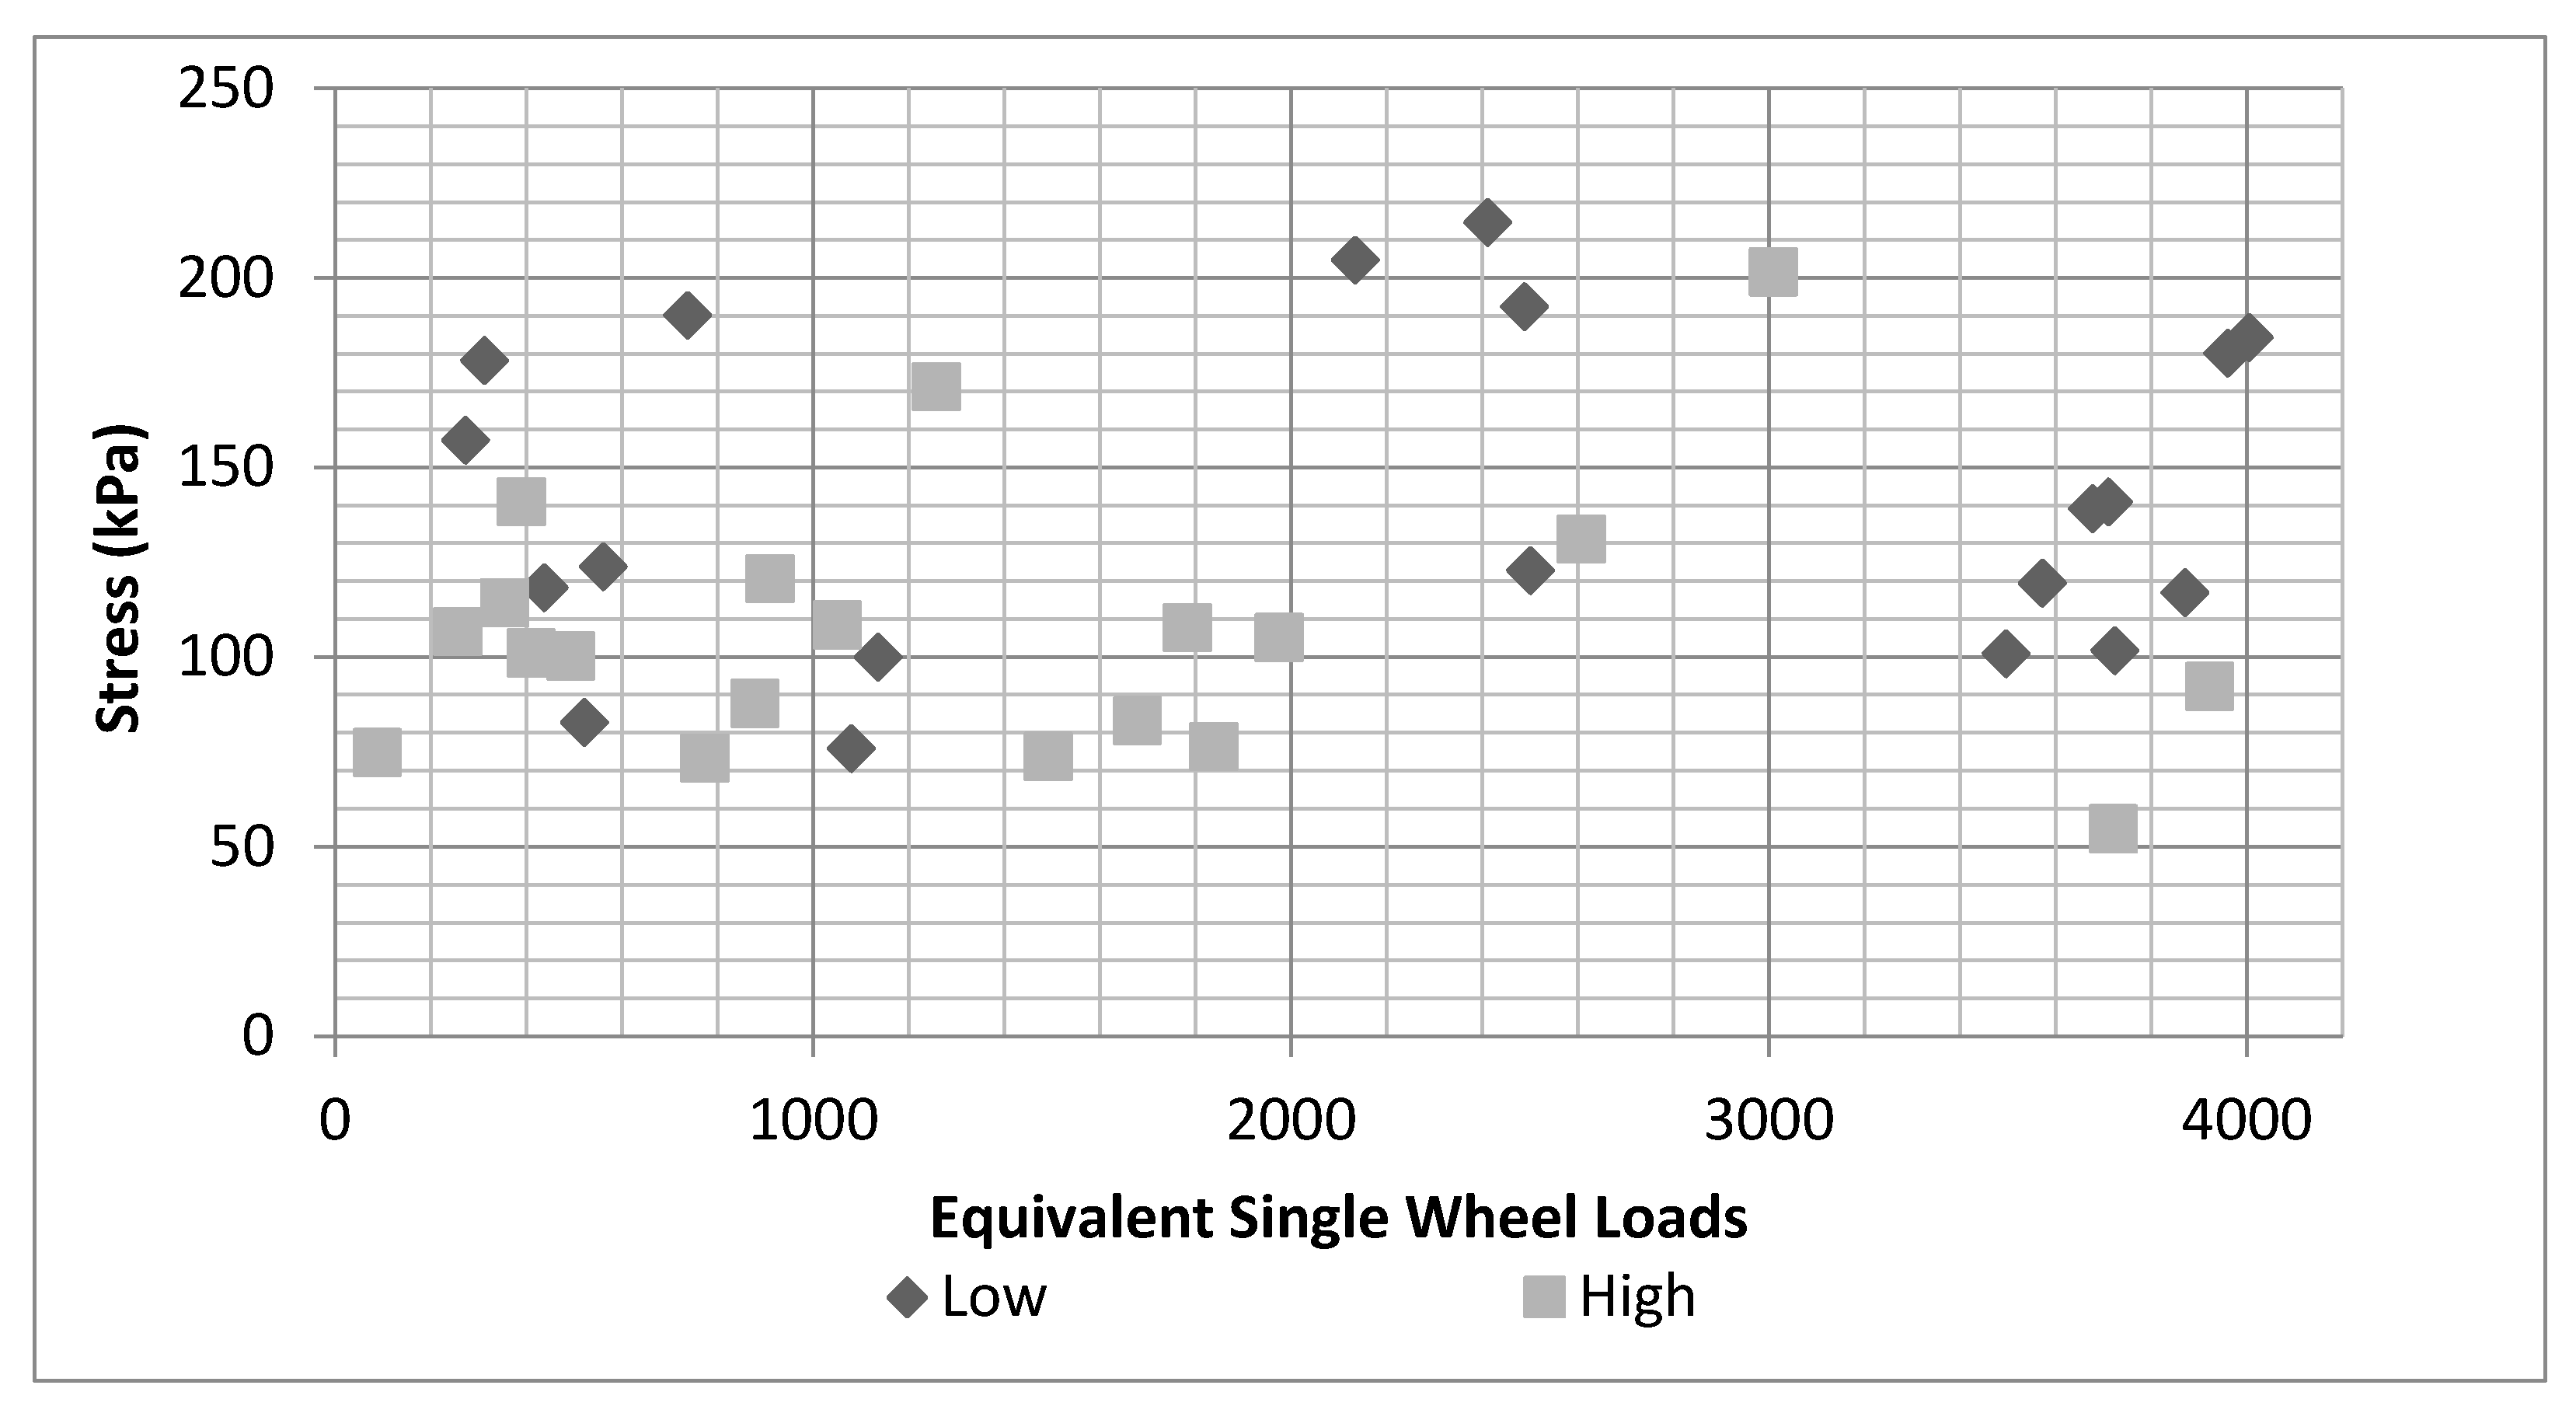
The stress plates measured the pressure that reached the subgrade due to the vehicle. The low-quality aggregate resulted in mean stress of 142 kPa at the aggregate–subgrade interface (20.6 psi) compared to 106 kPa (15.4 psi) for the high-quality aggregate (Figure 6). The results showed that there was higher observed stress at the subgrade for the low-quality rock when compared to the high-quality rock. A similar pattern appeared with the medium-quality rock, however this was removed for clarity of display.
An analysis of variance (ANOVA) test was performed to identify significant factors in the stress readings by testing the linear model: stress = quality + ESWLs. In the linear model, “quality” is a categorical variable representing the high, medium, and low aggregate qualities, while ESWLs is a continuous variable. The model found that aggregate quality resulted in a significant difference in subgrade stress on this road, with a p-value of 0.006.
4.3. Correlation of Degradation with the Material Tests
Multiple correlation comparisons were made between the material tests performed and the three measures of degradation. The coarse index was unable to distinguish between the three groups of aggregate; however, the fine index was better able to capture the attrition-based degradation, making it the preferred measure of degradation for the material studied in this project. The micro-Deval and the LA abrasion tests produced a correlation with the fine index, with a Pearson’s correlation index of 0.7479.
5. Discussion
5.1. Material Testing
Material tests were able to statistically differentiate between the low-, medium-, and high-quality aggregates, while LA abrasion and micro-Deval tests had a high degree of correlation with the fine index.
5.2. Degradation Process
All three aggregate types showed a similar trend of degradation due to traffic. The majority of degradation occurred within the first 500 passes; after that, little degradation occurred with additional traffic. This result is supported by other research that found that the greatest degradation and sediment production occurred quickly and then stabilized over time [11,13].
Samples were exposed to natural rain events that were not consistently spread out over the field trial. As previously mentioned, rain is the primary method of transporting fine sediment out of aggregate road surfaces, and the buildup of fine sediment influences the stability of aggregates [11]. The impact of rain may have reset the degradation process by transporting fine sediment away from the road. The loss of the fine sediment allowed the remaining rock to move, causing additional degradation to refill the voids created until the contacts points were reestablished. This theory is supported by observation of [12], who showed that sediment is produced from the surface of the roads and is likely created during the attrition caused by hauling.
The gradation changes are supported by the results from [11]. The particles susceptible to high-stress loading were the particles above the TMD line. When the gradation dropped below this line, this indicated that there were insufficient particles of the next smallest size to fill in void spaces and distribute loading through the rock layer. These results highlight the importance of gradation regarding the degradation of unbound aggregate surfaces and how the gradation will seek a stabilized level.
5.3. Stress Distribution
The stress data from the stress plates provide further insights into the degradation process. While all the aggregates had similar initial gradations, the high-quality aggregate was able to distribute the load better than lower quality aggregate. The pressure distributed to the subgrade below the high-quality aggregate was less than 75% of the pressure below the low-quality aggregate. However, the limited trials suggest the need for further study to develop the understanding of this relationship between rock quality and stress at the subgrade.
This is likely due to the ability of the high-quality aggregate to resist wear and transfer stresses more efficiently through the rock structure. The lower stresses at the subgrade level would indicate that the high-quality aggregate would require less aggregate to protect the subgrade from a bearing failure by reducing the stress that must be supported by the subgrade. This would contribute to improved environmental performance at two levels—a better distribution of stress that would reduce rut formation and a reduction of the fine sediment produced. Currently, there are no analytical methods to incorporate aggregate quality beyond the CBR in aggregate road design. This study suggests that further work is needed on incorporating aggregate quality into the design process. Additionally, the micro-Deval and LA abrasion tests were correlated with the fine index and present opportunities to predict aggregate wear. This agrees with the results of Hanna and Boston [14], who showed that the micro-Deval test was a better predictor of manager knowledge of aggregate wear than the LA abrasion test.
5.4. Future Study Design
The results indicate possible changes in future field trials that may be more effective. A shorter field trial with more frequent bag removals may provide a better understanding of degradation over time because of the higher data resolution. Furthermore, the results indicate that the majority of the degradation happened within the first 500 passes of the field trial; thus, trials that remove bags at 100, 250, 350, and finally 500 passes should capture more of the initial wearing of the aggregate. Increasing the sample size would be advantageous, as the aggregates were highly variable; however, this is a function of the resources available for the research. Additionally, newer stress plates that can take nearly continuous readings may provide a clearer image of subgrade stresses produced by traffic loading.
6. Conclusions
Design improvements may include the selection of higher quality aggregate, with lower quality aggregate not performing as well as the medium- or high-quality aggregate. The aggregate wear was statistically significantly correlated with the fine index. The quality of the aggregate can influence the generation of fine sediment, which may become mobilized and transported into water bodies, harming the habitat for threatened fish species. Degradation occurs rapidly, within the first 1300 ESWLs, making it an essential factor for even temporary road installations.
The micro-Deval and LA abrasion tests are both highly correlated with the fine index, describing aggregate wear in the road. The stress plate data also indicated that the higher quality aggregate was able to better distribute loading to the subgrade using the rock in this study. A larger range of rock types is suggested for future research. This information can be used in many applications in the future, such as reducing the surface thickness to save money on the transportation of aggregate. Aggregate could also be selected to provide higher subgrade protection or reduce sediment production in streams connected road segments. There are some significant limitations to the research methodology that deserve discussion. Samples were placed two inches under the surface of the road and covered in aggregate. The goal was to simulate the average condition of the aggregate, but the artificial layer that was designed to maintain the integrity of the samples may have introduced an artificial element whose effect is unknown. A second limitation is the necessity to confine the samples. The interface between the geotextile bags and the aggregate is not identical to the interactions between aggregates. While the influence of the bags is not known, the influence of the geotextiles should be similar for all samples. Future work is recommended to explore the influences on aggregate quality and subgrade stress. This study used a limited type of rock, and we recommend that others look to expand on these limited results.
Author Contributions
All authors contributed to the design, implementation, analysis and preparation of the manuscript. All authors have read and agreed to the published version of the manuscript.
Funding
This research was funded by OSU college forests
Conflicts of Interest
No conflict of interests occurred.
References
- Foltz, R.; Burroughs, R. Sediment Production from Forest Roads with Wheel Ruts. In Watershed Planning and Analysis in Action; Riggins, R.E., Ed.; American Society of Civil Engineers: New York, NY, USA, 1990; pp. 266–275. [Google Scholar]
- Boston, K.; Pyles, M.; Bord, A. Compaction of forest roads in Northwestern Oregon–room for improvement. Int. J. For. Eng. 2008, 19, 24–28. [Google Scholar] [CrossRef]
- Sessions, J.; Boston, K.; Thoreson, R.; Mills, K. Optimal Policies for Managing Aggregate Resources on Temporary Forest Roads. West. J. Appl. For. 2006, 21, 207–216. [Google Scholar] [CrossRef] [Green Version]
- Hanna, S.; Boston, K. Aggregate Performance on Forest Roads in the Pacific Northwest. Eur. J. For. Eng. 2018, 4, 43–49. [Google Scholar] [CrossRef]
- Cederholm, C.; Reid, L.; Salo, E. Cumulative Effects of Logging Road Sediment on Salmonid Populations in the Clearwater River, Jefferson County, Washington. In Salmon-Spawning Gravel: A Renewable Resource in the Pacific Northwest? Washington Water Research Center: Seattle, DC, USA, 1980; Volume Rep 39; pp. 38–74. [Google Scholar]
- Boston, K. The potential effects of forest roads on the environment and mitigating their impacts. Curr. For. Rep. 2016, 2, 215–222. [Google Scholar] [CrossRef]
- Boston, K. Impact of the Ninth Circuit Court Ruling (Northwest Environmental Defense Center v. Brown) Regarding Forest Roads and the Clean Water Act. J. For. 2012, 110, 344–346. [Google Scholar]
- Elliot, J.; Foltz, R.; Robichaud, P. Recent Findings Related to Measuring and Modeling Forest Road Erosion. In Proceedings of the 18th World IMACS/MODSIM Congress, International Congress on Modeling and Simulation, Cairns, Australia, 13–17 July 2009; Andersen, R.S., Braddock, R.D., Newham, L.T.H., Eds.; [Google Scholar]
- Indraratna, B.; Lackenby, J.; Christie, D. Effect of Confining Pressure on the Degradation of Ballast Under Cyclic Loading. Géotechnique 2005, 55, 325–328. [Google Scholar] [CrossRef]
- Lackenby, J.; Indraratna, G.; McDowell, G.; Christie, D. Effect of Confining Pressure on Ballast Degradation and Deformation under Cyclic Triaxial Loading. Géotechnique 2007, 57, 527–536. [Google Scholar] [CrossRef] [Green Version]
- Werkmeister, S.; Dawson, A.; Wellner, F. Permanent Deformation Behavior of Granular Materials. Road Mater. Pavement Des. 2005, 6, 31–51. [Google Scholar] [CrossRef]
- Toman, E.; Skaugset, A. Reducing sediment production from forest roads during wet-weather hauling. Trans. Res. Rec. 2011, 2203, 13–19. [Google Scholar] [CrossRef]
- Foltz, R.; Truebe, M. Locally Available Aggregate and Sediment Production. Trans. Res. Rec. J. Trans. Res. Board. 2003, 1819, 185–193. [Google Scholar] [CrossRef] [Green Version]
- McNally, G. Soil and Rock Construction Materials; E. & FN Spon: London, UK, 1998. [Google Scholar]
- MIRAFI. Mirafi 1100N Technical Data Sheet—TDS_1100N; Mirafi Construction Products: Pendergrass, GA, USA, 2012; Available online: www.tencate.com/TenCate/Geosynthetics/documents/.../TDS_1100N.pdf (accessed on 29 August 2013).
- Donaghe, R.; Torrey, V. A compaction test method for soil-rock mixtures in which equipment size effects are minimized. Geotech. Test. J. 1994, 17, 363–370. [Google Scholar]
- American Association for Testing and Materials (ASTM). Soil and Rock (I):D0422 Test Method for Particle-Size Analysis of Soils. D6928-10 Test Method for Resistance of Coarse Aggregate to Degradation by Abrasion in the micro-Deval Apparatus. C535-12 Test Method for Resistance to Degradation of Large-Size Coarse Aggregate by Abrasion and Impact in the Los Angeles Machine; ASTM: West Conshohocken, PA, USA, 2006; Volume 04.08. [Google Scholar]
- Bolander, P.; Marocco, D.; Kennedy, R. Earth and Aggregate Surfacing Design Guide for Low Volume Roads; EM-7170-16; USDA Forest Service: Washington, DC, USA, 1995.
Figure 1.
Field sample installation layout.

Figure 2.
Average gradation changes of low-quality aggregate samples.

Figure 3.
Average gradation changes of high-quality aggregate samples.

Figure 4.
Mass flow of low-quality aggregate sample averages by loading intensity.

Figure 5.
Changes in mass of high-quality aggregate sample averages by loading intensity.

Figure 6.
The 20 largest subgrade stress readings per plate.


Table 1.
Mean values of the material test results.
| Micro-Deval (Mass Loss) | LA Abrasion (Mass Loss) | Percent Passing #40 Sieve | |
|---|---|---|---|
| High | 9.1% | 16.9% | 5.5% |
| Medium | 18.6% | 20.3% | 6.8% |
| Low | 37.1% | 31.8% | 4.1% |
Table 2.
Tukey’s comparisons of mean test results.
| Micro-Deval (Mass Loss) | L.A. Abrasion (Mass Loss) | |
|---|---|---|
| High-Low | 0.00454 | 0.000 |
| High-Med | 0.939 | 0.167 |
| Med-Low | 0.00231 | 0.000 |
Table 3.
Measures of degradation.
| Aggregate Quality | Coarse Material Lost | Fine Material Gained |
|---|---|---|
| High | 2.2% | 2.2% |
| Medium | 2.6% | 3.1% |
| Low | 5.1% | 5.3% |
© 2020 by the authors. Licensee MDPI, Basel, Switzerland. This article is an open access article distributed under the terms and conditions of the Creative Commons Attribution (CC BY) license (http://creativecommons.org/licenses/by/4.0/).
Share and Cite
MDPI and ACS Style
De Witt, A.; Boston, K.; Leshchinsky, B. Predicting Aggregate Degradation in Forest Roads in Northwest Oregon. Forests 2020, 11, 729. https://doi.org/10.3390/f11070729
AMA Style
De Witt A, Boston K, Leshchinsky B. Predicting Aggregate Degradation in Forest Roads in Northwest Oregon. Forests. 2020; 11(7):729. https://doi.org/10.3390/f11070729
Chicago/Turabian StyleDe Witt, Austin, Kevin Boston, and Ben Leshchinsky. 2020. "Predicting Aggregate Degradation in Forest Roads in Northwest Oregon" Forests 11, no. 7: 729. https://doi.org/10.3390/f11070729
Note that from the first issue of 2016, this journal uses article numbers instead of page numbers. See further details here.