Transcriptional Modulation of Resistance against Xanthomonas oryzae pv. oryzae Korean Race K2 in japonica Rice


1
Department of Crop Science, Chungbuk National University, Cheongju 28644, Korea
2
Center for Studies in Biotechnology, Cebu Technological University Barili Campus, Cagay, Barili 6036, Cebu, Philippines
*
Author to whom correspondence should be addressed.
†
Affiliation 2 is the current address.
Agronomy 2020, 10(7), 960; https://doi.org/10.3390/agronomy10070960
Submission received: 15 May 2020
/
Revised: 14 June 2020
/
Accepted: 30 June 2020
/
Published: 3 July 2020
(This article belongs to the Section Crop Breeding and Genetics)
Abstract
:Bacterial blight is a common disease found in the rice-growing regions in the Korean peninsula. Identification of the gene network involved against Xanthomonas oryzae pv. oryzae Korean race K2 in popular japonica cultivars is essential in underpinning the molecular mechanism of resistance. A microarray of two popular Korean japonica rice cultivars, a bacterial blight susceptible Dongjin and resistant Jinbaek, was performed to investigate the transcripts of inducible genes at 48 h post-inoculation. A total of 771 differentially expressed genes were identified in Jinbaek, whereas 298 were found in Dongjin. The resistance observed in Jinbaek is likely participated by genes with predicted functions in transmembrane perception, intracellular signal transduction, and transcription activity. Moreover, the remarkable involvement of numerous WRKY proteins signifies orchestration of defense signals via robust cellular reprogramming, which leads to resistance. To discover genes essential to bacterial blight resistance in Jinbaek, 13 highly expressed genes encoding different protein classes were cloned and overexpressed in rice. Although none of the overexpression plants exhibited resistance comparable to Jinbaek, four candidate genes, including one twin-arginine translocation pathway signal (LOC_Os01g45640.1), one cytochrome p450 (LOC_Os09g10340.1), and two uncharacterized expressed protein (LOC_Os08g26230.4, LOC_Os09g04310.1) conferred partial resistance. However, of these four genes, only p450s have been reported to play an important role in the synthesis of plant defense compounds. These findings revealed the complexity of key immune signaling conduits critical to mounting a full defense against Xanthomonas. oryzae pv. oryzae race K2 in japonica rice.
1. Introduction
Bacterial leaf blight (BB) is a formidable threat to rice production both in tropical and temperate regions. Its causal pathogen, Xanthomonas oryzae pv. oryzae (Xoo) inflicts necrosis on the rice leaf blade resulting in reduced photosynthetic rate [1,2], thereby affecting grain yield. Despite extensive breeding programs designed to combat this disease, a widespread occurrence is still evident in major rice-growing areas. At least 40 resistance genes have been identified from wild and cultivated accessions [3,4,5], among which Xa4, xa5, Xa7, xa13, and Xa21-carrying cultivars are commonly deployed in the rice farms in Asia [3,5]. However, large-scale and long-term cultivation of specific resistant cultivars has been attributed to the shift in the race frequency of Xoo and breakdown of single major R gene, such as the case of Xa4 [6,7,8].
In South Korea, the notable evolution of the Xoo population despite the absence of their host-gene counterparts has been documented; wherein variants of pathotypes were found spreading from the southwestern coastal plains to the mid-northern regions [8]. Xoo race K2 has been found widespread in Korea since 2003 [9]. Gene pyramiding of resistance genes Xa4, xa5, and Xa21 have been considered as the most effective strategy for improving Korean japonica cultivars for BB resistance [8,10,11]. A comparative genomic analysis between Xanthomonas related species revealed that Xoo harbors approximately twice as many transposable elements as the genomes of X. campestris pv. campestris (Xcc) and X. axonopodis pv. citri (Xac) [12]. This discovery fundamentally underpins how fast this pathogen evolves as transposons can induce large-scale genome reorganization.
Accumulating evidence suggests that activation of host defense relies on the recognition and constant surveillance of invading elicitors by pattern recognition receptor (PRRs) and nucleotide-binding site-leucine-rich repeat (NBS-LRR), [13,14], and the subsequent transduction of signals. Forming the plant surveillance system and as the first layer of inducible defense is the receptor-like kinases (RLKs) that recognize cytoplasmic effector and receptor-like proteins (RLPs), which detect apoplastic patterns [15]. The resistance specificity of hosts is determined by LRR-containing resistance (R) genes as they interact with major effector proteins [16]. This was demonstrated by Pi-ta, a CC-NBS-LRR gene against blast, which depends on a single aa difference in the LRR domain (serine instead of alanine at position 918 with its susceptible allele Pi-ta−) [16]. In addition to receptors and NBS-LRR type R proteins, activation of WRKY transcriptions factors was also shown to increase the resistance of rice to Xoo and Magnaporthe grisea [14,17].
Microarray allows simultaneous measurement of the transcriptional levels of thousands of genes, making it possible to globally identify defense-related genes [18,19]. Completion of genome sequences for both rice and Xoo, as well as the development of oligo arrays [20], facilitates robust genome-wide expression profiling of this pathosystem. Transcriptional profiling has been employed to investigate the molecular mechanisms of some Xa resistance genes in rice, including Xa21 and Xa39. While results revealed similar machinery used in each system, both differed on the timing and activation of a particular regulatory pathway. Given that each resistance gene triggers unique transcriptomic modulations, it is interesting to examine the molecular mechanism of resistance in some popular modern cultivars and understand how the genetic background affects the dynamics of cellular reprogramming.
This study aimed to investigate the regulation of gene networks during the intermediate response to Xoo Korean race K2 using whole-genome oligonucleotide microarray of two popular Korean japonica rice cultivars. cDNA libraries of “Dongjin”, which is a bacterial blight sensitive and “Jinbaek”, a mid-late maturing and bacterial blight resistant cultivar, were employed to provide an overview of transcriptional modulation during compatible and incompatible plant-pathogen interaction.
2. Materials and Methods
2.1. Plant Materials, Growth Conditions, and Treatments
Healthy seeds of Dongjin (DJ) and Jinbaek (JB) were pre-germinated, and the seedlings were grown on a 50% composed peat and 50% earth soil mixture in a growth chamber. Plants were grown in a 13/11 photoperiod with a temperature setting of 28 °C/22 °C (day/night), 60% humidity, and a light intensity of 20,000 lux. The 6-week-old plants were inoculated with 1 × 10⁸ colony-forming unit (CFU) per ml Xoo Korean race K2. Mock treatment was also provided by inoculating the leaves with sterile water. Leaf samples pooled from three plants was taken as a biological replicate. Leaf tissues that were sampled at 48 h post-inoculation (hpi) were immediately submerged in liquid nitrogen.
2.2. Molecular Detection of X. oryzae pv. oryzae
Detection of X. oryzae pv. oryzae was carried out, as described in [21]. Briefly, high-quality genomic DNA templates were isolated from the leaves of inoculated and uninoculated leaves of ‘Dongjin’ and Jinbaek using cetyltrimethylammonium bromide (CTAB) buffer [22]. Primer pairs, JLXooF (5′-3′) CCTCTATGAGTCGGGAGCTG and JLXooR (5′-3′) ACACCGTGATGCAATGAAGA were used to amplify 230 bp-length regions of putative glycosyltransferase (AF169030.1) gene of Xoo using genomic PCR.
2.3. RNA Isolation, cDNA Synthesis, and Hybridization
Total RNA was extracted using the Trizol method (Invitrogen, Carlsbad, CA, USA) and cleaned from DNA contamination using DNase 1 kit (Invitrogen, Carlsbad, CA, USA). The purity and quality of freshly isolated RNA were then assessed using NanoDrop One UV-Vis Spectrophotometer (Thermo Fisher Scientific, Madison, WI, USA) and Agilent 2100 Bioanalyzer (Agilent Technologies, Palo Alto, CA, USA). Probe array hybridization procedures were carried out by DNALINK, INC (Seoul, Korea) as described in GeneChip Expression Analysis Technical Manual (https://tools.thermofisher.com/content/sfs/manuals/gcas_ht_plate_manual.pdf). Briefly, using a T7-Oligo promoter primer, a 1 µg of total RNA was first reverse-transcribed. Following RNase H-mediated second-strand cDNA synthesis, the resulting purified double-stranded cDNA was used in the subsequent in vitro transcription (IVT) reaction as a template. The IVT reaction was performed in the presence of T7 RNA Polymerase and a biotinylated nucleotide analog/ribonucleotide mix for cRNA amplification and biotin labeling. The biotinylated cRNA targets were then cleaned up, fragmented, and hybridized to GeneChipTM HT Array Plates.
2.4. Microarray Data Normalization, Analysis, and Gene Annotation
cDNA microarray was carried out using Affymetrix GeneChip® Rice (ssp. japonica) with 521,299 probes, including 29,664 gene-level probe sets. Probe array was scanned to create image data (DAT) files using the Affymetrix GeneChip Scanner 3000 7G (Thermo Fisher Scientific, USA). Scanned array images were then analyzed by the Affymetrix GeneChip Command Console® Software in a process including alignment of a grid on the image (DAT) file to identify the probe cells, analysis of the probe cell intensity data for the array (CEL), and generation of JPG and RPT in CHP file. The microarray probe intensity values were then background-corrected, summarized, and normalized by the Robust Multi-array Average using Affymetrix Expression Console 1.4. All probes used in the experiment chip were filtered out, and only those having ≥2-absolute-fold-change were selected. Functional annotation of DEGs was performed using DAVID 6.8 web tool [23]. The databases used to assign functions include Gene ontology and COG, and pathways using BIOCARTA and KEGG. For identification of enriched terms, the Oryza sativa japonica group was used as background list and DEGs as the screened gene list obtained from the background list to compute the EASE Score, a modified Fisher Exact P-value, using a hypergeometric test.
2.5. Expression Analysis of K2-Induced DEGs
To check the spatiotemporal expression of 13 selected DEGs, total RNA was isolated from different tissues (root, stem, leaf sheath, leaf, flag leaf), growth stages (germinating seeds, 3-leaf stage seedling, maximum tillering, panicle initiation), and leaves of plants sprayed with 100 µM salicylic acid (C7H6O3) and 100 µM jasmonic acid (C12H18O3). RNA isolation and cDNA synthesis were performed as described above. Briefly, the full-length cDNA of selected DEGs was amplified using the corresponding specific primer pair (Table S1). The cDNA product was then used as a template for PCR.
For validation of K2-DEGs microarray, the cDNA of 13 selected DEGs was added in a 10 μL reaction mixture that contains 5 μL iQ SYBR Green Supermix (Bio-Rad, Hercules, CA, USA) and loaded on the CFX Connect Real-time system (Bio-Rad, Hercules, CA, USA) with the following running condition: 5 min at 95 °C, 45 cycles of amplification with denaturation for 5 s at 95 °C, annealing for 30 s at 55 °C, and extension for 20 s at 72 °C. Three replications were provided for each reaction. Ubiquitin primers were used as an internal and loading control for normalization of the expression level of each treatment.
2.6. DEGs Isolation, Vector Construction, and Rice Transformation
Total RNA was isolated from the young leaves of japonica rice cv. Jinbaek using the RNAiso Plus extraction reagent (Takara Bio Inc. Tokyo, Japan). The first-strand cDNA was synthesized from 1 µg of high-quality total RNA in a 20-μL reaction volume containing Superscript III First-Strand cDNA Synthesis Kit (Invitrogen, Carlsbad, CA, USA). The cDNA library of each gene was used as a template for PCR using gene-specific primers (Table S2). Amplicons having the expected right band size were eluted using the gel purification kit (Bioneer, Oakland, CA, USA) and were sub-cloned into the pGEMT-easy vector (Promega, Madison, WI, USA) for sequencing. Sequence homology was confirmed using multiple sequence alignment. The full-length cDNA of each gene was ligated into the appropriate enzyme sites of pCAMBIA1300 using the T4 ligase kit (Promega, Madison, USA). Ligated products were transformed into Agrobacterium tumefaciens strain EHA105, which were then transformed into japonica rice cv. Dongjin, as described in Lee et al. [24].
2.7. Copy Number Assay Using TaqMan qPCR
Detection of the copy number of inserted genes in T0 transgenic rice was performed using the TaqMan assay (Applied Biosystems, Foster City, CA, USA). The 10 ng of purified genomic was added with a FAM dye-labeled MGB probe to detect the genomic DNA target sequence, VIC dye-labeled TAMRA probe to detect the genomic DNA reference sequence, and TaqMan Genotyping Master Mix which contains AmpliTaq Gold DNA polymerase, ultrapure, and dNTPs. All qPCR reactions were run in triplicates on an ABI 7900HT instrument (Applied Biosystems, CA, USA) using the following conditions: enzyme activation at 95 °C for 10 min, denaturation at 95 °C for 15 s, and annealing at 60 °C for 60 s. Data were analyzed using CopyCaller Software v 2.0 (Applied Biosystems, CA, USA).
2.8. Pathogenicity Test
Seven-week-old transgenic plants were inoculated with Xoo Korean race K2 resuspended in water at a density of 108 CFU/mL using the leaf-clipping method described in [25]. Three lines for each transgenic were used in the screening with three replications. Control plants were provided, including the wild type parent Dongjin, which is susceptible and the resistant cultivar Jinbaek. Lesion length was recorded at 16 days post-inoculation (dpi) in cm. The average value was interpreted using the standard evaluation system [26]) with the following scale: 0.0~5.0 cm (Resistant, R), 5.1~10.0 (Moderately Resistant, MR), 10.1~15.0 (Moderately Susceptible), and ≥15.1 (Susceptible, S).
2.9. Statistical Analysis
Data were subjected to Analysis of Variance (ANOVA), and treatment means with significant p value were compared using Duncan’s Multiple Range Test (DMRT) in SAS 9.4m5 (SAS Institute Inc, Cary, NC, USA, 2017).
3. Results
3.1. Phenotypic and Genotypic Characteristics of Dongjin and Jinbaek
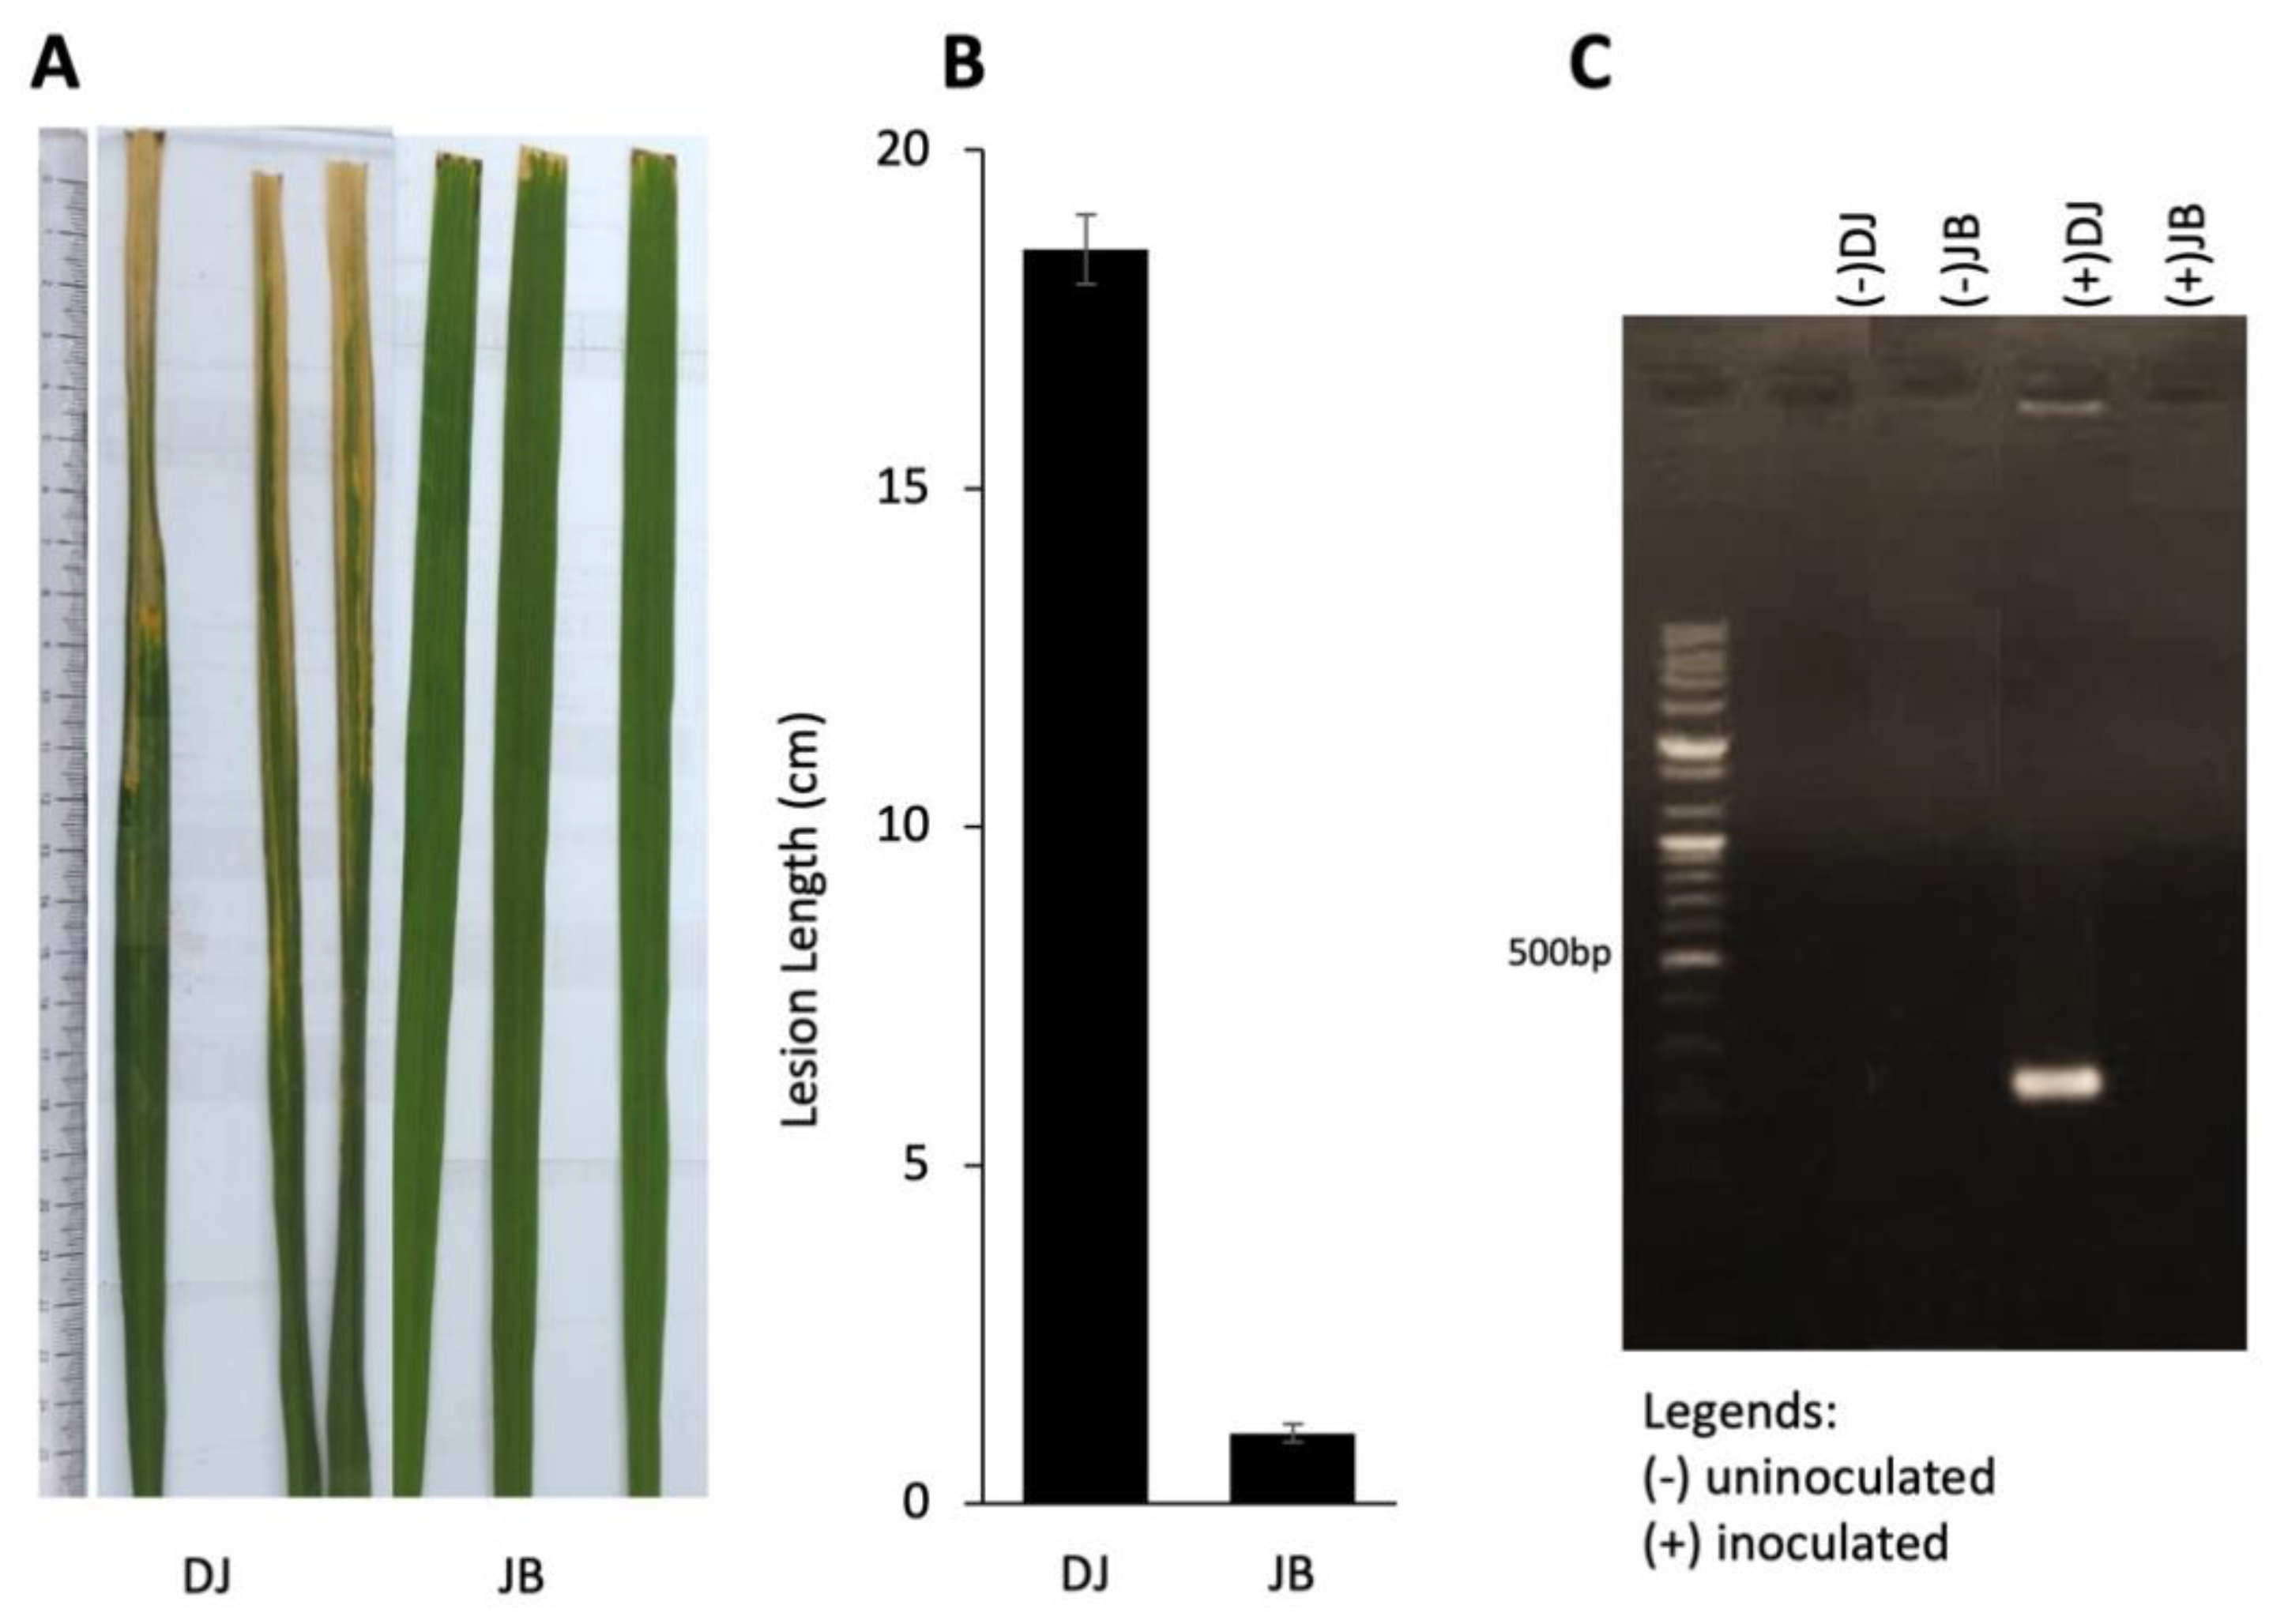
Bacterial blight disease screening using Xoo Korean race K2 showed that Dongjin (DJ) is highly susceptible (18.2 cm ± 0.4), while Jinbaek (JB) is strongly resistant (1.07 cm ± 0.15) (Figure 1A, B) at 14 dpi. Further, a 240-bp amplicon of putative glycosyltransferase (AF169030.1), indicating the presence of Xoo, was detected only in the leaves of infected DJ but not in JB (Figure 1C), which corroborates the disease screening result.
3.2. Differentially Expressed Genes between JB and DJ in Response to Xoo K2
Expression values inferred from the scanned hybridization signals were normalized and data were further processed for fold change and statistical filtering (Figure 2). Probes with values that passed both filter thresholds were inferred as the differentially expressed genes (DEGs) and used as a gene lists of a corresponding genotype for the subsequent analysis.
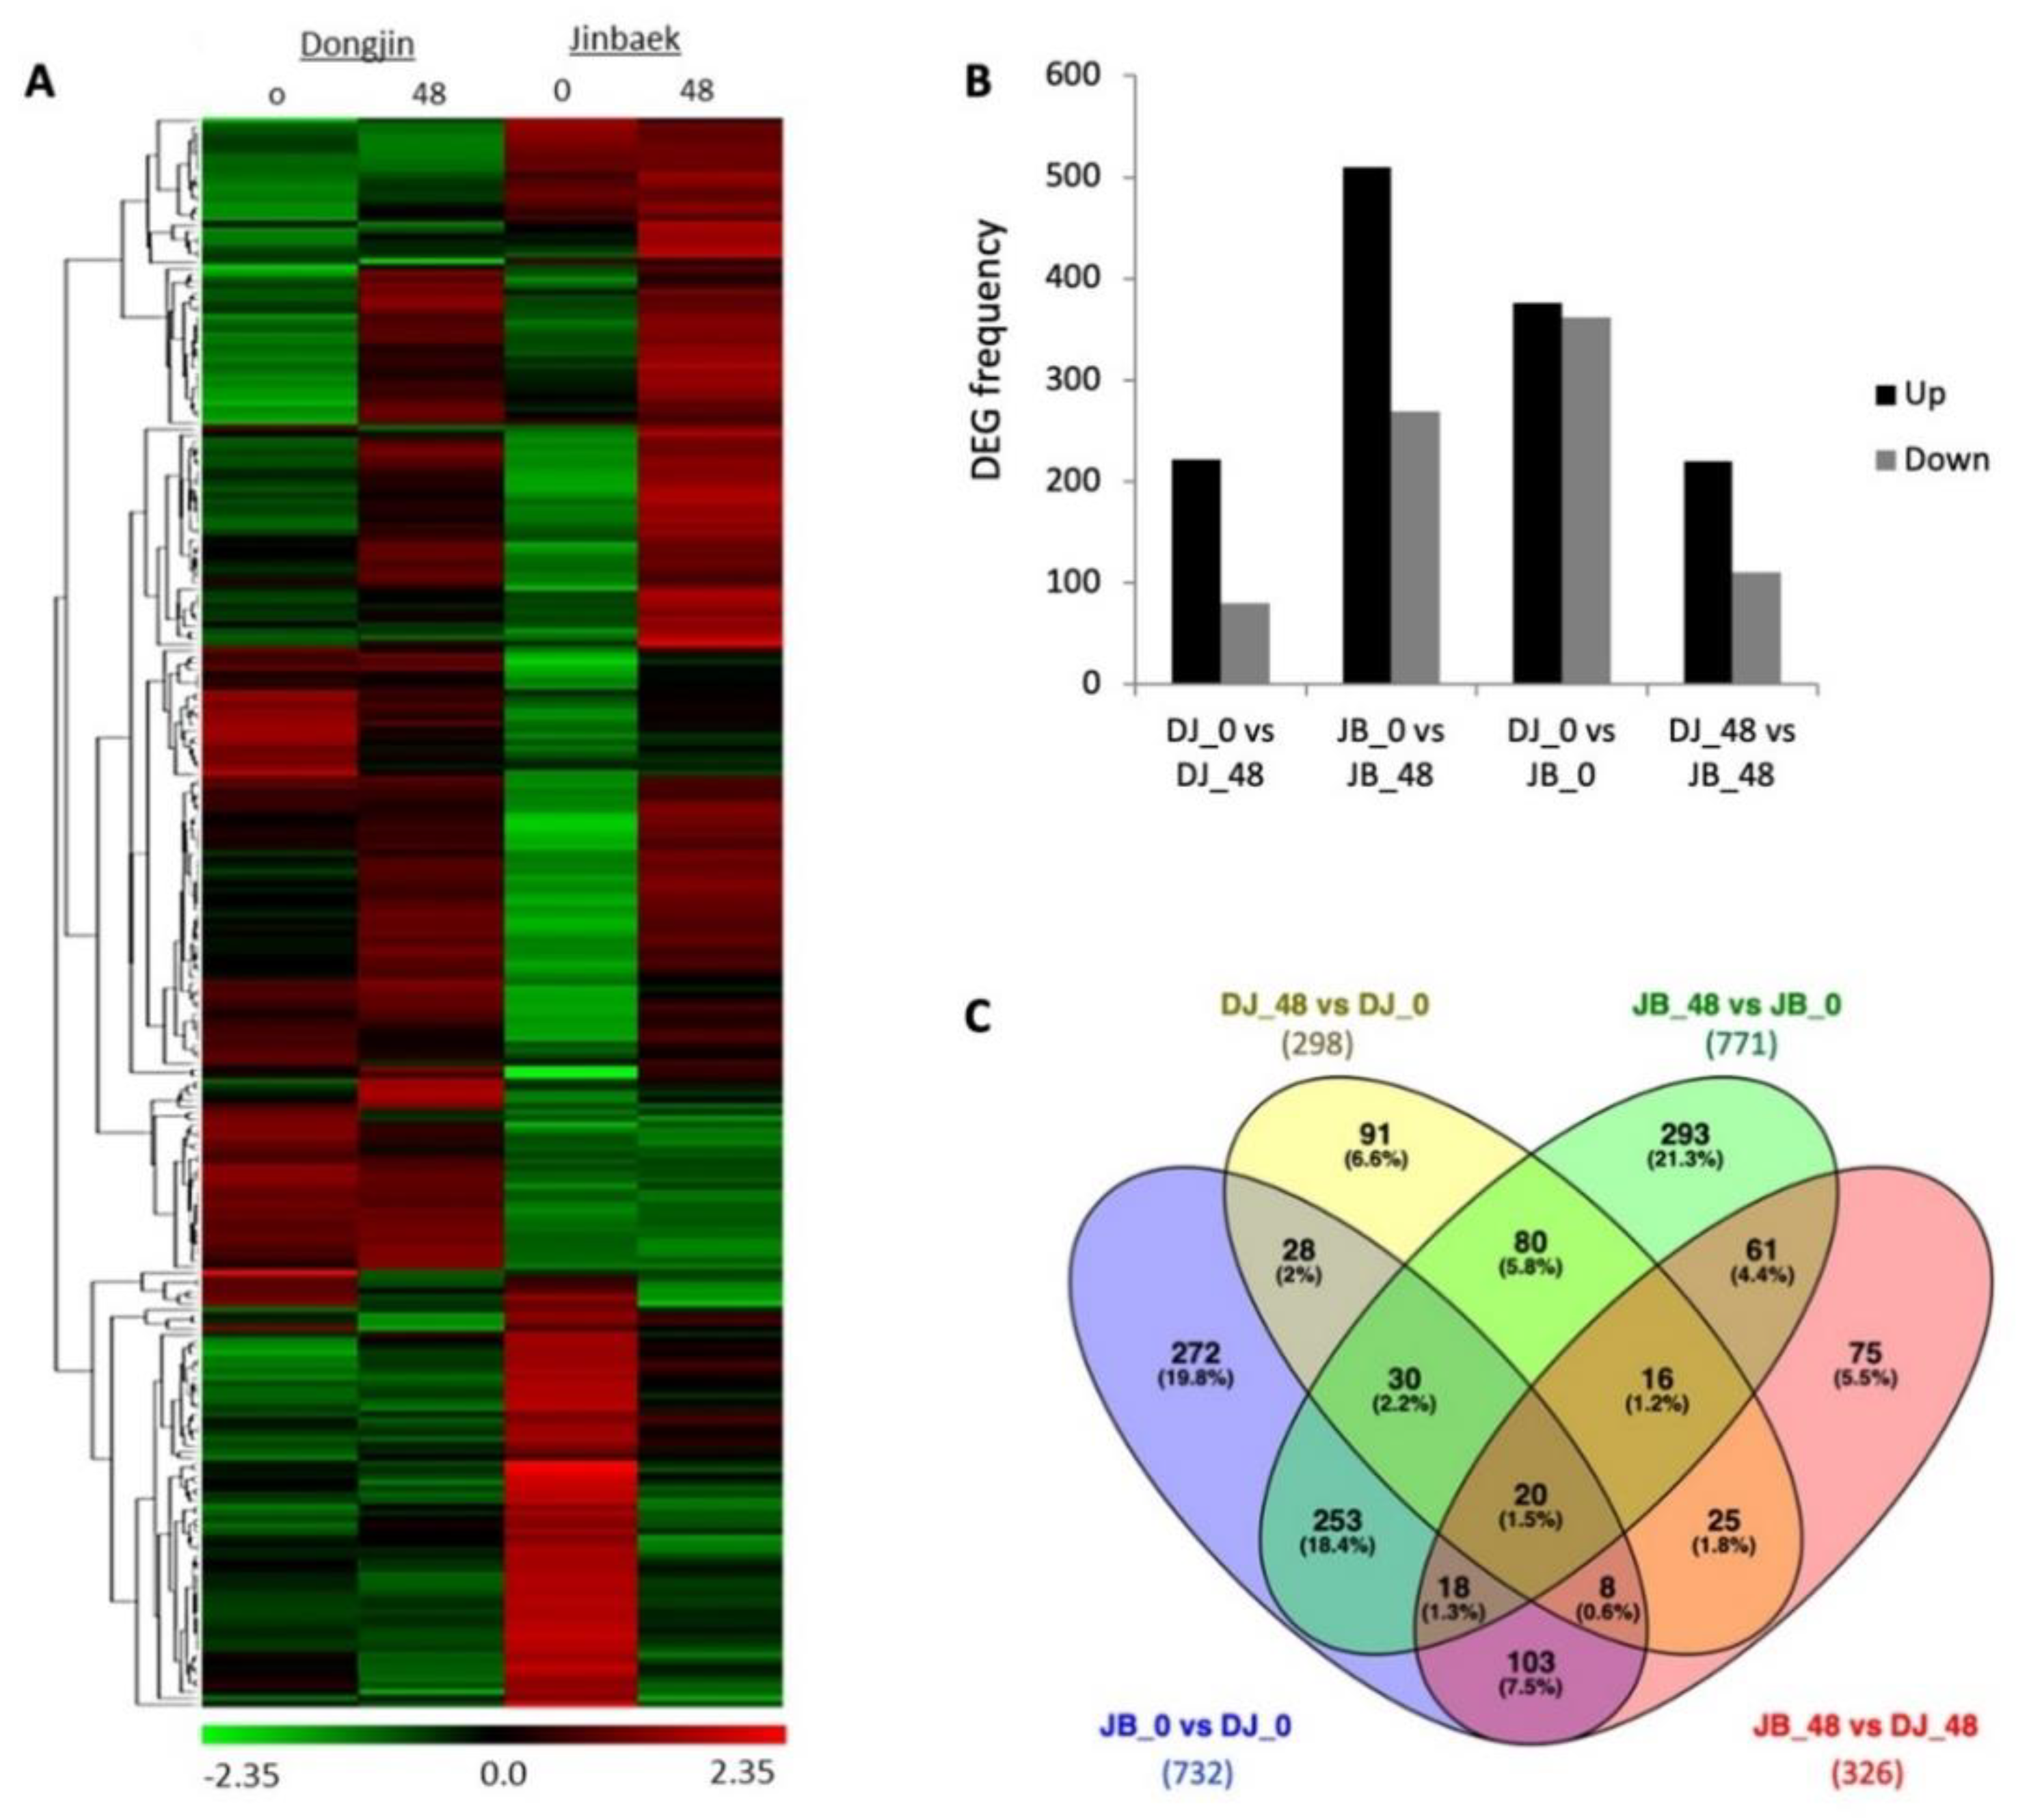
Genes with higher transcript abundance, depicted as red cells, were more abundant after challenged inoculation (48 hpi) in both genotypes (Figure 3A). Since DJ and JB have different parental background, a comparison of their expressions where DJ was used as control was employed to identify constitutively expressed genes and to account for genetic background effects on the expression of K2-responsive genes. With this, four pairwise group comparisons, including DJ_48 vs. DJ_0, JB_48 vs. JB_0, JB_0 vs. DJ_0, and JB_48 vs. DJ_48 were formed, which in total showed 1373 differentially expressed genes (DEGs). In DJ, 298 DEGs were identified, 218 of which were up-regulated, and 80 were down-regulated. The resistant cultivar JB had a total of 771 DEGs, which was about two times higher than those in DJ; 503 of which were up-regulated and 268 were down-regulated (Figure 3B). The Venn diagram showed 642 overlapping genes in at least two pairwise combinations (Figure 3C).
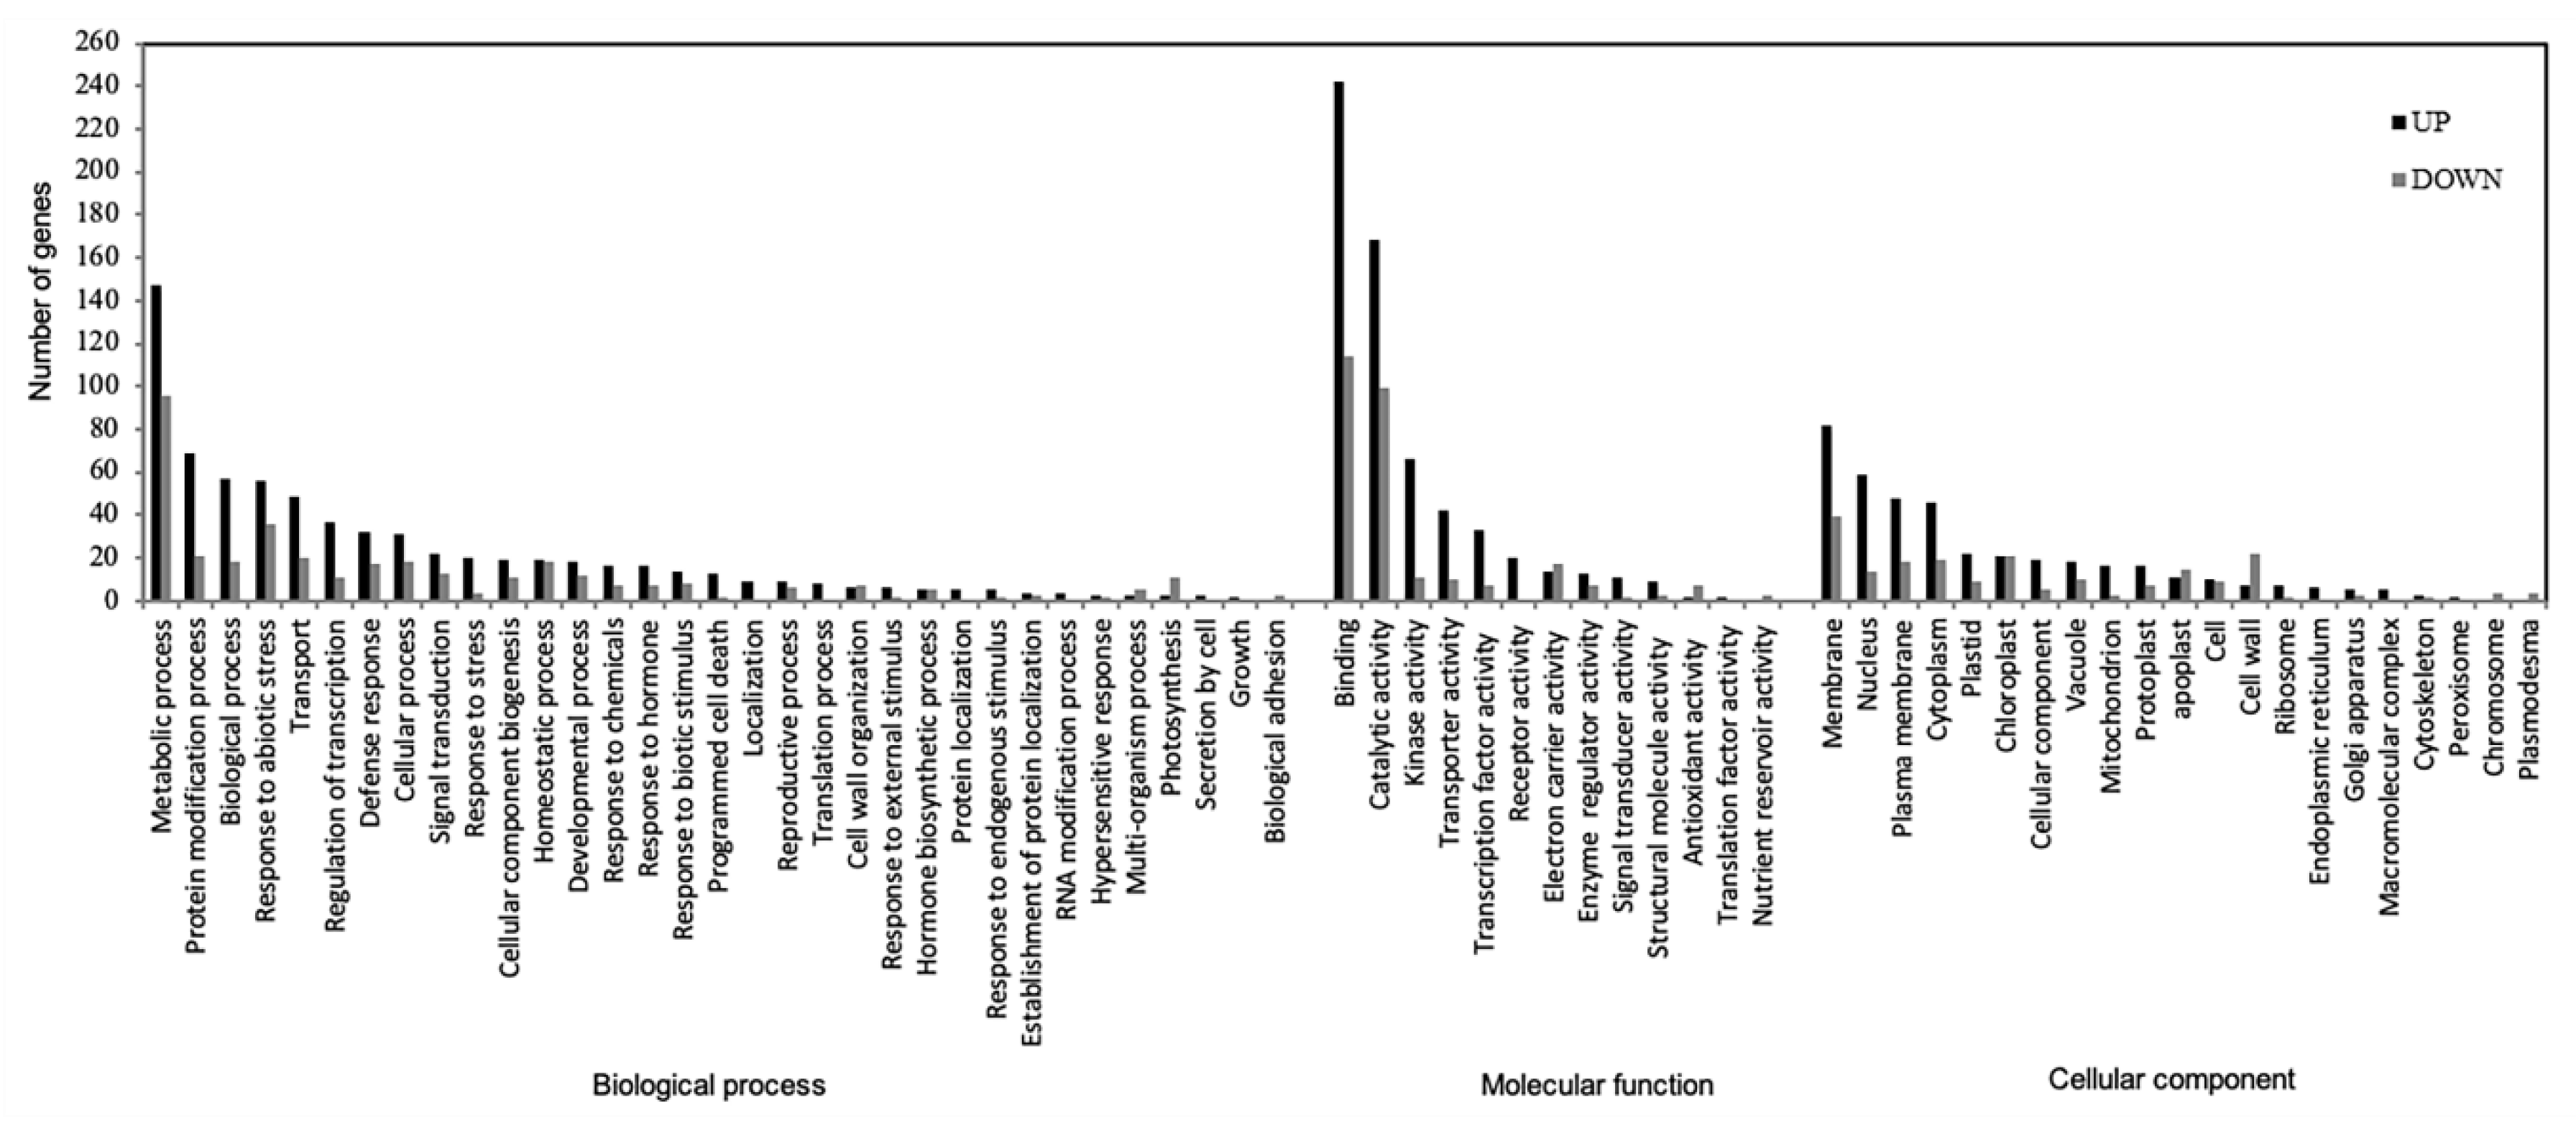
To identify the gene-linked annotation associated with the K2-induced genes, the gene list (DEGs identified in each genotype comparison) was uploaded to DAVID Functional Annotation Bioinformatics Microarray Analysis [23], and corresponding GO terms were obtained (Figure 4). A total of 39 terms were identified in the BP category with metabolic process, regulation of transcription, defense response, signal transduction, and programmed cell death as among the terms with the highest gene frequency. Overall, transcription factor activity was identified as the most enriched molecular function, an integral component of a membrane as the most over-represented cellular component, and response to the bacterium as the most important biological process (Table 1).
3.3. Essential Genes in Key Biological Processes
Cell-surface receptors are vital in perceiving molecular signatures of the invading pathogens. In this study, it was found that Jinbaek has a diverse surveillance system against the invading pathogen. A total of 12 genes with different domain including 3 LecRK (LOC_Os08g13420.1, LOC_Os07g04820.1, LOC_Os07g18230.1), 2 CRK (LOC_Os07g35004.1, LOC_Os09g16950.1), 2 LRR-RLK (LOC_Os11g36140.1, LOC_Os02g40180.1), 2 GPCR (LOC_Os06g09930.1, LOC_Os01g61970.1), RLK (LOC_Os10g17960.1), SERK2 (LOC_Os06g12120.1), and U-box 34 (LOC_Os06g37620.1) were identified only in in this cultivar.
Transcription factors (TFs) can reprogram large-scale gene regulation in response to environmental signals and pathogen attacks. Aside from 19 WRKYs upregulated in Jinbaek, three more TFs were noted, including the ZFP1 (LOC_Os03g32230.1), MADS-box 14 (LOC_Os12g25210.1), and HD13A (LOC_Os06320.1).
Moreover, the KEGG database provided an overview of the biochemical pathway of plant-pathogen interaction, the most enriched KEGG pathway (p-value ≤ 0.05) (Figure 5). A total of six genes were assigned in this pathway, five of which were involved in the PAMP-triggered immunity (PTI). LOC_Os02g03410.1, which encodes calcium-dependent protein kinase, was overexpressed in both genotypes after Xoo infection. This gene functions in hypersensitive response through the regulation of reactive oxygen species (ROS) production. Members of calmodulin family protein such as LOC_Os03g20370.1, which encodes calmodulin, LOC_Os01g04330.1 encoding calcium-binding protein CML16, and LOC_Os03g21380.1 encoding CML27, were shown to indirectly act towards the regulation of stomatal closure and cell wall reinforcement. CML16 and CML27 were constitutively expressed in both genotypes, whereas calmodulin was induced only in Jinbaek. Two proteins were found to antagonistically regulate defense response, including mitogen-activated protein kinase 5 (encoded by LOC_Os02g54600.1), which represses defense and WRKY transcription factor 33 (encoded by LOC_Os05g39720.1), which activates defense against infection. Interestingly, both were activated in Jinbaek only, suggesting crucial fine-tuning of these regulators for defense response.
3.4. Selection of DEGs for Cloning, Ectopic Expression, and Validation
To screen the overexpressed DEGs identified in the resistant genotype JB, the first 13 genes with the highest expression level obtained through microarray were selected for cloning. The expression patterns of these 13 selected DEGs when assayed using qRT-PCR conformed to the results of microarray (Table 2).
3.5. Generation of Overexpression Transgenic Plants
For identification of candidate genes conferring resistance against Xoo K2, the selected 13 DEGs were cloned and characterized through ectopic expression in rice. These genes include LOC_Os05g11320.1 encoding metallothionein-like protein 3B (referred to as MT3B); NM_001069356 (EXP1), LOC_Os08g26230.4 (EXP2), NM_001189913 (EXP3), and LOC_Os09g04310.1 (EXP4) which are all uncharacterized expressed protein; LOC_Os01g36294.1 (P450.1) and LOC_Os09g10340.1 (P450.2) which both encode cytochrome p450; LOC_Os06g38120.1 encoding low-affinity transporter (LCT); LOC_Os12g43380.1 encoding thaumatin (TLP); LOC_Os04g30250.3 encoding wall-associated receptor kinase-like (WAK5); AK062654 encoding cortical cell-delineating protein precursor (CCDP); LOC_Os11g02520.1 encoding WRKY104 transcription factor (WRKY104); and LOC_Os01g45640.1 encoding twin-arginine translocation pathway signal sequence (TAT). The insertion of each gene was confirmed by genomic PCR and qRT-PCR (data not shown). Using TaqMan qPCR, T0 lines carrying a single copy of gene insert (Table 3) were identified. Three lines for each transgenic were selected and established in the field for subsequent phenotypic analysis.
3.6. Spatio-Temporal Expression of K2-DEGs in Wild Type Rice
Figure 6 showed that MT3B is constitutively expressed in all tissues tested (root, stem, leaf sheath, leaf, flag leaf). Similarly, WRKY104 showed similar patterns except in roots. More intense bands were detected in the leaf sheaths, leaves, and flag leaf for EXP1 and TLP; leaves and flag leaf for P450.1 and P450.2; and stem and leaf sheaths for EXP3. Transcripts of EXP2, LCT, WAK5, CCDP, EXP4, and TAT were weakly or not expressed in all tissues tested. Expression patterns also varied in terms of growth stages, wherein MT3B, P450.1, and CCDP were expressed from germination up to the panicle initiation stage, while TAT was expressed from germination to maximum tillering. The rest of the genes showed developmentally regulated expression.
Overall, tissue and stage-specific differences in background expression of majority of these genes implied differences in the regulatory network, and employing them for overexpression studies is an essential strategy for connecting each of them to biological pathways.
3.7. Exogenous Application of SA and JA Induces mRNA Expression of K2-DEGs
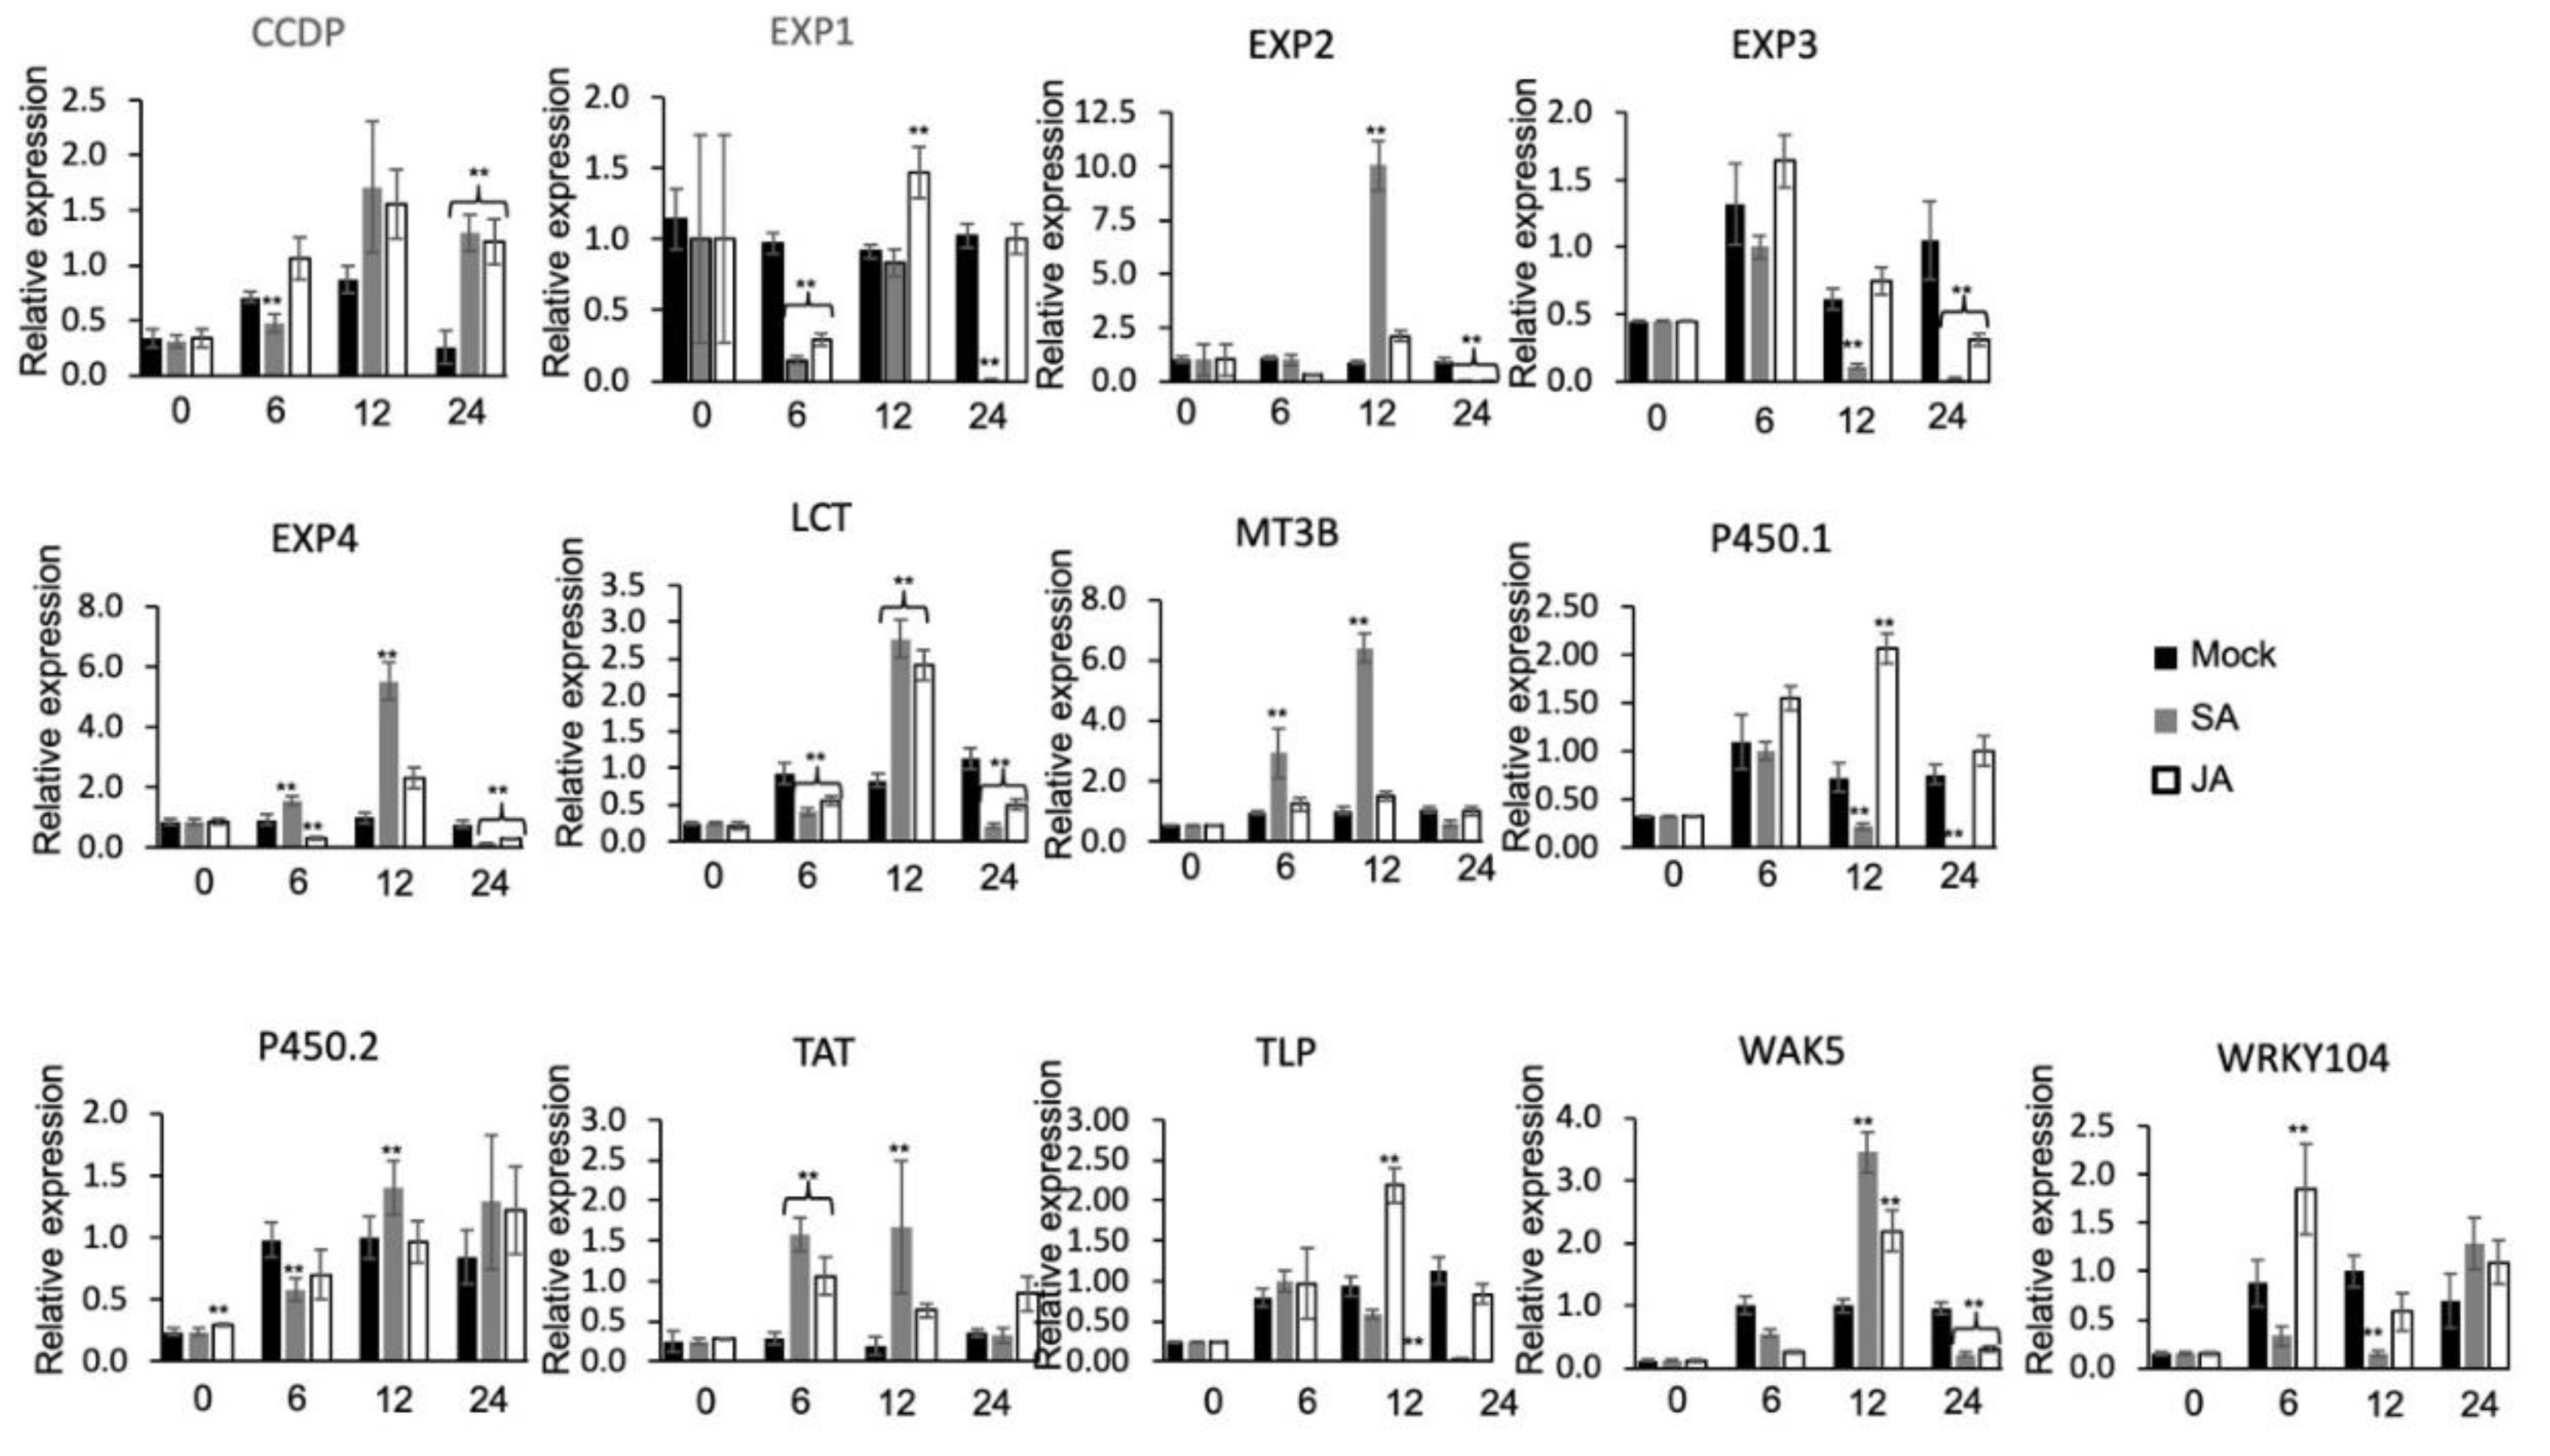
The plant hormones, salicylic acid (SA) and jasmonic acid (JA) play important function in activating defense response in plants against pathogen infection. To determine whether expressions of the 13 selected DEGs are affected by these two phytohormones, qPCR assay was carried out. Results revealed that expression of 13 DEGs after SA and JA treatment varied in all-time points with the peak values mostly noted at 12 hpi (Figure 7). Induction levels were generally higher in SA than in JA-treated plants. The highest induced transcripts level observed after SA treatment was EXP2, followed by MT3B, EXP4, WAK5, LCT, and TAT. In JA treatment, TLP, WAK5, LCT, and P450.1 showed significantly higher relative expression than mock. This implicates the probable involvement of these genes in SA and JA signal transduction pathways. Induced expression by both phytohormones further implies possible SA and JA signaling crosstalk involving regulation of some of the DEGs. However, expression of EXP1, TLP, and WRKY105 was either unaffected by SA treatment, and the same condition was observed in MT3B, EXP2, P450.2, and EXP4 after JA treatment, while EXP3 was unaffected by both treatments, which may indicate the involvement of other signaling pathways.
3.8. Overexpression of Xoo K2-Induced DEGs Delayed Bacterial Blight Disease Progress
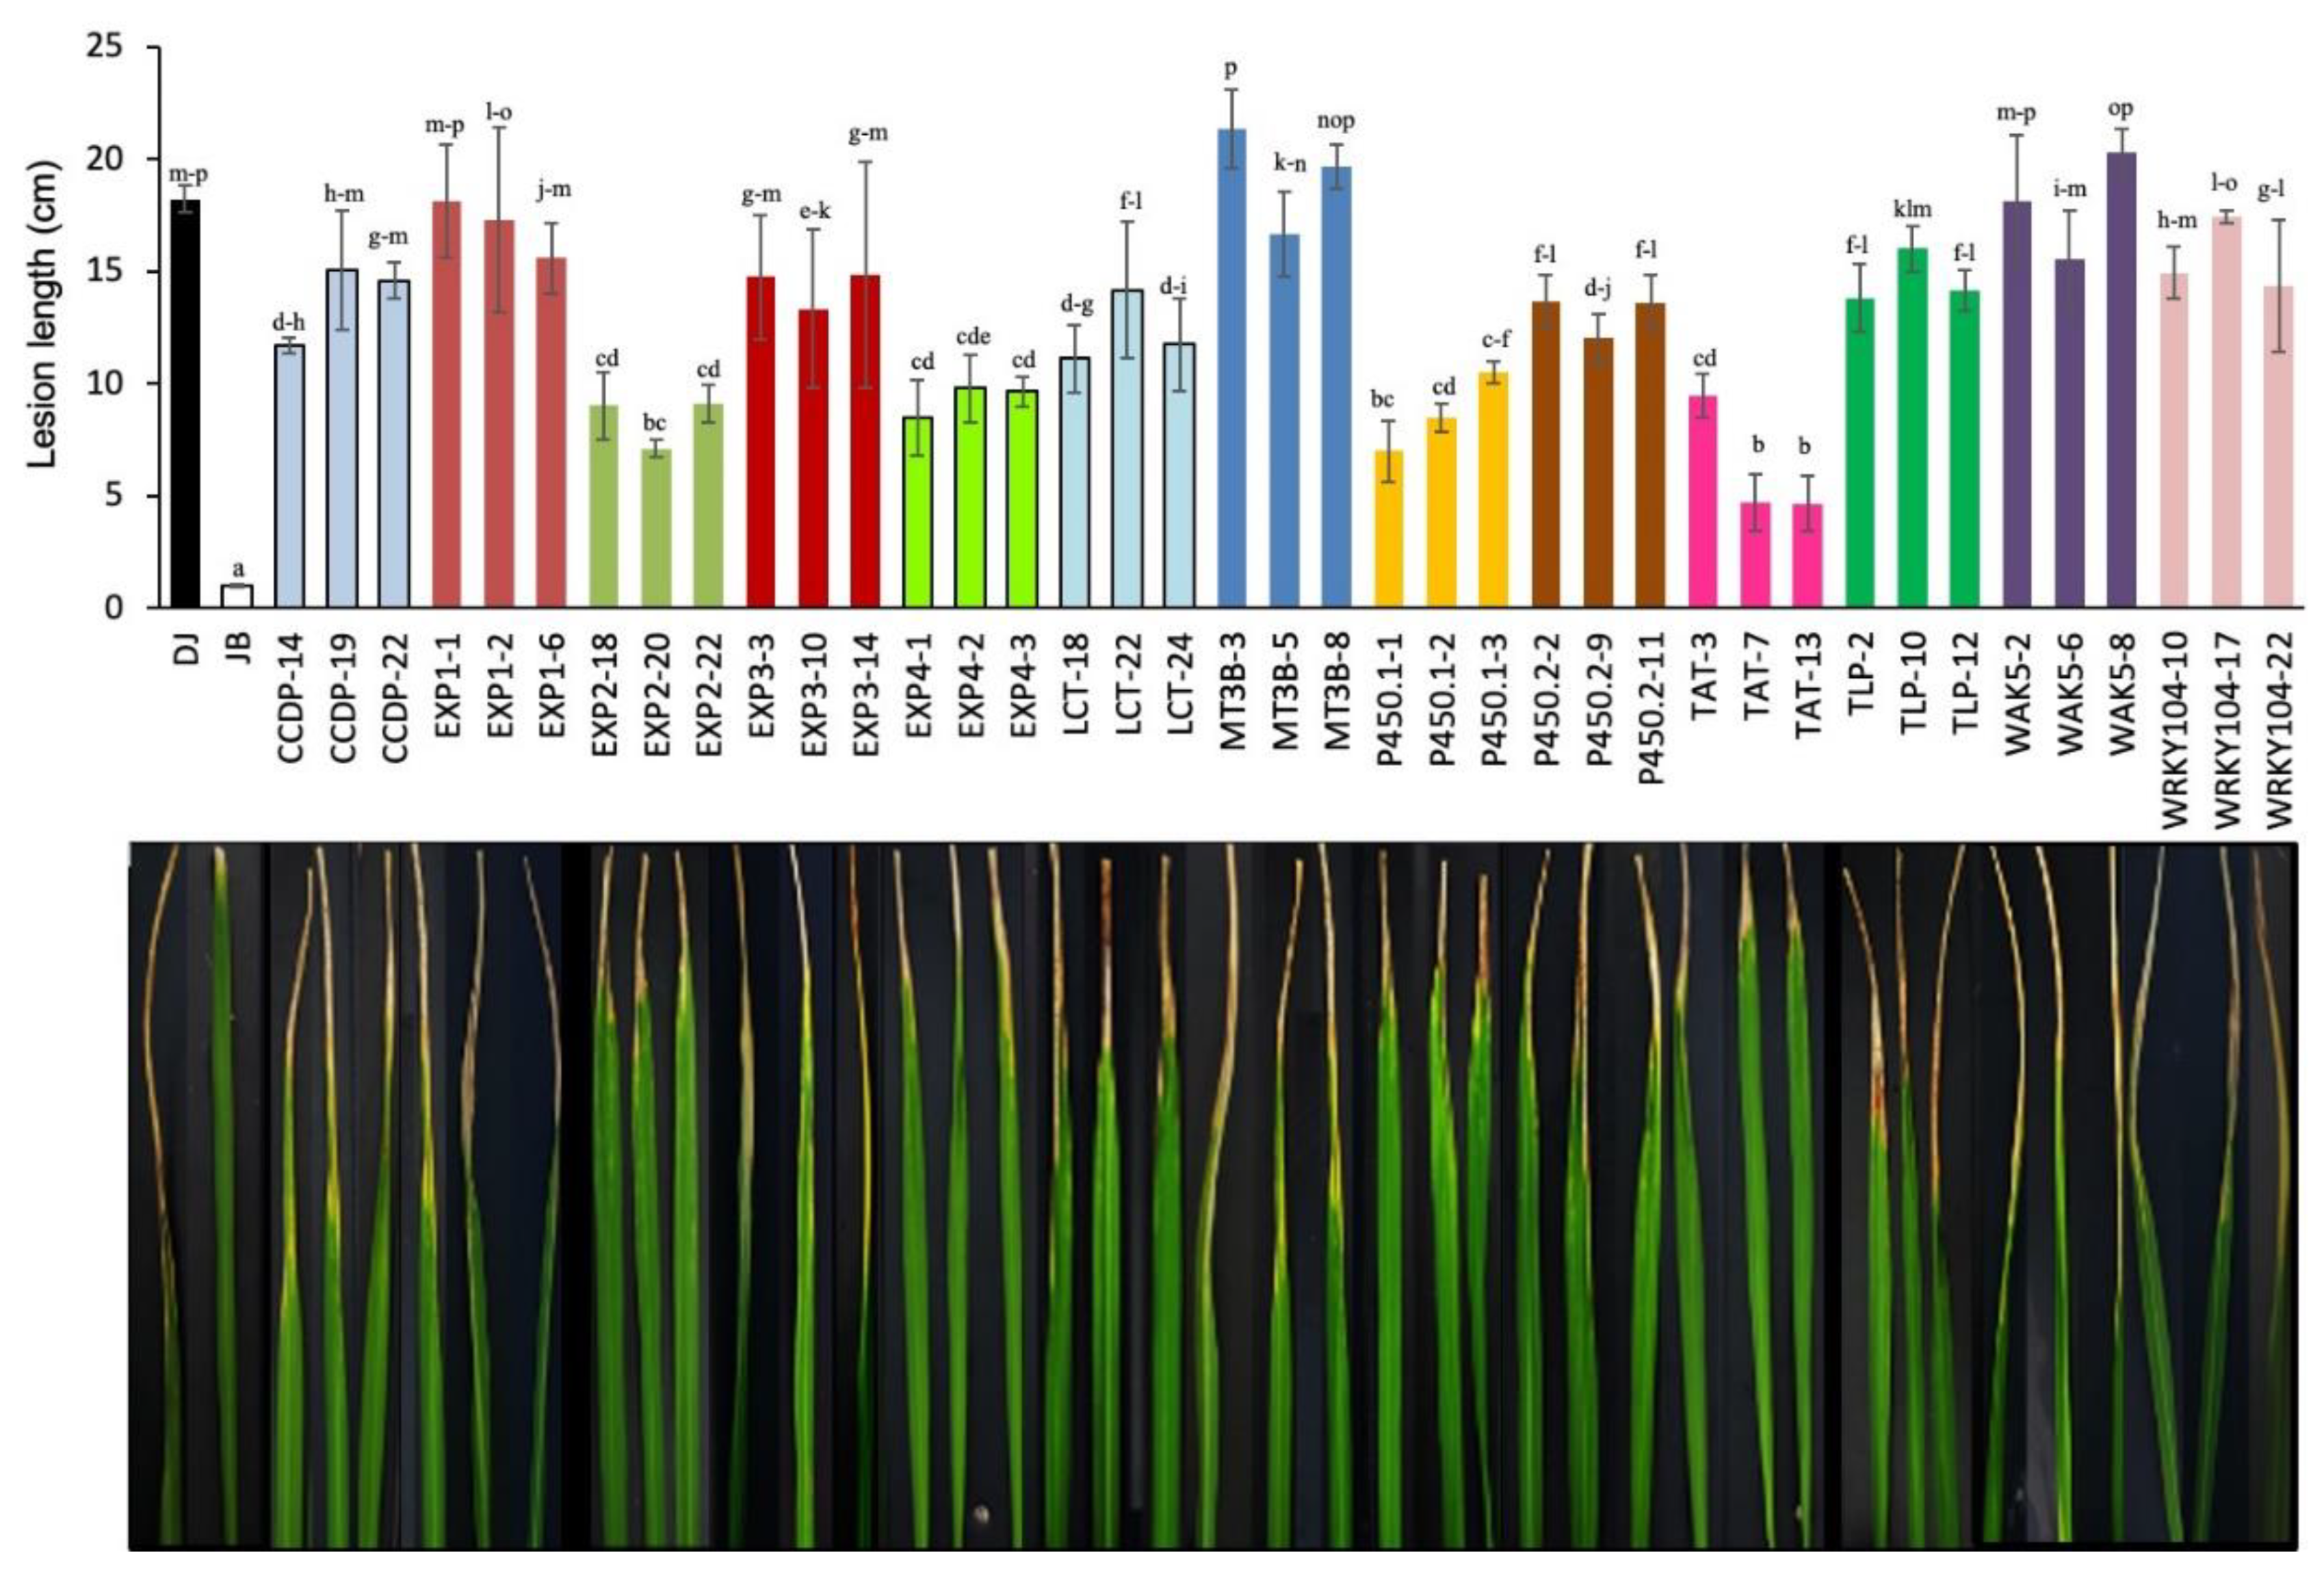
Inoculated leaves started to exhibit brown-discoloration and wilting at four dpi, which marked the onset of bacterial blight disease. To account for disease development among different transgenic plants, the lesion area was measured at 16 dpi (Figure 8). Employing the SES disease rating scale, at 16 dpi, transgenic plants were categorized into four groups with all lines of MT3B, EXP1, WAK5, lines CCDP-19 and WRKY104-17 showing high susceptibility (15.07–21.33 cm), while all lines of LCT, TLP, EXP3, P450.2, and two lines each for CCDP and WRKY104 were moderate susceptible (10.1–15.0 cm). Interestingly, all lines of EXP2, EXP4, and lines P450.1-23, P450.1-24, and TAT-3 exhibited moderate resistance (6.97–9.77 cm), while lines TAT-7 (4.63 cm) and TAT-13 (4.67 cm) showed resistant reaction to infection.
4. Discussion
Microarray technology has been instrumental in studying and understanding important cellular processes in several crops and model species. In this study, a higher DEG frequency accounted in resistant cultivar Jinbaek implies bigger and more complex regulatory gene networks employed during an incompatible interaction with the pathogen. The ability to perceive environmental and microbial cues and transmit them downstream is an integral feature of hosts to evade potential hijacking of its immune system. This role is taken by cell-surface receptors, mostly by receptor-like kinases (RLKs), which sense signals through their amino-terminal extracellular ligand recognition domains and transduce the message via their carboxyl-terminal cytoplasmic kinase domains [27]. Resistance in Jinbaek is ascribed to a diverse surveillance system as 12 of the 16 receptor proteins identified were up-regulated only in this cultivar. Most of them were RLKs containing different extracellular domains such as LRR-RLK, CRK, LecRK, U-box, and GPR. Some related members have been implicated in inducing PTI such as FLAGELLIN SENSITIVE 2 (FLS2), an RLK with an LRR domain involved in the perception of the bacterial elicitor flg22 [28,29]; LecRK, which contains lectin protein known to bind and hence provide defense response to fungal and bacterial cell wall components [27]; and U-Box protein CMPG1, which activates defense mechanisms triggered by multiple resistance genes in tobacco and tomato [30]. Another system by which signals are transmitted to the nucleus is through GTP binding proteins [31]. The current analysis identified two G PROTEIN-COUPLED RECEPTORS, 1 and 107 (GPCR1/107), which were induced by Xoo K2 infection exclusively in Jinbaek.
Signals are also transmitted downstream through changes in ionic characteristics of the cells, such as drastic elevation of Ca2+ concentration detected during an incompatible interaction between Pseudomonas syringae pv. tomato (containing avrRpm1) and RPM1 in Arabidopsis, which resulted in ETI [32]. It has been known that regulation of calcium signaling in cells is achieved by the calcium-binding proteins, including but not limited to Calcineurin B-like (CBL) protein, which then activates CBL-interacting protein kinases (CIPKs) that phosphorylate downstream components to transduce Ca2+ signals [33,34]. In the current study, four CIPKs were identified in Jinbaek. Although, OsCIPK15 was reported to play an important role in PTI as it induced defense-related gene expression, phytoalexin biosynthesis, and hypersensitive cell death [35], this calcium sensor, along with stomatal closure-regulator OsCIPK18 [36], however, were repressed in Jinbaek. The OsCIPK5, which was recently shown to be targeted and inactivated by RICE GRASSY STUNT VIRUS (RGSV) p5 to evade Ca2+ signaling in rice [37], was also down-regulated in both genotypes. Interestingly, CIPK21, which was implicated in mediating responses to osmotic and salt stress through regulation of ion and water homeostasis across the vacuolar membranes [34], was highly up-regulated, suggesting a possible involvement of this pathway in the incompatible interaction of Xoo race K2 and Jinbaek. In addition, another type of signal transducer protein identified in our microarray was phosphoprotein phosphatase 2A (PP2A). This protein has been reported as a crucial component controlling pathogenesis responses in plants [38].
Signals that reached the nucleus are manifested through changes in the activity of transcription factors that interact and modulate the regulatory regions of genes [31]. The primary resistance regulatory gene network in Jinbaek is possibly attributed to the extensive involvement of TFs. This is evident in the resistant cultivar, which possessed multiple TFs in eight different families, a majority of which were highly up-regulated. WRKY family member proteins, being mainly implicated to participate in plant biotic stress response [39], were found in large numbers in Jinbaek; hence this group of proteins may play pivotal roles in the induction of immunity in this cultivar. In particular, OsWRKY62, a transcriptional repressor regulated downstream of OsWRKY45, a central TF of SA signaling pathway in rice, positively regulates defense genes against blast and leaf blight disease by activating diterpenoid phytoalexin biosynthetic genes and their transcriptional regulator DPF [40].
Moreover, OsWRKY71 positively regulates OsNPR1 and OsPR1b, the marker genes in the defense signaling pathway, resulting in enhanced resistance to virulent Xoo 13,751 [39]. However, the induction of two JAZ proteins by Xoo in ‘Jinbaek’ makes the involvement of JA defense signaling also plausible, although this is very interesting since JA is required for resistance against necrotrophic pathogens and works antagonistically with SA [41]. This suggests that there could be an interplay between phytohormones, particularly SA and JA, in the regulation of cascades of genes in the downstream network.
To discover genes that are essential in conferring resistance to Xoo race K2, 13 most highly overexpressed DEGs that were induced by Xoo K2 were cloned for characterization through ectopic expression in rice. Pathogenicity test with Xoo K2 revealed that none of the overexpression plants exhibited strong resistance comparable to Jinbaek. However, some of the genes delayed the disease progress resulting in a significantly lower lesion area compared with the wild-type Dongjin at 16 dpi. Proteins such as TAT pathway signal (LOC_Os01g45640.1), cytochrome p450 (LOC_Os01g36294.1, and two uncharacterized proteins (LOC_Os08g26230.4, LOC_Os09g04310.1) attenuated the virulence of Xoo race K2 in transgenic rice. Cytochrome P450s have been implicated in the synthesis of plant defense compounds, including DIMBOA [42] and antimicrobial triterpenes [43]. However, no studies linking TAT and the two expressed proteins to the regulation of immunity in plants have been reported so far. The search for details on how these genes contributed to the slowing down of disease development provides exciting future directions of the study.
Supplementary Materials
The following are available online at https://www.mdpi.com/2073-4395/10/7/960/s1, Table S1: qPCR primers used to assay selected K2-induced DEGs identified by microarray, Table S2: Primers designed to clone selected K2-induced DEGs in rice.
Author Contributions
Y.-G.C. conceived and designed research. M.C.N. conducted experiments. M.C.N. and Y.-G.C. analyzed data. M.C.N. and Y.-G.C. wrote the manuscript. All authors read and approved the manuscript.
Funding
This research was funded by the Next-Generation BioGreen 21 Program (Plant Molecular Breeding Center, No. PJ01320701), Rural Development Administration, Republic of Korea.
Conflicts of Interest
The authors declare no conflict of interest.
References
- Rajarajeswari, N.V.L.; Muralidharan, K. Assessments of farm yield and district production loss from bacterial leaf blight epidemics in rice. Crop Prot. 2006, 25, 244–252. [Google Scholar] [CrossRef]
- Kumar, A.; Guha, A.; Bimolata, W.; Reddy, A.R.; Laha, G.S.; Pandey, M.K.; Ghazi, I.A. Leaf gas exchange physiology in rice genotypes infected with bacterial blight: An attempt to link photosynthesis with disease severity and rice yield. AJCS 2013, 7, 32–39. [Google Scholar]
- Khan, M.A.; Naeem, M.; Iqbal, M. Breeding approaches for bacterial leaf blight resistance in rice (Oryza sativa L.), current status and future directions. Eur. J. Plant Pathol. 2014, 139, 27–37. [Google Scholar] [CrossRef]
- Zhang, F.; Zhuo, D.-L.; Zhang, F.; Huang, L.-Y.; Wang, W.-S.; Xu, J.-L.; Vera Cruz, C.; Li, Z.-K.; Zhou, Y.-L. Xa39, a novel dominant gene conferring broad-spectrum resistance to Xanthomonas oryzae pv. oryzae in rice. Plant Pathol. 2015, 64, 568–575. [Google Scholar] [CrossRef]
- Dossa, G.S.; Sparks, A.; Cruz, C.V.; Oliva, R. Decision tools for bacterial blight resistance gene deployment in rice-based agricultural ecosystems. Front. Plant Sci. 2015, 6, 305. [Google Scholar] [CrossRef] [Green Version]
- Huang, N.; Angeles, E.R.; Domingo, J.; Magpantay, G.; Singh, S.; Zhang, G.; Kumaravadivel, N.; Bennett, J.; Khush, G.S. Pyramiding of bacterial blight resistance genes in rice: Marker-assisted selection using RFLP and PCR. Theory Appl. Genet 1997, 95, 313–320. [Google Scholar] [CrossRef]
- Mew, T.W.; Vera Cruz, C.M.; Medella, E.S. Change in race frequency of Xanthomonas oryzae pv. oryzae in response to the planting of rice cultivars in the Philippines. Plant Dis. 1992, 76, 1029–1032. [Google Scholar] [CrossRef]
- Jeung, J.U.; Heu, S.G.; Shin, M.S.; Vera Cruz, C.M.; Jena, K.K. Dynamics of Xanthomonas oryzae pv. oryzae Populations in Korea and Their Relationship to Known Bacterial Blight Resistance Genes. Phytopathology 2006, 96, 867–875. [Google Scholar] [CrossRef] [PubMed] [Green Version]
- Noh, T.H.; Lee, D.K.; Kang, M.H.; Shin, M.S.; Na, S.Y. Identification of new race of Xanthomonas oryzae pv. oryzae (Xoo) in Korea. (Abstr.). Phytopathology 2003, 93, S66. [Google Scholar]
- Kim, K.Y.; Shin, M.S.; Kim, W.J.; Mo, Y.J.; Nam, J.K.; Noh, T.H.; Kim, B.K.; Ko, J.K. Effective combination of resistance genes against rice bacterial blight pathogen. Korean J. Breed Sci. 2009, 41, 244–251. [Google Scholar]
- Suh, J.-P.; Jeung, J.-U.; Noh, T.-H.; Cho, Y.-C.; Park, S.-H.; Park, H.-S.; Shin, M.-S.; Kim, C.-K.; Jena, K.K. Development of breeding lines with three pyramided resistance genes that confer broad-spectrum bacterial blight resistance and their molecular analysis in rice. Rice 2013, 6, 5. [Google Scholar] [CrossRef] [PubMed] [Green Version]
- Lee, B.-M. The genome sequence of Xanthomonas oryzae pathovar oryzae KACC10331, the bacterial blight pathogen of rice. Nucleic Acids Res. 2005, 33, 577–586. [Google Scholar] [CrossRef] [PubMed] [Green Version]
- Iyer-Pascuzzi, A.S.; McCouch, S.R. Recessive Resistance Genes and the Oryza sativa-Xanthomonas oryzae pv. oryzae Pathosystem. MPMI 2007, 20, 731–739. [Google Scholar] [CrossRef] [PubMed]
- Narsai, R.; Wang, C.; Chen, J.; Wu, J.; Shou, H.; Whelan, J. Antagonistic, overlapping and distinct responses to biotic stress in rice (Oryza sativa) and interactions with abiotic stress. BMC Genom. 2013, 14, 93. [Google Scholar] [CrossRef] [PubMed] [Green Version]
- Tang, D.; Wang, G.; Zhou, J.M. Receptor Kinases in Plant-Pathogen Interactions: More Than Pattern Recognition. Plant Cell 2017, 29, 618–637. [Google Scholar] [CrossRef] [PubMed] [Green Version]
- Hulbert, S.H.; Webb, C.A.; Smith, S.M.; Sun, Q. Resistance gene complexes: Evolution and utilization. Annu. Rev. Phytopathol. 2001, 39, 285–312. [Google Scholar] [CrossRef]
- Mittler, R.; Blumwald, E. Genetic Engineering for Modern Agriculture: Challenges and Perspectives. Annu. Rev. Plant Biol. 2010, 61, 443–462. [Google Scholar] [CrossRef] [Green Version]
- Stoughton, R.B. Applications of DNA microarrays in biology. Annu. Rev. Biochem. 2005, 74, 53–82. [Google Scholar] [CrossRef] [Green Version]
- Glazebrook, J. Use of Microarray Analysis to Dissect the Plant Defense Response. In Plant-Pathogen Interactions; Humana Press: Totowa, NJ, USA, 2006; Volume 354, pp. 121–130. ISBN 978-1-59259-966-0. [Google Scholar]
- Kikuchi, S. Collection, Mapping, and Annotation of over 28,000 cDNA Clones from japonica Rice. Science 2003, 301, 376–379. [Google Scholar] [CrossRef]
- Lu, W.; Pan, L.; Zhao, H.; Jia, Y.; Wang, Y.; Yu, X.; Wang, X. Molecular detection of Xanthomonas oryzae pv. oryzae, Xanthomonas oryzae pv. oryzicola, and Burkholderia glumae in infected rice seeds and leaves. Crop J. 2014, 2, 398–406. [Google Scholar] [CrossRef] [Green Version]
- Kim, M.S.; Ouk, S.; Jung, K.H.; Song, Y.H.; Trang, L.V.; Yang, J.Y.; Cho, Y.G. Breeding hybrid rice with genes resistant to diseases and insects using marker-assisted selection and evaluation of biological assay. Plant Breed. Biotech. 2019, 7, 272–286. [Google Scholar] [CrossRef]
- Huang, D.W.; Sherman, B.T.; Lempicki, R.A. Systematic and integrative analysis of large gene lists using DAVID bioinformatics resources. Nat. Protoc. 2009, 4, 44–57. [Google Scholar] [CrossRef]
- Lee, H.J.; Abdula, S.E.; Jee, M.G.; Jang, D.W.; Cho, Y.G. High-efficiency and Rapid Agrobacterium-mediated genetic transformation method using germinating rice seeds. J. Plant Biotechnol. 2011, 38, 251–257. [Google Scholar] [CrossRef]
- Kauffman, H.; Reddy, A.; Hsieh, S.; Merca, S. Improved technique for evaluating resistance of rice varieties to Xanthomonas oryzae. Plant Dis. Rep. 1973, 57, 537–541. [Google Scholar]
- IRRI. Standard Evaluation System for Rice, 4th ed.; International Rice Testing Program (IRRI): Manila, Philippines, 1996; 52p. [Google Scholar]
- Vaid, N.; Macovei, A.; Tuteja, N. Knights in Action: Lectin Receptor-Like Kinases in Plant Development and Stress Responses. Mol. Plant 2013, 6, 1405–1418. [Google Scholar] [CrossRef] [Green Version]
- Gómez-Gómez, L.; Boller, T. Flagellin perception: A paradigm for innate immunity. Trends Plant Sci. 2002, 7, 251–256. [Google Scholar]
- Goff, K.E.; Ramonell, K.M. The Role and Regulation of Receptor-Like Kinases in Plant Defense. Gene Regul. Syst. Bio. 2007, 1, 117762500700100. [Google Scholar] [CrossRef] [Green Version]
- González-Lamothe, R.; Tsitsigiannis, D.I.; Ludwig, A.A.; Panicot, M.; Shirasu, K.; Jones, J.D.G. The U-Box Protein CMPG1 Is Required for Efficient Activation of Defense Mechanisms Triggered by Multiple Resistance Genes in Tobacco and Tomato. Plant Cell 2006, 18, 1067–1083. [Google Scholar] [CrossRef] [Green Version]
- Mulligan, R.M.; Chory, J.; Ecker, J.R. Signaling in plants. Proc. Natl. Acad. Sci. USA. 1997, 94, 2793–2795. [Google Scholar] [CrossRef] [PubMed] [Green Version]
- Grant, M.; Brown, I.; Adams, S.; Knight, M.; Ainslie, A.; Mans, J. The RPM1 plant disease resistance gene facilitates a rapid and sustained increase in cytosolic calcium that is necessary for the oxidative burst and hypersensitive cell death. Plant J. 2000, 10. [Google Scholar] [CrossRef]
- Liu, J.; Ishitani, M.; Halfter, U.; Kim, C.-S.; Zhu, J.-K. The Arabidopsis thaliana SOS2 gene encodes a protein kinase that is required for salt tolerance. Plant Biol. 2000, 97, 3730–3734. [Google Scholar] [CrossRef]
- Pandey, G.K.; Kanwar, P.; Singh, A.; Steinhorst, L.; Pandey, A.; Yadav, A.K.; Tokas, I.; Sanyal, S.K.; Kim, B.-G.; Lee, S.-C.; et al. Calcineurin B-Like Protein-Interacting Protein Kinase CIPK21 Regulates Osmotic and Salt Stress Responses in Arabidopsis. Plant Physiol. 2015, 169, 780–792. [Google Scholar] [CrossRef] [PubMed] [Green Version]
- Kurusu, T.; Hamada, J.; Hamada, H.; Hanamata, S.; Kuchitsu, K. Roles of calcineurin B-like protein-interacting protein kinases in innate immunity in rice. Plant Signal. Behav. 2010, 5, 1045–1047. [Google Scholar] [CrossRef] [PubMed] [Green Version]
- Cheng, M.-C.; Liao, P.-M.; Kuo, W.-W.; Lin, T.-P. The Arabidopsis ETHYLENE RESPONSE FACTOR1 Regulates Abiotic Stress-Responsive Gene Expression by Binding to Different cis-Acting Elements in Response to Different Stress Signals. Plant Physiol. 2013, 162, 1566–1582. [Google Scholar] [CrossRef] [PubMed] [Green Version]
- Xiong, L.; Yang, Y. Disease Resistance and Abiotic Stress Tolerance in Rice Are Inversely Modulated by an Abscisic Acid–Inducible Mitogen-Activated Protein Kinase. Plant Cell 2003, 15, 745–759. [Google Scholar] [CrossRef] [Green Version]
- Durian, G.; Rahikainen, M.; Alegre, S.; Brosché, M.; Kangasjärvi, S. Protein Phosphatase 2A in the Regulatory Network Underlying Biotic Stress Resistance in Plants. Front. Plant Sci. 2016, 7. [Google Scholar] [CrossRef] [PubMed] [Green Version]
- Liu, X.; Bai, X.; Wang, X.; Chu, C. OsWRKY71, a rice transcription factor, is involved in rice defense response. J. Plant Physiol. 2007, 164, 969–979. [Google Scholar] [CrossRef]
- Fukushima, S.; Mori, M.; Sugano, S.; Takatsuji, H. Transcription Factor WRKY62 Plays a Role in Pathogen Defense and Hypoxia-Responsive Gene Expression in Rice. Plant Cell Physiol 2016, 57, 2541–2551. [Google Scholar] [CrossRef] [Green Version]
- Rahman, T.A.E.; Oirdi, M.E.; Gonzalez-Lamothe, R.; Bouarab, K. Necrotrophic Pathogens Use the Salicylic Acid Signaling Pathway to Promote Disease Development in Tomato. MPMI 2012, 25, 1584–1593. [Google Scholar] [CrossRef] [Green Version]
- Niemeyer, H.M. Hydroxamic acids (4-hydroxy-1,4- benzoxazin-3-ones), defense chemicals in the gramineae. Phytochemistry. 1988, 27, 3349–3358. [Google Scholar] [CrossRef]
- Geisler, K.; Hughes, R.K.; Sainsbury, F.; Lomonossoff, G.P.; Rejzek, M.; Fairhurst, S.; Olsen, C.-E.; Motawia, M.S.; Melton, R.E.; Hemmings, A.M.; et al. Biochemical analysis of a multifunctional cytochrome P450 (CYP51) enzyme required for synthesis of antimicrobial triterpenes in plants. Proc. Natl. Acad. Sci. USA 2013, 110, E3360–E3367. [Google Scholar] [CrossRef] [PubMed] [Green Version]
Figure 1.
Phenotypic reaction of Dongjin (DJ) and Jinbaek (JB) to X. oryzae pv. oryzae race K2 inoculation. (A) The phenotype of two genotypes infected with Xoo at 14 dpi. (B) Average lesion length of blight symptoms measured in cm taken at 14 dpi. Data presented are treatment means ± SD. (C) Genomic PCR detection of putative glycosyltransferase (AF169030.1; 420 bp), which indicates the presence of Xoo, in the rice leaf tissue of DJ and JB 5 dpi. Band indicates the presence of Xoo; no band means absence of Xoo.

Figure 2.
Workflow involved in cDNA microarray data analysis.

Figure 3.
Expression analysis of differentially expressed genes (DEGs) in response to X. oryzae pv. oryzae race K2 interaction. (A) Heat-map showing the expression patterns of all differentially expressed genes in four libraries. From left to right, the four columns respectively show the expression of genes in the non-inoculated Dongjin (DJ; susceptible type), inoculated DJ, non-inoculated Jinbaek (JB; resistant type), and inoculated JB. Green, black, and red respectively indicates low, no change, and high expression levels of genes. (B) The number of DEGs in treated JB (JB_48 vs. JB_0), treated DJ (DJ_48 vs. DJ_0), and a combination of both. Dark bar represents up-regulated; gray bar represents down-regulated DEGs. (C) Venn diagram showing the number of genotype-specific (unique) genes and overlapping genes.

Figure 4.
GO term classification of overlapping DEGs categorized into three main groups, including Biological process, Molecular function, and Cellular component. Dark bar represents up-regulation; gray bar represents down-regulation.
Figure 4.
GO term classification of overlapping DEGs categorized into three main groups, including Biological process, Molecular function, and Cellular component. Dark bar represents up-regulation; gray bar represents down-regulation.

Figure 5.
Biochemical pathway of plant-pathogen interaction derived from the KEGG website. DEGs matching the enzymes/proteins involved in the pathway were indicated with red marks. Proteins in green boxes are: CEBiP, Chitin elicitor binding protein; CERK1, chitin elicitor receptor kinase 1;CNGCs, cyclic nucleotide gated channel 10; FLS2, Flagellin-Sensitive 2; CDPK, calcium-dependent protein kinase 1;Rboh, respiratory burst oxidase-like protein; CAMCML, calcium-binding protein CML;NOS, nitric-oxide synthase;WRKY25, WRKY transcription factor 25; MERK1, mitogen-activated protein kinase kinase kinase 1; MKK1/2, mitogen-activated protein kinase kinase 1;MKK45, mitogen-activated protein kinase kinase 4/5;NHO1, glycerol kinase; PR1, pathogenesis-related protein 1; Pti1, pto-interacting protein 1; RIN4, RPM1-interacting protein 4; RPM1, NB-ARC domain-containing disease resistance protein; RIN4, RPM1 interacting protein 4; RPS2, disease resistance protein RPS2; PBS1, serine/threonine-protein kinase PBS1; SGT1, suppressor of G2 allele of SKP1; RAR1, cysteine and histidine-rich domain-containing protein RAR1; HSP90, heat shock protein 90kDa beta.

Figure 6.
Expression of K2-DEGs in different tissues and growth stages of rice using RT-PCR assay. Genes were coded as follows: CCDP (AK062654), EXP1 (NM_001069356), EXP2 (LOC_Os08g26230.4), EXP3 (NM_001189913), EXP4 (LOC_Os09g04310.1), LCT (LOC_Os06g38120.1), MT3B (LOC_Os05g11320.1), P450.1 (LOC_Os01g36294.1), P450.2 (LOC_Os09g10340.1), TAT (LOC_Os01g45640.1), TLP (LOC_Os12g43380.1), WAK5 (LOC_Os04g30250.3), and WRKY104 (LOC_Os11g02520.1).

Figure 7.
The expression level of K2-DEGs in rice at 0, 6, 12, and 24 h after treatment with 100uM salicylic acid (SA) (C7H6O3) and 100uM jasmonic acid (JA) (C12H18O3). Data presented are the means ± SD from 3 replicates and ** above the bars indicate significant differences at p < 0.05 level between the treatment and mock at the same time points. Genes were coded as follows: CCDP (AK062654), EXP1 (NM_001069356), EXP2 (LOC_Os08g26230.4), EXP3 (NM_001189913), EXP4 (LOC_Os09g04310.1), LCT (LOC_Os06g38120.1), MT3B (LOC_Os05g11320.1), P450.1 (LOC_Os01g36294.1), P450.2 (LOC_Os09g10340.1), TAT (LOC_Os01g45640.1), TLP (LOC_Os12g43380.1), WAK5 (LOC_Os04g30250.3), and WRKY104 (LOC_Os11g02520.1).

Figure 8.
Attenuation of X. oryzae pv. oryzae race K2 virulence on rice overexpression transgenic plants. Lesion length of bacterial blight measured in cm at 16 dpi. Genes were coded, as mentioned above. Data presented are means ± SD from 3 replicates and different letters above the bars indicate significant difference at p < 0.05 level.


Table 1.
Representative term of most enriched annotation group (p ≤ 0.05) determined by functional annotation clustering in DAVID.
Table 1.
Representative term of most enriched annotation group (p ≤ 0.05) determined by functional annotation clustering in DAVID.
| Enriched Term | Enrichment | p-Value | Count | % | List Total |
|---|---|---|---|---|---|
| Transcription factor activity | 9.57 | 3.34 × 10⁻⁷ | 36 | 6.2827 | 329 |
| Integral component of membrane | 2.62 | 0.01756 | 116 | 20.2443 | 306 |
| Response to bacterium | 2.41 | 0.00311 | 3 | 0.5236 | 229 |
| Regulation of defense response | 2.26 | 0.00148 | 5 | 0.8726 | 229 |
| Plant hormone signal transduction | 2.26 | 0.10285 | 7 | 1.2216 | 71 |
| Chitin catabolic process | 2.13 | 7.04 × 10⁻⁵ | 8 | 1.3962 | 229 |
| Signal peptide | 2.13 | 0.01082 | 17 | 2.9668 | 58 |
| Protein kinase, ATP binding site | 1.85 | 8.15 × 10⁻⁴ | 32 | 5.5846 | 434 |
| Cytochrome P450, conserved site | 1.80 | 9.46 × 10⁻⁴ | 15 | 2.6178 | 434 |
| Secondary metabolites biosynthesis | 1.80 | 0.015962 | 15 | 2.6178 | 57 |
| Differentiation | 1.28 | 0.008475 | 5 | 0.8726 | 447 |
| Signal transduction | 1.04 | 0.022859 | 7 | 1.2216 | 229 |
Table 2.
Selected DEGs with the highest expression values confirmed through microarray and qRT-PCR assays.
Table 2.
Selected DEGs with the highest expression values confirmed through microarray and qRT-PCR assays.
| Locus | Gene | Expression Pattern | |||
|---|---|---|---|---|---|
| Microarray | qRT-PCR | ||||
| Exp. Pattern | F.C. | Exp. Pattern | F.C. | ||
| LOC_Os05g11320.1 | metallothionein-like protein 3B (MT3B) | Up | 76.2 | Up | 25.51 ± 0.92 |
| NM_001069356 | expressed protein (EXP1) | Up | 54.18 | Up | 363.97 ± 9.86 |
| LOC_Os08g26230.4 | expressed protein (EXP2) | Up | 20.45 | Up | 53.53 ± 1.80 |
| LOC_Os01g36294.1 | cytochrome P450 (P450.1) | Up | 15.92 | Up | 75.40 ± 4.03 |
| LOC_Os06g38120.1 | low-affinity cation transporter (LCT) | Up | 15.82 | Up | 15.91 ± 0.31 |
| LOC_Os12g43380.1 | thaumatin (TLP) | Up | 12.56 | Up | 10.70 ± 0.93 |
| NM_001189913 | expressed protein (EXP3) | Up | 12.16 | Up | 92.19 ± 5.66 |
| LOC_Os04g30250.3 | wall-associated receptor kinase-like 5 precursor (WAK5) | Up | 11.9 | Up | 31.74 ± 2.79 |
| LOC_Os09g10340.1 | cytochrome P450 (P450.2) | Up | 11.69 | Up | 8.32 ± 0.18 |
| AK062654 | cortical cell delineating protein precursor (CCDP) | Up | 10.93 | Up | 38.89 ± 1.76 |
| LOC_Os11g02520.1 | WRKY104 transcription factor (WRKY104) | Up | 10.9 | Up | 26.43 ± 1.25 |
| LOC_Os09g04310.1 | expressed protein (EXP4) | Up | 10.78 | Up | 32.43 ± 1.81 |
| LOC_Os01g45640 | twin-arginine translocation pathway signal (TAT) | Up | 10.1 | Up | 9.6 ± o.51 |
Table 3.
Number of plants in each overexpression construct with single gene determined by Taqman qPCR assay.
Table 3.
Number of plants in each overexpression construct with single gene determined by Taqman qPCR assay.
| Transgenic Rice | Gene ID | No. of Plants with Single Copy Gene | Calculated Copy Number (Range) |
|---|---|---|---|
| MT3B | LOC_Os05g11320.1 | 6 | 1.37 ± 0.08 to 1.44 ± 0.03 |
| EXP1 | NM_001069356 | 4 | 0.87 ± 0.05 to 1.25 ± 0.03 |
| EXP2 | LOC_Os08g26230.4 | 16 | 1.27 ± 0.05 to 1.47 ± 0.01 |
| P450.1 | LOC_Os01g36294.1 | 11 | 1.17 ± 0.04 to 1.31 ± 0.07 |
| LCT | LOC_Os06g38120.1 | 9 | 0.82 ± 0.10 to 1.44 ± 0.03 |
| TLP | LOC_Os12g43380.1 | 16 | 1.17 ± 0.01 to 1.49 ± 0.01 |
| EXP3 | NM_001189913 | 10 | 0.91 ± 0.03 to 1.48 ± 0.11 |
| WAK5 | LOC_Os04g30250.3 | 4 | 0.74 ± 0.30 to 1.38 ± 0.04 |
| P450.2 | LOC_Os09g10340.1 | 14 | 1.04 ± 0.13 to 1.39 ± 0.05 |
| CCDP | AK062654 | 13 | 1.19 ± 0.01 to 1.30 ± 0.09 |
| WRKY104 | LOC_Os11g02520.1 | 16 | 0.57 ± 0.04 to 1.24 ± 0.62 |
| EXP4 | LOC_Os09g04310.1 | 9 | 1.12 ± 0.10 to 1.42 ± 0.07 |
| TAT | LOC_Os01g45640.1 | 11 | 0.57 ± 0.04 to 1.44 ± 0.09 |
© 2020 by the authors. Licensee MDPI, Basel, Switzerland. This article is an open access article distributed under the terms and conditions of the Creative Commons Attribution (CC BY) license (http://creativecommons.org/licenses/by/4.0/).
Share and Cite
MDPI and ACS Style
Niño, M.C.; Cho, Y.-G. Transcriptional Modulation of Resistance against Xanthomonas oryzae pv. oryzae Korean Race K2 in japonica Rice. Agronomy 2020, 10, 960. https://doi.org/10.3390/agronomy10070960
AMA Style
Niño MC, Cho Y-G. Transcriptional Modulation of Resistance against Xanthomonas oryzae pv. oryzae Korean Race K2 in japonica Rice. Agronomy. 2020; 10(7):960. https://doi.org/10.3390/agronomy10070960
Chicago/Turabian StyleNiño, Marjohn C., and Yong-Gu Cho. 2020. "Transcriptional Modulation of Resistance against Xanthomonas oryzae pv. oryzae Korean Race K2 in japonica Rice" Agronomy 10, no. 7: 960. https://doi.org/10.3390/agronomy10070960
Note that from the first issue of 2016, this journal uses article numbers instead of page numbers. See further details here.