

Abstract
Boundary lubrication is one of the most interesting topics in the field of tribology, and many studies have been conducted in the past to gain deeper understanding of the behaviour of boundary lubrication layers formed by additives mixed in lubricants because the layer largely affects the tribological property of the target surface. With a strong demand to clarify the behaviour of boundary lubrication layers, several new approaches to in situ (=in lubricant) analysis have been proposed and applied. This paper focuses on the effectiveness of combined use of neutron reflectometry and frequency-modulation atomic force microscopy for the quantitative analysis of boundary lubrication layers formed at the interface between the metal substrate and lubricant and introduced their application with concrete case examples.
Export citation and abstract BibTeX RIS
1. Introduction
The trend towards creation of an eco-society in the near future has led to a rapid increase in the number of studies involving tribology, an interdisciplinary field covering friction, wear, and lubrication. Particularly important is reducing the friction of sliding surfaces under oil-lubricated conditions because most sliding machine parts, such as engine pistons, gears, and bearings, are lubricated with lubricating oil.1–4)
Typical friction behaviour under lubricated conditions is represented by the Stribeck curve, which essentially expresses friction behaviours under various lubrication conditions: boundary lubrication, mixed lubrication, and hydrodynamic lubrication (including elastohydrodynamic lubrication). To prevent sliding surfaces from seizing, the formation of thicker oil film is desirable. However, the use of high viscosity for forming the thicker oil film introduces high friction because high shear force occurs when the surface slides. Therefore, the development of lubricating oil with appropriate viscosity and excellent lubrication performance has become important.5–7)
With this background, boundary lubrication is now one of the most interesting topics in the field of tribology because friction performance under boundary lubrication conditions determines the total energy performance of machines,8–13) especially with the recent trend towards recommending the use of lower viscosity oil. The effective items for improving the friction performance under boundary lubrication condition is "material", "design" and "lubricant". With respect to "material", a lot of effective materials, including both of hard and soft coatings, have been proposed and developed, such as diamond-like carbon,14–16) ceramic coating,17,18) polymer coating,19,20) and their complex.21,22) The second item "design" is also quite influential to lubrication performance. For example, surface texturing is widely studied and already applied to many machine components.23–26) Excellent surface texturing contributes to the expansion of the hydrodynamic lubrication regime giving a lower Harsey number, resulting in a reduced contact area ratio operated under boundary lubrication.
The third item "lubricant" is predominant for lubrication performance as well. Typical lubrication oil consists of base oil and several kinds of additives. The layer formed by the additives in lubricating oil is the key to boundary lubrication performance. Such layers are called the "boundary lubrication layer" and classically divided into two principal types: adsorbed layers due to physical or chemical bonding to a surface and chemical reaction films, "tribofilms", formed in a friction process. The former types are formed by natural adsorption of oiliness additives while the latter ones are formed by the chemical reaction between extreme-pressure additives in lubricants and metal surfaces. A better understanding of both behaviours is quite important and has become necessary in the field of tribology. However, analysis of the former is more difficult than for the latter in general because an adsorbed additive layer is only nanometres thick and should be in situ analyzed in lubricant to prevent it from drying. There is thus more room for discussion regarding the former.27–29)
The model illustration proposed by Hardy (Fig. 1) is the most well-known model of a boundary lubrication layer consisting of adsorbed oiliness additives.30) In this model, active groups in the additives, such as hydroxyl or carboxyl groups, adsorb on the metal surface, and hydrocarbon chains in the additives stand vertically on the surface and support the load. Many classical studies demonstrated that the adsorptive performance of an additive to the surface greatly affects the friction coefficient of the surface.31–33) However, quantitative analysis of the physical and chemical properties of adsorbed layers had been few until recently because of its substantial difficulty.
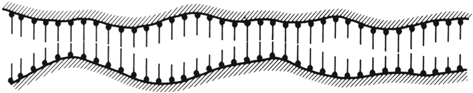
Fig. 1. Hardy's monolayer model. The history of "boundary lubrication" started from this model, and most researchers trust these kinds of interfacial structures still today. (Quoted from Ref. [30]).
Download figure:
Standard image High-resolution imageWith the strong demand for clarifying the behaviour of boundary lubrication layers, several new approaches to in situ analysis have been proposed and applied. For example, attenuated total reflection infrared spectroscopy (ATR-IR),34–36) sum frequency generation (SFG) spectroscopy,37–40) and quartz crystal microbalance with dissipation monitoring (QCM-D)41–43) are useful methods for the identification of molecular spices and amount of additives adsorbed to the substrate in lubricant. However, capture of visual (or quasi-visual) images of adsorbed additives in lubricants such as Hardy's illustration is still difficult only by these methods because the information derived from such analyses is not entirely quantitative but comparative.
The authors have had their eye on neutron reflectometry (NR) and frequency-modulation atomic force microscopy (FM-AFM) for several years for their application to tribology studies. Particularly, their combined use is extremely powerful for obtaining visual images of adsorbed additive layers with quantitative information. This paper reviews those using NR and FM-AFM, and describes their application in tribological studies with a focus on the analytical examples we achieved.
2. Neutron reflectometry
2.1. Features
The neutron beam is not familiar to most of researchers, but several features of neutron beams make them well suited for tribological studies.
- Neutrons can penetrate most common materials because they physically interact not with electrons but with atomic nuclei. Their use makes it easy to directly analyze the interface between a metal surface and lubricant.
- Neutrons can detect even light atoms such as hydrogen or carbon ones, in contrast to X-rays, making neutron beams suitable even for studies of lubricants composed of hydrocarbons.
- Labelled molecules by deuterium substitution are clearly distinguished from non-deuterated molecules by neutrons. Therefore, the thickness of an additive adsorption layer can be determined by using, for example, a normal base oil and a deuterated additive.
- Neutron energy is comparatively weak compared with that of X-rays or other beams, enabling non-destructive analysis of the target.
Reflectometry is a classical way to obtain angstrom-level information on the vertical structure, such as the distributions of density and thickness, through the reflectivity profile from the target surface (or interface).44–46) The vertical structure at the interface can be estimated by taking the optimum fitting for the experimentally-obtained profile by the theoretical reflectivity profile on the Parratt's theory with a physical model47) because the contribution of "thickness" and "density" of the target layer for reflectivity profile is dependent in principle.
2.2. Procedure
The typical procedure for interfacial analysis by NR is shown in Fig. 2. First, a sample substrate was set in the sample holder to obtain a neutron reflectivity profile from the interface between the substrate surface and air. Next, a base oil was flowed into the sample holder (=liquid cell) and a reflectivity profile from between the surface and the base oil was similarly obtained. Finally, an additive-mixed base oil was flowed and replaced with the normal base oil in the sample holder, and the reflectivity profile was again obtained. The neutron optics and sample holder were not touched during these steps, so the differences in the reflectivity profiles between steps were completely recognized as being provided by the existence of the base oil and/or additive at the interface. To clearly distinguish the additive layer from base oil by neutron, a deuterated base oil or a deuterated additive must be used as mentioned above.
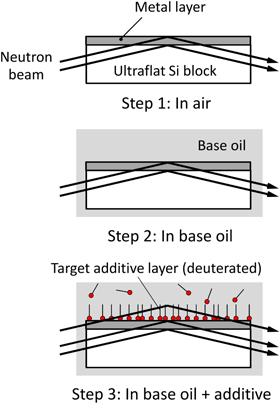
Fig. 2. (Color online) Neutron reflectometry procedure for structural analysis of adsorbed additive layer. Deposition of the metal layer is necessary because the layer acts as an "off-set" layer creating the clear fringes in reflectivity profile.
Download figure:
Standard image High-resolution image2.3. Case examples
Typical neutron reflectivity profiles from the sample surface in air, in a base oil, and in a base oil with deuterated additive we experimentally-obtained are shown in Fig. 3(a).48) The reflectivity profiles in the figure were obtained by the angular-dispersive neutron reflectometer "SUIREN", which is an angle dispersive reflectometer, operating at JRR-3M in the Japan Atomic Energy Agency (JAEA).49) The sample surface was a Cu layer (∼75 nm thick) deposited on a silicon block. The base oil and additive were poly-alpha-olefin (PAO) and deuterated acetic acid in this case, and the concentration of acetic acid in the PAO was 0.1 mass%. The reflectivity on the vertical axis corresponds to the ratio of the reflected beam intensity to the incident beam intensity. The scattering vector q on the horizontal axis was calculated from the incident beam angle θ and the wavelength of the detected neutrons λ

The figure shows that though there was no difference in the reflectivity profiles between the first step (in air) and second step (in PAO), the reflectivity profile obtained in the third step (in PAO + d-acetic acid) was slightly different; the fringe interval was clearly narrower than in the other profiles. The intervals of the interferential fringes in the profiles obtained in the first and second steps precisely corresponded to the thickness of the metal coating; the thickness of the Cu layer was estimated to be exactly 74.0 nm by taking the optimum fitting on a physical model. Fringe interval narrowing was observed only in the profile obtained in the third step, meaning that a homogeneous layer had formed on the metal surface. The layer could only be an additive layer formed by the deuterated acetic acid. Using the optimum fitting revealed that the adsorbed layer on the Cu surface was quite thin, only 2.0 nm, as illustrated in Fig. 3(b)48) with the estimated profile of scattering length density (SLD).

Fig. 3. Typical results obtained by NR for additive adsorption. Fringe interval narrowing in the top profile means that a homogeneous layer had formed on the metal surface. (Quoted from Ref. [48] with modification). (a) Neutron reflectivity profiles and (b) estimated interfacial structure.
Download figure:
Standard image High-resolution imageBesides being useful for in situ analysis, NR has another important advantage: the environmental conditions are easily changeable and controllable. Typical reflectivity profiles from the target interface obtained in another experiment are shown in Fig. 4(a).50) The bottom, middle and top profiles were obtained for the sample surface in PAO, in PAO with deuterated palmitic acid (d-PA), and in PAO with d-PA under a hydrostatic condition (3.0 MPa), respectively. In this experiment, the sample surface was a Cu layer deposited on a silicon block as well, and the concentration of d-PA in PAO was 0.1 mass%. The reflectivity profiles were obtained by a time-of-flight (TOF) neutron reflectometer in the CN-3 beamline at the Institute for Integrated Radiation and Nuclear Science, Kyoto University. The hydrostatic condition was created by injecting Ar gas through the top hole in the liquid cell. The optimum fitting lines based on Parratt's theory are also shown in the figure.

Fig. 4. (Color online) Structural change in additive adsorption under hydrostatic pressure. Fringe interval in the profile obtained at 3 MPa became narrower, meaning that the adsorbed additive layer at high pressure was thicker than that at atmospheric pressure. (Quoted from Ref. [50]). (a) Neutron reflectivity profiles and (b) estimated interfacial structures.
Download figure:
Standard image High-resolution imageA comparison of the reflective profiles for PAO (bottom) and PAO with d-PA (middle) clearly shows that they are slightly different; the fringe interval in the profile for PAO with d-PA is clearly narrower than in the profile for PAO. The scattering length density (SLD) profiles and images of the layer structure at atmospheric and high pressures (3.0 MPa) are shown in Fig. 4(b).50) Fitting based on Parratt's theory showed that the adsorbed additive layer on the Cu surface at atmospheric pressure was about 1.4 nm thick and that the density of the additive in the layer was almost the same as that of pure deuterated palmitic acid. This means that a monolayer of palmitic acid molecules formed on the Cu surface with high grafting density, which is almost the same result as with pure palmitic acid. Moreover, the fringe interval in the top profile in Fig. 4(a) was much narrower than that in the profile at atmospheric pressure (middle profile). Fitting showed that the adsorbed additive layer at high pressure was about 5.9 nm thick and that the density of the additive in the layer was almost the same as that of pure deuterated palmitic acid, as it was at atmospheric pressure. These results interestingly demonstrate that a high-pressure condition may results in a thicker additive layer due to the change in equilibrium state of additive molecules in lubricant. It is a well-known fact that the structure (thickness and density) of the adsorbed additive layer dominates the friction coefficient. NR is a unique and powerful technique for quantitative analysis for the layer structure in lubricant even under various conditions.
3. Frequency-modulation atomic force microscopy
3.1. Features
Atomic force microscopy (AFM) has two basic operation modes: contact and dynamic. Dynamic mode is further divided into "amplitude-modulation (AM) mode" and "frequency-modulation (FM) mode". The contact mode AFM is widely used in many researches in various fields. Particularly in the field of tribology, lateral force microscopy (LFM) that is modified from the normal AFM to measure a horizontal force has been recognized as an invaluable technique for evaluating the friction coefficient with taking the 3D surface profile simultaneously in a microscopic view. Such microscale studies have been positioned as being fundamental ones for clarifying the mechanisms of friction and wear.51–54) Recent advances with AFM for tribology studies is more remarkable, and classical problems are being moved toward clarification day by day.55)
Regarding the dynamic mode AFM, on the other hand, the use of AM-AFM is more widespread than that of FM-AFM, especially in the soft matter physics field. AM-AFM is quite useful for measuring stiffness and damping properties of soft materials. FM-AFM is still minor because of the difficulty in controlling its operation, but FM-AFM is more sensitive in estimating the structure of soft materials covering liquid due to its higher signal-to-noise ratio.56–58) In the FM-AFM apparatus, a cantilever is oscillated at the frequency of self-excited vibration by using a rectangular piezoelectric element. When the head of the cantilever comes close to the surface, the interaction force between the substrate and top of the cantilever shifts the self-excited frequency of the cantilever oscillation. The most attractive feature of FM-AFM is its higher sensitivity and its force resolution is less than 10 pN in principle.59,60) The surface topography of materials is obtained by moving the cantilever along the z-axis to each (x,y) point, as shown in Fig. 5(a),61) thereby keeping the shift, Δf, constant. Moreover, with FM-AFM it is possible to draw a cross-sectional density map of liquid molecules from the Δf map by x–z plane scanning, as shown in Fig. 5(b), owing to its high force sensitivity, which cannot be done with any other method.

Fig. 5. (Color online) Diagram of FM-AFM apparatus and tip scanning trace on x–z plane. (Quoted from Ref. [61]). (a) Mechanical system and electric circuit and (b) illustration of x–z plane scanning.
Download figure:
Standard image High-resolution image3.2. Procedure
To obtain a cross-sectional image of the metal/lubricant interface by FM-AFM, the target lubricant is first dropped onto a substrate. It is desirable for the substrate to have an ultraflat surface. The lubricant is kept between the cantilever and substrate by its surface tension when the cantilever comes close to the substrate surface. A cross-sectional image of the interface between the substrate surface and pure base oil is captured first, and a similar image is captured again after the lubricant is changed to base oil with additive. The choice of cantilever is quite important for obtaining clear images. One should be selected from the viewpoints of tip sharpness and resonant frequency.
3.3. Case examples
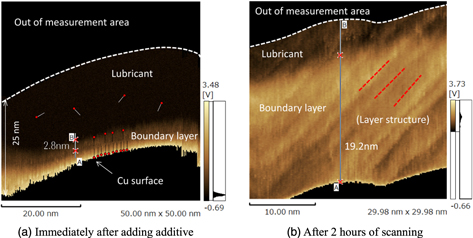
A typical example of an image captured by FM-AFM is shown in Fig. 6.61) In the experiment, the substrate was an ultraflat Cu layer made by sputtering on a silicon wafer, and the base oil and additive are hexadecane and palmitic acid (PA), respectively. The concentration of PA in hexadecane was 0.01 mass%. A commercially available FM-AFM apparatus (SPM-8000FM, Shimadzu) and a cantilever (PPP-NCHAuD, Nanosensors) suitable for the interfacial observation were used in this case. A cross-sectional image of the interface between the substrate and lubricant with additive taken immediately after addition of the additive is shown in Fig. 6(a). On the basis of the FM-AFM principle, the bright area corresponds to a "high-density" area, which should show the adsorbed additive layer. We can see a clear layer structure formed by the palmitic acid on the Cu surface. After 2 h of continuous scanning, we can see that the layer grew to a thickness of 20 nm [Fig. 6(b)]. In contrast, after 2 h without continuous scanning, the layer did not grow. This indicates that the external stimulus of continuous scanning caused the additive layer to grow. FM-AFM revealed that the adsorbed additive layer easily grew into a multilayer under tribological conditions. When a silicon wafer was used as a substrate material instead of a Cu layer, a bright area was not seen. This demonstrates that an adsorbed additive layer forms only on an oxidized metal surface, as expected.
Fig. 6. (Color online) Cross-sectional images of metal/lubricant interface captured by FM-AFM. Thickness of adsorbed additive layer gradually increased from (a) to (b), demonstrating that palmitic acid grew from monolayer to multilayer while maintaining layer structure due to cantilever oscillation. (Quoted from Ref. [61] with modification). (a) Immediately after adding additive and (b) after 2 h of scanning.
Download figure:
Standard image High-resolution image
4. Discussion
Until the recent development of in situ surface analysers, the behaviour of additive molecules at the interface in a lubricant was unknown. Now, powerful techniques such as NR and FM-AFM have the high possibility to reveal the behaviour of additive molecules. NR has the advantage of being able to adapt to environmental changes such as changes in temperature and/or pressure conditions while FM-AFM has the advantage of being able to simulate a sliding condition by scanning. Both NR and FM-AFM are quite useful for in situ analysis of an adsorbed additive layer, and their combined use is one of the most powerful tools for revealing the true state of a boundary layer. A comparison of the features of NR and FM-AFM analyses is shown in Table I.50) The number of papers discussing interfacial structures between the lubricant and substrate using NR62–64) or FM-AFM65,66) has markedly increased over recent years.
Table I. Comparison between NR and FM-AFM analyses of adsorbed additive layer.
| NR | FM-AFM | |
|---|---|---|
| Thickness resolution | ◎ Å-level | ◎ Å-level |
| Spatial resolution | × mm-level | ◎ nm-level |
| Information | Averaged | Local |
| Density profile | ○ Absolute | Δ Relative |
| Elemental analysis | ○ Possible (if d-material used) | × Impossible |
| Other | × Necessary for neutron facility | ◎ Possible in lab |
| ○ Non-destructive | × Destructive | |
| ○ Not necessary for special technique | Δ Necessary for special technique | |
| × Necessary for super-flat surface | ○ Not necessary for flat surface | |
| × Necessary for d-material | ○ Not necessary for material marking | |
| ◎ Easy for environmental control (pressure, temperature, etc.) | × Difficult for environmental control |
◎: excellent, ○: good, Δ: fair, ×: bad
Regarding the growth of adsorbed additive layers into multilayers, it is actually well known that the formation of a "metal soap" layer between a substrate and fatty acid due to a chemical reaction greatly reduces friction, and the layer is typically recognized as being thicker than a monolayer.28,32,67–71) Therefore, the results obtained by NR and FM-AFM may be natural and not surprising. However, quantitative information and cross-sectional images brought by NR and FM-AFM, respectively, help to consolidate our knowledge. In addition, these studies are well matched to studies by molecular simulation, that is significantly progressed with the dramatic development of large-scale computer systems in recent times.72,73) Moreover, the application of NR and/or FM-AFM is already widespread for analysis of "actual" additives having a more complicated chemical structure74) though the target of case examples introduced in this review are only model additives. The combined use of NR and FM-AFM is promising for further elucidation of the actual boundary lubrication mechanism. Its use should thus become quickly widespread as a powerful tribological technique.
5. Conclusions
This paper reviewed the research trend in the field of tribology, focusing on in situ analysis of adsorbed additive layers by NR and FM-AFM. These techniques can reveal the additive behaviour at a metal/lubricant interface even in the lubricant. The "monolayer-multilayer controversy" that lasted for over 50 years has finally been settled.
Most researchers believe that tribological phenomena are quite complex, making tribological properties unpredictable. However, general tribological properties measured with a full-size apparatus are closely connected to the interfacial structure from the microscopic view. The additive layer easily changes from monolayer to multilayer, and the growth of an additive layer promises to bring a lower coefficient of friction. A deeper tribological understanding of boundary lubrication through the combined use of in situ analyses will proceed in the near term in accordance with the strong demand for the construction of an eco-society.
Acknowledgments
The authors are grateful to Prof. Masahiro Hino (Kyoto Univ.) and Dr. Norifumi Yamada (KEK) for their supports for NR analysis and to Prof. Hiroshi Onishi (Kobe Univ.) and Dr. Ryohei Kokawa (Shimadzu Corp.) for their helpful advice and guidance for FM-AFM analysis.