Article

An Alternative for Estimating the Design Flood Interval of Agricultural Reservoirs under Climate Change Using a Non-Parametric Resampling Technique

1
Prediction Research Department, Climate Services and Research Division, APEC Climate Center, Busan 48058, Korea
2
Department of Agricultural Engineering, Institute of Agriculture and Life Science, Gyeongsang National University, Jinju 52828, Korea
3
Department of Agricultural and Biological Engineering & Tropical Research and Education Center, University of Florida, Homestead, FL 33031, USA
4
Department of Rural Systems Engineering, Research Institute for Agriculture and Life Sciences, Institute of Green Bio Science and Technology, Seoul National University, Seoul 08826, Korea
*
Author to whom correspondence should be addressed.
Water 2020, 12(7), 1894; https://doi.org/10.3390/w12071894
Submission received: 14 May 2020 / Revised: 23 June 2020 / Accepted: 29 June 2020 / Published: 2 July 2020
(This article belongs to the Special Issue Study for Ungauged Catchments—Data, Models and Uncertainties)

Abstract

:
Agricultural reservoirs play such a central role in supplying water to rural areas that it is essential to properly estimate the design flood for agricultural reservoirs under climate change. The objective of this study was to estimate the inflow design flood interval using a non-parametric resampling technique for agricultural reservoirs under climate change. This study suggested an alternative method to point estimation using insufficient past data by providing the interval of the inflow design flood under the representative concentration pathway. To estimate the interval of the inflow design flood, we employed the bootstrap technique, which estimated the confidence interval corresponding to the 95% confidence level. This study covered a spatial range of 30 agricultural reservoirs in South Korea and a temporal range of past and three future representative periods: the base period (2015s: 1986–2015) and future periods (2040s: 2011–2040, 2070s: 2041–2070, 2100s: 2071–2100). We analyzed the results of a 200-year return period and 24-hour duration as a representative case. For the 97.5th bias-corrected and accelerated percentile value, the overall inflow design floods were larger than the base period value (2015s) with the safety factor applied. The northern and midwestern regions of South Korea showed relatively greater changes than the southeastern region. Some agricultural reservoirs showed a decrease in the design flood during the 2040s but generally increased after the 2070s. Through the non-parametric resampling technique, the interval estimation was provided considering the uncertainty of the inflow design flood. By presenting the results for three periods, we can provide policymakers with information to select according to the target period. The findings may provide an essential step in replacing a safety factor used for determining the design flood of agricultural reservoirs with the confidence interval calculated in accordance with statistical characteristics.

1. Introduction

Hydrological cycle analysis is essential for the flexible and sustainable management of water resources in rural areas. The hydrological cycle in these areas is influenced by various external factors, including the apparent warming in the climate system and the increased frequency of extreme weather events [1]. In recent years, there has been a significant increase in weather-related disasters worldwide due to the increased intensity of weather and the extent of existing disaster risks as climate change occurs [2].
In evaluating the frequency and tendencies of these meteorological disasters, it can be seen that the majority of these disasters were caused by heavy rainfall. Besides, there is a globally increasing trend of disasters associated with floods [3]. Looking at South Korea′s statistics as a regional example, the most damage was caused by heavy rainfall that occurred during 2005 and 2010 [4]. It is further indicated that the inundation of urban and farmland accounts for the most considerable portion of total damages caused by typhoons [4]. Moreover, looking at South Korea′s past and future precipitation data, the 30-year average annual precipitation during the reference period (1981–2010) in South Korea was 1307.7 mm. Summer precipitation accounts for 55.3% of annual precipitation. In the representative concentration pathway (RCP) 4.5 scenario, the annual precipitation in South Korea was expected to increase by 6.7% in the distant future period (2017–2100) compared to the reference period. In the distant future period, the global annual precipitation was also projected to increase by 4.0%. It is analyzed that the annual precipitation in South Korea is related to the global increase [5].
Simultaneous manifestations of extreme weather due to climate change are now an important factor responsible for the increasing flood risk in rural areas. Current climate systems frequently tend to generate rainfall events that deviate from established design criteria based on past rainfall data. To reflect these changes, governments and researchers have strengthened design standards for infrastructure such as agricultural reservoirs.
Agricultural reservoirs play a central role in managing the water supply to rural areas. In particular, rice is the main crop related to agricultural reservoirs in South Korea. Agricultural reservoirs supply agricultural water to more than half of South Korea′s paddy fields using irrigation canals [6]. The operation of agricultural reservoirs based on the proper design flood ensures a stable supply of agricultural water. Also, it is crucial to properly estimate the design flood for agricultural reservoirs because its failures caused by overtopping can cause enormous damage. The current design flood for agricultural reservoirs is commonly based on a deterministic approach using past data. However, a deterministic approach cannot reflect the uncertainty inherent in the design flood and past data are not sufficient to estimate the design flood over a 200-year return period [7,8,9,10,11]. In addition, although there have been studies that estimated the design flood considering climate change, most cases have been conducted for specific periods or regions [12,13,14,15]; thus, additional studies that consider climate change in many regions are needed.
In the design process, some researchers employed a safety factor to overcome the uncertainty inherent in the design flood based on deterministic theories [6,16,17,18,19,20]. However, it often depends on experience in deriving safety factors; thus, it is required to quantify the uncertainty with a more rational method based on data. In this study, we intend to exclude the subjective elements of researchers, such as multiplying a point estimate by a safety factor, and quantify uncertainty with the data-driven approach. Specifically, we quantify the uncertainty by performing the interval estimation using statistical characteristics of the design flood.
Several studies have been conducted to evaluate the uncertainty of current design variables based on deterministic methods using parametric techniques such as a copula and Monte Carlo simulation [21,22,23,24,25,26]. However, if there is not much data available, parametric approaches may be limited in estimating accurate design variables. Therefore, it is necessary to use a non-parametric resampling technique considering the situation where there is insufficient data.
The objective of this study is to estimate the inflow design flood interval using a non-parametric resampling technique for agricultural reservoirs in South Korea, taking into account changes in future rainfall. We present an alternative method of estimating the design flood by suggesting an interval of design variables with insufficient past data. We expect this alternative method to contribute to estimating the design flood of agricultural reservoirs in South Korea under climate change.

2. Materials and Methods

The design flood estimation using a non-parametric resampling technique can be divided into two stages: (1) climate data construction for the design flood estimation and (2) interval estimation of design flood using a non-parametric resampling technique. In this study, the design flood for agricultural reservoirs indicated the inflow design flood, which was the peak discharge of the inflow hydrograph through an agricultural reservoir watershed. The general schematic diagram is shown in Figure 1.
Climate data construction was performed for design flood estimations. Historical hourly precipitation data were obtained from 15 weather stations (automatic synoptic observation systems) near the 30 agricultural reservoirs, which were then merged in 3-h intervals. Since the temporal resolution of future precipitation data is 3-hourly, historical precipitation data were merged into the 3-h interval. Future precipitation data were constructed using a regional climate change scenario. These data were provided by the Korea Meteorological Administration (KMA) and converted into annual series of maximum precipitation by eight durations (3, 6, 9, 12, 15, 18, 21, 24-h) to estimate the design flood. Historical and future precipitation can be downloaded at the websites of weather data release portal and climate information portal [27,28].
Subsequently, a non-parametric resampling was used to estimate the interval of the design flood. To perform an interval estimation, we employed the bootstrap method. The estimates, bias, standard errors of the sample, and estimated confidence interval corresponding to the 95% confidence level were calculated using bootstrap inference.
We used R software (version 3.6.2, R Core Team, Vienna, Austria) for the bias-correction, estimation of probable rainfall, and bootstrap technique and used the hydrologic engineering center 1 (HEC-1) model for the estimation of the inflow design flood. Weather stations and 30 agricultural reservoirs were displayed with ArcGIS software (version 10.3, Esri, Redlands, USA).

2.1. Study Area and Data Construction

2.1.1. Study Area

The study area of this study was the watersheds of 30 agricultural reservoirs in South Korea. To reflect local characteristics and accurately construct data, 30 agricultural reservoirs located in four major river basins (Han River, Geum River, Nakdong River, and Yeongsan River) under the jurisdiction of the Korea Rural Community Corporation in South Korea were selected. All 30 agricultural reservoirs exceeded 1,000,000 t capacity and 500 ha. Restricted military areas were excluded from the Gangwon Province.
The watershed characteristics and design specifications for the 30 agricultural reservoirs were based upon the values provided in the basic plan reports and emergency action plan (EAP) reports [29,30,31,32,33,34,35,36,37,38,39,40,41,42,43,44,45,46,47,48,49,50,51,52,53,54,55,56,57,58,59,60]. Table 1 lists the watershed characteristics and design specifications for the 30 agricultural reservoirs. According to the criteria specified in the Special Law on the Safety Management of Facilities, eight reservoirs correspond to 1st class facilities (10 million m3 or more), and a total of nine exceed the requirements to be considered large scale (2500 ha of the watershed area; capacity of 5 million m3). The remaining 21 reservoirs are classified as small reservoirs. Weather stations and 30 agricultural reservoirs are shown in Figure 2.

2.1.2. Design Criteria for Inflow Design Flood for Agricultural Reservoirs in South Korea

There are two design criteria for the inflow design flood in South Korea. The first is to use the 1.2 times probable flood for a 200-year return period for fill dams, and the second is to use the probable maximum flood. The second can be applied when the watershed area and total storage capacity of agricultural reservoirs both exceed 2500 ha and 5 million tons [6,19]. Most agricultural reservoirs correspond to the first using the safety factor. The interval estimation results of the design flood in this study were compared with the first design criteria.

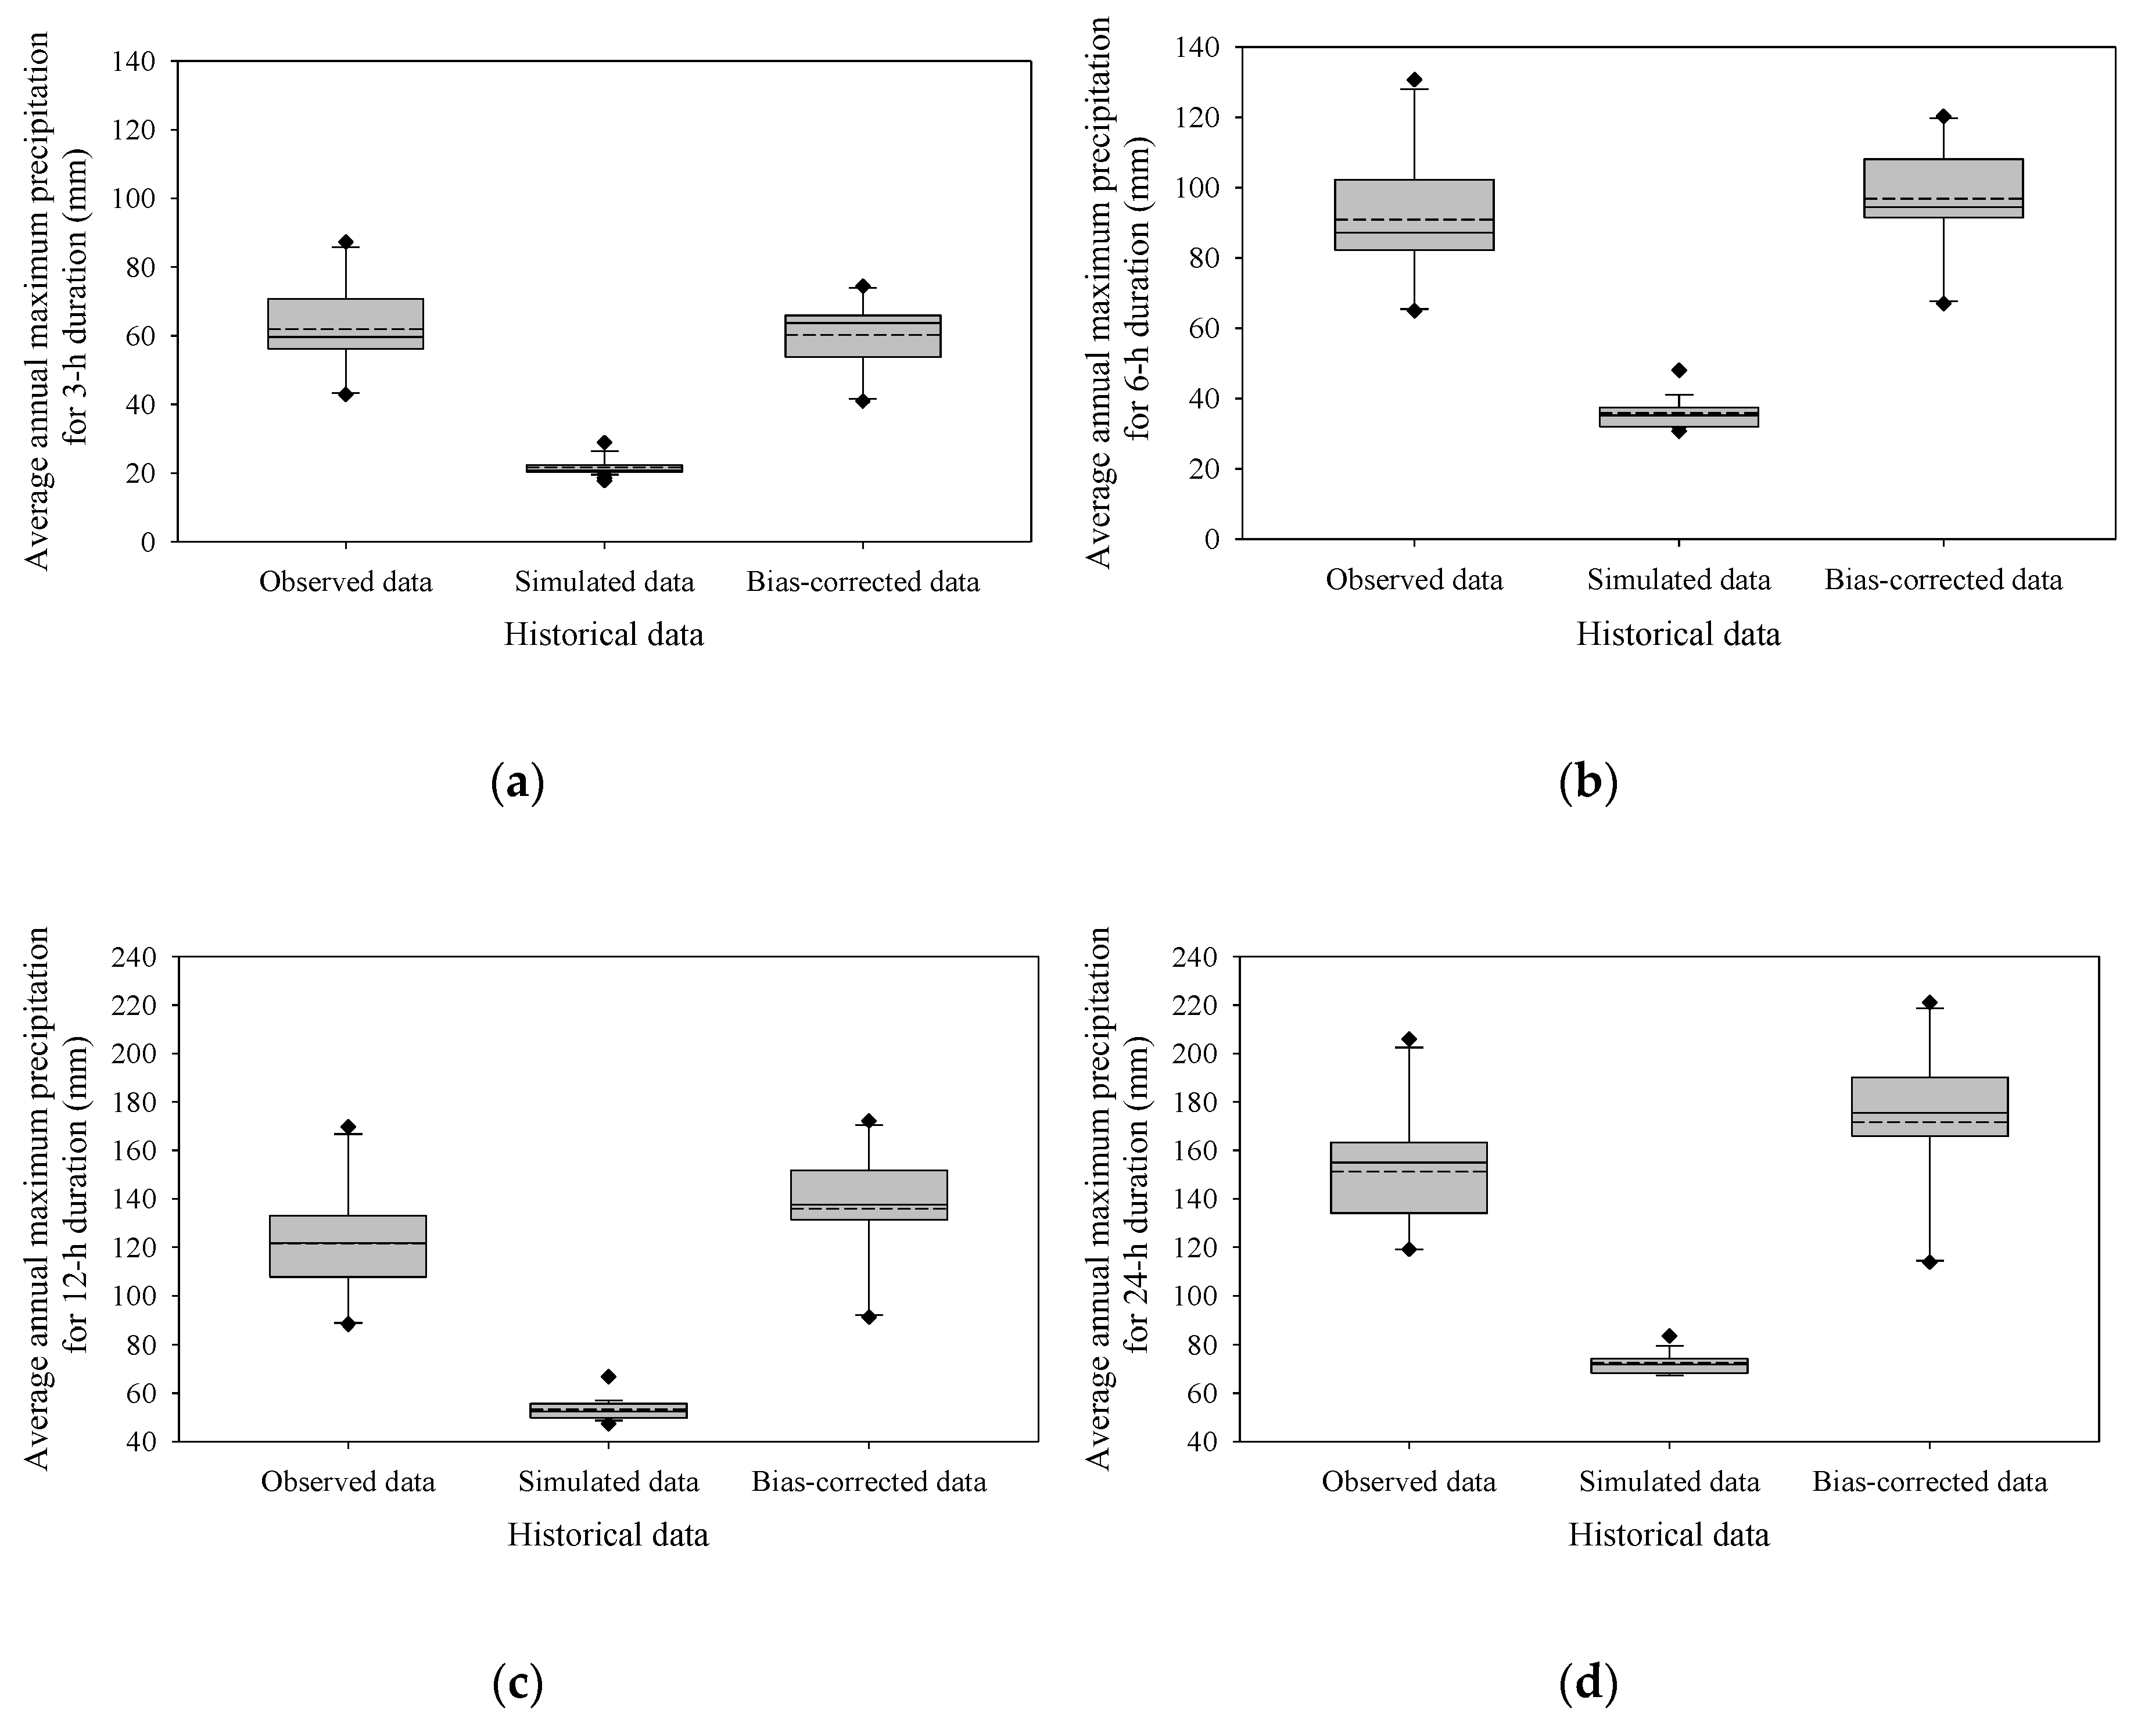
2.1.3. Climate Change Scenario and Bias-Correction

Future precipitation data were constructed using the climate change scenarios generated using the RCP scenario provided by the Korea Meteorological Administration [28]. The National Institute of Meteorological Sciences used the RCP scenario as input for the HadGEM2-AO model (global climate model) to generate a global climate change scenario with resolution down to 135 km. By assigning the results of the global climate model to input data for the regional climate model HadGEM3-RA, it was possible to provide a regional climate change scenario with a resolution of 12.5 km and 3-h for all weather stations representing the 30 reservoir watersheds [61]. Regional climate change scenarios provided both historical (1976–2005) and future precipitation simulations (2006–2100). In this study, we used the RCP4.5 scenario.
Precipitation produced using climate models includes a systematic bias. These systematic errors are difficult to solve internally in the model, and thus require additional bias-correction [62]. To resolve the systematic error inherent in the climate model, we performed a bias-correction based on the past 30 years of data (1976–2005) using the non-parametric quantile mapping method [63]. Empirical probability distributions of observed and simulated values were used. The calibration period (1976–2005) was chosen because the regional climate model provided a simulation of historical data up to 2005.

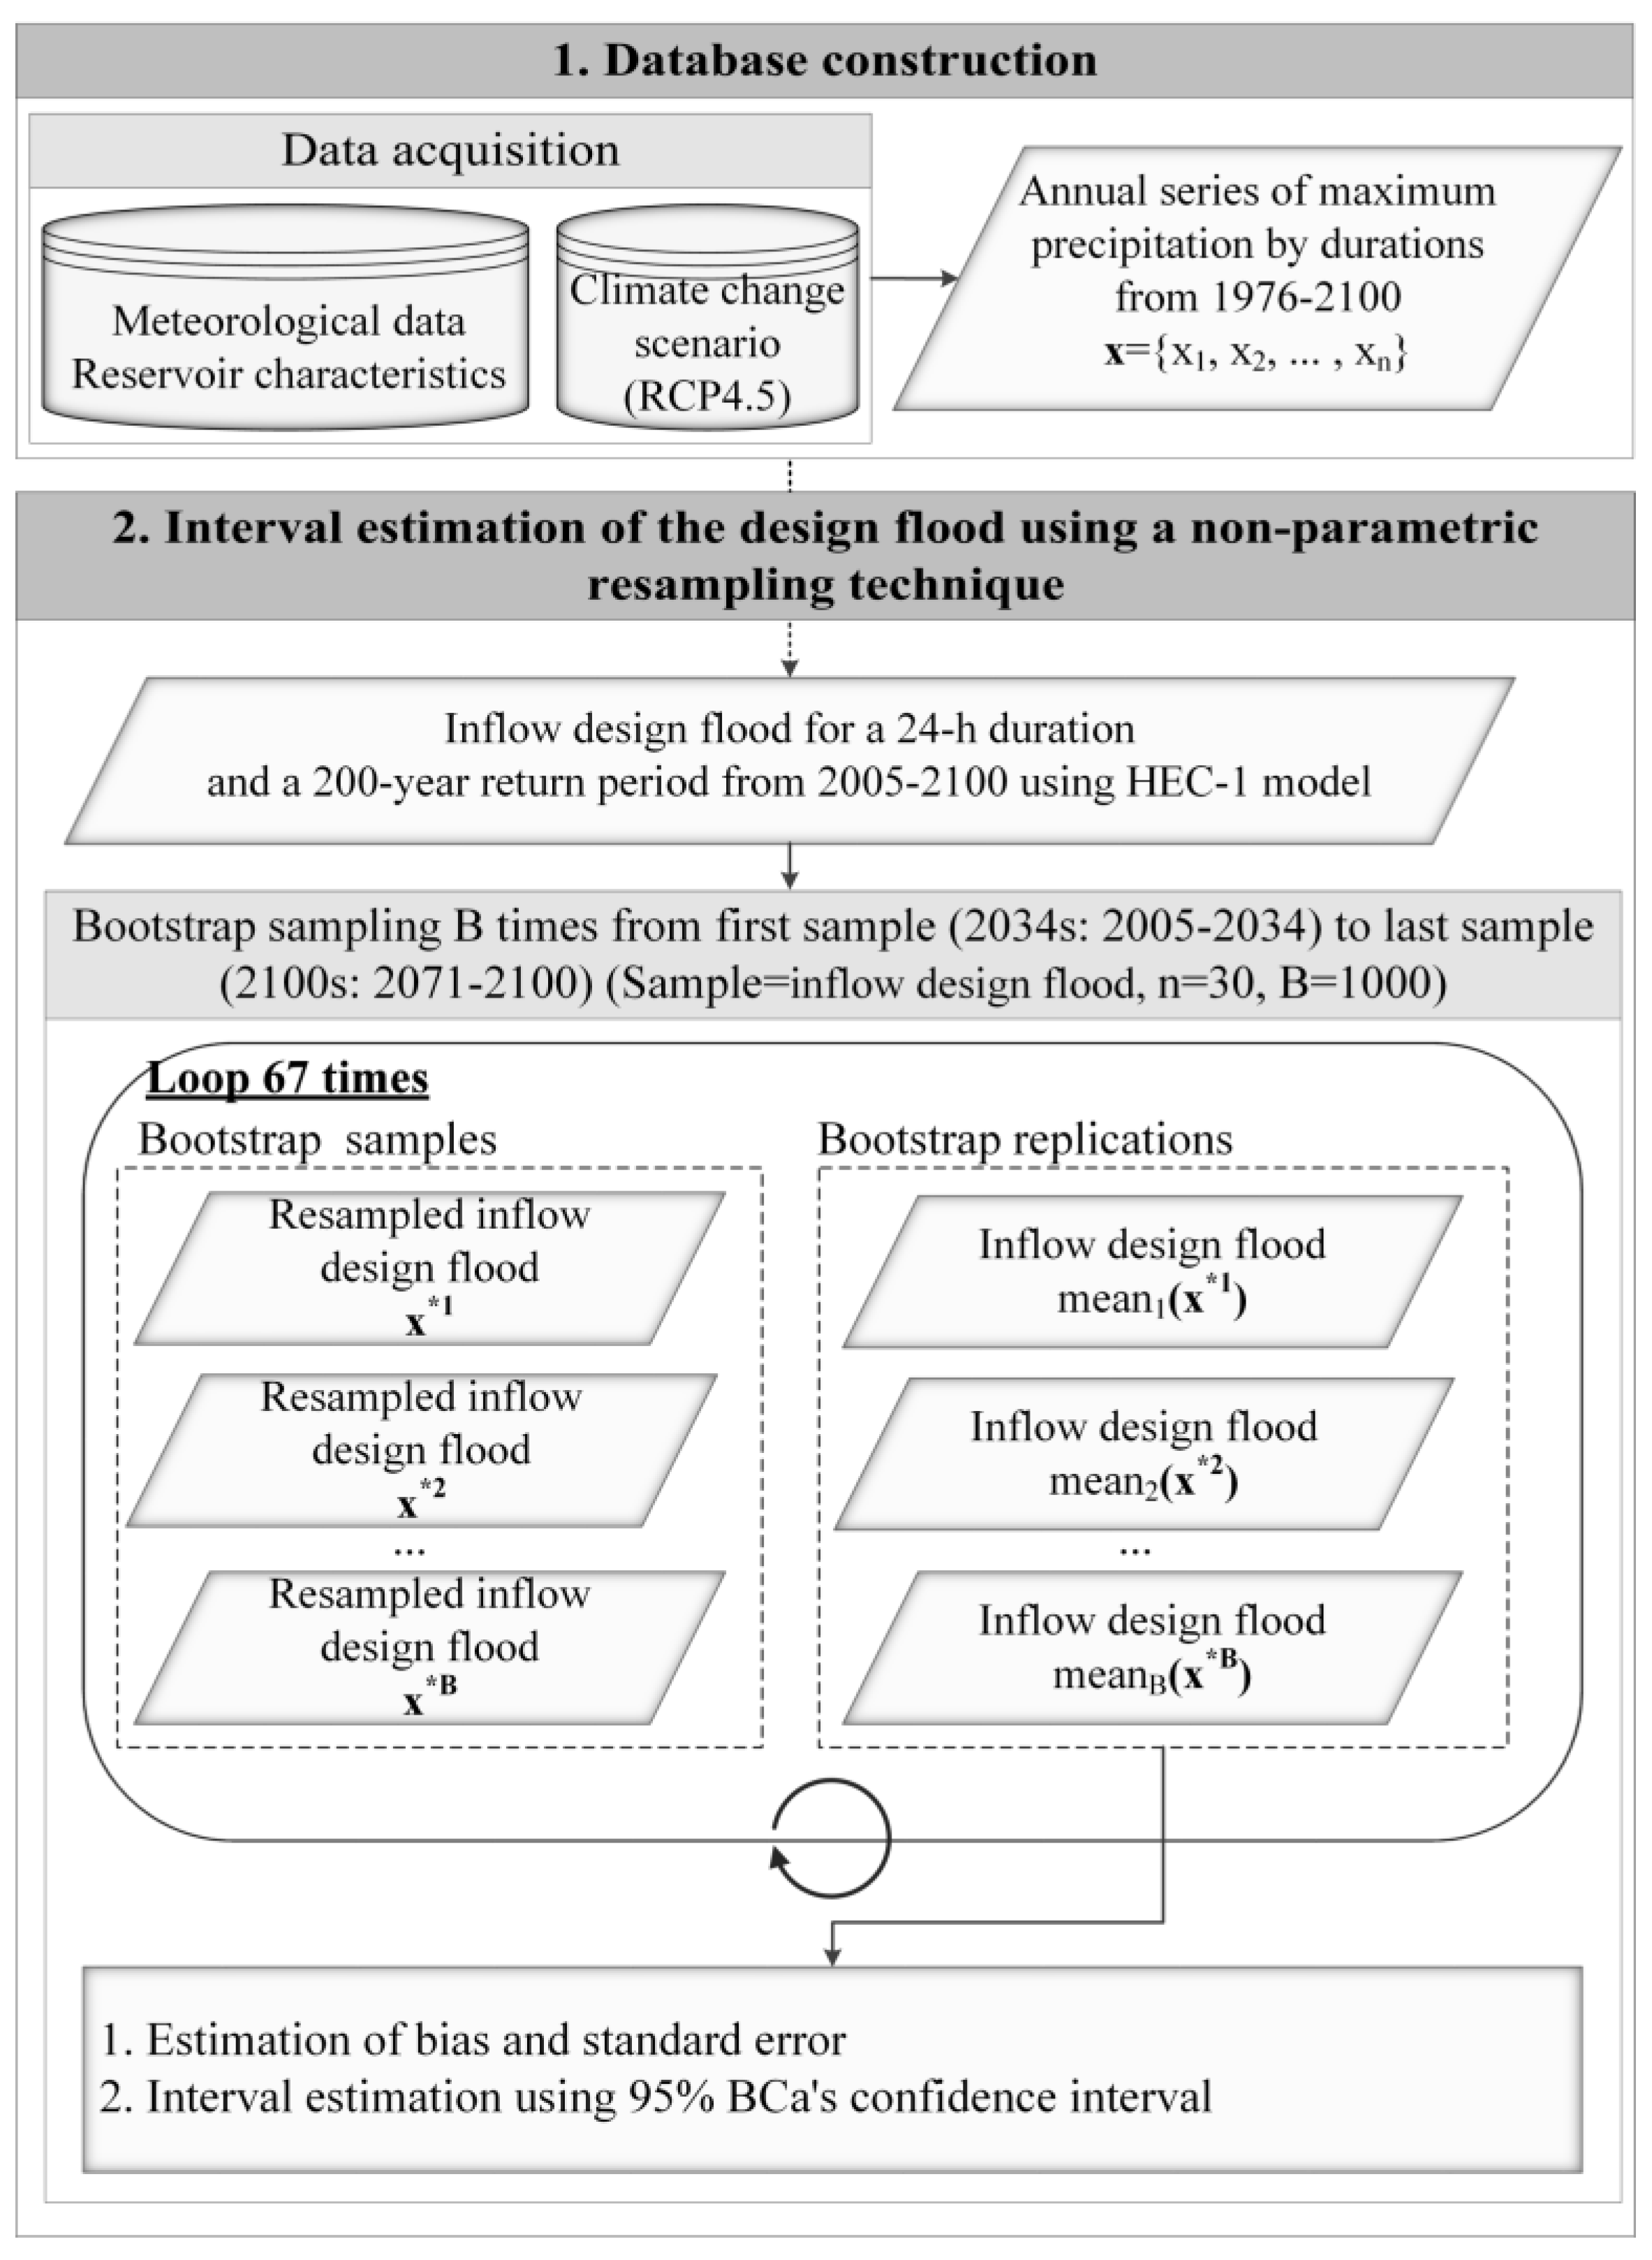
2.2. Interval Estimation of Design Flood Using a Non-Parametric Resampling Technique

2.2.1. Bootstrap Technique

Bootstrap is a non-parametric resampling method that uses the sample to represent the population probability distribution. Bootstrap treats the sample as a representation of the population probability distribution. Due to its robustness and coverage accuracy, bootstrap is often used for estimating a confidence interval. One advantage of this method is its ability to statistically infer the characteristics of the population using the statistical characteristics of the sample without assuming the probability distribution of the sample. Bootstrap uses computation-based algorithms instead of assuming a distribution [64,65].
Inference using the bootstrap technique provided a bias of θ ^ , a standard error of θ ^ , and a confidence interval of θ ^ . Equations (1) and (2) show the bias of θ ^ and the standard error of θ ^ [64]. θ ^ is the estimator of the sample, and θ ^ * is the estimator of the bootstrap sample.
bias = 1 B b = 1 B θ ^ b * θ ^
standard   error = se ^ B = 1 B 1 b = 1 B ( θ ^ b * 1 B b = 1 B θ ^ b * ) 2
The confidence interval of θ ^ can be determined using Efron′s percentile method, Hall′s percentile method, and the bias-corrected and accelerated (BCa) percentile method. In this study, the BCa percentile method was used to improve the accuracy of the correction. The BCa percentile method is effective even if the distribution of θ ^ has bias and skewness.
The BCa percentile method estimated the confidence interval of ( 1 2 α ) by estimating the lower α 1 quantile and the upper α 2 quantile. This method was used with z ^ 0 (bias-correction) and a ^ (acceleration) to improve accuracy.
Equations (3)–(7) show how to obtain the coefficients needed to estimate the confidence interval using the BCa percentile method [64].
BC a   : ( θ ^ lo , θ ^ up ) = ( θ ^ * ( α 1 ) , θ ^ * ( α 2 ) )
α 1 = Φ ( z ^ 0 + z ^ 0 + z α 1 a ^ ( z ^ 0 + z α ) )
α 2 = Φ ( z ^ 0 + z ^ 0 + z 1 α 1 a ^ ( z ^ 0 + z 1 α ) )
z ^ 0 = Φ 1 ( # ( θ ^ b * < θ ^ ) B )
a ^ = i = 1 n ( 1 n i = 1 n θ ^ i θ ^ i ) 3 6 ( i = 1 n ( 1 n i = 1 n θ ^ i θ ^ i ) 2 ) 3 / 2

2.2.2. Estimation of Probable Rainfall

The probable rainfall was calculated as follows. Weather stations were selected for each reservoir, and the maximum precipitation for each duration was calculated. The maximum precipitation for a duration was multiplied by the conversion factor of fixed- to true-interval maximum rainfall. Probable rainfall was estimated for 30 agricultural reservoir watersheds using the annual series of maximum rainfall for a 30-year period. Thus, from 2005–2100, a total of 96 probable rainfalls (2005s: 1976–2005, 2006s: 1977–2006, …, 2099s: 2070–2099, 2100s: 2071–2100) were estimated and used as input data for the inflow design flood.
The probable rainfall was calculated from 11 return periods (2, 5, 10, 20, 30, 50, 80, 100, 200, 500-y, probable maximum precipitation) and eight durations (3, 6, 9, 12, 15, 18, 21, 24-h) using frequency analysis. In this study, we analyzed the results of a 200-y return period and 24-h duration as a representative case. The frequency analysis was performed by selecting the generalized extreme value (GEV) probability distribution and estimating the parameters using the L-moment method.
The Thiessen coefficient was applied to the watersheds represented by two or more weather stations. In study areas over 25 km2, it was converted into the areal probable rainfall by applying the areal reduction factor.

2.2.3. Estimation of Inflow Design Flood

The inflow design flood was estimated using the HEC-1 model, a rainfall–runoff model developed by the US Army Corps of Engineers. The HEC-1 model is a conceptual model developed to simulate the rainfall–runoff process in the watersheds. The rainfall–runoff process of HEC-1 creates a hydrograph consisting of rainfall, blockage, and infiltration unit-hydrograph. The physical relationship of each process is expressed as a mathematical relationship [66]. In this study, the inflow design flood was estimated by applying the Huff third quartile distribution [67] to the probable rainfall and using the Clark unit-hydrograph method [68] for durations for each of the 30 agricultural reservoir watersheds from 2005–2100.

2.2.4. Interval Estimation of Inflow Design Flood Using the Bootstrap Technique

The bootstrap technique was employed to perform data resampling for the interval estimation of the inflow design flood. The inflow design flood was set as the bootstrap sample for durations from 2005–2100 for the 30 agricultural reservoir watersheds. The sample size was set to 30, and the bootstrap sample number was set to 1000. The estimator of the sample was set as the mean. The inflow design flood was calculated using a total of 96 probable rainfalls from 2005–2100. Because the sample size was set to 30, the bootstrap inference can be estimated from 2034s–2100s (2034s: 2005–2034, 2035s: 2006–2035, …, 2099s: 2070–2099, 2100s: 2071–2100). In this study, we analyzed the bootstrap inference results for three representative periods: 2040s: 2011–2040, 2070s: 2041–2070, and 2100s: 2071–2100. The bootstrap inference resulted in the estimate, bias, standard error, and confidence interval of the inflow design flood of the sample.
The overall procedure of the interval estimation of the inflow design flood using the bootstrap technique is as follows:
  • Select B independent bootstrap samples x * 1 , x * 2 , , x * B , each consisting of n data values drawn with replacement from x . The sample is the inflow design flood for a 24-h duration and a 200-y return period, the number of bootstrap samples (B) is 1000, and the sample size (n) is 30.
  • Evaluate the bootstrap replication corresponding to each bootstrap sample, θ ^ * ( b ) = s ( x * b ) ,   where   b = 1 , 2 , , B . s ( · ) is the mean of the bootstrap data set.
  • Estimate the bias and standard error using Equations (1) and (2).
  • Estimate the range of the inflow design flood BC a : ( θ ^ lo , θ ^ up ) = ( θ ^ * ( α 1 ) , θ ^ * ( α 2 ) ) using the BCa percentile method (Equations (3)–(7)). The confidence level is 95%.
  • The first sample is the inflow design floods from 2034s (2005–2034). Repeat 1–4 until the last sample 2100s (2071–2100).

3. Results and Discussion

3.1. Bias-Corrected Climate Change Scenario

The box plots of the past and future climate change simulations are shown in Figure 3 as median, maximum, minimum, and quartile values for the 30 selected agricultural reservoir watersheds over the calibration period. In the box plot, the dotted line shows the average, whereas the solid line indicates the median. In Figure 3a, the 30-year average annual precipitation of all observed values was 1251.7 mm, and the simulated values before and after the bias-correction were 1102.3 mm and 1235.4 mm, respectively. The simulated value before the bias-correction was 11.9% smaller than the observed value, and the variance was large. The average and variance improved significantly compared with before the bias-correction. In Figure 3b, the average annual precipitations before and after the correction were 1142.0 mm and 1402.4 mm, respectively. The simulated value after the bias-correction increased by 22.8% compared with the value before the bias-correction, and the variance after the bias-correction became smaller before the bias-correction. Figure 4 displays the past 30-year (1976–2005) average annual maximum precipitation for four durations (3, 6, 12, and 24-h) for 30 agricultural reservoir watersheds. The average and variance improved significantly compared with before the bias-correction for the three and six-hour duration results.

3.2. Estimation Result of Probable Rainfall

The probable rainfalls for the four selected durations (3, 6, 12, 24-h) of a 200-y return period for two periods (2015s and 2100s) are shown in Table 2 and Figure 5 for the agricultural reservoir watersheds. The average probable rainfalls for 30 agricultural reservoir watersheds for the four selected durations and a 200-y return period for 2100s increased by 42.0%, 86.8%, 104.8%, and 124.2%, respectively, compared with the probable rainfall estimated for 2015s. Some agricultural reservoirs decreased based on the 3-h duration, but overall increased significantly based on the 24-h duration.

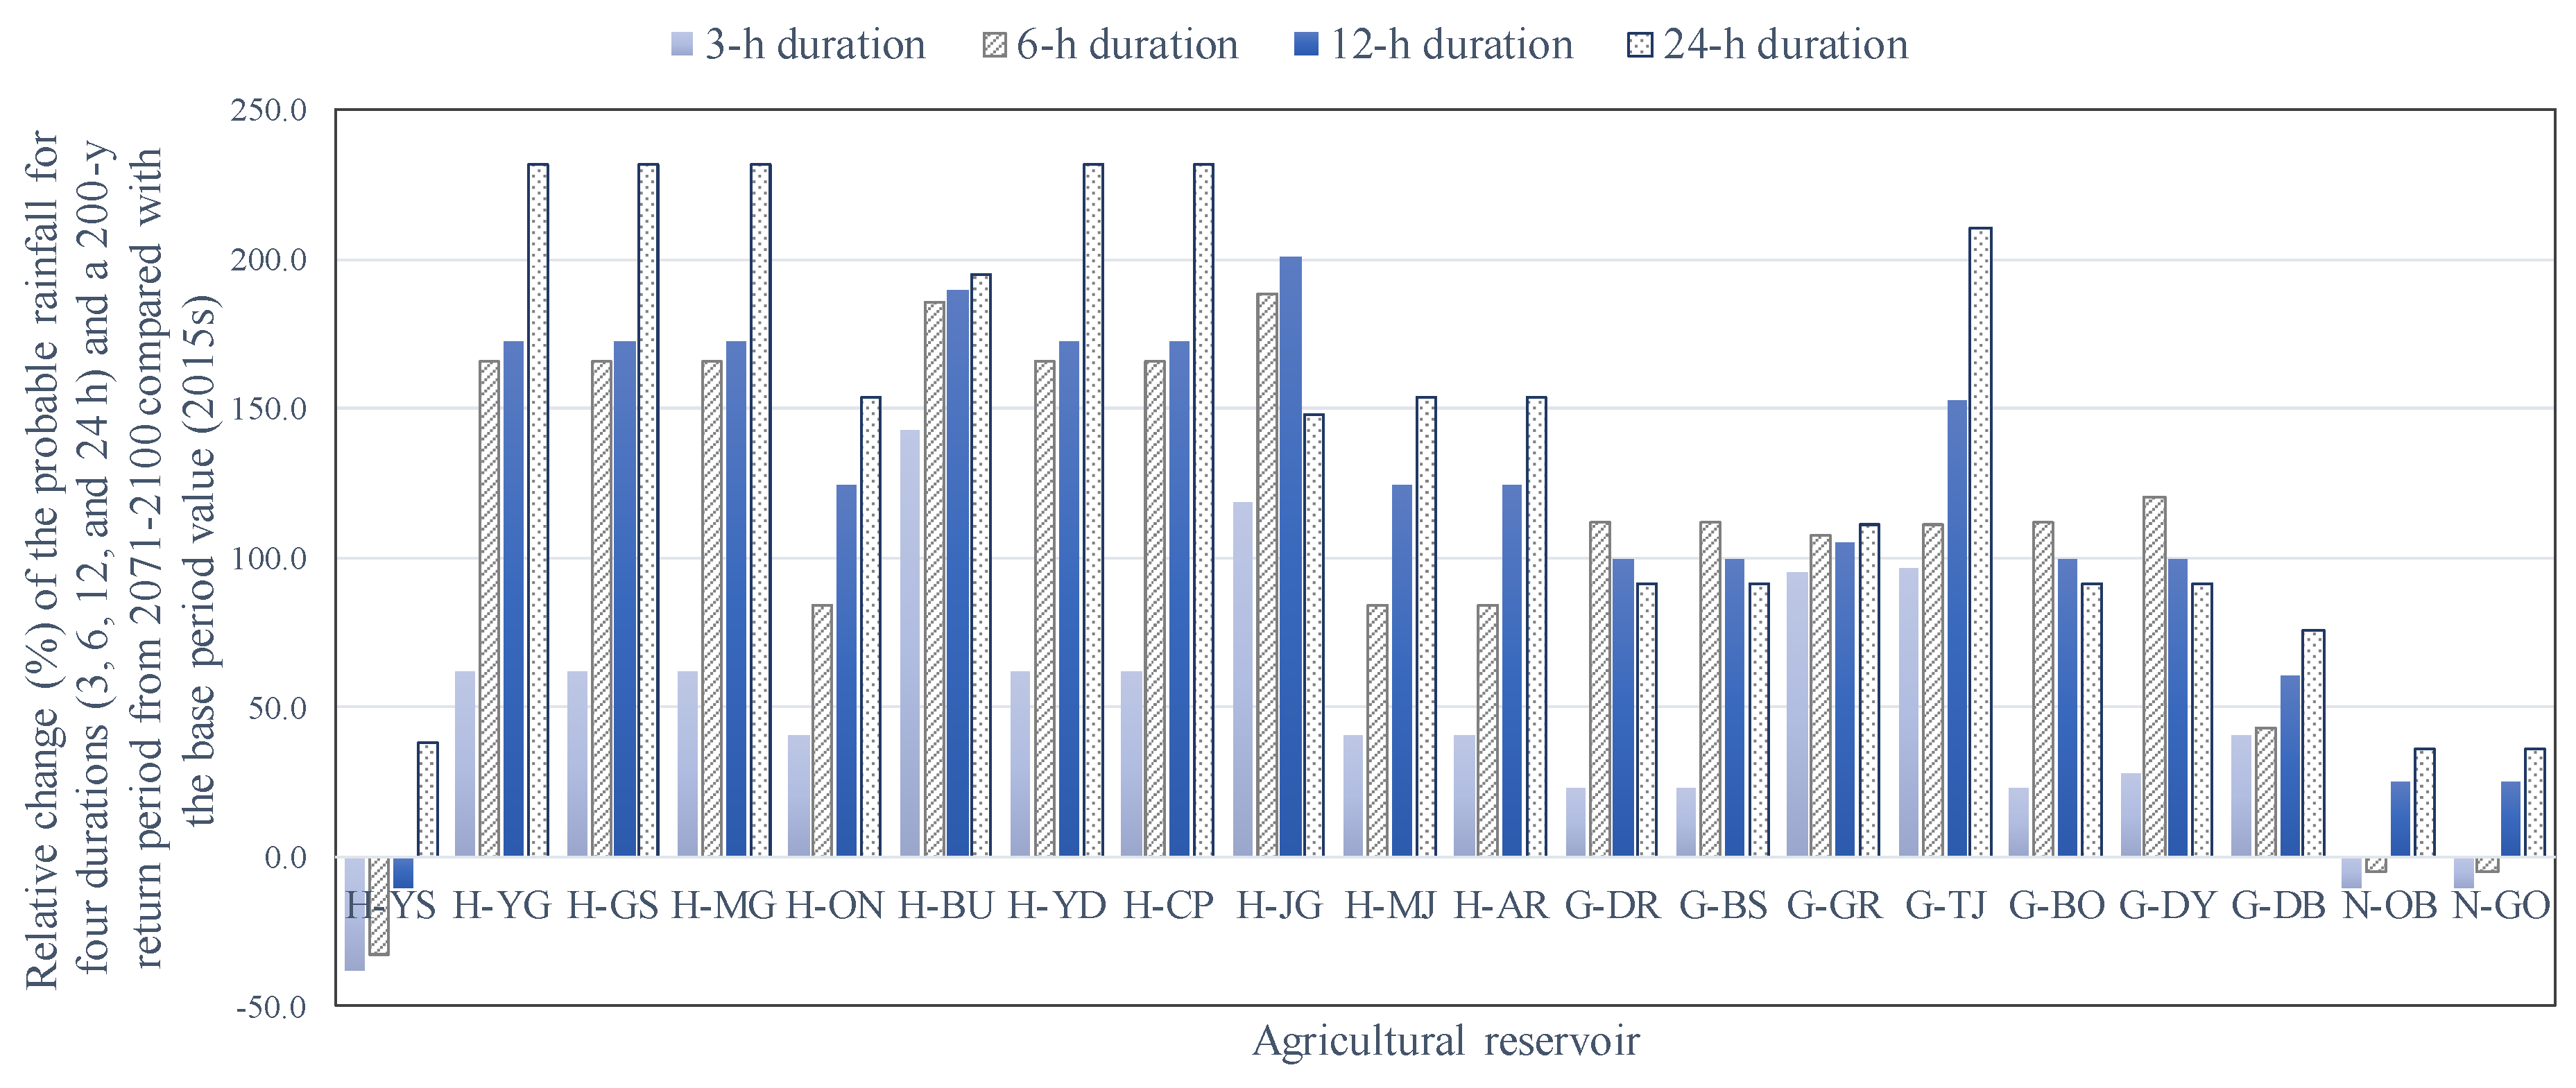
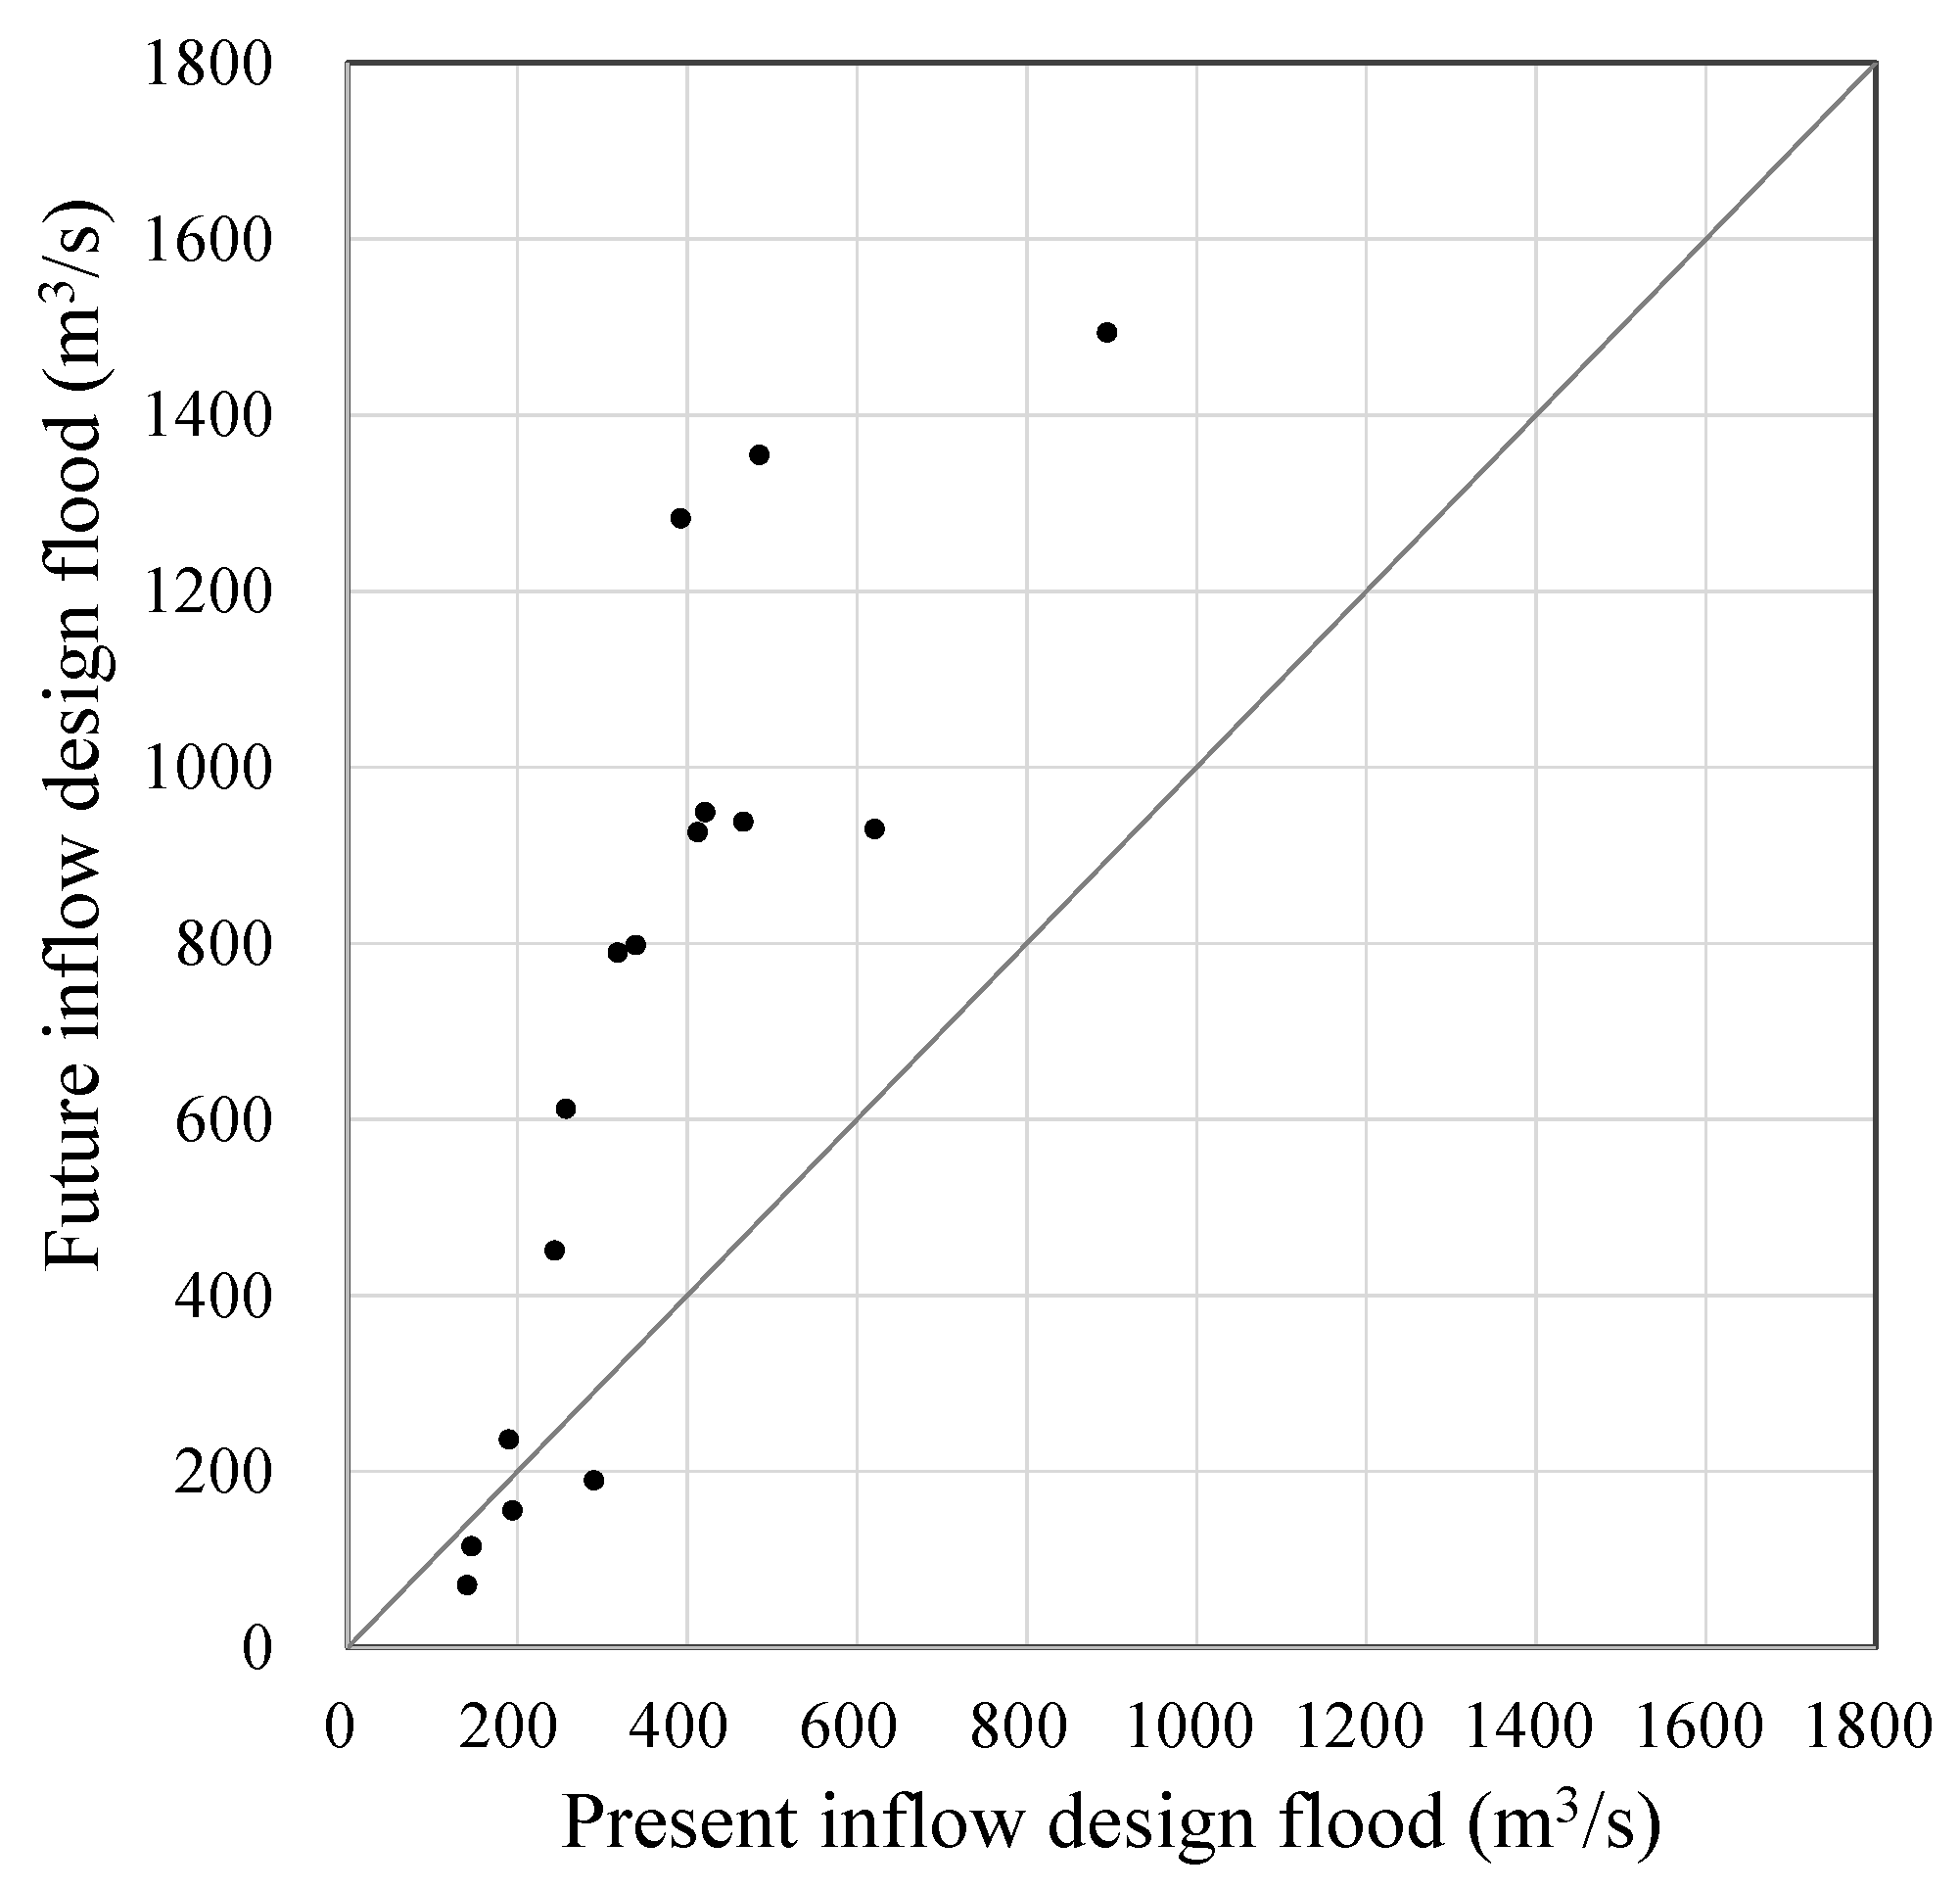
3.3. Change in Design Flood Due to Climate Change

Most of the agricultural reservoirs selected in this study were built decades ago; thus, it is necessary to check how much the inflow design flood has changed based on the current standard and will change in the future. In this section, the analysis of the design flood change due to changes in rainfall was described using a scatter plot. A comparison between the inflow design flood at the time of design and the re-estimated inflow design flood based on 2015 data for a 200-y return period for the 30 agricultural reservoir watersheds is shown in Figure 6. The safety factor (1.2 times), which is the standard in South Korea, was applied to the re-estimated inflow design.
Most of the re-estimated inflow design floods were similar or larger than the design flood based on design year. Generally, there seemed to be a slight increase in the inflow design flood except for a few agricultural reservoirs.
A comparison of the inflow design flood at the time of design for 30 agricultural reservoir watersheds and the inflow design flood based on 2015 data and future period (2100s) is shown in Figure 7. The inflow design flood tended to increase remarkably over time. It is needed to reflect the future increase and variability under climate change.

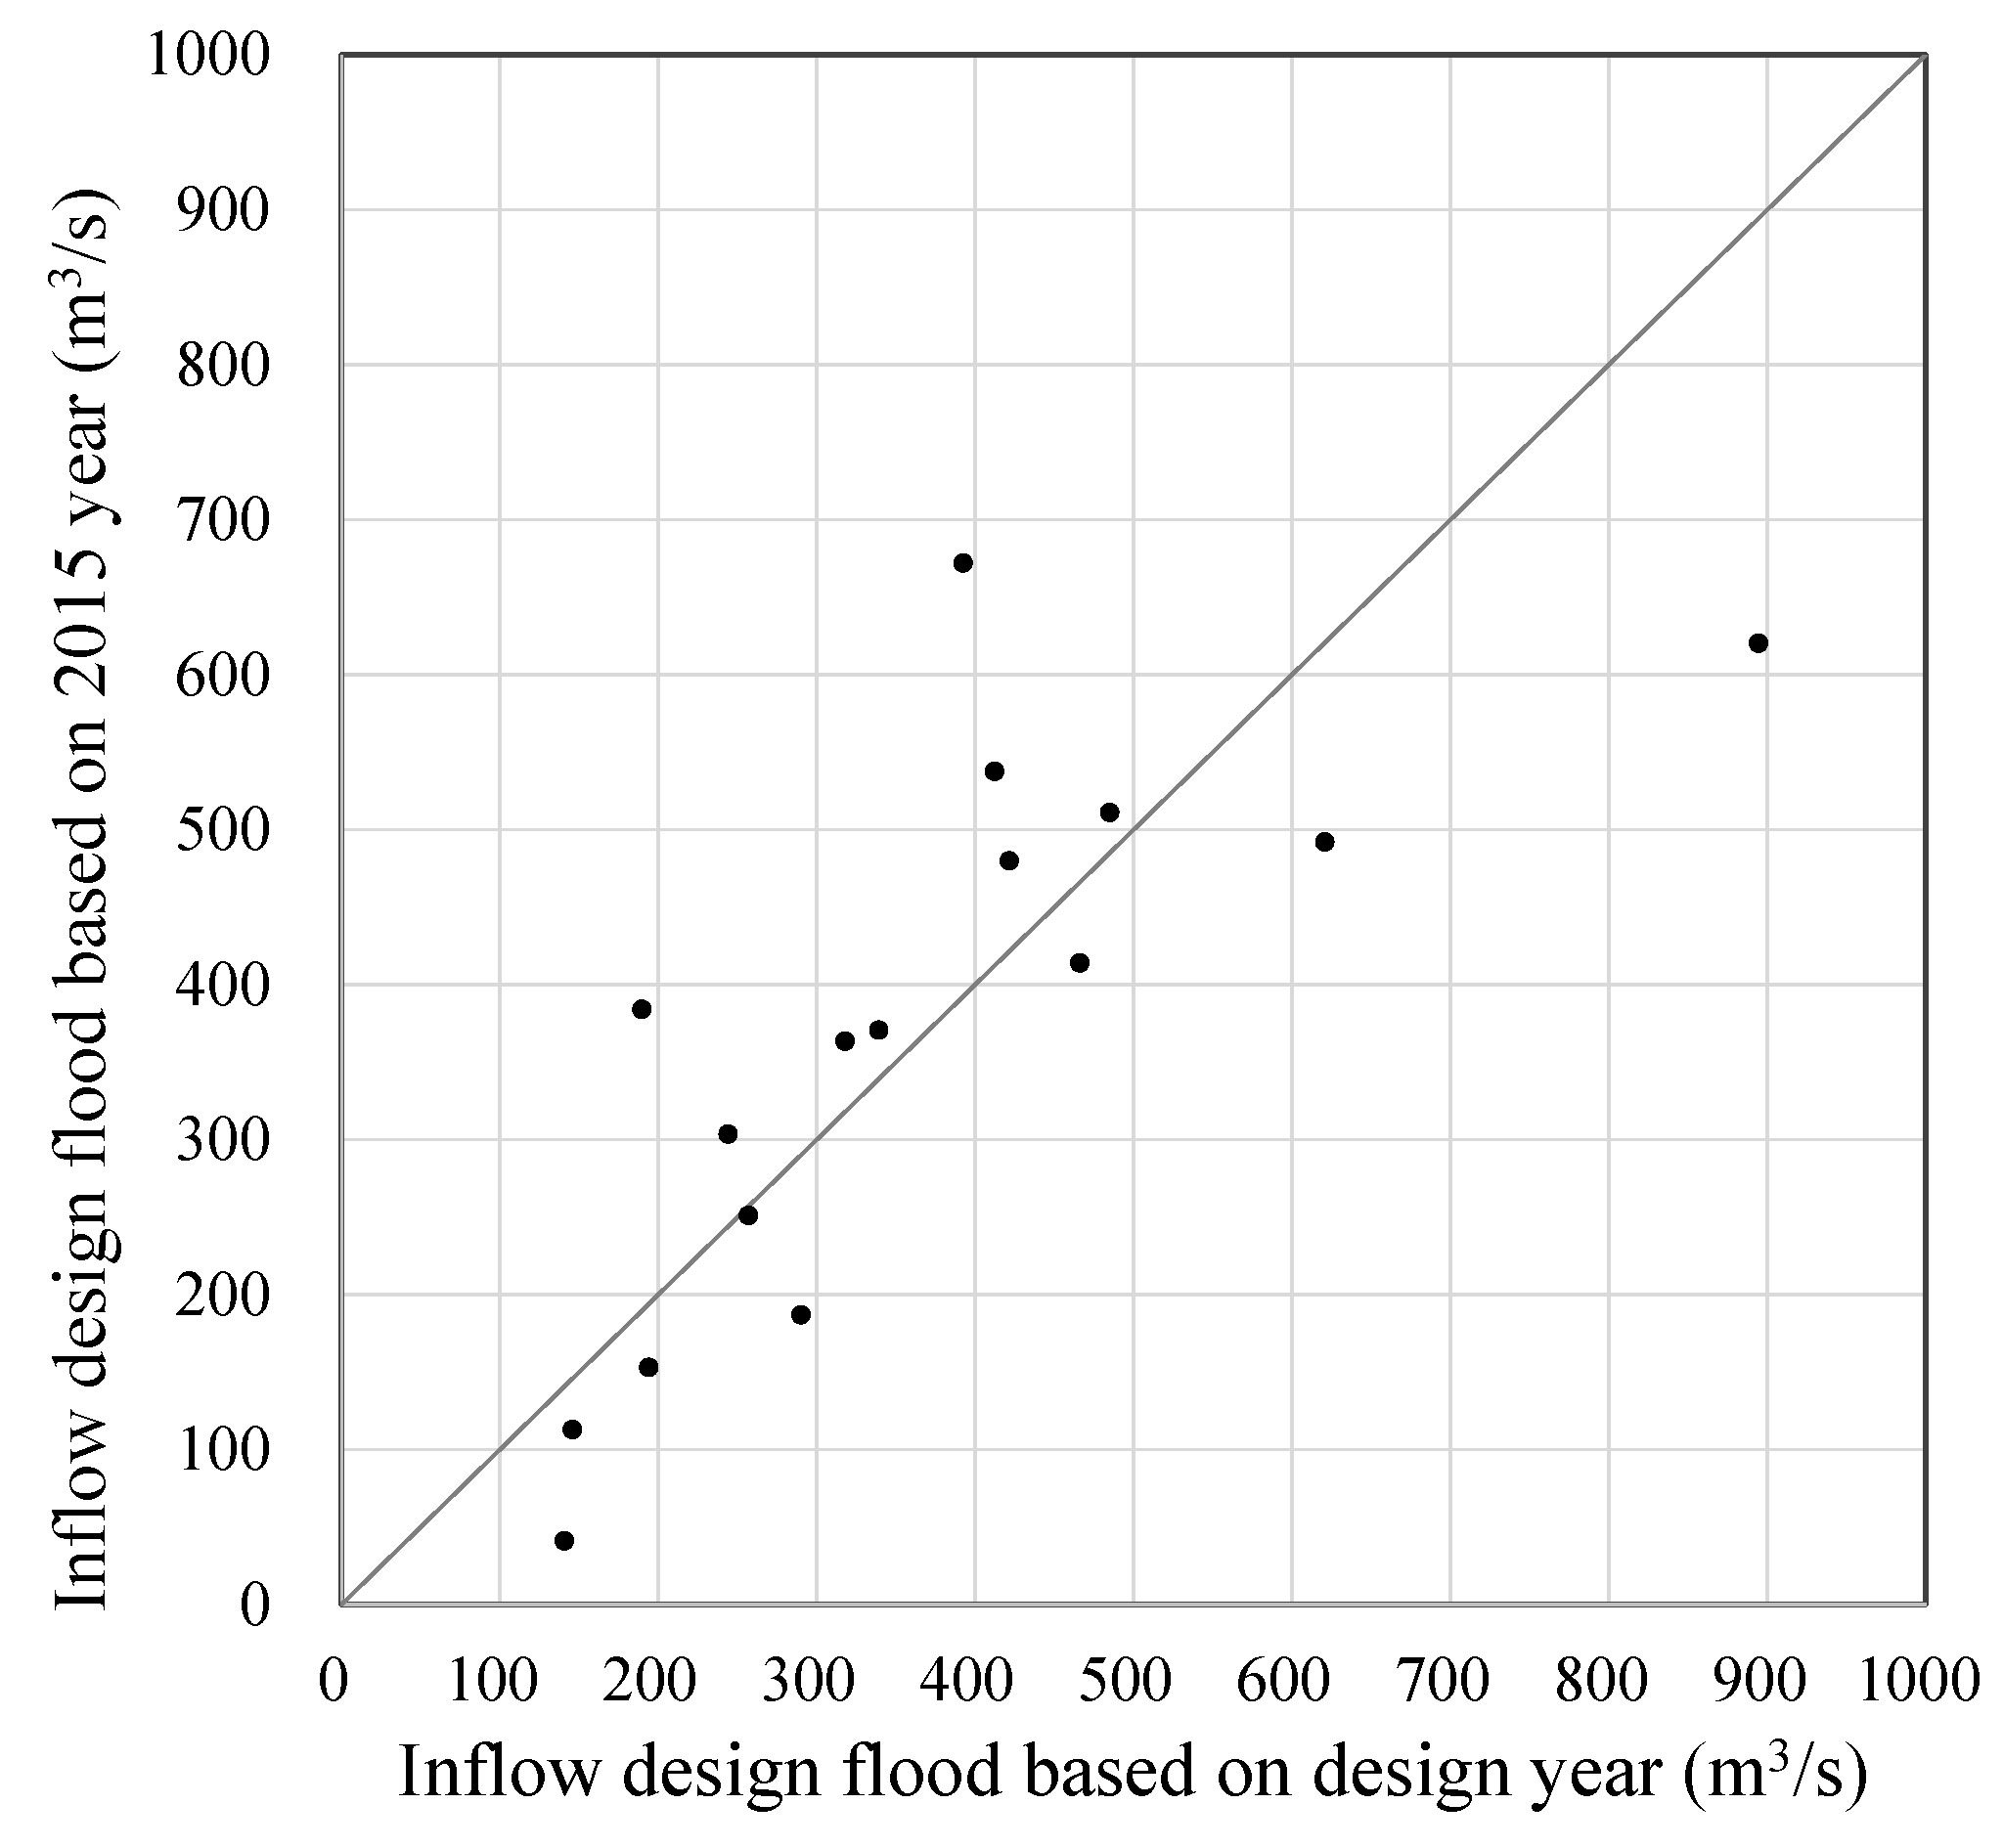
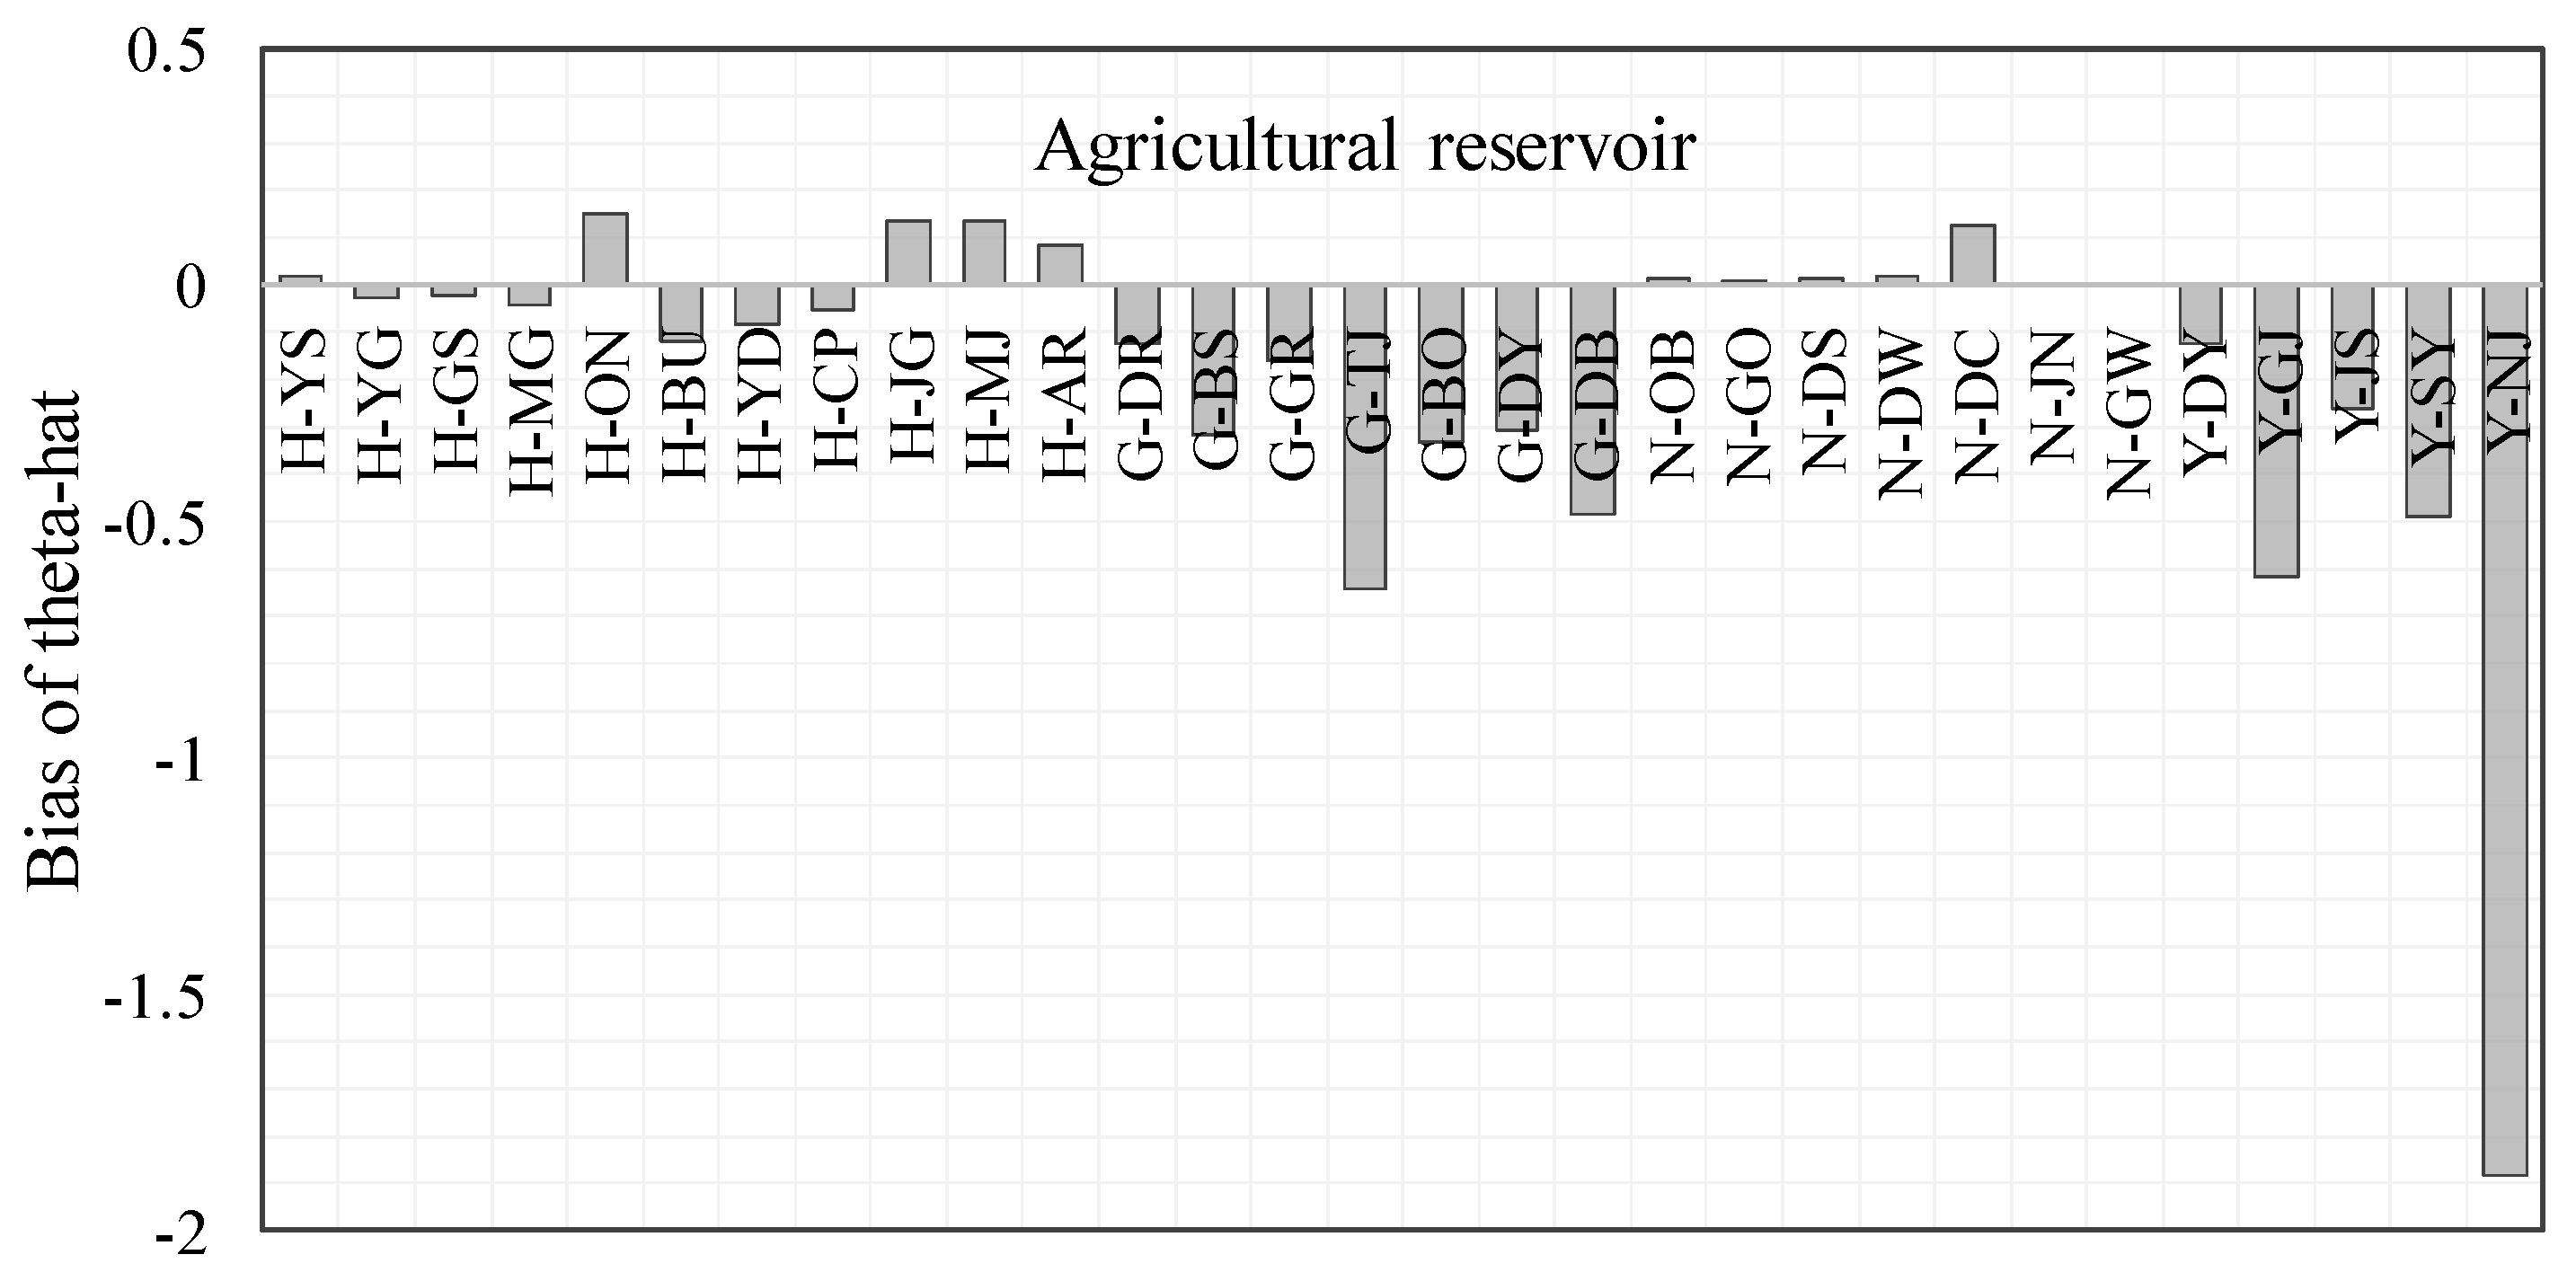
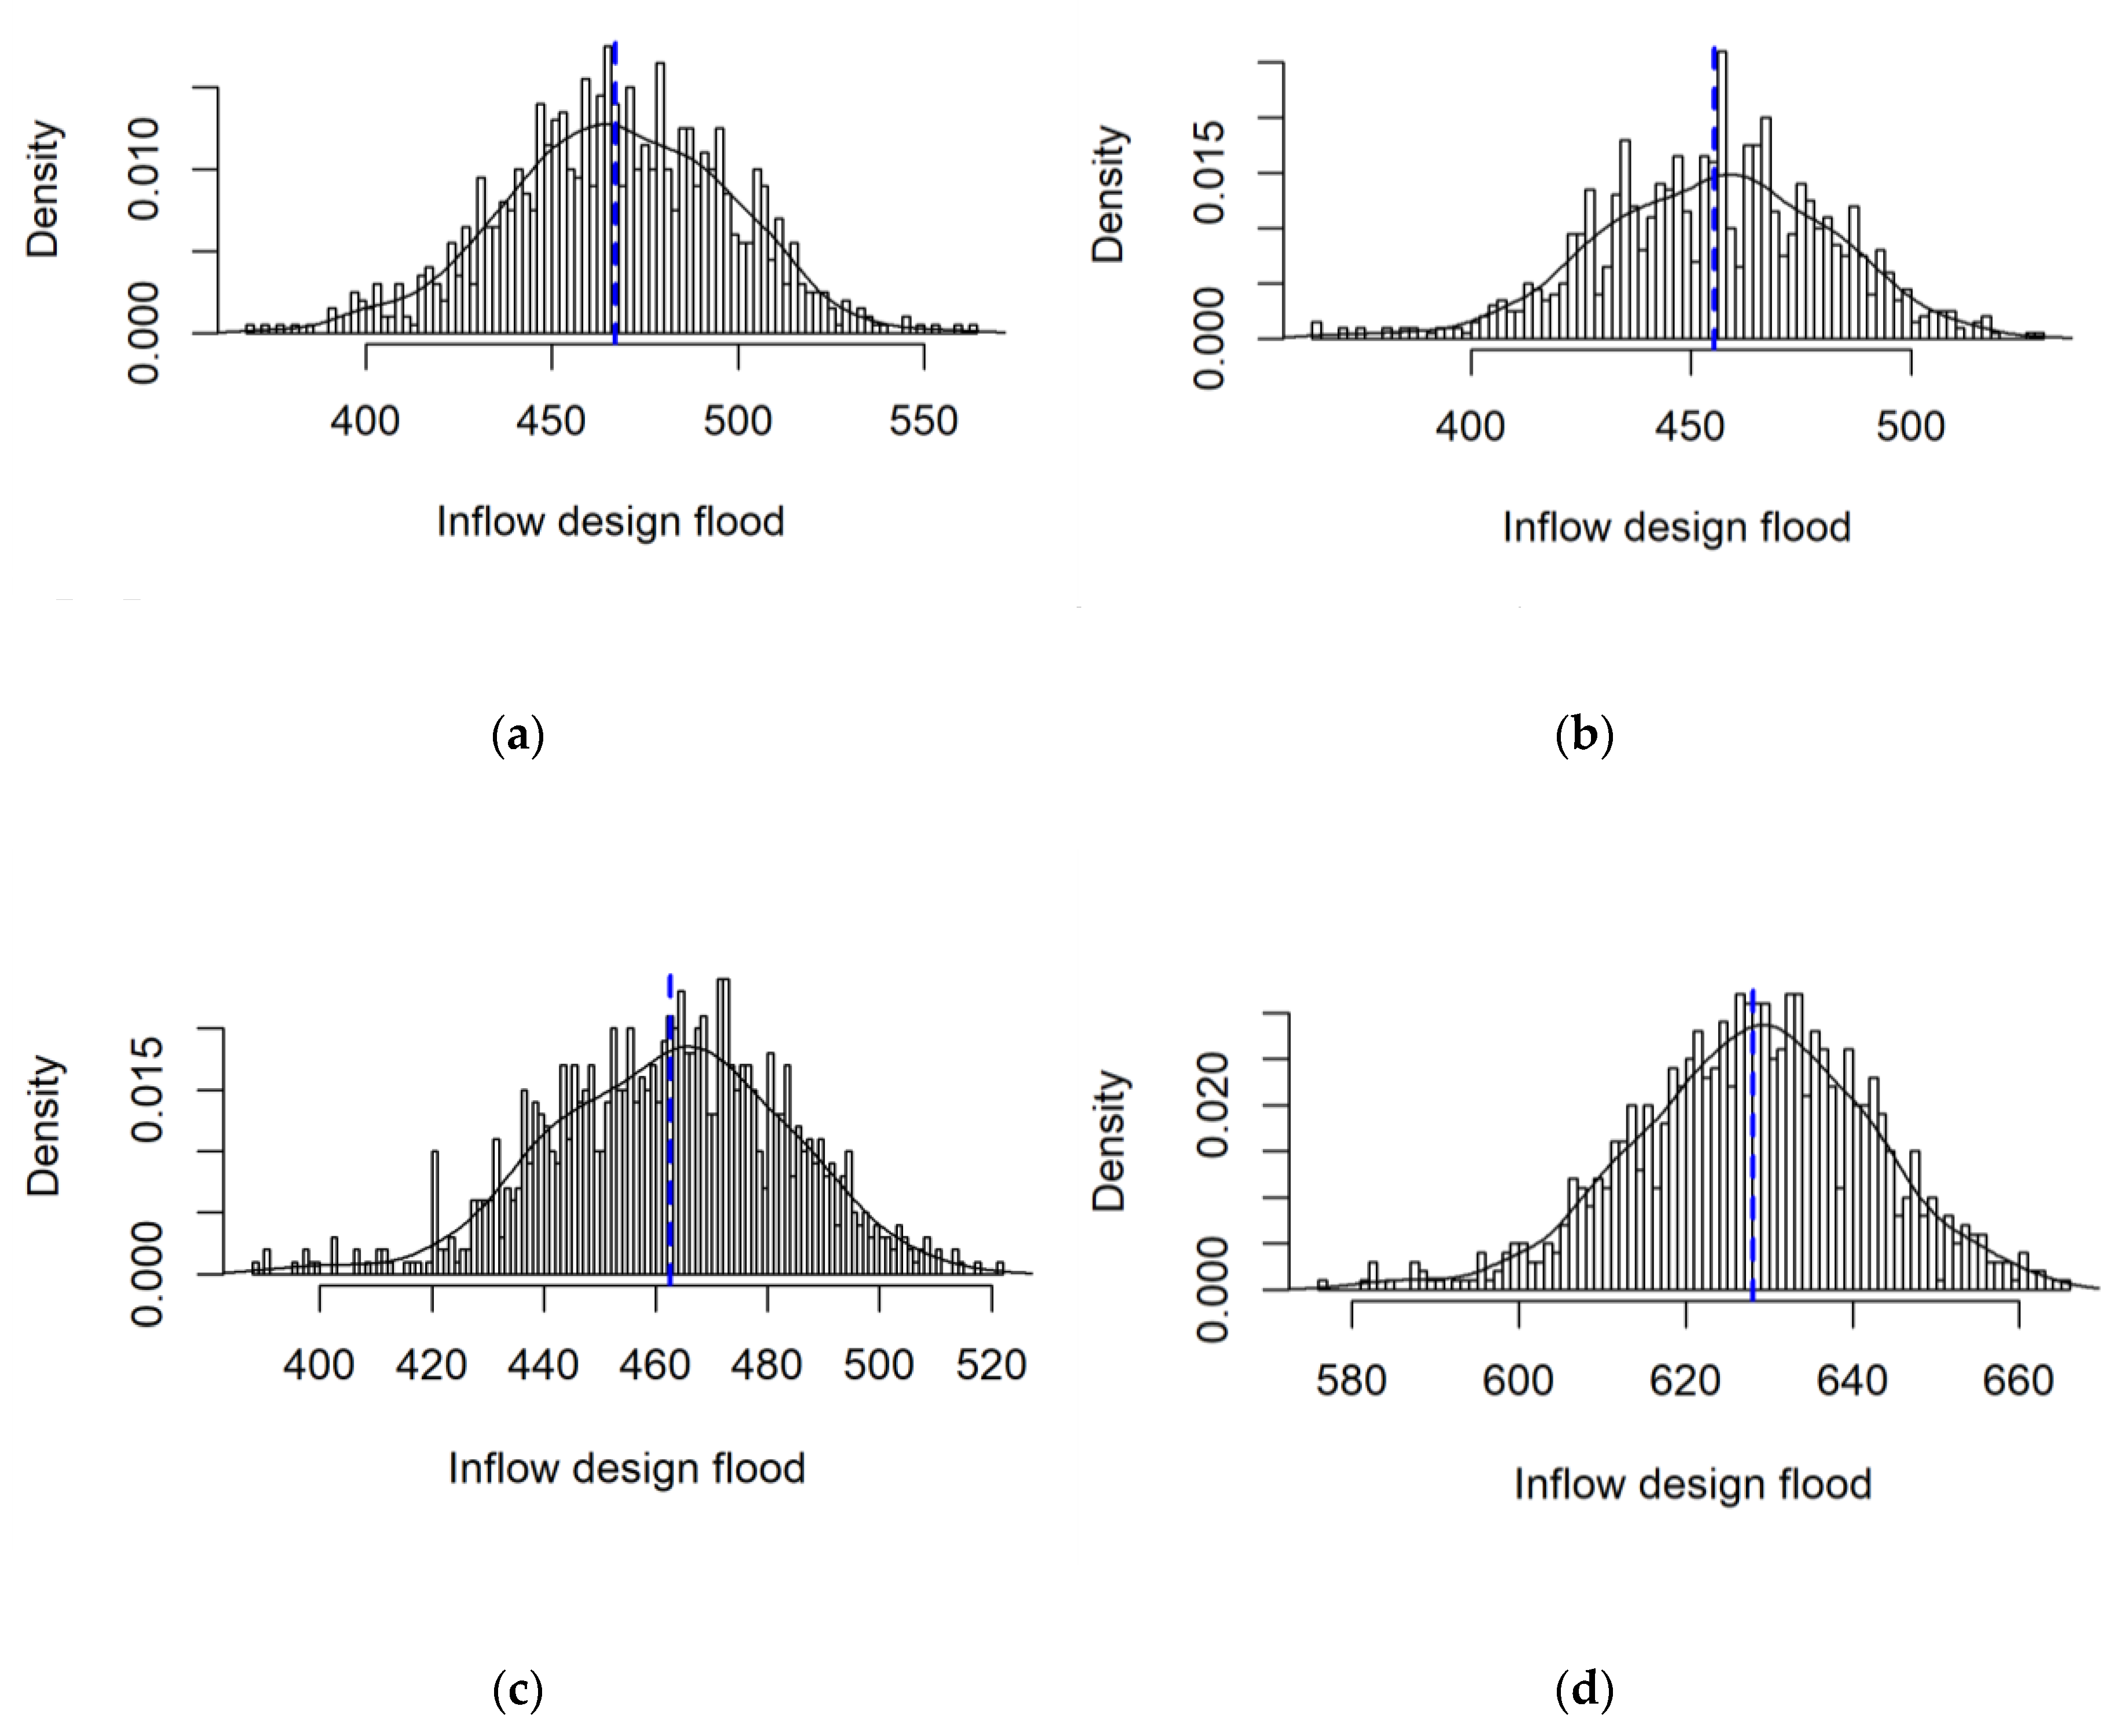
3.4. Bootstrap Result of Inflow Design Flood

The confidence interval of the inflow design flood was estimated using the resampled data from the bootstrap technique. The sample ( F ^ ) to which the bootstrap was applied was selected as the inflow design flood for a 24-h duration and a 200-y return period, and the estimator ( θ ^ ) of the sample was selected as the mean.
Table 3 shows the bootstrap inference results for a 24-h duration and a 200-y return period for 2040s under the RCP4.5 scenario for 30 agricultural reservoir watersheds. The original of θ ^ , the bias of θ ^ , and the standard error of θ ^ for 2040s are summarized for the 30 agricultural reservoir watersheds. The results of z ^ 0 , a constant for correcting the bias of the re-extracted sample, and a ^ , a constant for correcting the skewness of the re-extracted sample, were summarized. These two values were used to estimate the confidence interval with the BCa percentile method.
Figure 8 and Figure 9 show the bias and standard error of θ ^ for a 24-h duration and a 200-y return period for 2040s under the RCP4.5 scenario for 30 agricultural reservoir watersheds. The average bias of the 30 agricultural reservoir watersheds was −0.1788 m3/s, and the overall bias was small, except for several agricultural reservoirs in Geum and Yeongsan River basins. The standard errors of the Han River-Yongdang (H-YD), Geum River-Tapjeong (G-TJ), Yeongsan River-Jangseong (Y-JS), and Yeongsan River-Naju (Y-NJ) reservoirs were estimated to be the largest. The Y-NJ reservoir showed the largest variability of the 30 agricultural reservoirs.
Figure 10 presents the bootstrap histogram of the inflow design flood for a 24-h duration and a 200-y return period during S1 (2011–2040) under the RCP4.5 scenario. Han River-Onam (H-ON), Geum River-Boksim (G-BO), Geum River-Dongbu (G-DB), and Yeongsan River-Damyang (Y-DY) reservoirs were selected as representatives. It can be seen that the distribution of the four reservoirs was not completely symmetrical, so the estimation of the confidence interval with the BCa percentile method was necessary.

3.5. Interval Estimation of Inflow Design Flood Using BCa Confidence Interval Considering Climate Change

The interval estimation of the inflow design flood using the BCa confidence interval considering climate change was performed. The confidence interval was estimated using the resampled data by the bootstrap technique. The interval of inflow design flood for a 24-h duration and a 200-y return period for three periods (2040s, 2070s, and 2100s) under the RCP4.5 scenario for 30 agricultural reservoir watersheds is presented in Table 4. The inflow design flood with the safety factor applied, which was 1.2 times the design flood estimated based on 2015s (1986–2015), are presented. The inflow design flood with the safety factor applied meets the current design flood criteria for agricultural reservoirs. The confidence level of 95% was selected, which is commonly used in hydrology. For the 97.5th BCa percentile value, it could be seen that as the future period approached, the overall inflow design floods were larger than the base period value (2015s) with the safety factor applied.
Figure 11 represents the relative change (%) of 97.5th BCa percentile of the inflow design flood bootstrap sampling distribution compared with the base period value (2015s) with the safety factor applied. Generally, the inflow design flood increased as the 2100s period approached. Han River and Geum River basins showed relatively higher changes than the Nakdong River basin. Some agricultural reservoirs (H-YS: Han River-Yongseol, N-OB: Nakdong River-Obong, N-GO: Nakdong River-Geumo, N-DS: Nakdong River-Daeseong, N-JN: Nakdong River-Junam, and N-GW: Nakdong River-Gawol) showed a decrease in the design flood during 2040s but generally increased after 2070s. Most of these agricultural reservoirs were located in the Nakdong River basin. The inflow design flood for agricultural reservoirs in the Nakdong River basin did not appear to increase remarkably compared to other basins.
It may seem easier to select the maximum value among the inflow design floods from 2034s–2100s for determining the proper inflow design flood based on climate change, however depending on a policy, it may be necessary to analyze the impact of the near future or the distant future. Additionally, it may be unreasonable to adopt the maximum design criteria when considering financial health. That is why we selected three representative periods: 2040s, 2070s, 2100s. By presenting the results for three periods, we provided information to select according to the period. Through the non-parametric resampling technique, the interval estimation was provided considering the uncertainty of the inflow design flood.

4. Conclusions

This study performed the interval estimation of the inflow design flood using a non-parametric resampling technique for agricultural reservoirs in South Korea under climate change. This study suggested an alternative method to point estimation using insufficient past data by providing the interval of the inflow design flood under climate change. To estimate the interval of the inflow design flood, we employed the bootstrap technique. The bootstrap inference, which approximately calculated the estimates, bias, standard errors of the sample, and estimated the confidence interval corresponding to the 95% confidence level, was performed using 1000 bootstrap replications.
The study area of this study was the watersheds of 30 agricultural reservoirs in South Korea. For future climate projection, we used the RCP4.5 scenario, and we analyzed the bootstrap inference results for three representative periods: 2040s (2011–2040), 2070s (2041–2070), and 2100s (2071–2100). The probable rainfall for a 200-y return period and 24-h duration was calculated using frequency analysis. The frequency analysis was performed by selecting the GEV probability distribution and estimating the parameters using the L-moment method. The inflow design flood was estimated using the HEC-1 model.
Most of the re-estimated inflow design flood considering current climate systems were similar or large than the design flood based on design year. However, the inflow design floods of some agricultural reservoirs were increased sharply. The inflow design flood tended to increase remarkably in the future.
The interval estimation results of the design flood in this study were compared with the current design criteria, which is to use the 1.2 times probable flood for a 200-year return period for fill dams. Based on the relative change (%) of the 97.5th BCa percentile of the inflow design flood bootstrap sampling distribution compared with the base period value (2015s) with the safety factor applied, the inflow design flood increased as 2100s period approached. Han River and Geum River basins showed relatively greater changes than Nakdong River basin. Some agricultural reservoirs (H-YS: Han River-Yongseol, N-OB: Nakdong River-Obong, N-GO: Nakdong River-Geumo, N-DS: Nakdong River-Daeseong, N-JN: Nakdong River-Junam, and N-GW: Nakdong River-Gawol) showed a decrease in the design flood during 2040s, but generally increased after 2070s. The inflow design flood for agricultural reservoirs in the Nakdong River basin did not appear to increase remarkably.
The findings provided the inflow design flood interval according to the period of interest of policymakers and designers. Additionally, the findings suggested the inflow design flood interval for agricultural reservoirs in South Korea, taking into account changes in future rainfall. Because it provides regional results for South Korea, decision-makers could use it as a reference for future agricultural reservoir management plans. We propose that policymakers first select the future target period of the agricultural reservoir and then determine the final inflow design flood by considering the interval estimation result. This study may provide an essential step towards replacing the concept of a safety factor used in determining the design flood in agricultural reservoirs by proposing replacement with confidence intervals produced considering statistical characteristics. In a future study, we plan to estimate and analyze the inflow design flood for different RCP scenarios. Also, we plan to estimate the outflow design flood interval considering the operation of agricultural using the method proposed in this study.

Author Contributions

J.P. developed the method for estimating the design flood and prepared the manuscript. M.-S.K. supervised the research and revised the manuscript along with S.H. S.H. contributed to establish the methodology. J.-H.S. analyzed results. All authors have read and agreed to the published version of the manuscript.

Funding

This work was supported by the National Research Foundation of Korea (NRF) grant, funded by the Korean government (MSIP) (No. 2015R1A2A2A01008152).

Conflicts of Interest

The authors declare no conflict of interest.

References

  1. Stocker, T.F.; Qin, D.; Plattner, G.K.; Tignor, M.; Allen, S.K.; Boschung, J.; Nauels, A.; Xia, Y.; Bex, V. Contribution of Working Group I to the Fifth Assessment Report of the Intergovernmental Panel on Climate Change. In IPCC, 2013: Climate Change 2013: The Physical Science Basis; Midgley, P.M., Ed.; Cambridge University Press: Cambridge, UK; New York, NY, USA, 2013. [Google Scholar]
  2. Pachauri, R.K. Contribution of Working Groups I, II and III to the Fifth Assessment Report of the Intergovernmental Panel on Climate Change. In IPCC, 2014: Climate Change 2014: Synthesis Report; Meyer, L.A., Ed.; IPCC: Geneva, Switzerland, 2014. [Google Scholar]
  3. United Nations Office for Disaster Risk Reduction (UNDRR). Available online: https://www.undrr.org (accessed on 20 January 2019).
  4. Ministry of Public Safety and Security (MPSS). Disaster Annual Report; MPSS: Seoul, Korea, 2014.
  5. Korea Meteorological Administration (KMA). Korea Peninsula Climate Change Projection Analysis; KMA: Seoul, Korea, 2018. [Google Scholar]
  6. Ministry of Agriculture, Food and Rural Affairs and Korea Rural Community Corporation (MAFRA and KRC). Statistical Yearbook of Land and Water Development for Agriculture. 2019. Available online: http://rawris.ekr.or.kr/stastics/pdf/2018.pdf (accessed on 25 August 2019).
  7. Smithers, J. Methods for design flood estimation in South Africa. Water SA 2012, 38, 633–646. [Google Scholar] [CrossRef] [Green Version]
  8. Kang, M.S.; Goo, J.H.; Song, I.; Chun, J.A.; Her, Y.G.; Hwang, S.W.; Park, S.W. Estimating design floods based on the critical storm duration for small watersheds. J. Hydro-Environ. Res. 2013, 7, 209–218. [Google Scholar] [CrossRef]
  9. Faulkner, D.; Warren, S.; Burn, D. Design floods for all of Canada. Can. Water Resour. J. 2016, 41, 398–411. [Google Scholar] [CrossRef]
  10. Gioia, A. Reservoir Routing on Double-Peak Design Flood. Water 2016, 8, 553. [Google Scholar] [CrossRef] [Green Version]
  11. Deng, X.; Ren, W.; Feng, P. Design flood recalculation under land surface change. Nat. Hazards 2016, 80, 1153–1169. [Google Scholar] [CrossRef]
  12. François, B.; Schlef, K.E.; Wi, S.; Brown, C.M. Design considerations for riverine floods in a changing climate—A review. J. Hydrol. 2019, 574, 557–573. [Google Scholar] [CrossRef]
  13. Tofiq, F.A.; Güven, A. Potential changes in inflow design flood under future climate projections for Darbandikhan Dam. J. Hydrol. 2015, 528, 45–51. [Google Scholar] [CrossRef]
  14. Tofiq, F.A.; Guven, A. Prediction of design flood discharge by statistical downscaling and General Circulation Models. J. Hydrol. 2014, 517, 1145–1153. [Google Scholar] [CrossRef]
  15. Kwon, H.H.; Sivakumar, B.; Moon, Y.I.; Kim, B.S. Assessment of change in design flood frequency under climate change using a multivariate downscaling model and a precipitation-runoff model. Stoch. Environ. Res. Risk Assess. 2011, 25, 567–581. [Google Scholar] [CrossRef]
  16. Botto, A.; Ganora, D.; Claps, P.; Laio, F. Technical note: Design flood under hydrological uncertainty. Hydrol. Earth Syst. Sci. 2017, 21, 3353–3358. [Google Scholar] [CrossRef] [Green Version]
  17. Federal Emergency Management Agency (FEMA). Federal Guidelines for Dam Safety : Selecting and Accomodating Inflow Design Floods for Dams; FEMA: Washington, DC, USA, 2004.
  18. Vrijling, J.K.; Schweckendiek, T.; Kanning, W. Safety Standards of Flood Defenses. In Geotechnical Safety and Risk (ISGSR 2011); Bundesanstalt für Wasserba: Karlsruhe, Germany, 2011; pp. 67–84. [Google Scholar]
  19. Ministry of Agriculture, Food and Rural Affairs (MAFRA). Agricultural Infrastructure Design Standards. 2002. Available online: http://www.kcsc.re.kr (accessed on 25 August 2019).
  20. Communities and Local Government. Planning Policy Statement 25: Development and Flood Risk; The Stationery Office: London, UK, 2010.
  21. Vernieuwe, H.; Vandenberghe, S.; De Baets, B.; Verhoest, N.E.C. A continuous rainfall model based on vine copulas. Hydrol. Earth Syst. Sci. 2015, 19, 2685–2699. [Google Scholar] [CrossRef] [Green Version]
  22. Goodarzi, E.; Shui, L.T.; Ziaei, M. Risk and uncertainty analysis for dam overtopping—Case study: The Doroudzan Dam. Iran. J. Hydro-Environ. Res. 2014, 8, 50–61. [Google Scholar] [CrossRef]
  23. Blasone, R.S.; Madsen, H.; Rosbjerg, D. Uncertainty assessment of integrated distributed hydrological models using GLUE with Markov chain Monte Carlo sampling. J. Hydrol. 2008, 353, 18–32. [Google Scholar] [CrossRef] [Green Version]
  24. Blasone, R.S.; Vrugt, J.A.; Madsen, H.; Rosbjerg, D.; Robinson, B.A.; Zyvoloski, G.A. Generalized likelihood uncertainty estimation (GLUE) using adaptive Markov Chain Monte Carlo sampling. Adv. Water Resour. 2008, 31, 630–648. [Google Scholar] [CrossRef] [Green Version]
  25. Hong, Y.; Hsu, K.L.; Moradkhani, H.; Sorooshian, S. Uncertainty quantification of satellite precipitation estimation and Monte Carlo assessment of the error propagation into hydrologic response. Water Resour. Res. 2006, 42. [Google Scholar] [CrossRef] [Green Version]
  26. Yoon, S.K.; Kim, J.S.; Moon, Y.-I. Urban stream overflow probability in a changing climate: Case study of the Seoul Uicheon Basin, Korea. J. Hydro-Environ. Res. 2016, 13, 52–65. [Google Scholar] [CrossRef]
  27. Weather Data Release Portal. Available online: https://data.kma.go.kr (accessed on 10 January 2019).
  28. Climate Information Portal. Available online: http://www.climate.go.kr (accessed on 10 January 2019).
  29. Korea Rural Community Corporation (KRCC). Emergency Action Plan (Dongbu); KRCC: Naju, Korea, 2006. [Google Scholar]
  30. Korea Rural Community Corporation (KRCC). Emergency Action Plan (Onam, Maji, Aeryong); KRCC: Naju, Korea, 2007. [Google Scholar]
  31. Korea Rural Community Corporation (KRCC). Emergency Action Plan (Bansan); KRCC: Naju, Korea, 2007. [Google Scholar]
  32. Korea Rural Community Corporation (KRCC). Emergency Action Plan (Baegun, Yongseol); KRCC: Naju, Korea, 2008. [Google Scholar]
  33. Korea Rural Community Corporation (KRCC). Emergency Action Plan (Yonggye, Mugeuk, Geumseok); KRCC: Naju, Korea, 2008. [Google Scholar]
  34. Korea Rural Community Corporation (KRCC). Emergency Action Plan (Geumo, Daeseong, Obong, Dowon, Dalchang); KRCC: Naju, Korea, 2009. [Google Scholar]
  35. Korea Rural Community Corporation (KRCC). Master Plan (Chupyeong); KRCC: Naju, Korea, 2009. [Google Scholar]
  36. Korea Rural Community Corporation (KRCC). Master Plan (Dorim); KRCC: Naju, Korea, 2009. [Google Scholar]
  37. Korea Rural Community Corporation (KRCC). Master Plan (Gyeryong); KRCC: Naju, Korea, 2009. [Google Scholar]
  38. Korea Rural Community Corporation (KRCC). Master Plan (Boksim); KRCC: Naju, Korea, 2009. [Google Scholar]
  39. Korea Rural Community Corporation (KRCC). Emergency Action Plan (Jamgok); KRCC: Naju, Korea, 2010. [Google Scholar]
  40. Korea Rural Community Corporation (KRCC). Emergency Action Plan (Junam, Gawol); KRCC: Naju, Korea, 2010. [Google Scholar]
  41. Korea Rural Community Corporation (KRCC). Emergency Action Plan (Dorim); KRCC: Naju, Korea, 2010. [Google Scholar]
  42. Korea Rural Community Corporation (KRCC). Emergency Action Plan (Gyeryong); KRCC: Naju, Korea, 2010. [Google Scholar]
  43. Korea Rural Community Corporation (KRCC). Emergency Action Plan (Boksim); KRCC: Naju, Korea, 2010. [Google Scholar]
  44. Korea Rural Community Corporation (KRCC). Master Plan (Yongdang); KRCC: Naju, Korea, 2010. [Google Scholar]
  45. Korea Rural Community Corporation (KRCC). Master Plan (Tapjeong); KRCC: Naju, Korea, 2010. [Google Scholar]
  46. Korea Rural Community Corporation (KRCC). Master Plan (Deokyong); KRCC: Naju, Korea, 2010. [Google Scholar]
  47. Korea Rural Community Corporation (KRCC). Master Plan (Damyang); KRCC: Naju, Korea, 2010. [Google Scholar]
  48. Korea Rural Community Corporation (KRCC). Master Plan (Gwangju); KRCC: Naju, Korea, 2010. [Google Scholar]
  49. Korea Rural Community Corporation (KRCC). Master Plan (Jangseong); KRCC: Naju, Korea, 2010. [Google Scholar]
  50. Korea Rural Community Corporation (KRCC). Master Plan (Suyang); KRCC: Naju, Korea, 2010. [Google Scholar]
  51. Korea Rural Community Corporation (KRCC). Master Plan (Naju); KRCC: Naju, Korea, 2010. [Google Scholar]
  52. Korea Rural Community Corporation (KRCC). Reservoir Hydrological Research Synthesis Report; KRCC: Naju, Korea, 2010. [Google Scholar]
  53. Korea Rural Community Corporation (KRCC). Emergency Action Plan (Yongdang); KRCC: Naju, Korea, 2011. [Google Scholar]
  54. Korea Rural Community Corporation (KRCC). Emergency Action Plan (Chupyeong); KRCC: Naju, Korea, 2011. [Google Scholar]
  55. Korea Rural Community Corporation (KRCC). Emergency Action Plan (Deokyong); KRCC: Naju, Korea, 2011. [Google Scholar]
  56. Korea Rural Community Corporation (KRCC). Emergency Action Plan (Tapjeong); KRCC: Naju, Korea, 2012. [Google Scholar]
  57. Korea Rural Community Corporation (KRCC). Emergency Action Plan (Damyang); KRCC: Naju, Korea, 2012. [Google Scholar]
  58. Korea Rural Community Corporation (KRCC). Emergency Action Plan (Gwangju); KRCC: Naju, Korea, 2012. [Google Scholar]
  59. Korea Rural Community Corporation (KRCC). Emergency Action Plan (Suyang); KRCC: Naju, Korea, 2012. [Google Scholar]
  60. Korea Rural Community Corporation (KRCC). Emergency Action Plan (Naju); KRCC: Naju, Korea, 2012. [Google Scholar]
  61. National Institute of Meteorological Sciences (NIMS). Climate Change Scenario Report for IPCC AR5; 11-1360395-000233-01; National Institute of Meteorological Research, Climate Research Division: Seoul, Korea, 2011. [Google Scholar]
  62. Park, J.; Kang, M.S.; Song, I. Bias correction of RCP-based future extreme precipitation using a quantile mapping method; for 20-weather stations of South Korea. J. Korean Soc. Agric. Eng. 2012, 54, 133–142. [Google Scholar] [CrossRef]
  63. Gudmundsson, L.; Bremnes, J.B.; Haugen, J.E.; Skaugen, T.E. Technical Note: Downscaling RCM precipitation to the station scale using quantile mapping—A comparison of methods. Hydrol. Earth Syst. Sci. 2012, 16, 3383–3390. [Google Scholar] [CrossRef] [Green Version]
  64. Efron, B.; Tibshirani, R. An Introduction to the Bootstrap, Monograph in Applied Statistics and Probability, 57; Chapman and Hall/CRC: New York, NY, USA, 1994. [Google Scholar]
  65. Helsel, D.R.; Hirsch, R.M.; Ryberg, K.R.; Archfield, S.A.; Gilroy, E.J. Statistical Methods in Water Resources: US Geological Survey Techniques and Methods; Book 4, Chapter A3; US Geological Survey: Reston, VA, USA, 2020.
  66. US Army Corps of Engineers (USACE). HEC-1 Flood Hydrograph Package. 1998. Available online: http://www.hec.usace.army.mil/publications/ComputerProgramDocumentation/HEC-1_UsersManual_(CPD-1a).pdf (accessed on 25 August 2019).
  67. Huff, F.A. Time distribution of rainfall in heavy storms. Water Resour. Res. 1967, 3, 1007–1019. [Google Scholar] [CrossRef]
  68. Clark, C.O. Storage and the unit hydrograph. Trans. Am. Soc. Civil Eng. 1945, 110, 1419–1446. [Google Scholar]
Figure 1. Schematic diagram of the interval estimation of the design flood using a non-parametric resampling technique for agricultural reservoirs. RCP4.5 denotes the representative concentration pathway 4.5 scenario, which is used to select future precipitation. HEC denotes hydrologic engineering center. B is the number of bootstrap samples, n is the sample size, and BCa is the bias-corrected and accelerated percentile method.
Water 12 01894 g001
Figure 2. Location of weather stations, 30 agricultural reservoirs, and four major rivers in South Korea. The red circle means a weather station, and the green triangle means an agricultural reservoir. Four major rivers are shown on the digital elevation model (DEM). Refer to Table 1 for reservoir names.
Water 12 01894 g002
Figure 3. Bias-correction result of the past 30-year (1976–2005) and future 95-year (2006–2100) average annual precipitation for 30 agricultural reservoir watersheds. The dotted line is the average, whereas the solid line is the median. The diamond symbol is outliers. (a) past 30 years (1976–2005); (b) future 95 years (2006–2100).
Water 12 01894 g003
Figure 4. Bias-correction result of the past 30-year (1976–2005) average annual maximum precipitation for four durations (3, 6, 12, and 24-h) for 30 agricultural reservoir watersheds. The dotted line is the average, whereas the solid line is the median. The diamond symbol represents outliers. (a) 3-h duration; (b) 6-h duration; (c) 12-h duration; (d) 12-h duration.
Water 12 01894 g004
Figure 5. Relative change (%) of the probable rainfall for four durations (3, 6, 12, and 24-h) and a 200-y return period from 2071–2100 compared with the base period value (2015s) under the RCP4.5 scenario for 30 agricultural reservoir watersheds. Refer to Table 1 for reservoir names.
Water 12 01894 g005
Figure 6. Scatter plot between the present inflow design flood and the inflow design flood based on 2015s (1986–2015) for a 200-y return period for 30 agricultural reservoir watersheds. The solid gray line is the 1:1 line.
Water 12 01894 g006
Figure 7. Scatter plot between the present and future inflow design floods (2100s) for a 200-y return period for 30 agricultural reservoir watersheds. The solid gray line is the 1:1 line.
Water 12 01894 g007
Figure 8. Bias of θ ^ for a 24-h duration and a 200-y return period for 2040s under the RCP4.5 scenario for 30 agricultural reservoir watersheds. The estimator ( θ ^ ) is the mean. Refer to Table 1 for reservoir names.
Water 12 01894 g008
Figure 9. Standard error of θ ^ for a 24-h duration and a 200-y return period for 2040s under the RCP4.5 scenario for 30 agricultural reservoir watersheds. The estimator ( θ ^ ) is the mean. Refer to Table 1 for reservoir names.
Water 12 01894 g009
Figure 10. Bootstrap histogram of the inflow design flood for a 24-h duration and a 200-y return period during 2011–2040 under the RCP4.5 scenario for four agricultural reservoirs. The blue dashed line the denotes original of θ ^ . The estimator ( θ ^ ) is the mean. (a) H-ON reservoir; (b) G-BO reservoir; (c) G-DB reservoir; (d) Y-DY reservoir. Refer to Table 1 for reservoir names.
Water 12 01894 g010
Figure 11. Relative change (%) of 97.5th BCa percentile of the inflow design flood bootstrap sampling distribution compared with the base period value (2015s) with the safety factor (1.2 times) applied for three future periods under the RCP4.5 scenario for 30 agricultural reservoir watersheds. Refer to Table 1 for reservoir names.
Water 12 01894 g011
Table 1. Watershed characteristics and design specifications for the 30 agricultural reservoirs. These data were constructed from the basic plan reports and emergency action plan reports in South Korea [29,30,31,32,33,34,35,36,37,38,39,40,41,42,43,44,45,46,47,48,49,50,51,52,53,54,55,56,57,58,59,60].
Name of ReservoirWatershed Area
(ha)
Impervious (%)Time of Concentration
(h)
Watershed Length
(km)
Total Storage Capacity
(10,000 m3)
Effective Storage Capacity
(10,000 m3)
H-YS7901.850.382.19302.0293.2
H-YG7480.350.562.94425.9339.9
H-GS7171.260.422.96383.8330.9
H-MG13152.050.673.75306.8279.1
H-ON15520.790.704.68271.0271.0
H-BU10202.440.473.19138.0137.9
H-YD28738.271.226.30692.9683.0
H-CP16102.080.765.40493.3455.5
H-JG19700.210.403.78436.4427.9
H-MJ14200.561.165.63399.6389.1
H-AR8901.620.994.52103.098.4
G-DR6500.000.553.77382.9377.6
G-BS16771.141.608.33545.3545.3
G-GR15744.620.986.30471.8471.7
G-TJ21,8802.357.7837.853842.33842.3
G-BO17612.281.807.08502.8471.1
G-DY15672.511.034.42569.8569.8
G-DB28113.981.798.641218.21144.6
N-OB14600.550.996.20395.8383.2
N-GO11001.420.524.47173.9173.9
N-DS17800.970.905.61330.2330.2
N-DW5761.020.614.23140.4140.4
N-DC56301.653.8512.72878.8864.9
N-JN11733.481.523.181435.9530.3
N-GW374111.723.498.07970.3970.3
Y-DY47201.070.9512.007761.17667.0
Y-GJ41301.620.8110.202325.62108.5
Y-JS12,2801.371.5515.4810,388.09970.5
Y-SY33006.710.9411.901192.61183.3
Y-NJ84601.331.2515.7010,780.910,654.4
H: Han River, G: Geum River, N: Nakdong River, Y: Yeongsan River, H-YS: Yongseol, H-YG: Yonggye, H-GS: Geumseok, H-MG: Mugeuk, H-ON: Onam, H-BU: Baegun, H-YD: Yongdang, H-CP: Chupyeong, H-JG: Jamgok, H-MJ: Maji, H-AR: Aeryong, G-DR: Dorim, G-BS: Bansan, G-GR: Gyeryong, G-TJ: Tapjeong, G-BO: Boksim, G-DY: Deokyong, G-DB: Dongbu, N-OB: Obong, N-GO: Geumo, N-DS: Daeseong, N-DW: Dowon, N-DC: Dalchang, N-JN: Junam, N-GW: Gawol, Y-DY: Damyang, Y-GJ: Gwangju, Y-JS: Jangseong, Y-SY: Suyang, Y-NJ: Naju.
Table 2. Probable rainfall (mm) for four durations (3, 6, 12, and 24-h) and a 200-y return period from 1986–2015 and 2071–2100 under the RCP4.5 scenario for 30 agricultural reservoir watersheds.
Name of ReservoirDuration (h)
2015s (1986–2015)2100s (2071–2100)
361224361224
H-YS256.7425.0561.6586.6159.7286.0502.0809.1
H-YG177.9216.5334.4415.4288.1575.3910.61378.8
H-GS177.9216.5334.4415.4288.1575.3910.61378.8
H-MG177.9216.5334.4415.4288.1575.3910.61378.8
H-ON334.0512.4681.5754.2468.9942.51529.41913.6
H-BU201.6301.6402.2494.7490.0861.91164.11460.3
H-YD173.1212.8330.3412.8280.3565.5899.41370.1
H-CP177.9216.5334.4415.4288.1575.3910.61378.8
H-JG159.0222.6347.1518.0347.3642.01043.71286.3
H-MJ334.0512.4681.5754.2468.9942.51529.41913.6
H-AR334.0512.4681.5754.2468.9942.51529.41913.6
G-DR263.6302.3504.4574.4324.6641.81007.11098.3
G-BS263.6302.3504.4574.4324.6641.81007.11098.3
G-GR172.6242.0370.6499.5337.2502.5760.41054.0
G-TJ99.9154.5208.9257.9196.6326.3528.7801.8
G-BO263.6302.3504.4574.4324.6641.81007.11098.3
G-DY243.2278.6490.3559.0311.4613.8978.71070.0
G-DB132.8249.4417.0469.0187.2357.7669.4823.0
N-OB118.3195.8235.9298.9105.7186.0294.9407.5
N-GO118.3195.8235.9298.9105.7186.0294.9407.5
N-DS118.3195.8235.9298.9105.7186.0294.9407.5
N-DW99.0120.6178.8277.3103.5218.9323.3393.3
N-DC91.0113.4169.8267.095.1205.8307.0378.7
N-JN198.5333.9363.7335.8159.1271.6352.9401.1
N-GW186.1318.4349.5326.0149.1259.0339.1389.3
Y-DY194.6323.2421.9475.0212.3369.4567.5693.1
Y-GJ161.2251.7365.9457.1325.4601.8889.21026.0
Y-JS130.3220.5295.8349.7190.0365.4556.5720.1
Y-SY163.1253.3367.5458.9329.3605.7893.11030.0
Y-NJ106.1157.5268.1334.8270.2421.5668.31062.6
Refer to Table 1 for reservoir names.
Table 3. Bootstrap inference result for the inflow design flood for a 24-h duration and a 200-y return period for 2040s (2011–2040) under the RCP4.5 scenario. The estimator ( θ ^ ) is the mean, z ^ 0 denotes the constant for correcting the bias of the re-extracted sample, and a ^ denotes the constant for correcting the skewness of the re-extracted sample.
IDName of ReservoirOriginal of θ ^   Bias of θ ^ Standard Error of θ ^ z ^ 0 (Bias-Correction) a ^ (Acceleration)
1H-YS111.00.02170.8−0.04510.0027
2H-YG161.2−0.025210.4−0.0075−0.0271
3H-GS155.0−0.023610.0−0.0050−0.0271
4H-MG282.6−0.040318.2−0.0025−0.0271
5H-ON467.10.149630.20.00750.0004
6H-BU190.0−0.11939.7−0.0326−0.0263
7H-YD605.8−0.084838.9−0.0025−0.0271
8H-CP344.2−0.052222.30.0000−0.0271
9H-JG408.00.136218.00.0150−0.0242
10H-MJ424.10.137427.20.00500.0004
11H-AR265.60.085517.10.00750.0004
12G-DR175.6−0.124310.2−0.0502−0.0254
13G-BS439.7−0.318925.6−0.0426−0.0255
14G-GR227.2−0.15647.90.0075−0.0151
15G-TJ852.4−0.643748.5−0.0326−0.0264
16G-BO455.4−0.330726.6−0.0451−0.0255
17G-DY401.7−0.306223.3−0.0426−0.0255
18G-DB462.6−0.484721.4−0.0351−0.0252
19N-OB86.30.01410.9−0.0602−0.0054
20N-GO62.00.01040.7−0.0301−0.0039
21N-DS104.70.01671.1−0.0301−0.0055
22N-DW40.30.01911.2−0.0502−0.0183
23N-DC276.00.12537.9−0.0602−0.0175
24N-JN83.60.00201.10.0050−0.0130
25N-GW195.30.00342.80.0075−0.0119
26Y-DY628.1−0.125014.3−0.0276−0.0240
27Y-GJ679.5−0.617227.2−0.0276−0.0148
28Y-JS1360.5−0.259649.8−0.0276−0.0202
29Y-SY546.1−0.489221.7−0.0326−0.0148
30Y-NJ1429.0−1.884796.9−0.0276−0.0198
Refer to Table 1 for reservoir names.
Table 4. 95% non-parametric confidence interval of the inflow design flood for a 24-h duration and a 200-y return period for three future periods under the RCP4.5 scenario for 30 agricultural reservoir watersheds. The safety factor is 1.2 times. 0.025 and 0.975 mean 2.5th and 97.5th BCa percentile of the bootstrap sampling distribution, respectively.
Name of ReservoirInflow Design Flood (m3/s)
Base Period Value (2015s)Base Period Value (2015s) with the Safety Factor AppliedInterval Estimation
(95% Non-Parametric Confidence Interval)
2040s
(2011–2040)
2070s
(2041–2070)
2100s
(2071–2100)
0.0250.9750.0250.9750. 0250.975
H-YS111.0133.2109.5112.5102.9112.3147.7163.4
H-YG74.088.8137.8179.4157.1183.2185.2203.1
H-GS71.085.2132.5172.4150.7175.9177.8194.8
H-MG128.0153.6241.4314.8275.3321.3324.4355.8
H-ON279.0334.8403.7522.9457.2551.7487.8561.2
H-BU114.0136.8167.9206.7138.0190.7319.6363.4
H-YD277.0332.4518.2674.4589.6688.0694.8761.9
H-CP155.0186.0294.6383.6335.0391.5395.6433.9
H-JG238.0285.6370.0440.5339.8403.2595.3649.4
H-MJ255.0306.0367.1474.3415.1499.9442.7509.0
H-AR159.0190.8229.7297.2260.1313.4277.2318.9
G-DR90.0108.0151.4192.5118.2156.3200.2224.3
G-BS225.0270.0379.1482.2296.4391.0501.2561.4
G-GR179.0214.8210.0242.2285.1360.8368.1399.1
G-TJ452.0542.4739.5933.31104.01334.01455.51553.7
G-BO233.0279.6392.6499.5306.1404.8518.9581.4
G-DY208.0249.6346.3440.4270.7357.3457.3513.1
G-DB302.0362.4411.1498.7340.0429.9512.9590.7
N-OB90.0108.084.488.0103.3121.6131.6137.8
N-GO65.078.060.663.575.089.096.7101.5
N-DS110.0132.0102.4107.0125.4147.7160.1167.8
N-DW30.036.037.442.444.245.948.050.1
N-DC212.0254.4257.2289.5302.1312.9327.2340.6
N-JN89.0106.881.485.8106.2128.2112.1121.7
N-GW208.0249.6190.1200.5249.5301.9263.0286.1
Y-DY504.0604.8595.3653.5590.9669.9761.7824.2
Y-GJ442.0530.4620.3726.2707.5775.0864.8987.6
Y-JS931.01117.21245.21450.41358.61571.01964.92200.5
Y-SY357.0428.4498.9583.3568.4622.5694.0792.1
Y-NJ624.0748.81218.11592.01310.91470.31289.31426.1
Refer to Table 1 for reservoir names.

