Risk-Based and Hydrodynamic Pluvial Flood Forecasts in Real Time


Institute of Hydraulic Engineering and Water Resources Management, RWTH Aachen University, 57074 Aachen, Germany
*
Author to whom correspondence should be addressed.
Water 2020, 12(7), 1895; https://doi.org/10.3390/w12071895
Submission received: 3 June 2020
/
Revised: 26 June 2020
/
Accepted: 30 June 2020
/
Published: 2 July 2020
(This article belongs to the Special Issue Recent Advances and New Directions in Flood Forecasting, Modeling, and Mapping)
Abstract
:The effective forecast and warning of pluvial flooding in real time is one of the key elements and remaining challenges of an integrated urban flood risk management. This paper presents a new methodology for integrating risk-based solutions and 2D hydrodynamic models into the early warning process. Whereas existing hydrodynamic forecasting methods are based on rigid systems with extremely high computational demands, the proposed framework builds on a multi-model concept allowing the use of standard computer systems. As a key component, a pluvial flood alarm operator (PFA-Operator) is developed for selecting and controlling affected urban subcatchment models. By distributed computing of hydrologic independent models, the framework overcomes the issue of high computational times of hydrodynamic simulations. The PFA-Operator issues warnings and flood forecasts based on a two-step process: (1) impact-based rainfall thresholds for flood hotspots and (2) hydrodynamic real-time simulations of affected urban subcatchments models. Based on the open-source development software Qt, the system can be equipped with interchangeable modules and hydrodynamic software while building on the preliminary results of flood risk analysis. The framework was tested using a historic pluvial flood event in the city of Aachen, Germany. Results indicate the high efficiency and adaptability of the proposed system for operational warning systems in terms of both accuracy and computation time.
1. Introduction
Pluvial floods pose increasing problems for cities around the globe and have severe social and economic impacts [1,2,3]. Such floods, also known as surface-water floods, are caused by high-intensity rainfall events when the urban environment is not capable of absorbing the rainwater effectively and the capacity of the drainage system is exceeded [4]. Depending on variable topographic and urban characteristics, the rainfall-induced overland flows can result in fast high dynamic and hazardous water flows; hence they are also referred to as flash floods [5]. In contrast to fluvial and coastal floods, pluvial floods are usually the result of local convective weather systems characterized by fast-moving storm cells that can occur almost anytime and anywhere, varying enormously due to urban environments [6]. Consequently, substantial damage generally arises on a small scale in individual towns or urban districts [7].
Fast expanding urban developments and continuously changing climate conditions are stress factors leading to an increasing risk of pluvial flood events [8]. According to recent hydrologic studies in the United States, every 1 percentage point increase in impervious surface causes a 3.3–4.7% increase in annual flood magnitude [9]. At the same time, climate models indicate a weather-related increase of extreme rainfall events in frequency and intensity [10].
Furthermore, insurance companies point out the high vulnerability of cities and urban infrastructure to pluvial flooding [11,12]. In this context, damage related to extreme rainfall shows a close link to certain precipitation parameters, in particular the rainfall duration. Cooperative studies between the German Weather Service, DWD (German Meteorological Service), and the German insurance company GDV show that rainfall events with durations from 1 to 3 hours represent the most damaging events and induce the highest risks in Germany [13]. To address this risk, flood forecasting and early warning systems (EWS) are essential tools to reduce the impact of pluvial flood events.
Fluvial and coastal flooding have been very well researched and documented with extended fluvial flood mapping and operational EWS. Pluvial flooding, however, remains a major challenge for flood authorities and forecasters, since these events are often very localized, unique and connected to very short lead times [14,15]. There is a growing demand for more targeted and impact-based warning systems to facilitate mitigation actions. New methods of convection-permitting numerical weather prediction and radar-based nowcasts represent a step-change in rainfall forecasting by providing more accurate and high resolution data [16]. In addition, hydrodynamic models already play an essential role for a detailed inundation process representation and pluvial flood risk analysis in urban areas.
Since pluvial flooding represents complex processes there are various types of hydrodynamic modeling approaches used for urban flood simulations including one-dimensional (1D), two-dimensional (2D) and coupled 1D-2D models. 1D models (e.g., MIKE 11 or HEC-RAS) are valuable tools used to represent the drainage networks processes. Moreover, 1D-simulations run generally very fast with low computing requirements. However, 1D models reach their limitations when the drainage capacity is exceeded and major flow processes take place on the urban surface. The simulation of flood processes on free surfaces requires 2D hydrodynamic models (e.g., MIKE 21 or Telemac 2D), which have proven to be accurate for flood modeling [17]. However, they are considered to be unfeasible for real-time applications because of their high computational costs [18]. Due to dense and variable city topography and infrastructure, pluvial flooding requires high-resolution modeling in order to represent small-scale and complex transient flow processes in urban environments [19,20]. By combining both model types, 1D–2D coupled models (e.g., MIKE FLOOD), a more realistic but equally compute-intensive approach for modeling the dynamic interactions between drainage network and urban surface is achieved.
There are multiple approaches for pluvial flood EWS that can be generally classified related to their appropriate level of complexity into three systems: (1) empirical-based rainfall scenario-systems, (2) pre-simulated scenario-based systems and (3) real-time hydrodynamic simulation-based systems [21,22].
Empirical-based rainfall systems rely on rainfall thresholds that are based on local knowledge or historical flood events, for example, the extreme rainfall alert (ERA) operated by the Flood Forecast Centre (FFC) [23] or the German Weather Forecast Service, DWD [24]. The implementation expenditure of rainfall-based systems is very low; even though the warning thresholds generated in that way do not take urban flood processes and associated impacts into account [25]. Therefore, this type of EWS is often called “first-guess early warning” [26]. On the other hand, scenario-based methods built on catalogues, which are based on previous hydrodynamic inundation mapping and subsequent matching procedures in offline systems or data driven models [27]. Therefore, the accuracy of scenario-based methods is constrained by the quality and amount of input data, in particular rainfall scenarios and static flood simulations. Recent studies used simulated water depth maps as a training base but ignored the dynamic components of water flows, like flow velocities [28,29]. However, urban pluvial floods are characterized by their complex flow patterns and high dynamic nature. Therefore, a proper representation of momentum conservation is of very high value.
To address the high dynamic nature of pluvial events the most detailed and complex flood forecasting system is based on online hydrodynamic simulations at the urban scale [30]. The great benefit of hydrodynamic simulations is the ability to directly model inundations and impacts connected with the high spatially variability of rainfall forecast. Although, physically based models allow detailed predictions of urban flood-dynamics, the use of those models in real-time was always neglected due to the following reasons: (1) short lead time of rainfall forecast, (2) high-resolution inundation modeling of large and complex cityscapes induce long computation times and (3) the requirement of special infrastructure and high-performance computers. Therefore, recent solutions are only based on high performance computing (HPC) in connection with special software requiring super computers in order to fulfill the real-time requirement [31,32]. In this context, an approach is needed that connects existing infrastructure and resources of municipalities with available (open) data to create a transparent and user-friendly EWS system for pluvial flooding.
The objective of this paper is to present a multi-model concept and a new operational tool for the development of a risk-based EWS that meets end user requirements providing targeted pluvial flood forecasts in real time. While common approaches represent rigid systems relying on one fixed hydrodynamic model, the presented framework is based on a multi-model system with interchangeable modules adaptable to existing requirements and computational resources. In the online-mode, the developed pluvial flood alarm operator (PFA-Operator) combines two warning levels consisting of (a) impact-based rainfall-thresholds and (b) hydrodynamic real-time simulations for affected urban areas. Building on an offline preprocessing and real-time optimization the multi-model system effectively reduces the computational time of hydrodynamic simulations for operational application on low computer resources. Written in C++ and based on the open source framework Qt, the operator can be equipped with software independent modules running on all major operating systems. Furthermore, based on the open rainfall and open geodata the system can be deployed in any German territory and transnational areas with similar data quality.
First, the study demonstrates the framework and key elements of the multi-model system as well as the software and data used for the development of the PFA-Operator. Secondly, a case study in the German City of Aachen serves to illustrate the operational use of the framework in order to demonstrate the benefits and challenges for the operational implementation. By performing a comprehensive performance test the framework was assessed by comparing high precision simulation and real-time optimized simulation results in front of in situ observations of the pluvial flood event of 29 May 2018.
2. Multi-Model System
2.1. Framework and Components
This section explains the essential offline and online components of the multi-model system and the operational implementation of the EWS. The concept builds upon the author’s previous publication [33] introducing a risk-based approach that takes into account both the pluvial flood hazard as well as the vulnerability of urban infrastructure.
Using radar-based nowcasting products as input, the presented framework issues a forecast and warning combining impact-based rainfall thresholds with subsequent high-resolution inundation simulations and object-precise information about associated impacts. The biggest challenge for city-scale real-time application is posed by the high computational times connected to 2D hydrodynamic modeling. In order to effectively reduce the processing time, the framework relies on innovative offline and online methods. The offline pre-processing consists of the following three steps (Figure 1):
- (1)
- Determination of flood hotspots and delineation of connected urban subcatchments, and generation of urban subcatchments models (USC-Models).
- (2)
- Automated computation of rainfall-thresholds (R-thresholds) based on certain inundation hazard values (F-thresholds).
- (3)
- Real-time optimization of USC-Models by monitoring the gradual reduction through the adjustment of hydrodynamic model parameters.
In the operational online mode, the implemented PFA-Operator uses rainfall forecasts as input to issue pluvial flood alerts consisting of two output levels: first, warnings about exceeding the specific R-thresholds are given. In a second step, dynamic flood forecasts based on hydrodynamic real-time simulations are made. R-thresholds are derived by an automatic subroutine of hydrodynamic simulations and sensitivity analysis of synthetic rainfall scenarios that generate flooding of a defined flood depth at specific hotspots (F-threshold). Once the predefined R-thresholds are exceeded real-time simulations of affected subcatchments are triggered. The operator-controlled inundation simulations are based on splitting the modeling chain into single subprocesses and their execution through batch jobs. Sub-processes include the transformation of rainfall forecast as model input, simulation computation and output processing. Using the cross-platform software Qt, multiple batch-processes can be controlled sequentially, parallel or time-delayed.
The great benefit of the multi-model approach is the execution of parallel real-time simulations by using distributed computing on several mid-range computers. Thus, compute-intensive hydrodynamic simulations are executed remotely by a parallel distribution over individual computing systems (computing compound). Overall, it forms a module-based toolkit that provides the end users with an individual adaption on available infrastructure, computing capacity and hydrodynamic software. As a result, the application of the real forecasting system on variable computational resources is possible. The following sections will go step-by-step through the proposed framework, starting with the offline pre-processing steps followed by real-time operation of the PFA-Operator in the online-mode.
2.1.1. Determination of Flood Hotspots, USC Models and R-Thresholds
The first step of the offline pre-processing includes the localization of flood hotspots and the determination of associated urban subcatchments (USC). Within this context, hotspots are defined as vulnerable areas (critical infrastructure or water sensitive spots), which exhibit a high exposure to pluvial flooding. The hotspot analysis is mainly based on the pluvial flood risk analysis procedure described in [33], using a combined hydrodynamic inundation simulation and GIS-based damage potential analysis. The intersection of high-water levels and objects with a high damage potential equals into high risks. Subsequent systematic SQL (Structured Query Language) queries are used in combination with a defined risk matrix in order to automatically classify flood-critical objects as a function of the water level and damage potential. In particular, critical infrastructure and flood-sensitive points like underpasses or tunnels must be added if they are missing.
In the next step, spatial clustering algorithms like DBSCAN (density-based spatial clustering of applications with noise) [34] are used to locate areas with the highest density of flood-affected infrastructures that are classified with a high degree of risk. Subsequently, the identified hotspots are compared and linked to inundation-relevant areas termed as drainage points. In urban runoff modeling, drainage points are defined as junctions of critical overland flow paths induced by rainfall events. In this process, drainage points are delineated using GIS-based hydrology tools and validated by hydrodynamic simulations for the dynamic tracking and comparison of the flow paths. Building upon these results, drainage point-related and independent USC-models can be determined (Figure 2). Thus, the USC-models represent the rainfall-runoff effective area forming the discharge-relevant urban surface that is responsible for inundations at individual hotspots. Finally, independent USC-models are generated that represent the full inundation process at certain hotspots. In this manner, large urban areas can be subdivided into fast-computable independent hydrologic models.
In order to account for scale and boundary effects of the localized USC-models, two control and monitor mechanisms were applied: (1) the modeling area of the USC-models was increased gradually while several water level velocities were monitored at important flooding areas and (2) a large domain model served as the final control for assessing the conformity of the localized USC-model and the large domain model. In the case of a deviation the modeling area was corrected and enlarged.
The third step represents the derivation of R-thresholds, which serve to issue initial warnings and trigger subsequent real-time simulations for affected USC. This approach revealed that no fixed regional-wide dataset could characterize the rainfall thattriggered local flooding. However, R-thresholds at time scales that were relevant for local pluvial flooding were linked to certain F-thresholds. F-thresholds are defined for inundations that reach a critical level and are connected to flood-related values. This value can be the water depth, flow velocity or the product of both parameters as well as water level-dependent impacts like affected houses or critical infrastructure. Using this method allows the additional integration of the risk approach by linking a certain risk to R-thresholds.
The derivation of R-thresholds was based on an automized process of hydrodynamic simulations and subsequent sensitivity analysis. The execution was based on batch file controlled hydrodynamic simulations by increasing gradually the rainfall intensity. The rainfall catalogue reverted to a database consisting of predefined rainfall scenarios with the following parameters:
- Uniform spatial distribution
- Resolution of increasing rainfall intensity: 1 mm
- Rainfall durations: 15 min to 6 h with 15 min intervals.
In the following, sensitivity SQL-queries were used to determine user-defined F-thresholds. R-thresholds were determined and linked to hotspots or rather drainage points at the neighborhood level using high-resolution inundation models with a variable spatial resolution up to 1 m2.
2.1.2. Hydrodynamic Real-Time Optimization
The reaction time in the event of pluvial flooding is very short. Therefore, the lead time between rainfall prediction and hydrodynamic flood forecast is among the most crucial factors in the application process of a real-time flood forecasting system. On one hand, computational times must be as short as possible, but on the other hand sufficient spatial and temporal flood accuracy is necessary to derive effective measures for damage reduction. Hence inundation modeling is time-critical, as essential warning indicators can be derived from the result. In order to make the operational implementation of real-time simulations available for mid-range computers, special process techniques are required to reduce the computational time of physically based flood simulations.
The objective of the presented hydrodynamic real-time optimization was to achieve an optimal solution between computing speed, level of detail (model resolution) and result usability. Therefore, a systematic investigation procedure was developed to identify simplifications in the hydrodynamic model parameters to shorten the computing time without sacrificing essential results. The general aim was to permit real-time simulations within the update window of the rainfall forecast (e.g., 5 min) for the best possible consideration of fast-moving convective storm cells.
To analyze and assess the model performance in terms of accuracy and processing speed (computational time) multiple simulations were compared in a model-to-model comparison. Inundation maps consisting of water depth and velocity as variable models were generated by the 2D hydrodynamic model using a subroutine of batch jobs. Based on a scatter plot, the changes in the model parameters were monitored and compared by using different evaluation methods.
In order to identify and quantify deviations between high resolution simulations and real-time optimized simulations, root-mean-squared error (RMSE) and the coefficient of determination (R2) were utilized. To compare and quantify the simulated water depth and velocities at an element-by-element basis, the RMSE and R2 are defined as follows:
where N denotes the number of elements or observations, Si and Oi denote the water depth or velocity of the reference simulation and the optimized simulation, respectively.
To assess the speed performance and reduction of computational time, a speedup ratio (S) was calculated as:
where TGPU and TGPUopt represent the run time of the high-performance model (HP-model) and the real-time optimized model (RT-model).
2.1.3. Process Scheme of the PFA-Operator
The PFA-Operator is designed to provide impact-based pluvial flood warnings and hydrodynamic inundation forecasts in real time by controlling multiple USC-models. Using detailed rainfall forecasts as input, the system combines two process and warning levels: (a) warnings about exceeding the R-thresholds for defined hotspots and (b) flood forecasts based on hydrodynamic real-time simulations for affected USC-models. This effective combination provides both simple and clear warnings of inundations and impacts as well as high-resolution dynamic inundations maps.
Figure 3 presents the main elements and process flow of the system:
- Receiver for requesting rainfall-forecast data
- Threshold monitor for comparing rainfall values of forecast (TFX) with thresholds (TTR)
- Model broker for controlling multiple batch job-based USC-flood models
- Warning client for transmitting warnings and dynamic flood forecasts.
The receiver requests rainfall forecast data using versatile protocols like HTTP-requests (Hypertext Transfer Protocol) (e.g., DWD [35]) or by direct connections to ftp-servers (e.g., HydroMaster [36]). Based on a bounding box, the rainfall data was accumulated over the target intervals (e.g., 30 min, 60 min and 120 min) and target subcatchments. Subsequently, it was transformed and forwarded to the threshold monitor. The threshold monitor represents the control station by comparing forecasted rainfall (TFX) with the R-thresholds (TTR). Therefore, it decides about further processing. The model broker controls standalone USC-models by sending data and activating the real-time simulations. The warning client acts as an interface between the end user and the PFA-Operator by issuing warnings about exceeded R-thresholds and dynamic flood maps via SMS/emails or a web-platform (if existing).
In online use the PFA-Operator is connected to the Nowcasting-System and works in the following operational scheme:
- Continuously sends a request for retrieving rainfall forecast data every time that new information is available (5 min) from different sources, like the DWD-GeoServer and/or connecting to the HydroMaster ftp-server to retrieve a rainfall forecast every 5 min.
- Sum the rainfall forecast over the target interval, and use the Z–R relationship [37], if necessary for radar-echo transformation, to determine TFX.
- If TFX < TTR then there is no flood warning (comparing R-thresholds with a database).
- Otherwise, if TFX > TTR, a process is triggered composed of:
- A warning of local USC-threshold exceedance is sent via the warning client,
- TFX data is passed to the model broker for the hydrodynamic real-time simulation.
- Translate TFX to the appropriate model-input format input, address and run the affected USC-models.
- Sum up the simulation results to a dynamic flood forecast containing warnings about exceeded maximum inundation depths and/or velocities including flooding times of selected areas with high risks.
- Warning client issues flood forecasts by sending dynamic inundation maps via SMS/emails or in a web interface.
3. System Implementation and Results
3.1. Study Area
The feasibility of the framework is demonstrated using the city of Aachen, which is the westernmost city in Germany close to the border with Netherlands and Belgium (Figure 4a). The city lies in a valley basin near the head of the open valley of the Wurm River, which flows through the city in the canalized form. The monthly summer rainfall was around 75 mm. While fluvial flood events did not play an important role in the history of Aachen, the city has experienced a few strong pluvial flood events, mostly induced by convective storms. The most notable and significant heavy rainfall event occurred on 29 May 2018 and caused severe urban flooding in the center of Aachen [38].
According to the radar- and pluviometer-based observations, the May event caused a precipitation amount of 40–50 mm within 55 min (Figure 4b). In total 379 emergency calls were documented and subsequently provided for this study by the fire department of Aachen. Using a geocoder (Section 3.3.1) the object addresses were traced back and served consequently as validation data for the framework presented. Further data available to support the proposed modeling approach include a 1 m resolution digital elevation model (DEM1), a land-use map, building objects, radar-based rainfall measurements [36] and in situ observations (photos) of the May event. The open Geodata from the federal state of North Rhine Westphalia served as the basis for the model data [39].
3.2. Software and Model Data
3.2.1. Qt Software
The architecture of the PFA-Operator was written in C++ using the open source software Qt, which represents a framework for cross-platform application developments. Qt uses a preprocessor called MOC (meta-object compiler), which extends C++ by additional elements, such as signals and slots and introspection. One of the biggest advantages of using Qt for the development of PFA-Operator is its use in multi-platform applications that run on all major operating systems and platforms (e.g., Windows, Linux, macOS and Android). Therefore, the object-oriented framework needs almost no change in the code; the code is compiled to native binaries that run at full speed. Furthermore, Qt gives great control for the developer by offering language bindings to several other programming languages like Python (pyQt), Javascript or C#. These advantages build the essential key elements for developing an open multi model system that can be equipped with interchangeable modules regardless of their software background. In addition, Qt allows the easy integration of Google Maps into the framework by using Google APIs (Application Programming Interface). Known open-source or proprietary cross-platform frameworks that use Qt, are for example, the geographic information system QGIS [40] or Google Earth [41].
3.2.2. Rainfall Forecast Data
One of the most efficient methods for forecasting convective rainfall events is based on short-term radar-based forecasting also termed as nowcasting [42]. In contrast to deterministic or probabilistic numerical weather prediction, nowcasting systems are developed for high temporal and spatial resolution forecasts for rainfall events up to 6 h enabling the detection of small individual storms with reasonable accuracy [43]. The method is based on extrapolating radar echoes into the near future capable of detecting speed and direction of convective storm events and providing quantitative precipitation forecasts (QPF) [44].
Operating 18 operational weather radars the German weather forecast, DWD, provides QPF with high spatial (1 km × 1 km) and temporal resolution (5 min) in form of the RADVOR product (radar-based, real-time precipitation forecast for operational application) [45]. With a lead time of 2 h it provides a quantification of rainfall by using the latest comparison between C-band radar and pluviometer-based precipitation measurement [16]. Therefore, the radar-network provides new precipitation information every 5 min including a new radar nowcast for the next 2 h in the form of the FX-product. Provided by the open data-server Opendata DWD [35], the FX-product can be requested using defined HTTP-protocols. Figure A1 (Appendix A) serves as an example for the implementation of the FX-rainfall forecast into the operator via the PFA-Receiver. Using the bounding box principle, the following forecast request for a center area in Aachen (Kaiserplatz) serves as an example:
As an alternative, the HydroMaster [36] provides high resolution QPF with a spatial resolution of 1 km2 and a lead time of 3 h. HydroMaster, a collaboration product between KISTERS AG and MeteoGroup Ltd., offers a live web service for analyzing historical, current and upcoming heavy rainfall events. Providing an ftp-server, the HydroMaster offers another rainfall forecasting system that can be easily coupled with the PFA-Operator. Due to planned expansions including the installation and operation of a high-resolution X-band radar system, the use of HydroMaster presents a great potential for high-quality rainfall forecasts in the city of Aachen in the near future.
3.2.3. Hydrodynamic Model
The software MIKE 21 (version 2019) was used as the hydrodynamic module for the PFA-Operator for performing physical-based simulations of urban inundation processes. MIKE 21 is a distributed 2D hydrodynamic model using well-established codes for solving the full shallow water equations, and has been used extensively in the field of flood impact assessment [46]. One of the big advantages of MIKE is that it can be used for complex model structures in urban flood simulations. Furthermore, the software offers the possibility to simulate 1D-2D coupled models in order to represent the dynamic interactions between the storm drainage network and urban surface.
In this case study the simulation engine MIKE 21 FM HD was used, which is based on a flexible mesh method by using a cell-centered finite volume solution technique. One of the great benefits of MIKE is the execution of single simulation processes by batch operations. An example for the implementation of the batch job-controlled hydrodynamic model in the PFA-model broker is presented in Figure A2.
In previous work a 2D hydrodynamic model was implemented using the software XPSWMM [40] encompassing the central area of Aachen with a model area of 36 km2. Details of the model setup and data used can be found in [33]. The model parameters of the XPSWMM model were used for setting up the present 2D-MIKE 21 model. The hydraulic roughness was represented in the model by Manning’s n in individual areas regarding their land-use, where residential area, streets and pavements, short grass, industrial/commercial areas and forests are assigned values of 0.08, 0.015, 0.04, 0.06 and 0.10 m−1/3s, respectively. Since no drainage network data were available for the development of 1D model, the effect of the drainage system on the surface flooding process was considered by a simplified representation through a reduction of the effective rainfall.
Due to the lack of 1D-drainage network data, comprehensive flow measurements and field data, validation of the 2D model was performed by comparing the model results to in situ observations of the May event. First, the water depth was validated against estimations from georeferenced images at specific time steps. Moreover, the flood extent and affected buildings could be validated by using spatially related emergency calls of the fire department of Aachen. It was thus possible to compare the spatiotemporal flooding processes with the model results.
3.3. Results
3.3.1. Hot Spot Localization and Validation
The localization of hotspots was carried out first, based on the preliminary risk analysis comprising hydrodynamic inundation simulations and vulnerability analysis described in [33]. Building on these results, a systematic risk analysis was performed using GIS-based SQL queries in combination with a risk matrix. Based on a function of water level and damage potential, all individual objects were automatically classified, leading to higher risks for buildings that were affected by high inundation depths. In the next step, the number and level of risk were analyzed and clustered on a near neighborhood radius in order to determine hotspots. The results indicated several hotspots in generally low-lying areas in the center of Aachen concentrated near the Kaiserplatz.
Secondly, the identified hotspots were validated using the pluvial flood event of 29 May 2018 as a reference, hence called the May event. Therefore, documentation data of emergency calls during the event were used to investigate the agreement of simulation and in situ data. A text dataset, including the addresses of the objects where emergency calls were made and the corresponding times, was provided by the fire department of Aachen in the form of a PDF document. Using a geocoder equipped with a Google Maps API, the emergency calls could be tracked back, saved and GIS-visualized for further spatial analysis. Following, the georeferenced objects were clustered using the algorithm of DBSCAN with a maximum radius (eps) of 50 m and a total weight of 5, representing the number of objects in a neighborhood. Figure 5 shows the results of the zoom-in of the most affected area, which comprised 11 of the 14 hotspots in total.
The validation indicated a high degree of agreement between the simulation- and event-based hotspots. Both the number and geo-position of the individual affected buildings highlighted several matches. Comparing the number and location of the hotspots resulted in 9 simulated and 11 event-based hotspots, which equals a hit rate of 82%. Two hotspots that could not be localized were mainly caused by the overflow of the drainage system in low-lying narrow side streets. It is evident, that the simplified drainage capacity approach used was not capable of representing flooding processes induced by the drainage system. Considering the fact that the simulation was carried out before the May event happened, and the unenviable uncertainty associated with the complex modeling and analysis chain, the hit rate of 82% was considered to be good. In addition, the geo-event-based spatial analysis method offered new opportunities for large scale validations of the existing inundation model.
3.3.2. Determination of USC-Models and R-Thresholds
The determination of USC-models was performed using GIS-based hydrology analysis tools including the flow path and drainage point (critical flooding points) delineation. In comparison with the results of the hotspot analysis, the determined drainage points indicated a high degree of consistency with the positions of the hotspots. Therefore, the drainage points could be linked to the hotspots and thus to the associated risks. Consequently, the identified drainage points were considered to be a significant and representative indicator for the determination of hydrologic boundaries and accordingly to USC-models. Figure 6 shows four USC-models that represent affected areas of the May event of which the Kaiserplatz was the most severely affected area. The Kaiserplatz-USC encompasses an area of 1.32 km2 containing three critical drainage points (K1, K2 and K3). The subcatchment represents a densely urbanized area located at the lowest point of the entire study area and has the biggest model area compared to the other subcatchments.
The subsequent sensitivity analysis was used in order to investigate possible scale effects and quantify the influence of border areas on the inundation process at target drainage points. In order to ensure representative model areas, the simulation results of the large domain model were continually compared with the results of the USC-models. For this purpose, numerical water level and discharge meters were installed at numerous significant positions and checked by means of target and actual measurements. The results demonstrated none to very low need for model adjustments at the Kaiserplatz USC-model and the remaining models, respectively.
In the second step, R-thresholds were assigned to the hotspots based on automized batch job-controlled hydrodynamic simulations of a series of rainfall intensities. A subsequent routine based on a sensitivity analysis was carried out in order to determine R-thresholds that exceed the defined inundation depths (F-thresholds), which in turn are directly linked to the impacts and aggregated risks of objects in the near neighborhood. This procedure leads to the determination of impact-based R-thresholds.
Based on the assessment of inundation and risk analysis two F-thresholds were defined resulting in two R-thresholds for individual flooding points in order to classify the impact level. Table 1 shows, as an example, the rainfall intensities according to different rainfall durations and R-thresholds. At flooding point K3 a depth of 0.2 m and 0.5 m were selected as F-thresholds 1 and 2 respectively. While F-threshold 1 represented an inundation depth at which pedestrians and traffic are restricted and affected residents should start taking action, F-threshold 2 denoted an increasing risk to people. The derived R-thresholds served as warning indicators for the PFA-Operator.
3.3.3. Real-Time Optimization of USC-Model
The real-time optimization took place in two steps: (1) coarse analysis of sensitivity to different spatial resolutions of unstructured mesh sizes and (2) fine-tuning by adaption of hydrodynamic model parameters with simultaneous monitoring based on GIS-difference models and cell-to-cell comparisons.
RMSE and R² as well as S were utilized to assess the model results and performances in terms of accuracy and processing speed. All simulations were performed on a desktop computer equipped with AMD Ryzen 9 3900X 12-Core Processor, 64 GB RAM DDR4, GeForce RTX 2080 Ti (assembled at Alternate GmbH, Linden, Germany). In this context, the USC-Model of the Kaiserplatz served as an example since it represented the biggest subcatchment area with the highest risk degree and significant hotspots. The MIKE 21 FM high precision model (HP-model) used a variable computation time ranging from 0.01 to 1 s, keeping the critical Courant number (CFL) at 0.1 and using the high numerical order scheme regarding time integration and space discretization. This HP-model setting was used for all simulations in the coarse analysis.
First, a baseline simulation was carried out on a 1 m2 unstructured mesh for the complete model area of 1.32 km2, involving 1.17 million effective computational elements. Driven by spatiotemporal uniformly distributed rainfall of 47 mm/h (which represents statistically a 100 year rainfall event for the region of Aachen [47]) the simulation was run for 3 h consisting of 1 h rainfall and 2 h follow-up time. Figure 7 compares the maximum inundation maps of different spatial resolutions with maximum mesh sizes of 1 m2, 5 m2 and 8 m2. The number of effective elements and CPU and GPU computational performances for each model is provided in Table 2.
Overall, the results demonstrated a very high degree of congruency of all resolutions regarding maximum inundation extent and water depth. Small deviations were obtained in one narrow side-street at the model boundary with a stepwise increase of difference. While all simulation results indicated a very high degree of congruency regarding maximum inundation extent and water depth, the difference in computing time evidently becomes more prominent as the mesh size turned coarser. Furthermore, the use of GPU achieved a speedup ratio S of 11.4 and decreased with the number of elements (coarser resolution) to 6.6 for the 8 m2-model. Consequently, the results showed the declining speedup effect of GPU-computations for coarser resolutions leading to a limit for real-time applications.
Consequently, due to the results of the spatial resolution analysis, real-time optimizations were conducted on models with 5 m2 and 8 m2 to achieve further speed optimization. Therefore, the effect of different hydrodynamic model parameters and computation settings on the computation time was investigated. The parameter analysis included changes in numerical schemes for time integration and space discretization, critical CFL, single and double precision. For the automatized and precise assessment of a large number of model variants, maximum water depths and velocities were compared on a cell-to-cell basis using a MATLAB-script. Hence, the high precision models of 5 m2 and 8 m2 (HP-5m2 and HP-8m2) served as a reference to quantify the deviations to the model adaptions.
In consideration of the nowcast-based time limit of 5 min, several parameters were monitored showing that the use of low order scheme and increasing CFL adaptions lead to promising optimizations. Therefore, the RT-model setting used a variable computation time ranging from 0.01 to 1s, keeping the critical CFL number at 0.5 and using the low numerical order scheme. However, although the graphic card used has a high single precision performance, switching from double to single-precision GPU floating-point performance did not show a big effect on the speedup ratio.
Figure 8 demonstrates the maximum water depth difference between the HP-8 m2 and the RT-8 m2 simulations, whereas the maximum velocity difference is shown in Figure 9. The RMSE and R² obtained for the result on the RT-8 m2 model were 0.998 and 0.006 m, respectively, indicating that the inundation depth map was largely consistent with the one produced by the HP-8 m2 model. Just in northern areas with higher slopes and narrow streets small deviations up to a maximum range from 1 to 3 cm appeared. However, the results of maximum velocity differences demonstrate a higher effect on the CFL condition. Associated with complex topographic features, the difference of maximum velocity tended to be positive near to steep slopes and narrow streets and appeared artifactually negative at land gaps.
Finally, the results of HP-1 m2, RT-5 m2 and RT-8 m2 are presented in Figure 10 comparing the different water depths (A,B,C) and velocity maps (A2,B2,C2). While the investigations confirmed a very high agreement of the water depth maps, the comparison of the velocity maps indicated small deviations that became more prominent as the simplification and spatial-temporal resolution turned coarser. Associated with complex topographic structures, the velocities of B2 and C2 tended to be more extensive with higher slopes (northern areas), whereas the results in low-lying areas were highly concordant. In contrast, comparing the computation times, the RT-5 m2 and RT-8 m2 models required 4.56 min and 2.94 min, respectively, which highlighted a significant reduction of computation time resulting in speedup ratios of 65.9 and 100.6, respectively. Subsequently, this confirms the high potential of optimization procedures presented to meet the requirements for real-time applications.
3.3.4. Performance Test of the PFA-Operator
For a full performance test of the entire system, further investigations were carried out by coupling the high precision model and the real-time optimized models with the PFA-Operator. Therefore, a hindcast scenario was created representing the May event with all available information including rainfall data and in situ observations. In order to validate the system with realistic operational applications, radar-based rainfall measurements were extracted from the HydroMaster and served as input for the PFA-Operator. In this context, both the real-time capability and result usability were measured and compared.
Figure 11 presents the rainfall measurement and 2 h forecast of the May event based on the assumption that the forecast equals the measured rainfall amount. According to in situ observations and statements by the population [38], initial flooding processes occurred in the city center of Aachen at 15:00 h. Furthermore, as a first result, it highlights the time of warning outputs of the PFA-Operator consisting of the R-threshold warning (R1) and subsequent dynamic flood forecasts following in 5 min intervals (F1–F5). F1–F5 were each simulating a moving rain input sum of 60 min for best possible consideration of the fast-moving convective storm cells. The lead time of the R1 represented 125 min (12:55–15:00 h), and of the last dynamic flood forecast F5, 105 min (13:15–15:00 h).
The results of the F5-simulations are shown in Figure 12 comparing the synthetic flood forecasts of the HP-1 m2 model with RT-5 m2 and RT-8 m2 model in front of (a) a time series of water depth measurements at certain locations and (b) inundation maps at 15:20 h. The comparison of the simulations indicated small deviations between the HP- and RT-model results leading to a calculated RMSE of 0.03 m and 0.04 m for the RT-5 m2 model and RT-8 m2 model, respectively. The differences returned seemed to be acceptable values in view of the significant reduction of computation time.
In order to further validate the different models, in situ observations including their time and geo-position were used to be compared with the simulation results. The flood depths were estimated from georeferenced images shown in Figure 13 by using objects such as persons, vehicles, streets, bus stops, etc. Table 3 shows the in situ estimated depths compared to the simulation results. Considering the fact that the vertical accuracy of the DEM is ±20 cm and the uncertainties associated with the hydraulic parameters and water depth estimations, the overall results demonstrated a high prediction accuracy regarding concentration time and depth of the inundations. Both HP as well as RT simulations led to sufficient and similar results with maximum deviations in a range of 1–3 cm. However, the water depth at the Kaiserplatz (C) obtained a simulation-based overestimation of approximately 7 cm to the in situ-observation. One reason for this overestimation could be the uncertainty involved by the simplified representation of the drainage system, which was mentioned before.
In addition, Table 3 shows the total forecast computation time (CPU+GPU) expended for the simulations coupled with the pre and postprocessing of the PFA-Operator. Comparing the total times needed, the RT-5 m2 simulation was 60.9 times faster and the RT-8 m2 simulation 90.4 times faster than the HP-1 m2 simulation and were consequently in the nowcast-update time of 5 min. Considering the small deviations in the predictions, the achieved speed up factor was considered to be very good.
4. Discussion
The results drawn in Section 3 verified the high potential for the application of the presented multi-model system in the development of a pluvial flood early warning system that overcomes the computational issue of high demanding hydrodynamic simulations. The offline and online methods of the framework have shown to be efficient and adjustable for operational forecasting applications in terms of both accuracy and computation time. Based on an open model approach, the implemented PFA-Operator proved to meet the requirements of real-time applications working on mid-range computer resources. Furthermore, using open rainfall data and geodata as input the system can be deployed in any German territory as well as transnational areas with similar data quality.
The results of the performance test indicated a significant reduction of computation time by maintaining a very high level of consistency between high-precision and real-time optimized models. The real-time optimization achieved inundation simulations meeting the nowcast time limit of 5 min by demonstrating a speedup ratio of 60.9 and 90.4 for the RT-5 m2 and RT-8 m2 simulations, respectively. Furthermore, the comparison with in situ observations could additionally confirm a sufficiently high accuracy and reliability of real-time inundation forecasting in regard to water depth, extent and concentration time with deviations within a few centimeters range. However, one observation indicated an overestimation of the simulations of 0.1 m, which can be attributed to the simplified representation of the urban drainage system. Nevertheless, in accordance with the accuracy of the DEM and the uncertainties associated with the entire modeling chain, the results were considered to be sufficiently precise for real-time warning applications. The validation results obtained agree with the inundation simulation results of Yu et al. [48] in the city of Shanghai, but no investigations were carried out in order to validate the velocity. Schmitt and Scheid [49] note the importance of velocity analysis for the assessment of the pluvial flood hazard.
The real-time optimization method demonstrated an efficient approach for finding optimal hydrodynamic model solutions between computing speed, model accuracy and result usability. Automated routines for simultaneously monitoring model differences and speed-up factor represent an effective method for the fast identification of effective hydrodynamic simplifications in order to reduce the computing time while maintaining the required model accuracy. Other speedup techniques consisting of mesh size-modifications for irrelevant areas or the optimization of building objects are described by Russo et al. [50]. The EWS installed in a pilot site in Marbella, Spain used both grid-size modification and integrated catchment modeling (ICM)-based GPU high performance servers to achieve real-time simulations for a 10.6 km2 area consisting of more than 60.000 cells. High performance and supercomputing techniques using multiple high end GPUs and special infrastructure are also described in other studies in order to perform 2D hydrodynamic simulations [31,32]. However, in front of variable equipment (hydrodynamic software) and low computing resources, the application of HPC-based EWS is not applicable for all municipalities. In contrast, the PFA-Operator introduces a highly parallelable flood forecasting system by the integration of a model broker controlling optimized models in parallel. Furthermore, the system works on a risk-based approach controlling and activating targeted models in regard to their priority. Therefore, USC-models can be equipped with different resolutions and optimized in front of their flood risk level opening up many opportunities for end user adaptations.
In addition to hydrodynamic simulations, the PFA-Operator uses R-thresholds for both, warnings and triggering of real-time simulations. The use of R-thresholds is a common approach and best practice for “first-guess early warning” [51,52]. Threshold-based systems are used everywhere around the world like the heavy rainfall warning system of the Meteorological Service (DWD) in Germany [53], the Heavy Rainfall Alerting (HRA) in England [52], the Flash Flood Guidance (FFG) in USA [54] or the FloodAlert in Spain [55]. However, those simplified threshold-based EWS systems do not take into account the spatial and temporal variabilities connected to inundations and vulnerabilities. As an opportunity and extension to this common approach, the impact-based R-threshold method proposed uses combined inundation simulations and vulnerability analysis in order to derive targeted warning levels linked to pre-simulated consequences of local flooding. A disadvantage or rather precondition for the derivation of impact-based R-thresholds is the required presence of pluvial flood risk analysis.
Currently, the PFA-Operator provides a warning and forecasting tool for pluvial flooding including a simplified approach for the representation of the drainage surcharge in urban areas. This method neglects the bidirectional interaction of surface runoff and drainage network, which can consequently lead to over- or underestimation of the flood hazard [56]. Since drainage network systems vary strongly among cities, the application of the 2D modeling approach used is limited. Coupled 1D–2D models allow a more realistic representation of the complex pipe-surface interaction processes and therefore result in a more accurate forecast of urban floods. However, the set-up of fully coupled models requires comprehensive drainage network data and induces high workloads and computation effort [21]. The question of application involves competing priorities, like cost and benefit, and therefore depends on the characteristics of urban areas. Further investigations are planned to evaluate the boundary conditions and limitations of a coupled 1D–2D model in Aachen.
Furthermore, many urban areas around the world experience both pluvial and fluvial with combined flooding leading to a different initial situation that requires a more complex modeling and forecasting approach. Studies indicate promising results of combined fluvial and pluvial flood hazard analysis considering the probabilities of occurrence of combined events [57], whereby real-time flood forecasting combining surface runoff, drainage network systems and fluvial flows are computationally high demanding. However, since recent studies have proven the possibility of efficient methods for offline 1D-2D coupling of hydrodynamic models as well was artificial neural network (ANN)-based techniques [18], subsequent research should examine the possibilities and limits of those techniques in combination with low computer requirements. In this context, the use of cloud computing and highly paralleled multi-model computations are interesting.
In contrast to the standard calibration process of fluvial flood models, the calibration of urban flood models is usually difficult. Pluvial floods are of short duration and occur rapidly, which makes it difficult to collect sufficient observation data and flow measurements [58,59]. Comprehensive calibrations require several storm events with continued observations of flood parameters at several city spots in order to verify model results in space and time [60,61]. Considering the fact that in this study only one rainfall event was available for the model calibration, the main objective of the validation conducted was to compare the flood depths at selected spots with in situ data derived from georeferenced photos. Although crowd-sourcing data from social platforms (e.g., Twitter and Facebook) was available, only estimations of locations and depth of flooding was provided while information about the timing was often absent or too imprecise. Related studies have shown that sensors installed in the drainage network measurements can be used for calibrating coupled 1D–2D models. Furthermore, post-event surveys [62] and new methods for urban flood measurements using state-of-art sensors and surveillance cameras are providing new opportunities for calibrations [63]. However, persistent limitations are connected to the validation of surface flow velocities due to the lack of accurate urban flow measurements. Whereas rough estimations of flow velocities were done in the case study based on observations from images and videos, precise measurements require different methods like large scale particle image velocimetry (LSPIV) techniques [64] or classical in situ flow measurements. In the context that velocity validation is of crucial importance for model calibrations and the development of an effective EWS, further investigations are required.
Depending on the respective topography urban floods can develop high flow rates and thereby transport large amounts of sediment and flotsam as well as contamination by chemicals and sewage [65]. Thus, apart from water depth and flow velocity also the parameter of sediment transport is of crucial importance for assessing the hazard potential of pluvial flood events [66]. In the current model, the sediment transport is not considered such that cascading damage effects are not represented. However, MIKE 21 includes sediment transport module in order to simulate the sediment transport load for an oncoming rainfall event. Further research should therefore investigate the possibilities of including sediment transport module into the modeling approach.
Basic requirements for the application of the proposed framework are high-quality geodata. Therefore, the international use of the system is limited especially in areas where high-resolution DEM data is not available [67]. However, new methods based on satellite data and stereo images show a promising alternative to light detection and ranging (LiDAR) data [68]. Whereas 30 m resolution by SRTM (Shuttle Radar Topography Mission) and 12 m resolution of DLR (German Center for Air- and Space-flight) data is not applicable for inundation models with street level resolution, the use of stereo pictures seems to be a very good alternative with a resolution up to 2 m [69].
In addition, further limitations of the proposed framework are connected to the availability of accurate rainfall forecasts based on radar systems and nowcasting methods. It should be noted that the accuracy of real-time pluvial flood forecasts issued by the EWS system strongly depend on the rainfall forecast accuracy. While the prediction of the maximum rainfall accumulations is often accurate, the exact timing and location of convective storms events are driving factors to substantial uncertainty [70]. Recent studies have proven that the predictability of convective rainfall strongly depends on whether it is controlled by large scale or small scale factors [71]. Therefore, the probability of occurrence for any given location is likely to remain low at lead times beyond a few hours [27]. However, rainfall predictions and nowcasts are constantly improving and providing increasingly better and more accurate results. Therefore, an essential research question remains: how the communication of risk to first responders and public takes place, especially when probabilities of impacts may remain low until very close to the event? In Germany one of the major challenges faced by cities and municipalities is currently imposed by the large number of different state-specific guidelines, methods, software, available resources and preliminary analysis [49]. In this context, a major advantage of the PFA-Operator is its open model system, which can be equipped with individual (hydrodynamic-) modules regardless of their software background. Therefore, existing inundation and/or further analysis forecast like damage models can be integrated into the PFA-Operator. The only precondition is that the models can be run using batch-operations. In addition, the presented offline methods containing hotspots analysis and USC-model determination proved to be an innovative method allowing the effective application of the framework on other study areas. Urban areas with higher risks can be equipped with high resolution inundation models, while less endangered areas are assigned a threshold value. USC-models can represent different resolutions for different degrees of risks. Hereby, communities can adapt the system continuously to their needs, requirements and computational resources.
5. Conclusions
In the present study, an open multi-model controller for the development of a risk-based end-to-end EWS was established in order to issue impact-based threshold-warnings and dynamic inundation forecasts using standard computer systems. Results of the offline and online simulations and in situ-based validations show that the PFA-Operator has a promising ability to combine versatile USC-models and fast simulations while meeting the required accuracy. Thus, the developed system overcomes the main issue of computationally demanding hydrodynamic simulations by the use of performance-monitoring real-time optimization techniques and distributed computing. It includes a transparent tool to find an optimum between computational speed, model accuracy and result usability in order to meet individual requirements. Based on the open-source cross-platform program Qt, the controller runs on all operating systems and, thereby, enables the individual adaption of existing resources and infrastructure.
The following key conclusions and implications were drawn from this research:
- (1)
- The offline processing steps proved to be an effective method in order to localize hotspots and derive computable USC-models. The results obtained from the hotspot validation indicated a sufficient hit rate of 83%. However, uncertainties connected to the object-precise analysis developed due to the sum of uncertainties connected to the entire modeling chain and GIS-based analysis. While the delimitation of the USC-models showed very reasonable and good results, the application in other research areas may introduce more complex and bigger models.
- (2)
- Based on the real-time optimization method, an automated procedure was introduced that improved the computational efficiency of target models while satisfying the model accuracy and result usability. In final performance tests, speedup ratios of 60.9 and 90.4 were achieved by the RT-5 m2 model and RT-8 m2 model respectively, compared to the reference HP-1 m2 model. The deviations of the inundation depth measurements showed sufficient accuracy with an RMSE of a maximum of 2.9 cm and 4.2 cm with regards to the reference model. All investigations demonstrated a good spatial-temporal agreement between real-time dynamic inundation simulations and in situ observations.
- (3)
- By the combination of threshold-based warnings and real-time simulations of target models, the framework proved to be efficient and cost-effective by providing warning indicators that can be adapted to arbitrary urban environments. The open multi model system offers the implementation of interchangeable modules that meet variable backgrounds and needs of end users and resources. However, the application of the framework requires special knowledge and resources including hydrodynamic software and GIS systems.
The authors believe that this framework may be a new and promising approach for the development of localized and adapted end-to-end warning systems, helping local authorities, cities and municipalities to be better informed against pluvial flooding and meeting low-cost computer requirements. Based on the open-model concept the system can be further equipped with different modules (e.g., damage models) and hydrodynamic models regardless their software background. Furthermore, the controller allows the integration of Google Maps for the geovisualization of threshold warnings and flood forecasts in order to improve the communication. Typical end users in Germany are individual city authorities or civil protection organizations such as the Federal Agency for Technical Relief (THW).
Author Contributions
Conceptualization, J.H.; Methodology, J.H.; Modeling, J.H.; Formal Analysis, J.H.; Resources, J.H. and H.S.; Data Curation, J.H.; Writing—Original Draft, J.H.; Writing—Review and Editing, J.H. and H.S.; Visualization, J.H.; Supervision, H.S. All authors have read and agreed to the published version of the manuscript.
Funding
This research received no external funding.
Acknowledgments
The authors thank the KISTERS AG for providing the live-web service HydroMaster. Thanks also to DHI for providing the Mike Flood Software. Finally, the authors thank the Aachen fire brigade for providing data about incomings of emergency calls during the pluvial flood event in May 2018 in Aachen. Furthermore, the authors would like to thank colleagues and friends as well as the editors and anonymous reviewers for their valuable and constructive comments related to this manuscript.
Conflicts of Interest
The authors declare no conflict of interest.
Abbreviations
The following abbreviations are used in this manuscript:
| ANNs | Artificial Neural Networks |
| API | Application Programming Interface |
| DEM | Digital Elevation Model |
| DLR | Deutsches Zentrum für Luft- und Raumfahrt (German Center for Air- and Space-flight) |
| DWD | Deutsche Wetterdienst (German Meteorological Service) |
| EWS | Early Warning System |
| GIS | Geographic Information Systems |
| HPC | High Performance Computing |
| HTTP | Hypertext Transfer Protocol |
| ICM | Integrated Catchment Modeling (Innovyze Software) |
| LiDAR | Light Detection and Ranging |
| PFA | Pluvial Flood Alarm |
| SRTM | Shuttle Radar Topography Mission |
| SQL | Structured Query Language |
| USC | Urban Subcatchment |
Appendix A
Figure A1.
Example of the PFA code for the implementation of the DWD-HTTP request.

Figure A2.
Example of the PFA code for the implantation of the model broker to activate a simulation.
Figure A2.
Example of the PFA code for the implantation of the model broker to activate a simulation.

References
- Llasat, M.C.; Marcos, R.; Turco, M.; Gilabert, J.; Llasat-Botija, M. Trends in flash flood events versus convective precipitation in the Mediterranean region: The case of Catalonia. J. Hydrol. 2016, 541, 24–37. [Google Scholar] [CrossRef] [Green Version]
- Rubinato, M.; Nichols, A.; Peng, Y.; Zhang, J.-M.; Lashford, C.; Cai, Y.-P.; Lin, P.-Z.; Tait, S. Urban and river flooding: Comparison of flood risk management approaches in the UK and China and an assessment of future knowledge needs. Water Sci. Eng. 2019, 12, 274–283. [Google Scholar] [CrossRef]
- Yin, J.; Yu, D.; Yin, Z.; Liu, M.; He, Q. Evaluating the impact and risk of pluvial flash flood on intra-urban road network: A case study in the city center of Shanghai, China. J. Hydrol. 2016, 537, 138–145. [Google Scholar] [CrossRef] [Green Version]
- Scottish Government. Flood Risk Management (Scotland) Act 2009: Surface Water Management Planning Guidance; Scottish Government: Edinburgh, UK, 2013; ISBN 978-1-78256-378-5.
- Borga, M.; Anagnostou, E.N.; Blöschl, G.; Creutin, J.-D. Flash flood forecasting, warning and risk management: The HYDRATE project. Environ. Sci. Policy 2011, 14, 834–844. [Google Scholar] [CrossRef]
- Borga, M.; Anagnostou, E.N.; Blöschl, G.; Creutin, J.-D. Flash floods: Observations and analysis of hydro-meteorological controls. J. Hydrol. 2010, 394, 1–3. [Google Scholar] [CrossRef]
- Nicklin, H.; Leicher, A.M.; Dieperink, C.; Van Leeuwen, K. Understanding the costs of inaction—An assessment of pluvial flood damages in two European cities. Water 2019, 11, 801. [Google Scholar] [CrossRef] [Green Version]
- Pilling, C.; Dodds, V.; Cranston, M.; Price, D.; Harrison, T.; How, A. Flood forecasting—A National overview for Great Britain. In Flood Forecasting; Academic Press: Cambridge, MA, USA, 2016; pp. 201–247. ISBN 9780128018842. [Google Scholar]
- Blum, A.G.; Ferraro, P.J.; Archfield, S.A.; Ryberg, K.R. Causal effect of impervious cover on annual flood magnitude for the United States. Geophys. Res. Lett. 2020, 47. [Google Scholar] [CrossRef] [Green Version]
- Boers, N.; Goswami, B.; Rheinwalt, A.; Bookhagen, B.; Hoskins, B.; Kurths, J. Complex networks reveal global pattern of extreme-rainfall teleconnections. Nature 2019. [Google Scholar] [CrossRef] [PubMed]
- Munich, R.E. Naturkatastrophen 2016: Analysen, bewertungen, positionen. Topics Geo Ausgabe 2017, 54–56. [Google Scholar]
- The Berlin-Based German Insurance Association (GDV). Die Schaden-Chronik der Deutschen Versicherer, Naturgefahrenreport 2018; GDV: Berlin, Germany, 2018. [Google Scholar]
- Der Deutscher Wetterdienst (DWD); Gesamtverban der Deuthschen Versicherungsgesellschaft (GDV). Forschungsprojekt Starkregen; GDV: Berlin, Germany, 2019. [Google Scholar]
- Sörensen, J.; Mobini, S. Pluvial, urban flood mechanisms and characteristics—Assessment based on insurance claims. J. Hydrol. 2017, 555, 51–67. [Google Scholar] [CrossRef]
- Schanze, J. Pluvial flood risk management: An evolving and specific field. J. Flood Risk Manag. 2018, 11, 227–229. [Google Scholar] [CrossRef]
- James, P.M.; Reichert, B.K.; Heizenreder, D. NowCastMIX: Automatic integrated warnings for severe convection on nowcasting time scales at the German weather service. Wea. Forecast. 2018, 33, 1413–1433. [Google Scholar] [CrossRef]
- Chatterjee, C.; Förster, S.; Bronstert, A. Comparison of hydrodynamic models of different complexities to model floods with emergency storage areas. Hydrol. Process. 2008, 22, 4695–4709. [Google Scholar] [CrossRef]
- Zanchetta, A.D.L.; Coulibaly, P. Recent advances in real-time pluvial flash flood forecasting. Water 2020, 12, 570. [Google Scholar] [CrossRef] [Green Version]
- Hartnett, M.; Nash, S. High-resolution flood modeling of urban areas using MSN_Flood. Water Sci. Eng. 2017, 10, 175–183. [Google Scholar] [CrossRef]
- Wang, Y.; Chen, A.S.; Fu, G.; Djordjević, S.; Zhang, C.; Savić, D.A. An integrated framework for high-resolution urban flood modelling considering multiple information sources and urban features. Environ. Model. Softw. 2018, 107, 85–95. [Google Scholar] [CrossRef]
- Henonin, J.; Russo, B.; Mark, O.; Gourbesville, P. Real-time urban flood forecasting and modelling—A state of the art. J. Hydroinform. 2013, 15, 717–736. [Google Scholar] [CrossRef]
- Ochoa-Rodríguez, S.; Wang, L.-P.; Thraves, L.; Johnston, A.; Onof, C. Surface water flood warnings in England: Overview, assessment and recommendations based on survey responses and workshops. J. Flood Risk Manag. 2018, 11, S211–S221. [Google Scholar] [CrossRef]
- Met Office/Environment Agency. Extreme Rainfall Alert User Guide; Flood Forecasting Centre: Exeter, UK, 2010. [Google Scholar]
- Der Deutsche Wetterdienst (DWD). RADVOR (Radar Precipitation Forecast). Available online: https://www.dwd.de/EN/ourservices/radvor/radvor.html (accessed on 30 June 2020).
- Metin, D.; Apel, H.; Nguyen, V.D.; Bjorn, G.; Kreibich, H.; Schröter, K.; Vorogushyn, S.; Merz, B. Effects of changes along the risk chain on flood risk. In Proceedings of the 19th EGU General Assembly (EGU 2017), Vienna, Austria, 23–28 April 2017; p. 8711. [Google Scholar]
- Cranston, M.; Speight, L.; Kelly, L.; White, C.J. Towards Improved Surface Water Flood Forecasts for Scotland: A Review of UK and International Operational and Emerging Capabilities; University of Strathclyde: Glasgow, UK, 2019. [Google Scholar]
- Speight, L.; Cole, S.J.; Moore, R.J.; Pierce, C.; Wright, B.; Golding, B.; Cranston, M.; Tavendale, A.; Dhondia, J.; Ghimire, S. Developing surface water flood forecasting capabilities in Scotland: An operational pilot for the 2014 Commonwealth Games in Glasgow. J. Flood Risk Manag. 2018, 11, S884–S901. [Google Scholar] [CrossRef]
- Chu, H.; Wu, W.; Wang, Q.J.; Nathan, R.; Wei, J. An ANN-based emulation modelling framework for flood inundation modelling: Application, challenges and future directions. Environ. Model. Softw. 2020, 124, 104587. [Google Scholar] [CrossRef]
- Berkhahn, S.; Fuchs, L.; Neuweiler, I. An ensemble neural network model for real-time prediction of urban floods. J. Hydrol. 2019, 575, 743–754. [Google Scholar] [CrossRef]
- Acosta-Coll, M.; Ballester-Merelo, F.; Martinez-Peiró, M.; Emiro De la Hoz, F. Real-time early warning system design for pluvial flash floods: A review. Sensors 2018, 18, 2255. [Google Scholar] [CrossRef] [Green Version]
- Hu, X.; Song, L. Hydrodynamic modeling of flash flood in mountain watersheds based on high-performance GPU computing. Nat. Hazards 2018, 91, 567–586. [Google Scholar] [CrossRef]
- Xing, Y.; Liang, Q.; Wang, G.; Ming, X.; Xia, X. City-scale hydrodynamic modelling of urban flash floods: The issues of scale and resolution. Nat. Hazards 2019, 96, 473–496. [Google Scholar] [CrossRef] [Green Version]
- Hofmann, J.; Schüttrumpf, H. Risk-based early warning system for pluvial flash floods: Approaches and foundations. Geosciences 2019, 9, 127. [Google Scholar] [CrossRef] [Green Version]
- Sander, J.; Ester, M.; Kriegel, H.-P.; Xu, X. Density-Based Clustering in Spatial Databases: The Algorithm GDBSCAN and its applications. Data Min. Knowl. Discov. 1998, 2, 169–194. [Google Scholar] [CrossRef]
- Der Deutsche Wetterdienst (DWD). Open Data. Available online: https://www.dwd.de/DE/leistungen/opendata/opendata.html (accessed on 30 June 2020).
- HydroMaster. Available online: https://www.hydromaster.com/de/ (accessed on 30 June 2020).
- Der Deutsche Wetterdienst (DWD). Radarniederschlag: Prinzip der Niederschlags-Bestimmung mit Radar Inkl: Umrechnung der Radarreflektivitäten in Momentanwerte des Niederschlages Version 1.1; Der Deutsche Wetterdienst (DWD): Offenbach, Germany, 2015. [Google Scholar]
- Schmetz, O.; Esser, R. Die Innenstadt versinkt in Wassermassen: Schweres Unwetter trifft Aachen mit voller Wucht: Ungezählte Keller vollgelaufen, Straßen überflutet. Feuerwehr fährt 400 Einsätze. Aachener Zeitung, 30 May 2018. [Google Scholar]
- Bez-Reg Köln; Geobasis Bezirksregierung Köln. Open Data—Digitale Geobasisdaten NRW. 2018. Available online: https://www.opengeodata.nrw.de/produkte/ (accessed on 30 June 2020).
- QGIS Project. PyQGIS Developer Cookbook: Release 3.4. Available online: https://docs.qgis.org/3.4/pdf/en/QGIS-3.4-PyQGISDeveloperCookbook-en.pdf (accessed on 30 June 2020).
- Google Operating System. Google Earth Includes a Web Browser. Available online: http://googlesystem.blogspot.com/2010/06/google-earth-includes-web-browser.html (accessed on 30 June 2020).
- Hirano, K.; Maki, M. Imminent nowcasting for severe rainfall using vertically integrated liquid water content derived from X-band polarimetric radar. J. Meteorol. Soc. Jpn. 2018, 96A, 201–220. [Google Scholar] [CrossRef] [Green Version]
- Thorndahl, S.; Nielsen, J.E.; Jensen, D.G. Urban pluvial flood prediction: A case study evaluating radar rainfall nowcasts and numerical weather prediction models as model inputs. Water Sci. Technol. 2016, 74, 2599–2610. [Google Scholar] [CrossRef]
- Yoon, S.-S. Adaptive blending method of radar-based and numerical weather prediction QPFs for urban flood forecasting. Remote Sens. Remote Environ. 2019, 11, 642. [Google Scholar] [CrossRef] [Green Version]
- Der Deutsche Wetterdienst (DWD). RADOLAN/RADVOR: Hoch Aufgelöste Niederschlagsanalyse und–Vorhersage auf der Basis Quantitativer Radar–und Ombrometerdaten für Grenzüberschreitende Fluss–Einzugsgebiete von Deutschland im Echtzeitbetrieb, Beschreibung des Kompositformats, Version 2.5. Available online: www.dwd.de/DE/leistungen/radolan/radolan_info/radolan_radvor_op_komposit_format_pdf.pdf?__blob=publicationFile&v=8 (accessed on 30 June 2020).
- DHI Water and Environment. MIKE 21 Flow Model FM. Hydrodynamic Module User Guide; DHI Water and Environment: Denmark, The Netherlands, 2017. [Google Scholar]
- DWD Climate Datacenter (CDC). Raster der Wiederkehrintervalle für Starkregen (Bemessungsniederschläge) in Deutschland (KOSTRA-DWD), Version 2010R; Deutscher Wetterdienst CDC: Offenbach am Main, Germany, 2010. [Google Scholar]
- Yu, D.; Yin, J.; Liu, M. Validating city-scale surface water flood modelling using crowd-sourced data. Environ. Res. Lett. 2016, 11, 124011. [Google Scholar] [CrossRef]
- Schmitt, T.G.; Scheid, C. Evaluation and communication of pluvial flood risks in urban areas. WIREs Water 2020, 7. [Google Scholar] [CrossRef] [Green Version]
- Russo, B.; Sanchez, P.; Llort, X.; Rodriguez, A. Advanced urban flood EWS integrating radar nowcasting and 1D/2D modelling in real time. In Proceedings of the 14th IWA/IAHR International Conference on Urban Drainage, Prague, Czech Republic, 10–15 September 2017. [Google Scholar]
- Neal, R.A.; Boyle, P.; Grahame, N.; Mylne, K.; Sharpe, M. Ensemble based first guess support towards a risk-based severe weather warning service. Met. Apps 2014, 21, 563–577. [Google Scholar] [CrossRef]
- Hurford, A.P.; Priest, S.J.; Parker, D.J.; Lumbroso, D.M. The effectiveness of extreme rainfall alerts in predicting surface water flooding in England and Wales. Int. J. Climatol. 2012, 32, 1768–1774. [Google Scholar] [CrossRef]
- Der Deutsche Wetterdienst (DWD). Annual Report 2016; DWD: Offenbach am Main, Germany, 2016. [Google Scholar]
- The University Corporation for Atmospheric Research (UCAR). Flash Flood Early Warning System Reference Guide (US National Weather Service and The COMET Program) 2010. Available online: https://www.meted.ucar.edu/training_module.php?id=958#.XvsrG-dRVPZ (accessed on 30 June 2020).
- Llort, X.; Sánchez-Diezma, R.; Rodríguez, A.; Sancho, D.; Berenguer, M.; Sempere-Torres, D. FloodAlert: A simplified radar-based EWS for urban flood warning. In Proceedings of the 11th International Conference on Hydroinformatics (HIC 2014), New York, NY, USA, 17–21 August 2014. [Google Scholar]
- Schmitt, T.G.; Thomas, M.; Ettrich, N. Assesment of urban flooding by dual drainage simulation model RisUrSim. Water Sci. Technol. 2005, 52, 257–264. [Google Scholar] [CrossRef] [PubMed]
- Apel, H.; Martínez Trepat, O.; Hung, N.N.; Chinh, D.T.; Merz, B.; Dung, N.V. Combined fluvial and pluvial urban flood hazard analysis: Concept development and application to Can Tho City, Mekong Delta, Vietnam. Nat. Hazards Earth Syst. Sci. 2016, 16, 941–961. [Google Scholar] [CrossRef] [Green Version]
- Zevenbergen, C.; Cashman, A.; Evelpidou, N.; Pasche, E.; Garvin, S.; Ashley, R. Urban Flood Management; CRC Press: Hoboken, NJ, USA, 2012; ISBN 9780415559447. [Google Scholar]
- Leandro, J.; Djordjevic, S.; Chen, A.S.; Savić, D.A.; Stanić, M. Calibration of a 1D/1D urban flood model using 1D/2D model results in the absence of field data. Water Sci. Technol. 2011, 64, 1016–1024. [Google Scholar] [CrossRef] [Green Version]
- Dottori, F.; Todini, E. Testing a simple 2D hydraulic model in an urban flood experiment. Hydrol. Process. 2013, 27, 1301–1320. [Google Scholar] [CrossRef]
- Hunter, N.M.; Bates, P.D.; Horritt, M.S.; Wilson, M.D. Simple spatially distributed models for predicting flood inundation: A review. Geomorphology 2007, 90, 208–225. [Google Scholar] [CrossRef]
- Ciervo, F.; Papa, M.N.; Medina, V.; Bateman, A. Simulation of flash floods in ungauged basins using post-event surveys and numerical modelling. J. Flood Risk Manag. 2015, 8, 343–355. [Google Scholar] [CrossRef]
- Moy de Vitry, M.; Dicht, S.; Leitão, J.P. FloodX: Urban flash flood experiments monitored with conventional and alternative sensors. Earth Syst. Sci. Data 2017, 9, 657–666. [Google Scholar] [CrossRef] [Green Version]
- Seong, H.; Rhee, D.S.; Park, I. Analysis of urban flood inundation patterns according to rainfall intensity using a rainfall simulator in the Sadang Area of South Korea. Appl. Sci. 2020, 10, 1158. [Google Scholar] [CrossRef] [Green Version]
- Bronstert, A.; Agarwal, A.; Boessenkool, B.; Crisologo, I.; Fischer, M.; Heistermann, M.; Köhn-Reich, L.; López-Tarazón, J.A.; Moran, T.; Ozturk, U.; et al. Forensic hydro-meteorological analysis of an extreme flash flood: The 2016-05-29 event in Braunsbach, SW Germany. Sci. Total Environ. 2018, 630, 977–991. [Google Scholar] [CrossRef]
- Kourgialas, N.N.; Karatzas, G.P. A hydro-sedimentary modeling system for flash flood propagation and hazard estimation under different agricultural practices. Nat. Hazards Earth Syst. Sci. 2014, 14, 625–634. [Google Scholar] [CrossRef] [Green Version]
- René, J.-R.; Djordjević, S.; Butler, D.; Madsen, H.; Mark, O. Assessing the potential for real-time urban flood forecasting based on a worldwide survey on data availability. Urban Water J. 2014, 11, 573–583. [Google Scholar] [CrossRef] [Green Version]
- Wang, S.; Ren, Z.; Wu, C.; Lei, Q.; Gong, W.; Ou, Q.; Zhang, H.; Ren, G.; Li, C. DEM generation from Worldview-2 stereo imagery and vertical accuracy assessment for its application in active tectonics. Geomorphology 2019, 336, 107–118. [Google Scholar] [CrossRef]
- Almeida, L.; Almar, R.; Bergsma, E.; Berthier, E.; Baptista, P.; Garel, E.; Dada, O.; Alves, B. Deriving High spatial-resolution coastal topography from sub-meter satellite stereo imagery. Remote Sens. Environ. 2019, 11, 590. [Google Scholar] [CrossRef] [Green Version]
- Flack, D.; Skinner, C.; Hawkness-Smith, L.; O’Donnell, G.; Thompson, R.; Waller, J.; Chen, A.; Moloney, J.; Largeron, C.; Xia, X.; et al. Recommendations for Improving Integration in national end-to-end flood forecasting systems: An overview of the FFIR (Flooding From Intense Rainfall) program. Water 2019, 11, 725. [Google Scholar] [CrossRef] [Green Version]
- Flack, D.L.A.; Gray, S.L.; Plant, R.S.; Lean, H.W.; Craig, G.C. Convective-scale perturbation growth across the spectrum of convective regimes. Mon. Wea. Rev. 2018, 146, 387–405. [Google Scholar] [CrossRef]
Figure 1.
Offline and online components for the operational implementation of the framework.

Figure 2.
Localization of hotspots and urban subcatchments (USC).

Figure 3.
Process schema of the pluvial flood alarm operator (PFA-Operator) including the main components and process steps. The hydrodynamic flood forecasts are activated once the R-threshold is exceeded.
Figure 3.
Process schema of the pluvial flood alarm operator (PFA-Operator) including the main components and process steps. The hydrodynamic flood forecasts are activated once the R-threshold is exceeded.

Figure 4.
(a) Digital elevation model (DEM) of the study area including positions of emergency calls of the pluvial event in 29 May 2018 in the city of Aachen with enlarged view of central areas (Kaiserplatz) and (b) measured 1 h rainfall pattern (14:25–15:25 h) of the May event [36] highlighting the complete case study area (black rectangle) and special focus area (dashed rectangle).

Figure 5.
Zoom-in of a systematic risk analysis and clustered hotspots in a 100 years scenario (47 mm/h) and hotspot clustered emergency calls during the May event 2018 in the center of Aachen.
Figure 5.
Zoom-in of a systematic risk analysis and clustered hotspots in a 100 years scenario (47 mm/h) and hotspot clustered emergency calls during the May event 2018 in the center of Aachen.

Figure 6.
Determined urban subcatchments and catchment sizes including drainage points and flow paths in the study area of Aachen.
Figure 6.
Determined urban subcatchments and catchment sizes including drainage points and flow paths in the study area of Aachen.

Figure 7.
Maximum inundations maps on the basis of HP-model setting using maximum mesh sizes of 1 m2 (A), 5 m2 (B) and 8 m2 (C).
Figure 7.
Maximum inundations maps on the basis of HP-model setting using maximum mesh sizes of 1 m2 (A), 5 m2 (B) and 8 m2 (C).

Figure 8.
(a) Maximum inundation depth difference between HP-8 m2 and RT-8 m2 simulations shown on a 2D-difference map, and (b) on a scatterplot
Figure 8.
(a) Maximum inundation depth difference between HP-8 m2 and RT-8 m2 simulations shown on a 2D-difference map, and (b) on a scatterplot

Figure 9.
(a) Maximum velocity difference between HP-8 m2 and RT-8 m2 shown on a 2D-difference map, and (b) on a scatterplot
Figure 9.
(a) Maximum velocity difference between HP-8 m2 and RT-8 m2 shown on a 2D-difference map, and (b) on a scatterplot

Figure 10.
Maximum inundation maps (A–C) and velocity maps (A2–C2) on different models: A-A2 HP-1 m2; B-B2 RT-5 m2 and C-C2 RT-8 m2.
Figure 10.
Maximum inundation maps (A–C) and velocity maps (A2–C2) on different models: A-A2 HP-1 m2; B-B2 RT-5 m2 and C-C2 RT-8 m2.

Figure 11.
Test rainfall event consisting of nowcast and actual measurement of the May event (total 52 mm) and simulated warnings and forecasts of the PFA-Operator.
Figure 11.
Test rainfall event consisting of nowcast and actual measurement of the May event (total 52 mm) and simulated warnings and forecasts of the PFA-Operator.

Figure 12.
(a) Results of the different F5 simulations comparing HP-1 m2 simulation results with RT-5 m2 and RT-8 m2 simulation results in front of water depth estimations from in situ observations. (b) Results of the same simulations shown on a 2D-map and highlighted locations of in situ observations.

Figure 13.
In situ observations captured during the May event in the center of Aachen; locations are indicated by (A–D) shown on the map Figure 11; flood depths estimations are marked with a red square.
Figure 13.
In situ observations captured during the May event in the center of Aachen; locations are indicated by (A–D) shown on the map Figure 11; flood depths estimations are marked with a red square.


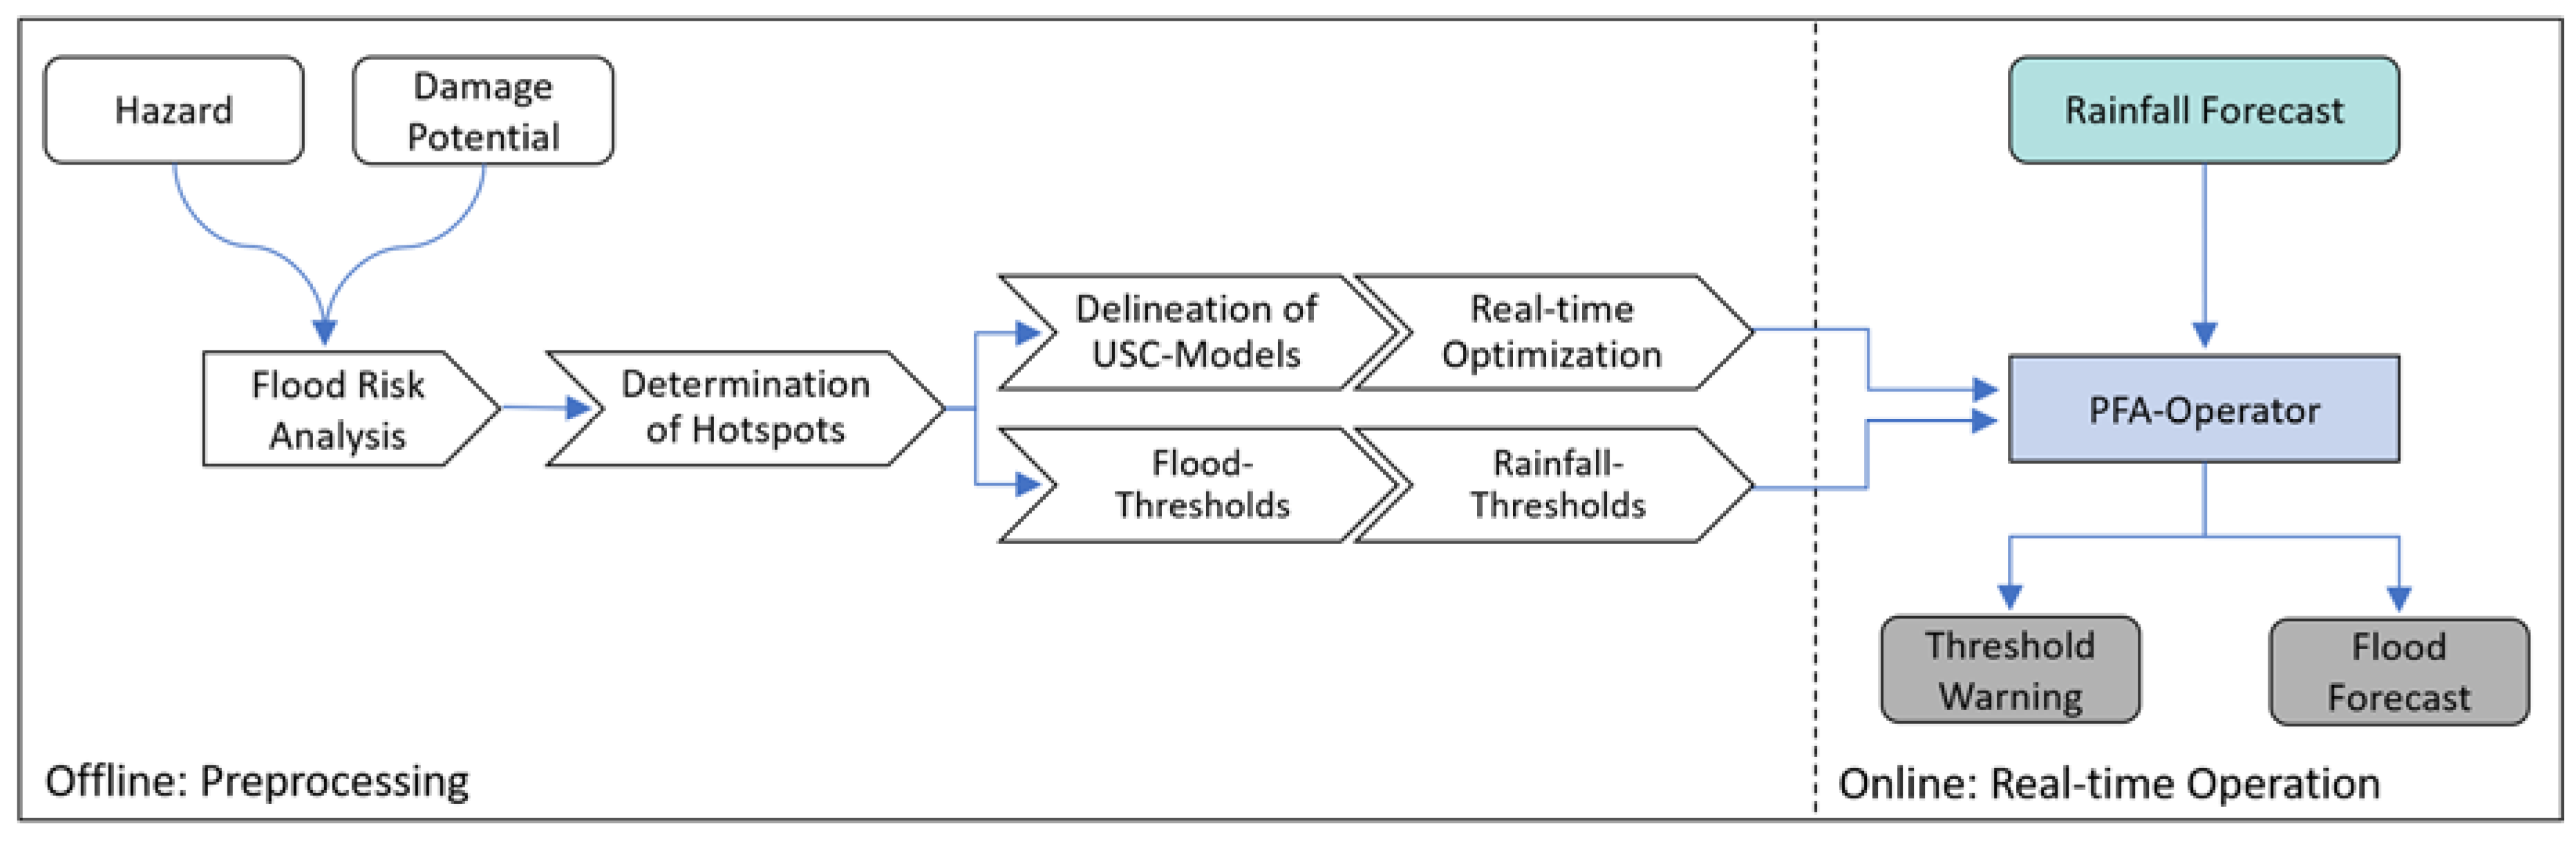
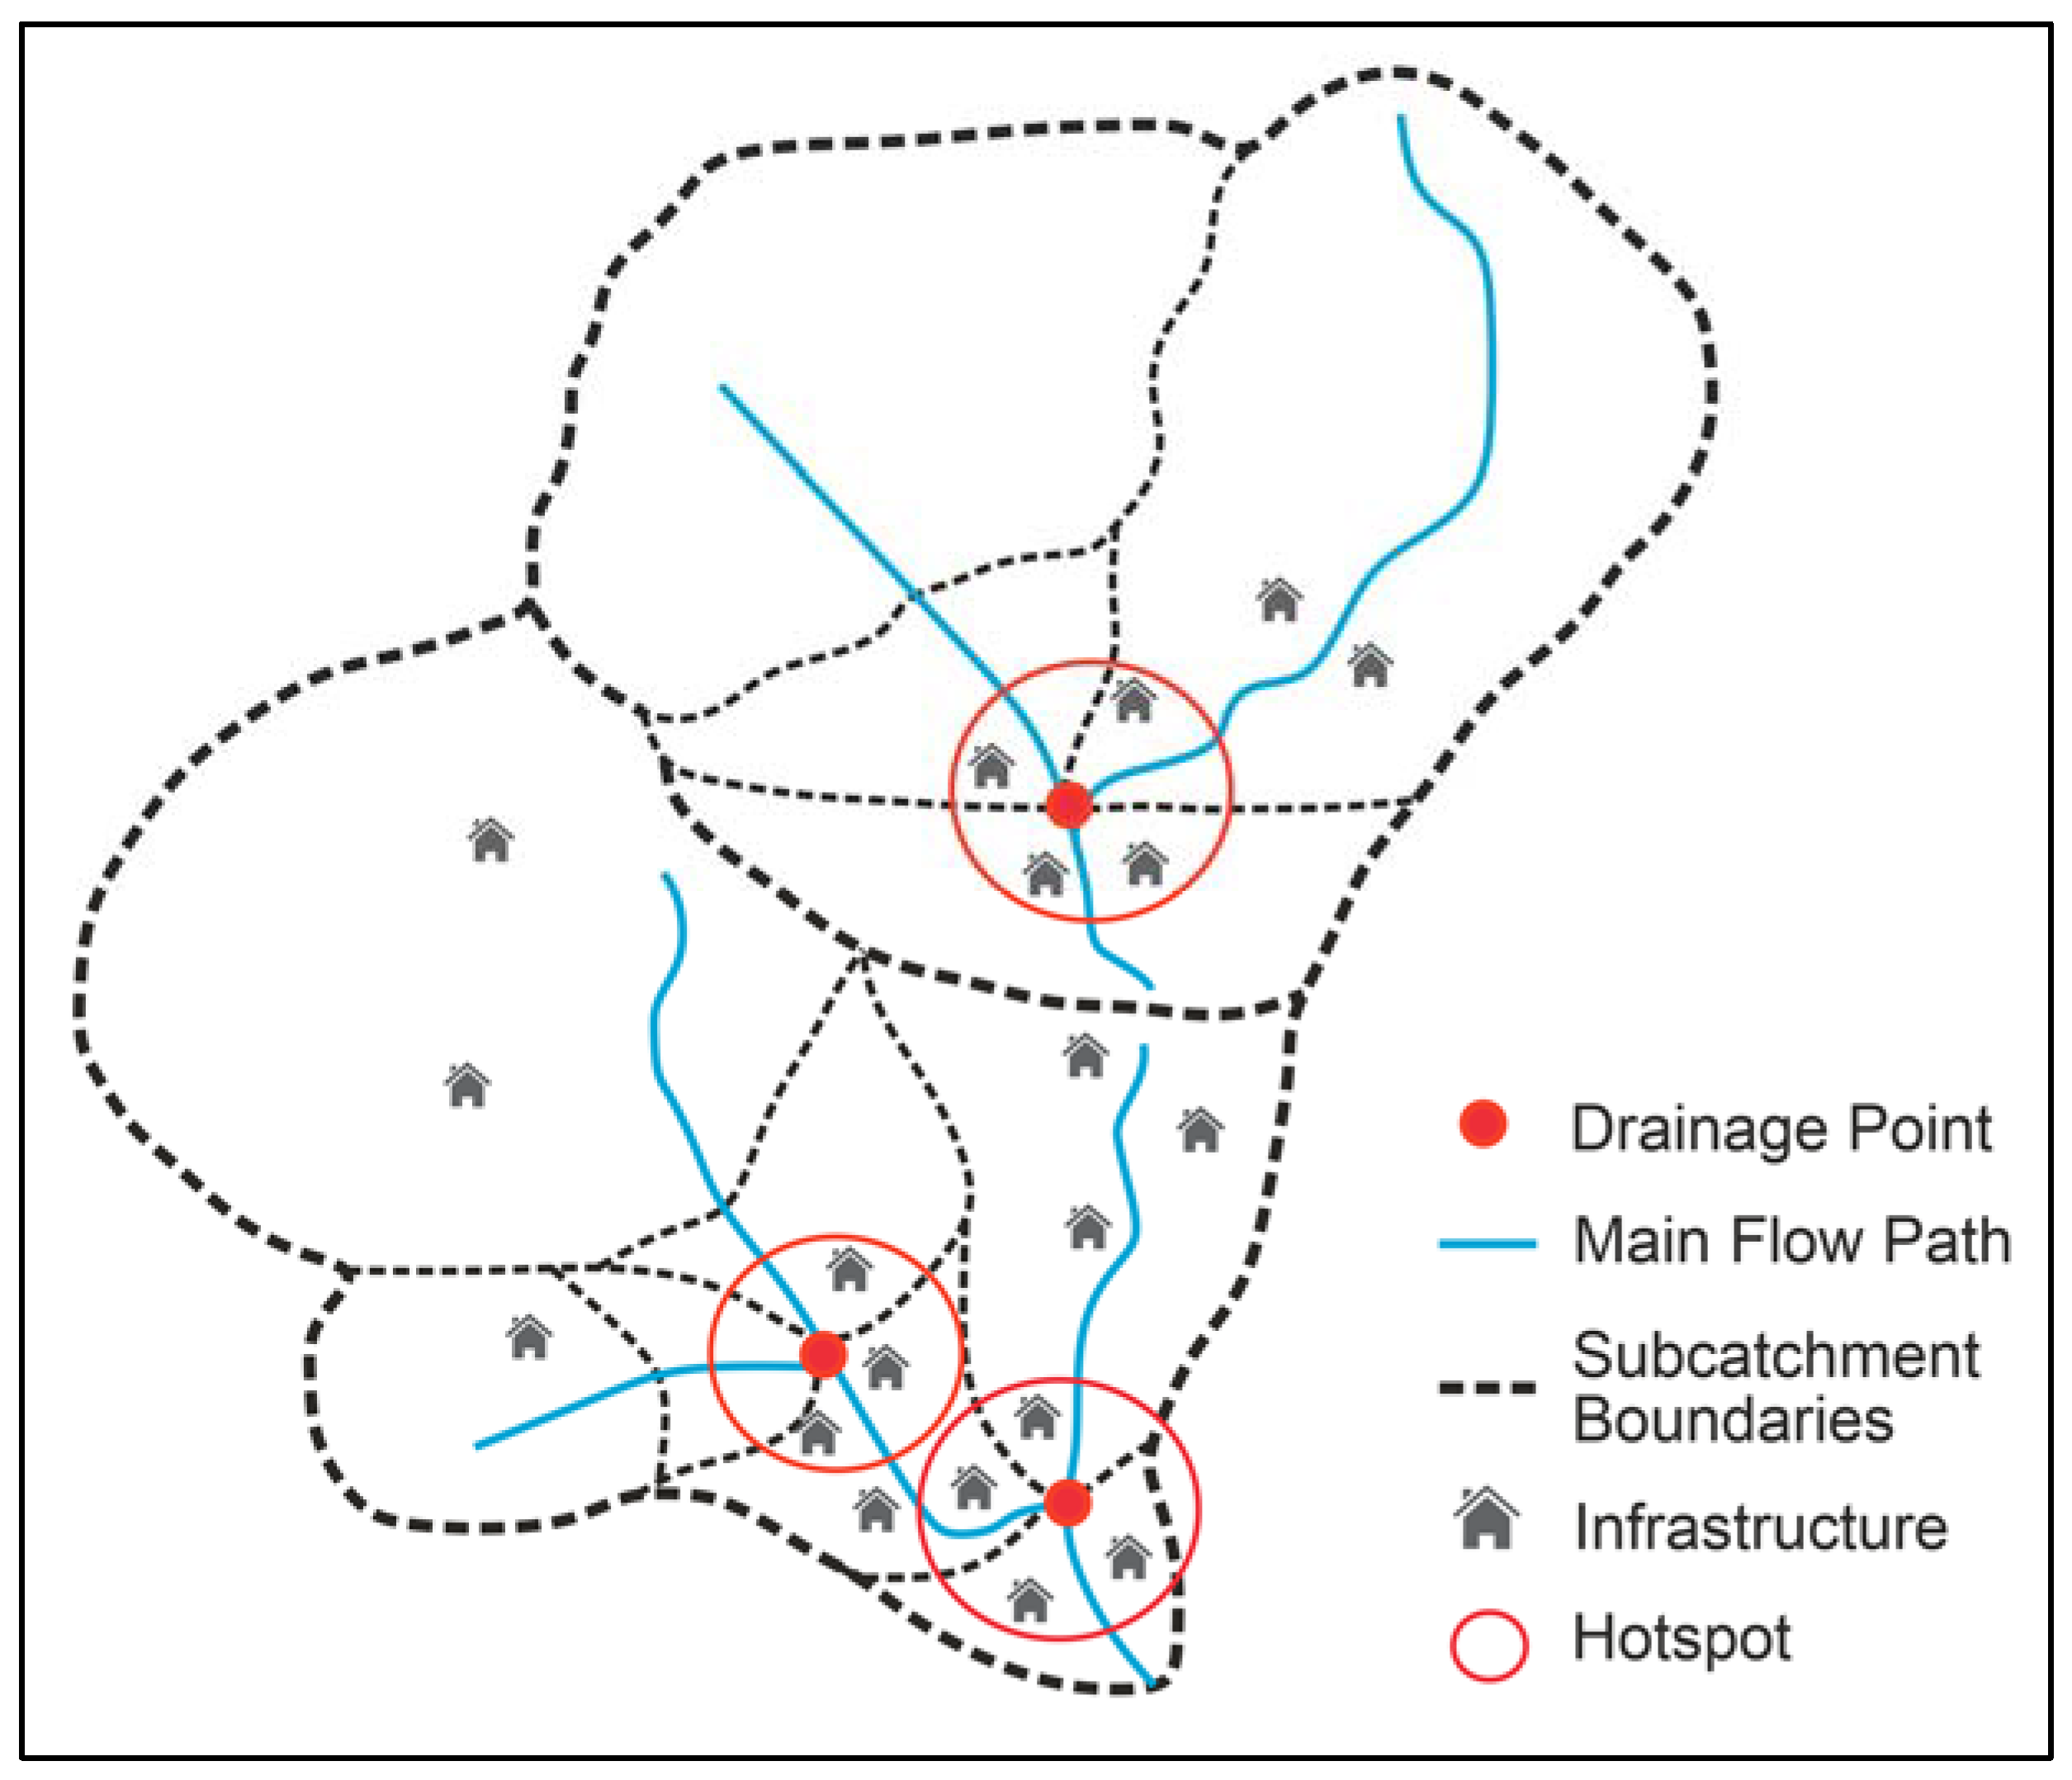
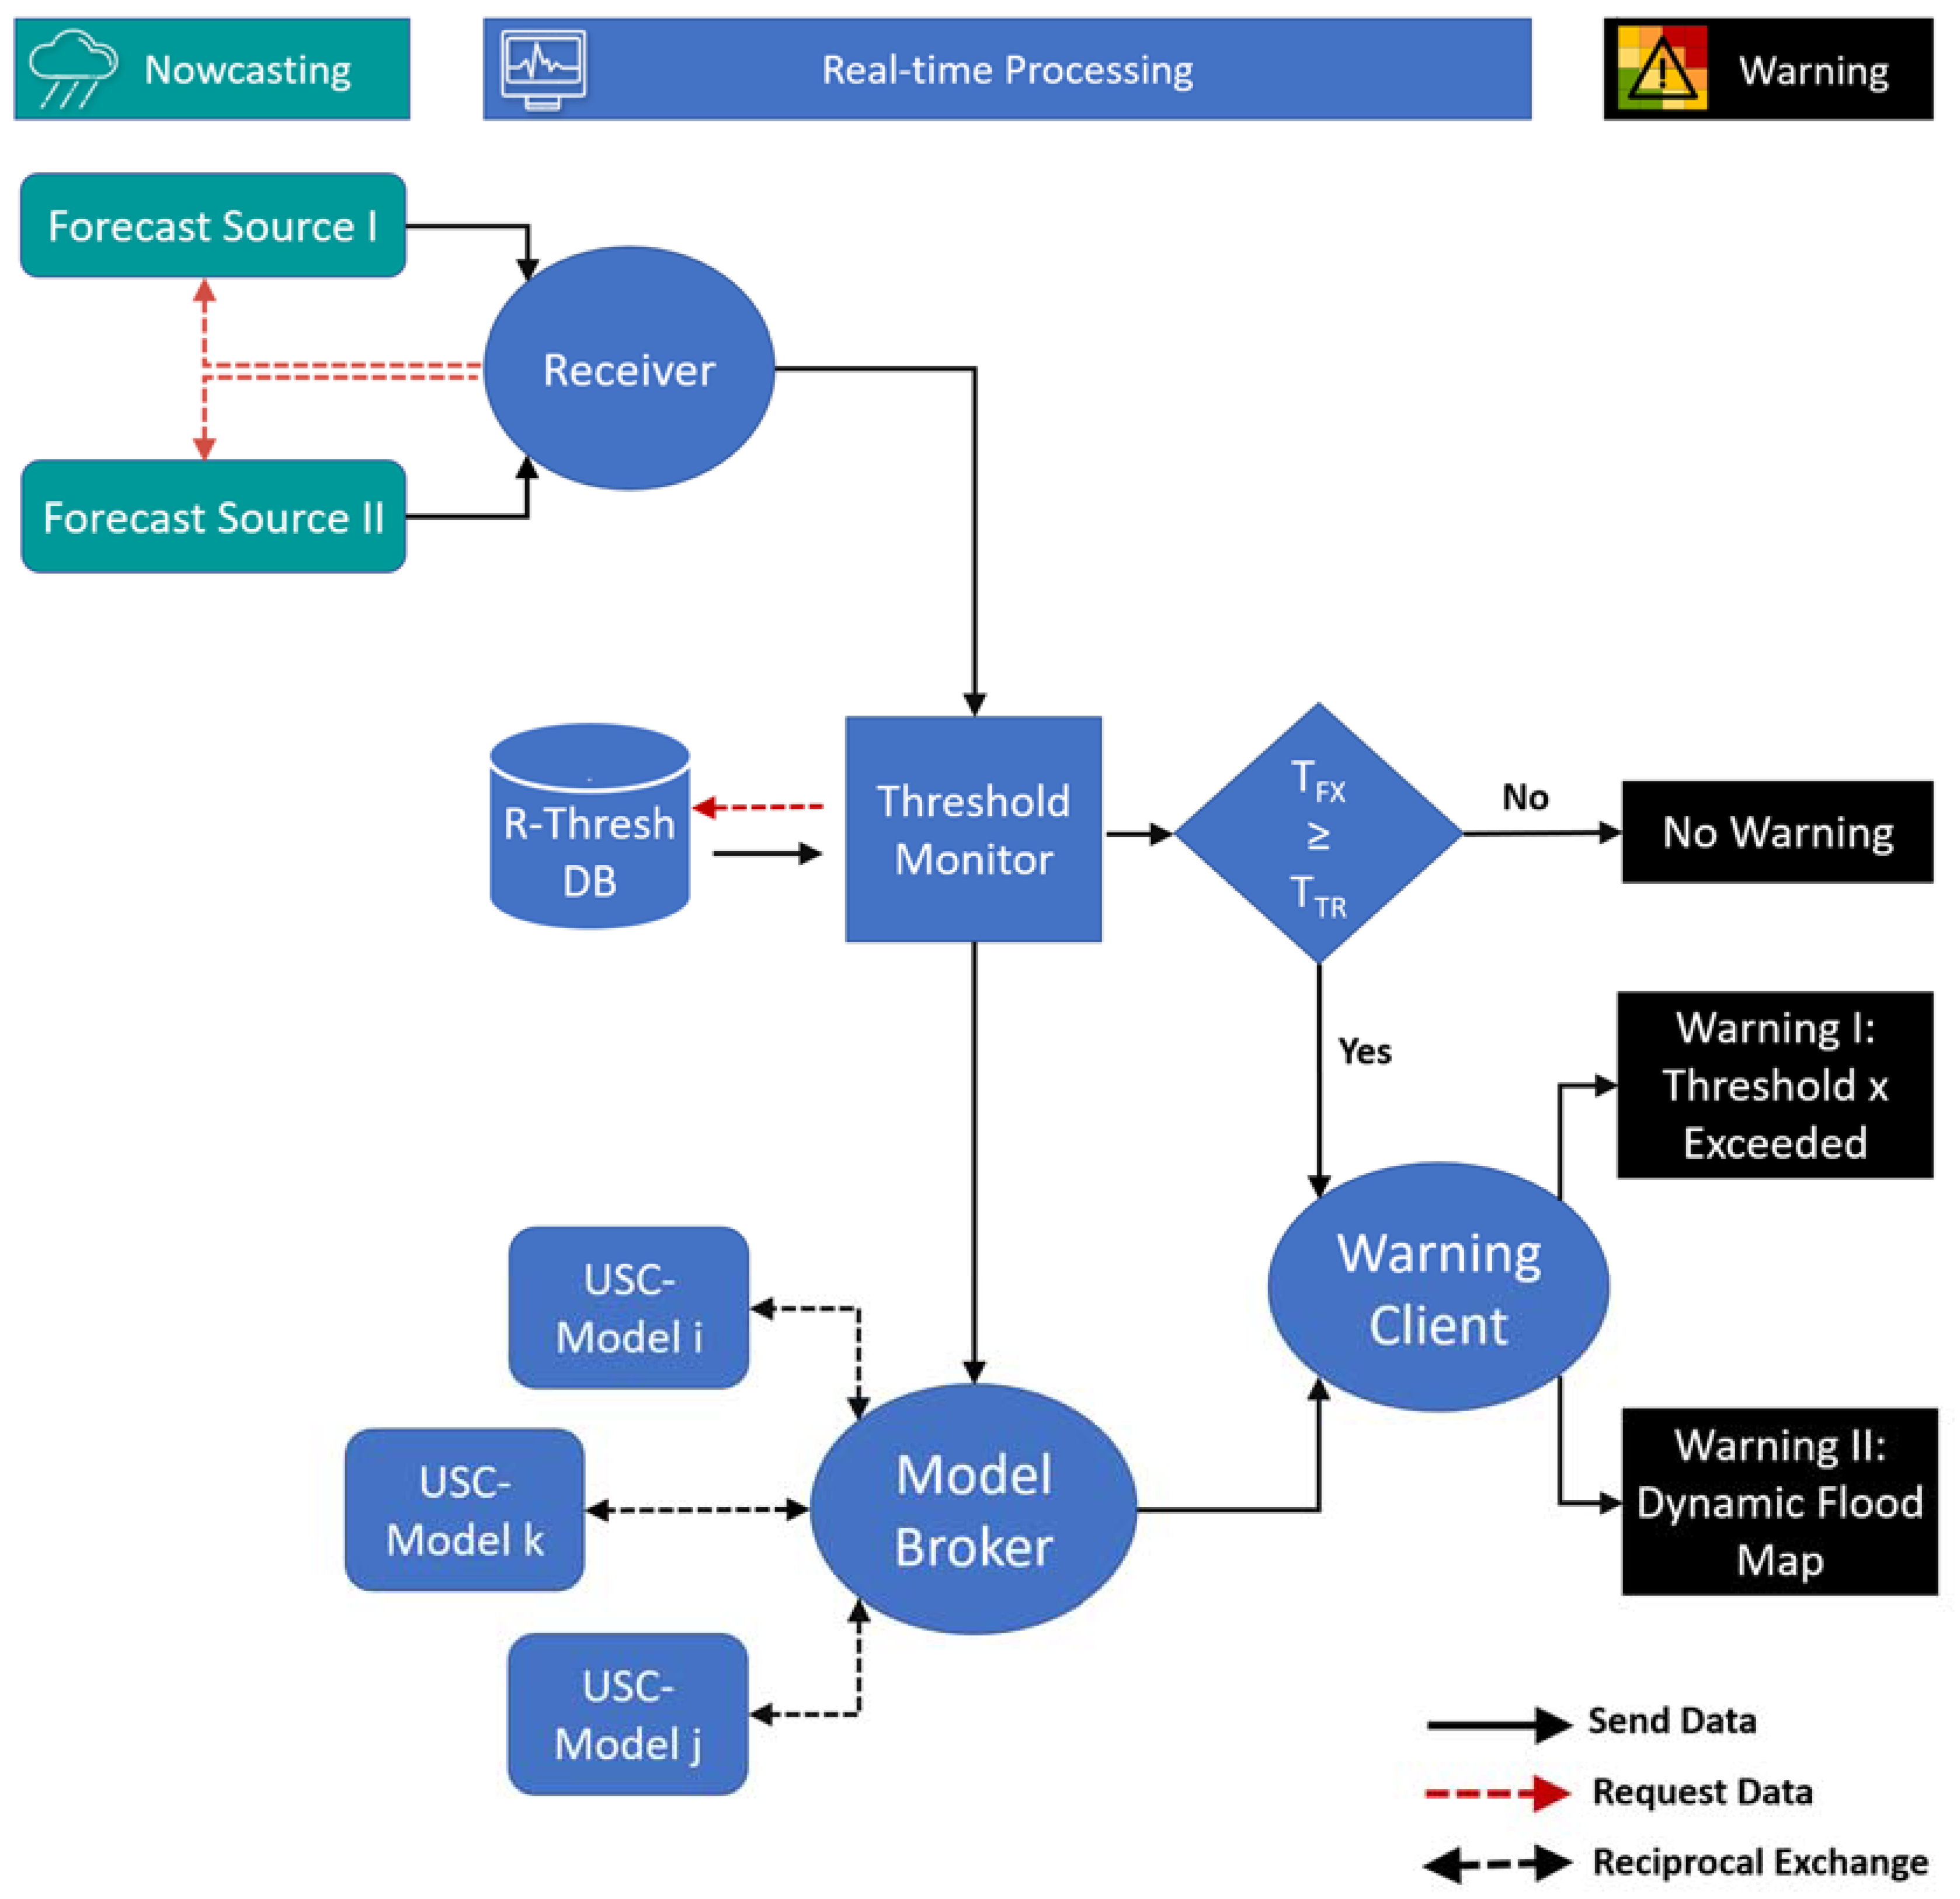
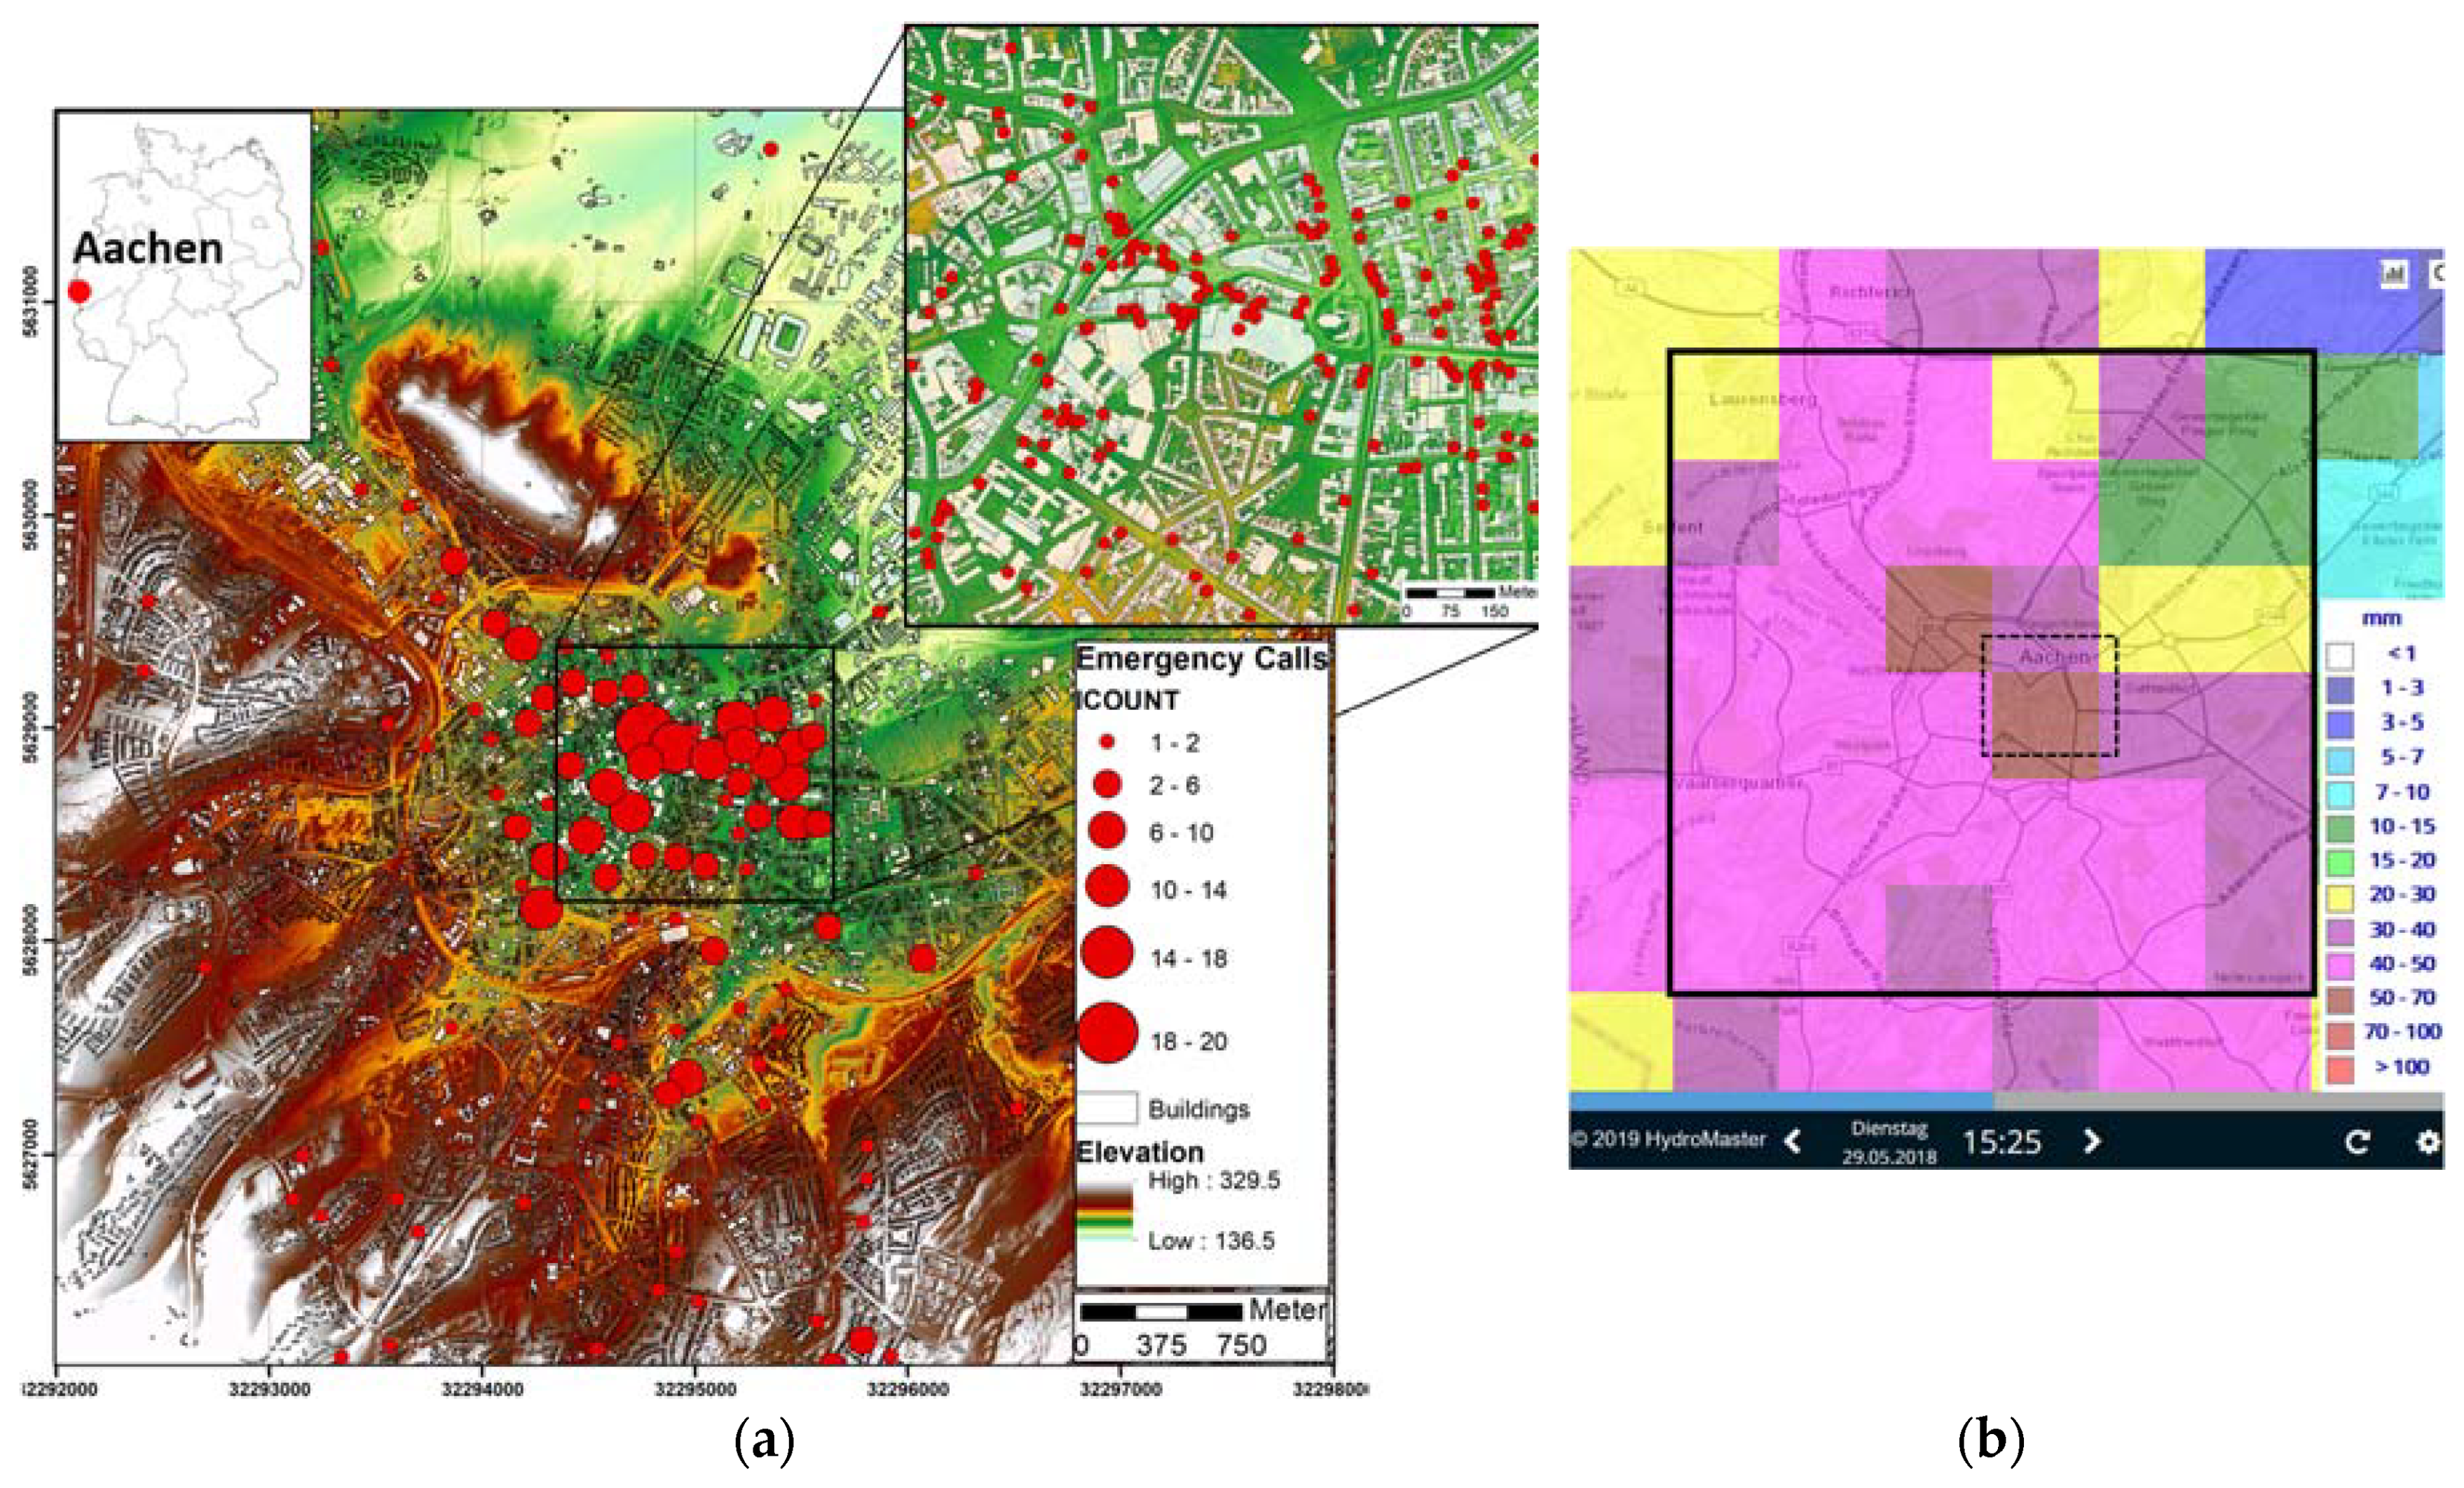
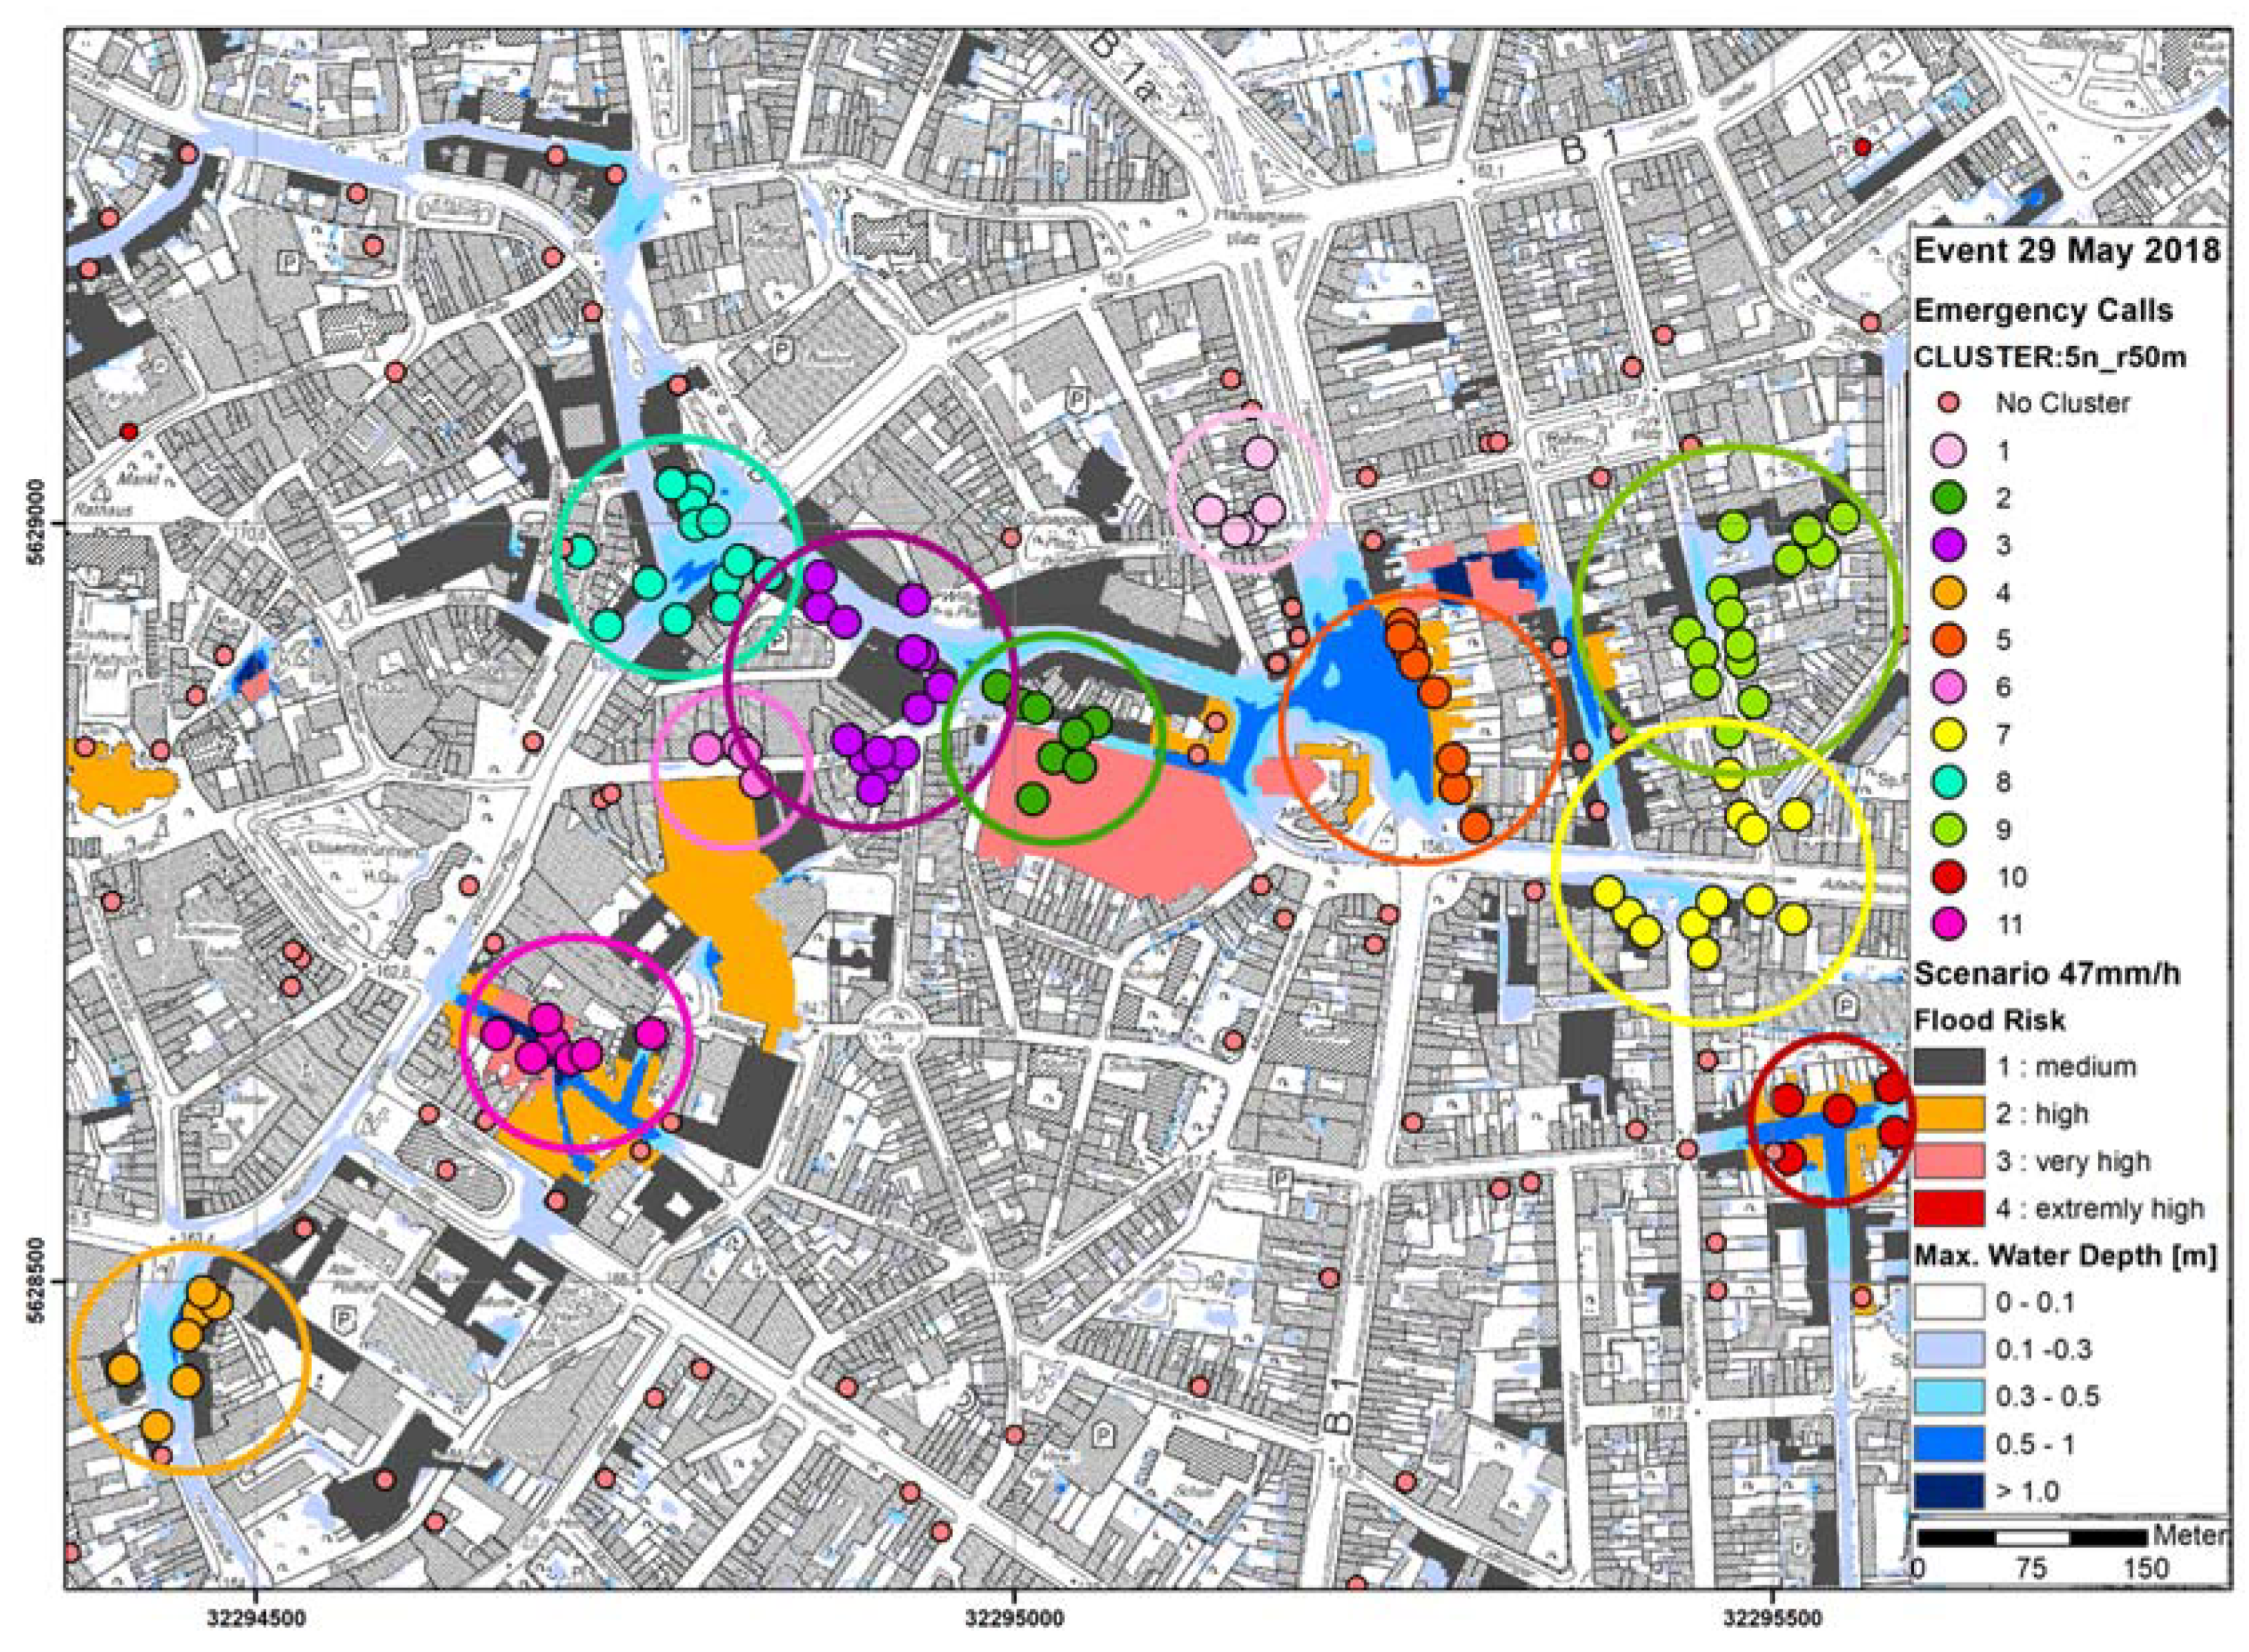
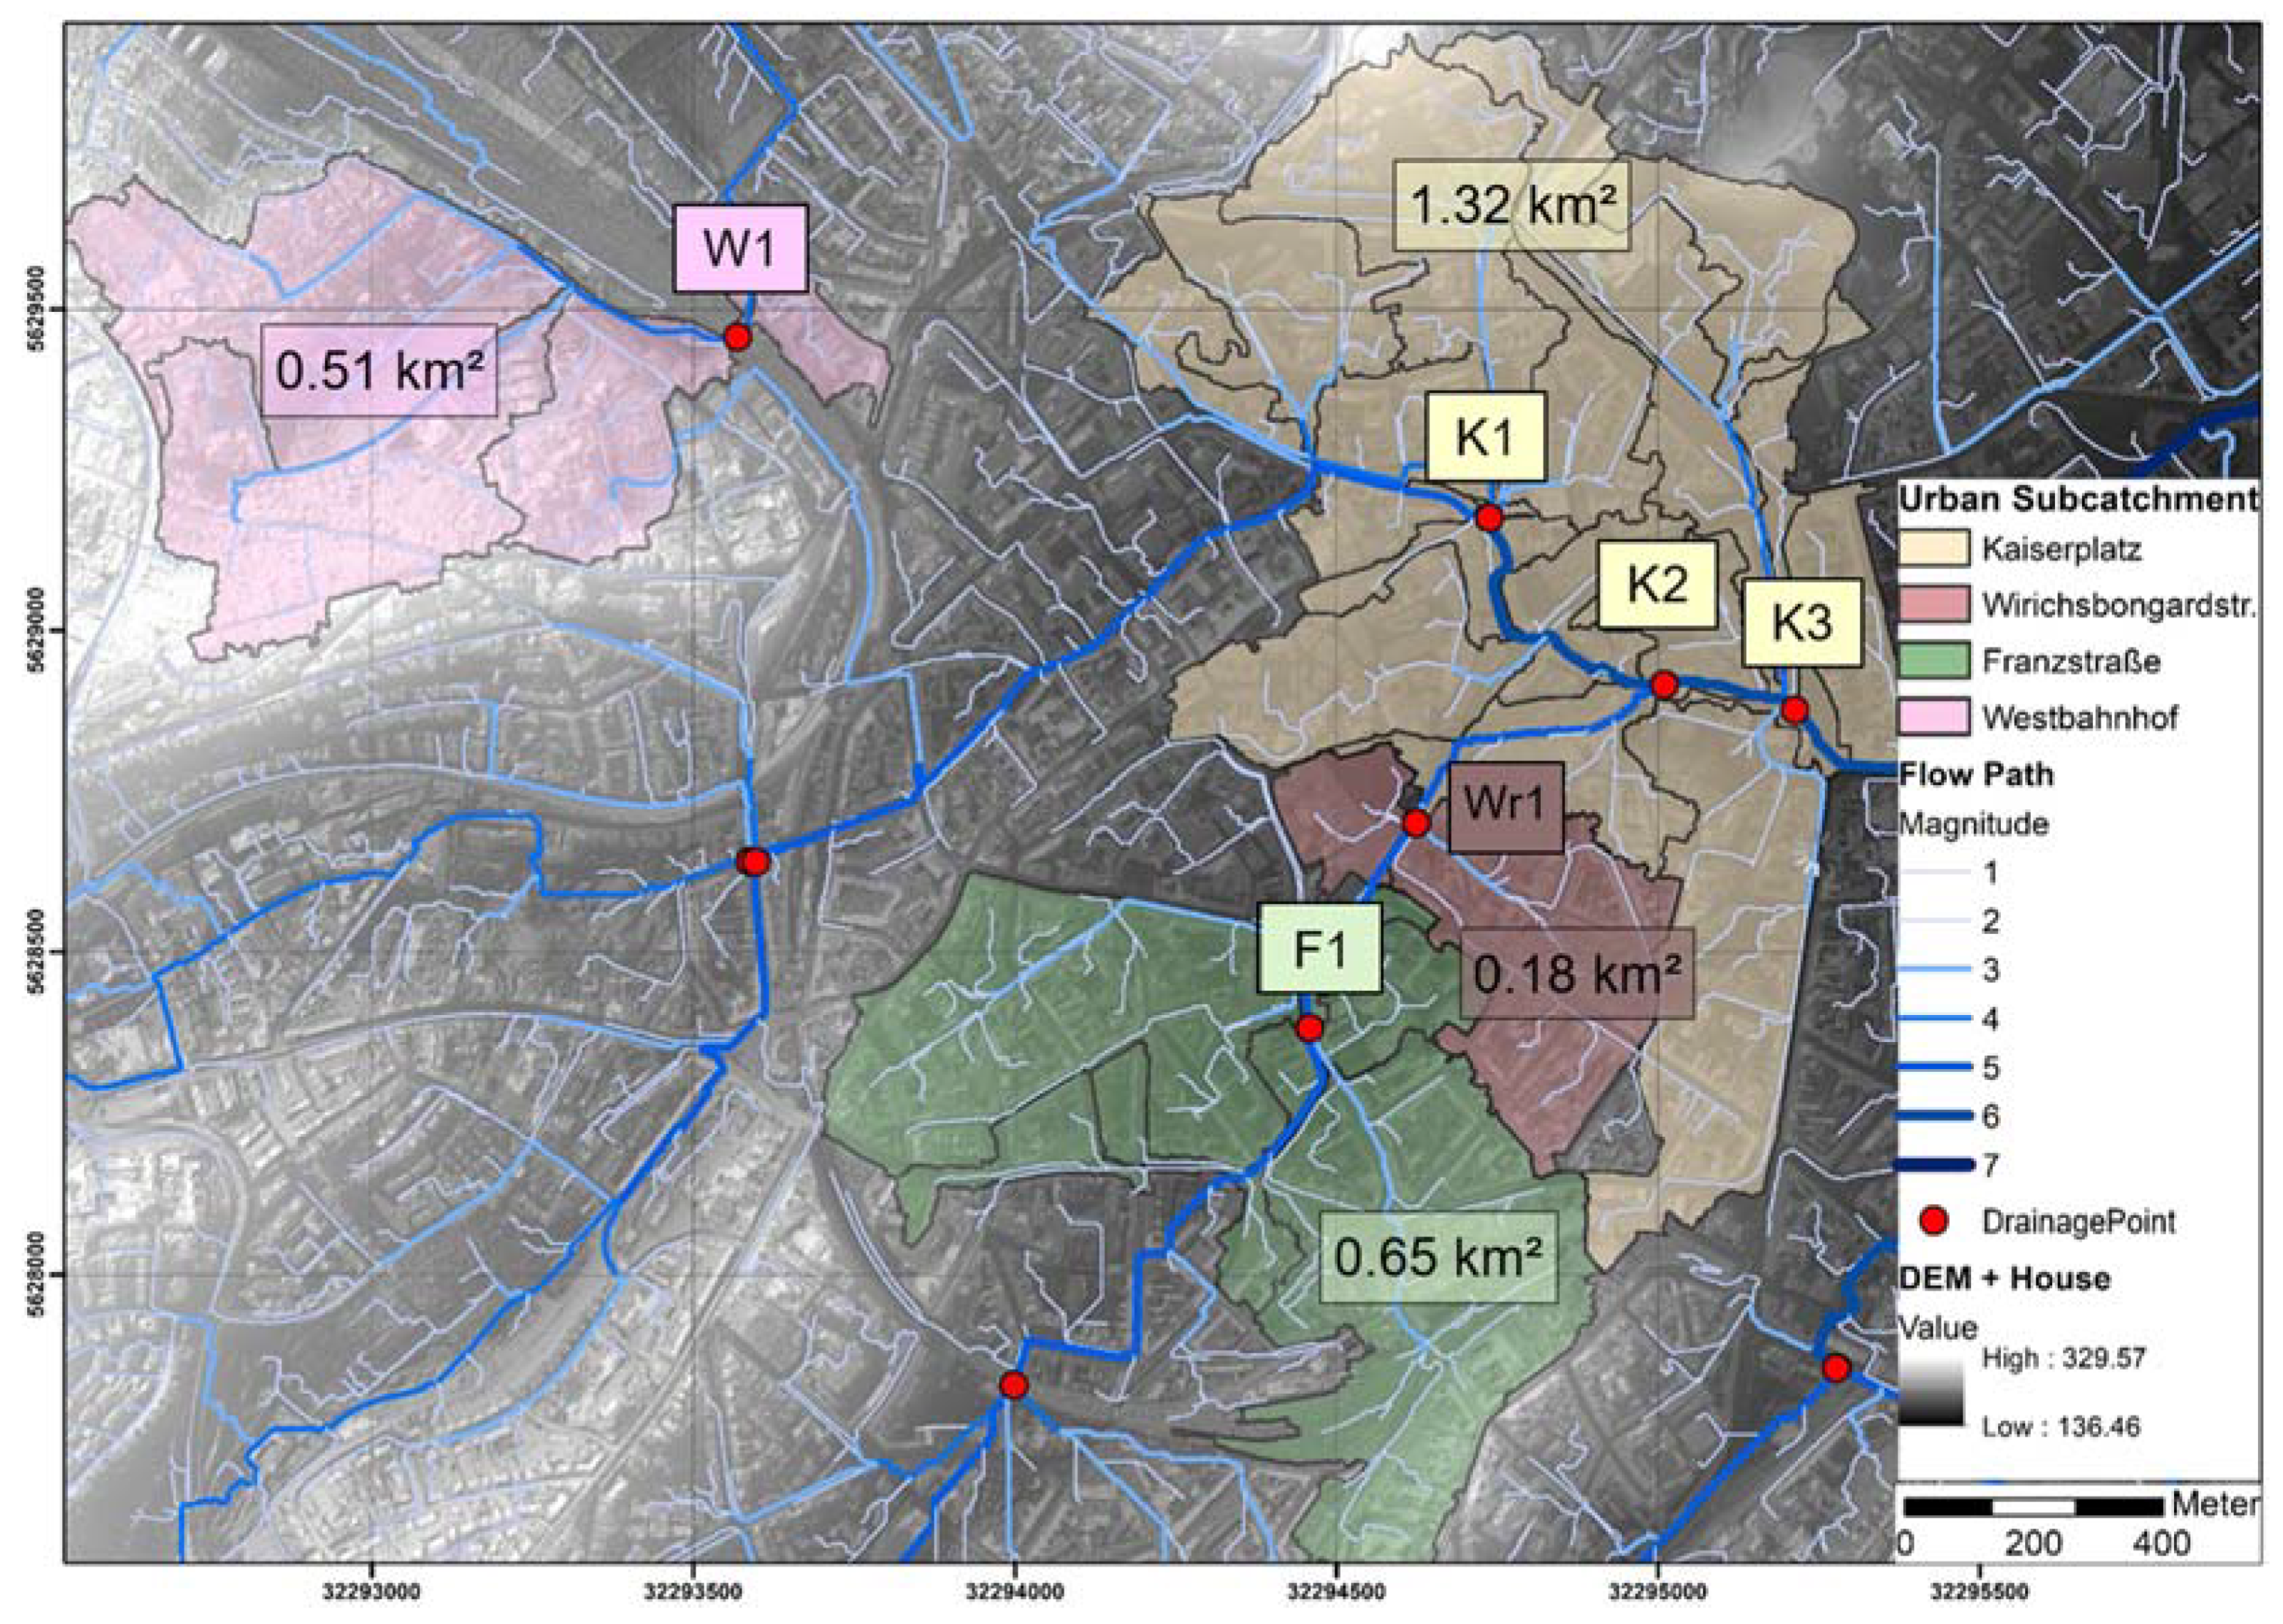
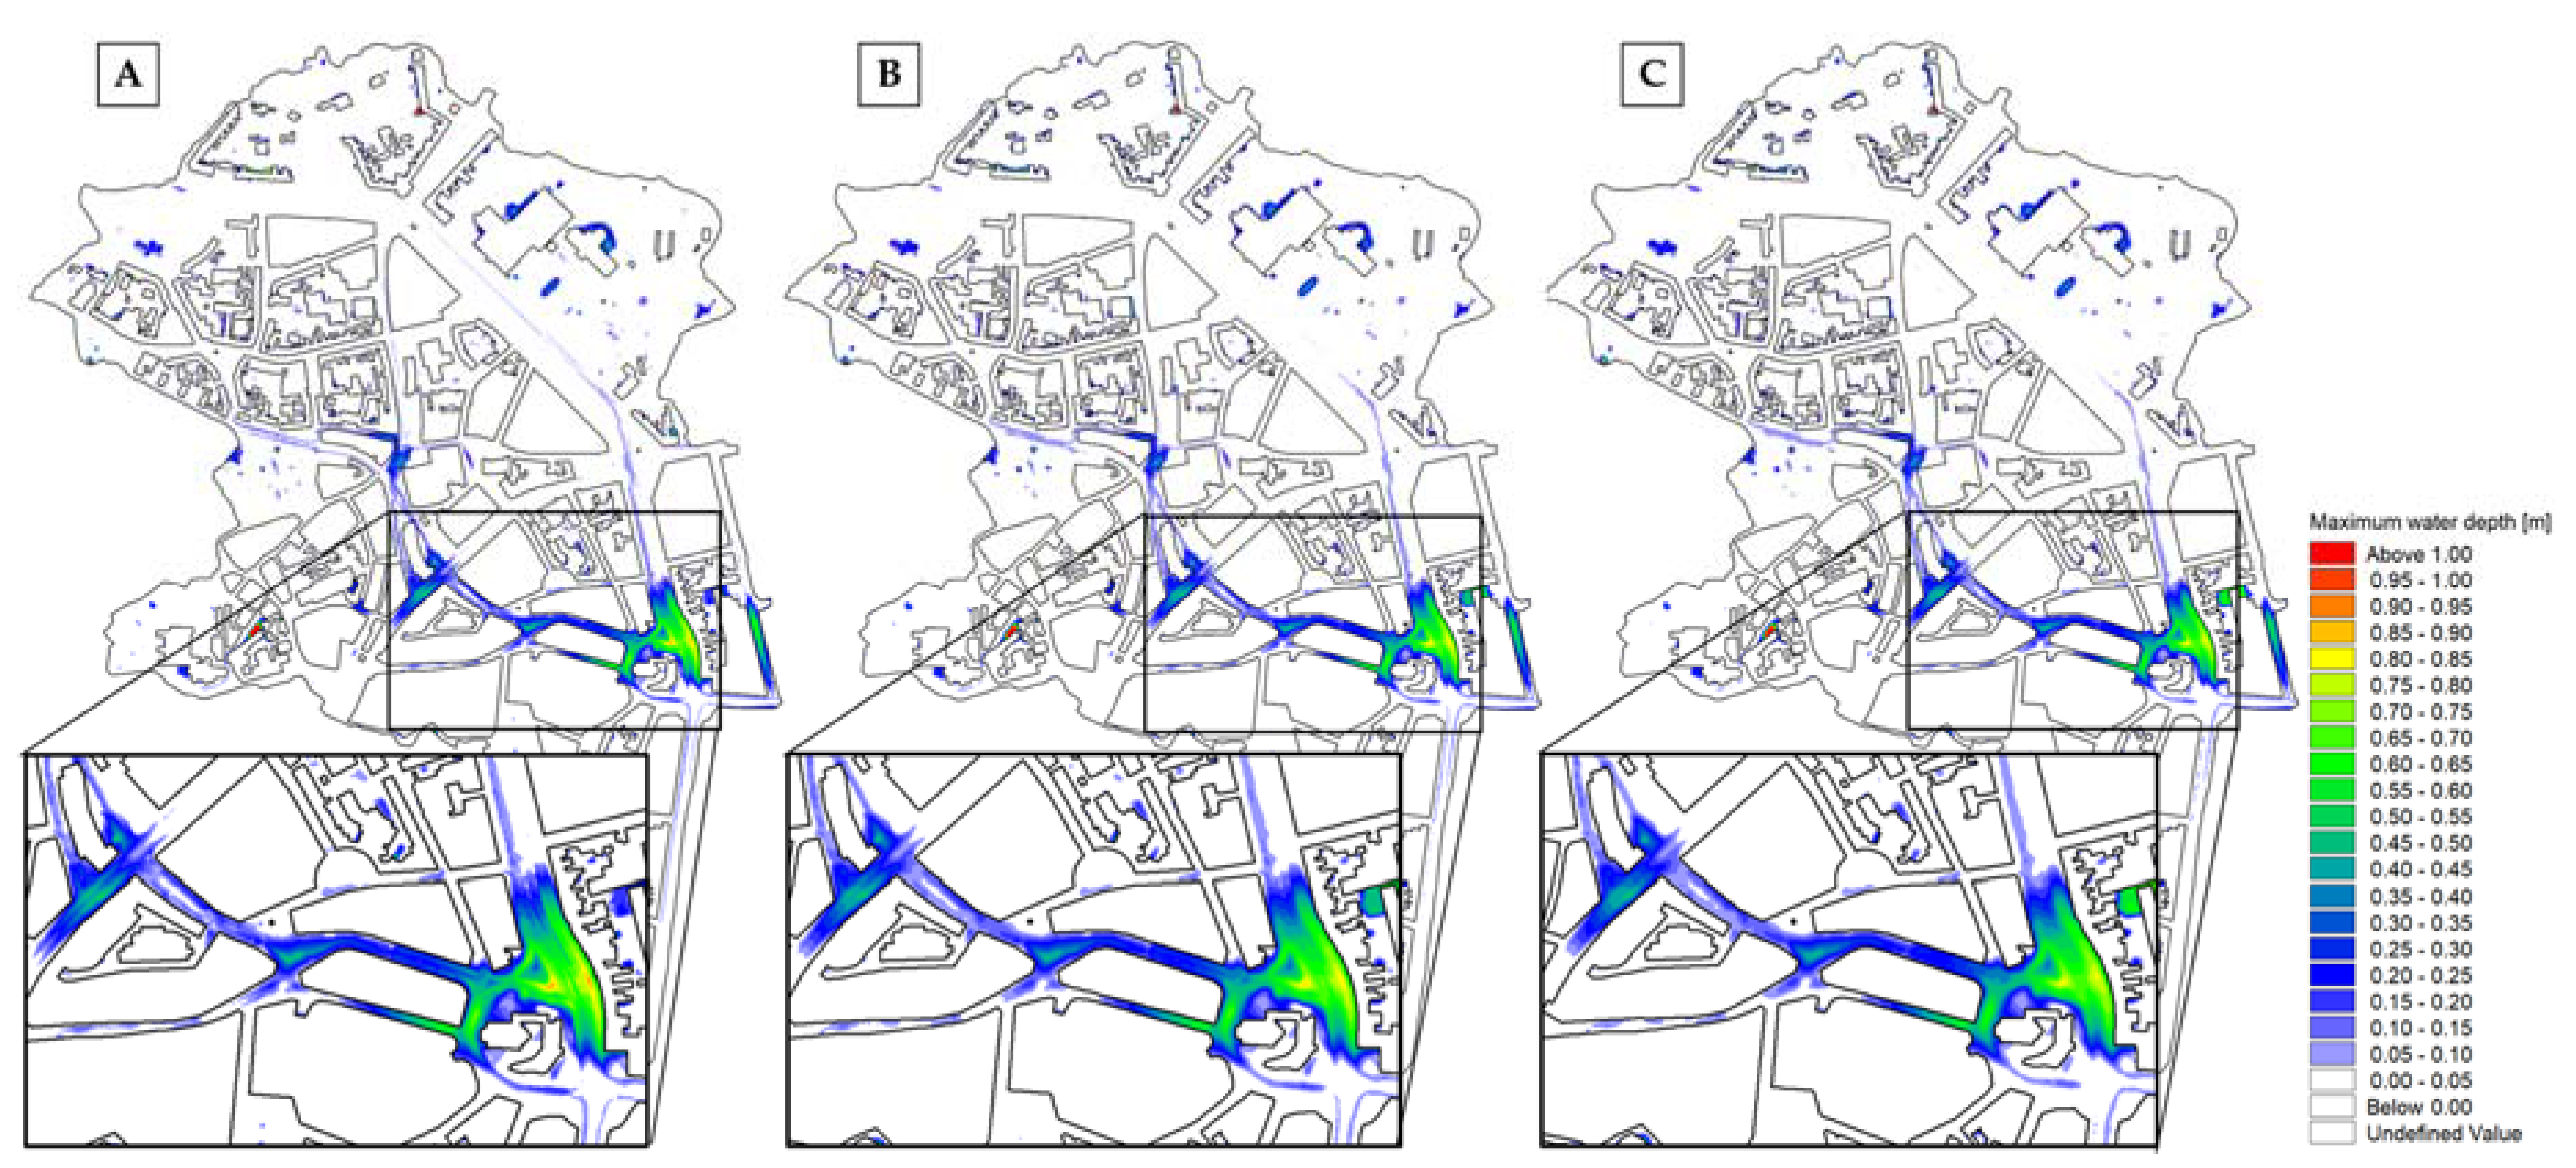
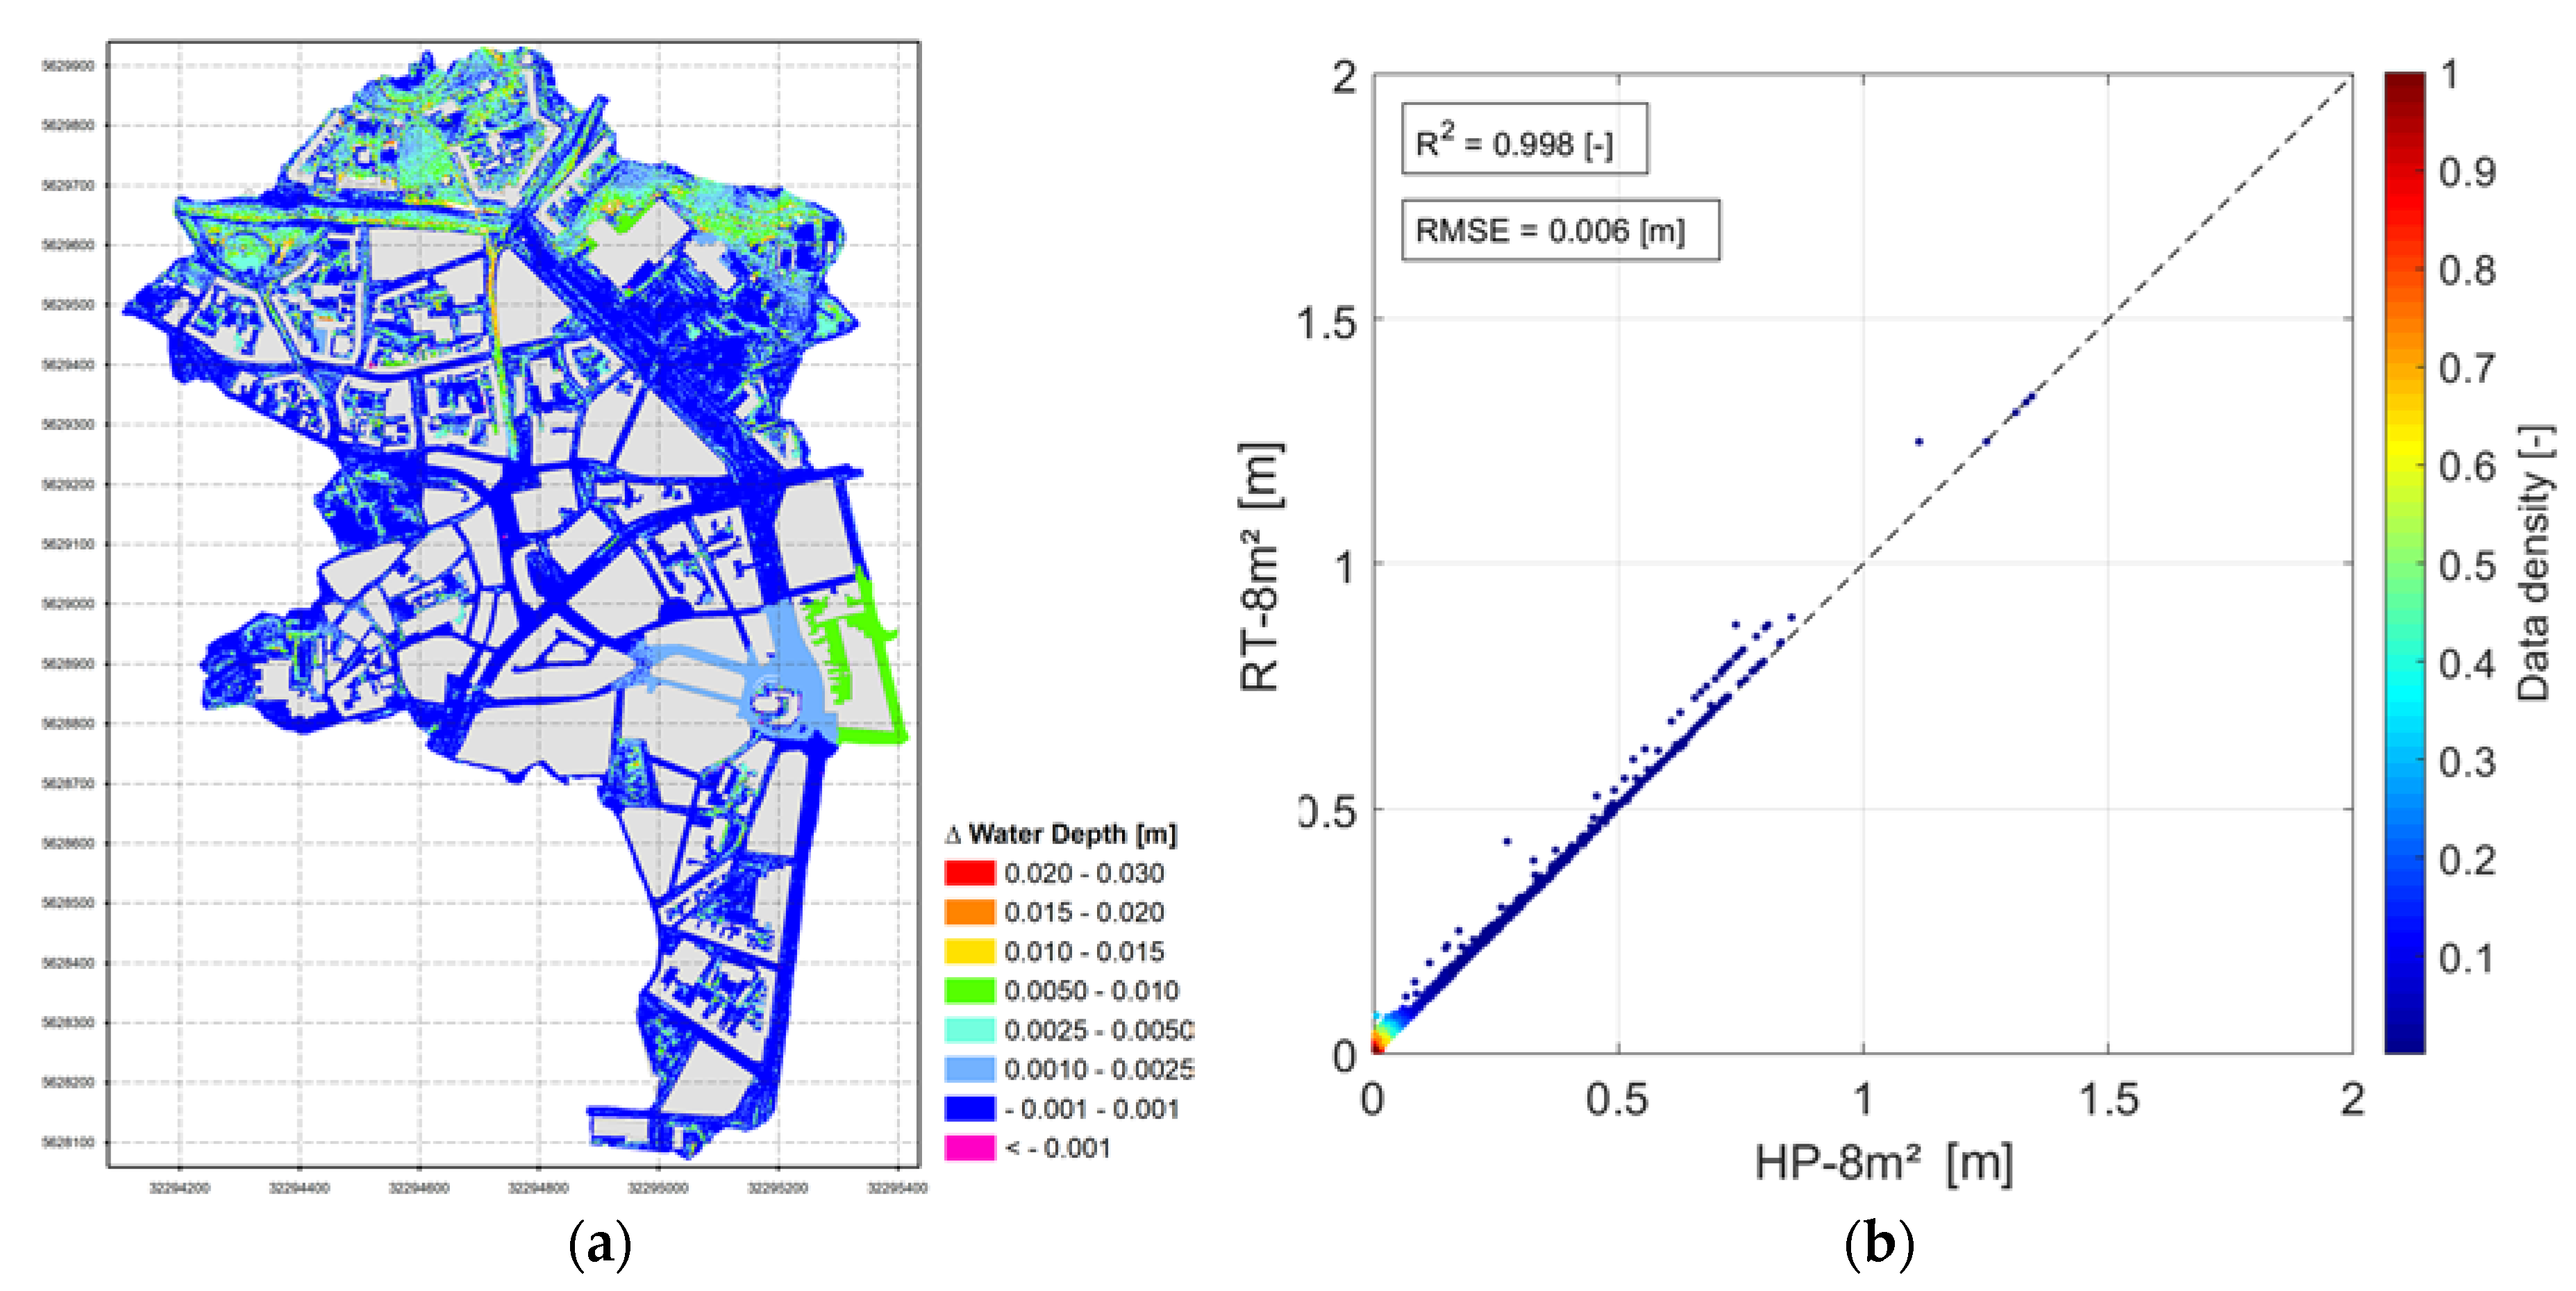
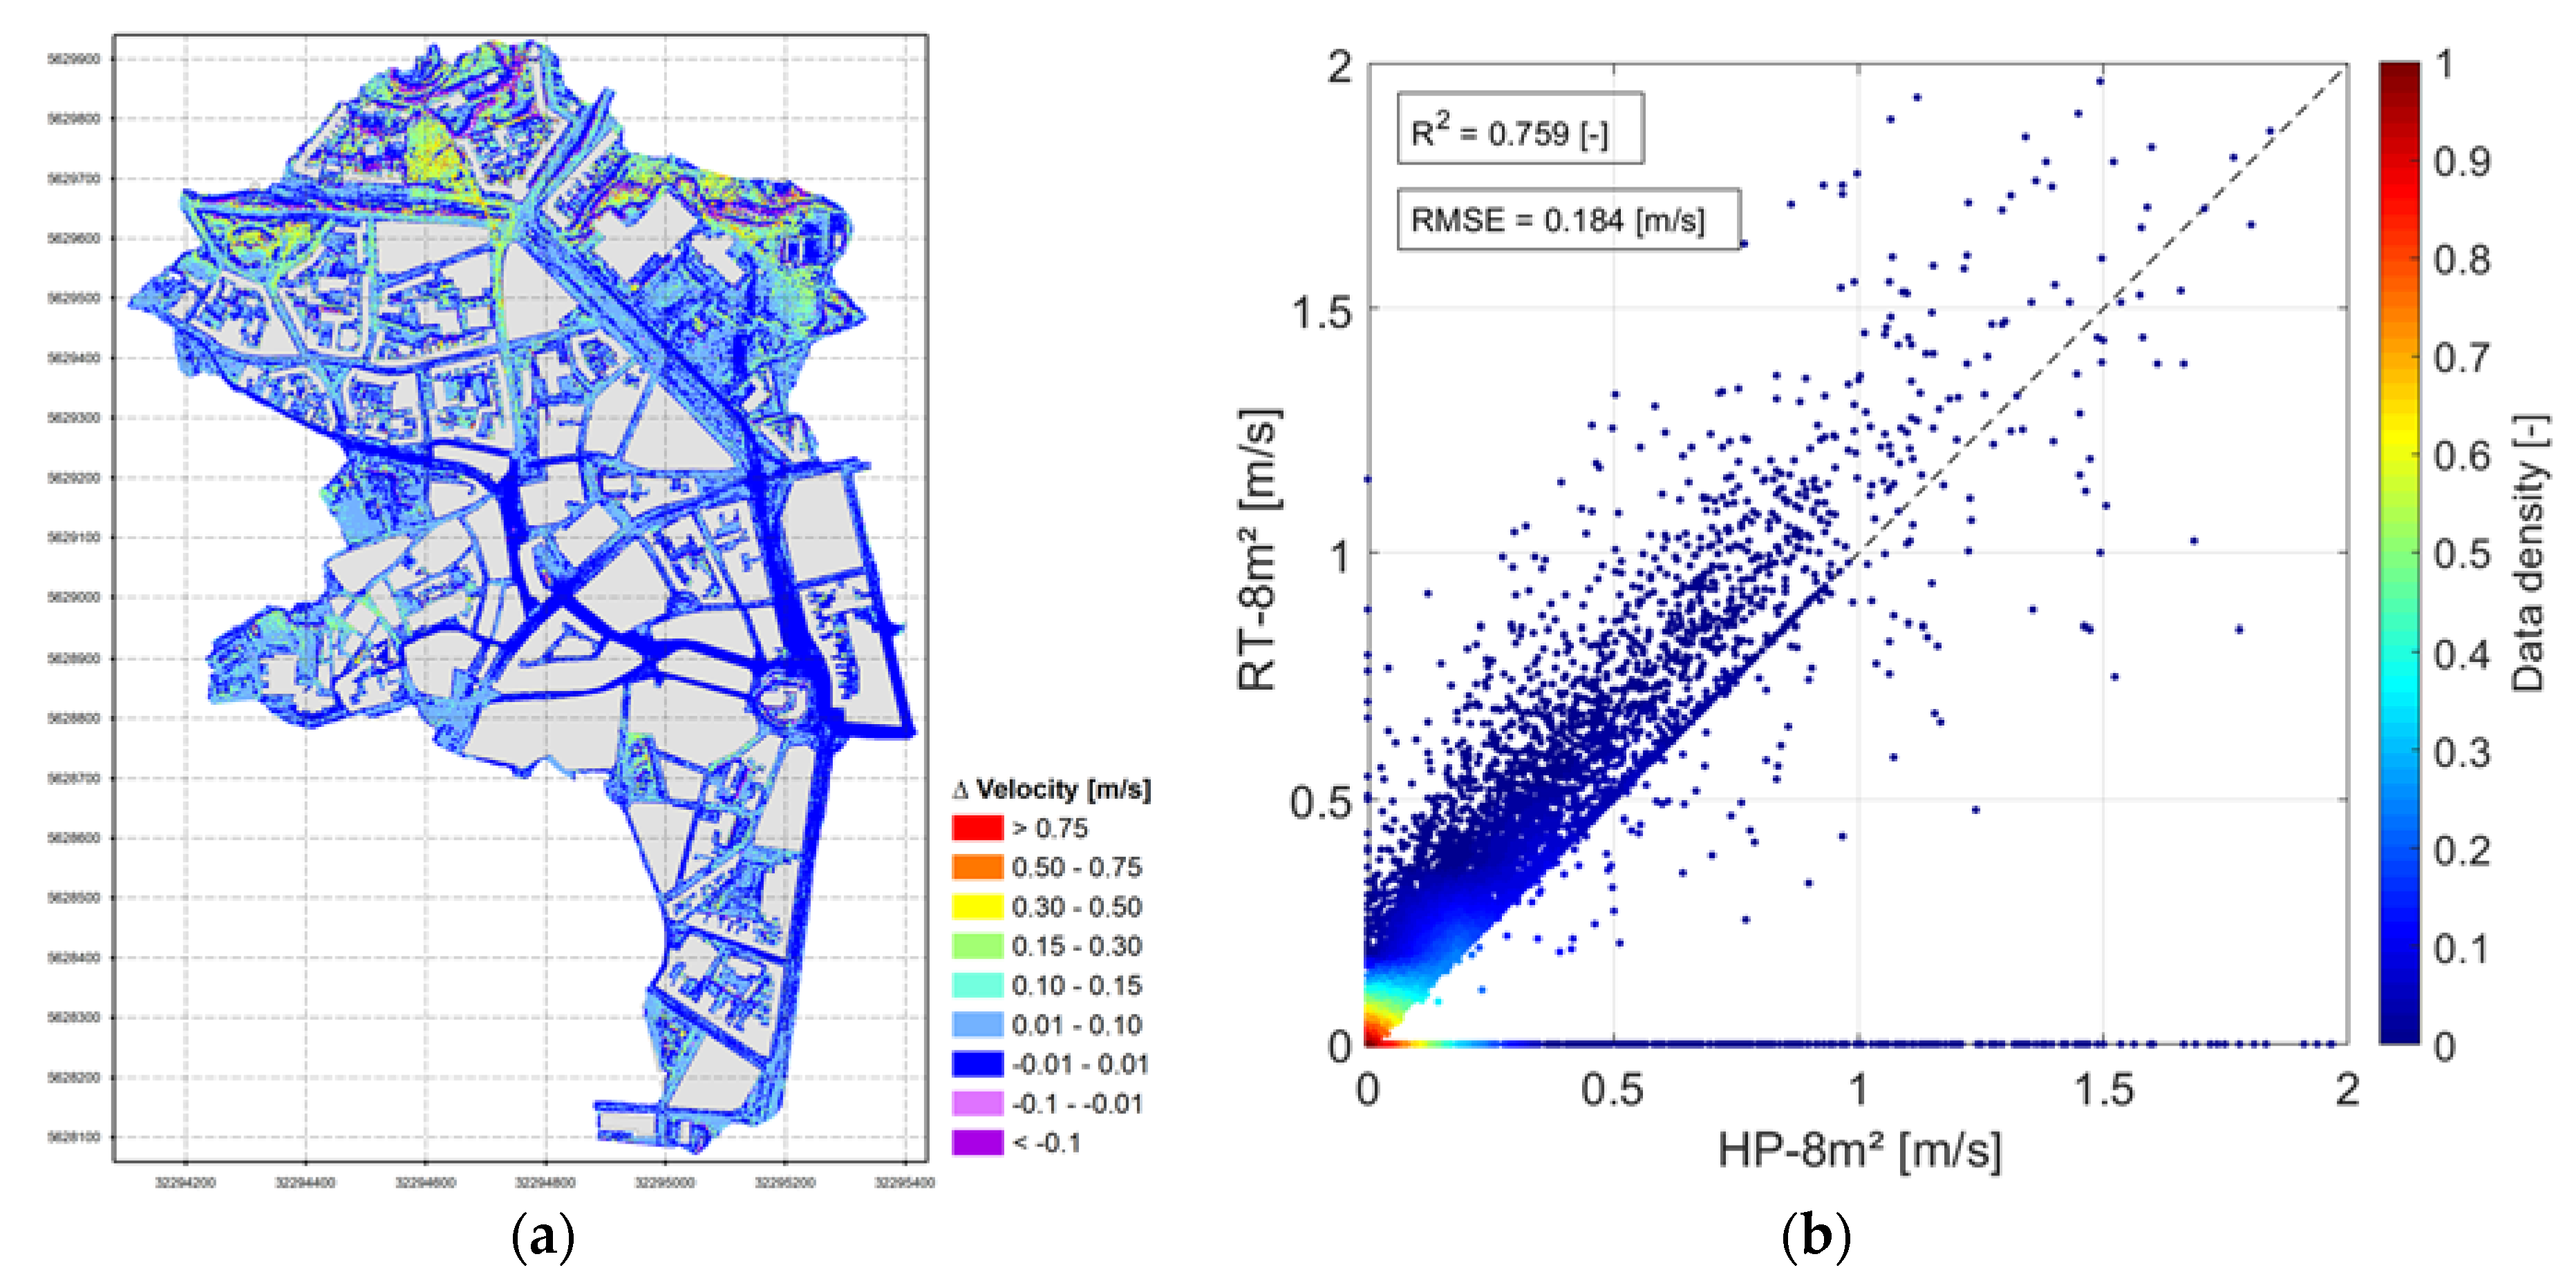
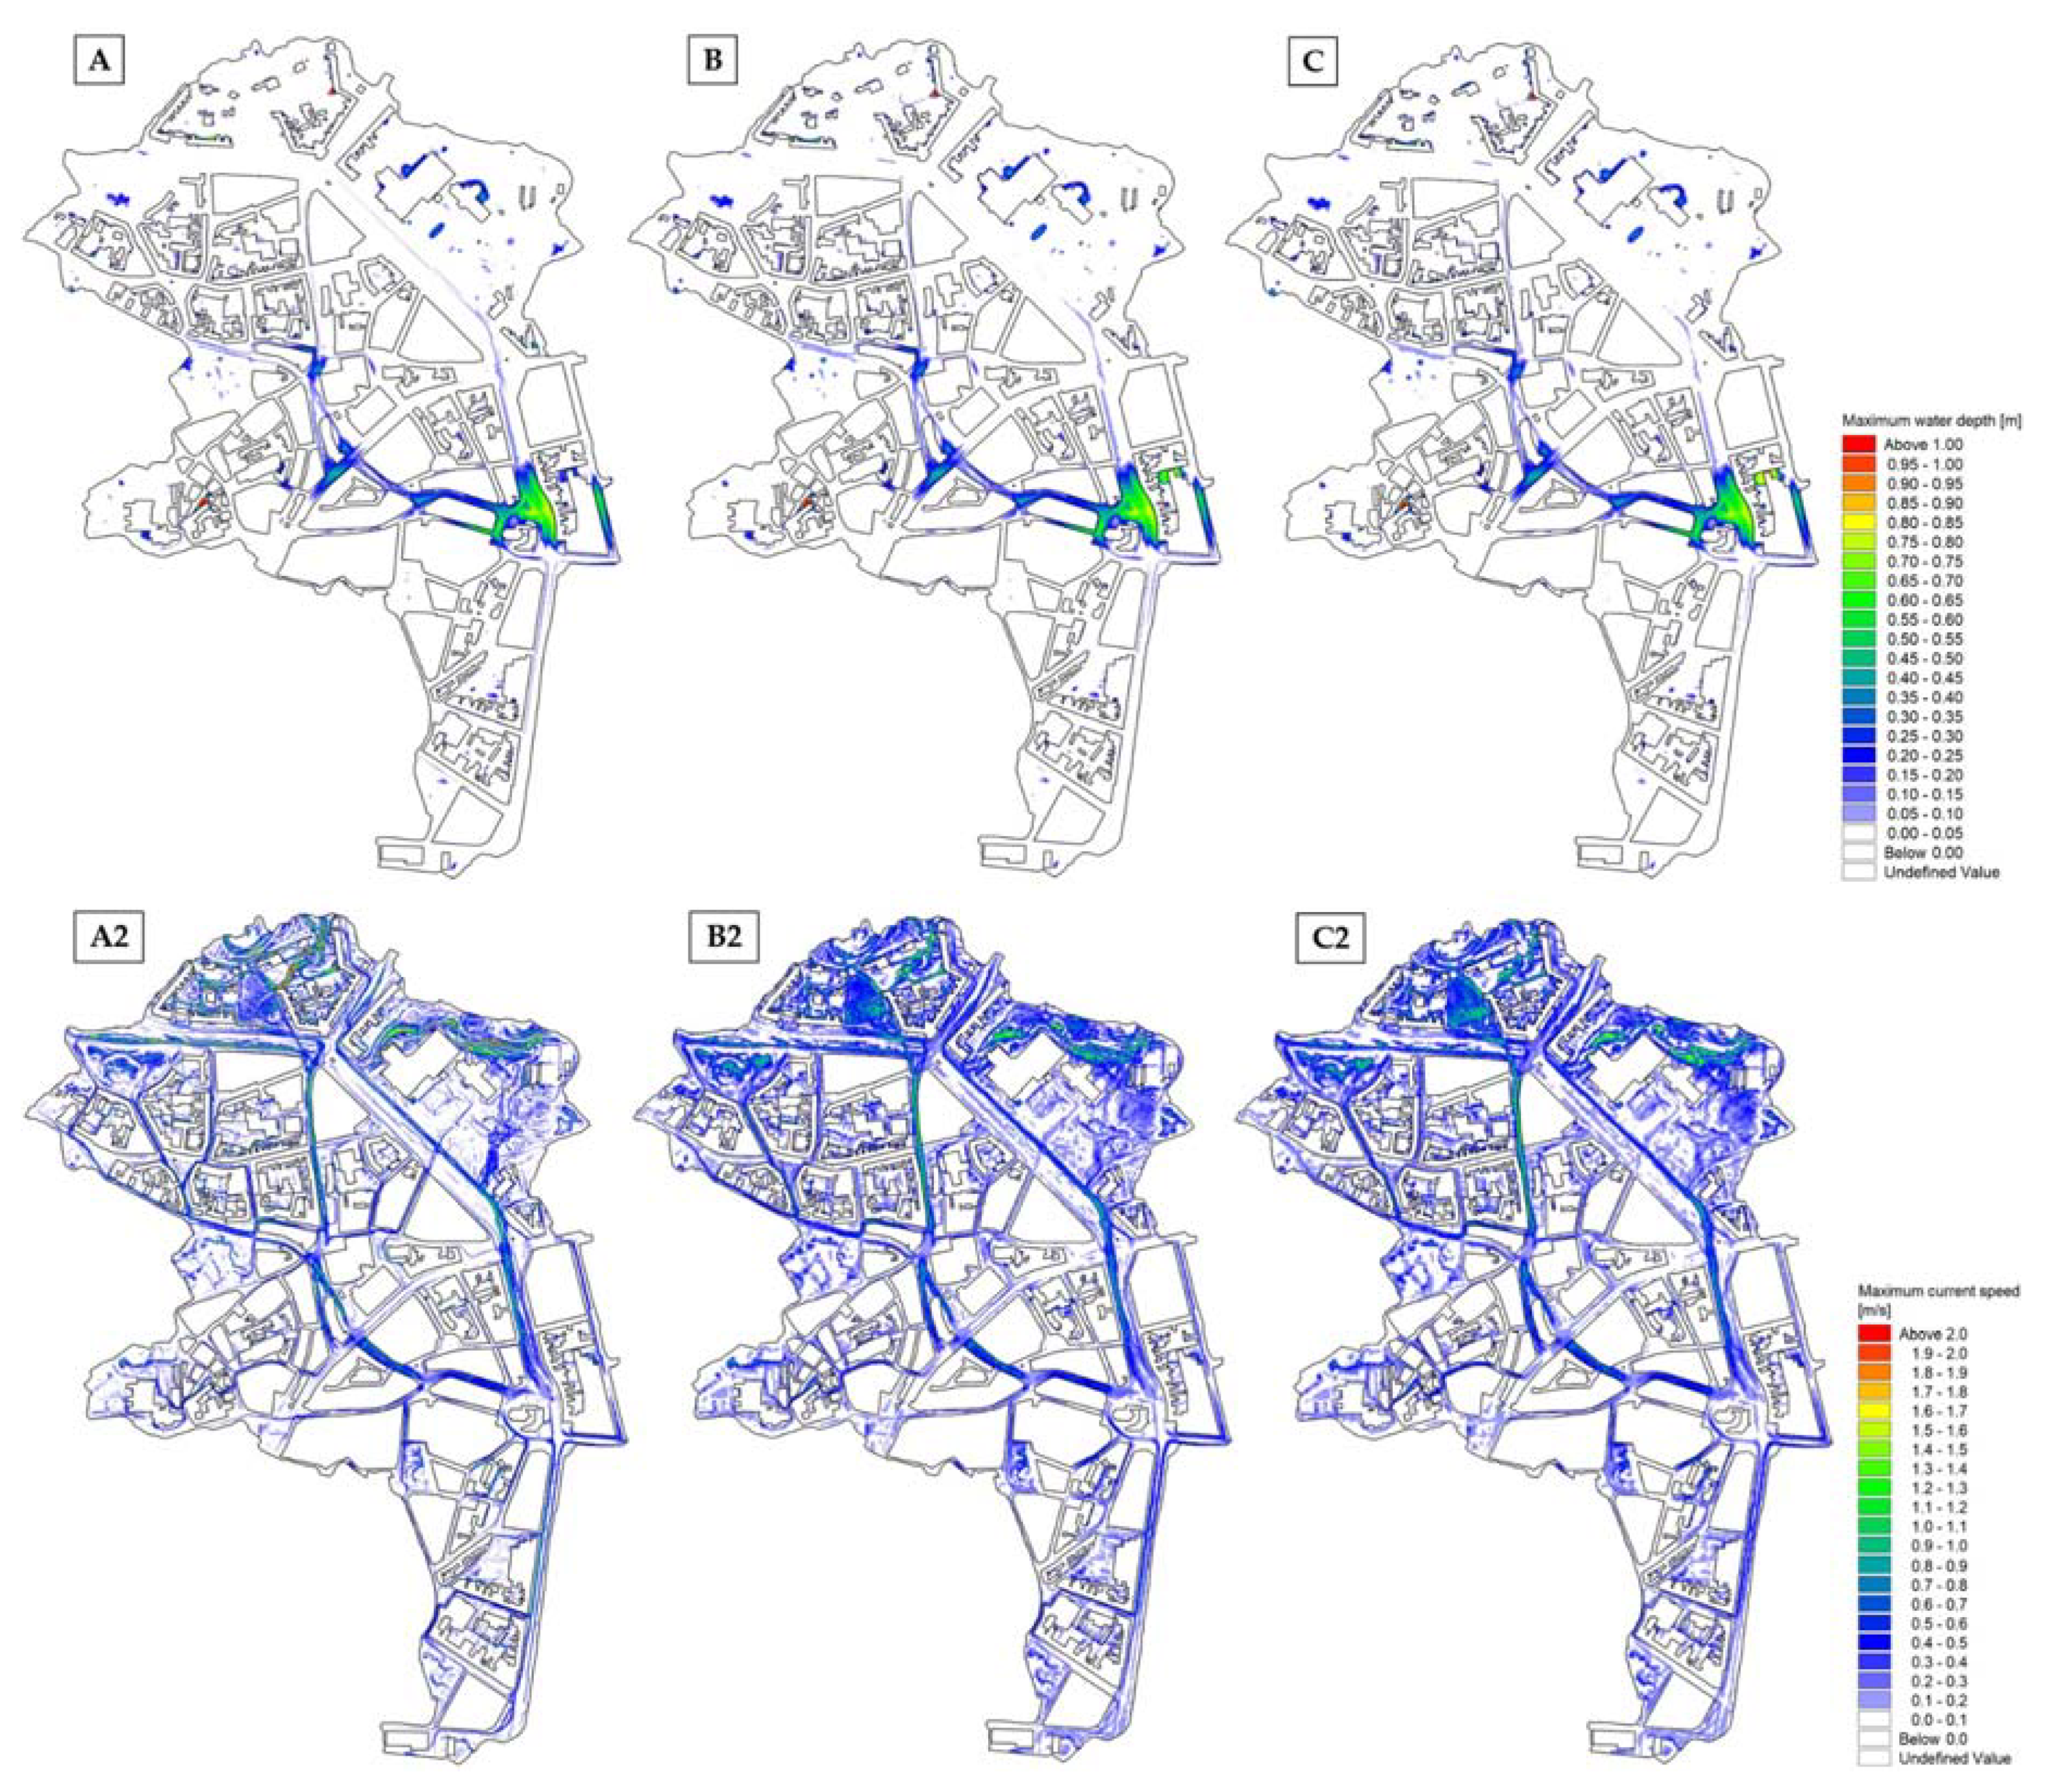
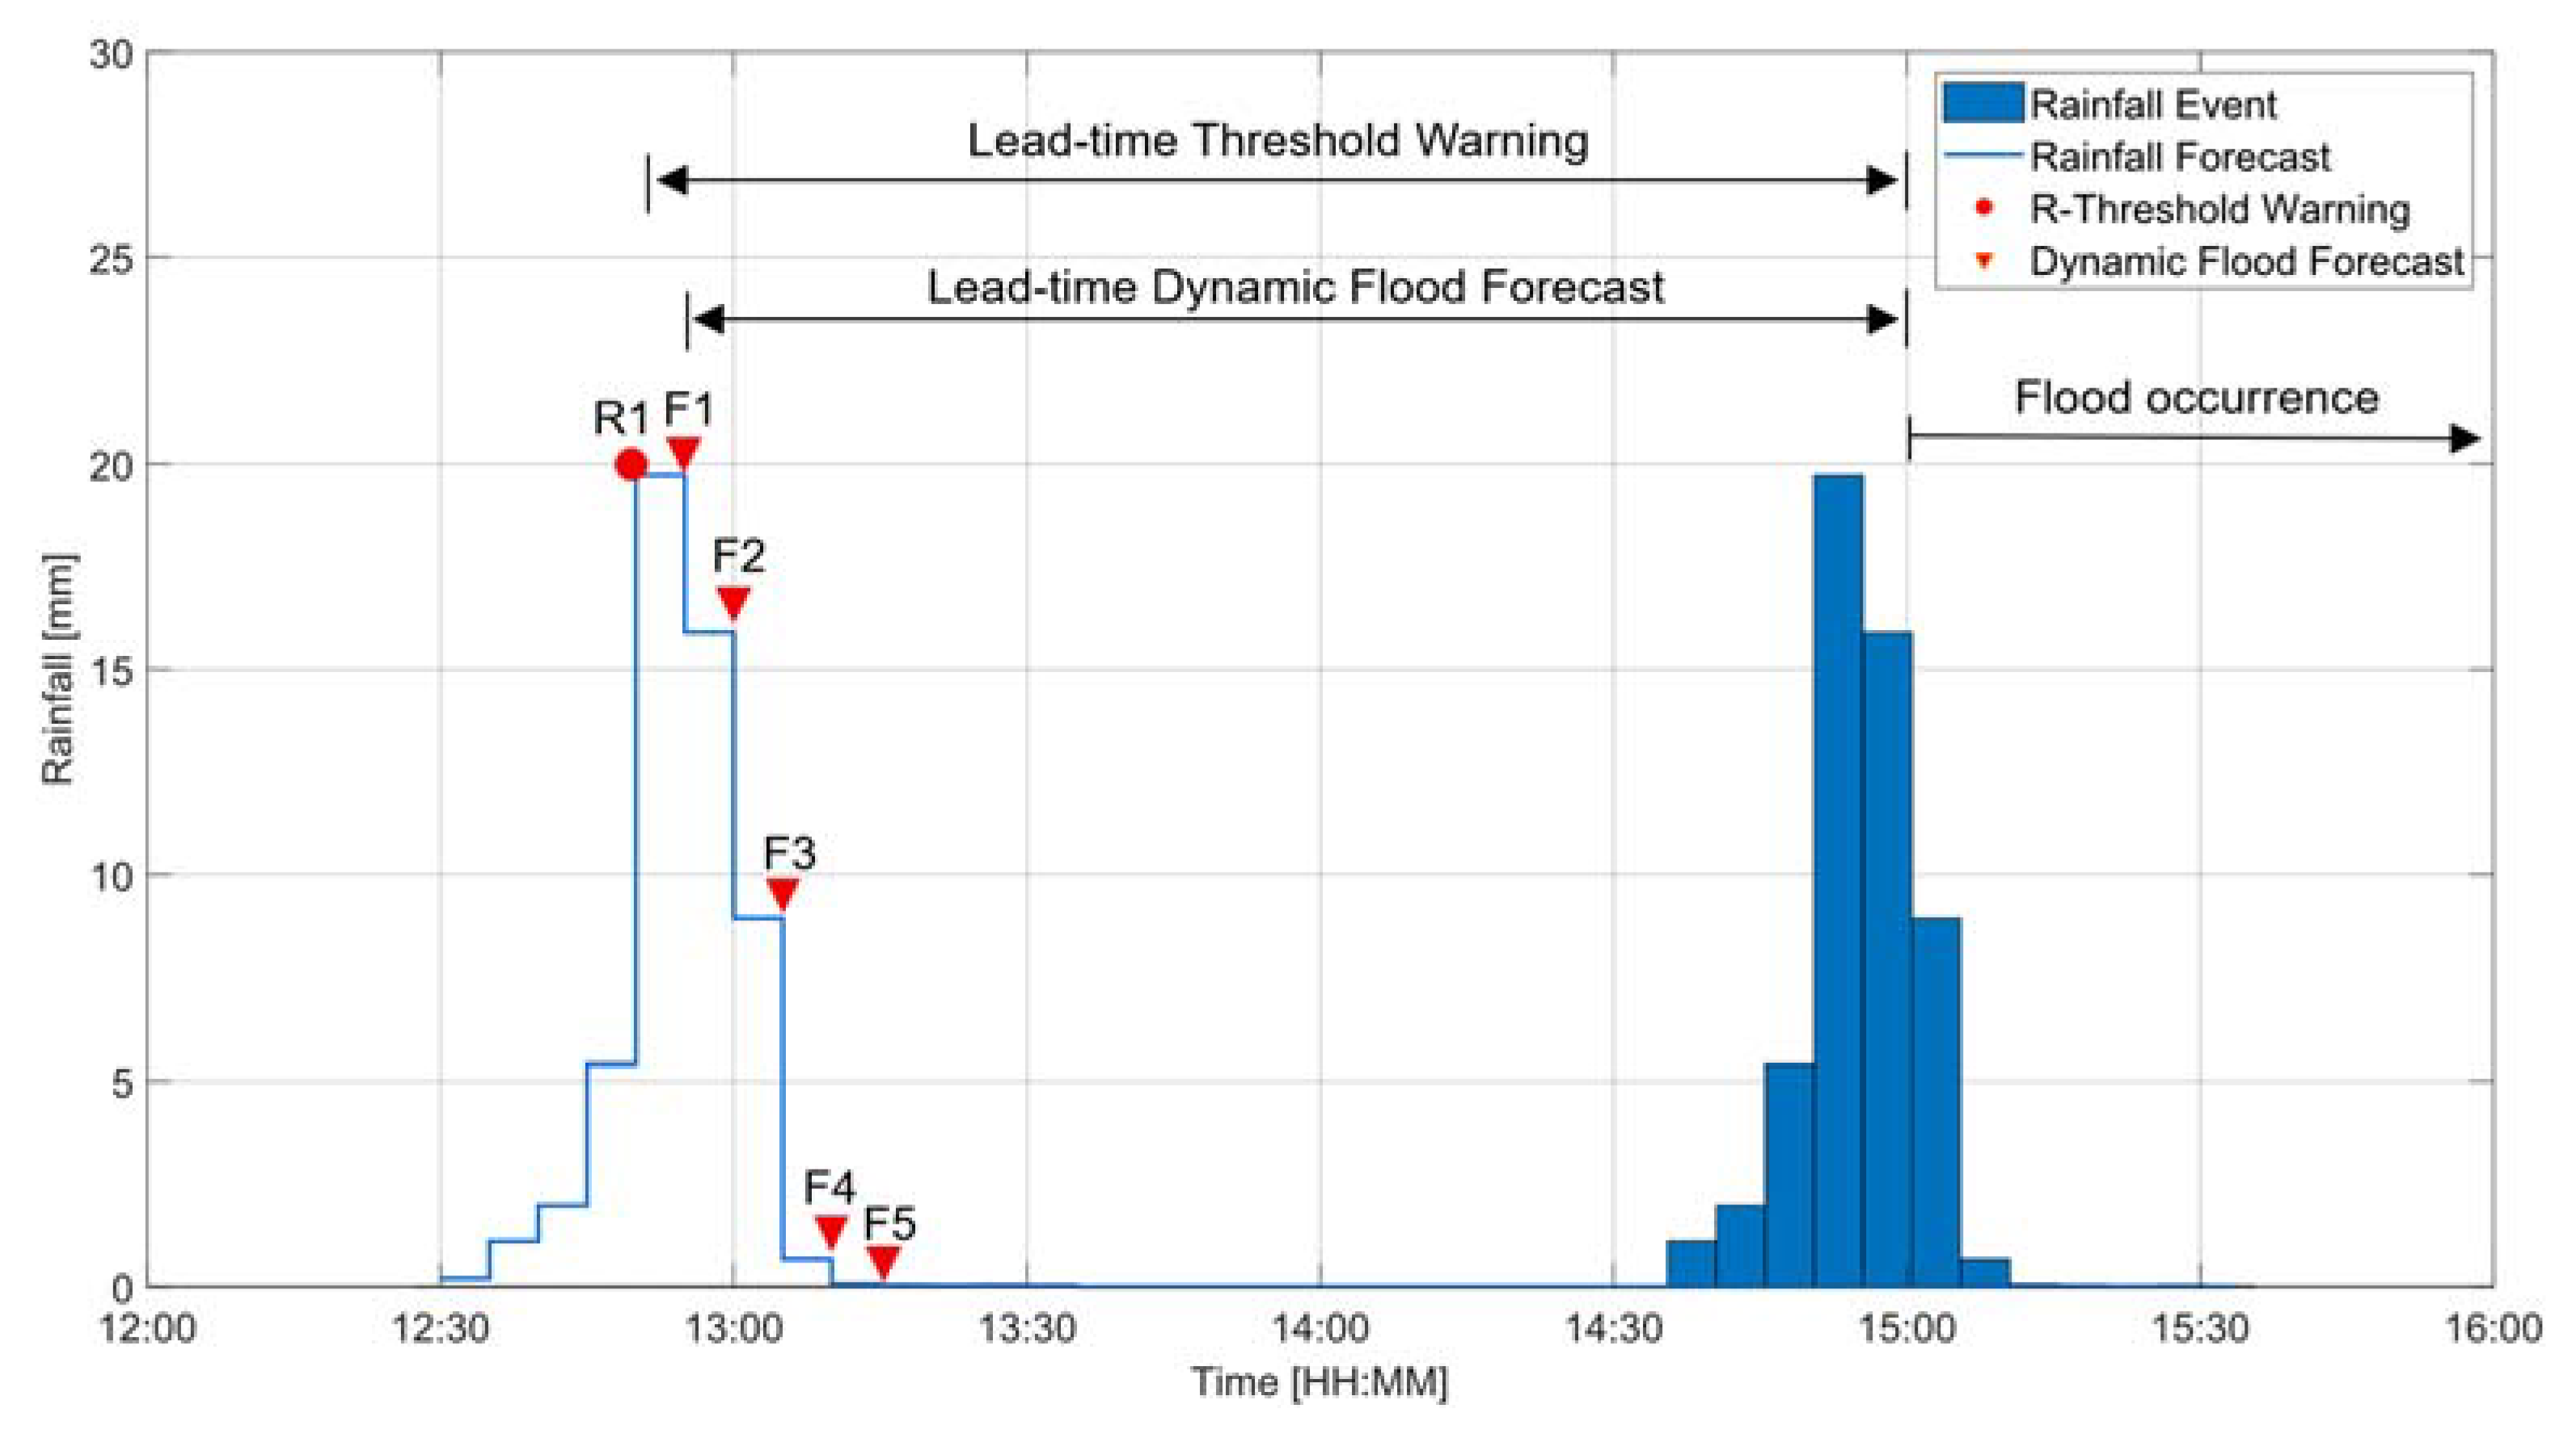
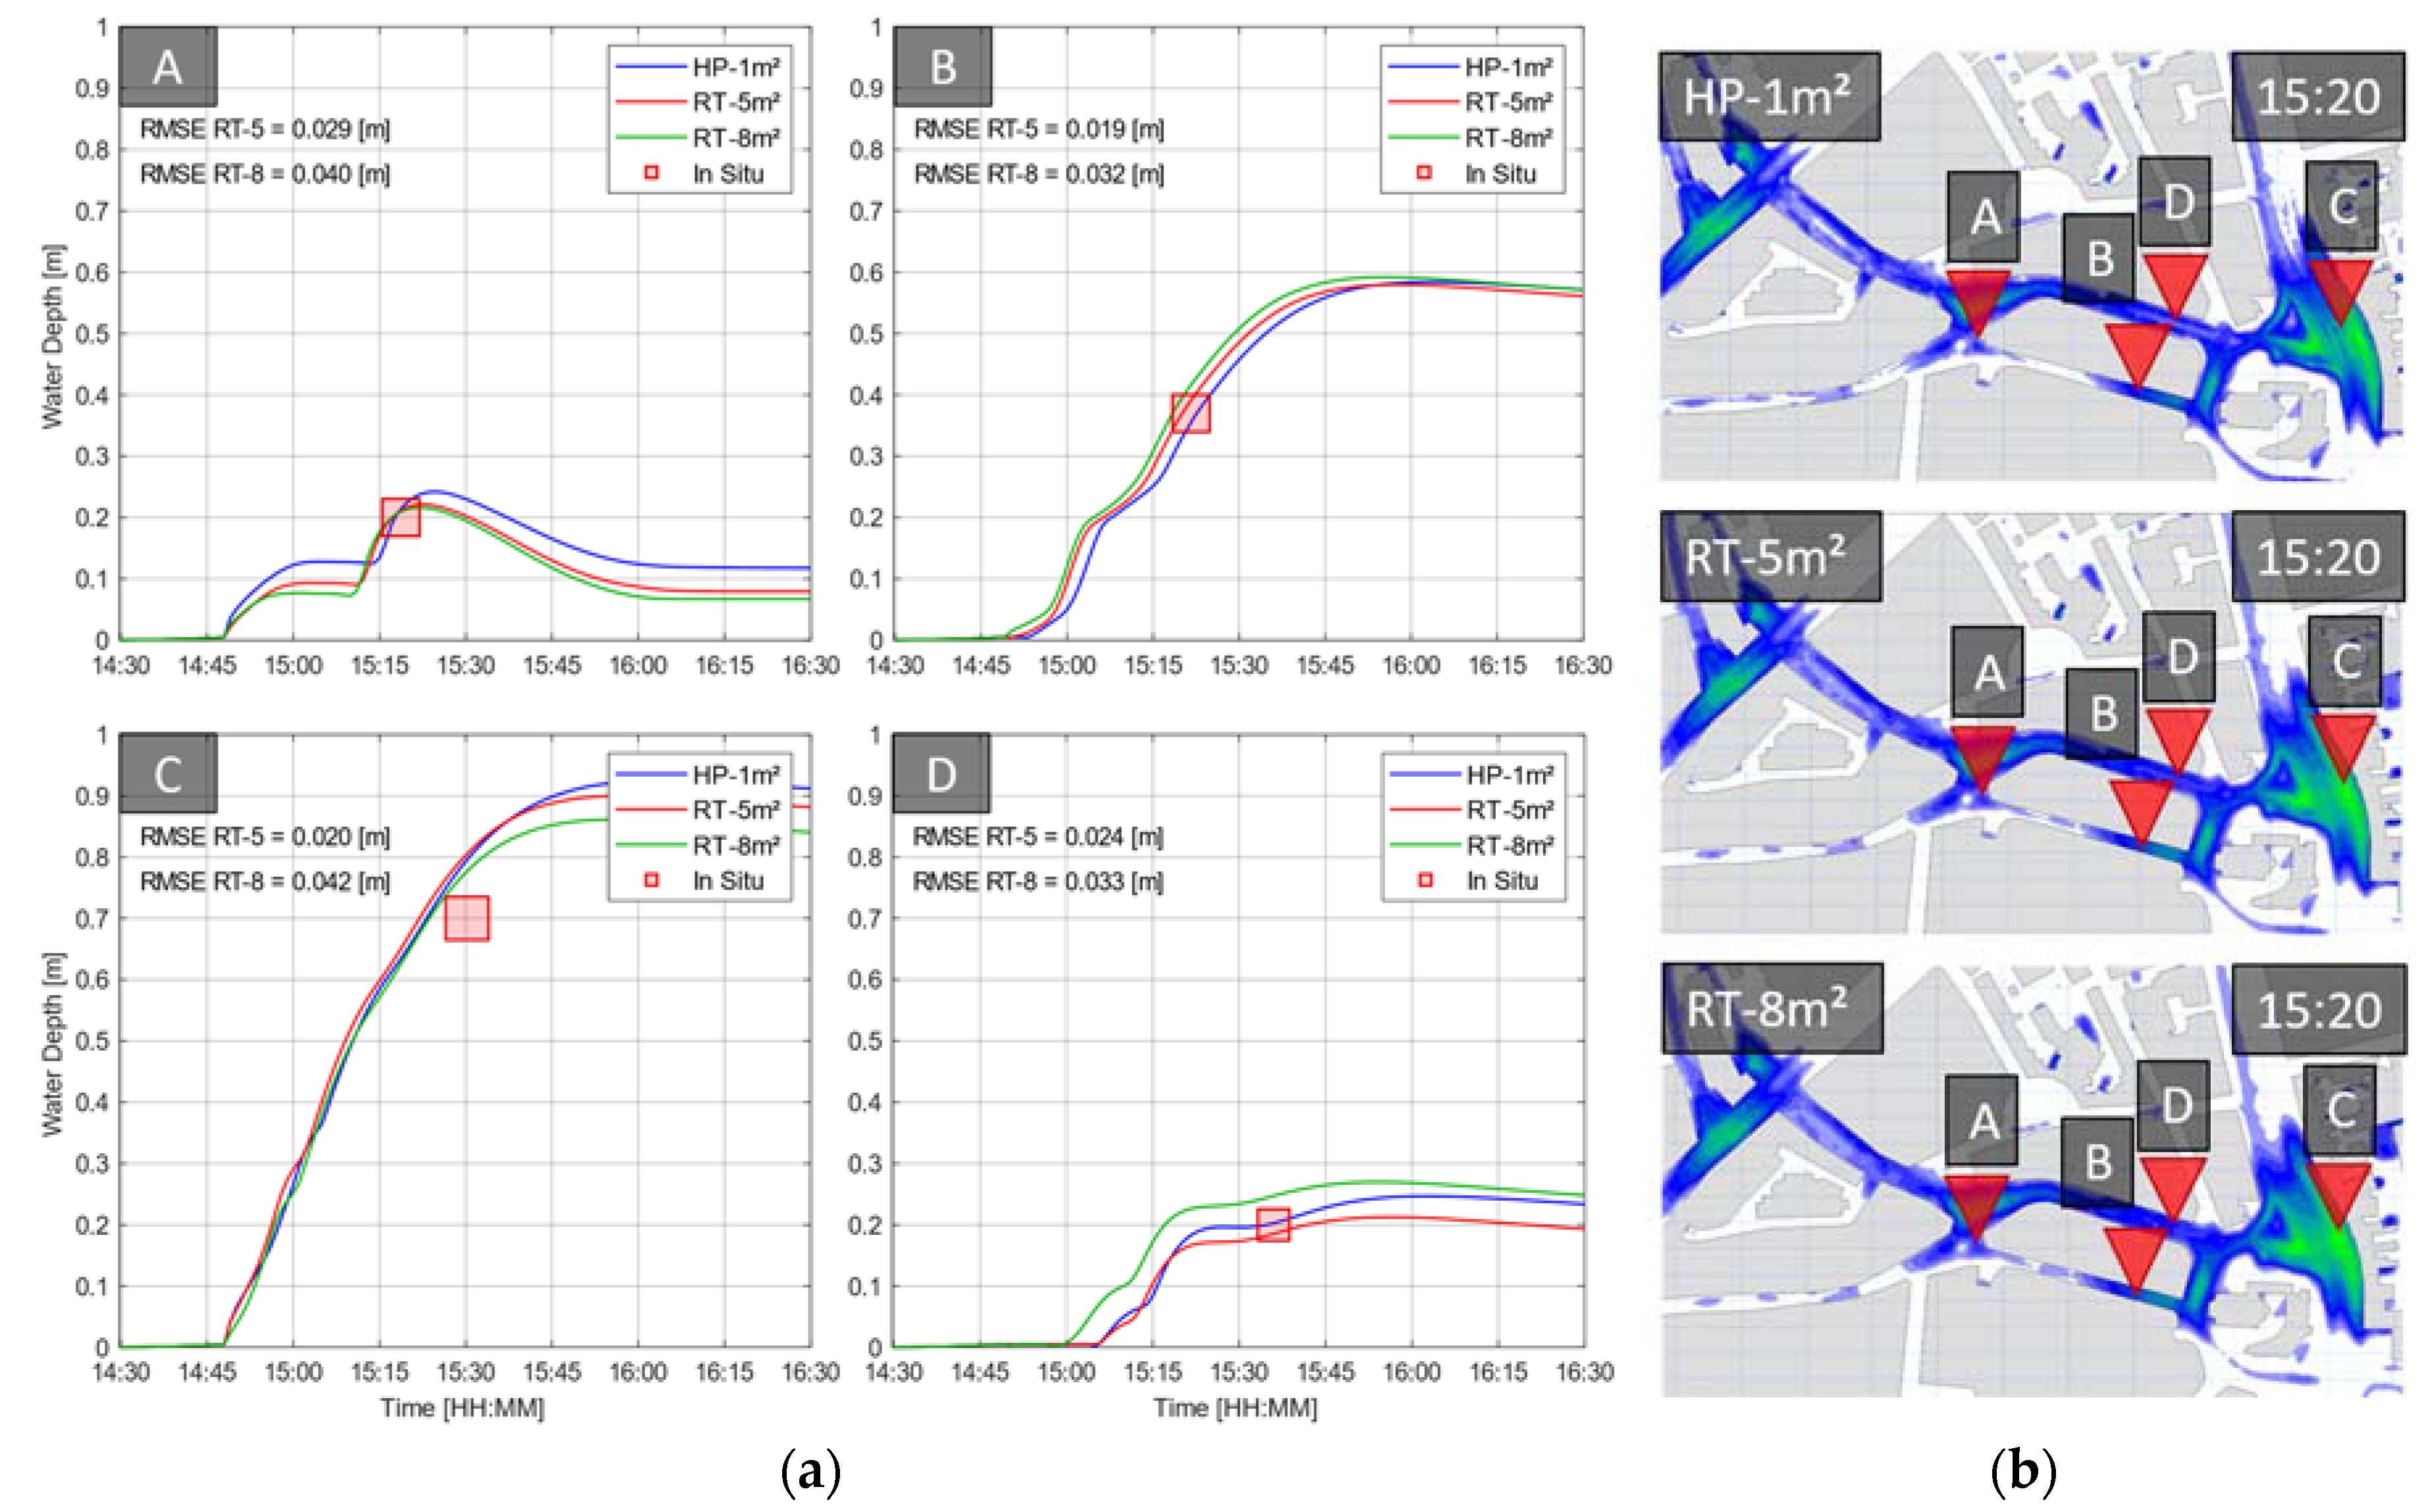
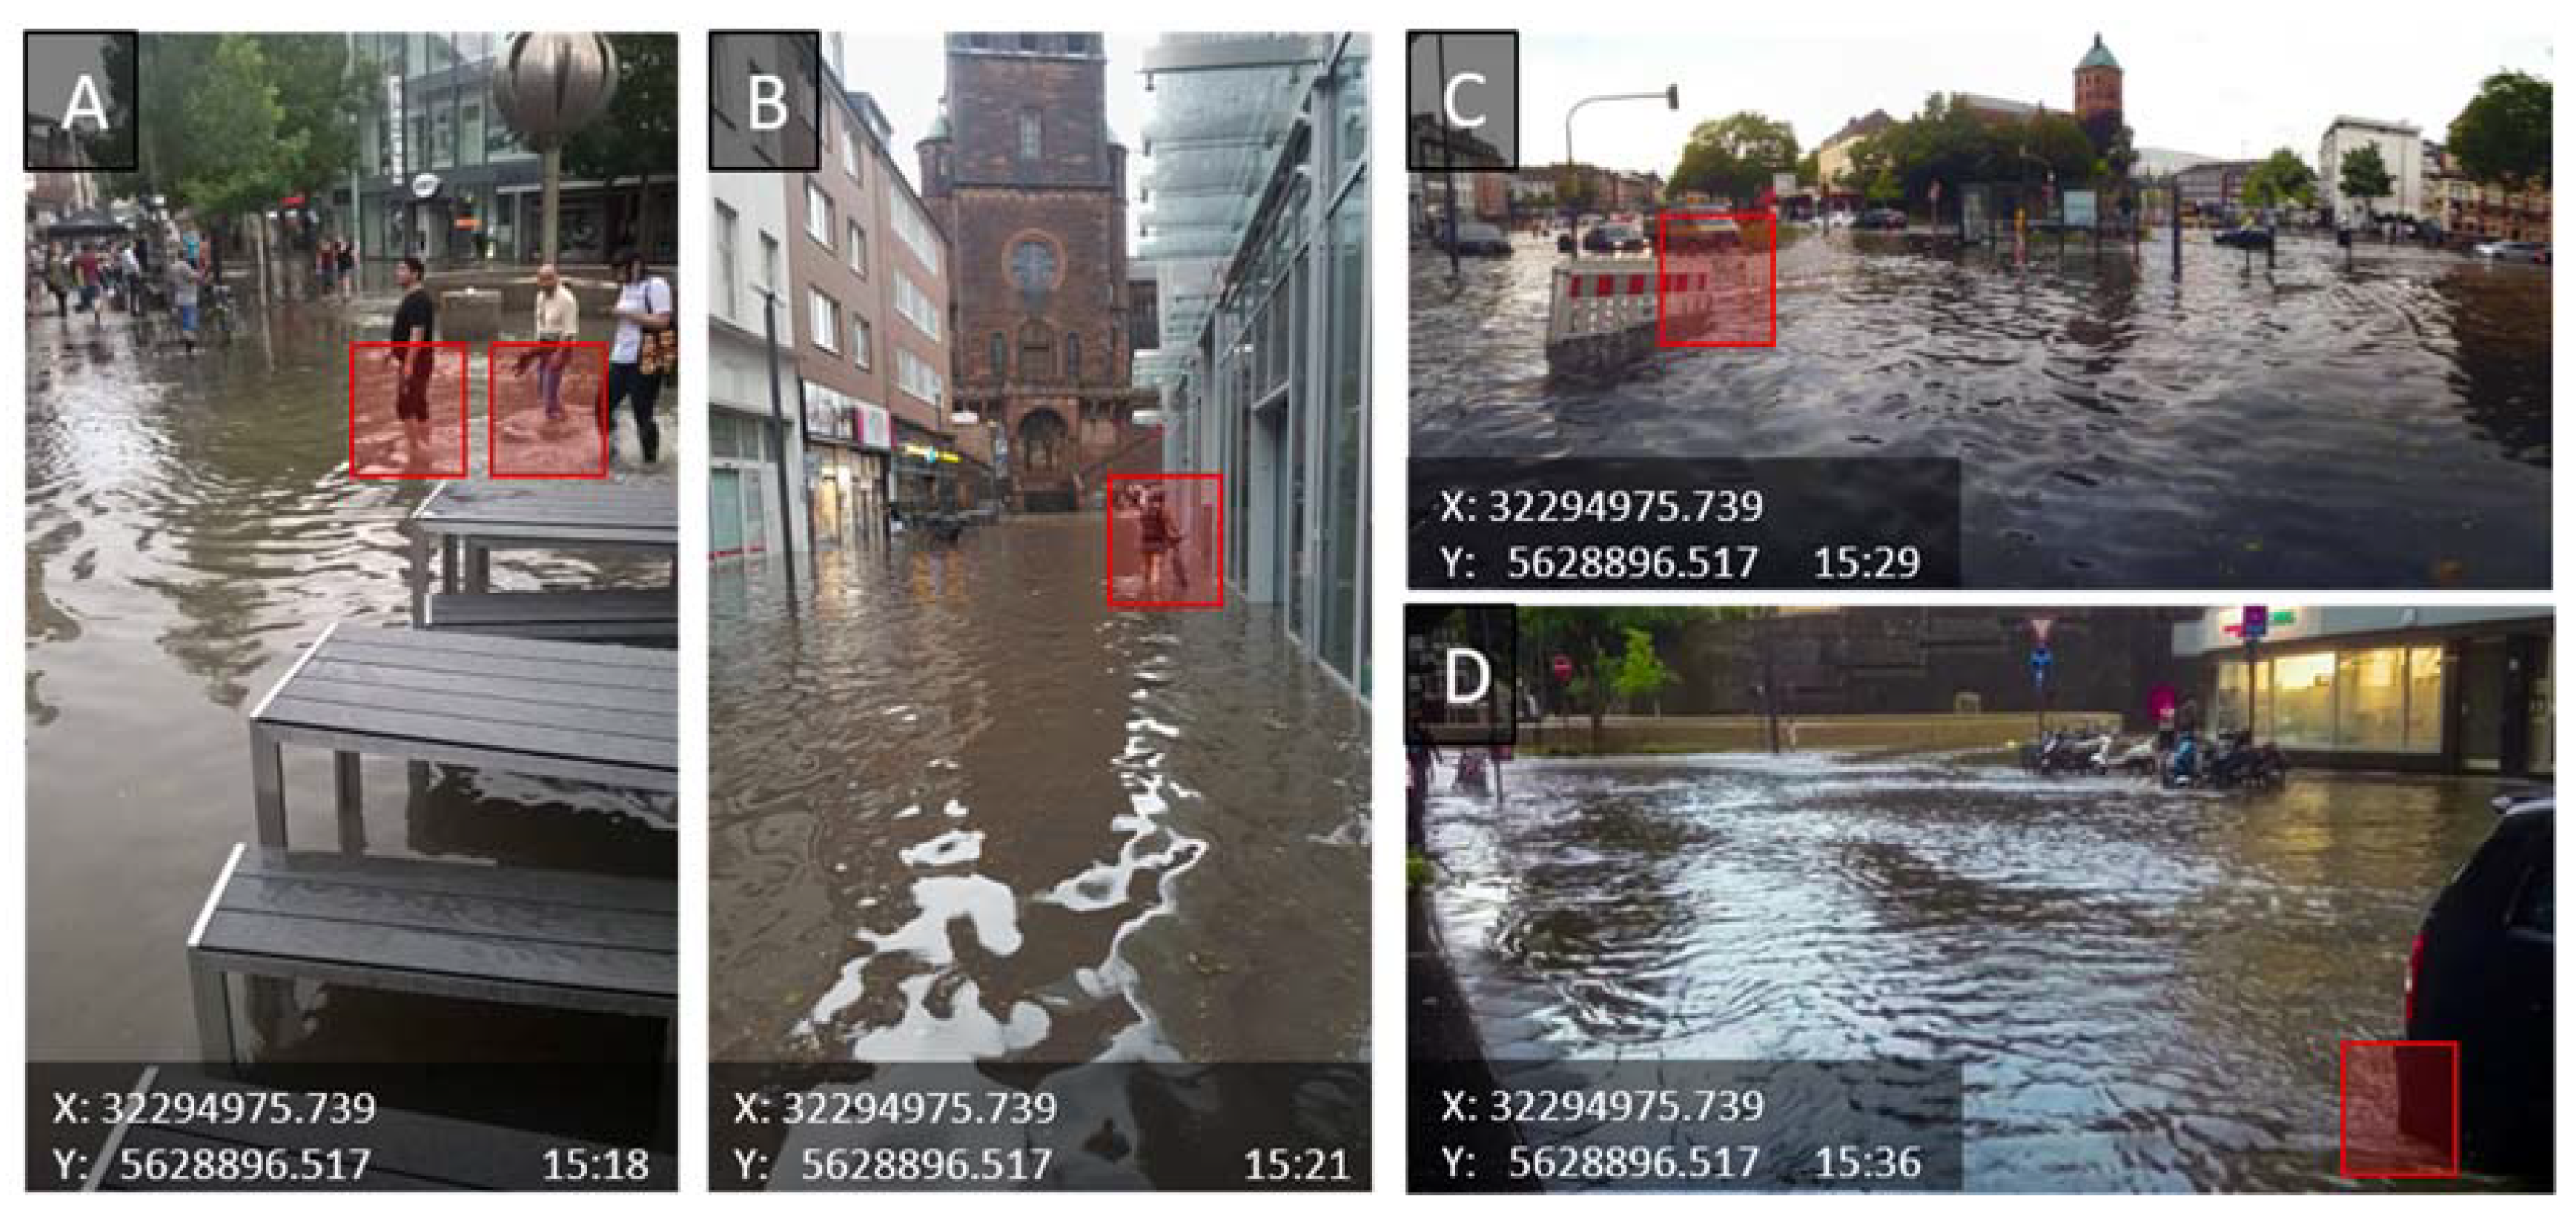
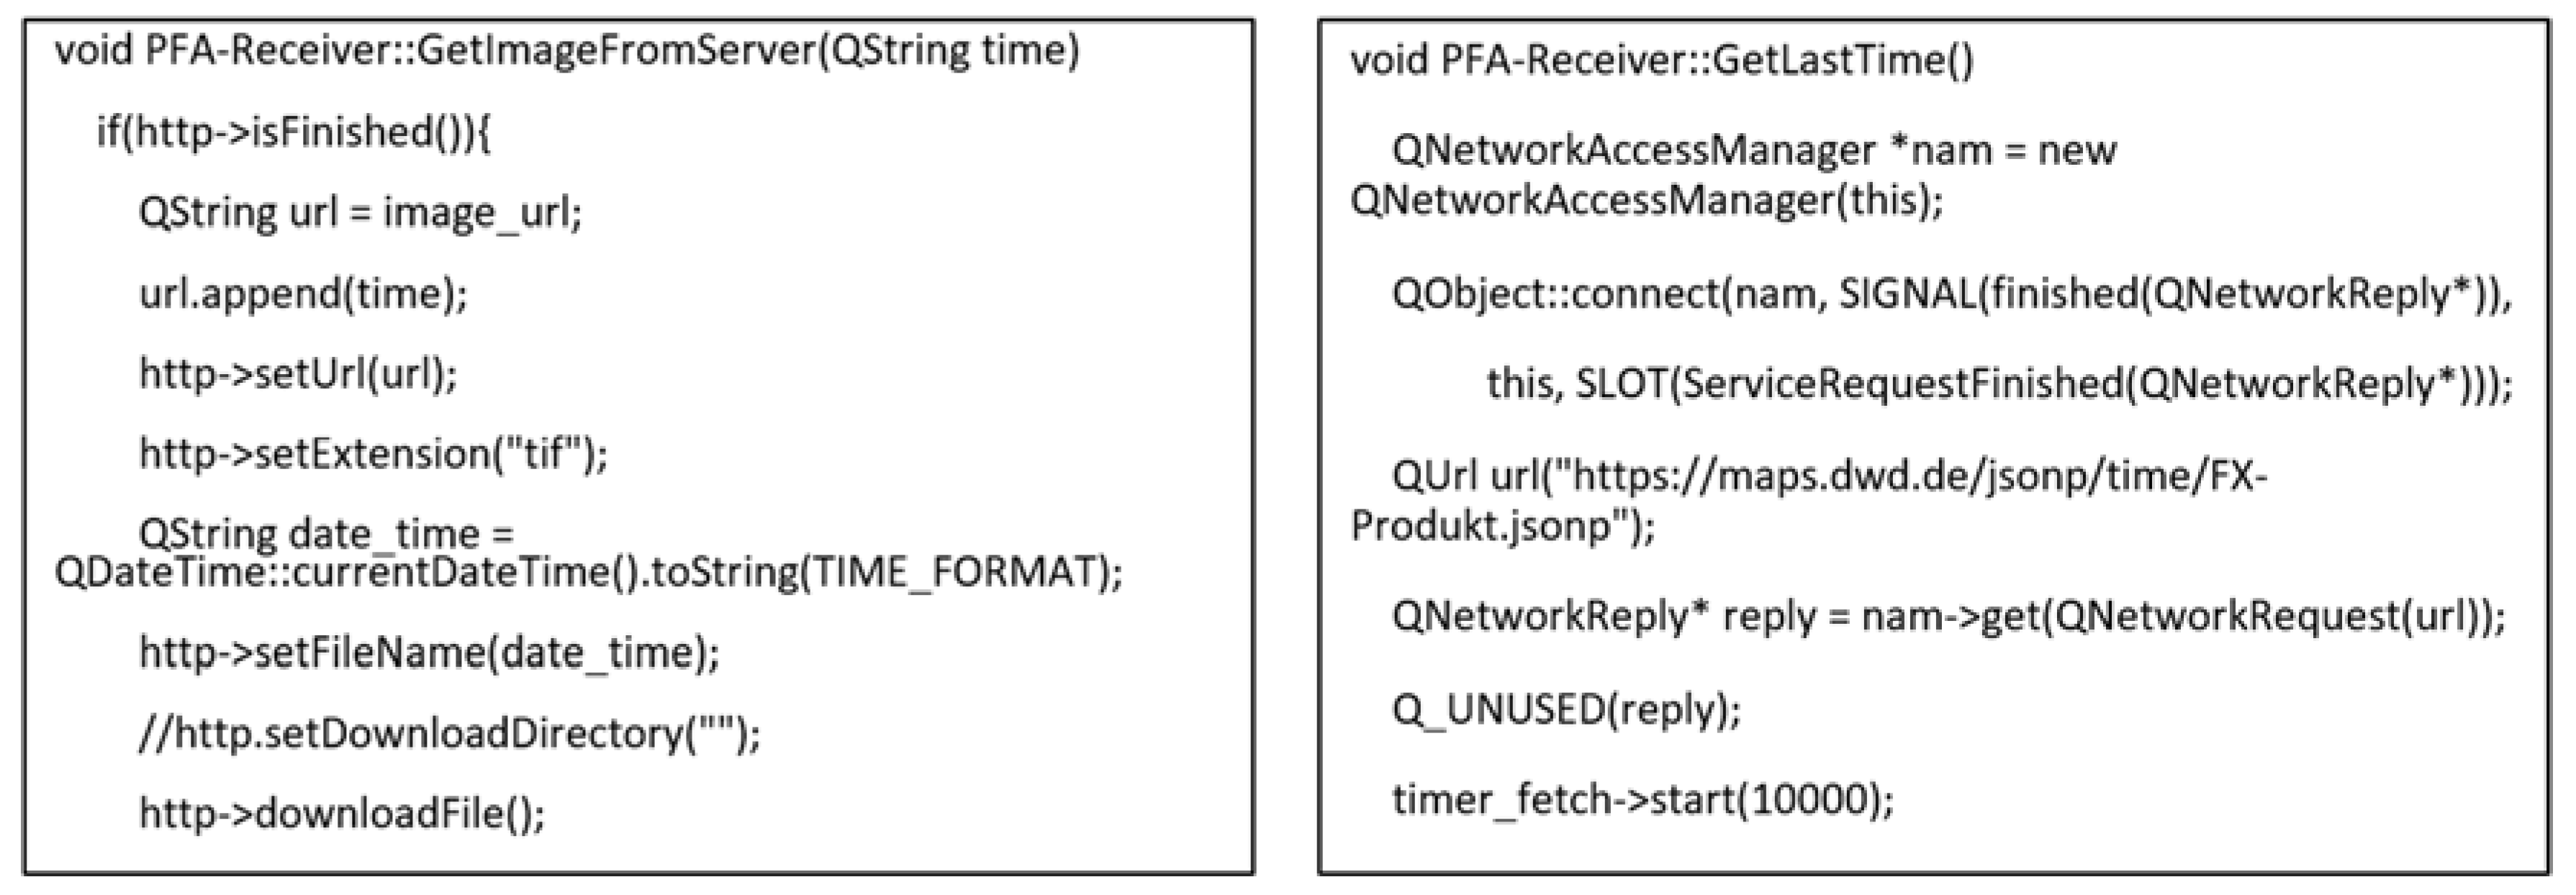
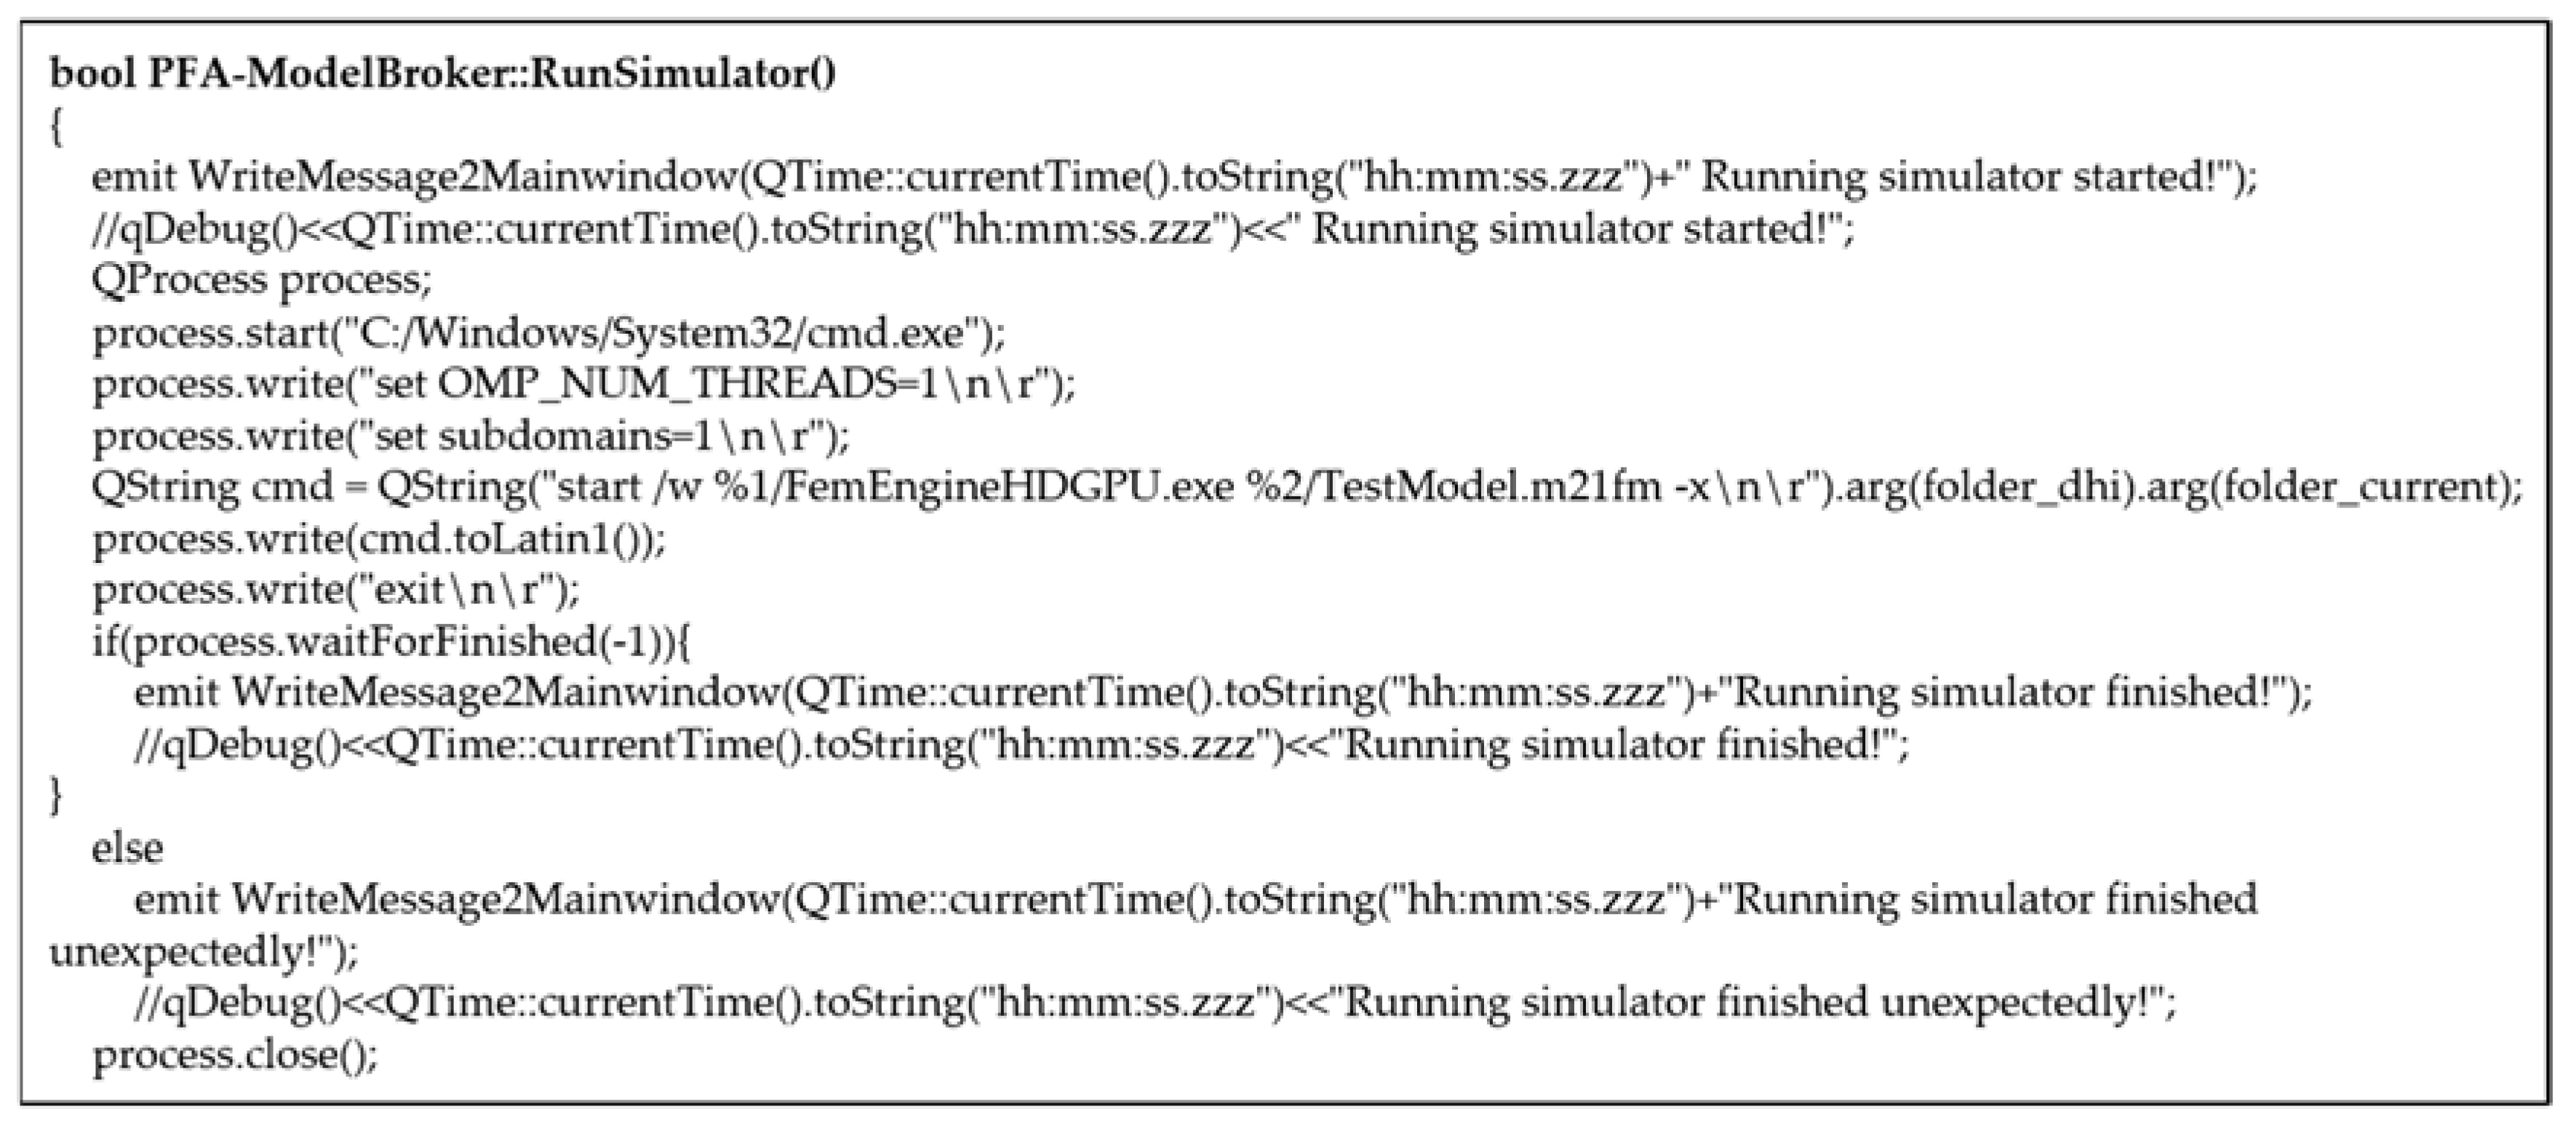
Table 1.
R-thresholds calculated for hotspot K3.
| Hotspot: K3 | F-Threshold 1 = 0.20 m --> R-Threshold 1 | |
|---|---|---|
| F-Threshold 2 = 0.50 m --> R-Threshold 2 | ||
| Rainfall Duration (min)] | R-Threshold 1 (mm/h) | R-Threshold 2 (mm/h) |
| 15 | 40 | 88 |
| 30 | 33 | 54 |
| 45 | 29 | 44 |
| 60 | 27 | 41 |
Table 2.
Number of elements, CPU and GPU computational times and speedup ratio S for the simulations at different resolutions.
Table 2.
Number of elements, CPU and GPU computational times and speedup ratio S for the simulations at different resolutions.
| Resolution (Maximum Mesh Size) | 1 m2 (A) | 3 m2 (B) | 5 m2 (C) | 8 m2 (D) |
|---|---|---|---|---|
| Number of Elements | 1,166,390 | 388,911 | 233,397 | 146,195 |
| TCPU (min) | 3399.2 | 988.6 | 470.4 | 216.025 |
| TGPU (min) | 298.1 | 104.4 | 54.0 | 32.7 |
| S (-) | 11.4 | 9.5 | 8.7 | 6.6 |
Table 3.
Estimated observed depths and simulated depths for selected locations in the central areas of Aachen including total computation times (TTotal) and speedup ratio (S) for different simulations.
Table 3.
Estimated observed depths and simulated depths for selected locations in the central areas of Aachen including total computation times (TTotal) and speedup ratio (S) for different simulations.
| Image Number | A | B | C | D | Ttotal | S |
|---|---|---|---|---|---|---|
| In situ estimated depth | 0.18–0.22 m | 0.35–0.40 m | 0.60–0.70 m | 0.19–0.21 m | ||
| HP-1 m2 | 0.20 m | 0.36 m | 0.79 m | 0.20 m | 298.4 min | 0 |
| RT-5 m2 | 0.20 m | 0.38 m | 0.80 m | 0.18 m | 4.9 min | 60.9 |
| RT-8 m2 | 0.20 m | 0.40 m | 0.77 m | 0.25 m | 3.3 min | 90.4 |
© 2020 by the authors. Licensee MDPI, Basel, Switzerland. This article is an open access article distributed under the terms and conditions of the Creative Commons Attribution (CC BY) license (http://creativecommons.org/licenses/by/4.0/).
Share and Cite
MDPI and ACS Style
Hofmann, J.; Schüttrumpf, H. Risk-Based and Hydrodynamic Pluvial Flood Forecasts in Real Time. Water 2020, 12, 1895. https://doi.org/10.3390/w12071895
AMA Style
Hofmann J, Schüttrumpf H. Risk-Based and Hydrodynamic Pluvial Flood Forecasts in Real Time. Water. 2020; 12(7):1895. https://doi.org/10.3390/w12071895
Chicago/Turabian StyleHofmann, Julian, and Holger Schüttrumpf. 2020. "Risk-Based and Hydrodynamic Pluvial Flood Forecasts in Real Time" Water 12, no. 7: 1895. https://doi.org/10.3390/w12071895
Note that from the first issue of 2016, this journal uses article numbers instead of page numbers. See further details here.