Spatiotemporal Differences and Dynamic Evolution of PM2.5 Pollution in China

1
Research Center of the Central China Economic Development, Nanchang University, Nanchang 330031, China
2
School of Economics and Management, Nanchang University, Nanchang 330031, China
3
Institute of Geographic Sciences and Natural Resources Research, CAS, Beijing 100101, China
4
School of Qianhu, Nanchang University, Nanchang 330031, China
*
Authors to whom correspondence should be addressed.
Sustainability 2020, 12(13), 5349; https://doi.org/10.3390/su12135349
Submission received: 8 June 2020
/
Revised: 29 June 2020
/
Accepted: 29 June 2020
/
Published: 2 July 2020
(This article belongs to the Special Issue Air Pollution as a Threat to Sustainable Development)
Abstract
:Air pollution, especially the urban haze, has become an urgent issue affecting the sustainable development of cities. Based on the PM2.5 concentration data of 225 Chinese cities collected by satellite remote sensing from 1998 to 2016, we quantitatively analyzed the spatiotemporal distribution characteristics and dynamic evolution trends of PM2.5 concentration in the four regions of China, namely the East, the Central, the West and the Northeast, by using statistical classification, GIS visualization, Dagum Gini coefficient decomposition and kernel density estimation. The results are as follows: First, the PM2.5 pollution in China showed a trend of fluctuation, which appeared to be increasing first and then decreasing, with the year 2007 as an important turning point for PM2.5 pollution changes across the country, as well as in the eastern and central regions. Second, PM2.5 pollution in China had significant spatial agglomeration. The intra-regional difference within the eastern region was the largest, and the inter-regional differences were the main source of overall differences. Third, kernel density estimation showed that the absolute difference of PM2.5 concentration distribution in China was expanding, with a significant phenomenon of polarization and the characteristics of spatial imbalance. This paper aimed to provide a scientific basis and effective reference for further advancing the sustainable development strategy of China in the new era.
1. Introduction
Under the long-term extensive economic development mode, China’s air pollution situation is becoming increasingly severe [1]. Particularly, as the primary pollutant affecting China’s air quality [2], haze pollution not only has long become a discordant factor restricting the sustainable development of China’s urban economy and society, but also seriously threatens the life and health of residents. People who have been long exposed to haze will bear a higher risk of suffering from cardiovascular, cerebrovascular, respiratory and other diseases, and even worse, the mortality will be dramatically increased [3,4,5]. The frequent occurrence of the haze pollution has become a great challenge for China to implement the strategy of sustainable development in the new era. Therefore, it is urgent to strengthen the pertinence of haze pollution prevention and control. However, China is a country with vast territory, and regions differ greatly in terms of natural environmental conditions, economic foundation, and resource endowment. Regional governments also have inconsistent efforts in the management and response of haze. Therefore, a quantitative study of the differences in haze pollution in various regions of China not only contributes to grasping the spatiotemporal pattern of haze in China more accurately, but is also helpful to evaluate the rationality of governance policies in various regions. In the meantime, studying the dynamic evolution of haze in China will also help to explore the evolution and governance effects of haze pollution in China, and provide effective decision-making references for formulating targeted policy recommendations and further advancing China’s sustainable development strategy in the new era.
At present, research in the field of haze pollution mainly focuses on the formation mechanism, influencing factors, spillover effect, control countermeasures, etc. The causes of haze pollution are relatively complex. Meteorological factors are generally considered to be the direct causes of haze weather [6,7,8], but in the final analysis, it comes from many social and economic factors formed under the extensive development mode, such as level of urbanization [9], industrial and energy structure [10,11,12], investment intensity [13], traffic activities [14], etc. Other studies further found that the distribution of haze pollution in China showed a significant spatial agglomeration effect and spillover effect [15,16]. In terms of governance countermeasures, domestic suggestions mainly concentrated on regional collaborative governance [17], interest compensation mechanism [18] and technological innovation [19], etc. With the deepening of the research, the analysis of the distribution characteristics and regional differences of haze from the perspective of time and space has gradually attracted the attention of scholars. The research on China mainly focuses on regions that suffered severe haze pollution, like Beijing, the Beijing-Tianjin-Hebei urban agglomeration and the Yangtze River Delta urban agglomeration, etc. [20,21,22,23], while studies abroad are more concentrated in internationally developed cities, such as Los Angeles and London [24,25]. Most studies mainly analyze the seasonal, monthly and daily variation of PM2.5 concentration in a certain area in a short period of time [26,27,28]. Meanwhile, model analyses, like geographical detector method, spatial autocorrelation analysis and spatial metrology etc., are also used by some scholars to analyze the spatial characteristics of haze pollution [29,30,31,32].
To sum up, scholars at home and abroad have carried out research on haze pollution from multiple perspectives and have achieved fruitful results. However, from the perspective of system theory and the goal of China’s sustainable development in the new era, the existing research still has the following deficiencies: first, due to the difficulty of data search, the time series of existing research is relatively short, most of which only discusses the law of individual years or changes with seasons, months and days, which is not enough to reflect the overall law of spatial-temporal evolution of haze pollution in China. Second, most scholars take single or multiple cities, provinces and city clusters with severe haze pollution as research samples. However, there is a relative lack of studies that apply quantitative measurement to the analysis of spatial-temporal differences, as well as dynamic evolution from the perspective of regional differences, so it is difficult to reveal the regional differences and dynamic evolution process of haze pollution in China.
On such a basis, this paper takes PM2.5, the main cause of haze pollution, as the research object, and based on the PM2.5 concentration data monitored by satellite remote sensing in 225 cities in China from 1998 to 2016, and from the perspective of four regions in eastern, central, western and northeastern China, analyzes the interannual variation characteristics of PM2.5 concentration in Chinese cities from the time dimension, and summarizes the spatial pattern changes of PM2.5 concentration through GIS visualization. Furthermore, the Dagum Gini coefficient and its decomposition method are used to analyze the regional differences and their sources. Finally, the kernel estimation method is used to describe the dynamic evolution of PM2.5 concentration distribution. This paper comprehensively reveals the spatiotemporal differences and dynamic evolution of haze pollution in China and provides a scientific basis and effective reference for the joint prevention and control of regional haze and policy optimization.
To be specific, the marginal contribution of this paper lies in the following three aspects. First, compared with most existing studies, this paper takes a longer time span and covers a wider range; second, based on the four major regional perspectives, this paper innovatively analyzes the spatiotemporal difference of PM2.5 pollution distribution from the perspective of relative differences and absolute differences; third, this paper further explores the source of regional differences of PM2.5 pollution in the four major regions of China, and provides a spatial exploration for distribution difference through scientific investigation of the spatiotemporal evolutionary characteristics.
2. Data Sources and Methods
2.1. Data Sources
At present, the data of PM2.5 concentration in the existing research are obtained from two sources. One is from monitoring stations in various regions, the other is from data obtained by inversion using satellite remote sensing technology [33]. Since the Ministry of Environmental Protection of the People’s Republic of China only began to launch the pilot work of taking PM2.5 concentration as a daily environmental monitoring indicator in 2012, the available years and cities for research are limited, making it difficult to systematically and comprehensively investigate the spatiotemporal distribution and dynamic evolution of PM2.5 pollution in China. Therefore, we use the raster data of PM2.5 concentration published by Columbia University Socioeconomic Data and Application Center, which is obtained by satellite monitoring. Then, we conduct vectorization treatment on the basis of it to obtain the PM2.5 concentration data of 225 cities in China from 1998 to 2016. Some missing data are complemented by the linear interpolation method. Although the precision of satellite remote sensing inversion data may be slightly lower than that of real-time monitoring data on the ground under the influence of meteorological factors, as non-point source data, it can fully reflect the change trend of PM2.5 concentration in a region. Therefore, the data can be used in the research of haze pollution in China.
2.2. Methods
2.2.1. Dagum Gini Coefficient and Decomposition Method
The Dagum Gini coefficient decomposition method [34] analyzes the overall differences and sources of differences of PM2.5 concentration in Chinese cities from the perspective of relative differences. In this paper, the mainland of China is divided into eastern, central, western and northeastern regions, and the corresponding cities are merged into the corresponding regions, to depict the spatial differences of PM2.5 concentration in the four regions. The larger the Gini coefficient, the greater the regional differences in PM2.5 pollution, and vice versa. Compared with the traditional Gini coefficient and Theil index, the Dagum Gini coefficient can not only analyze the source of regional differences effectively, but also reflect the overlapping problem within subgroups, so that the conclusion is more accurate. The total Gini coefficient is divided into three parts: the contribution of differences within regions (Gw), the contribution of differences between regions (Gnb), and the contribution super-variable density (Gt), which meets the requirements of G = Gw + Gnb + Gt. The total Gini coefficient G can be expressed by the following formula:
where yji(yhr)represents the annual average PM2.5 concentration of any city in the j-th (h-th) region, μ refers to the average value of PM2.5 concentrations in all cities; n is the size of the data set, that is, n=225; k represents the four major regions divided, that is, k=4; nj(nh) represents the number of cities in the j-th (h-th) region. The regions must be sorted according to the average value of PM2.5 concentrations in the region before performing the decomposition of the Dagum Gini coefficient, that is, μh ≤ μj ≤…≤ μk. The formulae of three compositions of the Dagum Gini coefficient are as bellow:
Gjj,Gjh represent the Gini coefficient within and between regions, respectively. In Formulaes (3–6), pj = nj/n, sj = njμj/nμ (j = 1,2, …, k). Djh refers to the relative impact of the PM2.5 concentration between the j-th and h-th regions and is calculated as Formula (7). Among them, djh represents the difference of PM2.5 concentration between the j-th and h-th regions, which can be understood as the sum of all the sample values of yji-yhr > 0 in the j and h regions. pjh represents the first moment of the super-variable, which can be understood as the sum of all the sample values of yhr–yji > 0 in the j and h regions. The definitions of djh and pjh are shown in Formulaes (8) and (9), where Fj (Fh) represents the cumulative density distribution function in the j (h) area.
2.2.2. Kernel Density Estimation
Kernel density estimation is a relatively mature non-parametric estimation method for studying unbalanced distribution, which is widely used in many research fields, such as economics and sociology [35,36,37]. With strong continuity and robustness, kernel density estimation uses a continuous curve to describe the distribution of random variables, and simulates the overall distribution based on data characteristics. If f (x) is the density function of the random variable x, the principle of kernel density estimation could be explained as:
where N represents the number of observation values; h represents bandwidth, which determines the estimation accuracy of the kernel density and the smoothness of the curve; i represents a city in the study area; Xi represents the sample points of independent identical distribution; K (•) denotes the kernel function, which is a smooth transformation or weighted function. Common kernel functions include quadratic kernel function, Gaussian kernel function, trigonometric kernel function and so on. In this paper, the commonly used Gaussian kernel function is used to estimate and analyze the dynamic evolution of haze pollution in China, as shown in Formula (11):
3. Results and Analysis
3.1. Temporal Differences of PM2.5 Pollution
3.1.1. Temporal Evolution of PM2.5 Pollution in China
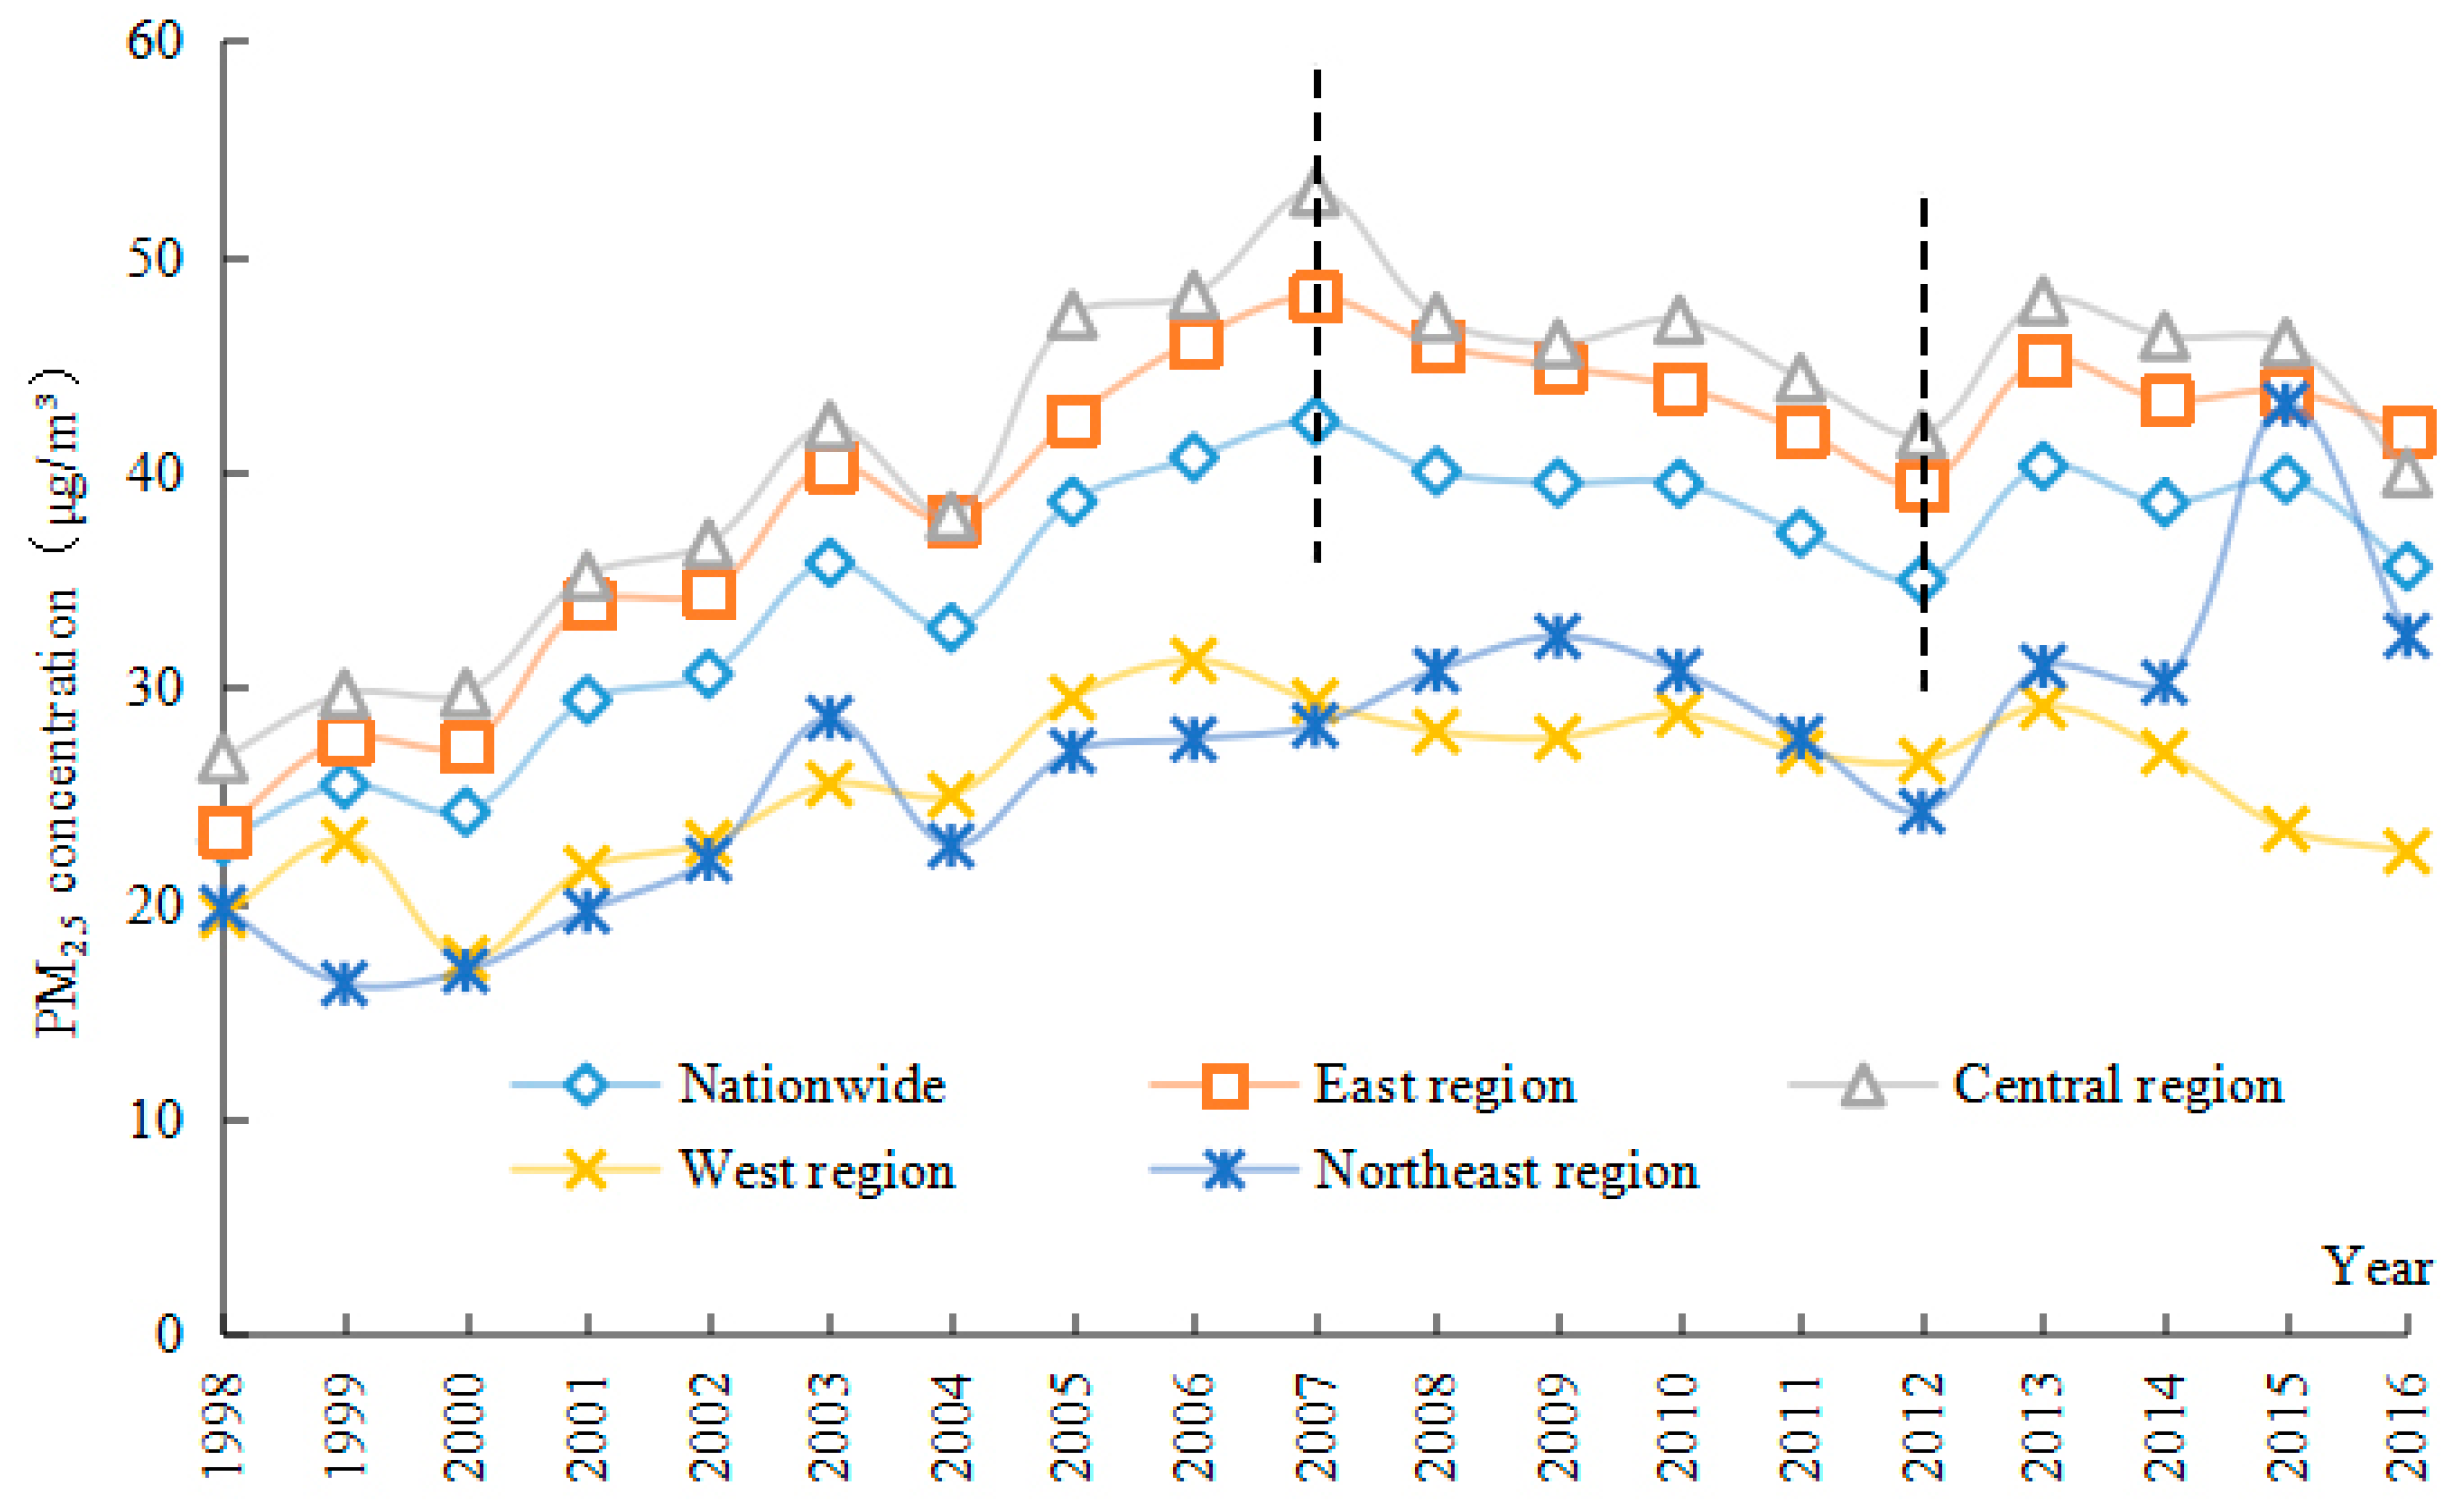
In order to better judge the overall trend of PM2.5 pollution in China from time spans, the temporal variation rule of PM2.5 concentration from 1998 to 2016 was plotted (Figure 1). From 1998 to 2016, the PM2.5 concentration in China showed a fluctuating trend, and the overall average was 35.15 μg/m3. According to the change trend, it can be roughly divided into three stages; the first stage (1998–2007): PM2.5 concentration showed a trend of rising in fluctuation and reached its peak in 2007, with the average annual growth of 1.95 μg/m3. The second stage (2008–2012): PM2.5 concentration in this stage dropped down in a wave and was at the lowest level in 2012, with an average annual decrease of 1.01 μg/m3. There may be two main reasons: the first one is related to the holding of the 2008 Beijing Olympic Games. During this period, the government strengthened the prevention and control of air pollution and shut down some polluting enterprises. The second reason is a series of important directive documents for air pollution prevention and control issued by the State Council, such as “Guidance on Promoting Joint Prevention and Control of air Pollution to Improve Regional Air Quality” in 2010, and the newly revised Ambient Air Quality Standard (GB3095–2012) in 2012 etc., which achieved remarkable results. The third stage (2013~2016): in 2013, PM2.5 concentration surged with an increase of 15% compared to the previous year, resulting in two large-scale regional haze pollution in the central and eastern regions, which attracted the wide attention of the public. In this background, the State Council issued the Action Plan of Air Pollution Prevention and Control, and formulated and implemented a series of haze control measures [38]. Through continuous efforts, PM2.5 concentration in China decreased from 2013 to 2016, to 35.61 g/m3 by 2016, leading to a significant reduction in PM2.5 pollution. It is worth noting that, although PM2.5 concentration has declined in recent years, the minimum value in China over 19 years was 22.86 μg/m3, far higher than the recommended value of 10 μg/m3 in the Air Quality Guidelines issued by the World Health Organization (WHO). In addition, according to the Ambient Air Quality Standard (GB3095–2012) formally implemented in China in 2016, except for 1998–2001, 2004 and 2012, PM2.5 concentration of the rest years all exceeded the average annual limit of 35 μg/m3. It can be seen that China’s haze control is still insufficient and there is still a long way to go.
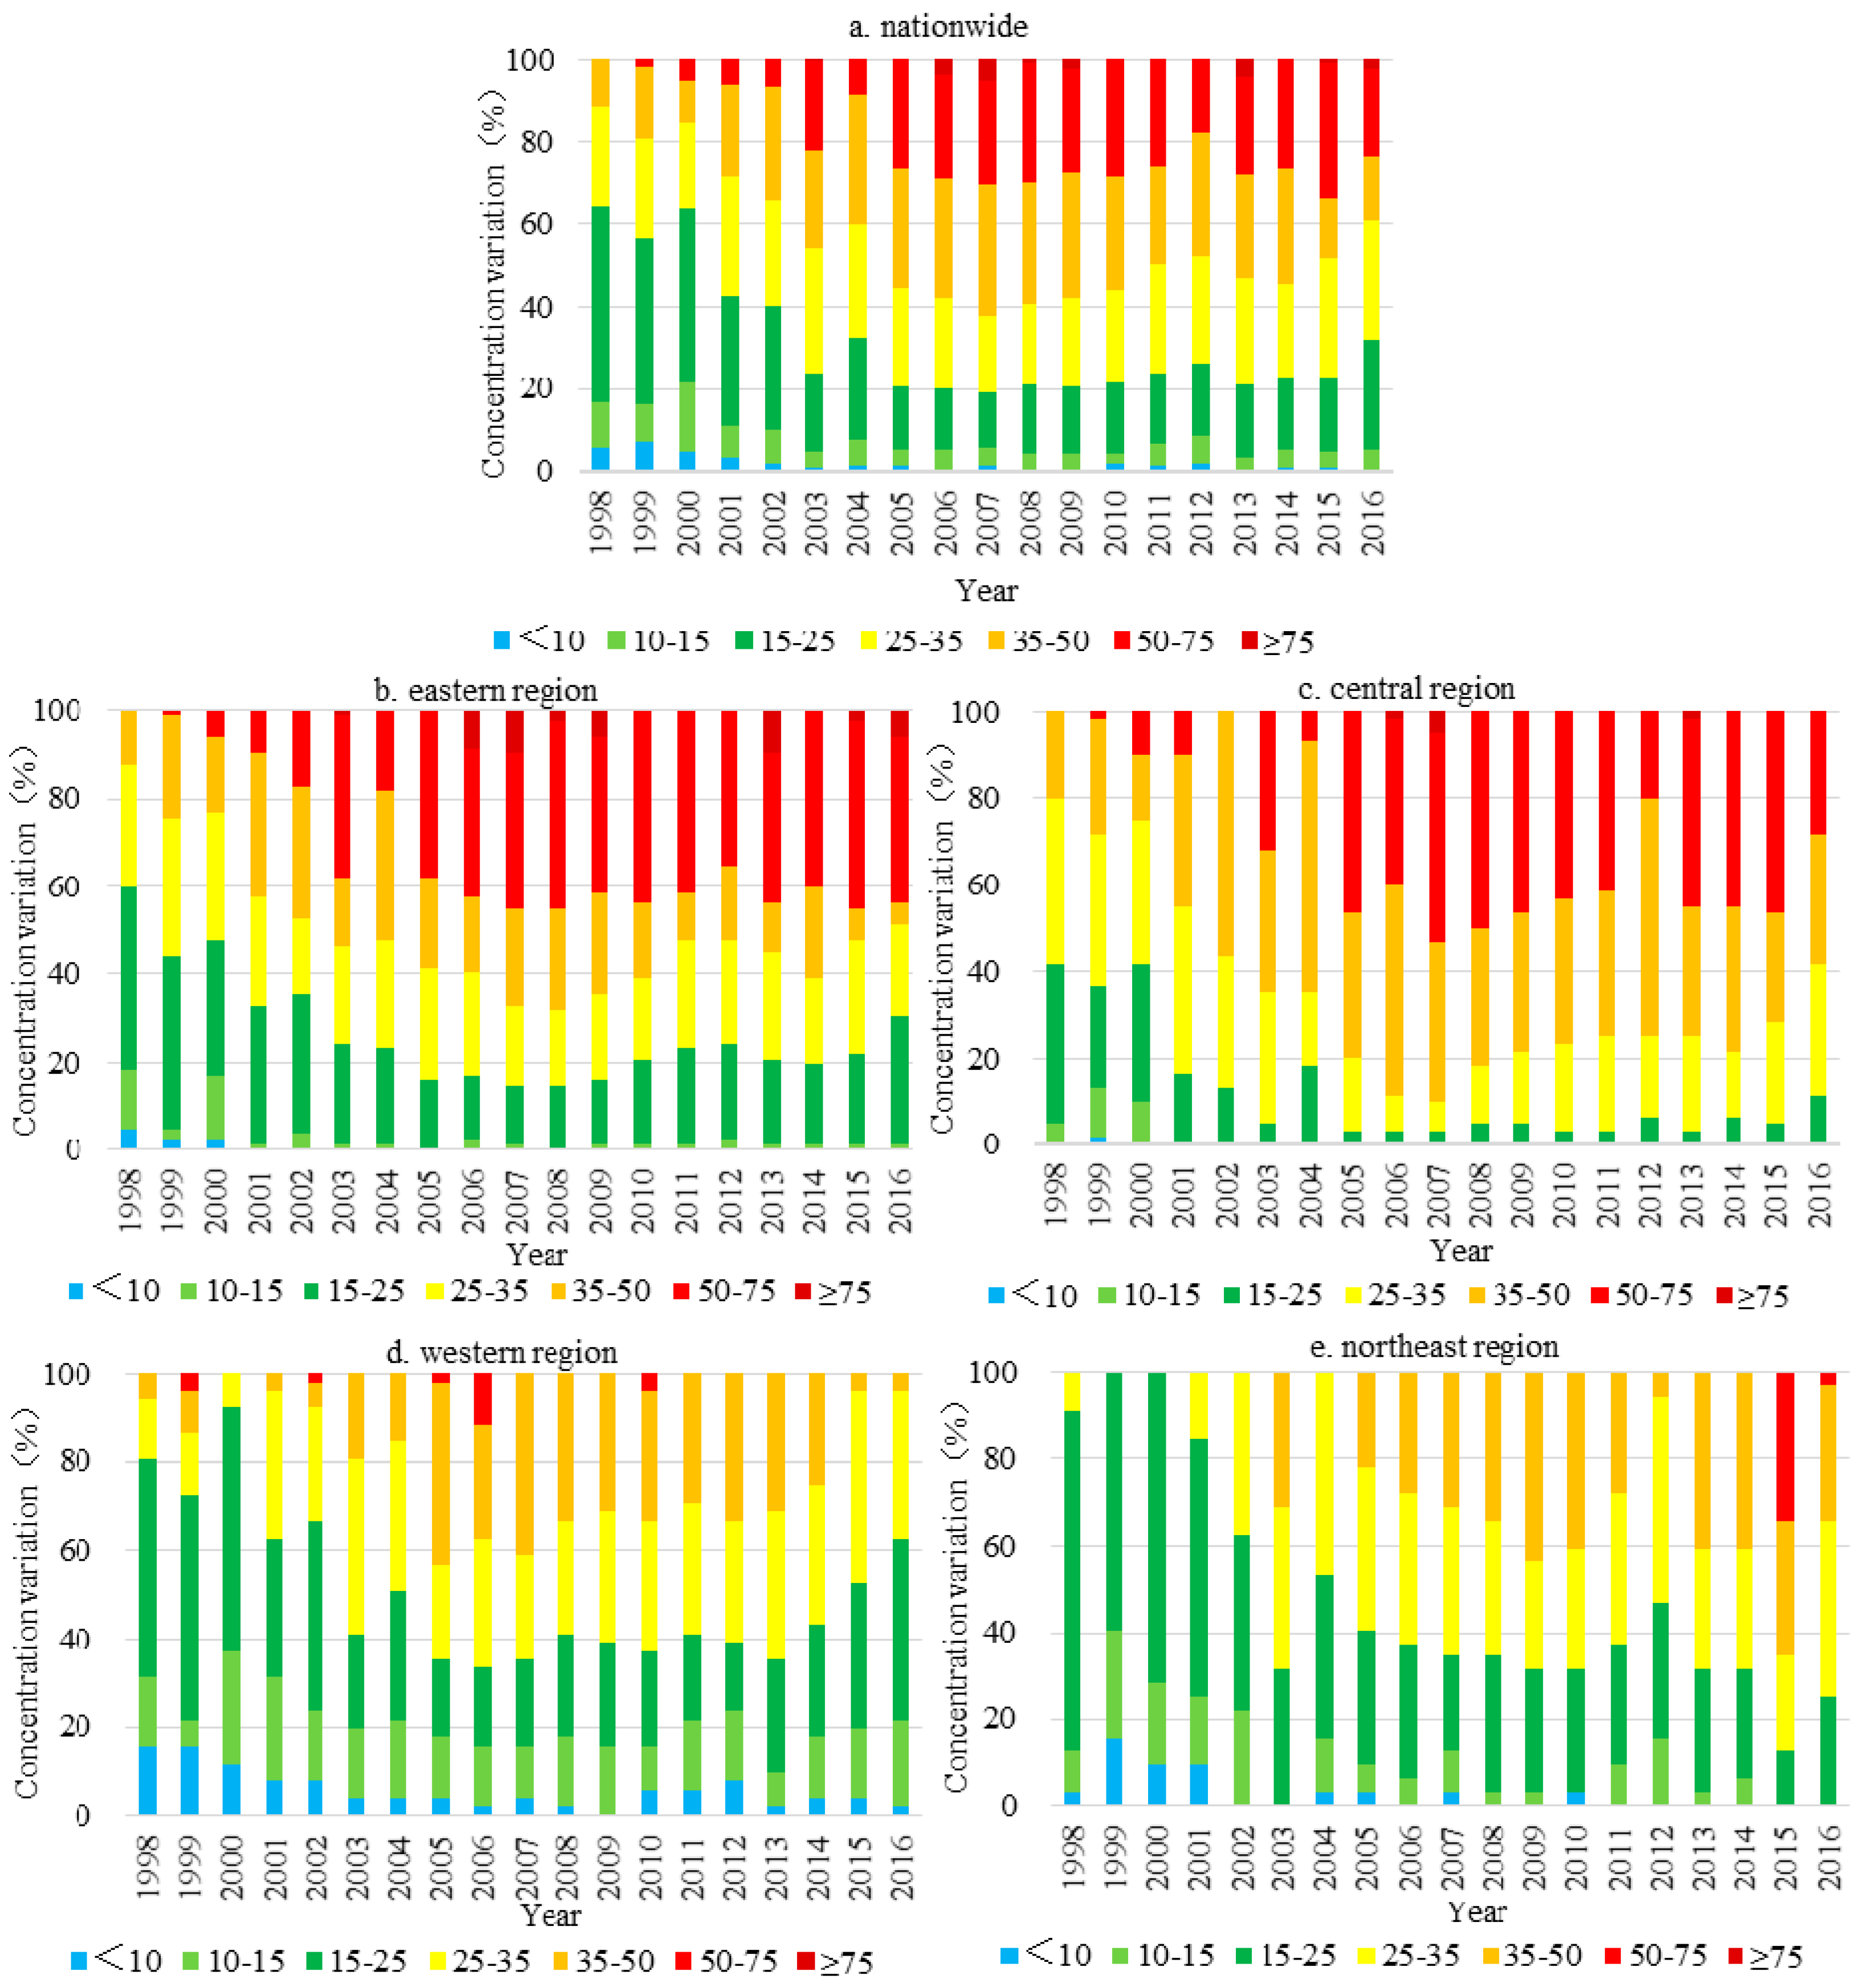
Furthermore, according to the guideline value set and the transitional target values of the three grades for PM2.5 concentration in the Air Quality Guidelines issued by the World Health Organization (WHO), as well as the average annual limit and daily average limit set in China’s Ambient Air Quality Standard (GB3095-2012) (Table 1), the annual average PM2.5 concentration is divided into seven grades (<10, 10–15, 15–25, 25–35, 35–50, 50–75, ≥75 μg/m3), and the bar graph (Figure 2a) of the proportion of PM2.5 concentration in various regions of China was obtained through classification statistics. During the studied period, the PM2.5 concentration in China was mainly between 10–35 μg/m3, accounting for 40%–80% of the total number of cities in China. About 40.89%–88.89% of urban PM2.5 concentrations met China’s average annual limit of 35 μg/m3, while less than 7.11% of urban PM2.5 concentrations met the guideline value of 10 μg/m3 set by WHO. In addition, the proportion of cities with good air quality (PM2.5 < 10 μg/m3) decreased year by year. The proportion of cities with average air quality (10 μg/m3<PM2.5 < 35 μg/m3) decreased first, and then increased. The proportion of cities with poor air quality (PM2.5 > 35 μg/m3) increased first and then decreased. These characteristics were consistent with China’s key policies on haze prevention and control in recent years.
Specifically (1), from 1998 to 2016, the number of cities with PM2.5 concentration less than 10 μg/m3 accounted for 0%–7.11% of the total number of cities in the country, with the largest proportion occurring in 1999, and almost no cities had a concentration less than 10 μg/m3 after 2002 (2). The proportion of cities with PM2.5 concentration of 10–15 μg/m3 was 2.67%–16.44%, with the largest proportion in 2000 and the smallest in 2013 (3); the proportion of cities with PM2.5 concentration 15–25 μg/m3 was 13.33%–47.11%, with the largest proportion in 1998 and the smallest in 2007 (4). The proportion of cities with PM2.5 concentration of 25–35 μg/m3 was 18.67%–30.22%, with the largest proportion in 2003 and the smallest in 2007 (5). The proportion of cities with PM2.5 concentration of 35-50 μg/m3 was 11.11%–31.56%, with the largest proportion in 2004 and 2007 and the smallest in 1998 (6). The proportion of cities with PM2.5 concentration of 50-75 μg/m3 was 0%–28.29%, with the largest proportion in 2008 and the smallest in 1998. (7) The proportion of cities with PM2.5 concentration greater than or equal to 75 μg/m3 ranged from 0% to 4.89%, with the largest proportion in 2007, and no cities exceeded 75 μg/m3 before 2006.
3.1.2. Temporal Evolution of PM2.5 Pollution in the Four Major Regions
From 1998 to 2016, the PM2.5 concentration in the four major regions of China had a fluctuation trend (Figure 1). The PM2.5 concentration in the eastern and central regions was higher than the national average, and the trend was basically consistent with that in the whole country, which was increasing to the highest value in 2007, then decreasing until 2012, and then decreasing after a short rise in 2012. This showed that 2007 was an important turning point for PM2.5 pollution in the eastern, central and national regions. The concentration of PM2.5 in the central region was apparently higher than that in the other three major regions, with PM2.5 pollution being the most serious, followed by the eastern region. In addition, the eastern and central regions showed an overall upward trend, respectively, with an average annual increase of 0.93μ/m³ and 0.88 μg/m3. The PM2.5 concentration in the western region increased by 0.30 μg/m3 per year on average during the study period, showing a slowly increasing trend. The increasing rate of PM2.5 concentration in Northeast region was 0.94 μg/m3 per year on average, which was the fastest region among the four major regions. From 1998 to 2015, PM2.5 concentration increased to a maximum of 43.11 μg/m3 with volatility and began to decline rapidly in 2015.
The results of the PM2.5 concentration grading proportion of the cities in the four regions (Figure 2b–e) showed that (1) the proportion of cities with PM2.5 concentration less than 10 μg/m3 was the highest in the western region, followed by the northeast region. The years with high proportion in the western region were mainly around 2000 and 2012, while those in the northeast region mainly appeared around 2000. In the eastern and central region, there were almost no cities with a PM2.5 concentration less than 10 μg/m3. (2) The cities with PM2.5 concentration less than 15 μg/m3 were mainly concentrated in the western and northeast regions, especially the western regions. In addition, the number of cities with PM2.5 concentration was less than 15 μg/m3 in the western regions varied slightly (3). The proportion of the number of cities lower than 25 μg/m3 in the eastern and western regions showed a trend of decreasing and then rising; in the central region, it decreased first, and then became almost stable at about 4% in the following years; in the northeast region, it kept decreasing all the time. (4) The cities with PM2.5 concentration higher than 35 μg/m3 were mainly concentrated in the eastern and central regions, especially the central regions. The proportion of cities with PM2.5 concentration higher than 35 μg/m3 is the highest in the central region, ranging from 20 % to 90%. The western region was the lowest, which was between 0%–43.14% (5). The cities with PM2.5 concentration higher than 50 μg/m3 were also concentrated in the eastern and central regions. The eastern region showed a change characteristic of rising first and then stabilizing at around 40%, while the central region showed a trend of rising first and then slowly decreasing. In 2015, the proportion in northeast China increased sharply, rising to 34.38% (6). The number of cities with PM2.5 concentration higher than 75 μg/m3 is relatively small, with the highest proportion occurring in the eastern region in 2007.
3.2. Spatial Differences of PM2.5 Pollution
3.2.1. Spatial Pattern of PM2.5 Pollution
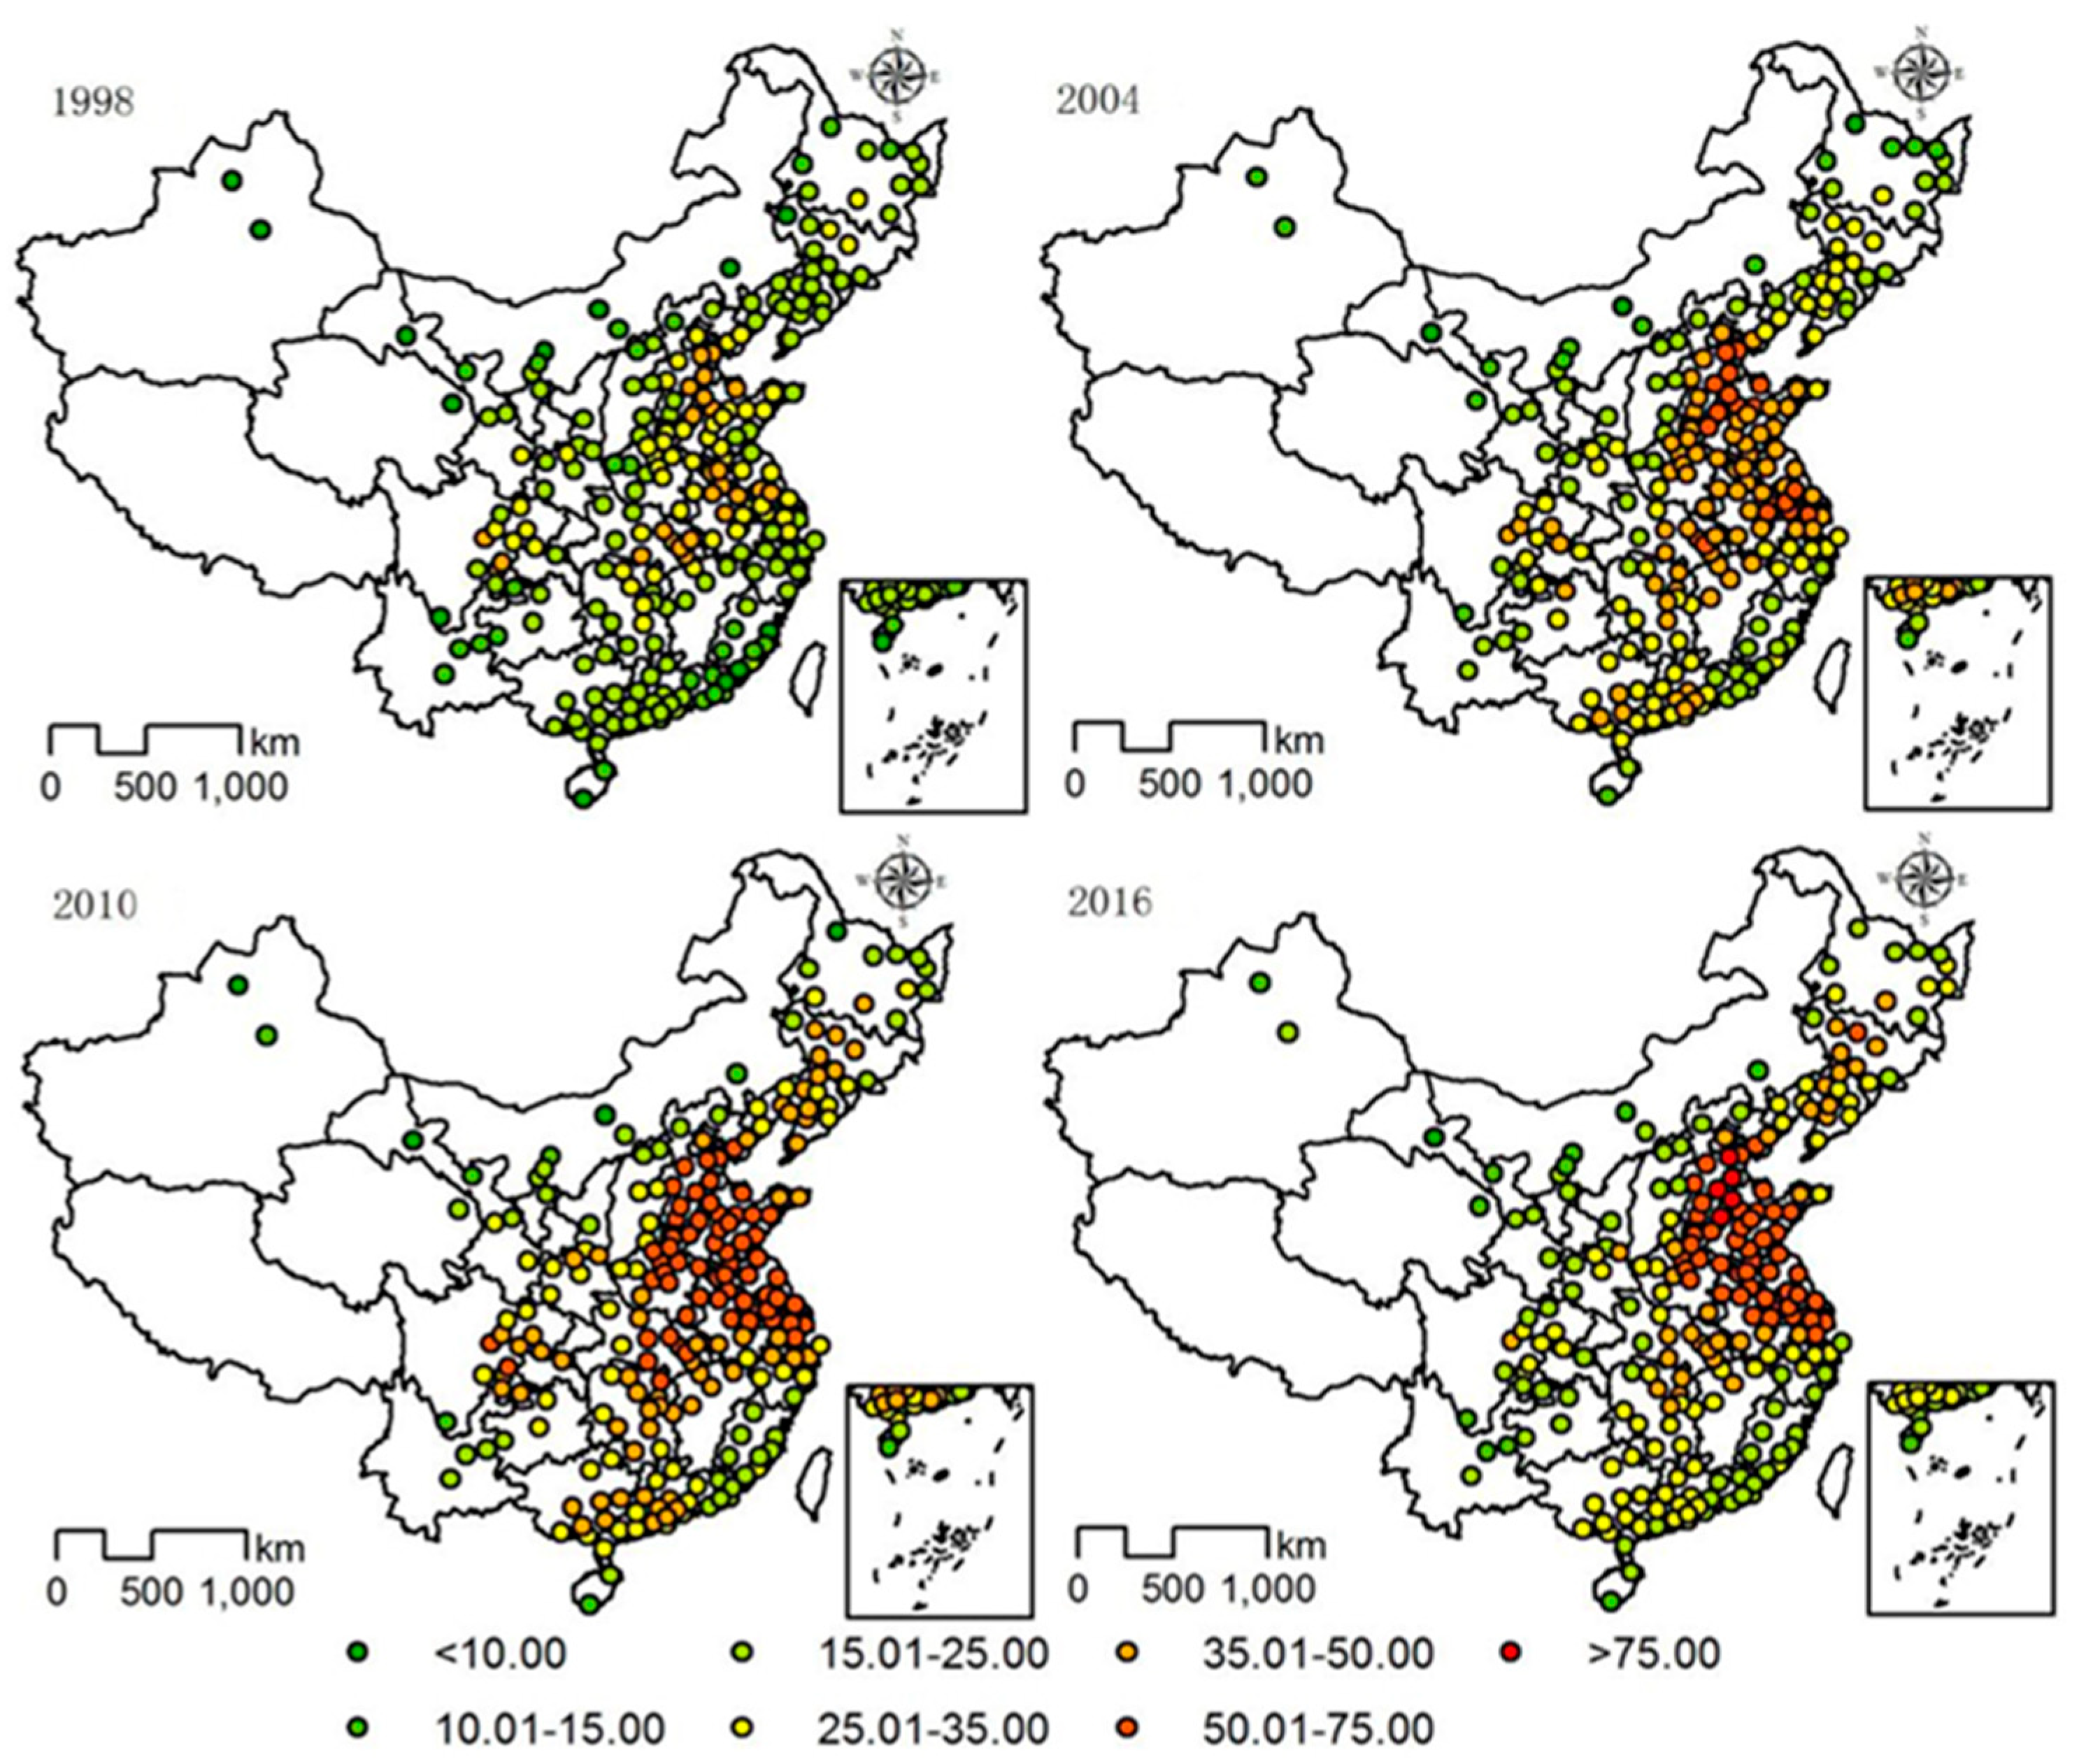
In the study period from 1998 to 2016, the PM2.5 concentration data of 225 cities in China in 1998, 2004, 2010 and 2016 were selected in a six-year time cycle, and the spatial distribution variation of PM2.5 pollution in China were plotted (Figure 3). On the whole, the overall level of PM2.5 pollution in China had risen remarkably, with significant spatial agglomeration characteristics and regional differences. Taking the average annual limit (35 μg/m3) set by China and the average daily limit set (50 μg/m3) of transition target Ⅱ by WHO as the cut-off point, 225 cities can be divided into three types: cities with low pollution (PM2.5 < 35 μg/m3), moderate pollution (35 μg/m3 ≤ PM2.5 < 50 μg/m3) and high pollution (PM2.5 ≥ 50 μg/m3).
From 1998 to 2016, PM2.5 moderately and highly polluted cities were mainly distributed in the Beijing-Tianjin-Hebei urban agglomeration, Shandong Peninsula urban agglomeration, Yangtze River Delta urban agglomeration, Chengdu-Chongqing urban agglomeration, urban agglomeration of central-southern Liaoning Province, central Yangtze urban agglomeration, and Central Plains urban agglomerations north of the Yangtze River. Particularly in northern regions, the air pollutant emissions were large and concentrated. The important reason was rapid industrialization and coal burning in winter. In addition, adverse weather conditions such as light wind and temperature inversion made PM2.5 pollution more serious. Low pollution cities mainly concentrated in the pearl river delta urban agglomeration, the urban agglomeration on the west coast of the Taiwan straits, the urban agglomeration in northern Guangxi, Tianshan mountains north slope urban agglomeration, urban agglomeration centered around the Ningxia section of the Yellow River, and the Hohhot-Baotou- Ordos-Yulin urban agglomeration.
Specifically, in 1998, PM2.5 pollution was distributed in a small scope. Only the cities in the southeast of the Beijing-Tianjin-Hebei urban agglomeration and the middle reaches of the Yangtze river were PM2.5 moderately polluted cities, while other cities were low-polluted cities. However, PM2.5 concentration was basically higher than the guideline (10 μg/m3) set by the WHO. The small scope of PM2.5 pollution was mainly due to China’s backward economic and social development in the 1990s, with low levels of urbanization, industrialization and traffic conditions, less consumption of coal and other energy, and less pollution from automobile exhaust emissions.
Since China joined the World Trade Organization in 2004, environmental pressure has gradually increased along with the continuous economic growth, and the scope of PM2.5 pollution has begun to expand. The cities with moderate pollution were mainly distributed in the central region of the Beijing-Tianjin-Hebei urban agglomeration, Shandong peninsula urban agglomeration, Yangtze river delta urban agglomeration and middle reaches of the Yangtze river urban agglomeration. Among them, the cities with high pollution were mainly distributed in the Beijing-Tianjin-Hebei urban agglomeration and Yangtze river delta urban agglomeration.
In 2010, with the rapid advancement of industrialization and urbanization, China’s PM2.5 pollution problem continued to worsen, and the polluted areas further expanded. PM2.5 pollution was spreading to the northeast, western and southern regions. The PM2.5 concentration in some cities which were mainly located around the Bohai sea was even higher than China’s daily average limit of 75 μg/m3. Compared with 2004, in 2010, there were new areas with moderate PM2.5 pollution, such as the central-southern Liaoning urban agglomeration and the Harbin-Changchun urban agglomeration in northeast China.
In 2016, the scope of PM2.5 pollution was reduced, indicating that the haze pollution problem in China showed a significant improvement. Among them, cities in the pearl river delta urban agglomeration and Chengdu-Chongqing urban agglomeration showed obvious signs of easing in the PM2.5 pollution level. This was mainly due to the series of environmental protection measures issued by the local government. In addition, the Pearl River Delta region was located in the southeast coast, with good air diffusion conditions and a relatively active atmospheric movement.
3.2.2. Analysis of Regional Differences Based on the Decomposition of Dagum Gini Coefficient
Based on the decomposition of the Dagum Gini coefficient, in this part, the total Gini coefficient, the Gini coefficient within regions, the regional differences sources and contributions of PM2.5 concentration in China from 1998 to 2016, were calculated to further reveal the regional differences and sources of PM2.5 pollution in China (Table 2).
1. The overall difference and its evolution trend.
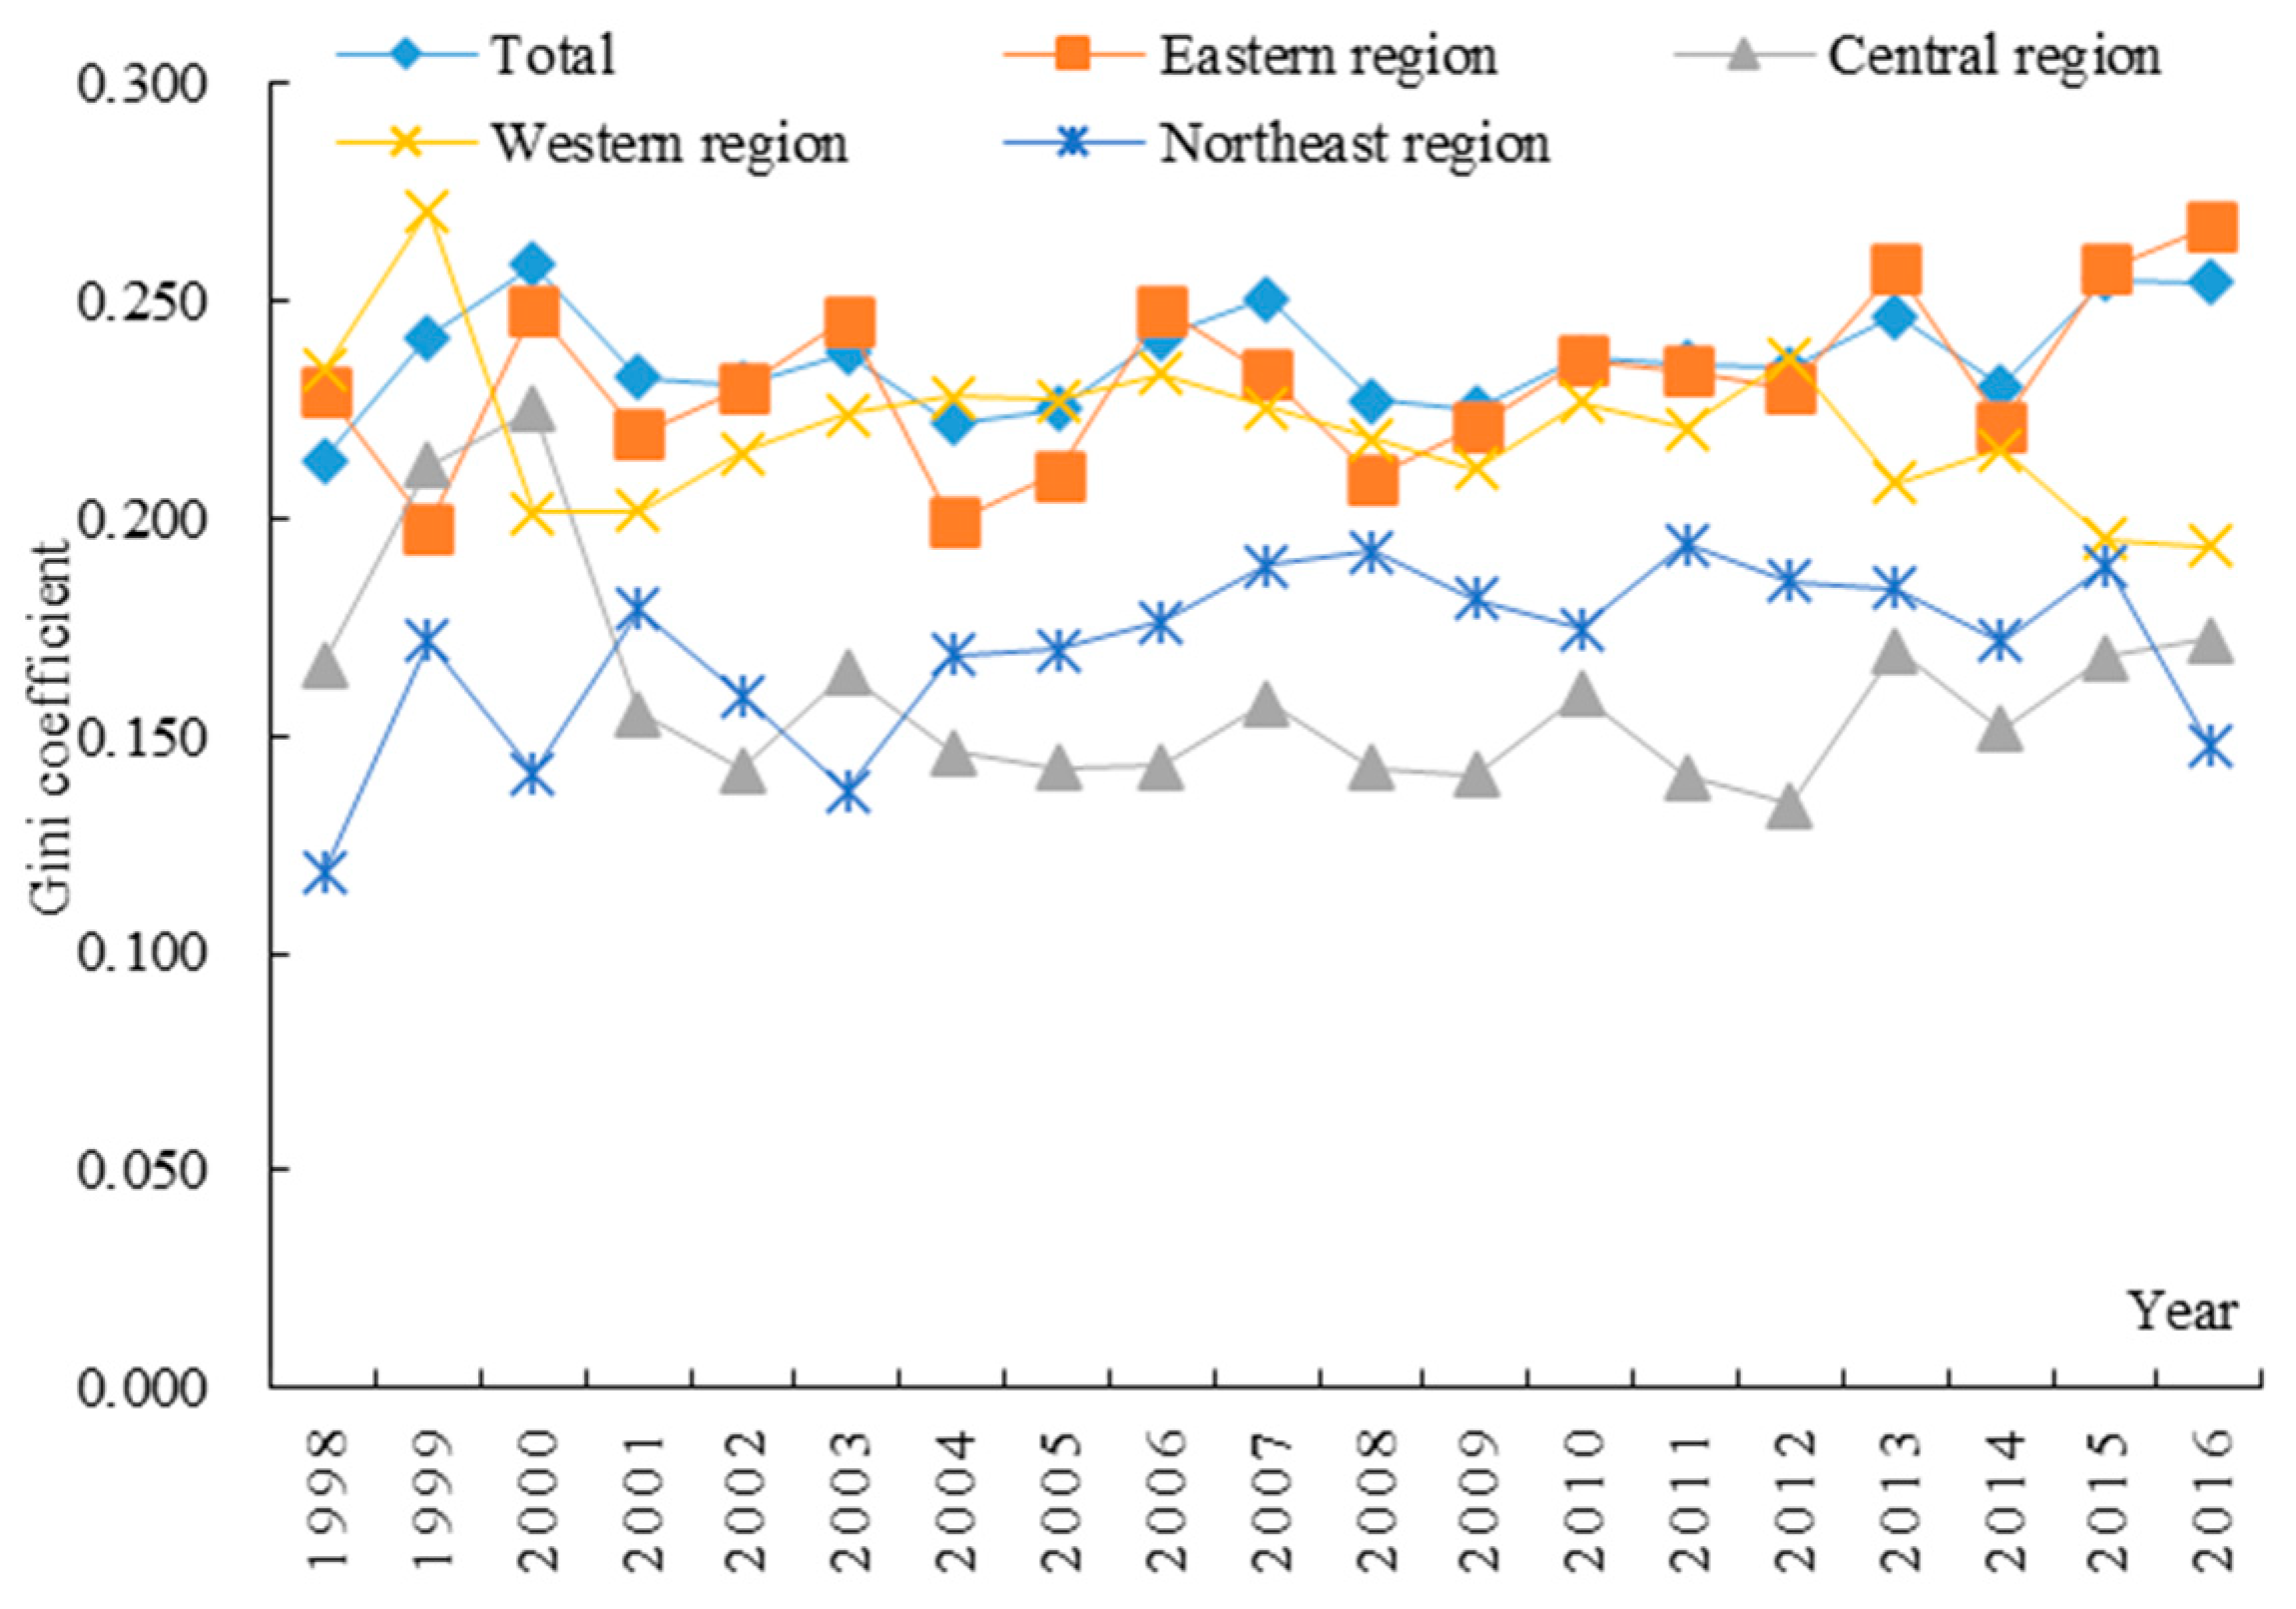
From 1998 to 2016, the PM2.5 concentration in Chinese cities varied greatly on the whole. The total Gini coefficient fluctuated between 0.214 and 0.259, with an average value of 0.237, showing the cyclical characteristics of “upward − downward” (Figure 4). According to the specific evolution process, the total Gini coefficient increased from 0.214 in 1998 to 0.259 in 2000, then decreased to 0.222 in 2004, then rose to 0.251 in 2007, and then fell to 0.225 in 2009. The overall difference in PM2.5 concentration showed a downward trend from 2007 to 2009 and decreased at an annual rate of 5.11%. It showed that China’s efforts made for intensified pollution control and the introduction of various environmentally friendly policies conducted during the Olympics period were effective for the governance of PM2.5 pollution, and the air quality in the PM2.5 polluted areas was indeed improved. Since then, except for the shortchange of inverted “V” in 2012–2014, the overall difference in other years had been expanding. Taking 1998 as the base period, the total Gini coefficient of PM2.5 concentration in Chinese cities rose at an average annual rate of 1.17%, which indicated that the overall difference of PM2.5 pollution in Chinese cities from 1998 to 2016 showed a trend of slow expansion. The obvious difference in PM2.5 concentration among the whole country might due to the fact that the pollution level in areas with high concentration of PM2.5 was further aggravated, and the pollution scope was constantly expanding during the study period. Therefore, it is necessary for the government to formulate policies to prevent the recurrence of haze pollution in areas with high concentration of PM2.5.
2. The trend of intra-regional differences.
Intra-regional differences of PM2.5 concentration in the four major regions had been fluctuating. Except for the regional difference in the western region, which showed a narrowing trend, the intra-regional differences in the other three regions had a slowly expanding trend (Figure 4). The average of the Gini coefficient within regions in eastern, central, western and northeast regions were 0.232, 0.160, 0.221 and 0.170 respectively, which showed a decreasing pattern of “east − west − northeast − central”. The obvious intra-regional difference in the eastern region might due to the fact that the eastern region includes more cities, and the PM2.5 concentration varies greatly from city to city, for example, the PM2.5 concentration of the Beijing-Tianjin-Hebei urban agglomeration, the Yangtze river delta urban agglomeration and the Shandong peninsula urban agglomeration in the eastern region were higher than those of the southeastern coastal areas and the Pearl River Delta urban agglomeration on the whole. Through the specific analysis of the dynamic evolution of intra-regional differences, it could be seen that the variation range of intra-regional differences in the eastern region was the most frequent and dramatic, showing the characteristic of “ascending and descending” with an average annual decline rate of 1.54%. The intra-regional difference in the central region increased from 0.167 in 1998 to 0.225 in 2000, reaching the first peak, and then decreased to 0.142 for the trough in 2002. From 2002 to 2016, it fluctuated around 0.14–0.17, with an average annual increase of 1.21% during the whole study period. On the whole, the intra-regional difference in the western region showed a declining trend, with an average annual decline rate of only 0.64%. It reached a peak value of 0.271 in 1999 and a minimum value of 0.194 in 2016. The evolution trend of intra-regional differences in northeast China can be divided into three stages: the first stage showed an “up−down−up−down” “M” type change trend from 1998 to 2003; in the second stage, the intra-regional difference basically increased slowly from 2003 to 2015, with an average annual increase rate of 2.42%; this might be due to the fact that the central-southern Liaoning urban agglomeration and Harbin-Changchun urban agglomeration in northeast China were important areas of heavy industry in China, and the concentration of heavy industry has led to a growing disparity in PM2.5 concentration from other cities; in the third stage, it dropped from 0.189 in 2015 to 0.148 in 2016.
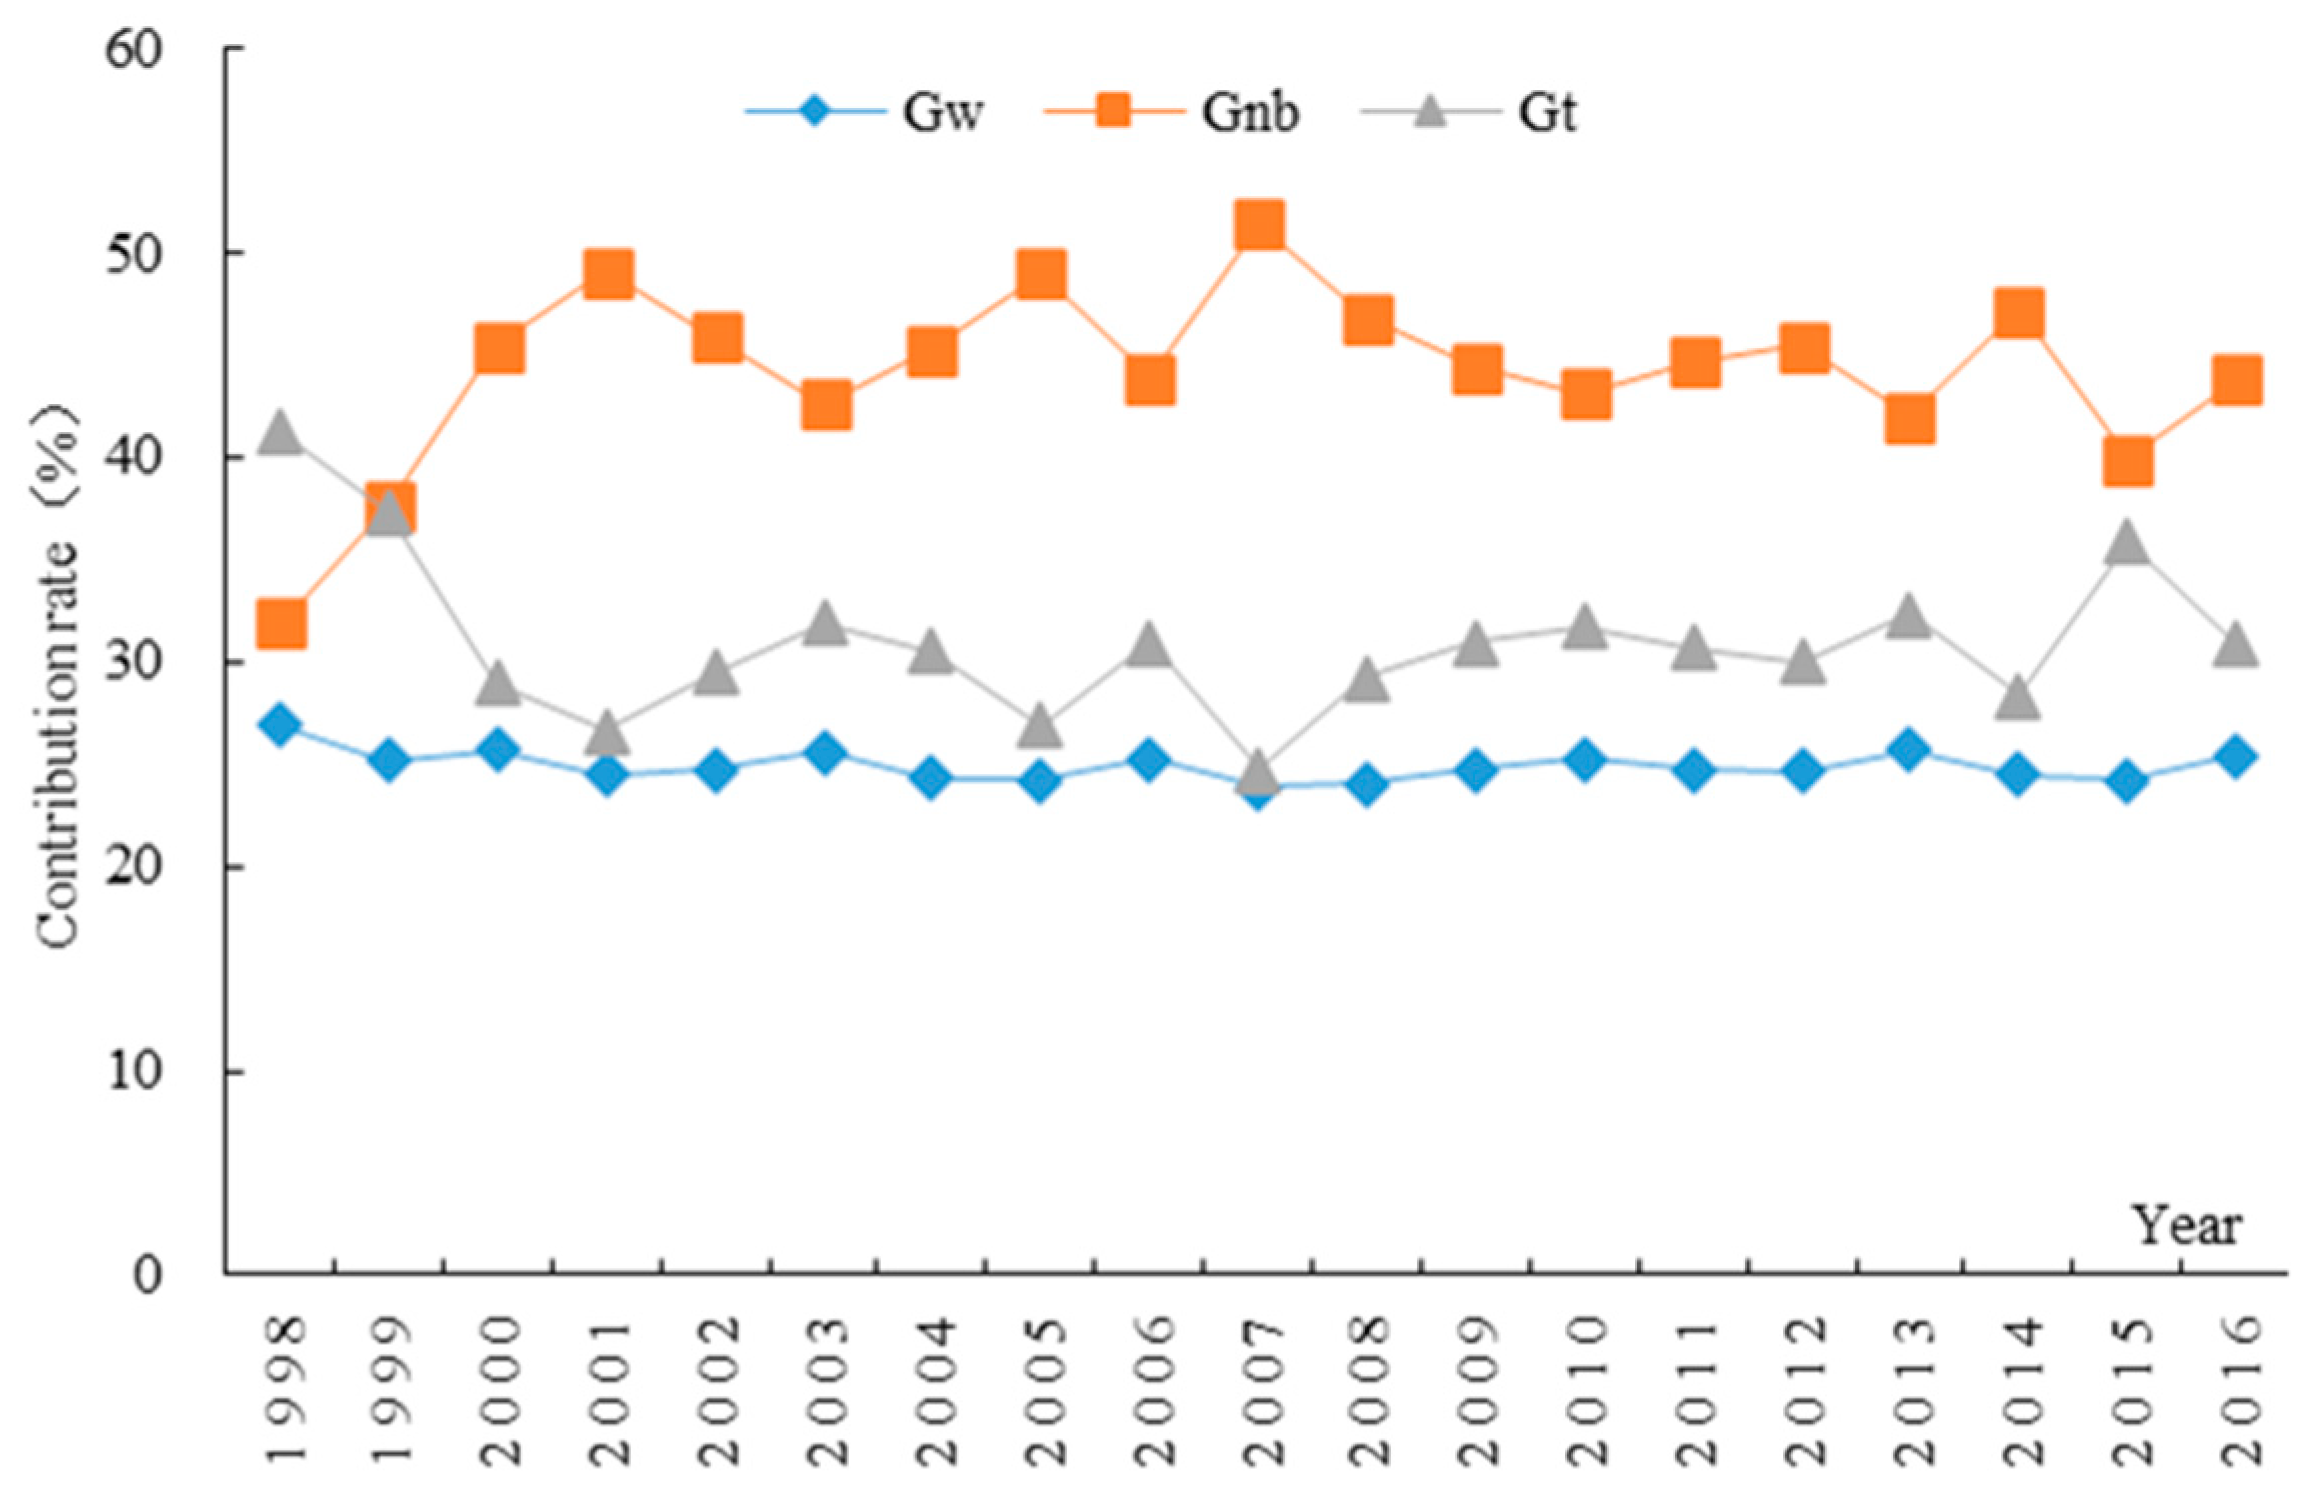
3. The sources and contributions of overall difference.
Figure 5 shows the overall difference sources and contribution rates of PM2.5 pollution in China. During the study period, the inter-regional difference was the most important source of the overall difference, with an average value of 0.105 and an average contribution rate of 44.15%, which was significantly higher than the average value of the intra-regional difference and super-variable density, indicating that the difference between different regions in China was the main reason for the difference in the distribution of PM2.5 pollution. The contribution rate of intra-regional differences generally presented a fluctuated trend of “up − down − up − down − up − down”, increasing at annual rate of 2.31%. The value of the super-variable density was between 0.061 and 0.091, and the average value was 30.96%. Its variation was just opposite to super-variable density, with the annual decline rate of 0.74%. The value of intra-regional difference was always lower than that of inter-regional difference and super-variable density, with the value of 0.06 around and the average rate of 24.89%, which was at a stable level. The annual decline rate of the contribution rate was 0.25%, showing that intra-regional differences were stable on the whole, and the key to solve spatial imbalance of PM2.5 pollution was to narrow the differences between regions, such as the differences between the western region and the eastern and central regions.
3.3. Dynamic Evolution of PM2.5 Pollution
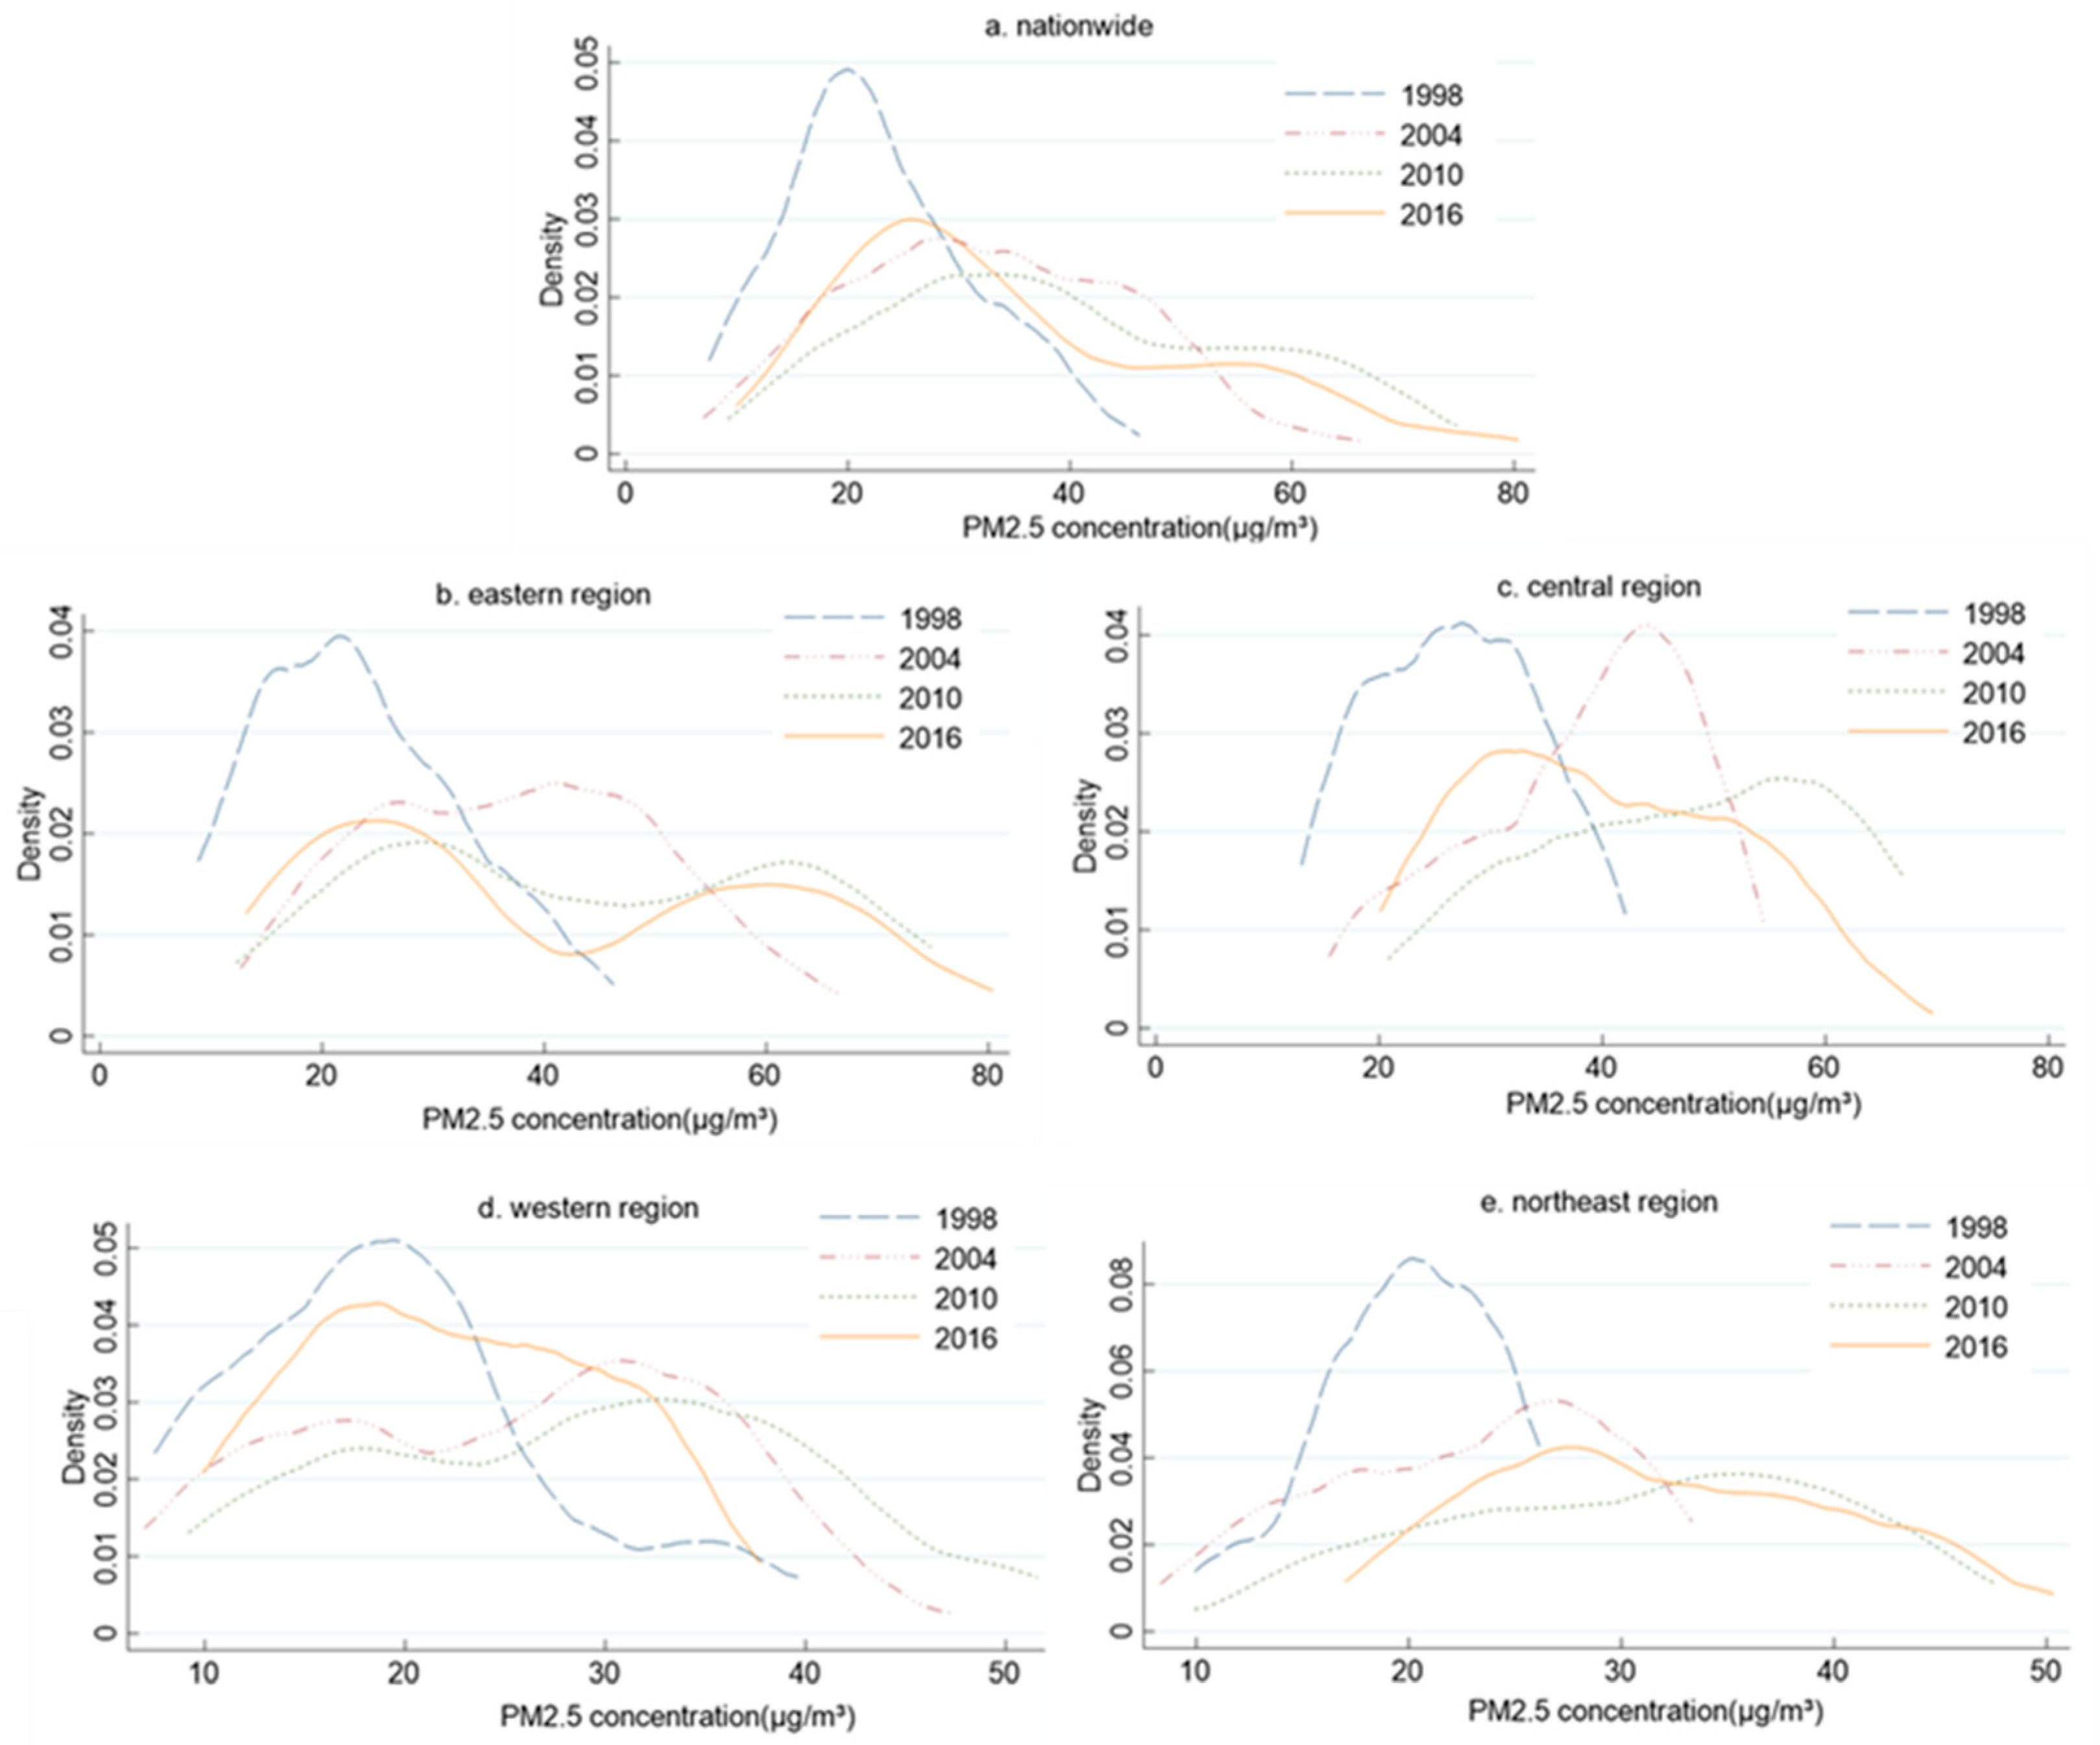
The above analysis of the Gini coefficient describes the spatial relative differences of PM2.5 concentration and its source in China and the four major regions but fails to reflect the dynamic evolution of absolute differences in PM2.5 concentration. Therefore, with the data in 1998, 2004, 2010 and 2016 selected, and with the help of Stata15.1 software, the dynamic evolution and regional differences of PM2.5 concentration in China and the four major regions is described by kernel density estimation (Figure 6).
3.3.1. Dynamic Evolution of PM2.5 Pollution in China
From 1998 to 2010, the curve center of PM2.5 concentration distribution in China had been moving towards the right, and from 2010 to 2016, it began to move towards the left. This illustrates that the overall level of PM2.5 concentration in China had experienced a continuous increased and then gradually decreased change (Figure 6a). There was a larger shift to the right in 1998 and 2004, which may be due to the rapid economic growth after China’s accession to the World Trade Organization in 2001. In addition, since 2003, China’s industry entered the stage of heavy industry, with continually growing coal consumption [39]. It is worth noting that there was a significant right-tail phenomenon of in 2016, indicating that PM2.5 concentration in the high pollution areas, such as the perimeter of Bohai Bay on North China Plain and the Yantze River Delta urban agglomeration, was considerably higher than that of the Western Region, including the Qinghai-Tibet Plateau and some southeast coastal cities. During the study period, the PM2.5 concentration distribution appeared to have a positive skewness on the whole. In 1998, it had a non-strict single peak, while the double peak was not obvious. In 2004, the curve showed many small peaks, while in 2010 and 2016, the curves showed obvious double peaks, indicating that there was an obvious polarization within the regions. In addition, from 1998 to 2016, the curve peak of PM2.5 concentration distribution in China developed from narrow to wide, with the decreasing peak value and extending change interval, the regional differences showed an expanding trend.
3.3.2. Dynamic Evolution of PM2.5 Pollution in the Four Major Regions
The movement of the curve center of PM2.5 concentration distribution in the four major regions was basically synchronized with that in the whole country, all of which moved toward the right from 1998 to 2010, and toward the left from 2010 to 2016 (Figure 6b–e).
The leftward shift in the eastern region was the smallest, indicating that the degree of mitigation of PM2.5 pollution in the eastern region was weak. Compared with 1998, the main peak of the PM2.5 concentration distribution in the eastern region in 2010 tended to be flat, and the change interval was expanded, with a more significant characteristic of “double peak”, indicating that the regional differences of PM2.5 concentration distribution in the eastern region have been expanding from 1998 to 2010, and the polarization gradually deepened. In 2016, compared with 2010, the main peak value of PM2.5 concentration distribution slightly increased, while the side peak value slightly decreased, indicating that the regional difference of PM2.5 concentration distribution in the eastern region in 2010-2016 had a weak narrowing trend, and the polarization phenomenon was still serious.
In the central region, the curve of PM2.5 concentration distribution presented an irregular single peak shape, with certain spatial polarization characteristics. Compared with 1998, in 2010, the main peak tended to be flat and the change interval increased, and the regional differences of PM2.5 concentration distribution showed an expanding trend. Compared with 2010, the shapes of the two kernel density curves were approximately symmetrical in 2016 and 2010. The peak value slightly increased, with the change from negative skewness to positive skewness. This indicated that the number of cities with high concentration decreased significantly from 2010 to 2016, while the number of cities with low concentration increased continuously, but the regional differences narrowed to a small extent.
Compared with 1998, the main peak of PM2.5 concentration distribution in the western region in 2010 gradually flattened, with an increasing change interval and a deepening double peak characteristic, indicating that the regional differences in PM2.5 concentration distribution from 1998 to 2010 were gradually expanded, and the polarization was further intensified. Compared with 2010, the main peak in 2016 was steeper, the change interval was reduced, and the double peaks became less obvious, indicating that the regional differences of PM2.5 concentration distribution gradually narrowed from 2010 to 2016, and the polarization turned from strong to weak.
From 1998 to 2010, the northeast region presented an overall negative skewness, with many small wave peaks and weak multi-polarization. The value of main peak kept decreasing, and the change interval kept expanding, indicating that the regional differences in PM2.5 concentration distribution showed an expanding trend during this period. By 2016, the distribution curve of PM2.5 concentration changed from a negative skewness to a positive skewness, with the main peak value slightly increasing and the change interval narrowing, indicating that the regional differences in PM2.5 concentration distribution in northeast China showed a trend of narrowing from 2010 to 2016.
4. Conclusions and Recommendations
Based on the data of PM2.5 concentration monitored by satellite in 225 Chinese cities from 1998 to 2016, this paper analyzed the spatial and temporal pattern, regional differences and dynamic evolution of PM2.5 pollution in Chinese cities, by using classification statistics, GIS visualization, the Dagum Gini coefficient and the Kernel density estimation method. The research conclusions are as follows.
- During the study period, PM2.5 pollution in China showed an overall trend of fluctuation, which was first rising and then falling. Although PM2.5 pollution had been reduced in recent years, it still exceeded the standard level. The prevention and control of haze pollution was not enough, which still lagged behind the expected effect of the public. The central region had the highest annual PM2.5 concentration and the most severe PM2.5 pollution, followed by the eastern region, while the PM2.5 pollution in the western region was lightest. The year 2007 was an important turning point of PM2.5 pollution in the entire country, eastern and central region.
- The distribution of PM2.5 pollution was unbalanced, with significant spatial agglomeration characteristics. The cities with moderate and high PM2.5 pollution were mainly distributed in the Beijing-Tianjin-Hebei urban agglomeration, Shandong Peninsula urban agglomeration, Yangtze River Delta Urban Agglomerations, Chengdu-Chongqing urban agglomeration, central-southern Liaoning urban agglomeration, the central of the middle reaches of the Yangtze River and the Zhongyuan urban agglomeration in the north of the Yangtze river. The cities with low PM2.5 pollution were mainly distributed in the Pearl River Delta urban agglomeration, Western Taiwan Strait urban agglomeration, Guangxi Gulf of Tonkin urban agglomeration, Tianshan Mountains northern slopes urban agglomeration, the urban agglomeration centered around the Ningxia section of the Yellow River and Hohhot-Baotou-Ordos-Yulin urban agglomeration.
- The results of the relative differences from the analysis of the Gini coefficient showed that the overall number of differences of PM2.5 pollution in China was high, with significant spatial differences, and the Gini coefficient showed a trend of slow expansion. The regional differences in the four major regions appeared as a decreasing pattern of “east−west−northeast−central”. Inter-regional difference was the major source of the overall difference, and the contribution rate of intra-regional difference was relatively stable.
- The results of the absolute differences from the analysis of kernel density estimation showed that the curve center of PM2.5 concentration distribution in China and the four major regions shifted toward the right from 1998 to 2010, and began to turn left from 2010 to 2016. This indicated that PM2.5 pollution had eased in the later study period. The regional differences in the four major regions showed a trend of “expanding-narrowing”, but the amplitude of narrow was relatively small.
It should be noted that, based on the availability of data, the research period in this paper is from 1998 to 2016, which is a period of serious haze pollution in China. Since the Tenth Five-Year Plan, China has continued to increase its efforts to protect the ecological environment, and successively issued a series of laws, regulations and long-term measures for the prevention and control of air pollution; from the Twelfth Five-Year Plan for the Prevention and Control of Atmospheric Pollution in Key Regions in 2012, to the Action Plan for the Prevention and Control of Atmospheric Pollution in 2013, and the Law of the People’s Republic of China on the Prevention and Control of Atmospheric Pollution newly implemented in 2016, all of which have revealed the high recognition and determination of the Chinese government on haze prevention and control. However, due to the short time and great differences of haze pollution and economic development among regions, China is still facing the problems of inadequate governance and regional imbalance in haze pollution.
It is worth mentioning that, since 2016, China has embarked on its strictest environmental protection campaign in history. The central supervision on environmental protection has broad coverage, strong efforts, and is implemented in a strict and speedy manner. In only two years, it had achieved full coverage in 31 provinces. In the last three years, China’s air quality has improved significantly. In 2018, PM2.5 concentration in 338 cities at and above prefecture-level in China was 39 μg/m3, dropped down by 30.36% compared with that in 2013 [40]. It can be seen that China’s haze control has achieved initial results, and the overall situation has improved, but it is still far from the requirements on air quality of the sustainable development goals. Based on the above, this paper puts forward the following suggestions:
First, formulate differentiated regional environmental regulations according to the actual situation of regions in China [41,42]. For example, the environmental regulations of the eastern, central, western regions and northeastern provinces should be revised to form a governance framework with regional characteristics. The local governments of central provinces should strictly control the expansion and repetitive construction of high-polluting and energy-consuming enterprises, speed up the elimination of backward production facilities, then actively promote the construction and maturity of green industrial system, strengthen preferential tax policies and the support for technological research and development for enterprises engaged in new energy, environmental governance and green and recycling production [43]. Meanwhile, local governments ought to make full use of administrative means to improve pollutant discharge and emission permit trading systems, strengthen the collection of pollutant discharge fees, and impose restrictions on loans and financing for enterprises that violate regulations, so as to promote the transfer of high-tech environmental technologies from eastern provinces to central provinces.
Second, implement differentiated regional governance policies accordingly. The eastern region should strengthen technological innovation, accelerate the green transformation of industry, encourage and advocate local governments to develop energy-saving and environmental-protecting industries. At the same time, it ought to raise the threshold of entry permission, strengthen the screening and identifying of foreign direct investment and improve the clean production technology. And then gradually build a long-term incentive mechanism and actively use technology spillover effects of foreign direct investment. Furthermore, make full use of industrial function of eastern China in positive transmission and incentives among provinces. For central and northeastern China, the governments are encouraged to focus on optimizing the industrial structure, upgrading traditional industries with new and high technologies, accelerating the construction of a new type of urbanization, and optimizing the ecological environment. For western China, the local governments should focus on encouraging the development of develop new energy sources.
Third, establish a governance mechanism for regional joint defense and joint control. To narrow the regional differences and tackle the haze problem in the core high-polluted city clusters, local governments need to attach importance to regionally joint prevention and control and work together, to fight the battle against haze pollution. Despite China’s current efforts to tackle environmental pollution, the long-rooted assessment system of official performance, which is mainly based on local economic development, has not been changed. Moreover, due to the regional differences in the level of haze pollution, economic foundation and resource endowment, there are inevitably unbalanced interests occurring in the collaborative haze control. As a result, some local governments with weak economic foundation are not endogenously motivated enough to make environmental protection policies and attach little importance to environmental governance. Hence, it is urgent to strengthen the scientific top-level design from the national level, improve regional cooperation, establish regional compensation mechanism for haze control and form coordinated efforts to solve haze pollution. On the one hand, it is necessary to reasonably coordinate and distribute the haze control tasks according to the economic foundation, resource endowment, industrial structure, and other conditions of different cities, so as to balance the interests of all parties. On the other hand, the construction of ecological civilization is a good welfare implementation that will benefit mankind for generations; therefore, attention should be paid to the long-term effectiveness of haze pollution control on the sustainable development of cities.
Author Contributions
Conceptualization, Y.L. and H.X.; methodology, H.X. and L.L. (Lingyu Lan); data curation, H.X. and L.L. (Longwu Liang); writing, H.X., L.L. (Lingyu Lan) and X.X.; supervision, L.L. (Longwu Liang). All authors have read and agreed to the published version of the manuscript.
Funding
This research was funded by Major Program of National Social Science Foundation (18ZDA047), National Natural Science Foundation (41661116) and the Youth Program of the National Social Science Foundation (15CJL029) of China.
Conflicts of Interest
The authors declare no conflict of interest.
References
- Wang, Z.B.; Liang, L.W.; Sun, Z.; Wang, X.M. Spatiotemporal differentiation and the factors influencing urbanization and ecological environment synergistic effects within the Beijing-Tianjin-Hebei urban agglomeration. J. Environ. Manag. 2019, 243, 227–239. [Google Scholar] [CrossRef]
- Chen, S.Y.; Chen, S.X. Haze pollution and economic green transformation assessment of Chinese cities: 2004–2016. Fudan J. (Soc. Sci. Ed.) 2018, 60, 122–134. [Google Scholar]
- Santibañez, D.A.; Ibarra, S.; Matus, P. A five-year study of particulate matter (PM2.5) and cerebrovascular diseases. Environ. Pollut. 2013, 181, 1–6. [Google Scholar]
- Dockery, D.W.; Pope, C.A.; Xu, X.; Spengler, J.D. An association between air pollution and mortality in six U.S. cities. N. Engl. J. Med. 1994, 329, 1753–1759. [Google Scholar] [CrossRef] [Green Version]
- Han, X.; Liu, Y.Q.; Gao, H.; Ma, J.M.; Mao, X.X.; Wang, Y.T.; Ma, X.D. Forecasting PM2.5 induced male lung cancer morbidity in China using satellite retrieved PM2.5 and spatial analysis. Sci. Total Environ. 2017, 607–608, 1009–1017. [Google Scholar] [CrossRef]
- Han, S.Q.; Hao, T.Y.; Zhang, Y.F.; Liu, J.L.; Li, P.Y.; Cai, Z.Y.; Zhang, M.; Wang, Q.L.; Zhang, H. Vertical observation and analysis on rapid formation and evolutionary mechanisms of a prolonged haze episode over central-eastern China. Sci. Total Environ. 2017, 616, 135–146. [Google Scholar] [CrossRef]
- Jia, M.W.; Zhao, T.L.; Zhang, X.Z.; Wu, X.H.; Tang, L.L.; Wang, L.M.; Chen, Y.S. Seasonal variations in major air pollutants in Nanjing and their meteorological correlation analyses. China Environ. Sci. 2016, 36, 2567–2577. [Google Scholar]
- Sabetghadam, S.; Ahmadi-Givi, F. Relationship of extinction coefficient, air pollution, and meteorological parameters in an urban area during 2007 to 2009. Environ. Sci. Pollut. Res. 2014, 21, 538–547. [Google Scholar] [CrossRef] [PubMed]
- Fang, C.; Liu, H.; Li, G.D.; Sun, D.Q.; Miao, Z. Estimating the impact of urbanization on air quality in China using spatial regression models. Sustainability 2015, 7, 15570–15592. [Google Scholar] [CrossRef] [Green Version]
- Guo, S.; Hu, M.; Zamora, M.L.; Peng, J.; Shang, D.; Zheng, J.; Du, Z.; Wu, Z.; Shao, M.; Zeng, L. Elucidating Severe Urban Haze Formation in China. Proc. Natl. Acad. Sci. USA 2014, 111, 17373–17378. [Google Scholar] [CrossRef] [Green Version]
- Wang, H.; Ji, G.X.; Xia, J.X. Analysis of Regional Differences in Energy-Related PM2.5 Emissions in China: Influencing Factors and Mitigation Countermeasures. Sustainability 2019, 11, 1409. [Google Scholar] [CrossRef] [Green Version]
- Shao, S.; Li, X.; Cao, J.H.; Yang, L.L. China’s economic policy choices for governing smog pollution based on spatial spillover effects. Econ. Res. J. 2016, 51, 73–88. [Google Scholar]
- Leng, Y.L.; Xian, G.M.; Du, S.Z. Foreign direct investment and haze pollution: An empirical analysis based on provincial panel data. J. Int. Trade 2015, 12, 74–84. [Google Scholar]
- Zhao, S.; Xu, Y. Exploring the Spatial Variation Characteristics and Influencing Factors of PM2.5 Pollution in China: Evidence from 289 Chinese Cities. Sustainability 2019, 11, 4751. [Google Scholar] [CrossRef] [Green Version]
- Wang, Z.B.; Liang, L.W.; Wang, X.J. Spatio-temporal evolution patterns and influencing factors of PM2.5 in Chinese urban agglomerations. Acta Geogr. Sin. 2019, 74, 2614–2630. [Google Scholar]
- Ma, L.M.; Zhang, X. The spatial effect of China’s haze pollution and the impact from economic change and energy structure. China Ind. Econ. 2014, 4, 19–31. [Google Scholar]
- Nesadurai, H. ASEAN environmental cooperation, transnational private governance, and the haze: Overcoming the ‘Territorial Trap’ of State-Based Governance? Transreg. Natl. Stud. Southeast Asia 2017, 5, 121–145. [Google Scholar] [CrossRef]
- Zhou, Z.; Xing, Y.Y.; Sun, H.X. Interval game analysis of government subsidy to the control strategy of Beijing-Tianjin-Hebei smog. Syst. Eng. Theory Pract. 2017, 37, 2640–2648. [Google Scholar]
- Wei, W.X.; Ma, X.L.; Li, P.; Chen, Y. Roles of Technological Progress and Tax in Regional Air Pollution Control in China. China’s Popul. Resour. Environ. 2016, 26, 1–11. [Google Scholar]
- Zhai, B.X.; Chen, J.X.; Yin, W.W.; Huang, Z.L. Relevance Analysis on the Variety Characteristics of PM2.5 Concentrations in Beijing, China. Sustainability 2018, 10, 3228. [Google Scholar] [CrossRef] [Green Version]
- Liu, H.M.; Fang, C.L.; Huang, J.J.; Zhu, X.D.; Wang, Z.B.; Zhang, Q. The spatial-temporal characteristics and influencing factors of air pollution in Beijing-Tianjin-Hebei urban agglomeration. Acta Geogr. Sin. 2018, 73, 177–191. [Google Scholar]
- Wang, S.F.; Xu, L.; Ge, S.J.; Jiao, J.L.; Pan, B.L.; Shu, Y. Driving force heterogeneity of urban PM2.5 pollution: Evidence from the Yangtze River Delta, China. Ecol. Indic. 2020, 113, 106210. [Google Scholar] [CrossRef]
- Gao, J.J.; Wang, K.; Wang, Y.; Liu, S.H.; Zhu, C.Y.; Hao, J.M.; Liu, H.J.; Hua, S.B.; Tian, H.Z. Temporal-spatial characteristics and source apportionment of PM2.5 as well as its associated chemical species in the Beijing-Tianjin-Hebei region of China. Environ. Pollut. 2018, 233, 714–724. [Google Scholar] [CrossRef] [PubMed]
- Pakbin, P.; Hudda, N.; Cheung, K.L.; Moore, K.F.; Sioutas, C. Spatial and temporal variability of coarse (PM10, PM2.5) particulate matter concentrations in the Los Angeles Area. Aerosol. Sci. Technol. 2010, 44, 514–525. [Google Scholar] [CrossRef] [Green Version]
- Smith, J.D.; Barratt, B.M.; Fuller, G.W.; Kelly, F.J.; Loxham, M.; Nicolosi, E.; Priestman, M.; Tremper, A.H.; Green, D.C. PM2.5 on the London underground. Environ. Int. 2020, 134, 105188. [Google Scholar] [CrossRef] [PubMed]
- Li, Y.X.; Dai, Z.X.; Liu, X.L. Analysis of Spatial-Temporal Characteristics of the PM2.5 Concentrations in Weifang City, China. Sustainability 2018, 10, 2960. [Google Scholar] [CrossRef] [Green Version]
- Xiong, H.H.; Liang, L.W.; Zeng, Z.; Wang, Z.B. Dynamic analysis of PM2.5 spatial-temporal characteristics in China. Resour. Sci. 2017, 39, 136–146. [Google Scholar]
- Xu, W.J.; He, F.F.; Li, H.X.; Zhong, L.J. Spatial and temporal variations of PM2.5 in the Pearl River Delta. Res. Environ. Sci. 2014, 27, 951–957. [Google Scholar]
- Zhou, L.; Zhou, C.H.; Yang, F.; Che, L.; Wang, B.; Sun, D.Q. Spatio-temporal evolution and the influencing factors of PM2.5 in China between 2000 and 2015. J. Geogr. Sci. 2019, 29, 253–270. [Google Scholar] [CrossRef] [Green Version]
- Zhou, M.D.; Kuang, Y.Q.; Yun, G.L. Analysis of Driving Factors of Atmospheric PM2.5 Concentration in Guangzhou City Based on Geo-Detector. Res. Environ. Sci. 2020, 33, 271–279. [Google Scholar]
- Dong, T.T.; Li, X.; Liu, N.Q. The effect of industrial agglomeration to haze pollution (PM2.5) based on spatial perspective: Theoretical and empirical research. Econ. Res. J. 2015, 37, 29–41. [Google Scholar]
- Fang, C.L.; Wang, Z.B.; Xu, G. Spatial-temporal characteristics of PM2.5 in China: A city-level perspective analysis. J. Geogr. Sci. 2016, 26, 1519–1532. [Google Scholar] [CrossRef]
- Han, J.; Li, Y.Z.; Li, F. Spatiotemporal distribution characteristic of PM2.5 concentration and the difference of PM2.5 concentration between urban areas and rural areas in China from 2000 to 2015. Acta Ecol. Sin. 2019, 39, 2954–2962. [Google Scholar]
- Dagum, C. A New Approach to the Decomposition of the Gini Income Inequality coefficient. Empir. Econ. 1997, 22, 515–531. [Google Scholar] [CrossRef]
- Li, Z.W.; He, P. Data-Based Optimal Bandwidth for Kernel Density Estimation of Statistical Sample. Commun. Theor. Phys. 2018, 70, 728–734. [Google Scholar] [CrossRef]
- Spencer, C.J.; Yakymchuk, C.; Ghaznavi, M. Visualisling data distributions with kernel density estimation and reduced chi-squared statistic. Geosci. Front. 2017, 8, 1247–1252. [Google Scholar] [CrossRef]
- Xu, X.X.; Wang, H.G. Dynamics of Factor Payment: Evidence from China. Econ. Res. J. 2008, 2, 106–118. [Google Scholar]
- Zheng, B.L.; Liang, L.T.; Li, M.M. Analysis of temporal and spatial patterns of PM2.5 in Prefecture-Level Cities of China from 1998 to 2016. China Environ. Sci. 2019, 39, 1909–1919. [Google Scholar]
- Wu, Z.J.; Ye, H.F.; Shan, Y.L.; Chen, B.; Li, J.S. A city-level inventory for atmospheric mercury emissions from coal combustion in China. Atmos. Environ. 2020, 223, 117245. [Google Scholar] [CrossRef]
- Ministry of Ecology and Environment of the People’s Republic of China. China’s Eco-Environment Status Bulletin in 2018; Ministry of Ecology and Environment of the People’s Republic of China: Beijing, China, 2018.
- Zhang, M.; Li, M. Study on the regional difference in the relationship among haze pollution, economic growth and environmental regulation from the perspective of spatial gravitational effect. China Popul. Resour. Environ. 2017, 27, 23–34. [Google Scholar]
- Liang, L.W.; Wang, Z.B.; Li, J.X. The effect of urbanization on environmental pollution in rapidly developing urban agglomeration. J. Clean. Prod. 2019, 237, 117649. [Google Scholar] [CrossRef]
- Li, J.S.; Song, X.H.; Guo, Y.Q.; Feng, K.H. The determinants of China’s national and regional energy-related mercury emission changes. J. Environ. Manag. 2019, 246, 503–513. [Google Scholar] [CrossRef] [PubMed]
Figure 1.
Trends of PM2.5 concentration of China and the four major regions from 1998 to 2016.

Figure 2.
Percentage of each class of PM2.5 concentration in the four major regions from 1998 to 2016.
Figure 2.
Percentage of each class of PM2.5 concentration in the four major regions from 1998 to 2016.

Figure 3.
Spatial variation of PM2.5 concentration in China in 1998, 2004, 2010 and 2016.

Figure 4.
Gini Coefficient evolution of PM2.5 concentration in China and its four major regions.

Figure 5.
The evolution of the contribution rates of regional difference of PM2.5 concentration in China.
Figure 5.
The evolution of the contribution rates of regional difference of PM2.5 concentration in China.

Figure 6.
Dynamic evolution of PM2.5 concentration in China and the four major regions.


Table 1.
Standard values of PM2.5 concentration formulated by WHO and China.
| Air Quality Guidelines Issued by WHO | China’s Ambient Air Quality Standard (GB3095-2012) | ||||
|---|---|---|---|---|---|
| Category | Average Annual Limit | Daily Average Limit | Category | Average Annual Limit | Daily Average Limit |
| Safety threshold | 10 μg/m3 | 25 μg/m3 | Safety threshold | 35 μg/m3 | 75 μg/m3 |
| Transitional target I | 35 μg/m3 | 75 μg/m3 | —— | —— | —— |
| Transitional target Ⅱ | 25 μg/m3 | 50 μg/m3 | —— | —— | —— |
| Transitional target Ⅲ | 15 μg/m3 | 37.5 μg/m3 | —— | —— | —— |
Table 2.
The Dagum Gini coefficient and its decomposition results of PM2.5 concentration in China.
| Year | Total Gini Coefficient g | GJJ | GW | GNB | GT | ||||||
|---|---|---|---|---|---|---|---|---|---|---|---|
| Eastern Region | Central Region | Western Region | Northeast Region | Source | Contribution Rate | Source | Contribution Rate | Source | Contribution Rate | ||
| 1998 | 0.214 | 0.230 | 0.167 | 0.234 | 0.119 | 0.057 | 26.86% | 0.068 | 31.91% | 0.088 | 41.22% |
| 1999 | 0.242 | 0.198 | 0.212 | 0.271 | 0.172 | 0.061 | 25.15% | 0.091 | 37.55% | 0.090 | 37.30% |
| 2000 | 0.259 | 0.248 | 0.225 | 0.201 | 0.141 | 0.066 | 25.63% | 0.118 | 45.46% | 0.075 | 28.91% |
| 2001 | 0.233 | 0.220 | 0.155 | 0.202 | 0.179 | 0.057 | 24.43% | 0.114 | 49.01% | 0.062 | 26.57% |
| 2002 | 0.231 | 0.230 | 0.142 | 0.215 | 0.159 | 0.057 | 24.69% | 0.106 | 45.83% | 0.068 | 29.48% |
| 2003 | 0.238 | 0.246 | 0.165 | 0.224 | 0.138 | 0.061 | 25.60% | 0.101 | 42.55% | 0.076 | 31.85% |
| 2004 | 0.222 | 0.200 | 0.146 | 0.228 | 0.169 | 0.054 | 24.26% | 0.100 | 45.24% | 0.068 | 30.50% |
| 2005 | 0.225 | 0.210 | 0.143 | 0.227 | 0.170 | 0.054 | 24.16% | 0.110 | 48.94% | 0.061 | 26.90% |
| 2006 | 0.242 | 0.248 | 0.143 | 0.233 | 0.176 | 0.061 | 25.24% | 0.106 | 43.83% | 0.075 | 30.93% |
| 2007 | 0.251 | 0.233 | 0.158 | 0.226 | 0.189 | 0.060 | 23.87% | 0.129 | 51.39% | 0.062 | 24.74% |
| 2008 | 0.227 | 0.210 | 0.143 | 0.218 | 0.193 | 0.055 | 24.05% | 0.106 | 46.79% | 0.066 | 29.16% |
| 2009 | 0.225 | 0.221 | 0.141 | 0.212 | 0.182 | 0.056 | 24.71% | 0.100 | 44.35% | 0.070 | 30.94% |
| 2010 | 0.237 | 0.237 | 0.160 | 0.227 | 0.175 | 0.060 | 25.24% | 0.102 | 43.08% | 0.075 | 31.68% |
| 2011 | 0.236 | 0.234 | 0.141 | 0.221 | 0.194 | 0.058 | 24.69% | 0.105 | 44.61% | 0.072 | 30.70% |
| 2012 | 0.235 | 0.230 | 0.134 | 0.237 | 0.186 | 0.058 | 24.59% | 0.106 | 45.40% | 0.070 | 30.01% |
| 2013 | 0.247 | 0.257 | 0.170 | 0.208 | 0.184 | 0.063 | 25.68% | 0.104 | 42.00% | 0.080 | 32.32% |
| 2014 | 0.231 | 0.222 | 0.152 | 0.216 | 0.172 | 0.056 | 24.49% | 0.109 | 47.18% | 0.065 | 28.34% |
| 2015 | 0.255 | 0.258 | 0.168 | 0.195 | 0.189 | 0.062 | 24.21% | 0.102 | 39.93% | 0.091 | 35.86% |
| 2016 | 0.254 | 0.267 | 0.172 | 0.194 | 0.148 | 0.064 | 25.36% | 0.111 | 43.80% | 0.078 | 30.84% |
© 2020 by the authors. Licensee MDPI, Basel, Switzerland. This article is an open access article distributed under the terms and conditions of the Creative Commons Attribution (CC BY) license (http://creativecommons.org/licenses/by/4.0/).
Share and Cite
MDPI and ACS Style
Xiong, H.; Lan, L.; Liang, L.; Liu, Y.; Xu, X. Spatiotemporal Differences and Dynamic Evolution of PM2.5 Pollution in China. Sustainability 2020, 12, 5349. https://doi.org/10.3390/su12135349
AMA Style
Xiong H, Lan L, Liang L, Liu Y, Xu X. Spatiotemporal Differences and Dynamic Evolution of PM2.5 Pollution in China. Sustainability. 2020; 12(13):5349. https://doi.org/10.3390/su12135349
Chicago/Turabian StyleXiong, Huanhuan, Lingyu Lan, Longwu Liang, Yaobin Liu, and Xiaoyu Xu. 2020. "Spatiotemporal Differences and Dynamic Evolution of PM2.5 Pollution in China" Sustainability 12, no. 13: 5349. https://doi.org/10.3390/su12135349
Note that from the first issue of 2016, this journal uses article numbers instead of page numbers. See further details here.