Evaluation of Flood Risk Management in Japan through a Recent Case

School of Global Environmental Studies, Sophia University, Tokyo 102-8554, Japan
*
Author to whom correspondence should be addressed.
Sustainability 2020, 12(13), 5357; https://doi.org/10.3390/su12135357
Submission received: 10 June 2020
/
Revised: 24 June 2020
/
Accepted: 29 June 2020
/
Published: 2 July 2020
(This article belongs to the Section Hazards and Sustainability)
Abstract
:Major disasters cause loss of life and serious disturbance to livelihoods. Integrative and innovative risk management is needed to reduce the impacts of such a disturbance. To pursue this, a better understanding of the current level of disaster risk management is indispensible. Following this line of thinking, the present work was intended to evaluate the various aspects of flood risk management in Japan using a recent case of major flooding that occurred last autumn as a result of a major storm. The focus was on the vulnerability assessment for the disaster-stricken area using various kinds of information including topographic features, land use, flood warning system, evacuation behavior, levee structure, insurance system and government support for recovery. Such an integrative assessment shed new light on vulnerability-generating mechanisms. In particular, it found that the disaster-stricken area has a high level of coping capacity related to flood disasters. However, the high level of coping capacity hinders the reduction of susceptibility to the impacts of flooding. Based on this finding, a new, simple but operational vulnerability management framework was proposed, which may help decision-makers prioritize actions for vulnerability reduction.
1. Introduction
Flood disasters have been present throughout human history, challenging our societies to respond to unexpected disruptions. In recent decades, flood risk has been increasing worldwide due to various reasons—from urbanization, population growth and concentration in big cities to climate change [1,2,3,4,5]. The combined impact of urbanization and climate change has also been assessed, although the understanding of this impact is still limited [6]. Under a changing environment, effective flood risk management is extremely important to minimize the number of deaths and injuries caused by a disaster, as well as the financial cost associated with disaster-induced property damage and losses. To enable better flood risk management in the future, post-event auditing of how recent flood disasters have been managed is indispensible for improving the effectiveness of flood management practices, and this requires analyses from different perspectives and at different levels.
Japan is a country with a long history of flood disasters. The first recorded flood disaster in Japan was in the mid 6th century, while the Isewan Typhoon in 1959 was responsible for the greatest flood damage in modern Japanese history [7]. In 1896, the Japan River Law was established with the aim of diverting flood waters to the sea as quickly as possible [8]. Then, the emphasis of flood control was given to high water control via straightening river channels and levee construction. During the Showa period (1926–1989), due to the difficulty in securing land for levee enhancement or upgrade, flood control was dominated by the construction of multipurpose dams [9,10].
In response to an increase in flood risk caused by rapid urbanization in the 1960s and 1970s, Comprehensive Flood Risk Management Measures (CFRMMs) were developed in 1980 to meet the urgent need of river improvement works and runoff management in watersheds running through rapidly urbanized areas [10].
In 2003, the Act on Countermeasures against Flood Damage of Specified Rivers Running across Cities was enacted for eight designated rivers [11]. It mandated that river management authorities protect urban areas and take flood management measures within and beyond each watershed. The law instructed the development of an integrated flood management plan between river and sewerage management authorities. It led not only to horizontal collaboration between national and local governments, but also to lateral engagements, promoting the collaboration between the public and private sectors. The law also defined requirements for the private sector, including the installation of stormwater storage and infiltration facilities, and the collaboration with river and sewerage administrators on planning and implementing flood management measures such as the operational rules of pumping stations.
Since the 1980s, Japan has recognized the importance of combining structural and non-structural measures for effective flood risk management. In 2004, the Flood Fighting Act was amended and went into effect on 1 July 2005 [12]. By this amendment, municipal governments are responsible for designating inundation risk areas along both large and small to medium-sized rivers within their administrative boundaries. In addition, municipal governments are also required to inform their residents of flood risk-related matters such as potential inundation depths and locations of evacuation shelters, by distributing flood hazard maps to all residents. In this way, the preparation of flood hazard maps, which was previously an administrative effort, became the responsibility of each municipality. In 2013, a 100 mm h−1 safety plan was issued by the Ministry of Land, Infrastructure, Transport and Tourism (MLIT) to tackle the increasing impacts of heavy rain in urban areas [13]. The plan clarifies the responsibilities of local government and authority, the participation of residential communities and the private sector, and flood management measures to prevent inundation in urban and residential areas.
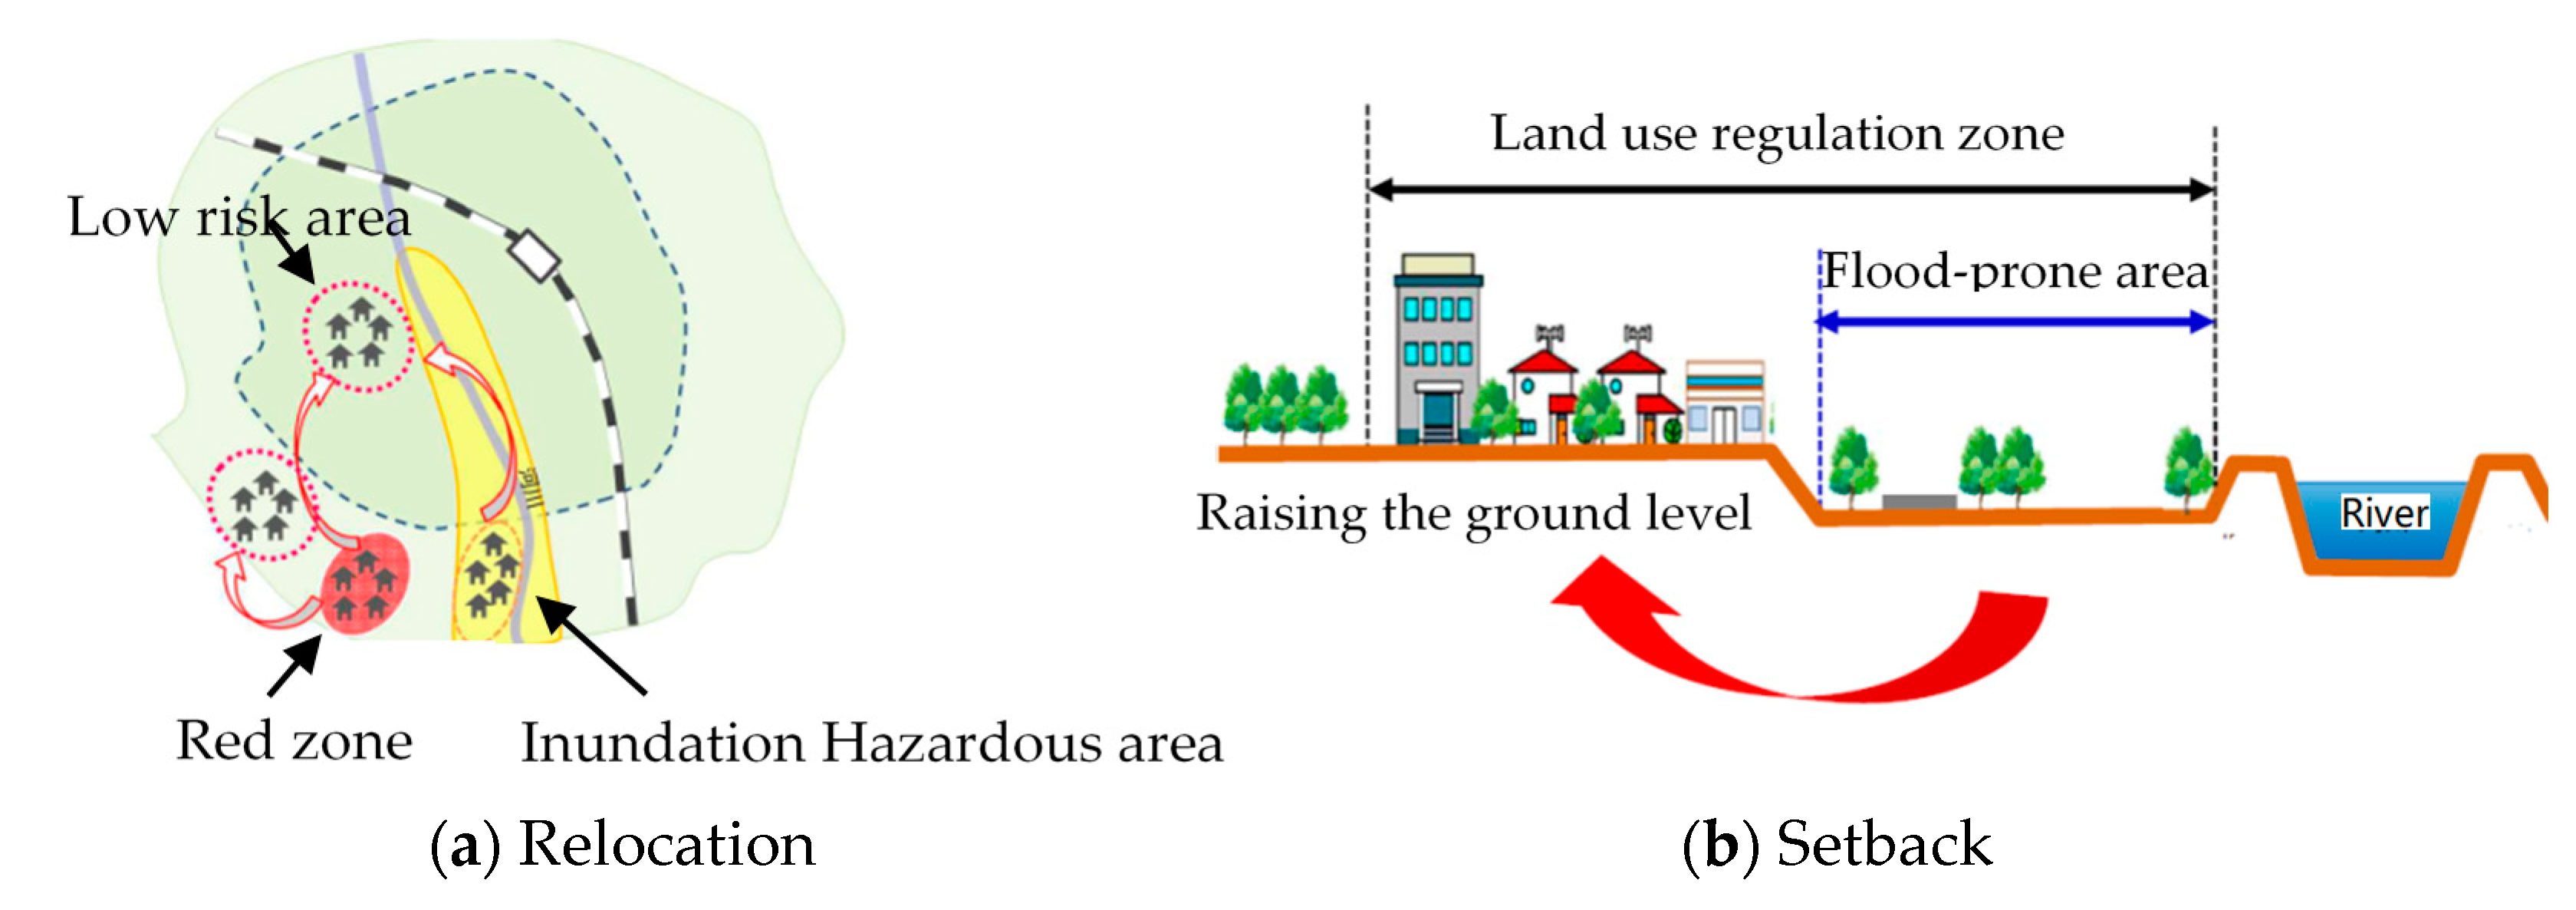
According to the Act on Special Measures concerning Urban Reconstruction amended in 2018 [14], local governments can designate areas as vulnerable to disasters such as floods, tsunamis and storm surges and prohibit construction of residential buildings in disaster red zones. The case of Shiga Prefecture’s land use regulation and water-resistant architecture is a representative example [15]. Furthermore, the 2018 amendment of the Act on Special Measures concerning Urban Reconstruction [16] also promotes the relocation of residents from disaster-prone areas to low risk areas, as illustrated in Figure 1.
These developments show clearly that the institutional setting for flood risk reduction by both structural and non-structural measures in Japan has been well formulated. However, whether these efforts and initiatives lead to a significant reduction of flood risk is an open question. At present, half of Japan’s population and 75% of its total assets are concentrated in flood-prone areas. A study by Huang [17] analyzed the flood fatality in Japan from 1930 to 2007 and detected a downward-shifting point corresponding to the 60% completion of the planned river improvement works for flood control across the nation. However, flood-induced economic loss in Japan showed a non-declining pattern. Another study by Ushiyama [18], analyzing the flood fatality in Japan from 1968 to 2014, also revealed a declining trend.
In 2019, Typhoon No. 19, also known as “Hagibis” (meaning “speed” in Tagalog), brought about record-breaking rainfall across East Japan from 12 to 13 October 2019, causing widespread flooding in a large number of locations including Tokyo, Chiba and Nagano prefectures. From Shizuoka, through Kanagawa, Tokyo, Chiba, Saitama and even all the way up to Nagano, Iwate and Fukushima, more than 7 million people were urged to evacuate. The half-day, one-day and two-day rainfalls brought by Hagibis set records in 120, 103 and 72 locations, respectively, as revealed by Japan’s Meteorological Agency [19]. In Hakone-machi, Kanagawa Prefecture, the two-day rainfall reached 1001 mm, which was about 30% of the annual precipitation at this site. In Hagiwara village, Tokyo, the two-day rainfall was 649 mm, equivalent to 40% of the annual precipitation. The air pressure at the center of the typhoon had fallen by 77 Pa to 915 over the 24-h period, which can be considered as explosive intensification.
According to a report of the Cabinet Office, Japan [20], 104 people died and 381 were injured in this disaster. There was also serious property damage caused by Hagibis. It was reported that 3308 houses were completely demolished, 30,024 were half damaged and 37,320 were partially affected. Among them, 8129 homes were inundated above floor level. In total, levee breaches occurred at 142 locations in 74 rivers, in 7 prefectures.
In view of the scope and magnitude of the damage, the disaster caused by Hagibis can be used to evaluate the effectiveness of flood management practices in Japan, in terms of investigating the possible causes of its high vulnerability to flooding. Motivated by this way of thinking, the present study conducted field surveys and multi-view analysis for flooding that occurred in Nagano City. The field surveys included an engineering investigation of the levee structure, inundation depths, shelter locations and residential house structures, and an interview survey on evacuation behavior and information sharing among foreign residents in Nagano City at the time of emergency. The objective was to analyze the main features of this flood event and identify the flood vulnerability still existing in Japan, which is a society considered as being well prepared for disasters.
Vulnerability is a concept that originated from social sciences and evolved into a major framework in risk science and management and related academic fields, with more than 25 definitions available in the literature [21]. One of the widely known definitions is given by the United Nations Development Program (UNDP) [22], which describes vulnerability as “a human condition or process resulting from physical, social, economic and environmental factors, which determines the likelihood and scale of damage from the impact of a given hazard”. Beyond the different vulnerability definitions, the improvement of risk management requires a particular focus on the relationship between risk and disaster. In our study, a step toward this achievement is given for the vulnerability assessment of flood risk.
The main body of this paper is organized as follows: site and case studies description are given in Section 2, while the results and discussion are given in Section 3, where a new framework proposal for vulnerability management is proposed, according to relevant criticalities detected during the case study analysis.
2. Materials and Methods
2.1. Study Area
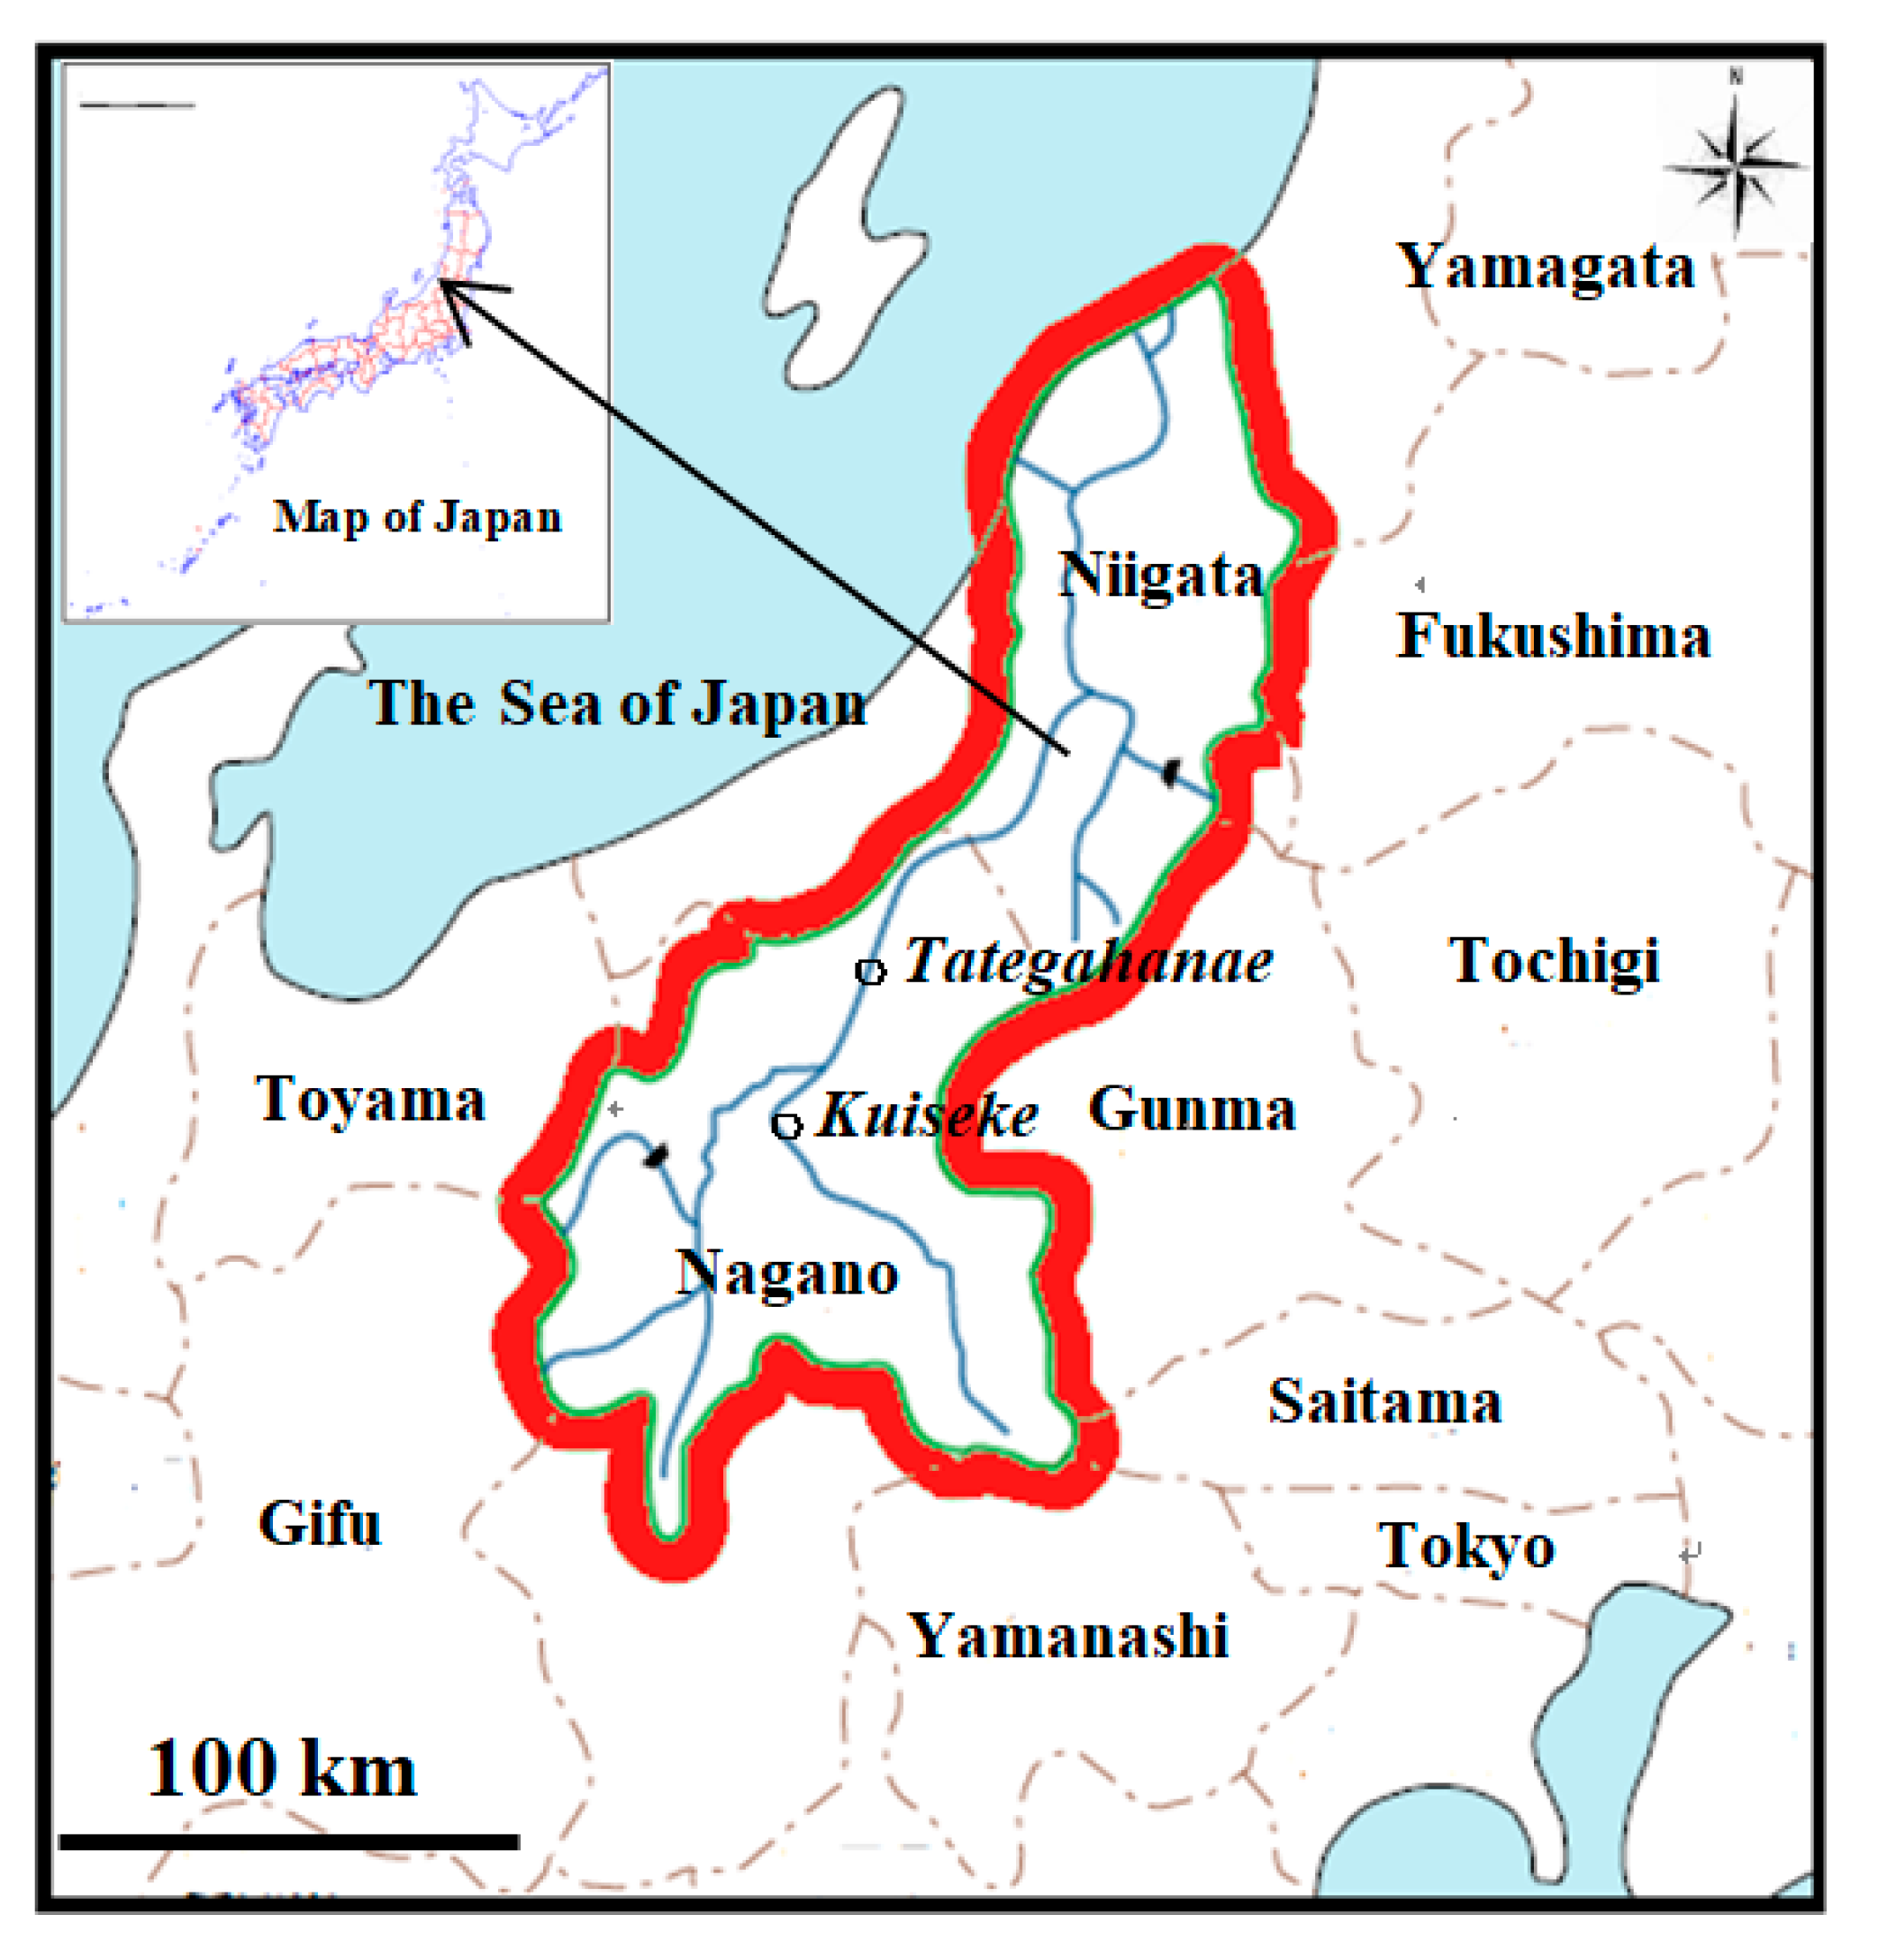
Nagano City is located in the Nagano Basin, in the central region of Japan, and surrounded by mountains. Chikuma River, the longest and widest river in Japan, flows through the city, and the Sai River and Asakawa River join the Chikuma River in the city. Figure 2 shows the watershed of the Chikuma River. It is elongated from north to south and flows through three prefectures: Nagano, Gunma and Niigata. As the waterway runs into Niigata Prefecture, it is renamed as Shinano River and finally flows into the Japan Sea. The area of the basin is 11,900 km2, and the population in the basin reaches about 2.9 million. Annual precipitation in the basin is about 900 mm upstream, 2300 mm in the middle stream and about 1800 mm downstream, respectively. The design flood at the Kuiseke gauging station is 4000 m3 s−1 and increases to 7500 m3 s−1 after the Sai River joins the Chikuma River. The mean annual discharge at the Kuiseke gauging station is 1.8 × 10⁸ m3 for the period from 1993 to 1998, accounting for 11% of the mean annual discharge at the river mouth.
The total area of the city is 834.81 km2, having a population of 370,632 and consisting of 160,625 households. It was one of the hardest hit areas in the disaster caused by Typhoon No. 19.
During the early morning of 13 October 2019, Typhoon No. 19 brought heavy rainfall to the city. The daily precipitation was as high as 132 mm, exceeding the historical record. The heavy rainfall caused a levee breach on the left bank of the Chikuma River in the Nagano City, allowing floodwaters to inundate residential areas, crop lands and business facilities. More than 360 residents in the Naganuma district, which is next to the breaching site, of whom around 200 were in a special nursing care home, were stranded by flood waters and rescued by the Ground Self-Defense Force via helicopter. Two residents of the district lost their life in this disaster. 448 ha of crop lands were flooded, resulting in a 974,000,000 JPY (approximately 9 million USD) loss. In addition, ten rows of bullet trains parked in the East Japan Railway Co.’s railyard, located in the northeastern part of the district, were inundated by muddy water, with the consequence that all flooded trains had to be disposed of.
2.2. Methods
Disasters are singular large-scale events that result in serious disruptions of the function of a community or society, with human and economic or environmental losses. Those losses may exceed the community’s or society’s ability to absorb or cope with them, causing long-lasting impacts. Conceptually, disasters can be defined as the product of hazards and vulnerability [23].
This structure can be interpreted as the interplay of an external force and an internal force, and the internal force can be described by the concept of vulnerability (although a general and unanimous definition of vulnerability remains non-existent). This study, following the works of Turner et al. [24], Balica et al. [25] and Adger [26], adopts a definition of vulnerability which can be mathematically expressed as follows:
where exposure is defined as the degree, duration and extent to which a system is in contact with, or subject to, perturbation. Susceptibility refers to the factors and attributes that make a community or society more or less likely to be negatively affected by perturbation. Coping capacity is defined as the ability to cope with, or absorb and adapt to, hazard impacts. It is the product of planned preparation before a disaster, emergency response during the disaster and post-disaster reconstruction.
This study evaluates flood risk management in Japan through the lens of vulnerability assessment for the Naganuma district. Four field surveys were conducted between November 2019 and January 2020. Unlike conventional qualitative studies, the methodology we employed for this study was to combine social and engineering information, document analysis and a field survey, which made it a hybrid type of research. For the engineering part, we investigated the geometric shape of the levee, the vegetation on the levee, the levee’s construction history and the design standard at the breaching site. We also conducted field work to investigate flood marks on residential houses, collected land surface elevation and land use data in the disaster-stricken area from Advanced Land Observing Satellite (ALOS) Research and Application Project, Japan Aerospace Exploration Agency [27], and received evacuation shelters locations from the Nagano City. The spatial resolutions for land surface elevation and land use were 30 m and 10 m, respectively. Furthermore, in order to find out what measures the business sector had taken for flood risk management, we surveyed the surrounding area of the JR railyard for bullet trains, which was inundated and suffered a major economic loss. Then, Geographic Information System (GIS) software ArcGIS Pro 2.3 was employed to map the surface elevation distribution, land use, building distribution and shelters in the affected district. The shelters were divided into those that actually functioned and those that malfunctioned. For the social part, governmental and historical documents were analyzed to look into the history of the district’s development and to examine the government support system for community recovery. A particular attention was given to the assessment of agricultural practices in the region in relation to disaster insurance systems in Japan. In addition, we conducted a questionnaire survey with a focus on evacuation behavior and emergency information communication to non-Japanese residents. Since many residents in the disaster-stricken area had not returned to their homes at the time of the survey, random sampling was not feasible. Instead, a convenience sampling approach was employed, and 80 samples were obtained. Besides, we interviewed 11 local residents, chosen at random in a separate field work, about the insurance they had. Based on the aforementioned information, the vulnerability of the district to flooding was assessed qualitatively from three aspects: (1) exposure, (2) susceptibility and (3) coping capacity. Particular attention was given to the interplay of the three components in order to identify not just the district’s vulnerability to flooding but also the vulnerability-generating mechanisms. Finally, the intention was to propose a new framework for vulnerability management, which can be characterized as more operational than existent vulnerability frameworks. In short, the methodology can be characterized as information mining, cross-sectoral data analysis and the development of a conceptual model for better vulnerability management.
3. Results
3.1. Exposure and Susceptibility Assessment
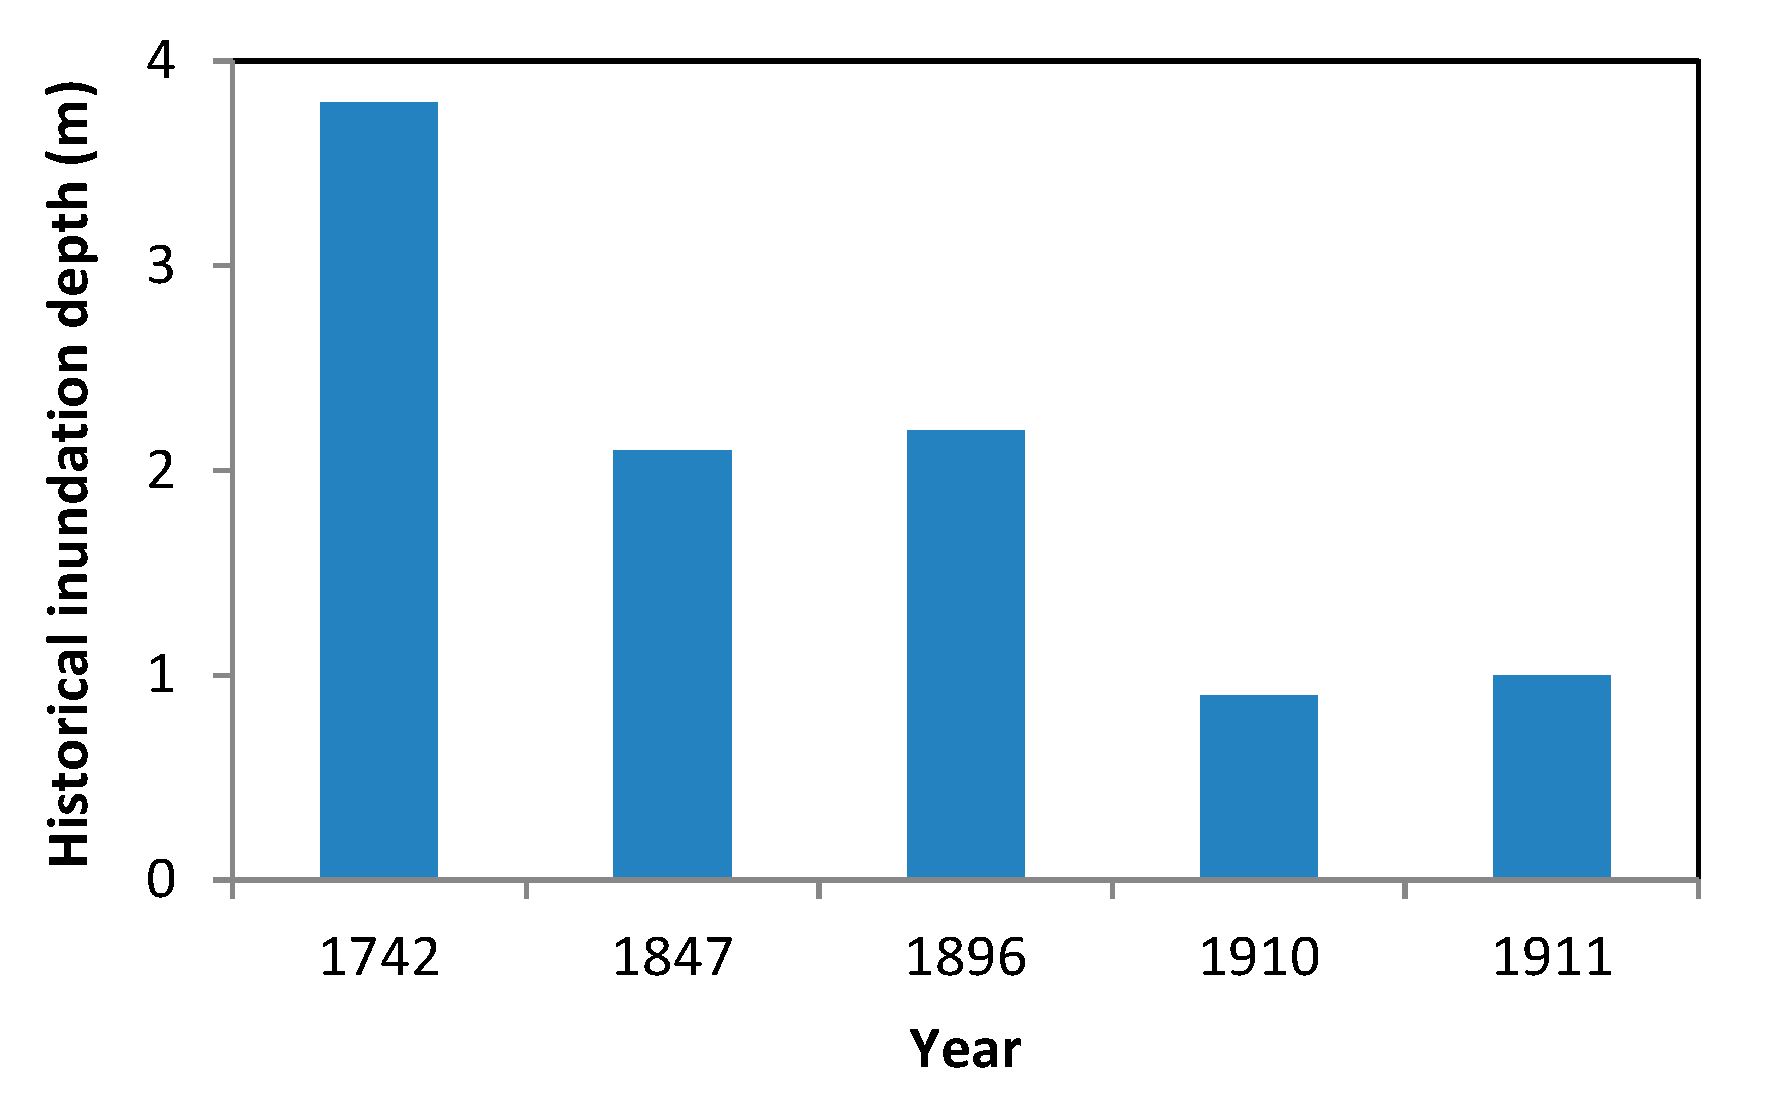
According to historical records [28], the Naganuma district had been flooded several times from the Edo period 1603–1868) to the Meiji period (1868–1912). The inundation depths of these flooding events were marked on the pillar of the main hall of a temple near the levee breaching site, as shown in Figure 3.
The design rainfall for the Chikuma River at the Tategahana station is 186 mm/48 h, which has a 1/100 probability of occurrence. During Typhoo No. 19, the two-day total rainfall was 193.7 mm, exceeding the design rainfall by 4% according to data of Japan’s Meteorological Agency. Furthermore, the maximum 24 h rainfall exceeded historical records by 50%. Therefore, the rainfall brought by Typhoon No. 19 can be characterized as intensive heavy rainfall.
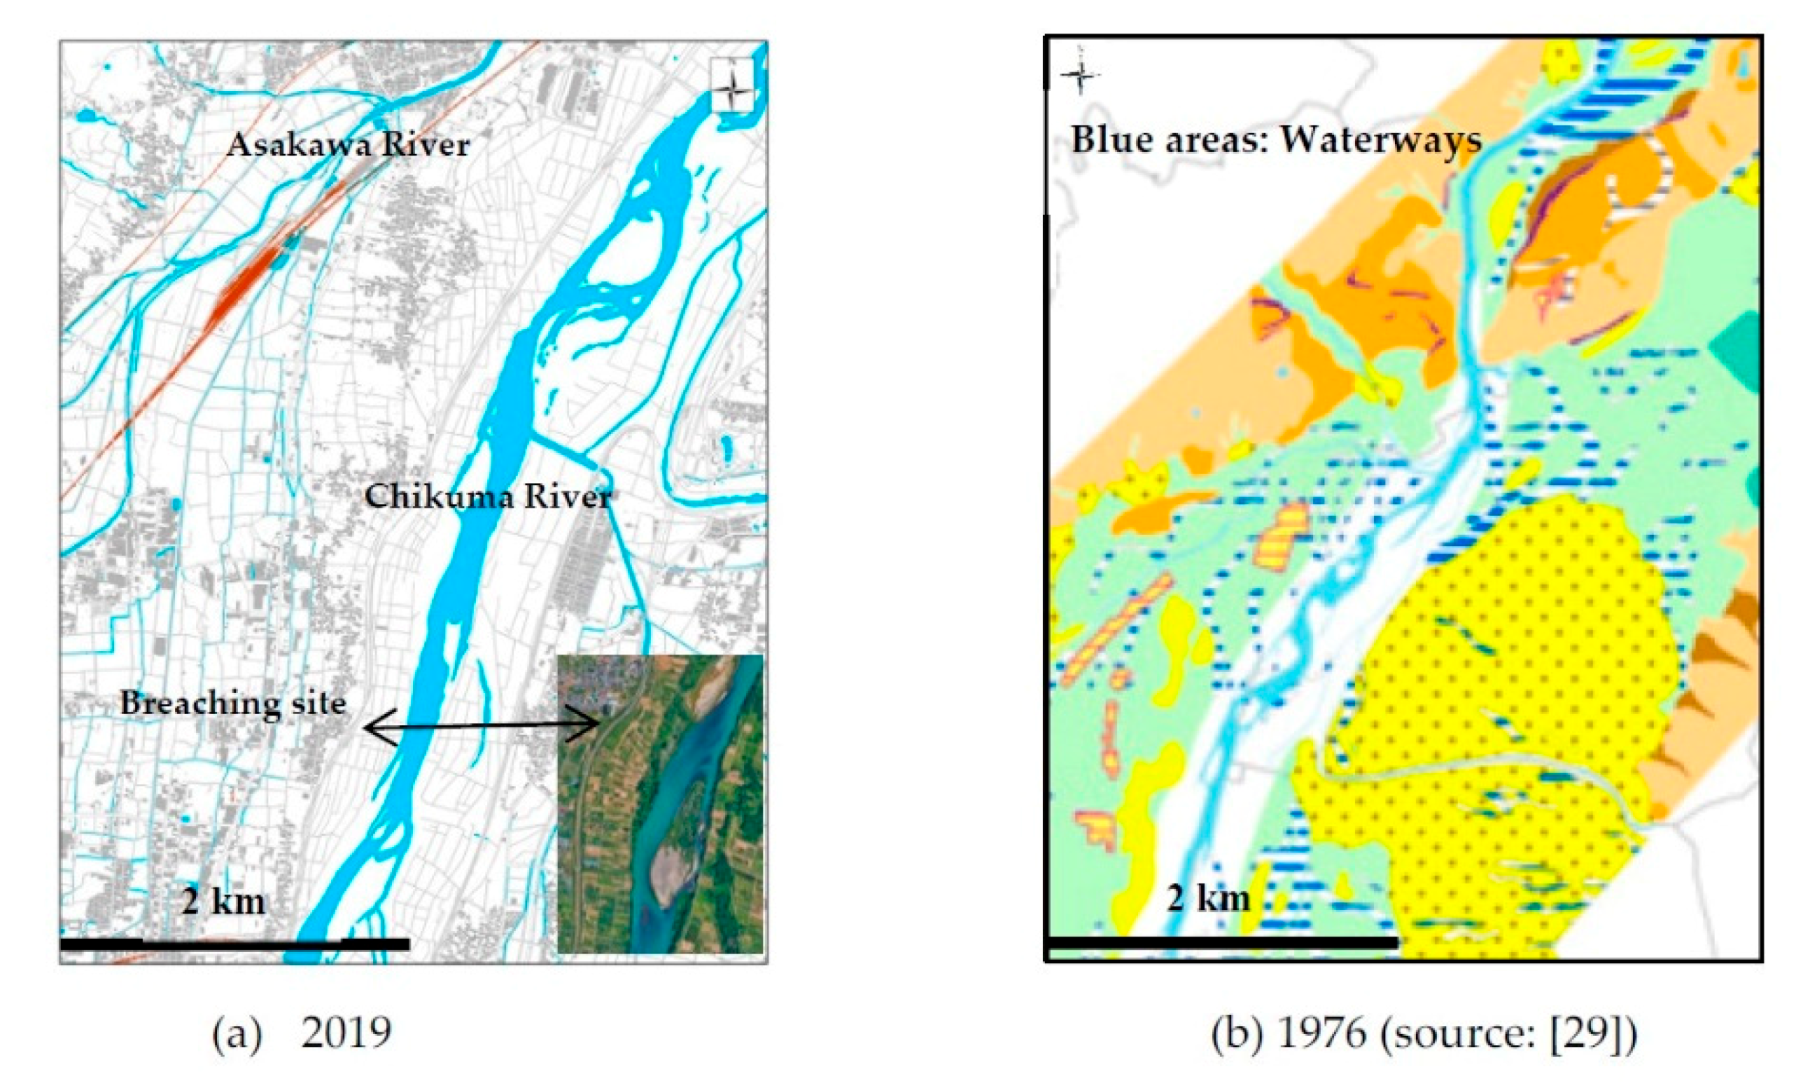
Figure 4 shows the main geographic characteristics of the district as well as an old map of the area. The district is surrounded by the Chikuma River and the Asakawa River. The map of current landform shows that the river course is curved around the breaching site, although only mildly so, and the district is located on the concave side of the river bend. Such a landform makes this area prone to flooding. The map of the district about half a century ago, obtained from the Geospatial Information Authority of Japan [29], indicates that there were quite a number of small waterways in the district in the past that have now been transformed into land. Because of the landform, agriculture in this area had often been affected by flooding. In 1897, local famers started planting apple trees because apple cultivation has a higher level of resistance to flood damage compared to sericulture, which was the dominant business in this area before 1897. This initiative can be evaluated as an adaption measure and has proven to be successful. Over the years, Nagano City has established its reputation as a major apple grower in Japan, and the majority of residents in Naganuma district are engaged in the apple business in some way. From a vulnerability point of view, this initiative reduced the susceptibility to the impact of flooding, since apple trees are more resistant to flood waters and provide a stable and good income to the community during normal years.
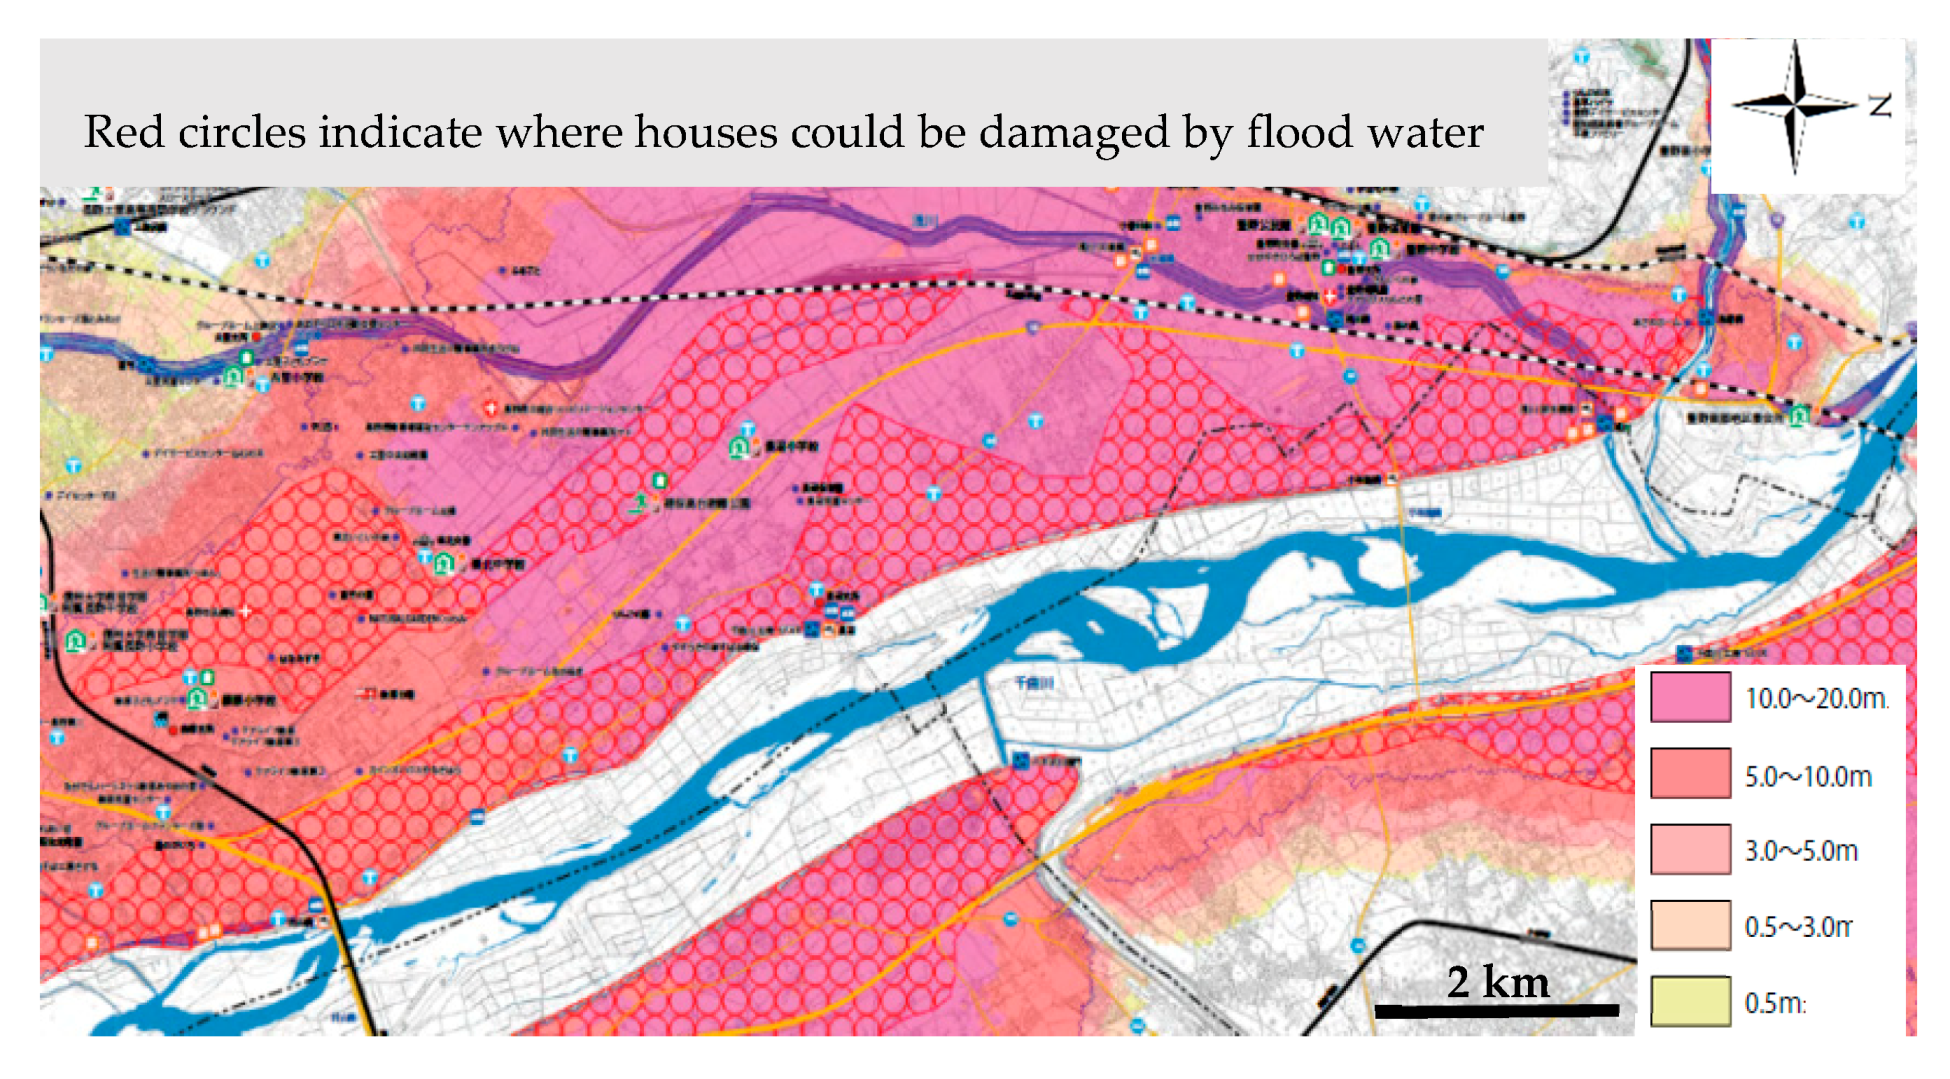
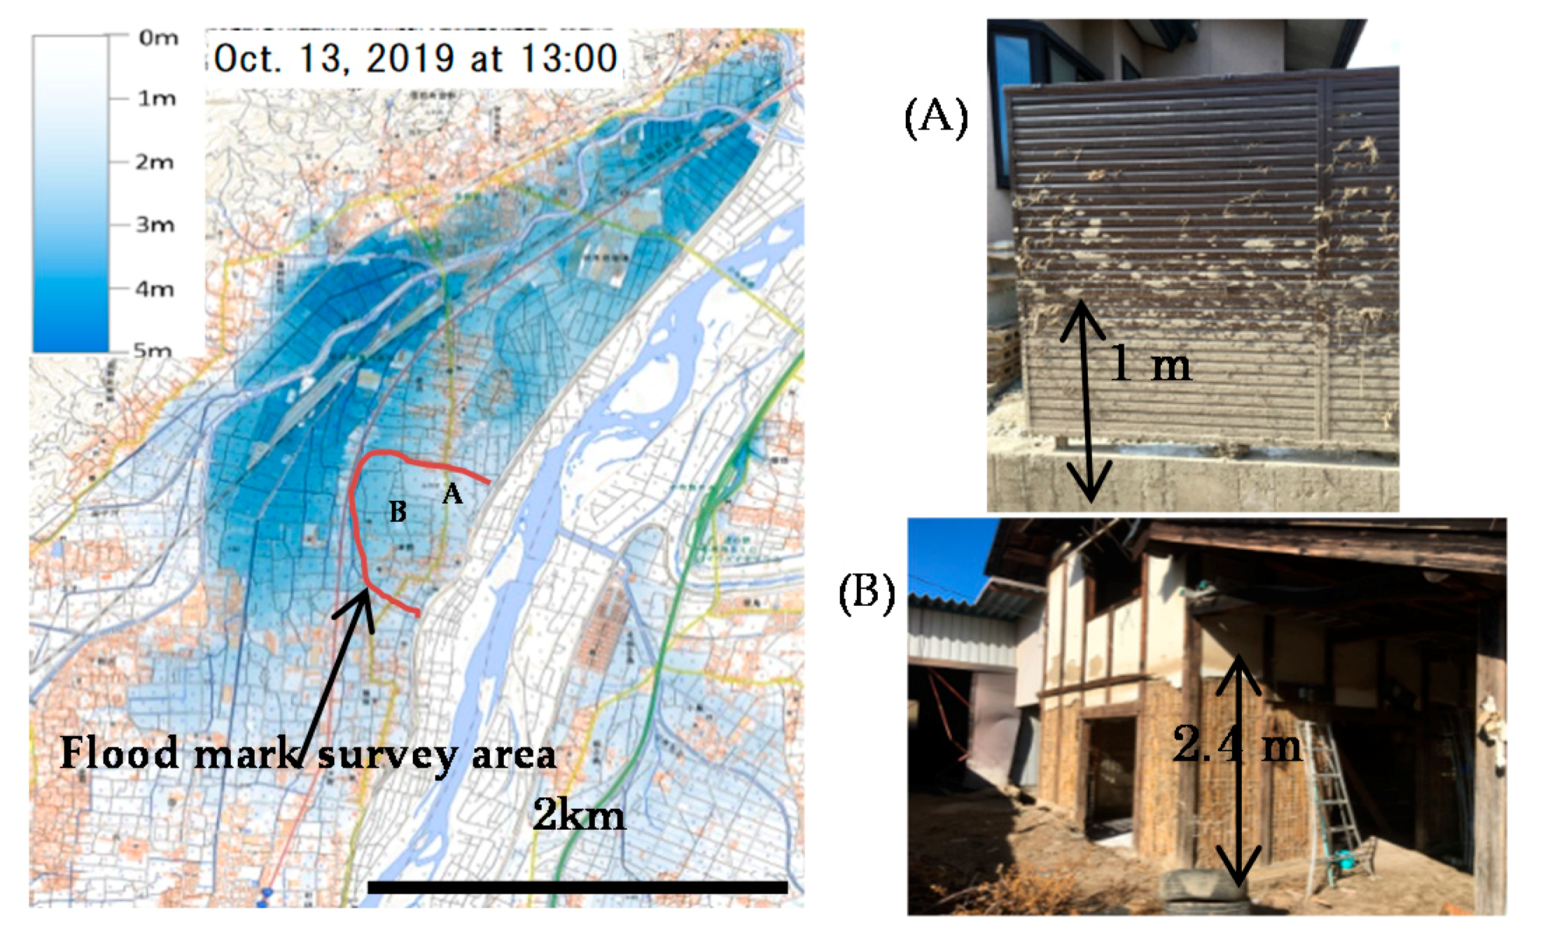
Figure 5 shows the flood hazard map prepared by the Nagano City government [30], indicating that the projected maximum inundation depth in Naganuma district could be as high as 20 m. Figure 6 shows the flood water depth distribution on 13 October 2019, produced by the Geospatial Information Authority of Japan (GSI), based on satellite images [31]. Our field survey on flood water marks left on the walls of residential houses revealed that the flood water depth in Hoyasu subdistrict, which is the main residential area of Naganuma district, varied from 1 m to 2.4 m as shown in Figure 6, which is due partially to the backwater effects of buildings. This validated the flood depth estimation of the GSI. By comparing the actual flood water depth distribution with the projected flood water depth in the flood hazard map, it appears that the inundation area matches the projection, although the water depth was lower than the projected possible maximum value. This proves that the flood hazard map for this area provided reliable information on high flood risk zones. Meanwhile, it also serves as a reminder that flood hazard maps need further improvement to provide more accurate information on inundation depths and thereby facilitate risk management.
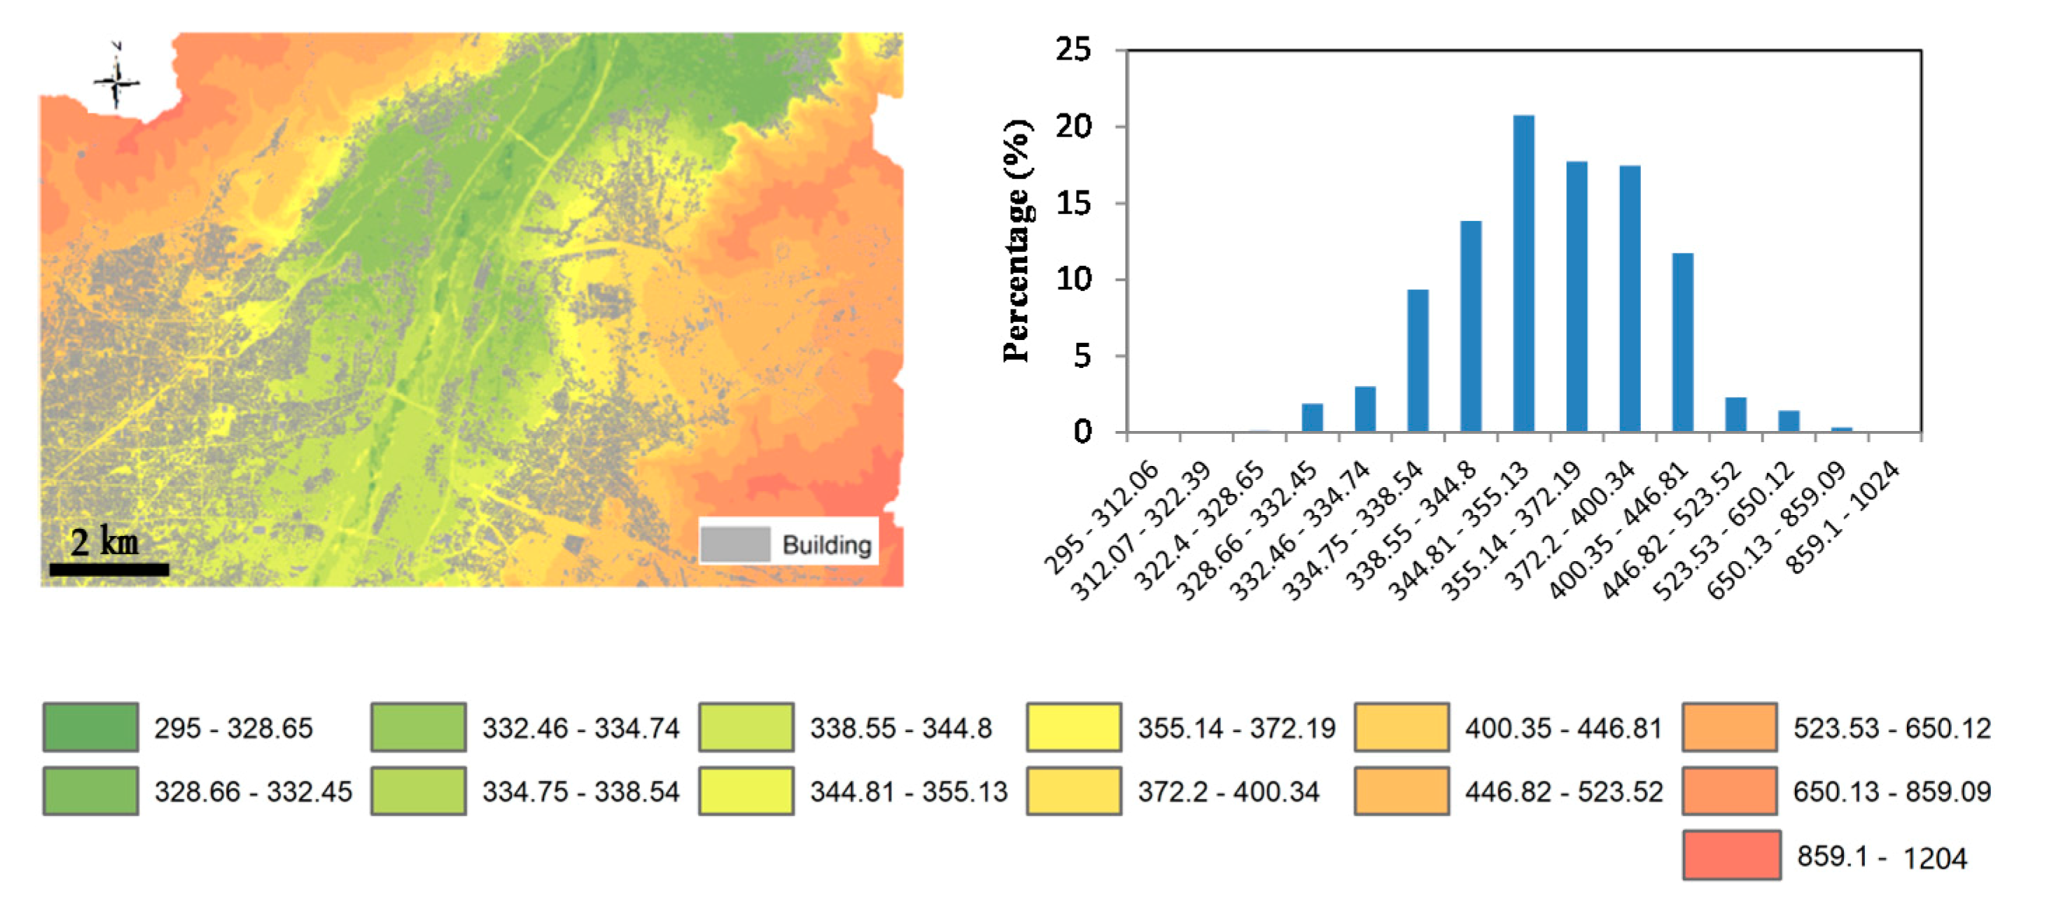
By using the building inventory database of the Geospatial Information Authority of Japan [32], the distribution of residential houses in Naganuma district was mapped and plotted together with the spatial variation of the surface elevation in the district (Figure 7). Besides, the percentages of houses in different risk zones are also shown in Figure 7. It is clear that many houses were indeed constructed in relatively less dangerous locations. Such a data analysis revealed that the local community has taken certain measures to reduce the degree of susceptibility to flooding.
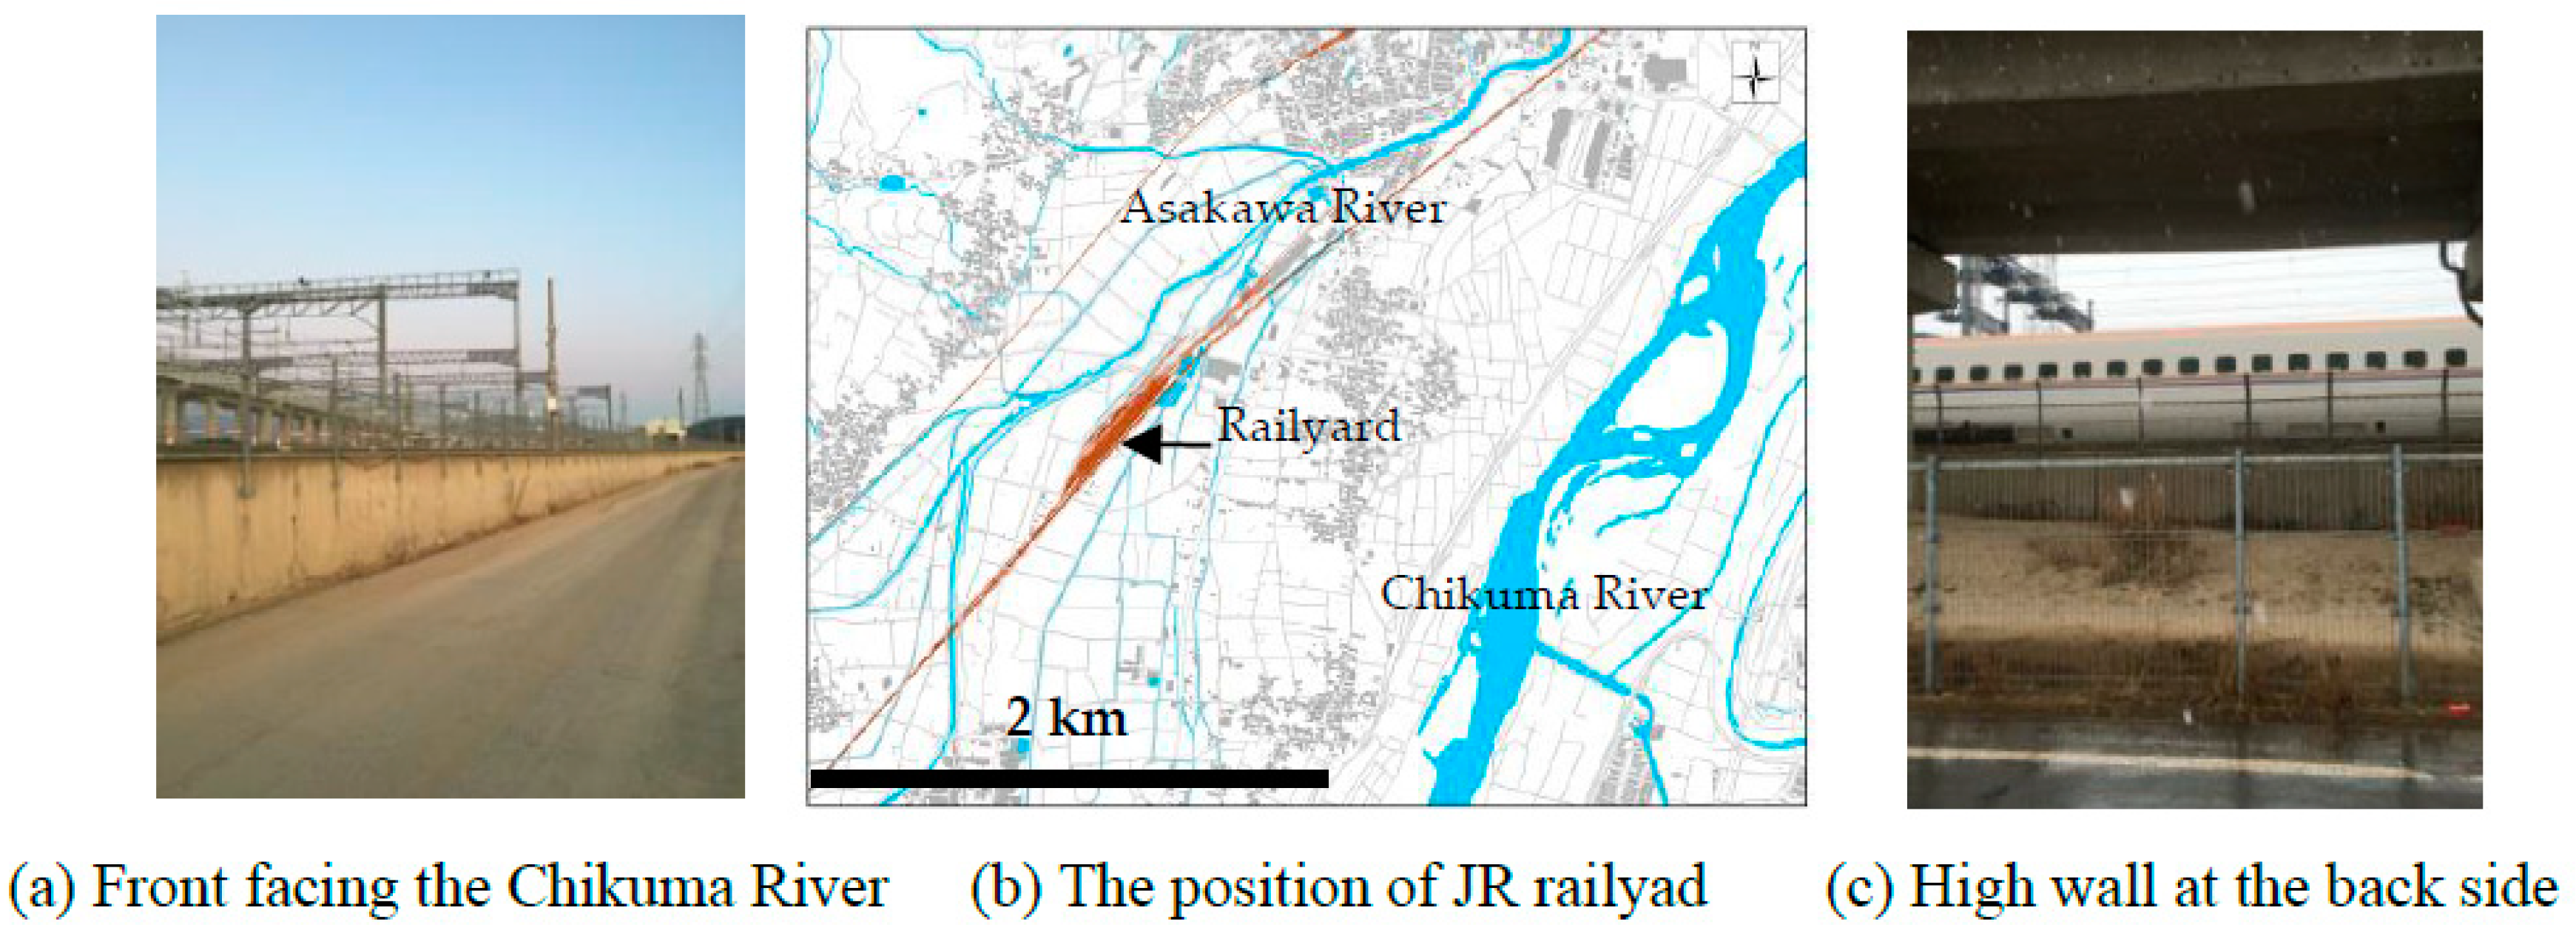
In contrast to the residential areas, however, the JR railyard for bullet trains is situated in the northeast part of the district, where the ground surface elevation is the lowest in the district. Our field survey found that the protective measures at the front and back of the railyard are different, as shown in Figure 8. At the front of the yard, facing the Chikuma River, the foundation was raised by about 2 m, and trains can be seen from outside the yard. At the back, however, there is a 4-meter-high wall. As can be seen from Figure 8, the Asakawa River (with its two tributaries) is closer to the back of the railyard than the Chikuma River is to the front of the railyard. In 1983, the Asakawa River flooded and inundated an area of 248.5 ha, with 331 houses being flooded above floor level. Since the railyard was constructed in the 1990s, it may be postulated that the high wall at the back of the railyard was constructed to protect against flood waters from the Asakawa River. This suggests that the East Japan Railway Co. had taken measures to reduce the exposure of its facility to flooding from the Asakawa River. However, it may have underestimated the exposure to flooding from the Chikuma River. According to the document archive of Nagano City, the local community supported the construction of the high-speed Shinkansen railway line and associated facilities in the district but requested the early construction of a dam in the upstream of the Asakawa River in 1993. In subsequent years, the dialogues between the city office and the local community have been pretty much focused on the flood risk imposed by the Asakawa River [33]. The fact that the local government and residents were more concerned with the Asakawa River would have led the East Japan Railway Co. to pay more attention to the Asakawa River than the Chikuma River in its flood risk management.
Geographical characteristics such as distance or proximity to a hazard can be an important determinant of flood risk perception. Botzen et al. [34], through a survey of 1000 householders in The Netherlands, showed geographical characteristics (distance from river and elevation relative to water level) to be the main factor in shaping a respondent’s flood risk perception. Another study by Zhang et al. [35] also showed that perceived personal risk of flood hazard was positively correlated with the proximity to the hazard source. Therefore, the underestimation of the exposure to flooding from the Chikuma River might be explained by such a cognitive effect.
Although the Act on Special Measures concerning Urban Reconstruction, amended in 2018 [36], prohibits the construction of residential buildings in highly hazardous areas and promotes the relocation of residences and hospitals from disaster-prone areas to low risk areas, the law does not target business operations in general. This may be considered a legal inadequacy as regards integrated watershed management. Unless widely targeted and legally enforced, the clean-up of highly risky zones would be very difficult, if not impossible. Our investigation of the East Japan Railway Co. also revealed that the company did not have any guideline relating to the emergency operation of trains in the railyard during a disaster.
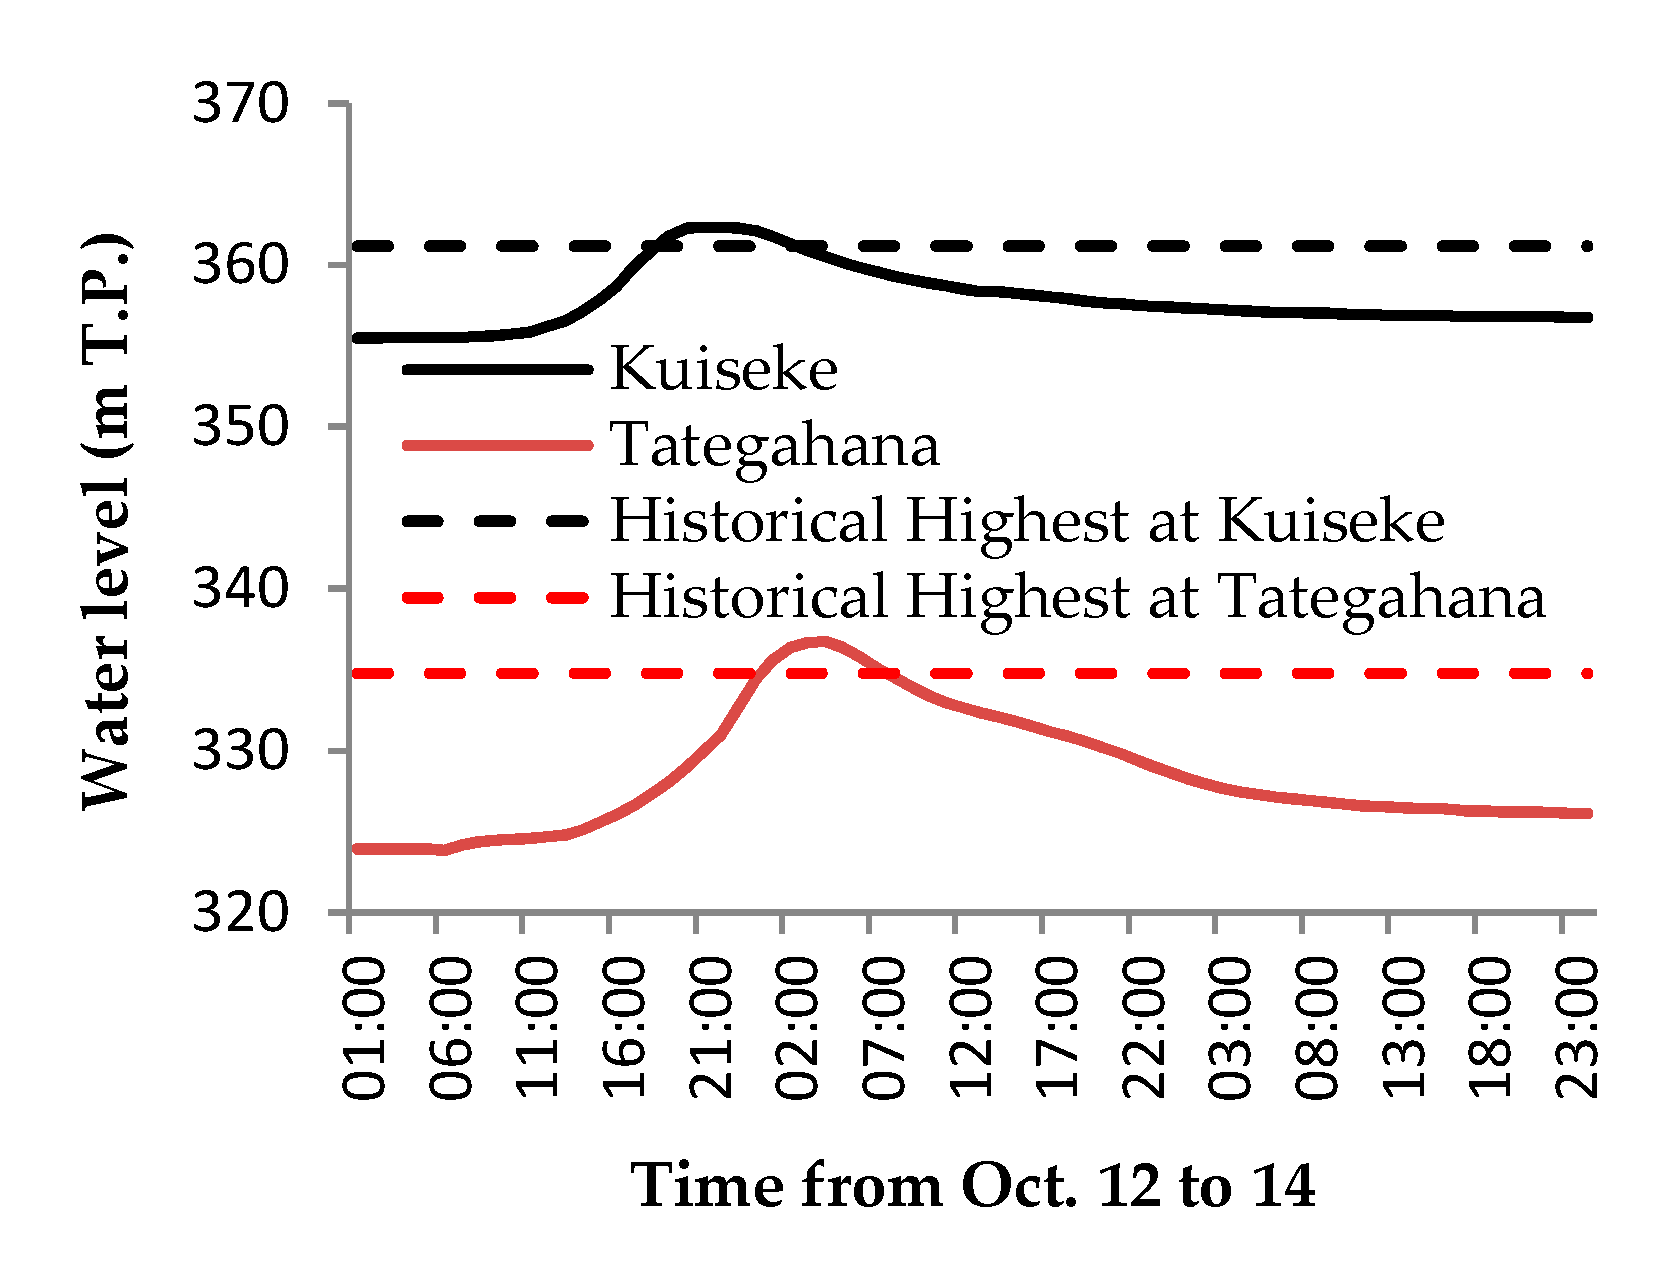
Figure 9 shows the water level variation during the flood at two gauge stations: Kuiseke, about 20 km upstream, and Tategahana, about 6 km downstream of the levee breaching site, respectively. At both locations, the water level exceeded historical records. While the historical highest water level at the Kuiseke gauging station occurred on 16 September 2013, the historical highest at the Tategahana gauging station was recorded on 19 July 2006.
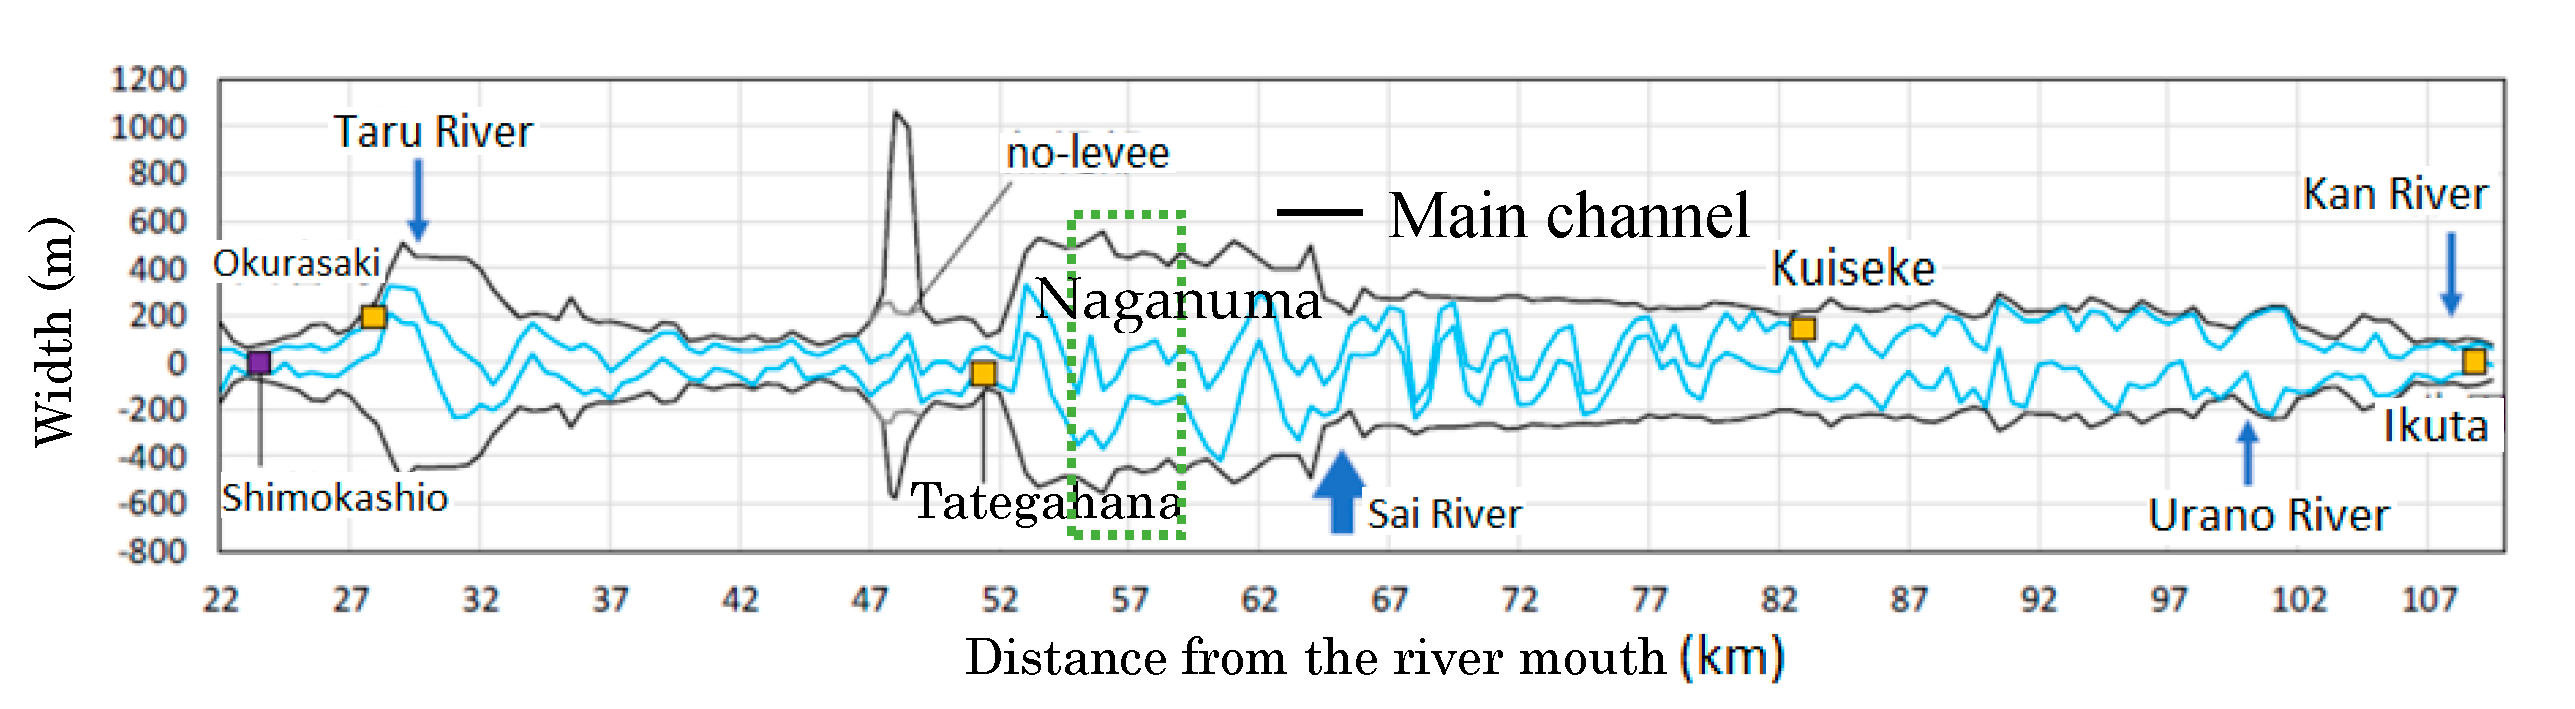
As shown in Figure 10, Tategahana is the narrowest point of the river course within the Nagano Prefecture. During a large flood event, such a significant contraction of the river’s width can cause a significant backwater effect on the water level in the upstream reach. Preliminary simulations using HEC-RAS modeling system [37] indicated that Naganuma district is within the backwater zone when the flow discharge at Tategahana station is assumed to be 7000 m3 s−1.
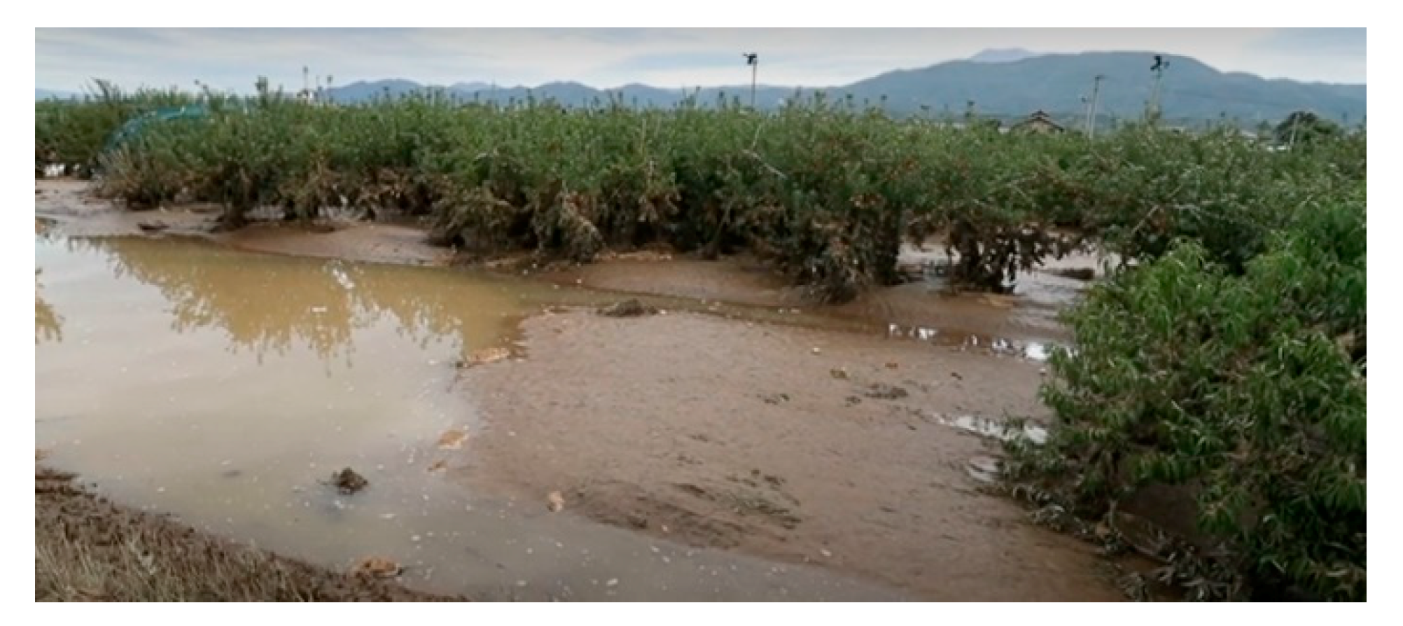
For the river reaches within Nagano City, a large portion of the floodplains are used as orchards, mainly of apple trees, as shown in Figure 11. It is well documented that the presence of vegetation on floodplains may affect channel conveyance, because it increases the channel roughness coefficient, reduces the cross-sectional area and lowers channel conveyance [38,39,40,41,42,43]. For the river cross section at the breaching site, the ratio of the width of the vegetated zone to the total channel width is about 0.5, according to our field survey. A laboratory experiment showed that when the ratio is 0.5, the conveyance could be reduced by 20% [44]. A recent study [45] indicated that peak flood stages could be decreased by 13–34 cm after the clearance of invasive plants. From the viewpoint of flood risk management, vegetation developed on floodplains due to human activity should be removed or managed properly to ensure the safe passage of floodwater. However, an issue in Nagano City is that these floodplains are owned by farmers, and fruit cultivation on floodplains has become a major source of income for the local population. Therefore, the Japanese government cannot simply order agricultural activity on the floodplains to be stopped. Consequently, the combination of possible backwater due to channel width contraction and vegetation effects may have increased the susceptibility of Naganuma district to flooding.
The level of vulnerability is highly dependent upon the economic status of individuals, communities and nations. The poor are usually more vulnerable to disasters because they lack the resources to protect themselves and to recover from disasters. Previous studies have highlighted that the impact of floods varies by social class, not only during the pre-impact and response phases of a flood event but also during the recovery and rebuilding processes [46]. Even in a mature and well-organized society such as Japan, a good household income is a prerequisite for a person to be able to say, after a disaster, “just clear the rubble and I can take care of reconstruction on my own”. In the Nagano case, farming on floodplains provides the local population with a stable and good income, contributing to the enhancement of coping capacity, but may also increase the possibility of river channel overflow. Therefore, this study presents a case in which economic activity increases the financial capacity of the local community to deal with disasters but increases its susceptibility to hazard at the same time. Such a linkage between hazard susceptibility and coping capacity has not previously been addressed. In addition, trees in the river channel may be uprooted and transported downstream during a flood. Any accumulation of driftwood at, for example, a bridge downstream may then cause overflow due to flow blockage, as well as damage to the bridge. Such a problem has indeed happened frequently in Japanese rivers [47,48]. This highlights the possibility that the mismanagement of vegetation on floodplains may not only increase the vulnerability to flooding at specific locations, but also increase the vulnerability to flooding at downstream sites due to the accumulation of driftwood, or at upstream sites due to the backwater effect of vegetation. As vegetation on floodplains is a major issue in integrated river management, new and innovative management practices should be explored to achieve a win-win solution.
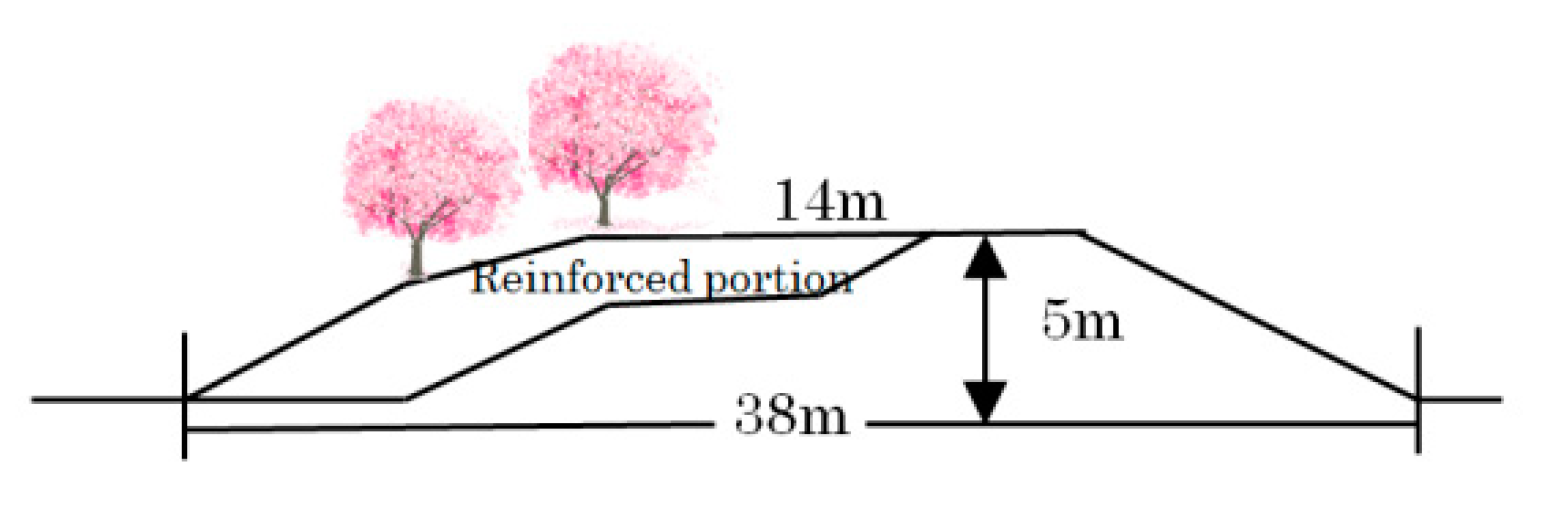
The levee in Naganuma district was constructed in 1984, and reinforcement work to expand the width of the levee to 14 m was started in 2007 and completed in 2016. The work was designed to resist a 100-year flood. The reinforced levee is 4.37 km-long, has 600 cherry trees and is called the Sakura levee, as sketched in Figure 12. There are indeed many so-called Sakura levees across Japan. They are good for the riparian landscape and serve as a place of relaxation for visitors. However, they present a safety concern, because the presence of the trees’ root systems inside the levee can reduce its strength [49]. Therefore, on normal days, Sakura levees can reduce the stress of residents, but under extreme weather conditions, the presence of Sakura trees on a levee might increase the exposure of local residents to a flood disaster.
3.2. Assessment of Coping Capacity
The majority of residents in Naganuma district are engaged in agricultural businesses, so the potential for crop damage by flooding is a critical factor in their lives. Therefore, how the impact of crops and property damage can be reduced is a very important part of the coping capacity of an agriculture-centered community. Among 11 local residents interviewed, ten of them have agricultural insurance of one type or another. The one resident without insurance was a retailer, not engaged in the agricultural business. Currently, Japan has three types of insurance in the agricultural sector. Japan’s Agricultural Insurance scheme, known as NOSAI [50], is provided by National Agricultural Mutual Relief (AMR) Associations or municipal governments, in which liabilities by the AMR Associations and the municipal governments are reinsured by their prefectural federation, and the federations’ liabilities are further re-reinsured by the national government. Under this insurance scheme, not just crops but also residential houses can be insured. From 2019, the National Agricultural Insurance Association started a new revenue insurance program [51]. Under this program, three types of revenue insurance models are available: crop-based revenue, combined-crop revenue (rice/wheat/soybeans) and total farm revenue. By joining this revenue insurance, 80% of a farmer’s income can be guaranteed when hit by a natural disaster. It also applies to the income reduction due to the 2020 coronavirus outbreak. In addition, there is a so-called JA insurance system, run by the National Mutual Insurance Federation of Agricultural Cooperatives [52]. For the NOSAI and revenue insurance programs, 50% of the premium is shouldered by the national government, to reduce the burden on farmers. In addition, Nagano City has provided financial support to victims via the distribution of relief money, paying for the cost of demolishing severely damaged houses, reducing property tax, and so forth.
In addition to insurance, Japan has the Extreme Disaster Act, established in 1962 [53]. In the event of a major disaster that meets certain criteria, disaster-stricken regions will be designated under the said law, and special measures will be implemented to provide subsidies from central government for the post-disaster recovery of public infrastructure, such as roads, and joint facilities of business cooperatives, such as irrigation channels.
After the Great East Japan earthquake (11 March 2011), Japan established the Large-Scale Disaster Recovery Act in 2013 [54], which gives a disaster area more generous financial support and makes the support process faster. For the flood disasters caused by Typhoon No. 19 across Japan, both the Extreme Disaster Act and the Large-Scale Disaster Recovery Act were applied.
Putting the aforementioned information together, there are at least three insurance options for farmers in Japan: NOSAI, revenue insurance and JA insurance. More importantly, when a major disaster occurs, there will be great relief aid from the central government guaranteed by law.
Therefore, the financial capacity of local communities in the disaster-stricken area for rebuilding can be considered very high. Nevertheless, field surveys and interviews with the local residents two months after the disaster found that the recovery process was in fact slow because most of the destroyed houses were still with little repair. One reason for this is that Typhoon No. 19 caused flood disasters in many regions in Japan, so there was high demand for carpenters for wooden house construction and staff for disinfection and sterilization. Furthermore, manpower for debris removal was not sufficient, even though many volunteers came to help. According to a report by the Nagano City government, the debris removal rates were 94% in residential areas and 84% in farmlands, respectively, by April 18, more than five months after the disaster. Based on these facts, the coping capacity of the community can be characterized as being financially sufficient but insufficient in terms of human resources for reconstruction.
Another important aspect of coping capacity is the warning system. Japan has a good flood warning system, consisting of five levels, as shown in Table 1 [55]. The aim of the system is to save lives by clearly distinguishing between levels of danger, so that individuals can prepare for evacuation and promptly seek refuge in the event of a natural disaster.
Following meteorological information, the Nagano City government issued an evacuation advisory at 18:00 on 12 October 2019 and then raised it to the evacuation order at 23:40. There are a number of CCTV cameras installed along the river course by the Chikuma River Office, with one of them close to the breaching site. The video images recorded by this camera showed that the overflow in the Hoyasu subdistrict occurred around 01:00, and that the levee collapsed at 05:30, on 13 October 2019. Therefore, there was a one-hour lead time for residents to evacuate before being hit by flood waters. Nevertheless, about 1000 residents did not evacuate in time and were later rescued, according to our interview with Nagano City officials. Among these 1000, 287 were rescued from an intensive-care nursing home for the elderly by the Japan Self-Defense Force. When the staff in the nursing home received the evacuation advisory at 18:00, on 12 October 2019, they moved all residents to the second floor. However, they did not follow the evacuation order issued at 23:40 of the same day, because the number of staff was only around 10, and they were unable to move all 287 residents out of the facility. Instead, they moved everyone to the third floor at 07:00 a.m. on 13 October 2019 and waited to be rescued.
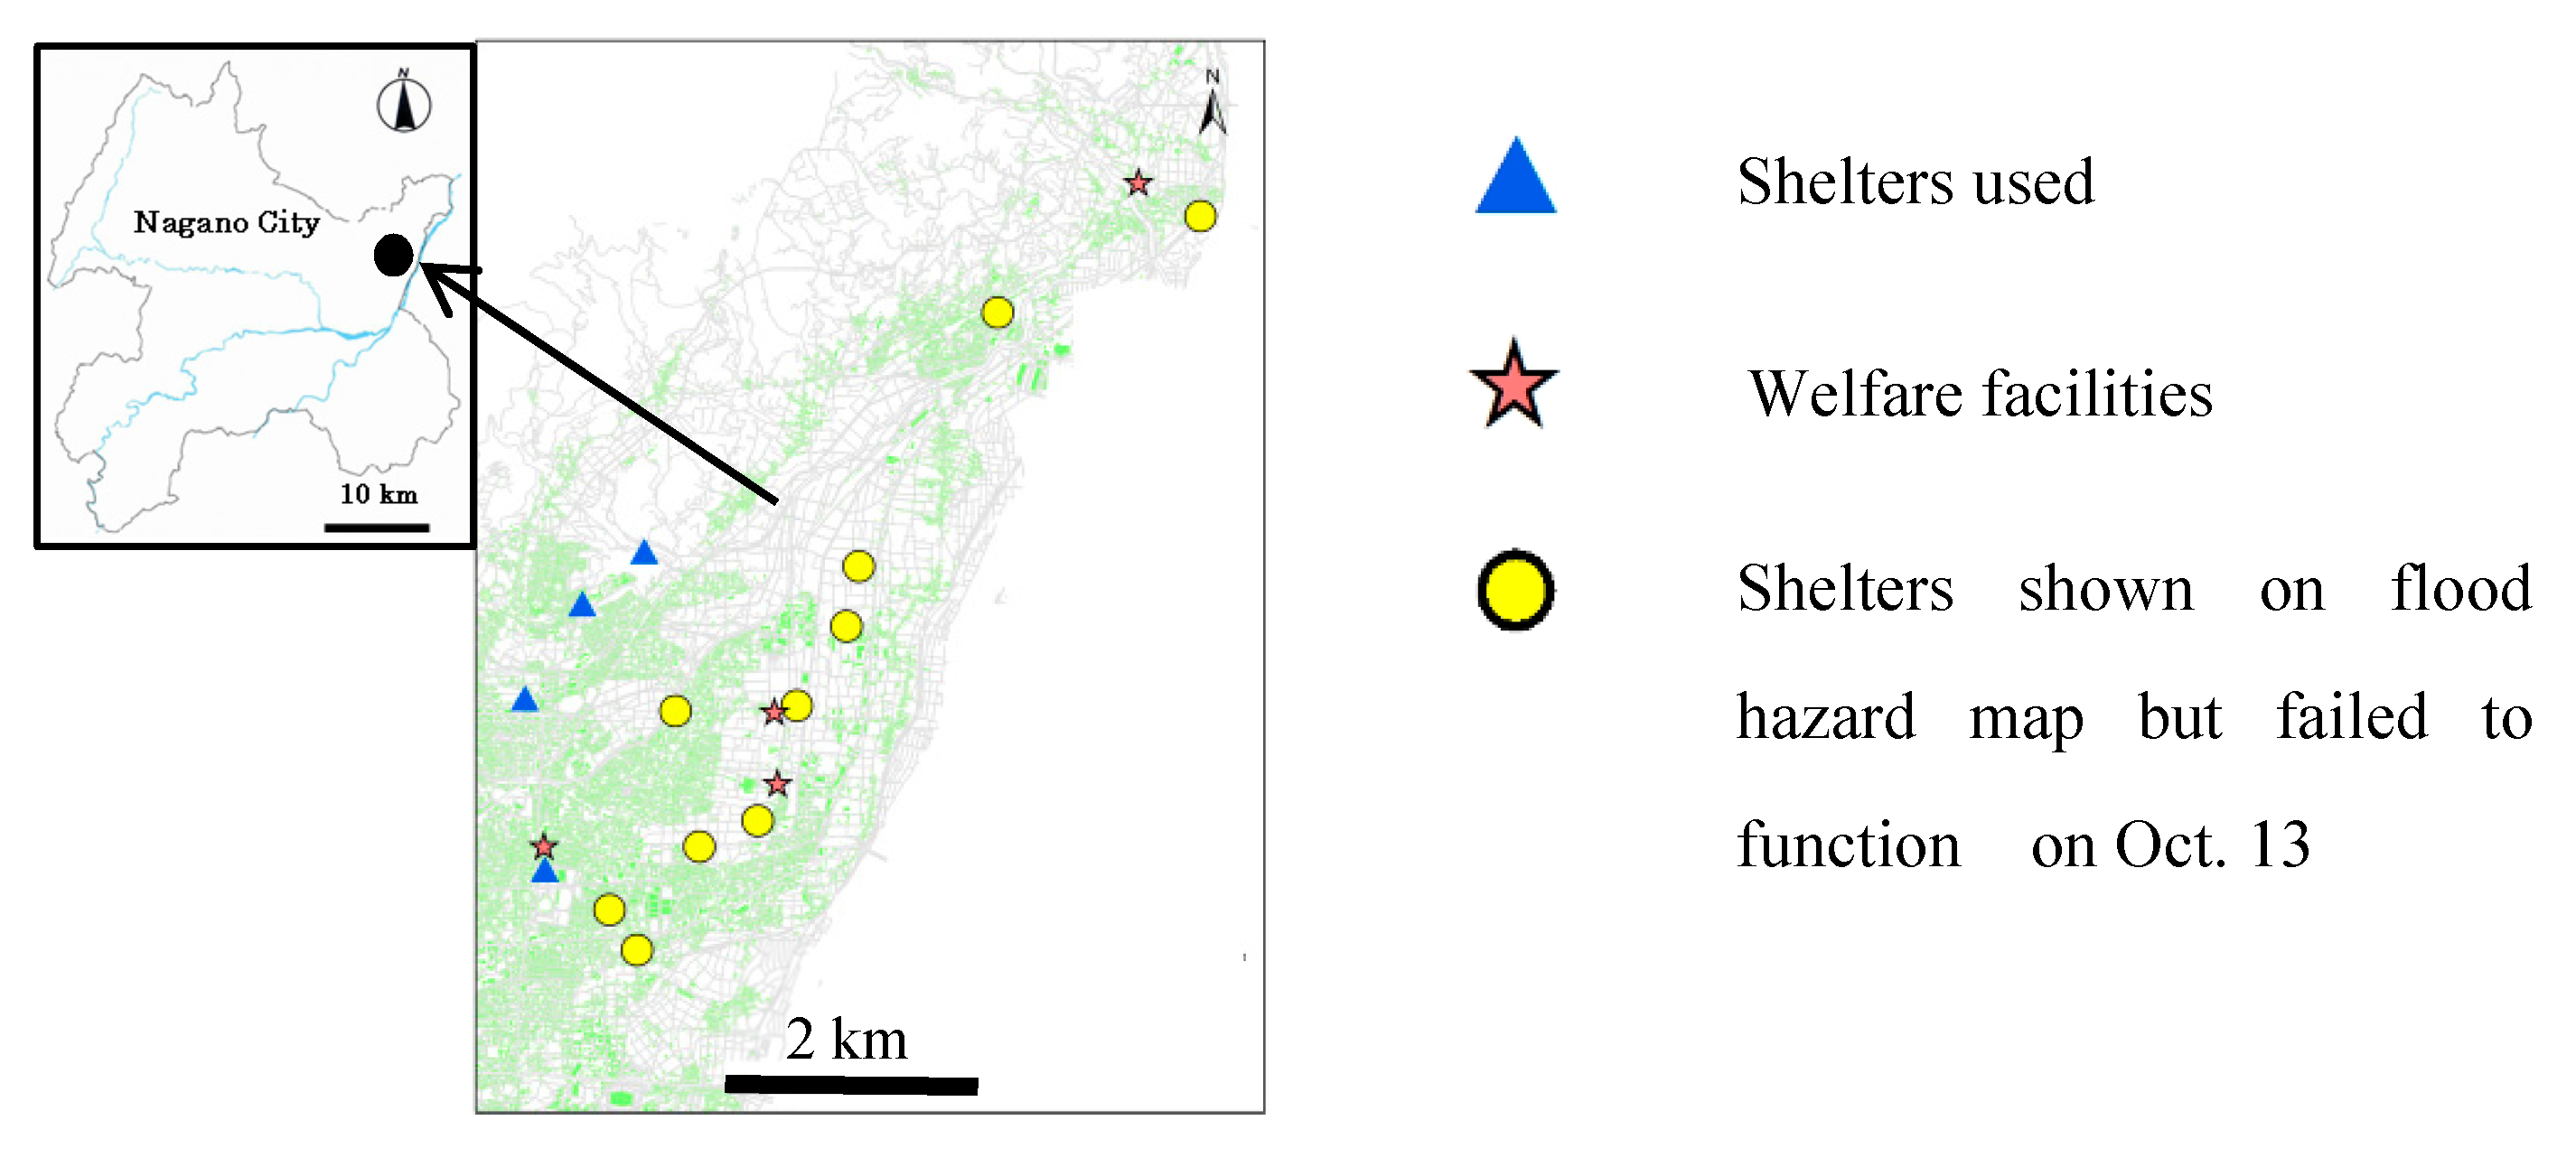
An issue in relation to evacuation is whether or not designated evacuation shelters are safe. Field surveys revealed that some shelters shown on the flood hazard map for the disaster area failed to function because they were also inundated. Shelters in Naganuma district that functioned and malfunctioned were mapped in Figure 13. As can be seen from this map, all shelters close to residential areas failed. We interviewed more than 80 residents in the Hoyasu subdistrict, and one of the questions asked was about how they evacuated. Among those who evacuated by themselves, 100% used cars for evacuation. In principle, evacuees should walk to shelters according to the guideline of evacuation set by the Japanese government. Nevertheless, the use of cars in the Hoyasu district is justifiable, given the 38.2% aging rate in the district and the distance to functioning shelters. In Suzaka City, Nagona Prefecture, which was also inundated by flood waters from the Chikuma River during the same typhoon, our interviews with local residents found that some residents evacuated to shelters on foot, and their cars left at home were damaged by flood waters, while those who relied on the cars for evacuation did not suffer car damage. This suggests that the use of cars for evacuation in non-urbanized areas with high aging rates may be given, priority, and the administration should provide residents with information about driving evacuation routes.
In Naganuma district, local residents established a Self-Governing Council in 2009 for disaster management [56]. A major duty of the council is disaster management. In 2015, it issued a 30-page long evacuation rule book for the community and distributed it to all families in the district. It contains various kinds of information from hazard maps for different disasters, evacuation routes, historical flood water depths and logistic stations. According to the evacuation rule book, the community will monitor the changes in the water level of the Chikuma River at a gauging station 6 km downstream of the district. During a flood, the time for the water to reach dangerous levels, as specified by the river authority of Japan, is estimated based on the real-time rate of water level increase at the gauging station. An evacuation warning can then be issued 4 h before a projected emergency may occur. An evacuation drill is even conducted by the Self-Governing Council every year. Such community-based emergency preparedness is unique and can be considered to be of a high level in Japan.
On 12 October 2019, the council followed their plans and issued the evacuation warning at 17:45, 15 min ahead of the warning issued by Nagano City. However, a large number of residents living within a certain distance of the river course did not evacuate as instructed. According to our interviews, one family immediately followed the warning and went to a shelter. After staying in the shelter for a few hours without receiving any update on the flood situation, they thought that flooding was not going to happen and left the shelter. Right after they returned home, flood waters hit their home and they were trapped inside until they could be rescued. Therefore, there are two lessons learned from this disaster. One is that a high level of preparedness does not guarantee a high level of emergency response. Another is that an early warning could cause evacuees to run out of patience if information is not updated in a timely manner. In light of the above information, the coping capacity of the community can also be characterized as being very high in terms of preparedness, but questionable with regard to the implementation of the emergency response plan.
4. Discussion of a New Framework
The findings of the present study revealed that susceptibility can be divided into two components: (1) susceptibility to direct life loss and injury due to a disaster event, and (2) susceptibility to non-life (or other-than-casualty) impacts of a disaster, both tangible—such as economic loss—and non-tangible—such as post-disaster health. Besides, susceptibility is not independent of coping capacity, and each of its components could be related to different aspects of coping capacity. In previous studies, although coping capacity and susceptibility were implicitly connected according to their definitions and frameworks, how the enhancement of coping capacity would affect susceptibility has not been explicitly studied. Some previously proposed frameworks even disconnected susceptibility from coping capacity.
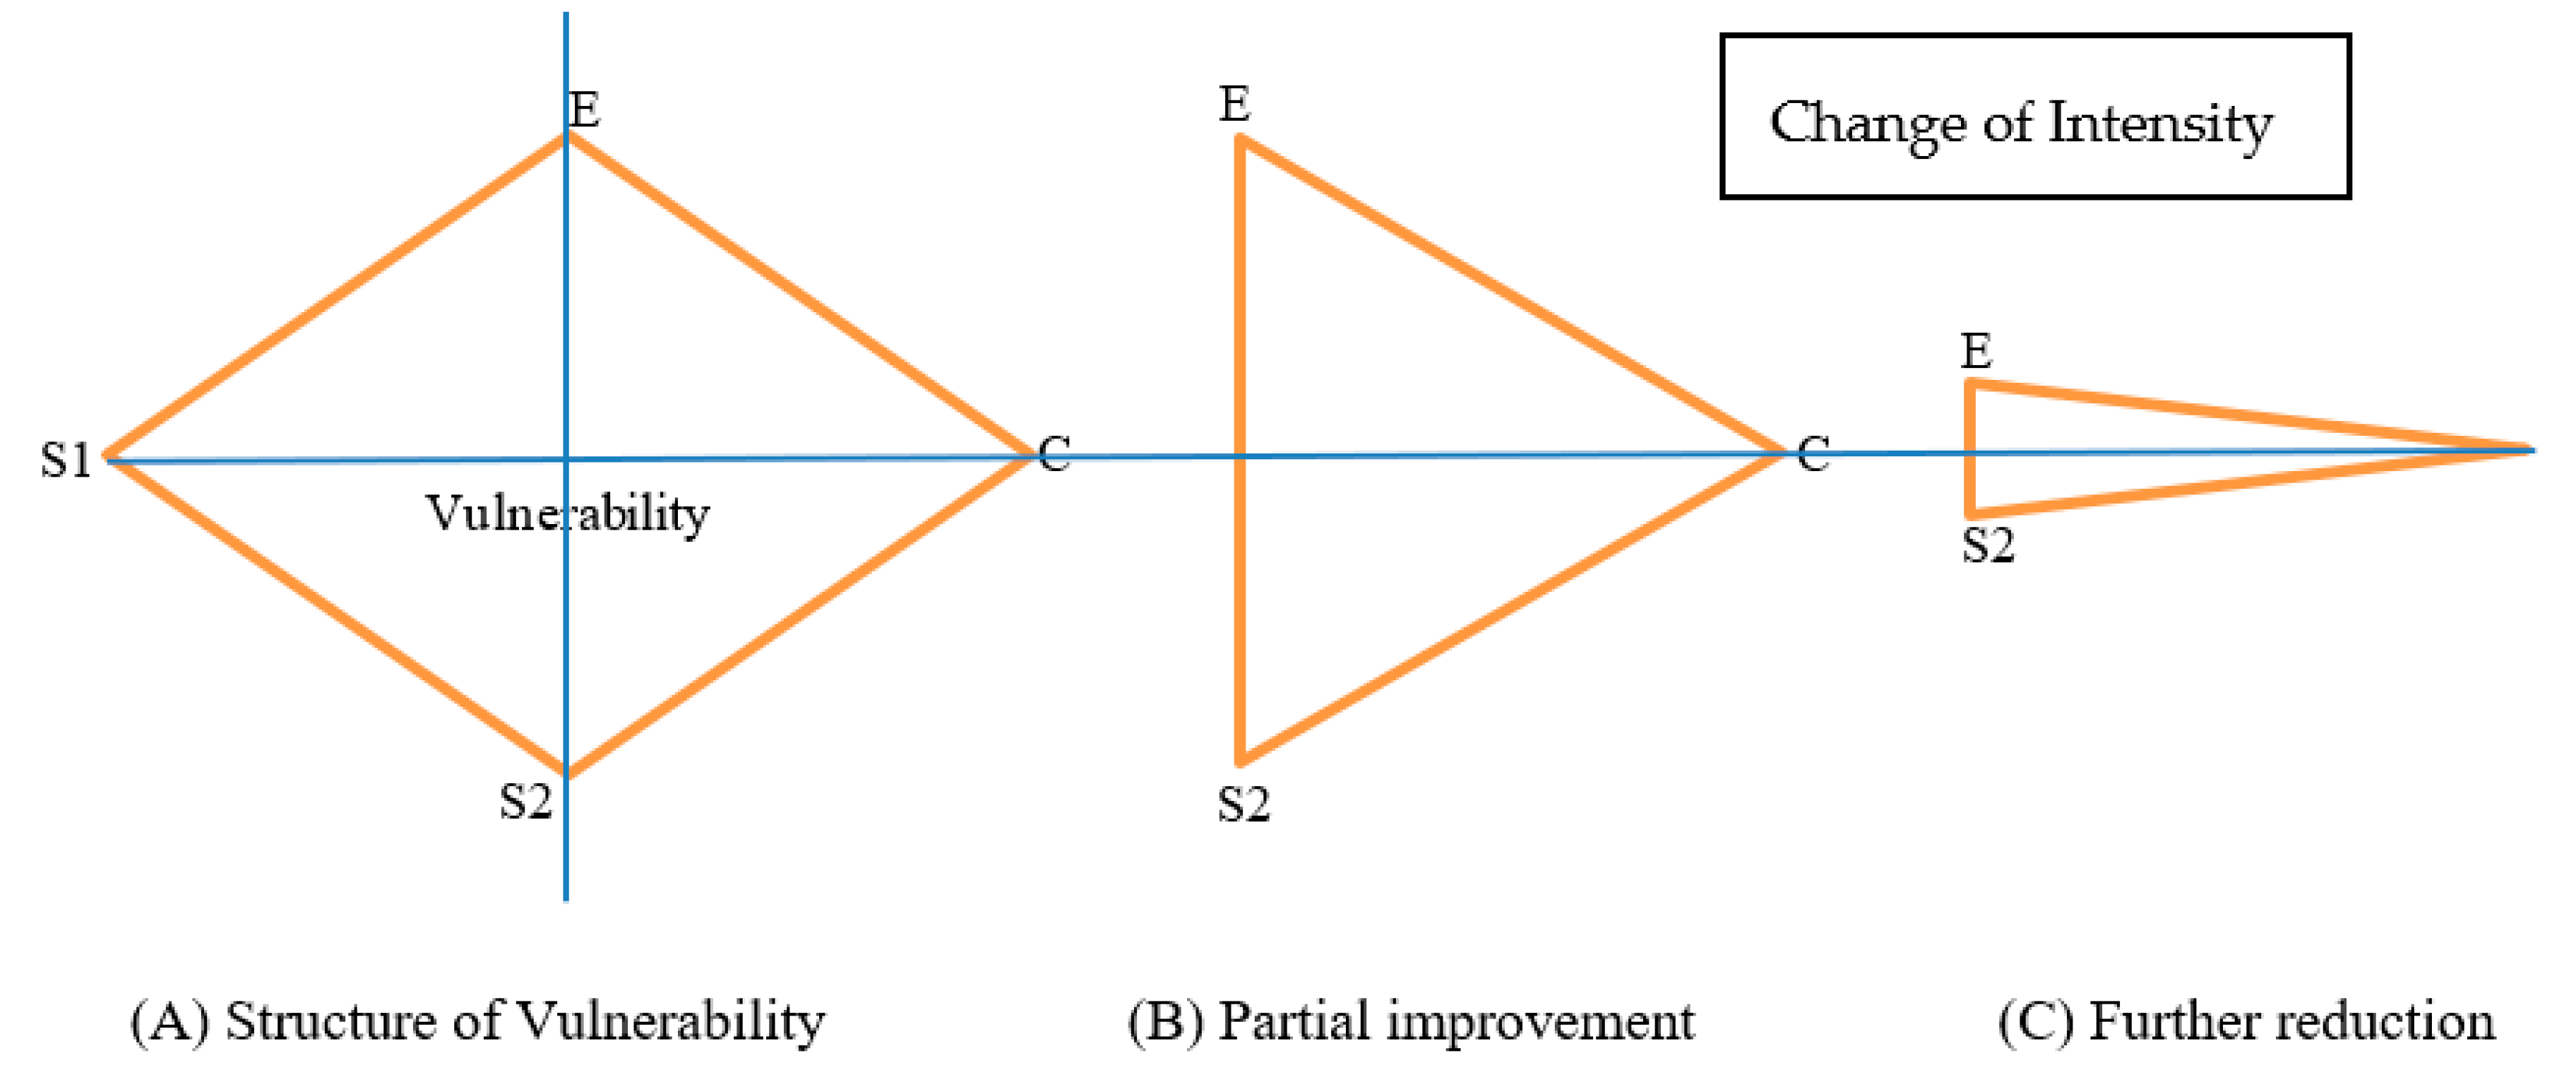
Preparedness means such as flood hazard maps and evacuation warning systems, which are part of coping capacity, may reduce flood susceptibility to life loss and injury. However, they may not directly reduce susceptibility to non-life impacts. Meanwhile, the strength for absorbing property damage and post-disaster reconstruction—promoted, for example, by insurance systems, which are also part of coping capacity—is critical to a successful rebuilding. Nevertheless, financial ability may hinder efforts to reduce the susceptibility to impacts. In the Nagano case, preparedness reduced the residents’ susceptibility to death or injury, as proven by just two fatalities in this disaster event. On the other hand, since a good insurance system guarantees the income of farmers, they have no intention to give up farming on floodplains, although they know another large flood may come at any time. As a result, the economic loss, or the susceptibility to non-life impacts of flooding, will remain high because of the high level of coping capacity. In light of the relationship between susceptibility and coping capacity identified in this study, a new conceptual vulnerability reduction framework is proposed, as shown in Figure 14.
The area of the diamond represents the level of vulnerability, and the four vertices represent Exposure (E), Coping Capacity (C), Susceptibility to direct life loss and injury (S1) and Susceptibility to non-life impacts (S2). For vulnerability management, the top priority should be the minimization of S1, ideally to zero, through enhancing coping capacity. This translates into transforming the diamond to a triangle. Then, via further coping capacity enhancement such as better land-use planning and regulation and better insurance systems, both E and S2 can be reduced, transforming a fat triangle into a thin triangle. This simple conceptual model can help decision-makers prioritize policies to effectively reduce disaster vulnerability step by step and contribute to better urban planning. It could also be used to conduct a better evaluation of disaster reduction policies by elucidating which component of susceptibility is more influenced, or whether both S1 and S2 could be simultaneously reduced. For Naganuma district, this framework placed its vulnerability status close to the B stage. Namely, it reduced S1 to a large extent, but had a limited effect on S2. To move to the C stage, new policies are required to reduce both E and S2 via coping capacity enhancement. Such an enhancement could come from a combination of river engineering work to reduce exposure and better insurance as an incentive for farmers to abandon farming on floodplains or seek crop change in order to reduce S2.
Furthermore, this conceptual framework can be expressed mathematically as
where the coefficient α reflects the effect of coping capacity management on susceptibility to non-life impacts. If α > 1, the enhancement of coping capacity is less effective in reducing vulnerability due to the negative effect on non-life-impact susceptibility.
5. Conclusions
By conducting a multifaceted analysis of a recent flooding disaster in Japan, new insights into vulnerability and its generating mechanisms were gained. Highlights of our findings are given below:
- The examination of the landform, flood hazard maps and building locations of the target area indicated that it is a highly flood-prone area and that the projected maximum inundation depth in Naganuma district could be as high as 20 m. However, many houses were constructed in relatively less dangerous locations, proving that the local community has taken certain measures to reduce the degree of susceptibility to flooding.
- The comparison between flood hazard maps and the estimated inundation depth distribution on 13 October 2019 indicated that the flood hazard map for the target area provided reliable information on high flood risk zones, although it needs further improvement to provide more accurate information of inundation depths.
- An adaptation measure taken 100 years ago has increased the financial capacity of the local community to deal with flood disasters. However, it may have heightened its susceptibility to flood hazard at the same time.
- Although the coping capacity of the community can be characterized as being financially capable because of the well-established insurance and government aid systems, it is insufficient in terms of human resources for reconstruction.
- Given that a large number of residents were rescued, not evacuated before the occurrence of the disaster, and that shelters near residential areas malfunctioned, the coping capacity of the local community can also be characterized as being very high in terms of preparedness but questionable with regard to the implementation of the emergency response plan.
- Based on our fieldwork, we concluded that the distance or proximity to a hazard can be an important determinant of the flood risk management strategy taken by a company.
- Besides, the analysis showed that Sakura levees can reduce the stress of residents, but also increase the exposure of local residents to a flood disaster. Such a culture-induced exposure deserves further study.
- The work also suggested that the enhancement of coping capacity via insurance may hinder the reduction of susceptibility to the impacts of flooding and proposed a new framework for vulnerability management.
Author Contributions
G.H. designed this study and conducted the field survey and data analysis together with J.F. J.F. conceptualized the new framework for vulnerability management. The manuscript was jointly prepared. All authors have read and agreed to the published version of the manuscript.
Funding
This research received no external funding and was supported by Sophia University, Japan.
Acknowledgments
This research was funded by Sophia University, Japan, Internal Grant, 2019. We would like to express our gratitude to the reviewers for their very constructive comments and professional advice, which greatly improved the quality of the manuscript.
Conflicts of Interest
The authors declare no conflicts of interest.
References
- Pattison, I.; Lane, S.N. The link between land-use management and fluvial flood risk: A chaotic conception? Prog. Phys. Geogr. 2012, 36, 72–92. [Google Scholar] [CrossRef] [Green Version]
- Huong, H.T.L.; Pathirana, A. Urbanization and climate change impacts on future urban flooding in Can Tho city, Vietnam. Hydrol. Earth Syst. Sci. 2013, 17, 379–394. [Google Scholar] [CrossRef] [Green Version]
- Huang, Q.; Wang, J.; Li, M.; Fei, M.; Dong, J. Modeling the influence of urbanization on urban pluvial flooding: A scenario-based case study in Shanghai, China. Nat. Hazards 2017, 87, 1035–1055. [Google Scholar] [CrossRef]
- Nigel, W.A.; Simon, N.G. The impacts of climate change on river flood risk at the global scale. Clim. Chang. 2016, 134, 387–401. [Google Scholar]
- Abdallah, S.; Rami, A.-R.; Abdullah, G.Y.; Mohsin, S.; Tarek, M.; Monzur, A.I. Effects of land cover change on urban floods and rainwater harvesting: a case study in Sharjah, UAE. Water 2018, 10, 631. [Google Scholar] [CrossRef] [Green Version]
- Miller, J.D.; Hutchins, M. The impacts of urbanisation and climate change on urban flooding and urban water quality: A review of the evidence concerning the United Kingdom. J. Hydrol. Reg. Stud. 2017, 12, 345–362. [Google Scholar] [CrossRef] [Green Version]
- Huang, G. A Comparative study on flood management in China and Japan. Water 2014, 6, 2821–2829. [Google Scholar] [CrossRef] [Green Version]
- Takei, A. Flood Control. Technology and System in Japan; JSCE: Tokyo, Japan, 1961. [Google Scholar]
- Yamamote, S. Historical Study on Modern River Works until the Overall Revision of the River Law; Japan River Association: Tokyo, Japan, 1993. [Google Scholar]
- Ueno, T. On some problems in river administration and flood control measures fitting in the twenty-first century. Annu. Disas. Prev. Res. Inst. Kyoto Univ. 2002, 45, 1–16. [Google Scholar]
- About Comprehensive Flood Risk Management Measures. Available online: https://www.mlit.go.jp/river/shinngikai_blog/past_shinngikai/gaiyou/seisaku/sougouchisui/pdf/2_1haikei_keii.pdf (accessed on 1 June 2020).
- OECD. OECD Studies in Risk Management Japan-Floods. 2006. Available online: https://www.oecd.org/japan/37378001.pdf (accessed on 1 June 2020).
- MLIT. 100 mm/h Safety Plan. 2013. Available online: https://www.mlit.go.jp/common/001011616.pdf (accessed on 1 June 2020).
- Summary of the Act on Countermeasures against Flood Damage of Specified Rivers Running across Cities. Available online: https://www.ktr.mlit.go.jp/ktr_content/content/000047029.pdf (accessed on 1 June 2020).
- Ichidate, S.; Tsuji, M.; Taki, K.; Nakamura, H. The Risk-Based Floodplain Regulation of Shiga Prefecture in Japan. E3S Web Conf. 2006, 7, 13008. [Google Scholar] [CrossRef] [Green Version]
- Available online: http://www.mlit.go.jp/toshi/common/001283640.pdf (accessed on 1 June 2020).
- Huang, G. Does a kuznets curve apply to flood fatality? A holistic study for China and Japan. Nat. Hazards 2014, 71, 2029–2042. [Google Scholar] [CrossRef]
- Ushiyama, M. Basic study on trend of victims caused by storm and flood in Japan. J. Jpn. Soc. Civil. Eng. Ser. B1 Hydraul. Eng. 2017, 73, 1369–1374. [Google Scholar] [CrossRef]
- Available online: https://www.data.jma.go.jp/obd/stats/data/bosai/report/2019/20191012/20191012.html (accessed on 15 June 2020).
- Available online: http://www.bousai.go.jp/updates/r1typhoon19/pdf/r1typhoon19_45.pdf (accessed on 1 June 2020).
- Birkmann, J. Measuring vulnerability to promote disaster-resilient societies and to enhance adaptation: Conceptual frameworks and definitions. In Measuring Vulnerability to Natural Hazards: Towards Disaster Resilient Societies; Birkmann, J., Ed.; United Nations University Press: Tokyo, Japan, 2006; pp. 9–54. [Google Scholar]
- United Nations Development Program (UNDP). Reducing Disaster Risk: A Challenge for Development. A Global Report; UNDP Bureau for Crisis Prevention: New York, NY, USA, 2004. [Google Scholar]
- Blaikie, P.; Cannon, T.; Davis, I.; Wisner, B. At Risk: Natural Hazards, Peoples’s Vulnerability, and Disaster, 1st ed.; Routledge: London, UK, 1994. [Google Scholar]
- Turner, B.L.; Kasperson, R.E.; Matson, P.A.; McCarthy, J.J.; Corell, R.W.; Christensen, L.; Eckley, N.; Kasperson, J.X.; Luers, A.; Martello, M.L.; et al. A framework for vulnerability analysis in sustainability science. PNAS 2003, 100, 1–6. [Google Scholar]
- Balica, S.F.; Wright, N.G.; van der Meulen, F. A flood vulnerability index for coastal cities and its use in assessing climate change impacts. Nat. Hazards 2012, 64, 73–105. [Google Scholar] [CrossRef] [Green Version]
- Adger, W.N. Vulnerability. Glob. Environ. Chang. 2006, 16, 268–281. [Google Scholar] [CrossRef]
- Available online: https://www.eorc.jaxa.jp/ALOS/en/aw3d30/index.html (accessed on 1 May 2020).
- Publishing Department of the Shinano Mainichi Shimbun. Walking through the Chikuma River flood in the Second Year of Kanho Era; The Shinano Mainichi Shimbun: Nagano, Japan, 2002. [Google Scholar]
- Available online: https://www.gsi.go.jp/bousaichiri/fc_index.html (accessed on 1 May 2020).
- Available online: https://www.city.nagano.nagano.jp/soshiki/kikibousai/2570.html (accessed on 10 June 2020).
- Available online: https://www.gsi.go.jp/BOUSAI/R1.taihuu19gou.html (accessed on 10 June 2020).
- Available online: https://fgd.gsi.go.jp/download/mapGis.php (accessed on 1 May 2020).
- Nagano City. Minutes for Naganuma District Citizens’ Council. 7 October 2006. Available online: https://www.city.nagano.nagano.jp/site/midorinoteble/81224.html (accessed on 1 June 2020).
- Botzen, W.; Aerts, J.; Van Den Bergh, J. Dependence of flood risk perceptions on socioeconomic and objective risk factors. Water Resour. Res. 2009, 45. [Google Scholar] [CrossRef] [Green Version]
- Zhang, Y.; Hwang, S.N.; Lindell, M.K. Hazard proximity or risk perception? Evaluating effects of natural and technological hazards on housing values. Environ. Behav. 2010, 42, 597–624. [Google Scholar] [CrossRef]
- Available online: https://www.mlit.go.jp/report/press/toshi05_hh_000271.html (accessed on 1 June 2020).
- Available online: https://www.hec.usace.army.mil/software/hec-ras/documentation.aspx (accessed on 15 April 2020).
- Chow, V.T. Open Channel Hydraulics; McGraw-Hill: New York, NY, USA, 1959. [Google Scholar]
- Aberle, J.; Järvelä, J. Flow resistance of emergent rigid and flexible floodplain vegetation. J. Hydraul. Res. 2013, 51, 33–45. [Google Scholar] [CrossRef]
- Takuya, U.; Keiichi, K.; Kohji, M. Experimental and numerical study on hydrodynamics of riparian vegetation. J. Hydrodyn. 2014, 26, 796–806. [Google Scholar]
- Wang, C.; Zheng, S.; Wang, P.; Hou, J. Interactions between vegetation, water flow and sediment transport: A review. J. Hydrodyn. 2015, 27, 24–37. [Google Scholar] [CrossRef]
- Wu, F.; Shen, H.; Chou, Y. Variation of roughness coefficient for unsubmerged and submerged vegetation. J. Hydraul. Eng. 1999, 125, 934–942. [Google Scholar] [CrossRef] [Green Version]
- Thomas, H.; Nisbet, T.R. An assessment of the impact of floodplain woodland on flood flows. Water Environ. J. 2006, 21, 114–126. [Google Scholar] [CrossRef]
- Shimizu, Y.; Kobatake, S.; Ezaki, K.; Motegi, K. Experimental Study on Characteristics of Flood Wave Propagation in a Vegetated Channel. Proc. Hydraul. Eng. JSCE 1996, 40, 1141–1144. [Google Scholar] [CrossRef]
- Kiss, T.; Nagy, J.; Fehérváry, I.; Vaszkó, C. (Mis) management of floodplain vegetation: The effect of invasive species on vegetation roughness and flood levels. Sci. Total. Environ. 2019, 686, 931–945. [Google Scholar] [CrossRef] [PubMed]
- Rufat, S.; Tate, E.; Burton, C.G.; Maroof, A.S. Social vulnerability to floods: Review of case studies and implications for measurement. Int. J. Disaster Risk Reduct. 2015, 14, 470–486. [Google Scholar] [CrossRef] [Green Version]
- Abe, S.; Watanabe, Y.; Hasegawa, K. Flood damage to bridges on Saru River from Typhoon Etau (Typhoon No. 10), 2003. Adv. River Eng. JSCE 2005, 11, 109–114. [Google Scholar]
- Ishino, K.; Ueda, S.; Tamai, N. Study on the causes of collapsed bridges during the disaster in Fukui 2004.7 and investigation on extending life of bridge. Adv. River Eng. JSCE 2005, 11, 157–162. [Google Scholar]
- Abernethy, B.; Rutherfurd, I.D. The effect of riparian tree roots on the mass-stability of riverbanks. Earth Surf. Process. Landf. 2000, 25, 921–937. [Google Scholar] [CrossRef]
- NOSAI. Available online: http://nosai.or.jp/ (accessed on 1 June 2020).
- Income Insurance. Available online: http://nosai-zenkokuren.or.jp/insurance.html (accessed on 1 June 2020).
- JA Kyosai. Available online: https://shiryo.ja-kyosai.or.jp/index.html (accessed on 1 June 2020).
- About the Extreme Disaster Act. Available online: http://www.bousai.go.jp/taisaku/pdf/seido.pdf (accessed on 1 June 2020).
- Cabinet Office. Available online: http://www.bousai.go.jp/taisaku/minaoshi/housei_minaoshi.html (accessed on 1 June 2020).
- Available online: https://www.jma.go.jp/jma/kishou/know/bosai/flood.html (accessed on 1 June 2020).
- Available online: https://www.naganuma-ju.com/ (accessed on 1 June 2020).
Figure 1.
Promotion of resettlement (modified based on [16]).
Figure 1.
Promotion of resettlement (modified based on [16]).

Figure 2.
Watershed of the Chikuma River.

Figure 3.
Historical flood water depths at a temple near the breaching site.

Figure 4.
Main landform features of the Naganuma district at present and half a century ago.

Figure 5.
Flood hazard map of the Naganuma district [30].
Figure 5.
Flood hazard map of the Naganuma district [30].

Figure 6.
Estimated inundation depth distribution on 13 October2019 [31] and flood marks obtained from the field survey.
Figure 6.
Estimated inundation depth distribution on 13 October2019 [31] and flood marks obtained from the field survey.

Figure 7.
Distribution of buildings in the inundated area and the percentage in different elevation zones.
Figure 7.
Distribution of buildings in the inundated area and the percentage in different elevation zones.

Figure 8.
The position of JR railyard in relation to the Chikuma River and the Asakawa River, and flood protection measures around the facility.
Figure 8.
The position of JR railyard in relation to the Chikuma River and the Asakawa River, and flood protection measures around the facility.

Figure 9.
Water level variations at Kuiseke and Tategahana stations during the flood.

Figure 10.
Channel width change along the Chikuma River.

Figure 11.
Apple trees on the floodplains of the Chikuma River.

Figure 12.
The levee structure in the Naganuma district.

Figure 13.
Shelters that failed to function on 13 October 2019.

Figure 14.
New framework for vulnerability management.


Table 1.
Flood warning system of Japan.
| Warning Level | Evacuation Information | Meteorological Information | Advised Action |
|---|---|---|---|
| 1 | Early advisory | Be in a state of readiness | |
| 2 | Heavy rain/flooding advisory | Verify evacuation routes | |
| 3 | Evacuation preparation | Heavy rain/flooding warning | Evacuate elderly and other persons requiring assistance |
| 4 | Evacuation orders/advisories | Landslide warning | Full evacuation |
| 5 | Disaster-level | Heavy rain emergency warning | Take optimal measures to save lives |
© 2020 by the authors. Licensee MDPI, Basel, Switzerland. This article is an open access article distributed under the terms and conditions of the Creative Commons Attribution (CC BY) license (http://creativecommons.org/licenses/by/4.0/).
Share and Cite
MDPI and ACS Style
Fan, J.; Huang, G. Evaluation of Flood Risk Management in Japan through a Recent Case. Sustainability 2020, 12, 5357. https://doi.org/10.3390/su12135357
AMA Style
Fan J, Huang G. Evaluation of Flood Risk Management in Japan through a Recent Case. Sustainability. 2020; 12(13):5357. https://doi.org/10.3390/su12135357
Chicago/Turabian StyleFan, Juan, and Guangwei Huang. 2020. "Evaluation of Flood Risk Management in Japan through a Recent Case" Sustainability 12, no. 13: 5357. https://doi.org/10.3390/su12135357
Note that from the first issue of 2016, this journal uses article numbers instead of page numbers. See further details here.