Assessment of Cancer Care Costs in Disease-Specific Cancer Care Pathways


 ,
,
Abstract
:1. Introduction
- (a)
- developing indicators of the value of cancer care at the population level, as defined according to the three-fold definition proposed by Gray et al. (allocative value, technical value, personalized value) [17];
- (b)
- developing a strategy for combining health data from multiple sources in order to identify areas of waste of resources;
- (c)
- developing a procedure to calculate the costs along the whole care pathways;
- (d)
- developing indicators for benchmarking initiatives in order to identify unwarranted variations [18]; and
- (e)
2. Materials and Methods
2.1. Setting: The Romagna Cancer Care Network
2.2. Rationale: The Disease-Specific Cancer Care Workgroups and Pathways
2.3. Study Objectives
2.4. Study Design
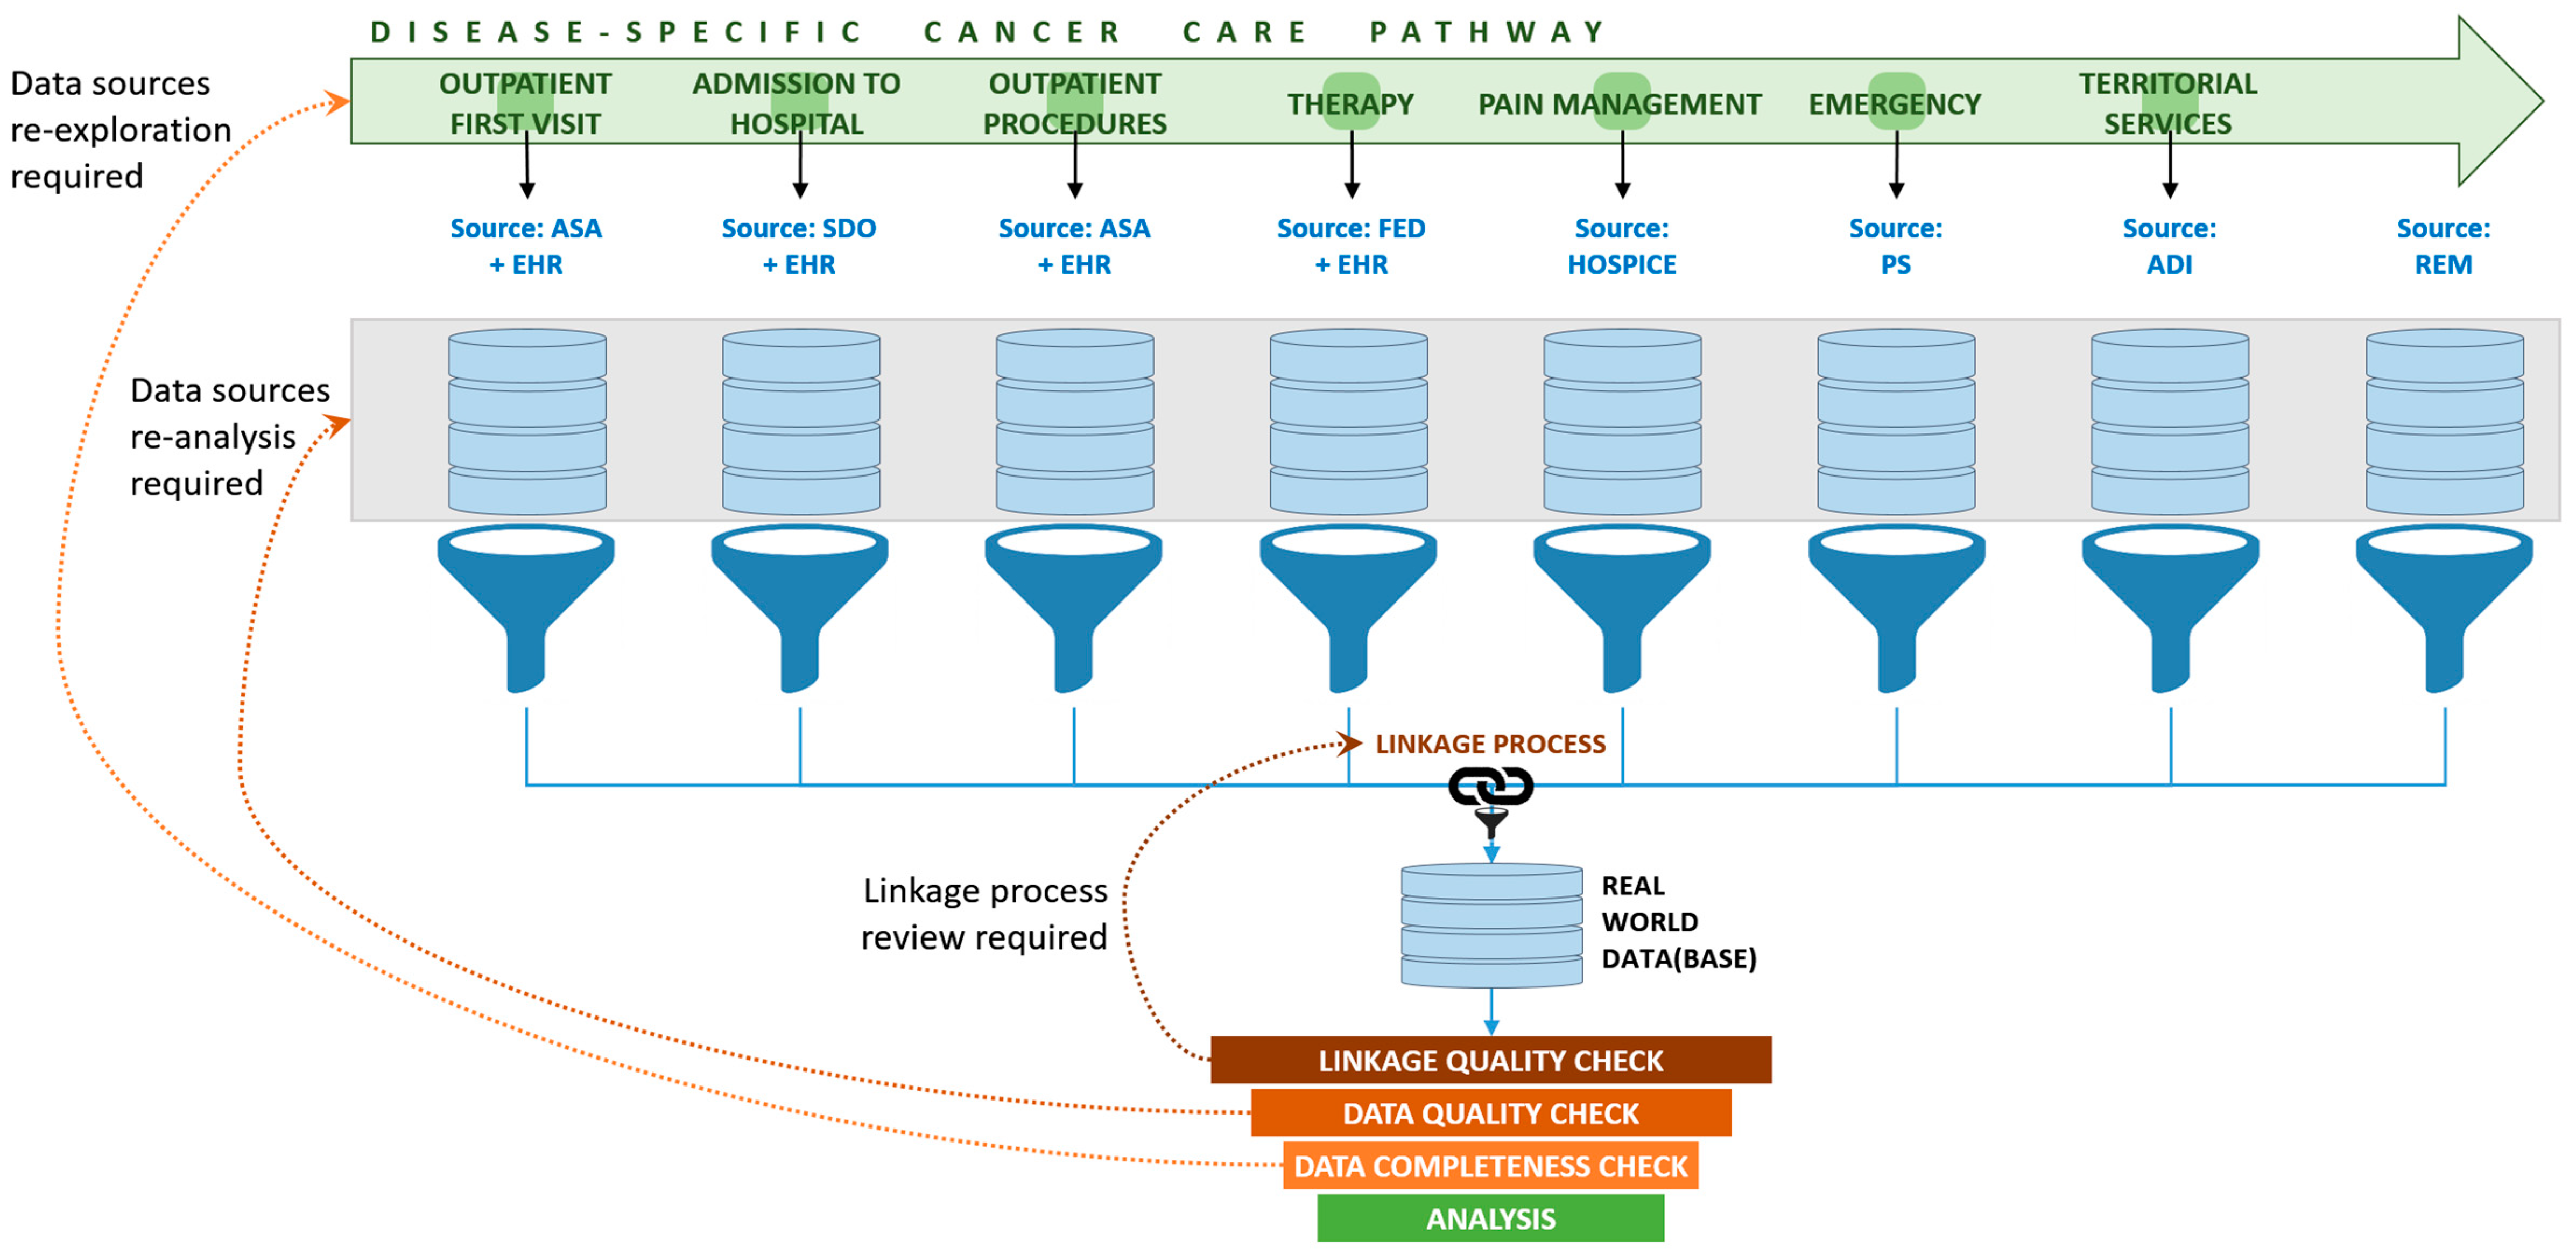
2.5. Data Sources
- (a)
- the hospital discharge database, from which we extracted information about any discharge of residents of the Emilia-Romagna Region from any public and accredited private hospital in Italy, including the start date and the end date of hospitalization, the principal diagnosis, the procedures and services provided (coded according to the ICD-O 10), and their cost;
- (b)
- the outpatient specialist assistance database, containing individual information of all outpatient specialist visits, clinical tests and procedures (coded according to a local extension of the International Classification of Diseases), and their cost in € according to the Emilia-Romagna regional tariffs [28];
- (c)
- the hospice admission database, containing the main information about any single hospice admission;
- (d)
- the home care database, containing the main information about the utilization (visits and days) of home care services;
- (e)
- the emergency database, containing information about any single emergency admission, including date, procedures, diagnosis and cost;
- (f)
- the drugs databases, containing information on all drug expenditures (aggregate information about the drugs used in different settings) and high-cost drugs administration (specifications of any single high-cost drug administration). Drugs are coded according to the Anatomical Therapeutic Chemical Classification System [29].
2.6. Data Analysis
3. Results
4. Discussion
5. Conclusions
Author Contributions
Funding
Acknowledgments
Conflicts of Interest
Data Availability
References
- Karim-Kos, H.E.; De Vries, E.; Soerjomataram, I.; Lemmens, V.; Siesling, S.; Coebergh, J.W.W. Recent trends of cancer in Europe: A combined approach of incidence, survival and mortality for 17 cancer sites since the 1990s. Eur. J. Cancer 2008, 44, 1345–1389. [Google Scholar] [CrossRef] [PubMed]
- De Angelis, R.; Sant, M.; Coleman, M.P.; Francisci, S.; Baili, P.; Pierannunzio, D.; Trama, A.; Visser, O.; Brenner, H.; Ardanaz, E.; et al. Cancer survival in Europe 1999–2007 by country and age: Results of EUROCARE-5—A population-based study. Lancet Oncol. 2014, 15, 23–34. [Google Scholar] [CrossRef]
- Global Burden of Disease Cancer Collaboration; Fitzmaurice, C.; Allen, C.; Barber, R.M.; Barregard, L.; Bhutta, Z.A.; Brenner, H.; Dicker, D.J.; Chimed-Orchir, O.; Dandona, R.; et al. Global, Regional, and National Cancer Incidence, Mortality, Years of Life Lost, Years Lived With Disability, and Disability-Adjusted Life-years for 32 Cancer Groups, 1990 to 2015. JAMA Oncol. 2017, 3, 524–548. [Google Scholar] [CrossRef]
- Roth, G.; Abate, D.; Abate, K.H.; Abay, S.M.; Abbafati, C.; Abbasi, N.; Abbastabar, H.; Abd-Allah, F.; Abdela, J.; Abdelalim, A.; et al. Global, regional, and national age-sex-specific mortality for 282 causes of death in 195 countries and territories, 1980–2017: A systematic analysis for the Global Burden of Disease Study 2017. Lancet 2018, 392, 1736–1788. [Google Scholar] [CrossRef] [Green Version]
- Lee, J.A.; Roehrig, C.S.; Butto, E.D. Cancer care cost trends in the United States: 1998 to 2012. Cancer 2016, 122, 1078–1084. [Google Scholar] [CrossRef] [Green Version]
- Jönsson, B.; Hofmarcher, T.; Lindgren, P.; Wilking, N. The cost and burden of cancer in the European Union 1995–2014. Eur. J. Cancer. 2016, 66, 162–170. [Google Scholar] [CrossRef]
- Jakovljevic, M.; Malmose-Stapelfeldt, C.; Milovanovic, O.; Rančić, N.K.; Bokonjic, D. Disability, Work Absenteeism, Sickness Benefits, and Cancer in Selected European OECD Countries—Forecasts to 2020. Front. Public Health 2017, 5, 23. [Google Scholar] [CrossRef] [Green Version]
- Atkin, W.; Wooldrage, K.; Brenner, A.; Martin, J.; Shah, U.; Perera, S.; Lucas, F.; Brown, J.; Kralj-Hans, I.; Greliak, P.; et al. Adenoma surveillance and colorectal cancer incidence: A retrospective, multicentre, cohort study. Lancet Oncol. 2017, 18, 823–834. [Google Scholar] [CrossRef] [Green Version]
- AIRTUM Working Group. Italian cancer figures, report 2009: Cancer trend (1998–2005). Epidemiol. Prev. 2009, 33, 1–168. [Google Scholar]
- Given, L.S.; Hohman, K.; Graaf, L.; Rochester, P.; Belle-Isle, L. From planning to implementation to outcomes: Comprehensive cancer control implementation building blocks. Cancer Causes Control. 2010, 21, 1987–1994. [Google Scholar] [CrossRef]
- Rochester, P.W.; Townsend, J.S.; Given, L.; Krebill, H.; Balderrama, S.; Vinson, C.A. Comprehensive cancer control: Progress and accomplishments. Cancer Causes Control. 2010, 21, 1967–1977. [Google Scholar] [CrossRef] [PubMed]
- Corrigan, P. Can the NHS cut costs without substantially damaging the quality of health care? Yes. BMJ 2010, 340, c1999. [Google Scholar] [CrossRef] [PubMed]
- Trogdon, J.G.; Tangka, F.K.L.; Ekwueme, N.U.; Guy, G.P.; Nwaise, I.; Orenstein, D. State-level projections of cancer-related medical care costs: 2010 to 2020. Am. J. Manag. Care 2012, 18, 525–532. [Google Scholar] [PubMed]
- Bruno, R.; Zuccaro, V.; Pinto, C.; Puoti, M.; Gaeta, G.B.; Pagani, A.; Taliani, G.; Baldanti, F.; Cinieri, S.; Pedrazzoli, P. Management of hepatitis C positive patients undergoing active treatment for malignancies: A position paper from the Associazione Italiana di Oncologia Medica (AIOM) and the Società Italiana di Malattie Infettive e Tropicali (SIMIT). Semin. Oncol. 2018, 45, 259–263. [Google Scholar] [CrossRef] [Green Version]
- Adesoye, T.; Greenberg, C.C.; Neuman, H.B. Optimizing Cancer Care Delivery through Implementation Science. Front. Oncol. 2016, 6, 1. [Google Scholar] [CrossRef] [PubMed] [Green Version]
- Massa, I.; Balzi, W.; Burattini, C.; Gentili, N.; Bucchi, L.; Nanni, O.; Gallegati, D.; Pierini, A.; Amadori, D.; Falcini, F.; et al. The challenge of sustainability in healthcare systems: Frequency and cost of inappropriate patterns of breast cancer care (the E.Pic.A study). Breast 2017, 34, 103–107. [Google Scholar] [CrossRef] [Green Version]
- Gray, M.; Wells, G.; Lagerberg, T. Optimising allocative value for populations. J. R. Soc. Med. 2017, 110, 138–143. [Google Scholar] [CrossRef] [Green Version]
- Mokdad, A.H.; Dwyer-Lindgren, L.; Fitzmaurice, C.; Stubbs, R.W.; Bertozzi-Villa, A.; Morozoff, C.; Charara, R.; Allen, C.; Naghavi, M.; Murray, C.J.L. Trends and Patterns of Disparities in Cancer Mortality Among US Counties, 1980–2014. JAMA 2017, 317, 388–406. [Google Scholar] [CrossRef] [Green Version]
- Personal Finance Research Centre, University of Bristol: The Financial Impacts of Cancer. Final Report. 2013. Available online: https://www.bristol.ac.uk/media-library/sites/geography/pfrc/pfrc1210-financial-impacts-of-cancer-report.pdf (accessed on 4 June 2020).
- Drummond, M.F.; Schulper, M.J.; Claxton, K.; Stoddart, G.L.; Torrance, G.W. Methods for the Economic Evaluation of Health Care Programmes, 4th ed.; Oxford University Press: Oxford, UK, 2015; pp. 5–22. [Google Scholar]
- Jönsson, B.; Hofmarcher, T.; Lindgren, P.; Wilking, N. Comparator Report on Patient Access to Cancer Medicines in Europe Revisited; Institute for Health Economics Report 2016:4; Institute for Health Economics: Lund, Sweden, 2016. [Google Scholar]
- Ancarani, V.; Bernabini, M.; Zani, C.; Altini, M.; Amadori, D. The Comprehensive Cancer Care Network of Romagna: The Opportunities Generated by the OECI Accreditation Program. Tumori. J. 2015, 101, S55–S59. [Google Scholar] [CrossRef]
- AIRTUM Working Group. Italian cancer figures, report 2014: Prevalence and cure of cancer in Italy. Epidemiol. Prev. 2014, 38, 1–122. [Google Scholar] [CrossRef]
- World Health Organization. International Classification of Diseases for Oncology; 10th Revision; World Health Organization: Geneva, Switzerland, 1990. [Google Scholar]
- Schrijvers, A.J.; Van Hoorn, A.; Huiskes, N. The Care Pathway Concept: Concepts and theories: An introduction. Int. J. Integr. Care 2012, 12. [Google Scholar] [CrossRef] [PubMed]
- Cancer Council Australia. Optimal Cancer Care Pathways. Available online: http://www.cancer.org.au/health-professionals/optimal-cancer-care-pathways.html (accessed on 4 June 2020).
- Mauskopf, J. Prevalence-Based Economic Evaluation. Value Health 1998, 1, 251–259. [Google Scholar] [CrossRef] [PubMed] [Green Version]
- Regione Emilia-Romagna. Tariffe DRG. Allegato 3 DGR 1673/2014. Available online: http://salute.regione.emilia-romagna.it/siseps/sanita/sdo/files/allegato_3_TARIFFE_DRG.xls/view (accessed on 4 June 2020).
- World Health Organization. Anatomical Therapeutic Chemical Classification System with Defined Daily Doses (ATC/DDD). Available online: http://www.who.int/classifications/atcddd/en/ (accessed on 4 June 2020).
- ISTAT. Il Sistema dei Conti Della Sanità per L’Italia (2018). Available online: https://www.istat.it/it/files/2017/07/CS-Sistema-dei-conti-della-sanit%C3%A0-anni-2012-2016.pdf?title=Conti+della+sanit%C3%A0+-+04%2Flug%2F2017+-+Testo+integrale.pdf (accessed on 4 June 2020).
- Luengo-Fernandez, R.; Leal, J.; Gray, A.; Sullivan, R. Economic burden of cancer across the European Union: A population-based cost analysis. Lancet Oncol. 2013, 14, 1165–1174. [Google Scholar] [CrossRef]
- Defourny, N.; Dunscombe, P.; Grau, C.; Perrier, L.; Lievens, Y. Cost evaluations of radiotherapy: What do we know? An ESTRO-HERO analysis. Radiother. Oncol. 2016, 121, 468–474. [Google Scholar] [CrossRef]
- Lopes, J.M.; Rocha-Gonçalves, F.; Borges, M.; Redondo, P.; Laranja-Pontes, J. The cost of cancer treatment in Portugal. Ecancermedicalscience 2017, 11, 765. [Google Scholar] [CrossRef] [PubMed] [Green Version]
- Burns, R.; Leal, J.; Sullivan, R.; Luengo-Fernandez, R. Economic burden of malignant blood disorders across Europe: A population-based cost analysis. Lancet Haematol. 2016, 3, e362–e370. [Google Scholar] [CrossRef]
- Green, A.R.; Bron, M.; Chomienne, C.; De Wit, T.D.; De Haas, F.; Engert, A.; Hagenbeek, A.; Jäger, U.; MacIntyre, E.; Muckenthaler, M.U.; et al. Costs of haematological disease high and rising. Lancet Haematol. 2016, 3, e353–e354. [Google Scholar] [CrossRef]
- Dagovic, A.; Walstra, K.M.; Gutzwiller, F.S.; Djordjevic, N.; Rankovic, A.; Djordjevic, G.; Sanja, K.; Dragan, V.; Canovic, P.; Aleksandra, K.; et al. Resource use and costs of newly diagnosed cancer initial medical care. Eur. J. Oncol. 2014, 19, 166–184. [Google Scholar]
- Jakovljevic, M.B. Oncology monoclonal antibodies expenditure trends and reimbursement projections in the emerging Balkan market. Farmeconomia Health Econ. Ther. Pathways 2014, 15, 27–32. [Google Scholar] [CrossRef]
- Mayor, S. Differences in availability of cancer drugs across Europe. Lancet Oncol. 2016, 17, 1196. [Google Scholar] [CrossRef]
- Nanni, O.; Amadori, D.; Lugaresi, C.; Falcini, F.; Scarpi, E.; Saragoni, A.; Buiatti, E. Chronic lymphocytic leukaemias and non-Hodgkin’s lymphomas by histological type in farming-animal breeding workers: A population case-control study based on a priori exposure matrices. Occup. Environ. Med. 1996, 53, 652–657. [Google Scholar] [CrossRef] [PubMed]
- Jansman, F.G.; Postma, M.J.; Brouwers, J.R.; Jansman, F.G.A. Cost Considerations in the Treatment of Colorectal Cancer. Pharmacoeconomics 2007, 25, 537–562. [Google Scholar] [CrossRef] [PubMed]
- Radice, D.; Redaelli, A. Breast Cancer Management. PharmacoEconomics 2003, 21, 383–396. [Google Scholar] [CrossRef] [PubMed]
- Jakovljevic, M.; Zugic, A.; Rankovic, A.; Dagovic, A. Radiation therapy remains the key cost driver of oncology inpatient treatment. J. Med. Econ. 2014, 18, 29–36. [Google Scholar] [CrossRef]
- Houssami, N.; Sainsbury, J.R. Breast cancer: Multidisciplinary care and clinical outcomes. Eur. J. Cancer 2006, 42, 2480–2491. [Google Scholar] [CrossRef]
- Ruhstaller, T.; Roe, H.; Thürlimann, B.; Nicoll, J.J. The multidisciplinary meeting: An indispensable aid to communication between different specialities. Eur. J. Cancer 2006, 42, 2459–2462. [Google Scholar] [CrossRef]
- Kane, B.; Luz, S.; O’Briain, D.S.; McDermott, R. Multidisciplinary team meetings and their impact on workflow in radiology and pathology departments. BMC Med. 2007, 5, 15. [Google Scholar] [CrossRef] [PubMed] [Green Version]
- Hong, N.J.L.; Wright, F.C.; Gagliardi, A.; Brown, P.; Dobrow, M.J. Multidisciplinary cancer conferences: Exploring the attitudes of cancer care providers and administrators. J. Interprof. Care 2009, 23, 599–610. [Google Scholar] [CrossRef] [PubMed]
- Álvarez, L.G.; Aylin, P.; Tian, J.; King, C.; Catchpole, M.; Hassall, S.; Whittaker-Axon, K.; Holmes, A. Data linkage between existing healthcare databases to support hospital epidemiology. J. Hosp. Infect. 2011, 79, 231–235. [Google Scholar] [CrossRef]
- Balia, S.; Brau, R.; Marrocu, E. What drives patient mobility across Italian regions? Evidence from hospital discharge data. Dev. Health Econ. Public Policy 2014, 12, 133–154. [Google Scholar] [CrossRef] [PubMed] [Green Version]
- Corbellini, C.; Andreoni, B.; Ansaloni, L.; Sgroi, G.; Martinotti, M.; Scandroglio, I.; Carzaniga, P.; Longoni, M.; Foschi, D.; Dionigi, P.; et al. Reliability and validity assessment of administrative databases in measuring the quality of rectal cancer management. Tumori J. 2018, 104, 51–59. [Google Scholar] [CrossRef] [PubMed] [Green Version]


| Disease Group | Number of Patients | Total Cost | Cost per Patient (€) | Cost Per Capita (€) | Percent Share of Total Health Expenditure a | |
|---|---|---|---|---|---|---|
| Amount (€) | Percent Distribution | |||||
| Blood cancer | 2943 | 21,619,772 | 26.6 | 7346.17 | 54.50 | 2.9 |
| Gastrointestinal cancer | 1849 | 16,830,382 | 20.7 | 9102.27 | 42.43 | 2.3 |
| Breast cancer | 2759 | 13,482,037 | 16.6 | 4886.12 | 33.99 | 1.8 |
| Uro-gynecologic cancer | 1457 | 12,443,182 | 15.3 | 8539.29 | 31.37 | 1.7 |
| Thorax cancer | 600 | 9,105,226 | 11.2 | 15,165.62 | 22.95 | 1.2 |
| Rare cancers and others | 877 | 7,689,522 | 9.5 | 8771.26 | 19.38 | 1.0 |
| All | 10,486 | 81,170,121 | 100.0 | 7741.17 | 204.62 | 11.1 |
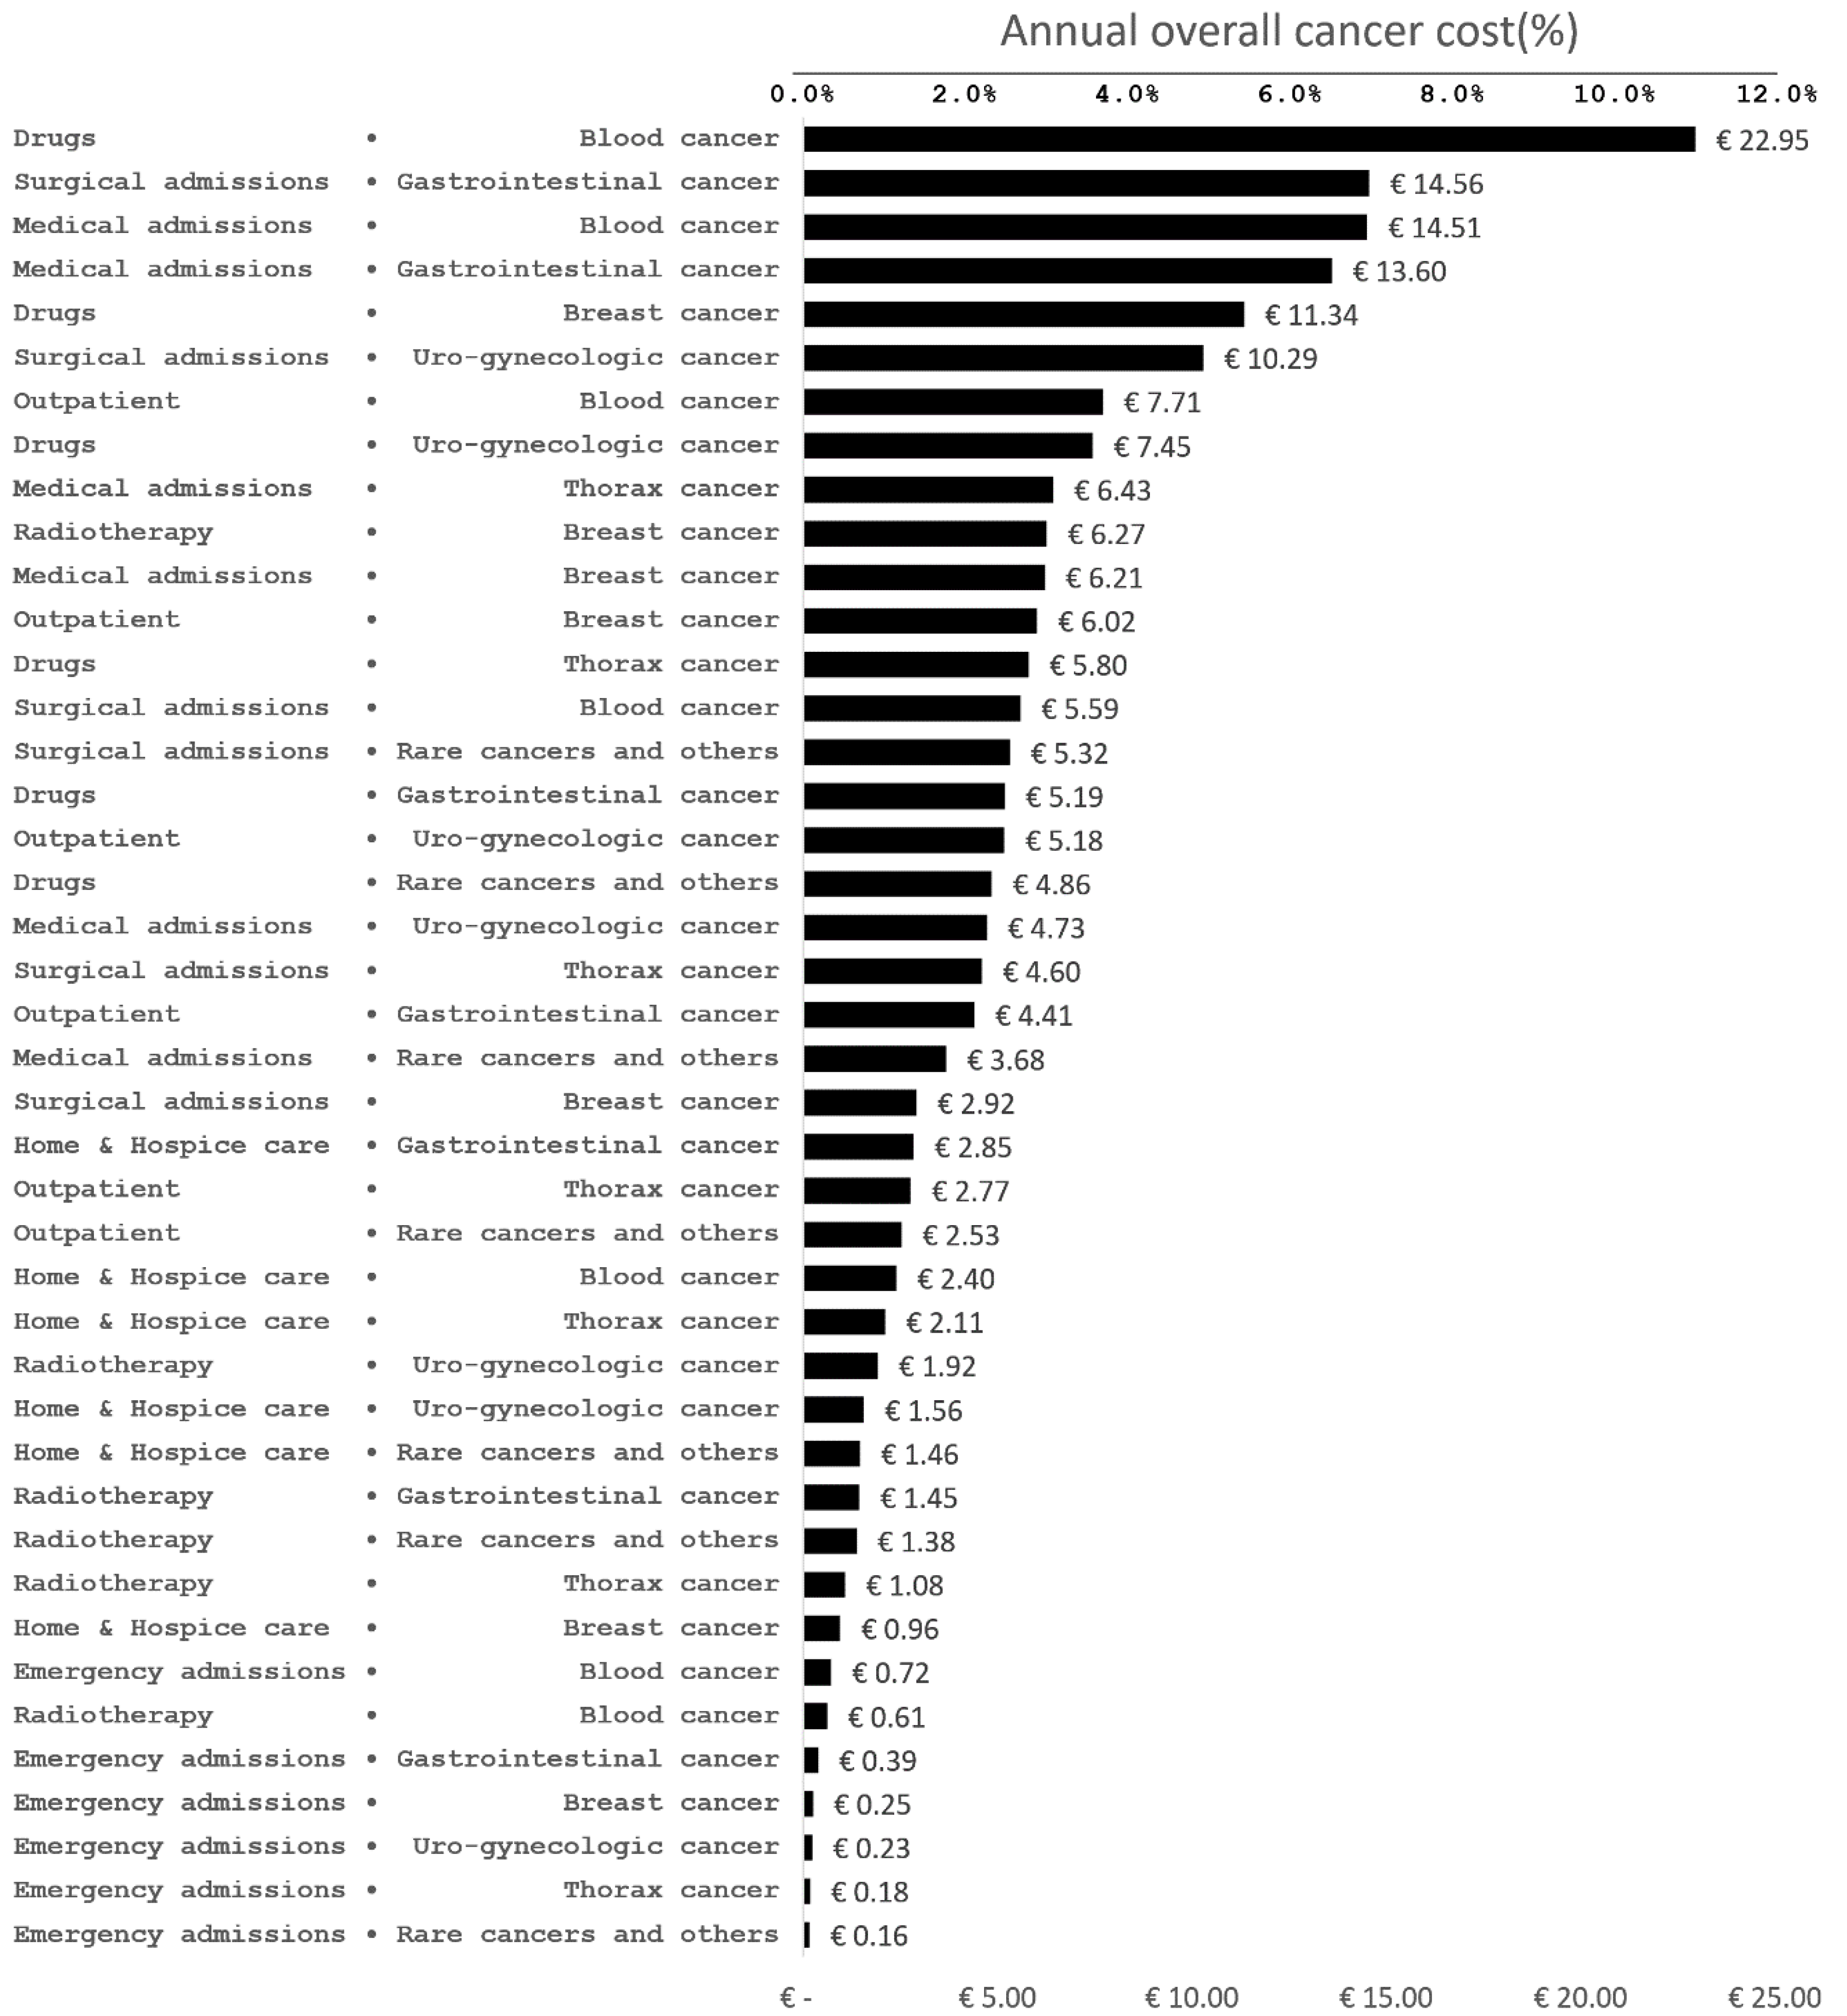
| Disease Group | Item of Expenditure | Total | ||||||
|---|---|---|---|---|---|---|---|---|
| Surgical Admissions | Medical Admissions | Radiotherapy | Drugs | Outpatient Care | Emergency Admissions | Home and Hospice Care | ||
| Blood cancer | 10.3 | 26.7 | 1.1 | 42.2 | 14.2 | 1.3 | 4.3 | 100.0 |
| Gastrointestinal cancer | 34.4 | 32.1 | 3.4 | 12.2 | 10.4 | 0.9 | 6.6 | 100.0 |
| Breast cancer | 8.6 | 18.3 | 18.5 | 33.4 | 17.7 | 0.7 | 2.8 | 100.0 |
| Uro-gynecologic cancer | 32.8 | 15.1 | 6.1 | 23.8 | 16.5 | 0.7 | 4.9 | 100.0 |
| Thorax cancer | 20.1 | 28.1 | 4.7 | 25.3 | 12.1 | 0.8 | 9.0 | 100.0 |
| Rare cancers and others | 27.5 | 19.0 | 7.1 | 25.1 | 13.1 | 0.8 | 7.4 | 100.0 |
| All | 21.2 | 24.1 | 6.2 | 28.2 | 14.0 | 0.9 | 5.4 | 100.0 |
| Disease Group | Cost Item a | ||||||
|---|---|---|---|---|---|---|---|
| Surgical Admissions (€17,185,783) | Medical Admissions (€19,523,707) | Radiotherapy (€5,046,641) | Drugs (€22,864,622) | Outpatient Care (€11,364,573) | Emergency Admissions (€764,019) | Home and Hospice Care (€4,420,776) | |
| Blood cancer | 12.9 | 29.5 | 4.8 | 39.9 | 26.9 | 37.5 | 21.1 |
| Gastrointestinal cancer | 33.6 | 27.7 | 11.4 | 9.0 | 15.4 | 20.1 | 25.1 |
| Breast cancer | 6.7 | 12.6 | 49.3 | 19.7 | 21.0 | 12.9 | 8.4 |
| Uro-gynecologic cancer | 23.8 | 9.6 | 15.1 | 12.9 | 18.1 | 11.9 | 13.8 |
| Thorax cancer | 10.6 | 13.1 | 8.5 | 10.1 | 9.7 | 9.1 | 18.6 |
| Rare cancers and others | 12.3 | 7.5 | 10.8 | 8.4 | 8.8 | 8.4 | 12.9 |
| All | 100.0 | 100.0 | 100.0 | 100.0 | 100.0 | 100.0 | 100.0 |
© 2020 by the authors. Licensee MDPI, Basel, Switzerland. This article is an open access article distributed under the terms and conditions of the Creative Commons Attribution (CC BY) license (http://creativecommons.org/licenses/by/4.0/).
Share and Cite
Altini, M.; Solinas, L.; Bucchi, L.; Gentili, N.; Gallegati, D.; Balzi, W.; Falcini, F.; Massa, I. Assessment of Cancer Care Costs in Disease-Specific Cancer Care Pathways. Int. J. Environ. Res. Public Health 2020, 17, 4765. https://doi.org/10.3390/ijerph17134765
Altini M, Solinas L, Bucchi L, Gentili N, Gallegati D, Balzi W, Falcini F, Massa I. Assessment of Cancer Care Costs in Disease-Specific Cancer Care Pathways. International Journal of Environmental Research and Public Health. 2020; 17(13):4765. https://doi.org/10.3390/ijerph17134765
Chicago/Turabian StyleAltini, Mattia, Laura Solinas, Lauro Bucchi, Nicola Gentili, Davide Gallegati, William Balzi, Fabio Falcini, and Ilaria Massa. 2020. "Assessment of Cancer Care Costs in Disease-Specific Cancer Care Pathways" International Journal of Environmental Research and Public Health 17, no. 13: 4765. https://doi.org/10.3390/ijerph17134765