Levels of Physical Activity during School Hours in Children and Adolescents: A Systematic Review


Abstract
:1. Introduction
2. Materials and Methods
2.1. Selection Criteria
2.2. Data Extraction and Reliability
2.3. Assessment of Quality and Level of Evidence
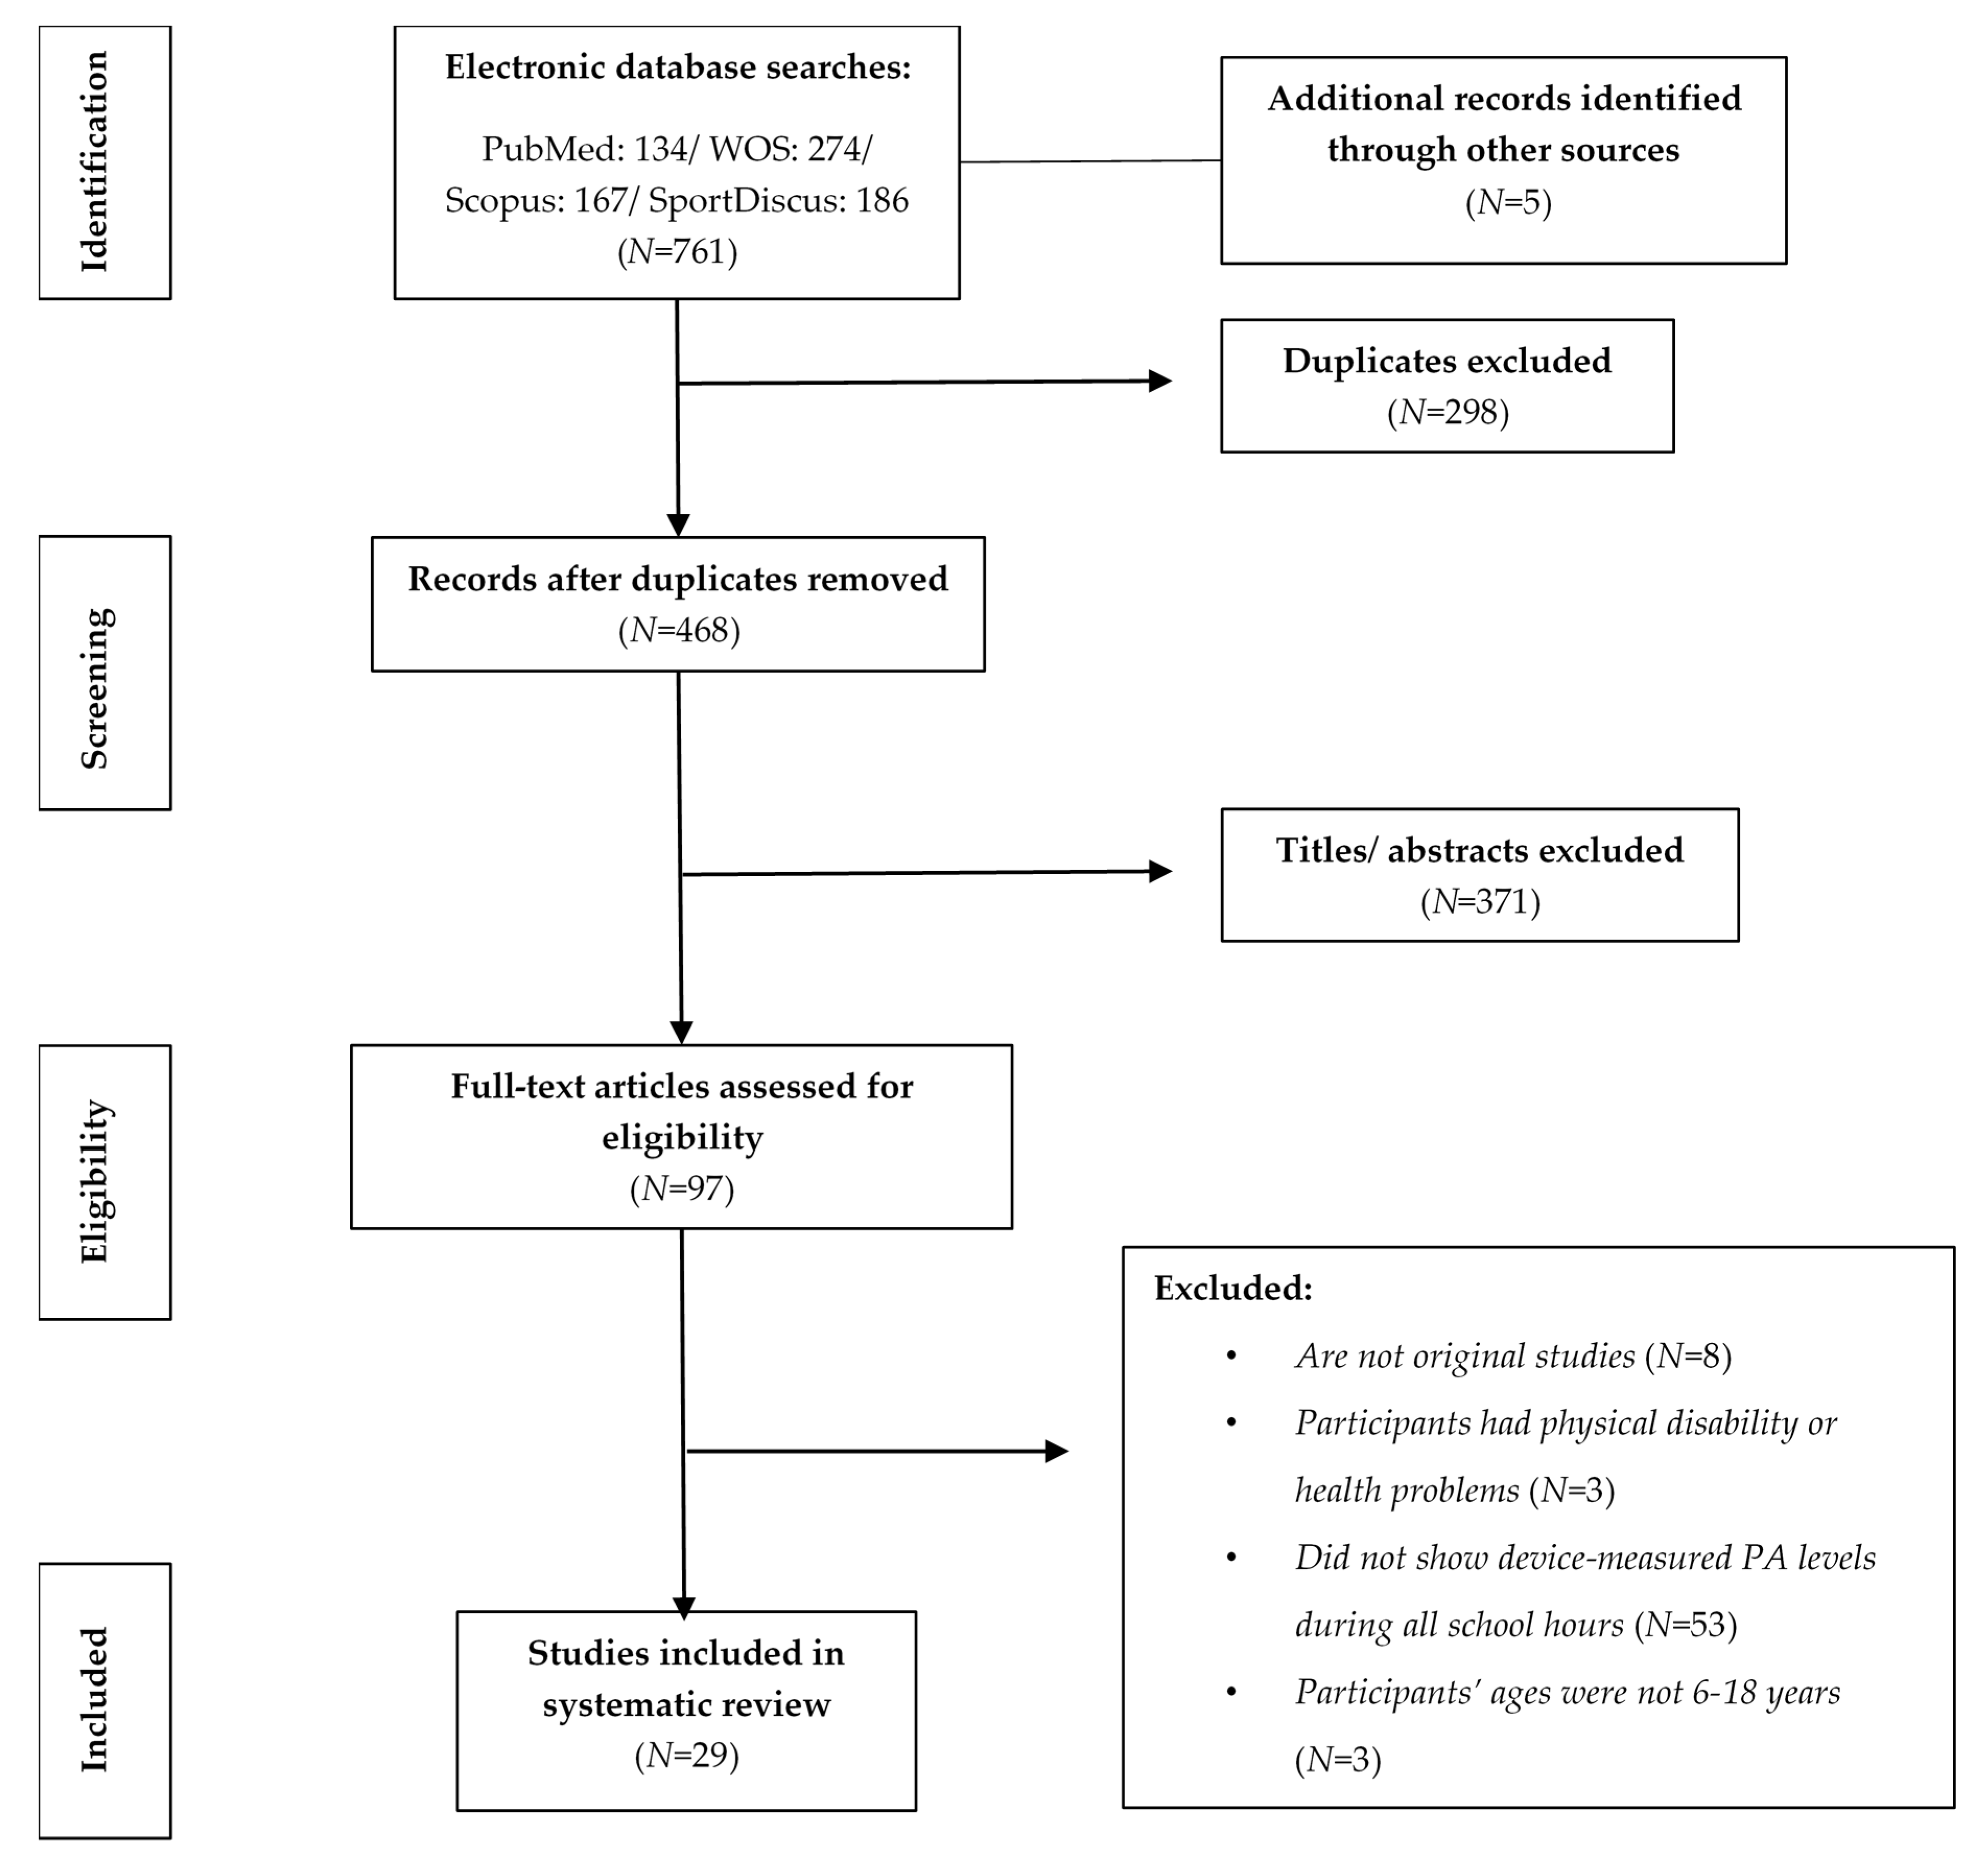
3. Results
3.1. General Findings
3.2. Characteristics of the School Schedules
3.3. Measures of Physical Activity
3.4. Absolute Physical Activity Levels during School Hours
3.5. Percentage of Physical Activity Levels during School Hours
3.6. Compliance with the School Physical Activity Recommendation
4. Discussion
5. Conclusions
Author Contributions
Funding
Conflicts of Interest
References
- Poitras, V.J.; Gray, C.E.; Borghese, M.M.; Carson, V.; Chaput, J.P.; Janssen, I.; Katzmarzyk, P.T.; Pate, R.R.; Connor Gorber, S.; Kho, M.E.; et al. Systematic review of the relationships between objectively measured physical activity and health indicators in school-aged children and youth. Appl. Physiol. Nutr. Metab. 2016, 41, S197–S239. [Google Scholar] [CrossRef]
- Piercy, K.L.; Troiano, R.P.; Ballard, R.M.; Carlson, S.A.; Fulton, J.E.; Galuska, D.A.; George, S.M.; Olson, R.D. The physical activity guidelines for Americans. J. Am. Med. Assoc. 2018, 320, 2020–2028. [Google Scholar] [CrossRef]
- Guthold, R.; Stevens, G.A.; Riley, L.M.; Bull, F.C. Worldwide trends in insufficient physical activity from 2001 to 2016: A pooled analysis of 358 population-based surveys with 1·9 million participants. Lancet Glob. Health 2018, 6, e1077–e1086. [Google Scholar] [CrossRef] [Green Version]
- Pate, R.; O’Neill, J. Summary of the American Heart Association scientific statement: Promoting physical activity in children and youth: A leadership role for schools. J. Cardiovasc. Nurs. 2008, 23, 44–49. [Google Scholar] [CrossRef]
- Institute of Medicine. Educating the Student Body: Taking Physical Activity and Physical Education to School; National Academies Press: Washington, DC, USA, 2013. [Google Scholar]
- Egan, C.A.; Webster, C.A.; Beets, M.W.; Glenn, R.; Russ, L.; Michael, D.; Nesbitt, D.; Orendorff, K.L. Sedentary time and behavior during school: A systematic review and meta-analysis. Am. J. Health Educ. 2019, 50, 283–290. [Google Scholar] [CrossRef]
- Nettlefold, L.; McKay, H.A.; Warburton, D.E.R.; McGuire, K.A.; Bredin, S.S.D.; Naylor, P.J. The challenge of low physical activity during the school day: At recess, lunch and in physical education. Br. J. Sports Med. 2011, 45, 813–819. [Google Scholar] [CrossRef]
- Van Stralen, M.M.; Yildirim, M.; Wulp, A.; te Velde, S.J.; Verloigne, M.M.; Doessegger, A.; Androutsos, O.; Kovács, É.; Brug, J.; Chinapaw, M.J.M.M.; et al. Measured sedentary time and physical activity during the school day of European 10-to 12-year-old children: The ENERGY project. J. Sci. Med. Sport 2014, 17, 201–206. [Google Scholar] [CrossRef]
- Grao-Cruces, A.; Segura-Jiménez, V.; Conde-Caveda, J.; García-Cervantes, L.; Martínez-Gómez, D.; Keating, X.; Castro-Piñero, J. The role of school in helping children and adolescents reach the physical activity recommendations: The UP&DOWN study. J. Sch. Health 2019, 89, 612–618. [Google Scholar] [PubMed]
- Cheung, P. School-based physical activity opportunities in PE lessons and after-school hours: Are they associated with children’s daily physical activity? Eur. Phys. Educ. Rev. 2019, 25, 65–75. [Google Scholar] [CrossRef]
- Pau, M.; Corona, F.; Leban, B.; Piredda, S.; Vacca, M.M.; Mura, G. Influence of school schedules on physical activity patterns in Primary School Children: A case study in Italy. J. Phys. Act. Health 2017, 14, 501–505. [Google Scholar] [CrossRef] [PubMed]
- Parrish, A.M.; Tremblay, M.S.; Carson, S.; Veldman, S.L.C.; Cliff, D.; Vella, S.; Chong, K.H.; Nacher, M.; Del Pozo Cruz, B.; Ellis, Y.; et al. Comparing and assessing physical activity guidelines for children and adolescents: A systematic literature review and analysis. Int. J. Behav. Nutr. Phys. Act. 2020, 17. [Google Scholar] [CrossRef] [PubMed] [Green Version]
- Mayorga-Vega, D.; Parra Saldías, M.; Viciana, J. Comparison of moderate-to-vigorous physical activity levels between physical education, school recess and after-school time in secondary school students: An accelerometer-based study. Kinesiology 2017, 49, 242–251. [Google Scholar] [CrossRef]
- Martínez, J.; Contreras, O.R.; Aznar, S.; Lera, Á. Niveles de actividad física medido con acelerómetro en alumnos de 3° ciclo de Educació Primaria: Actividad física diaria y sesiones de Educación Física. Rev. Psicol. Deport. 2012, 21, 117–123. [Google Scholar]
- Martínez, J.; Aznar, S.; Contreras, O. The recess school space and time as an opportunity healthy. Int. J. Med. Sci. Phys. Act. Sport 2015, 15, 419–432. [Google Scholar] [CrossRef] [Green Version]
- Reilly, J.J.; Johnston, G.; McIntosh, S.; Martin, A. Contribution of school recess to daily physical activity: Systematic review and evidence appraisal. Health Behav. Policy Rev. 2016, 3, 581–589. [Google Scholar] [CrossRef]
- Hollis, J.L.; Sutherland, R.; Williams, A.J.; Campbell, E.; Nathan, N.; Wolfenden, L.; Morgan, P.J.; Lubans, D.R.; Gillham, K.; Wiggers, J. A systematic review and meta-analysis of moderate-to-vigorous physical activity levels in secondary school physical education lessons. Int. J. Behav. Nutr. Phys. Act. 2017, 14, 52. [Google Scholar] [CrossRef]
- Agencia Española de Consumo Seguridad Alimentaria y Nutrición. Estudio ALADINO 2013: Estudio de Vigilancia del Crecimeinto, Alimentación, Actividad Física, Desarrollo Infantil y Obesidad en España 2013; Madrid, 2014; Ministerio de Sanidad, Servicios Sociales e Igualdad, Madrid, Gobierno de España. Available online: http://www.aecosan.msssi.gob.es/AECOSAN/docs/documentos/nutricion/observatorio/Estudio_ALADINO_2015.pdf (accessed on 5 March 2019).
- Daly-Smith, A.; Quarmby, T.; Archbold, V.S.J.; Routen, A.C.; Morris, J.L.; Gammon, C.; Bartholomew, J.B.; Resaland, G.K.; Llewellyn, B.; Allman, R.; et al. Implementing physically active learning: Future directions for research, policy, and practice. J. Sport Health Sci. 2019. [Google Scholar] [CrossRef] [PubMed]
- Beller, E.M.; Glasziou, P.P.; Altman, D.G.; Hopewell, S.; Bastian, H.; Chalmers, I.; Gøtzsche, P.C.; Lasserson, T.; Tovey, D. PRISMA for abstracts: Reporting systematic reviews in journal and conference abstracts. PLoS Med. 2013, 10, e1001419. [Google Scholar] [CrossRef] [PubMed] [Green Version]
- Aibar, A.; Bois, J.E.; Zaragoza Casterad, J.; Generelo, E.; Paillard, T.; Fairclough, S. Weekday and weekend physical activity patterns of French and Spanish adolescents. Eur. J. Sport Sci. 2014, 14, 500–509. [Google Scholar] [CrossRef] [PubMed]
- Bürgi, R.; Tomatis, L.; Murer, K.; De Bruin, E.D. Spatial physical activity patterns among primary school children living in neighbourhoods of varying socioeconomic status: A cross-sectional study using accelerometry and Global Positioning System. BMC Public Health 2016, 16, 282. [Google Scholar] [CrossRef] [PubMed] [Green Version]
- Bürgi, R.; Tomatis, L.; Murer, K.; de Bruin, E.D. Localization of physical activity in primary school children using accelerometry and global positioning system. PLoS ONE 2015, 10, e0142223. [Google Scholar] [CrossRef] [PubMed] [Green Version]
- Clark, A.F.; Wilk, P.; Gilliland, J.A. Comparing physical activity behavior of children during school between balanced and traditional school day schedules. J. Sch. Health 2019, 89, 129–135. [Google Scholar] [CrossRef]
- Dale, D.; Corbin, C.B.; Dale, K.S. Restricting opportunities to be active during school time: Do children compensate by increasing physical activity levels after school? Res. Q. Exerc. Sport 2000, 71, 240–248. [Google Scholar] [CrossRef] [PubMed]
- Dalene, K.E.; Anderssen, S.A.; Ekelund, U.; Thorén, A.K.H.; Hansen, B.H.; Kolle, E. Permanent play facility provision is associated with children’s time spent sedentary and in light physical activity during school hours: A cross-sectional study. Prev. Med. Rep. 2016, 4, 429–434. [Google Scholar] [CrossRef] [PubMed] [Green Version]
- Eyre, E.L.J.J.; Duncan, M.J.; Smith, E.C.; Matyka, K.A. Objectively measured patterns of physical activity in primary school children in coventry: The influence of ethnicity. Diabet. Med. 2013, 30, 939–945. [Google Scholar] [CrossRef]
- Fairclough, S.J.; Butcher, Z.H.; Stratton, G. Whole-day and segmented-day physical activity variability of northwest England school children. Prev. Med. 2007, 44, 421–425. [Google Scholar] [CrossRef]
- Fairclough, S.J.; Beighle, A.; Erwin, H.; Ridgers, N.D. School day segmented physical activity patterns of high and low active children. BMC Public Health 2012, 12. [Google Scholar] [CrossRef] [Green Version]
- Galloway, R.; Booker, R.; Owens, S. Factors leading to discrepancies in accumulated physical activity during school hours in elementary school students. J. Teach. Phys. Educ. 2019, 38, 338–346. [Google Scholar] [CrossRef]
- Gao, Y.; Wang, J.J.; Lau, P.W.C.; Ransdell, L. Pedometer-determined physical activity patterns in a segmented school day among Hong Kong primary school children. J. Exerc. Sci. Fit. 2015, 13, 42–48. [Google Scholar] [CrossRef] [Green Version]
- Gidlow, C.J.; Cochrane, T.; Davey, R.; Smith, H. In-school and out-of-school physical activity in primary and secondary school children. J. Sports Sci. 2008, 26, 1411–1419. [Google Scholar] [CrossRef]
- Grao-Cruces, A.; Sánchez-Oliva, D.; Segura-Jiménez, V.; Cabana-Sánchez, V.; Martínez-Gómez, D.; Rodríguez-Rodríguez, F.; Moreno, L.; Castro-Piñero, J. Changes in compliance with school-based physical activity recommendations in Spanish youth: The UP&DOWN longitudinal study. Scand. J. Med. Sci. Sports 2019, 29, 554–565. [Google Scholar] [CrossRef] [PubMed]
- Guinhouya, B.C.; Lemdani, M.; Vilhelm, C.; Hubert, H.H.; Apété, G.K.; Durocher, A.; Vilhelm, C.; Hubert, H.H. How school time physical activity is the “Big One” for daily activity among schoolchildren: A semi-experimental approach. J. Phys. Act. Health 2009, 6, 510–519. [Google Scholar] [CrossRef] [PubMed]
- Hardman, C.A.; Horne, P.J.; Rowlands, A. V Children’s pedometer-determined physical activity during school-time and leisure-time. J. Exerc. Sci. Fit. 2009, 7, 129–134. [Google Scholar] [CrossRef] [Green Version]
- Hubbard, K.; Economos, C.D.; Bakun, P.; Boulos, R.; Chui, K.; Mueller, M.P.; Smith, K.; Sacheck, J. Disparities in moderate-to-vigorous physical activity among girls and overweight and obese schoolchildren during school- and out-of-school time. Int. J. Behav. Nutr. Phys. Act. 2016, 13, 39. [Google Scholar] [CrossRef] [Green Version]
- Kidokoro, T.; Shimizu, Y.; Edamoto, K.; Annear, M. Classroom standing desks and time-series variation in sedentary behavior and physical activity among primary school children. Int. J. Environ. Res. Public Health 2019, 16, 1892. [Google Scholar] [CrossRef] [Green Version]
- Loucaides, C.A. Seasonal differences in segmented-day physical activity and sedentary behaviour in primary school children. Early Child Dev. Care 2018, 188, 410–420. [Google Scholar] [CrossRef]
- Martin, R.; Murtagh, E. Active classrooms: A cluster randomized controlled trial evaluating the effects of a movement integration intervention on the physical activity levels of primary school children. J. Phys. Act. Health 2016, 14, 290–300. [Google Scholar] [CrossRef]
- Murtagh, E.; Mulvihill, M.; Markey, O. Bizzy break! The effect of a classroom-based activity break on in-school physical activity levels of primary school children. Pediatr. Exerc. Sci. 2013, 25, 300–307. [Google Scholar] [CrossRef] [Green Version]
- Romar, J.E.J.E.; Enqvist, I.; Kulmala, J.; Kallio, J.; Tammelin, T. Physical activity and sedentary behaviour during outdoor learning and traditional indoor school days among Finnish primary school students. J. Adventure Educ. Outdoor Learn. 2019, 19, 28–42. [Google Scholar] [CrossRef]
- Rush, E.; Coppinger, T.; Obolonkin, V.; Hinckson, E.; McGrath, L.; McLennan, S.; Graham, D. Use of pedometers to identify less active children and time spent in moderate to vigorous physical activity in the school setting. J. Sci. Med. Sport 2012, 15, 226–230. [Google Scholar] [CrossRef]
- Taylor, S.L.; Curry, W.B.; Knowles, Z.R.; Noonan, R.J.; McGrane, B.; Fairclough, S.J. Predictors of segmented school day physical activity and sedentary time in children from a northwest England low-income community. Int. J. Environ. Res. Public Health 2017, 14, 534. [Google Scholar] [CrossRef] [PubMed]
- Watson, A.J.L.L.; Timperio, A.; Brown, H.; Hesketh, K.D. A pilot primary school active break program (ACTI-BREAK): Effects on academic and physical activity outcomes for students in Years 3 and 4. J. Sci. Med. Sport 2019, 22, 438–443. [Google Scholar] [CrossRef] [PubMed]
- Zimmo, L.; Farooq, A.; Almudahka, F.; Ibrahim, I.; Al-Kuwari, M.G. School-time physical activity among Arab elementary school children in Qatar. BMC Pediatr. 2017, 17, 76. [Google Scholar] [CrossRef] [Green Version]
- Grao-Cruces, A.; Sánchez-Oliva, D.; Padilla-Moledo, C.; Izquierdo-Gómez, R.; Cabanas-Sánchez, V.; Castro-Piñero, J. Changes in the school and non-school sedentary time in youth: The UP&DOWN longitudinal study. J. Sports Sci. 2020, 4, 1–7. [Google Scholar]
- Wechsler, H.; Devereaux, R.S.; Davis, M.; Collins, J. Using the school environment to promote physical activity and healthy eating. Prev. Med. 2000, 31. [Google Scholar] [CrossRef] [Green Version]
- Carlin, A.; Perchoux, C.; Puggina, A.; Aleksovska, K.; Buck, C.; Burns, C.; Cardon, G.; Chantal, S. A life course examination of the physical environmental determinants of physical activity behaviour: A “Determinants of diet and physical activity” (DEDIPAC) umbrella systematic literature review. PLoS ONE 2017, 12, e0182083. [Google Scholar] [CrossRef]
- Aleksovska, K.; Puggina, A.; Giraldi, L.; Buck, C.; Burns, C.; Cardon, G.; Carlin, A.; Chantal, S.; Ciarapica, D.; Colotto, M.; et al. Biological determinants of physical activity across the life course: A “determinants of diet and physical activity” (DEDIPAC) umbrella systematic literature review. Sport Med. 2019, 5, 1–26. [Google Scholar] [CrossRef]
- Cortis, C.; Puggina, A.; Pesce, C.; Aleksovska, K.; Buck, C.; Burns, C.; Cardon, G.; Carlin, A.; Simon, C.; Ciarapica, D.; et al. Psychological determinants of physical activity across the life course: A determinantes of diet and physical activity (DEDIPAC) umbrella systematic literature review. PLoS ONE 2017, 12, e0182709. [Google Scholar] [CrossRef]
- Brooke, H.L.; Atkin, A.J.; Corder, K.; Ekelund, U.; van Sluijs, E.M.F. Changes in time-segment specific physical activity between ages 10 and 14 years: A longitudinal observational study. J. Sci. Med. Sport 2016, 19, 29–34. [Google Scholar] [CrossRef] [Green Version]
- Brooke, H.L.; Corder, K.; Griffin, S.J.; van Sluijs, E.M.F. Physical activity maintenance in the transition to adolescence: A longitudinal study of the roles of sport and lifestyle activities in British youth. PLoS ONE 2014, 9, e89028. [Google Scholar] [CrossRef]
- Marques, A.; de Matos, M.G. Adolescents’ physical activity trends over the years: A three-cohort study based on the health behaviour in school-aged children (HBSC) portuguese survey. BMJ Open 2014, 4, 1–7. [Google Scholar] [CrossRef] [Green Version]
- Dumith, S.C.; Gigante, D.P.; Domingues, M.R.; Kohl, H.W. Physical activity change during adolescence: A systematic review and a pooled analysis. Int. J. Epidemiol. 2011, 40, 685–698. [Google Scholar] [CrossRef] [PubMed] [Green Version]
- Telford, R.M.; Telford, R.D.; Olive, L.S.; Cochrane, T.; Davey, R. Why are girls less physically active than boys? Findings from the LOOK longitudinal study. PLoS ONE 2016, 11, e0150041. [Google Scholar] [CrossRef] [PubMed]
- Ridgers, N.D.; Stratton, G.; Fairclough, S.J. Assessing physical activity during recess using accelerometry. Prev. Med. 2005, 41, 102–107. [Google Scholar] [CrossRef] [PubMed]
- Stratton, G.; Mullan, E. The effect of multicolor playground markings on children’s physical activity level during recess. Prev. Med. 2005, 41, 828–833. [Google Scholar] [CrossRef] [PubMed] [Green Version]
- United States Department of Health and Human Services. Strategies to Improve the Quality of Physical Education; Centers for Disease Control and Prevention: Washington, DC, USA, 2010.
- Whinnery, E.; Pompelia, S. 50-State Comparison: Instructional Time Policies. 2018. Available online: https://www.ecs.org/50-state-comparison-developmental-education-policies/ (accessed on 20 January 2019).
- Norris, E.; Shelton, N.; Dunsmuir, S.; Duke-Williams, O.; Stamatakis, E. Physically active lessons as physical activity and educational interventions: A systematic review of methods and results. Prev. Med. 2015, 72, 116–125. [Google Scholar] [CrossRef] [PubMed]
- McMullen, J.; Kulinna, P.; Cothran, D. Physical activity opportunities during the school day: Classroom teachers’ perceptions of using activity breaks in the classroom. Eur. Phys. Educ. Rev. 2014, 33, 511–527. [Google Scholar] [CrossRef]
- Ridgers, N.D.; Salmon, J.; Parrish, A.M.; Stanley, R.M.; Okely, A.D. Physical activity during school recess: A systematic review. Am. J. Prev. Med. 2012, 43, 320–328. [Google Scholar] [CrossRef] [Green Version]
- Janssen, M.; Twisk, J.W.R.; Toussaint, H.M.; van Mechelen, W.; Verhagen, E.A.L.M. Effectiveness of the PLAYgrounds programme on PA levels during recess in 6-year-old to 12-year-old children. Br. J. Sports Med. 2015, 49, 259–264. [Google Scholar] [CrossRef]
- Wang, H.; Li, T.; Siahpush, M.; Chen, L.-W.; Huberty, J. Cost-effectiveness of ready for recess to promote physical activity in children. J. Sch. Health 2017, 87, 278–285. [Google Scholar] [CrossRef]
- Smith, N.J.; Lounsbery, M.A.F.; McKenzie, T.L. Physical activity in high school physical education: Impact of lesson context and class gender composition. J. Phys. Act. Health 2014, 11, 127–135. [Google Scholar] [CrossRef] [PubMed]
- Rowlands, A.V. Moving forward with accelerometer-assessed physical activity: Two strategies to ensure meaningful, interpretable, and comparable measures. Pediatr. Exerc. Sci. 2018, 30, 450–456. [Google Scholar] [CrossRef] [PubMed] [Green Version]
- Rowlands, A.V.; Sherar, L.B.; Fairclough, S.J.; Yates, T.; Edwardson, C.L.; Harrington, D.M.; Davies, M.J.; Munir, F.; Khunti, K.; Stiles, V.H. A data-driven, meaningful, easy to interpret, standardised accelerometer outcome variable for global surveillance. J. Sci. Med. Sport 2019, 22, 1132–1138. [Google Scholar] [CrossRef] [PubMed]
- Griew, P.; Page, A.; Thomas, S.; Hillsdon, M.; Cooper, A.R. The school effect on children’s school time physical activity: The PEACH Project. Prev. Med. 2010, 51, 282–286. [Google Scholar] [CrossRef]


| Database | Search Strategy | Limits | Filters |
|---|---|---|---|
| Web of Science | TITLE: (physical activity or exercise or sport) AND TITLE: (school time or school schedule or school hours or primary school or secondary school) AND TITLE: (students or children or schoolchildren or adolescents or teenagers or youth) | SCI-EXPANDED, SSCI Title Article English/Spanish | 274 items filtered |
| PubMed | (((physical activity[Title] OR exercise[Title] OR sport[Title])) AND (school time[Title] OR school schedule[Title] OR school hours[Title] OR primary school[Title] OR secondary school[Title])) AND (students[Title] OR children[Title] OR schoolchildren[Title] OR adolescents[Title] OR teenagers[Title] OR youth[Title]) | Title English/Spanish Humans | 134 items filtered |
| Scopus | TITLE (physical AND activity OR exercise OR sport) AND TITLE (school AND time OR school AND schedule OR school AND hours OR primary AND school OR secondary AND school) AND TITLE (students OR children OR schoolchildren OR adolescents OR teenagers OR youth) | Title English/Spanish | 167 items filtered |
| SportDiscus | TI (physical activity or exercise or sport) AND TI (school time or school schedule or school hours or primary school or secondary school) AND TI (students or children or schoolchildren or adolescents or teenagers or youth) | Title Article English/Spanish | 186 items filtered |
| Author | A | B | C | D | E | F | Total Score | Quality Level |
|---|---|---|---|---|---|---|---|---|
| Aibar et al. [21] | 2 | 0 | 2 | 2 | 2 | 0 | 8 | MQ |
| Bürgi et al. [22] | 1 | 0 | 2 | 2 | 2 | 0 | 7 | MQ |
| Bürgi et al. [23] | 1 | 1 | 2 | 2 | 2 | 0 | 9 | HQ |
| Cheung [10] | 1 | 1 | 2 | 2 | 2 | 2 | 10 | HQ |
| Clark et al. [24] | 1 | 0 | 2 | 2 | 2 | 0 | 7 | MQ |
| Dale et al. [25] | 1 | 0 | 0 | 2 | 2 | 2 | 7 | MQ |
| Dalene et al. [26] | 2 | 2 | 2 | 1 | 2 | 0 | 9 | HQ |
| Eyre et al. [27] | 1 | 0 | 0 | 2 | 2 | 1 | 6 | MQ |
| Fairclough et al. [28] | 1 | 1 | 2 | 2 | 2 | 1 | 9 | HQ |
| Fairclough et al. [29] | 1 | 2 | 2 | 2 | 2 | 0 | 9 | HQ |
| Galloway et al. [30] | 1 | 2 | 1 | 2 | 2 | 1 | 7 | MQ |
| Gao et al. [31] | 1 | 0 | 0 | 2 | 2 | 1 | 6 | MQ |
| Gidlow et al. [32] | 1 | 2 | 2 | 2 | 2 | 0 | 9 | HQ |
| Grao-Cruces, Segura-Jiménez et al. [33] | 2 | 0 | 2 | 2 | 2 | 1 | 9 | HQ |
| Grao-Cruces, Sánchez-Oliva et al. [9] | 2 | 0 | 2 | 2 | 2 | 1 | 9 | HQ |
| Guinhouya et al. [34] | 1 | 0 | 2 | 2 | 1 | 2 | 8 | MQ |
| Hardman et al. [35] | 1 | 0 | 0 | 2 | 1 | 0 | 4 | LQ |
| Hubbard et al. [36] | 2 | 0 | 2 | 2 | 2 | 0 | 8 | MQ |
| Kidokoro et al. [37] | 0 | 0 | 1 | 2 | 2 | 0 | 5 | MQ |
| Loucaides [38] | 1 | 0 | 0 | 2 | 2 | 0 | 5 | MQ |
| Martin and Murtagh [39] | 1 | 2 | 2 | 2 | 2 | 0 | 9 | HQ |
| Murtagh et al. [40] | 1 | 0 | 0 | 2 | 2 | 0 | 5 | MQ |
| Pau et al. [11] | 1 | 0 | 2 | 2 | 2 | 0 | 7 | MQ |
| Romar et al. [41] | 0 | 0 | 2 | 1 | 2 | 2 | 7 | MQ |
| Rush et al. [42] | 0 | 0 | 2 | 2 | 1 | 0 | 5 | MQ |
| Taylor et al. [43] | 1 | 0 | 2 | 2 | 2 | 2 | 9 | HQ |
| van Stralen et al. [8] | 2 | 2 | 2 | 2 | 2 | 0 | 10 | HQ |
| Watson et al. [44] | 2 | 0 | 2 | 2 | 2 | 0 | 8 | MQ |
| Zimmo et al. [45] | 1 | 0 | 1 | 2 | 2 | 1 | 7 | MQ |
| First Author | Study Design/Measurement Year/Country | Sample/Age | PA Measuring | Mean Data about School and PA | Results |
|---|---|---|---|---|---|
| Bürgi et al. [22] | Cross-sectional/2014/Zurich (Switzerland). | N = 83 (48.2% girls). Average age (years): 8.5 (7–9). | A. Actigraph GT3X; GPS receiver (BT-Q1000XT). From waking time to bedtime (7 consecutive days). Evenson et al. (2008), 101 ≤ LPA ≤ 2295 cpm; 2296 ≤ MVPA ≤ 4011 cpm; VPA ≥ 4012 | School schedule: 4 h No reported PE sessions. | Average MVPA: 121.5 min/week. |
| Cheung, [10] | Cross-sectional/2015-16/Hong Kong. | N = 242 (45.9% girls). Average age (years): 8.7 (6–13). | A. Actigraph GT3X. All-day use. Remove only for bathing or swimming (7 consecutive days). Evenson et al. (2008), 101 ≤ LPA ≥ 2295 cpm; 2296 ≤ MVPA ≤4011 cpm; VPA ≥ 4012. | School schedule: 7 h 20 min. PE session: 35–60 min (44 min on average; 5%–8% of total school hours). | Average LPA and MVPA: 100.2 min and 18 min respectively. PE performance: 28.8 min of MVPA/day. |
| Clark et al. [24] | Case study/2010-13/Southwest Ontario (Canada). | N = 163. Average age (years): 10–12. | A. ActicalTM. From waking time to bedtime (8 consecutive days). Puyau et al. (2004), MVPA > 1500 cpm. | School schedule: 8 h. A traditional day: (2 recesses × 15 min + 60 min lunchtime). A balanced day: (2 recesses × 40 min). No reported PE sessions. | Traditional and balanced average MVPA’s day: Boys: 44.9 min/d. Girls: 31.9 min/d. Girls’ PA< boys. |
| Dale et al., [25] | Cross-sectional/2009/Arizona (USA). | N = 78 (51.3% girls). Average age (years): 9.3 (7–15). | A. WAM Model 7164. From waking time to bedtime (4 school days). Trost, et al. (1998). | School schedule: 6 h. 2 days with no PE and no recess. 2 days with PE and 2 recess × 20 min. | Students spent on active and restricted days 366 cpm and 129 cpm, respectively. |
| Dalene et al. [26] | Cross-sectional/2011/Norway. | N = 2256 (51% girls). Average age (years): Group 6 = 6.6; Group 9 = 9.6. | A. Actigraph CT1M and GT3X. From waking time to bedtime (7 consecutive days). Andersen et al. (2006), 100 ≤ LPA ≤ 1999 cpm; MVPA ≥ 2000 cpm. | School schedule: 4 h. No reported PE sessions. | On average: 6 years old group: PA: 765 cpm. Boys’ LPA and MVPA: 88 min and 37 min. Girls’ LPA and MVPA: 85 min and 31 min. 9 years old group: PA 845 cpm. Boys’ LPA and MVPA: 76 min and 34 min. Girls’ LPA and MVPA: 71 min and 26 min. Girls’ PA< boys. |
| Eyre et al. [27] | Cross-sectional/2010/Coventry (UK). | N = 161 (96 Europeans + 65 Asians) (60.9% girls). Average age (years): 9 (8–9). | Monitor de FC Actiheart, Camntech, UK. All-day use (7 consecutive days). MET: 1.5 ≤ LPA < 3; 3 ≤ AFM < 6; VPA ≥ 6. | School schedule: 6 h 15 min. A recess × 15 min + 60 min lunchtime. PE session: 60 min 1 d/week for 60 min + 1 swimming day not supervised. | On average: European group: PA: 124 cpm. Asian group: PA: 120 cpm. Boys: 145 cpm. Girls: 108 cpm. Girls’ PA< boys. |
| Fairclough et al., [28] | Cross-sectional/2005/England (UK). | N = 58 (46.6% girls). Average age (years): 7–11 (8.6 boys and 8.4 girls). | A. Actigraph GT1M. During 5 consecutive days. Nilson et al. (2002), 1956 ≤ MVPA ≤ 5759 cpm; VPA ≥ 5760 cpm. | School schedule: 6 h. No reported PE sessions. | On average: Boys’ MVPA: 32.8 min/d. Girls‘ MVPA: 25.4 min/d. |
| Fairclough et al. [29] | Cross-sectional/2009/Wigan (UK). | N = 223 (98 low activity+ 125 high activity) (40.8% girls + 67.2% girls, respectively). Average age (years): 10.6 low activity; 10.7 high activity (10–11). | A. Actigraph GT1M. From waking time to bedtime (7 consecutive days). 2000 ≤ AFM ≤ 3999 cpm; VPA ≥ 4000 cpm. | School schedule: 6 h 30 min. PE session: 2 d/week (in class time, without any differentiation). | High activity group’s MVPA: 28.4 min/d. Low activity group’s MVPA: 23.3 min/d. |
| Galloway et al. [30] | Cross-sectional/2018/Mississippi (USA). | N = 241. Average age (years): (9–10). | A. Actigraph GT3X. From school to bedtime (5 consecutive days). Evenson et al. (2008), 101 ≤ LPA ≤ 2295 cpm; 2296 ≤ MVPA ≤ 4011 cpm; VPA ≥ 4012. | School schedule: 6 h. 29.4 min-recess/d PE session: 76.4 min/week and 17.4 min/d. | On average: Students’ MVPA: 19.8 min/d. Boys: 22.8 min/d. Girls: 17.1 min/d. Walking distance during school hours: Boys: 3827 steps. Girls: 3420 steps. |
| Gao et al. [31] | Cross-sectional/2014/Hong Kong. | N = 68 (58.8% girls). Average age (years): 10.4 (10–11). | SW 700 YAMAX Pedometer. From waking time to bedtime (4 consecutive days). | School schedule: 7 h. 3 × 20 min-recess/d + 60 min- lunchtime. PE session: 2 d/week (35 min). | Sample’s walking distance during school hours: 5110 steps. Boys: 5734 steps. Girls: 4672 steps. Girls’ PA< boys. |
| Gidlow et al. [32] | Cross-sectional/2006-07/England (UK). | N = 233 (49.8% girls). Average age (years): Primary 8.5 (5.4–11.7). | A. Actigraph GT1M. From waking time to bedtime (7 consecutive days). Trost et al. (2002) and Puyau et al. (2002), MVPA ≥ 3200 cpm. | School schedule: 6 h. No reported PE sessions. | Average students’ school hours PA and MVPA: 510.7 cpm and 24 min/d. |
| Grao-Cruces, et al. [33] | Longitudinal/2011-12/2013-14/Cadiz (Spain). | N = 814 (48.1% girls) First measurement. Average age (years): 8.1 (boys) and 8.2 (girls). Second measurement. Average age (years): 10.1 (boys) and 10.3 (girls). | A. Actigraph CT1M, GT3X and GT3X+. From waking time to bedtime (7 consecutive days). 100 < LPA < 2000 cpm; MVPA > 2000 cpm; VPA > 4000 cpm. | School schedule: 5 h. 30 min-recess. PE session: 2 d/week (60 min). | First measurement: boys’ PA: 483.2 cpm from which 76 min/d of LPA and 24.2 min/d of MVPA. Girls’ PA: 392.6 cpm from which 71.2 min/d of LPA and 18.4 min/d of MVPA. Second measurement: boys’ PA: 440.1 cpm from which 63.6 min/d of LPA and 22.5 min/d in MVPA. Girls’ PA: 341.7 cpm from which 58.6 min/d of LPA and 16.7 min/d in MVPA. |
| Grao-Cruces, et al. [9] | Cross-sectional/2011-12/Cadiz (Spain). | N = 926 (48.2% girls) Average age (years): 8.1. | A. Actigraph GT1M, GT3X and GT3X+. From waking time to bedtime (7 consecutive days). 100 < LPA < 2000 cpm; 2001 < AFM > 4000 cpm; VPA > 4000 cpm. | School schedule: 5 h. 30 min-recess. PE session: 2 d/week (45–120 min) or 1 d/week (90–150 min). | On average boys’ PA: 100 min/d and girls PA: 89.2 min/d. Boys’ MVPA: 24.1 min/d. Girls’ MVPA: 18.3 min/d. Girls’ PA < boys. |
| Guinhouya et al. [34] | Cuasi-experimental/2005-06/Lille (France). | N = 93 (40% girls). Average age (years): Children 10; Girls 10.1 (8–11). | A. Actigraph Model 7164. From waking time to bedtime (≥ 2 school selected days). MVPA ≥ 3200 cpm. | School schedule: 8 h 2 recesses × 15 min + 120 min lunchtime. PE sessions not included in the measurement. | On average, all participants at baseline: Boys’ MVPA: 29.9 min/d. Girls’ MVPA: 17.7 min/d. |
| Hardman et al. [35] | Cross-sectional/2003/Wales (UK). | N = 95 (54.1% girls). Average age (years): Boys 9.8; Girls 10 (7–11). | YAMAX SW-200 Pedometer. During ≥3 weekdays and 2 weekend days. | School schedule: 6 h 30 min. No reported PE sessions. | Average walking distance during school hours: Boys: 7312 steps. Girls: 5782 steps. Girls’ PA< boys. |
| Hubbard et al. [36] | Cross-sectional/2013-14/New England (USA). | N = 453 (60.5% girls). Average age (years): 9.1 (8–11). | A. Actigraph GT3X and GT3X. From waking time to bedtime (7 consecutive days). Evenson et al. (2008), 51 ≤ LPA ≤ 1148 cpm; 1149 ≤ AFM ≤ 2005 cpm; VPA ≥ 2006 cpm. | School schedule: 6 h 25 min. No reported PE sessions. | Average students’ PA: 161.5 cpm from which 143.8 min/d in LPA and 18.1 min/d in MVPA. Boys: 22.0 min/d. Girls: 14.2 min/d. Girls’ PA < boys. |
| Kidokoro et al. [37] | Cuasi-Experimental/2018/Japan. | N = 38 (42.1% girls). Average age (years): 11.3 (11–12). | A. ActiGraph wGT3X-BT. From waking time to bedtime (5 school days). Evenson et al. (2008), 101 ≤ LPA ≥ 2295 cpm; MVPA ≥ 2296 cpm. | School schedule: 7 h 40 min. No reported PE sessions. | At baseline: Average control class students’ MVPA during school hours: 40.5 min/d. Average intervention class students’ MVPA during school hours: 46.9 min/d. |
| Loucaides [38] | Cross-sectional/2016/Limassol (Cyprus). | N = 64 (54.7% girls). Average age (years): 11.5. | Yamax DW-200 Pedometer. For 6 winter days and 6 spring days. | School schedule: 5 h 20 min: 20 min-recess + 2 × 10 min-recess No reported PE sessions. | Average student’s walking distance: Winter: 5930 steps (Boys: 6795, Girls: 5223 steps). Spring: 6417 steps (Boys: 7068, Girls: 5884 steps). |
| Martin and Murtagh [39] | Experimental (Cluster randomised controlled trial)/2014/Limerick (Ireland). | N = 186. Average age (years): 8.9 (8–12). | A. Actigraph GT3X and GT3X+. During school hours (5 consecutive days). Evenson et al. (2008), 101 ≤ LPA ≥ 2295 cpm; MVPA ≥ 2296 cpm; VPA ≥ 4012 cpm. | School schedule: 5 h 40 min. No reported PE sessions. | At baseline: Control group LPA: 96.3 min/d, MVPA: 21.5 min/d. Intervention group LPA: 92.1 min/d, MVPA: 19.2 min/d. |
| Murtagh et al. [40] | Experimental/2010-11/Ireland. | N = 90 (45.6% girls) Average age (years): 9.3. | Yamax Digiwalker SW-200 pedometer. During all day (5 school days). | School schedule: 5 h30 min with a recess and a lunchtime. No reported PE sessions. | Average waking distance at baseline: Control group 5469 steps. Intervention group: 5351 steps. |
| Pau et al. [11] | Case study/2015-16/Cagliari (Sardinia, Italy). | N = 169 (55% girls). Average age (years): 8.6. | A. Actigraph GT3X. Durante all day (7 consecutive days). Crouter et al. (2015), 101 ≤ LPA ≤ 609 cpm; 610 ≤ AFM ≤ 1809 cpm; VPA > 1809 cpm. | Regular school schedule: 5 h with 15 min-recess. Full Schedule: 8 h with 15 min-recess + 60 min-lunchtime + 60 min-additional recess. No reported PE sessions. | On average, Regular Schedule students’ PA and MVPA: 104 min/d and 11% of school time (33 min/d). Full Schedule student’s PA and MVPA: 186.3 min/d and 9.5% of school time (60.9 min/d). Average walking distance: Regular Schedule student’s: 4358 steps. Full Schedule student’s: 7479 steps. |
| Romar et al. [41] | Case study/2017/Finland. | N = 21 (12 from 1st to 3rd grade and 9 from 4th to 6th grade). Average age (years): 6–12. | A. Actigraph GT3X and wGT3X+. From waking time to bedtime (7 consecutive days). Evenson et al. (2008), 101 ≤ LPA ≤ 2295; 2296 ≤ AFM ≤ 4011; VPA ≥ 4012. | Traditional school schedule: 4 h 15 min in 1st–3rd grade and 6 h 15 min in 4th–6th grade. During Fridays and outdoor days, the school Schedule: 4 h 15 min. Traditional day include PE sessions. | Traditional day student’s LPA, MVPA and walking distance: 19.6 min/h, 6.9 min/h and 4513 steps. Outdoor day student’s LPA, MVPA and walking distance: 24.3 min/h, 8.8 min/h and 5613 steps. |
| Rush et al. [42] | Cross-sectional/2009/New Zealand. | N = 47 (59.6% girls). Average age (years): 8–11. | A. ActicalTM and pedometer Digiwalker SW200. During school hours (3 consecutive days). Puyau et al. (2014), LPA ≥ 100 cpm; AFM ≥ 1500 cpm; VPA ≥ 6500. | School schedule: 5 h. No reported PE sessions. | Average students’ LPA: 92.5 min/d (Boys: 89.2 min/d, Girls: 94.8 min/d). Average students’ MVPA: 67.8 min/d (Boys: 68.5 min/d, Girls: 67.4 min/d) Average students walking distance at school: 7424 steps (Boys: 8103 steps, Girls: 6963 steps). |
| Taylor et al. [43] | Cross-sectional/2016/Skelmesdale (UK). | N = 215 (48.8% girls). Average age (years): 10.2 (9–10). | A. Actigraph GT9X. During all day (7 consecutive days). 142 ≤ AFM ≤ 464 mg→ 3 ≤ AFM ≤ 5.99 METs; VPA ≥ 6 METs. | School schedule: 6 h 30 min. 15.7 min-recess + 37.9 min lunchtime (Only recess). PE session: 90.7 min. | Boys’ LPA and MVPA: 157.5 min and 20.9 min/d Girls’ LPA and MVPA: 151.9 min and 14.3 min/d. |
| van Stralen et al. [8] | Cross-sectional/2010/Belgium, Greece, Hungary, Netherland and Switzerland. | N = 1025 (51% girls). Average age (years): 11.6 (10–12). | A. Actigraph, actitrainers, GT3X and GT1M. From waking time to bedtime (≥ 6 consecutive days). MVPA ≥ 3000 cpm | School schedule: 5 h 54 min. No reported PE sessions. | Average students’ MVPA: 16 min/d. |
| Watson et al. [44] | Experimental (Pilot cluster randomized controlled trial)/2017/Melbourne (Australia). | N = 341 (50% girls in intervention group and 54% girls in control group). Average age (years): 9.2 (intervention group) and 9 (control group). | A. Actigraph GT3-X. From waking time to bedtime (7 consecutive days). Freedson et al. (2005), 150 ≤ LPA ≤ 499 cpm; 500 ≤ AFM ≤ 3999 cpm; VPA ≥ 4000 cpm. | School schedule: 6 h 30 min. No reported PE sessions. | At baseline, control group’s MVPA: 34.4 min/d Intervention group: 35.4 min/d. |
| Zimmo et al. [45] | Cross-sectional/2014/Qatar. | N = 92 (57.6% girls). Average age (years): 8.8 (boys) and 9.1 (girls). | A. Actigraph wGT3X-BT. During all day (5 consecutive days). Chandler et al. (2015), 101 ≤ LPA ≥ 2295 cpm; MVPA ≥ 2296 cpm; VPA ≥ 4012 cpm. | School schedule: 6 h. 25 min-recess + another 15 min-recess. PE: 2 d/week (45 min). | Average students’ MVPA: 31.8 min/d (Boys: 42.7 min/d, Girls: 23.7 min/d). |
| First Author | Study Design/Measure Age/Country | Sample/Age | PA Measures | School Schedule | Results |
|---|---|---|---|---|---|
| Aibar et al. [21] | Cross-sectional/2010-12/Huesca (Spain) and Tarbes (France). | N = 829 (55.2% girls). Average age (years): 14.3. | A. Actigraph GT3X. From waking time to bedtime (8 consecutive days). Evenson et al. (2008), 101 ≤ LPA ≥ 2295 cpm; MVPA ≥ 2296 cpm; VPA ≥ 4012.MVPA ≥ 2296 cpm. | French school schedule: 9 h Spanish: 6 or 8 h. No reported PE sessions. | Average teenagers’ MVPA: Spanish: 23 min/d. French: 28.5 min/d. |
| Bürgi et al. [23] | Cross-sectional/2013/Winterthur (Switzerland). | N = 119 (57.1% girls). Average age (years): 12.5 (11–14). | A. Actigraph GT3 X and GPS receiver (BT-Q1000 XT) From waking time to bedtime (7 consecutive days). Evenson et al. (2008), 101 ≤ LPA ≤ 2295 cpm; 2296 ≤ MVPA ≤ 4011 cpm; VPA ≥ 4012. | School schedule: 6 h 30 min. No reported PE sessions. | Average teenagers’ MVPA: 74.7 min/week (Boys: 80.3 min/week, Girls: 71.9 min/week). |
| Dalene et al. [26] | Cross-sectional/2011/Norway. | N = 784 (50.1% girls). Average age (years): Group 15 years old = 15.1. | A. Actigraph CT1M and GT3X. From waking time to bedtime (7 consecutive days). Andersen et al. (2006), 100 ≤ LPA ≤ 1999 cpm; MVPA ≥ 2000 cpm. | School schedule: 5 h. No reported PE sessions. | Average teenagers’ PA, LPA and MVPA: Boys: 391 cpm, 69 min/d and 26 min/d. Girls: 393 cpm, 56 min/d and 20 min/d. Girls’ PA < boys. |
| Gidlow et al. [32] | Cross-sectional/2006-07/England (UK). | N = 213 (52.1% girls). Average age (years): 14.1 (11–16.5). | A. Actigraph GT1M. From waking time to bedtime (7 consecutive days). Trost et al. (2002) and Puyau et al. (2002), MVPA ≥ 3200 cpm. | School schedule: 6 h. No reported PE sessions. | Average teenagers’ PA and MVPA during school hours: 321.6 cpm and 16.5 min/d. |
| Grao-Cruces et al. [33] | Longitudinal/2011-12 y 2013-14/Madrid (Spain). | N = 658 (49.8% girls). First measurement. Average age: 13.8. Second measurement. Average age (years): 15.8. | A. Actigraph CT1M and GT3X. From waking time to bedtime (7 consecutive days). 100 < LPA < 2000 cpm; MVPA > 2000 cpm; VPA > 4000 cpm. | School schedule: 5 h 45 min. 30 min-recess. PE: 2 d/week (45–120 min). | First measurement: Boys’ LPA and MVPA: 61.9 min/d and 21.5 min/d. Girls’ LPA and MVPA: 51.8 min/d and 13 min/d. Second measure: Boys’ LPA and MVPA: 48.8 min/d and 19.1 min/d. Girls’ LPA and MVPA: 41.4 min/d and 13.3 min/d. |
| Grao-Cruces et al. [9] | Cross-sectional/2011-12/Madrid (Spain). | N = 906 (49.1% girls) Average age (years): 14. | A. Actigraph CT1M, GT3X and GT3X+. From waking time to bedtime (7 consecutive days). 100 < LPA < 2000 cpm; MVPA > 2000 cpm; VPA > 4000 cpm. | School schedule: 5 h 45 min. A recess × 30 min. PE: 2 d/week (45–120 min (usually 55 min)) or 1 d/week (90–150 min). | Boys’ PA and MVPA: 83.4 min/d and 22 min/d. Girls’ PA and MVPA: 63.9 min/d and 13.2 min/d. |
© 2020 by the authors. Licensee MDPI, Basel, Switzerland. This article is an open access article distributed under the terms and conditions of the Creative Commons Attribution (CC BY) license (http://creativecommons.org/licenses/by/4.0/).
Share and Cite
Grao-Cruces, A.; Velázquez-Romero, M.J.; Rodríguez-Rodríguez, F. Levels of Physical Activity during School Hours in Children and Adolescents: A Systematic Review. Int. J. Environ. Res. Public Health 2020, 17, 4773. https://doi.org/10.3390/ijerph17134773
Grao-Cruces A, Velázquez-Romero MJ, Rodríguez-Rodríguez F. Levels of Physical Activity during School Hours in Children and Adolescents: A Systematic Review. International Journal of Environmental Research and Public Health. 2020; 17(13):4773. https://doi.org/10.3390/ijerph17134773
Chicago/Turabian StyleGrao-Cruces, Alberto, María J. Velázquez-Romero, and Fernando Rodríguez-Rodríguez. 2020. "Levels of Physical Activity during School Hours in Children and Adolescents: A Systematic Review" International Journal of Environmental Research and Public Health 17, no. 13: 4773. https://doi.org/10.3390/ijerph17134773