Fine-Scale Vegetation Characteristics Drive Insect Ensemble Structures in a Desert Ecosystem: The Tenebrionid Beetles (Coleoptera: Tenebrionidae) Inhabiting the Ulan Buh Desert (Inner Mongolia, China)


Abstract
:1. Introduction
2. Materials and Methods
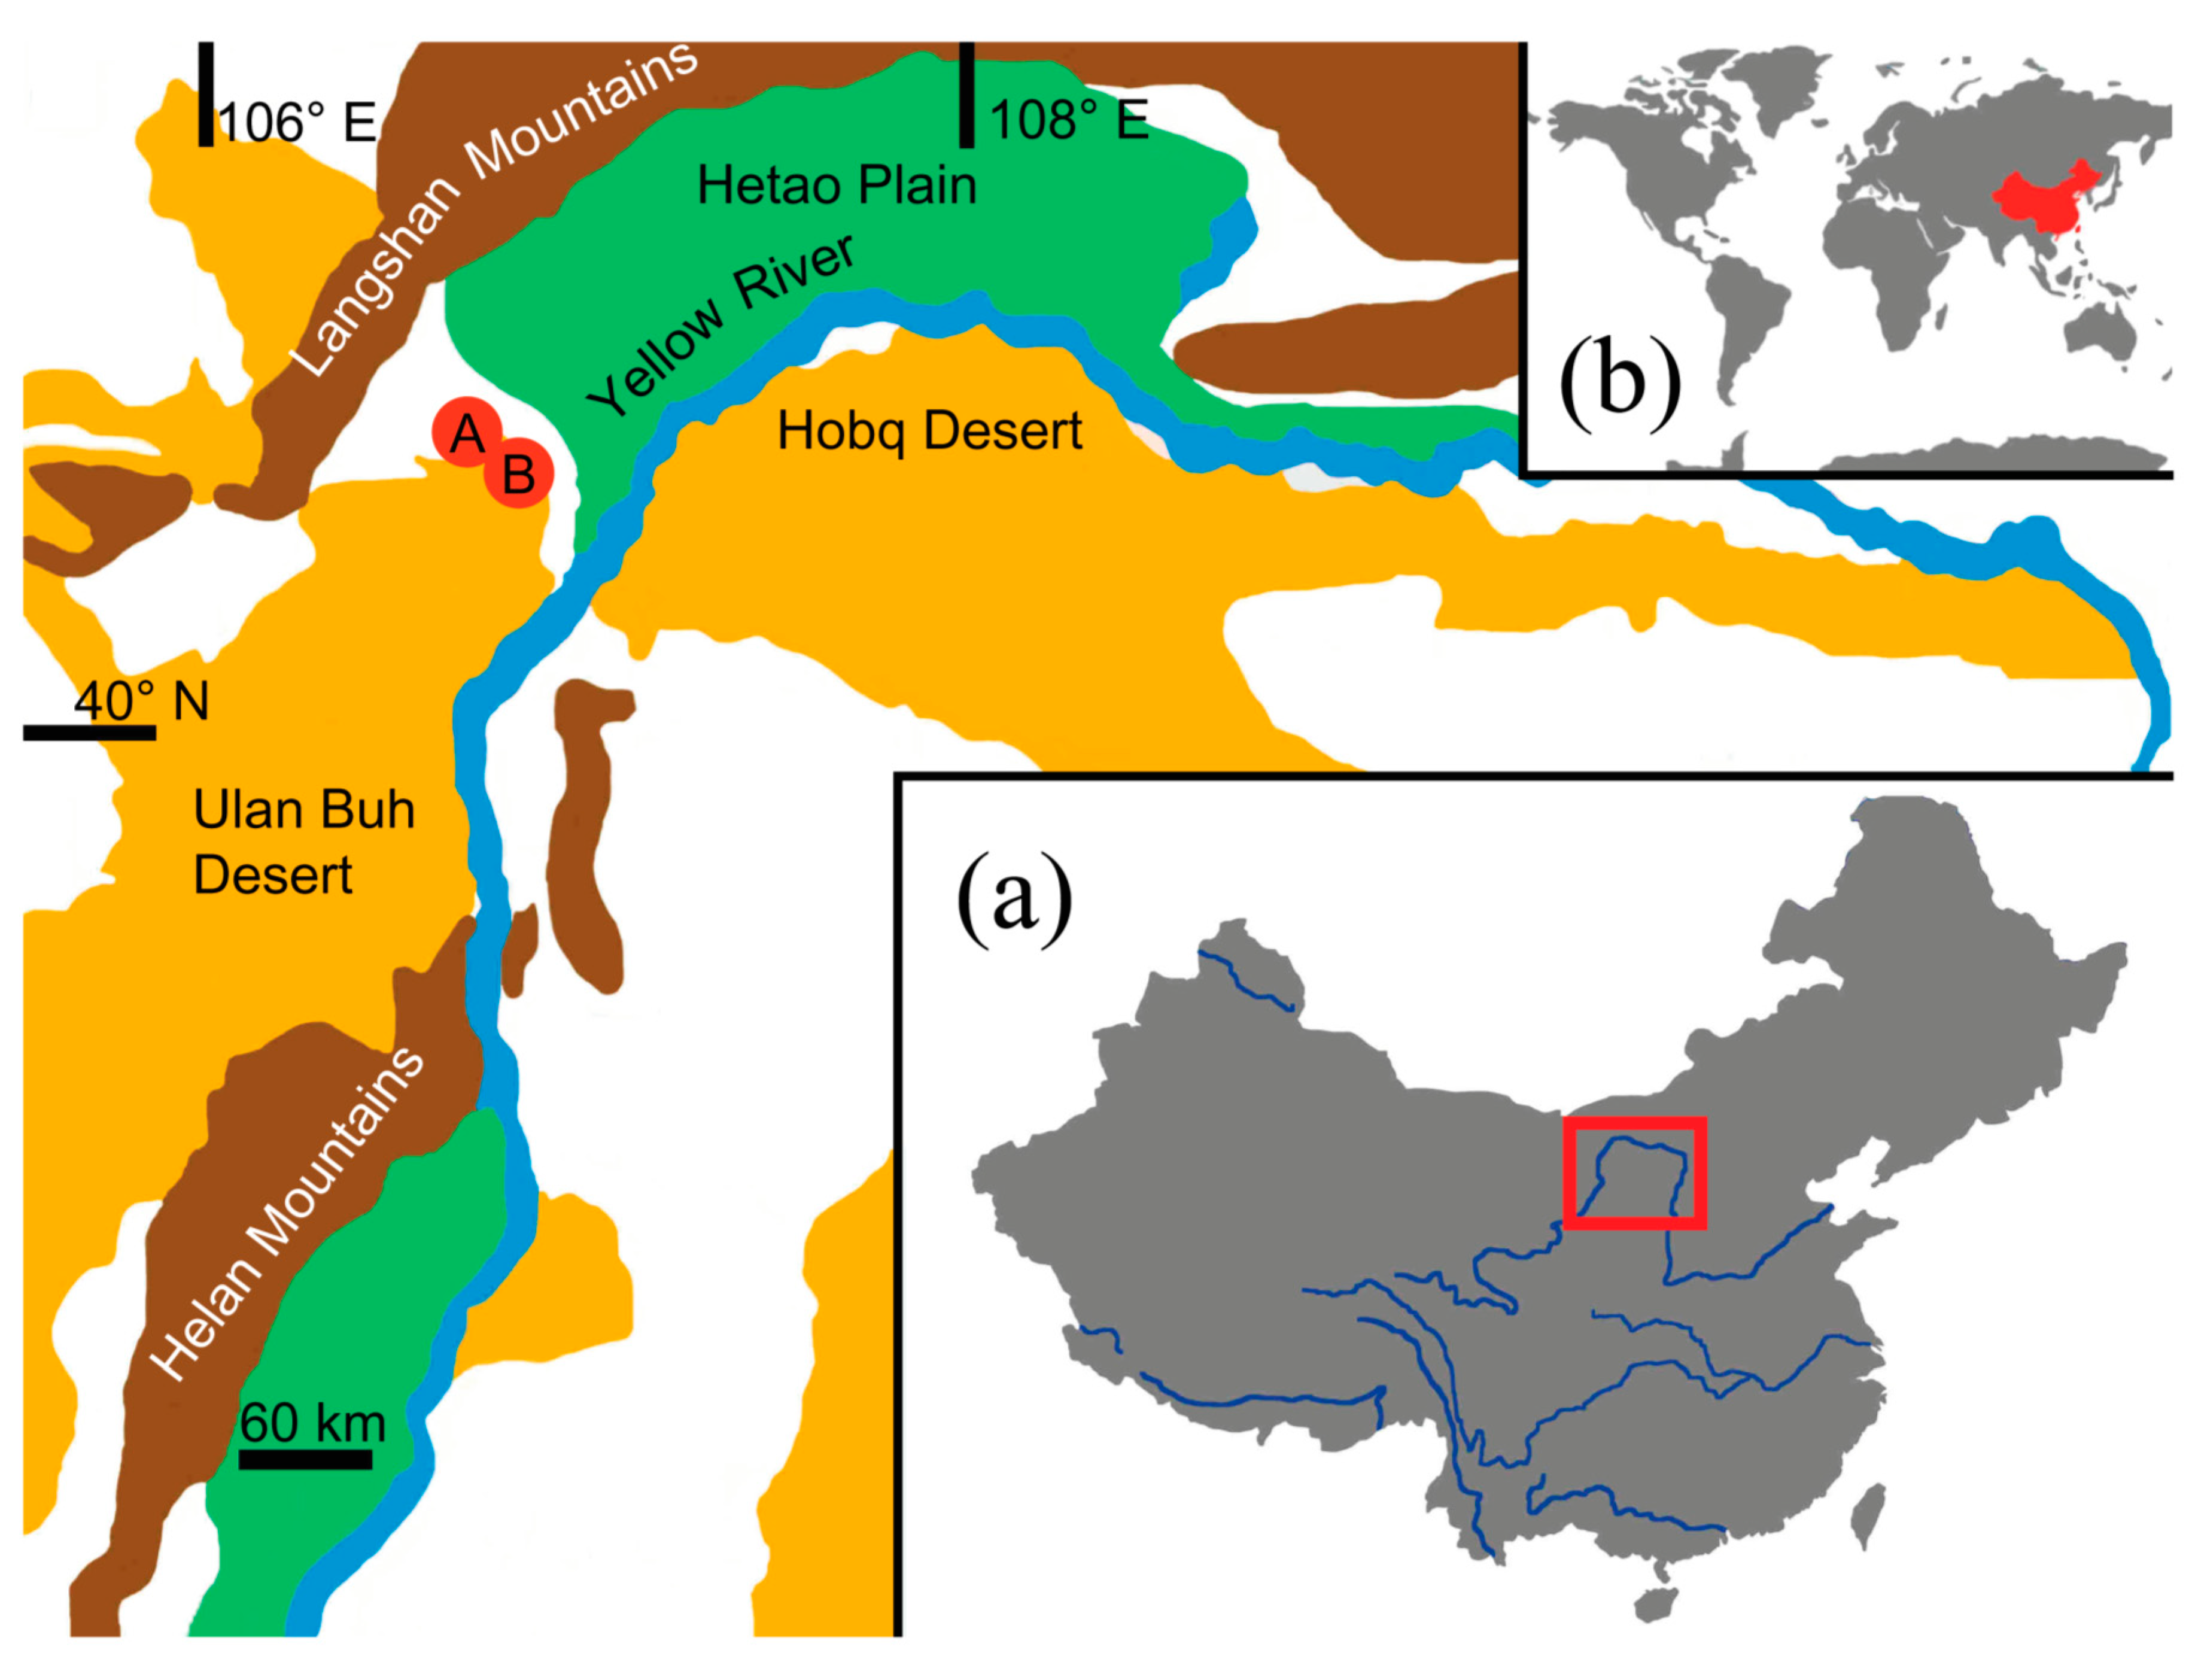
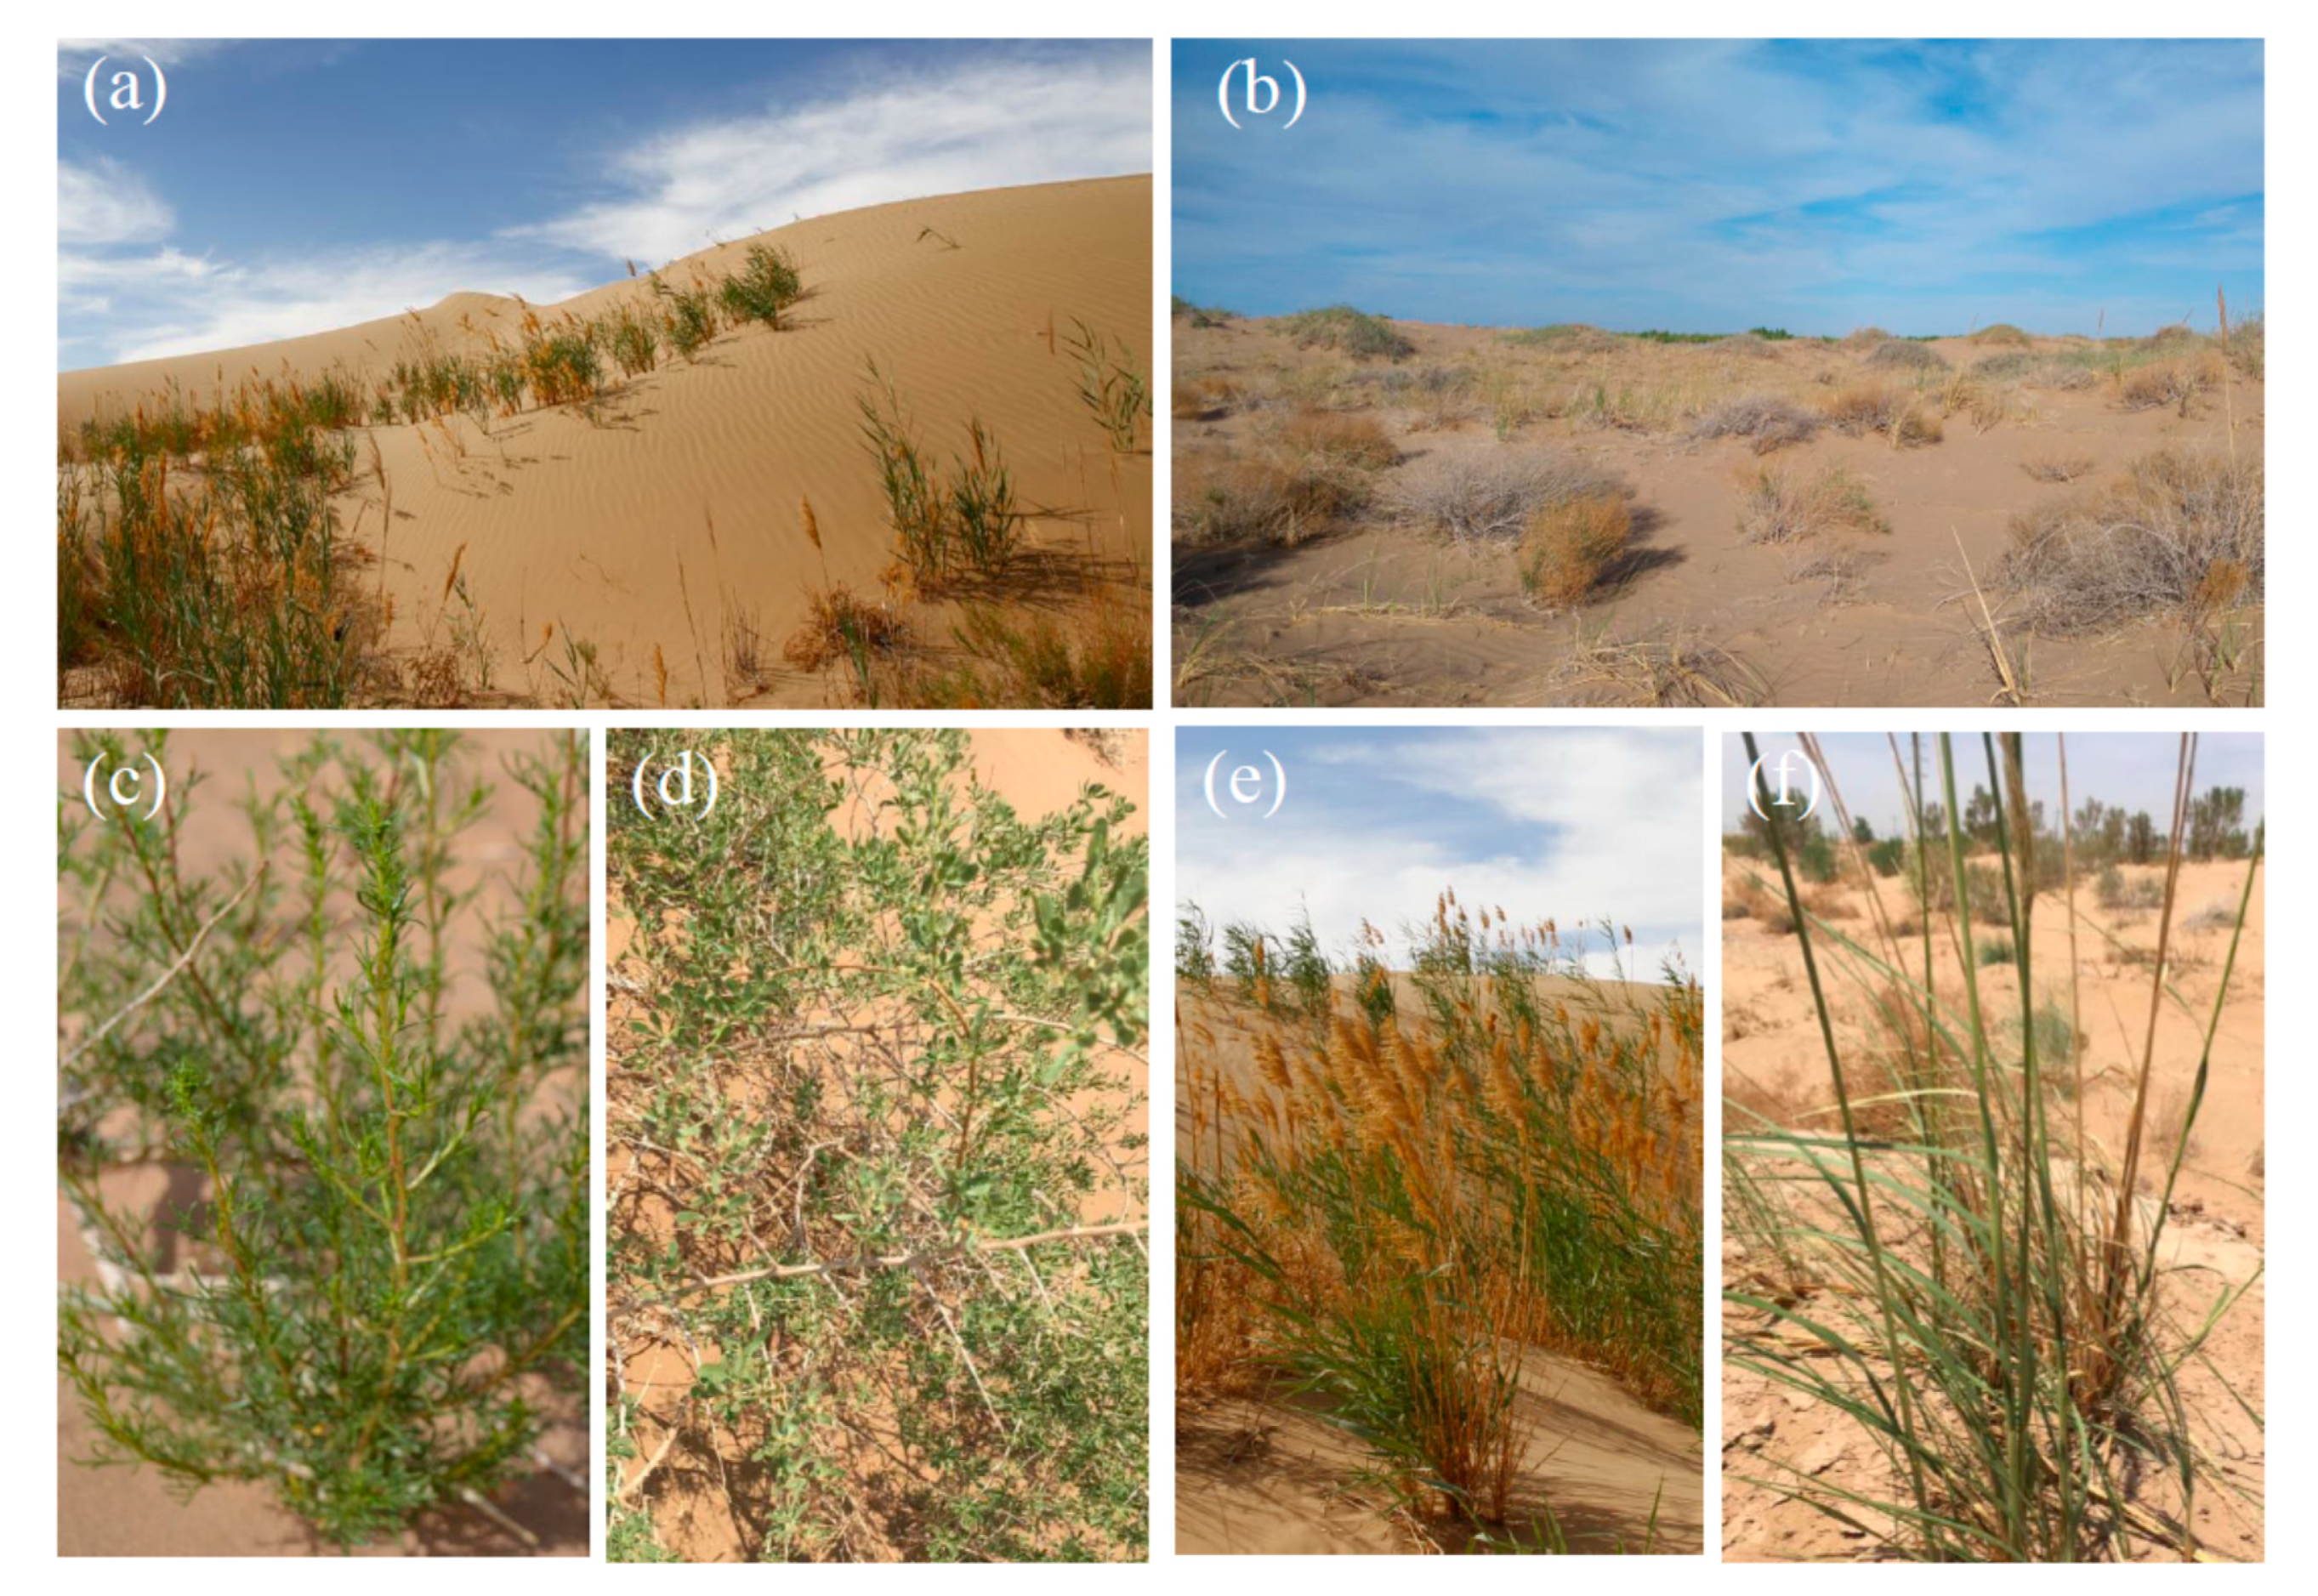
2.1. Study Area and Data Collection
2.2. Data Analysis
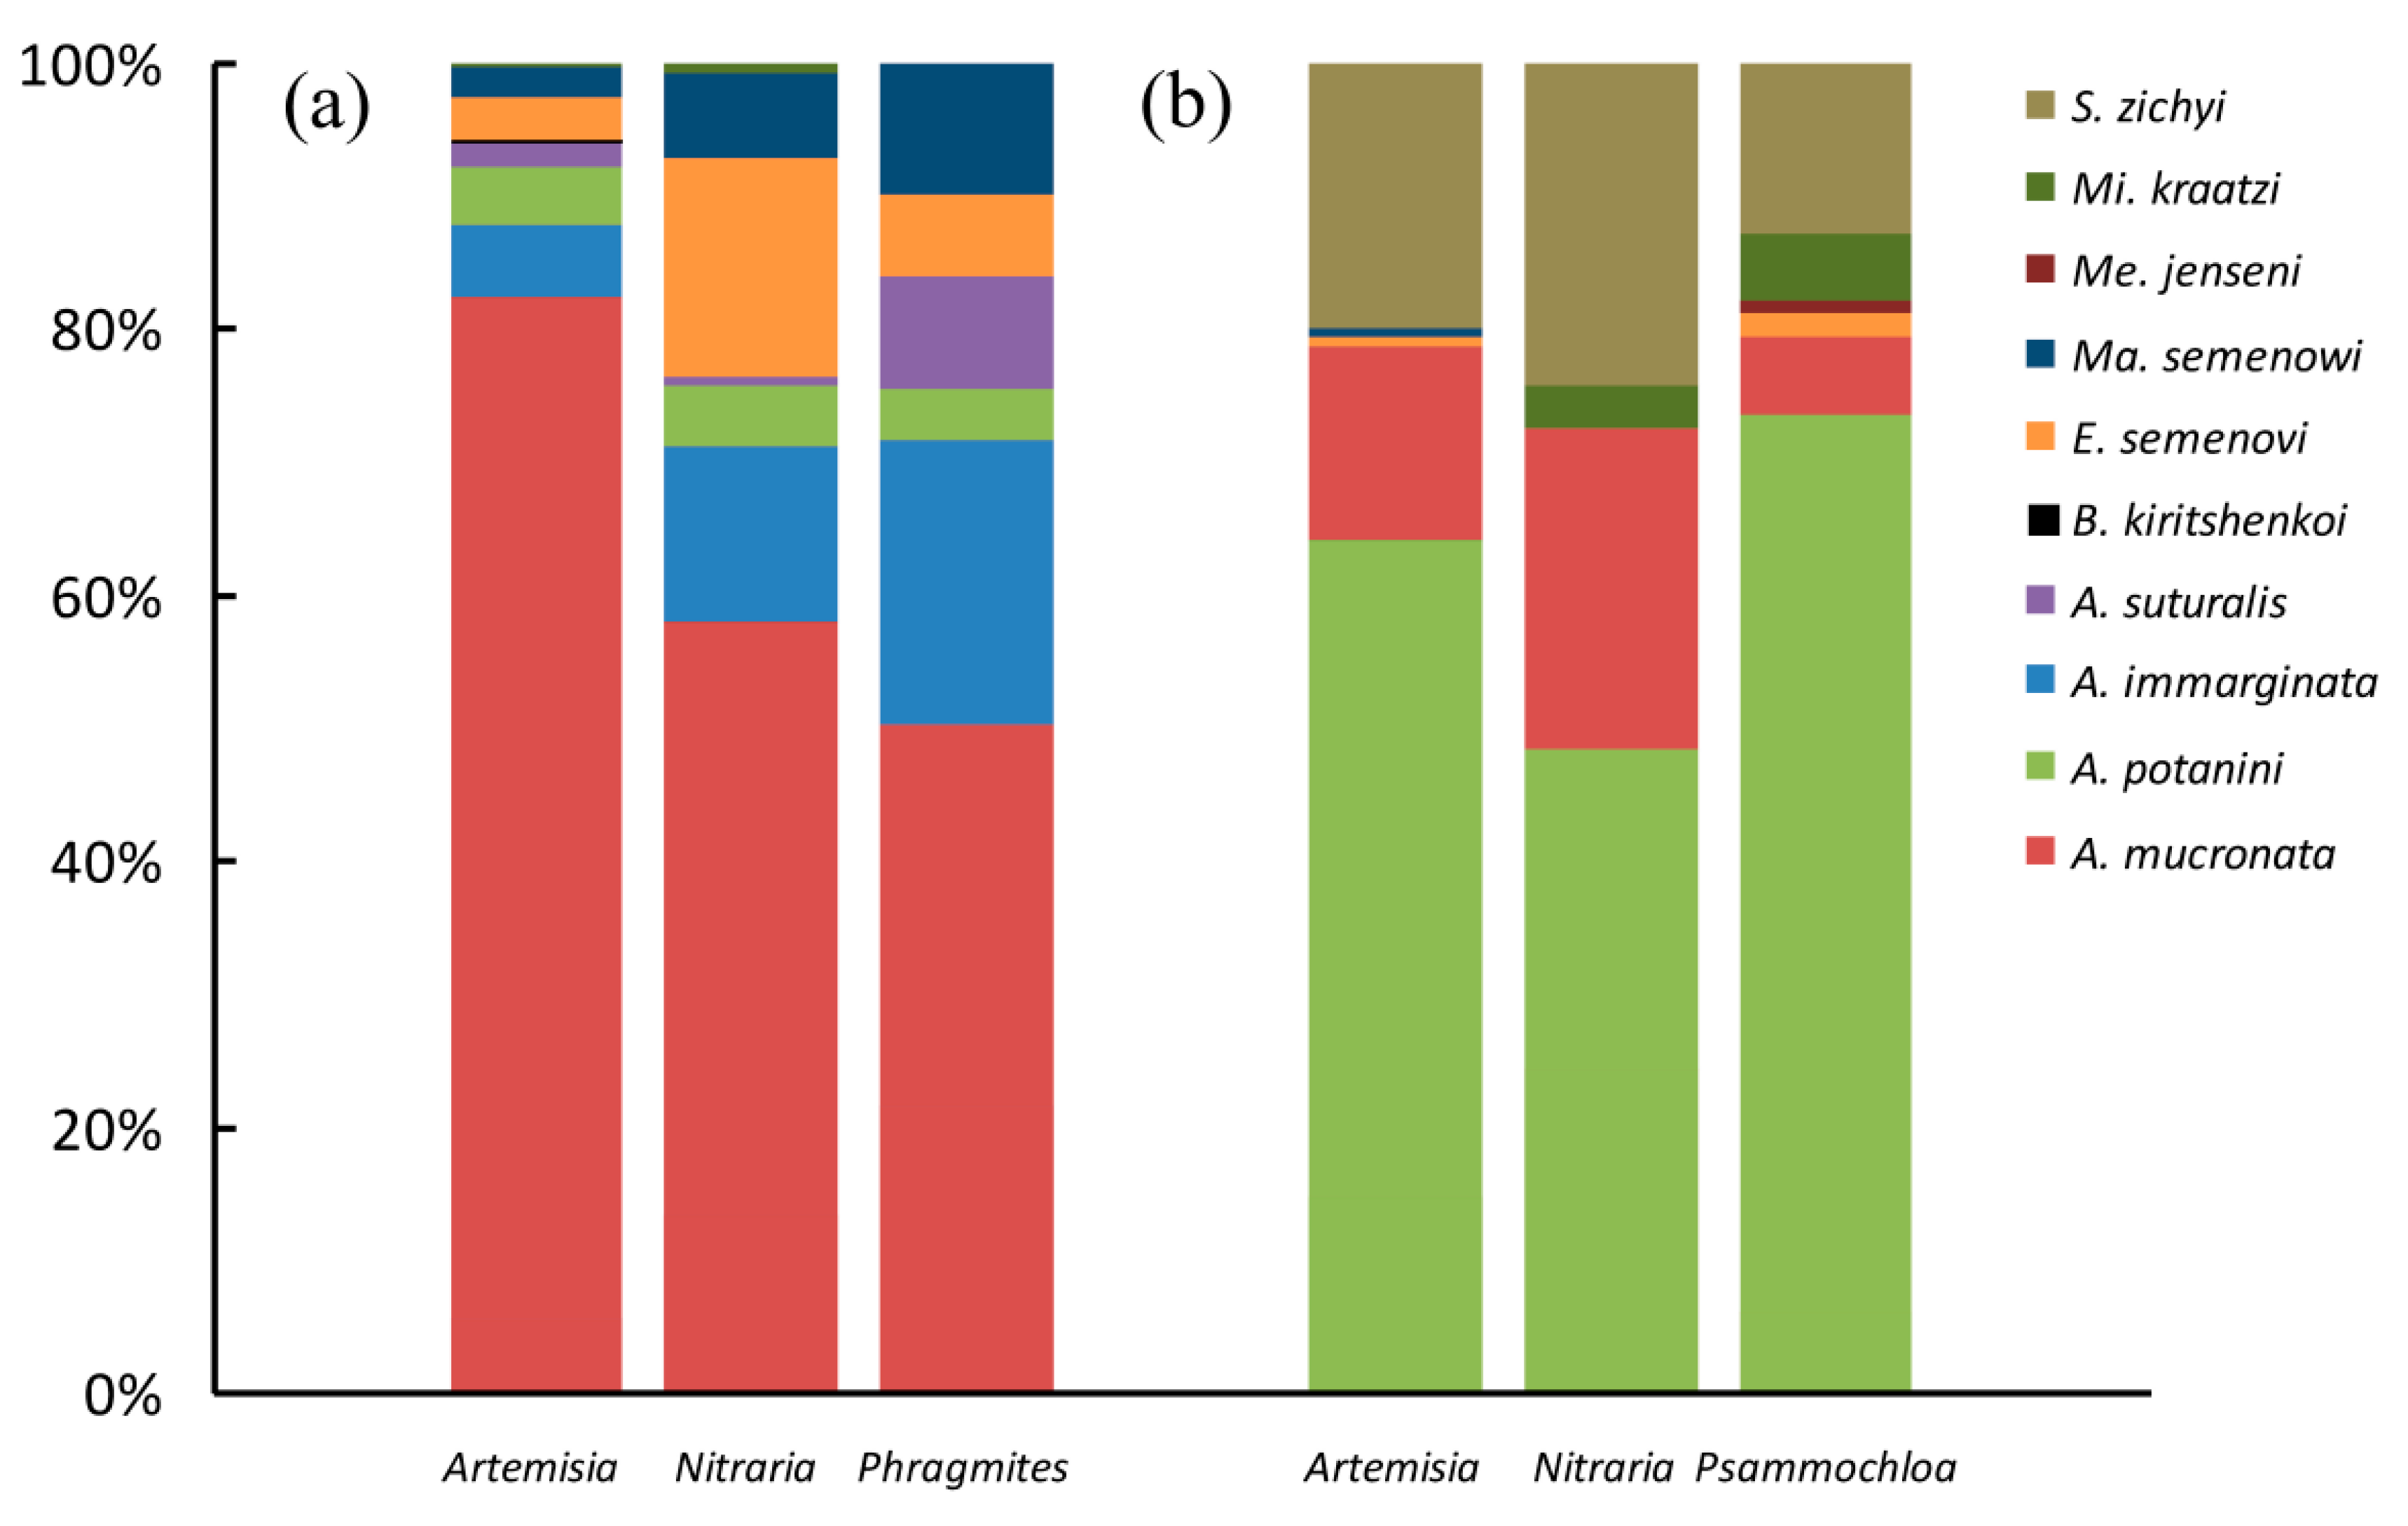
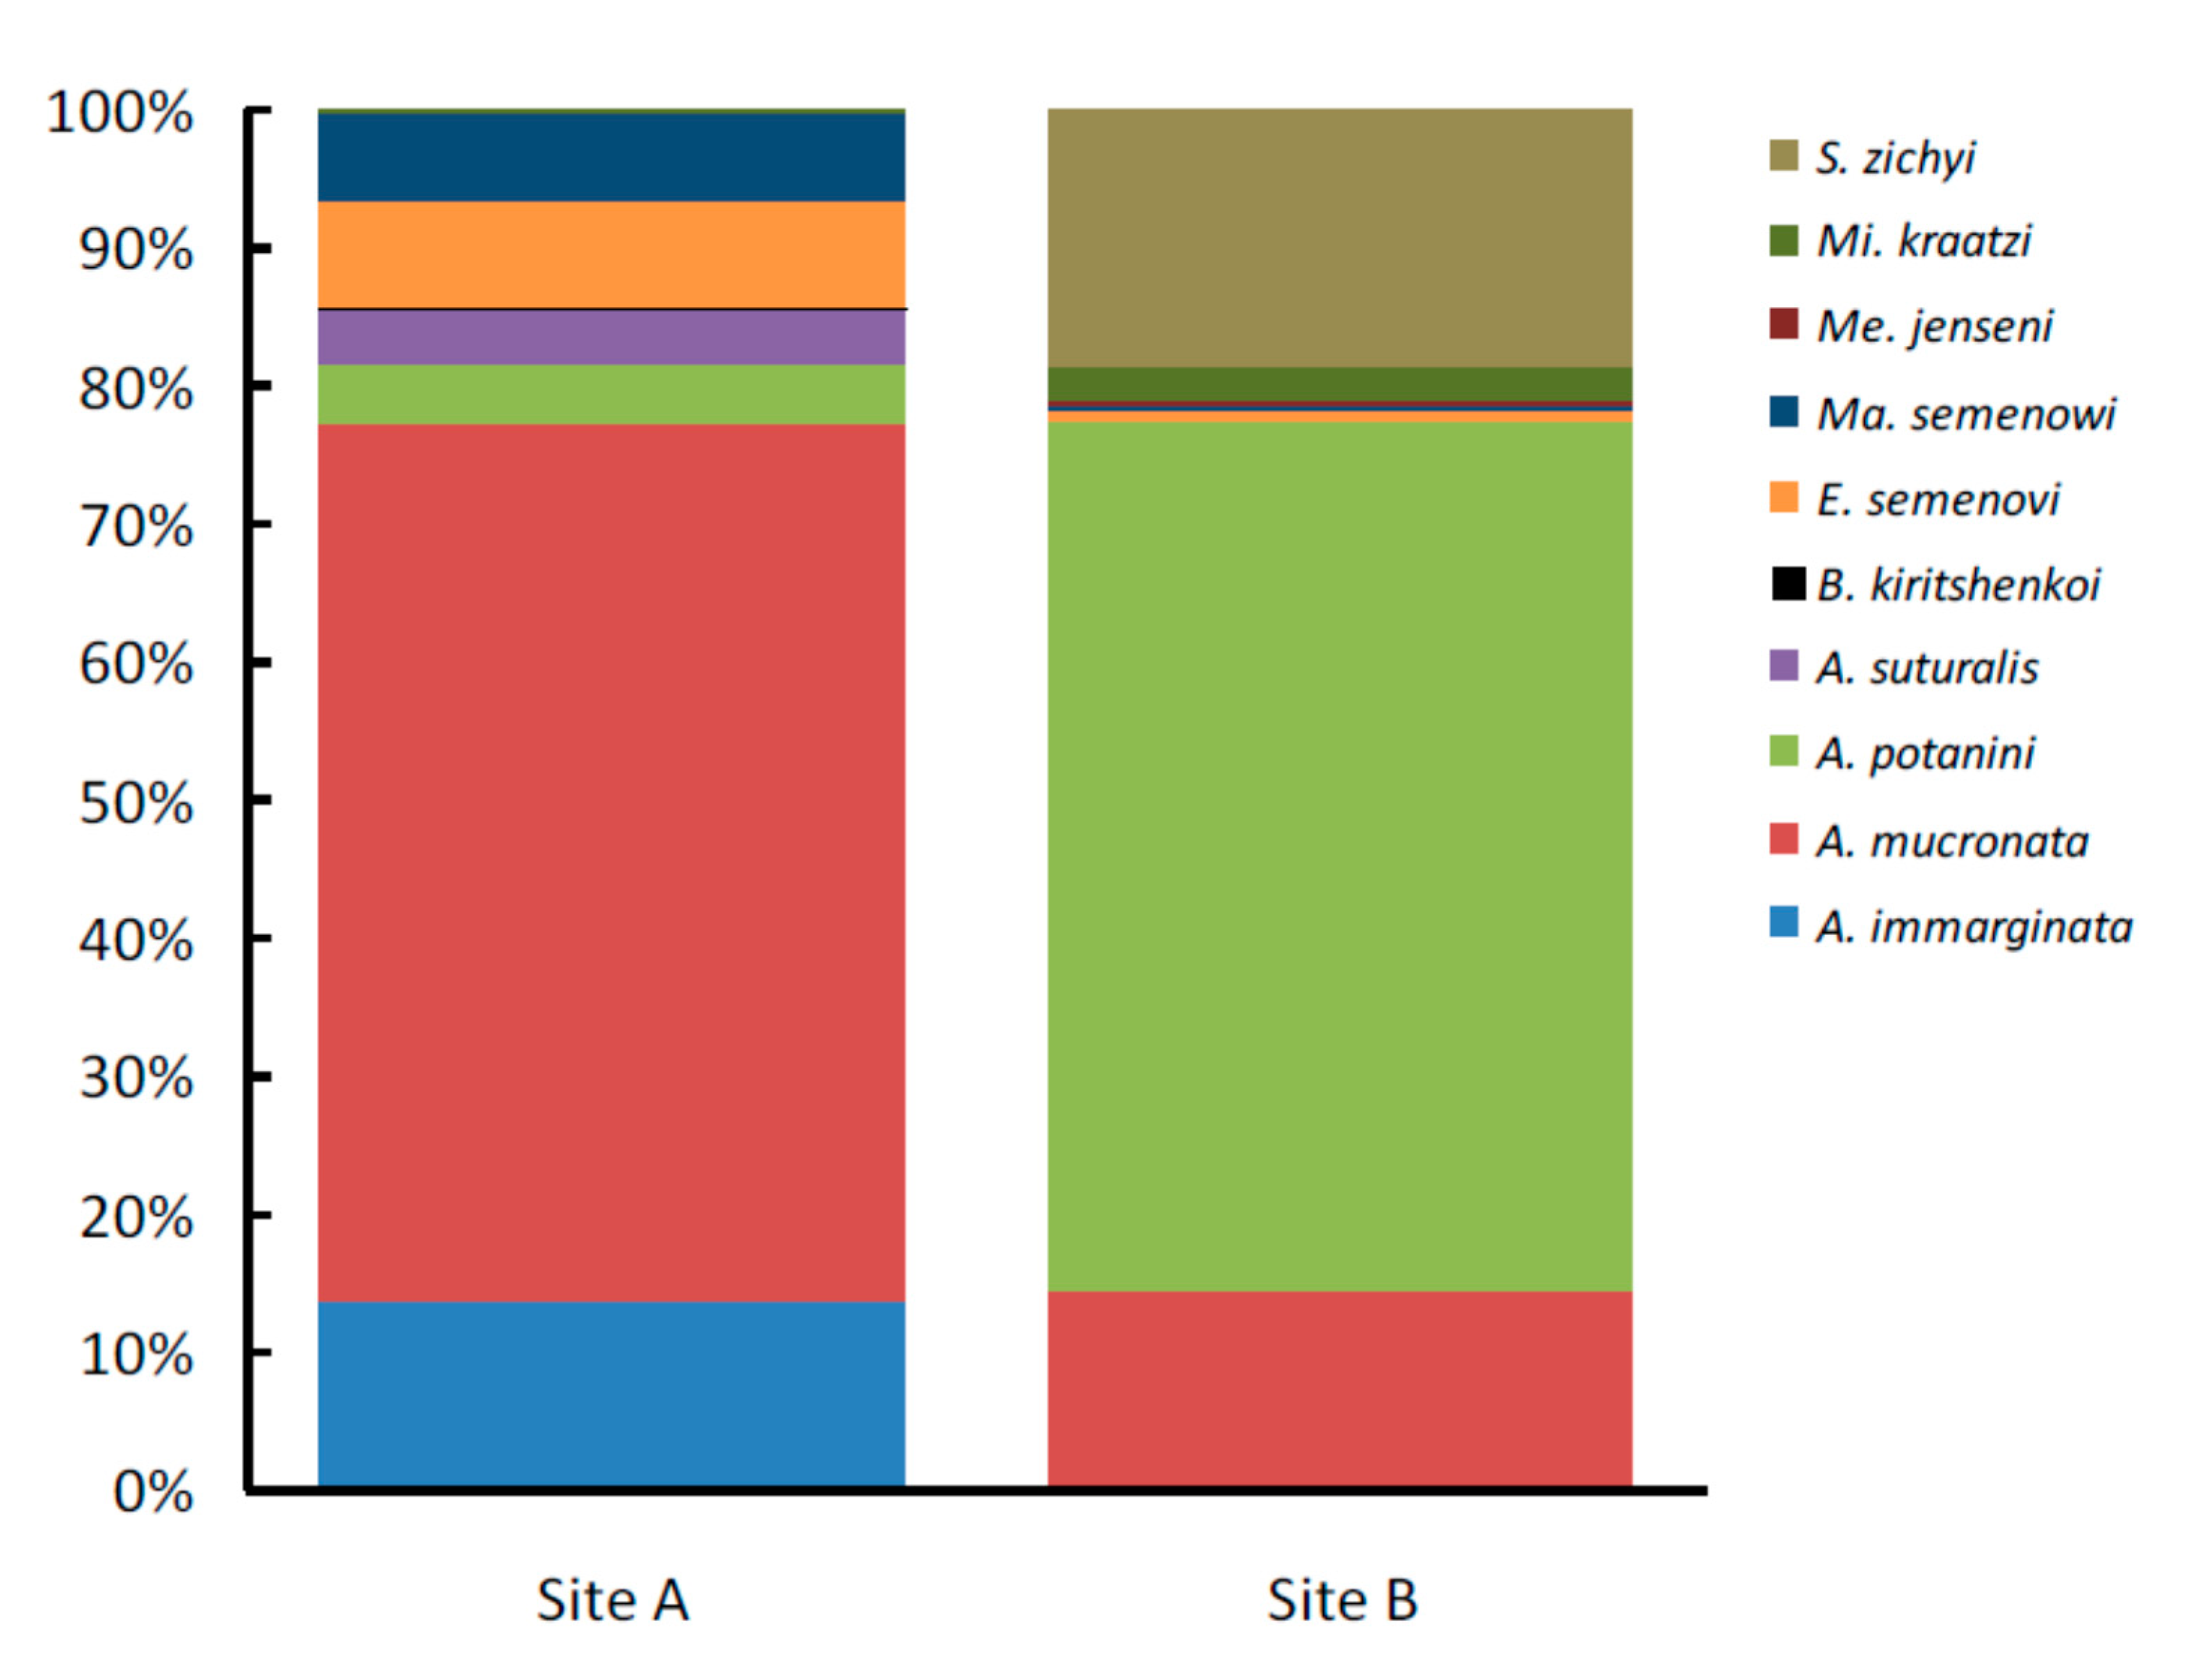
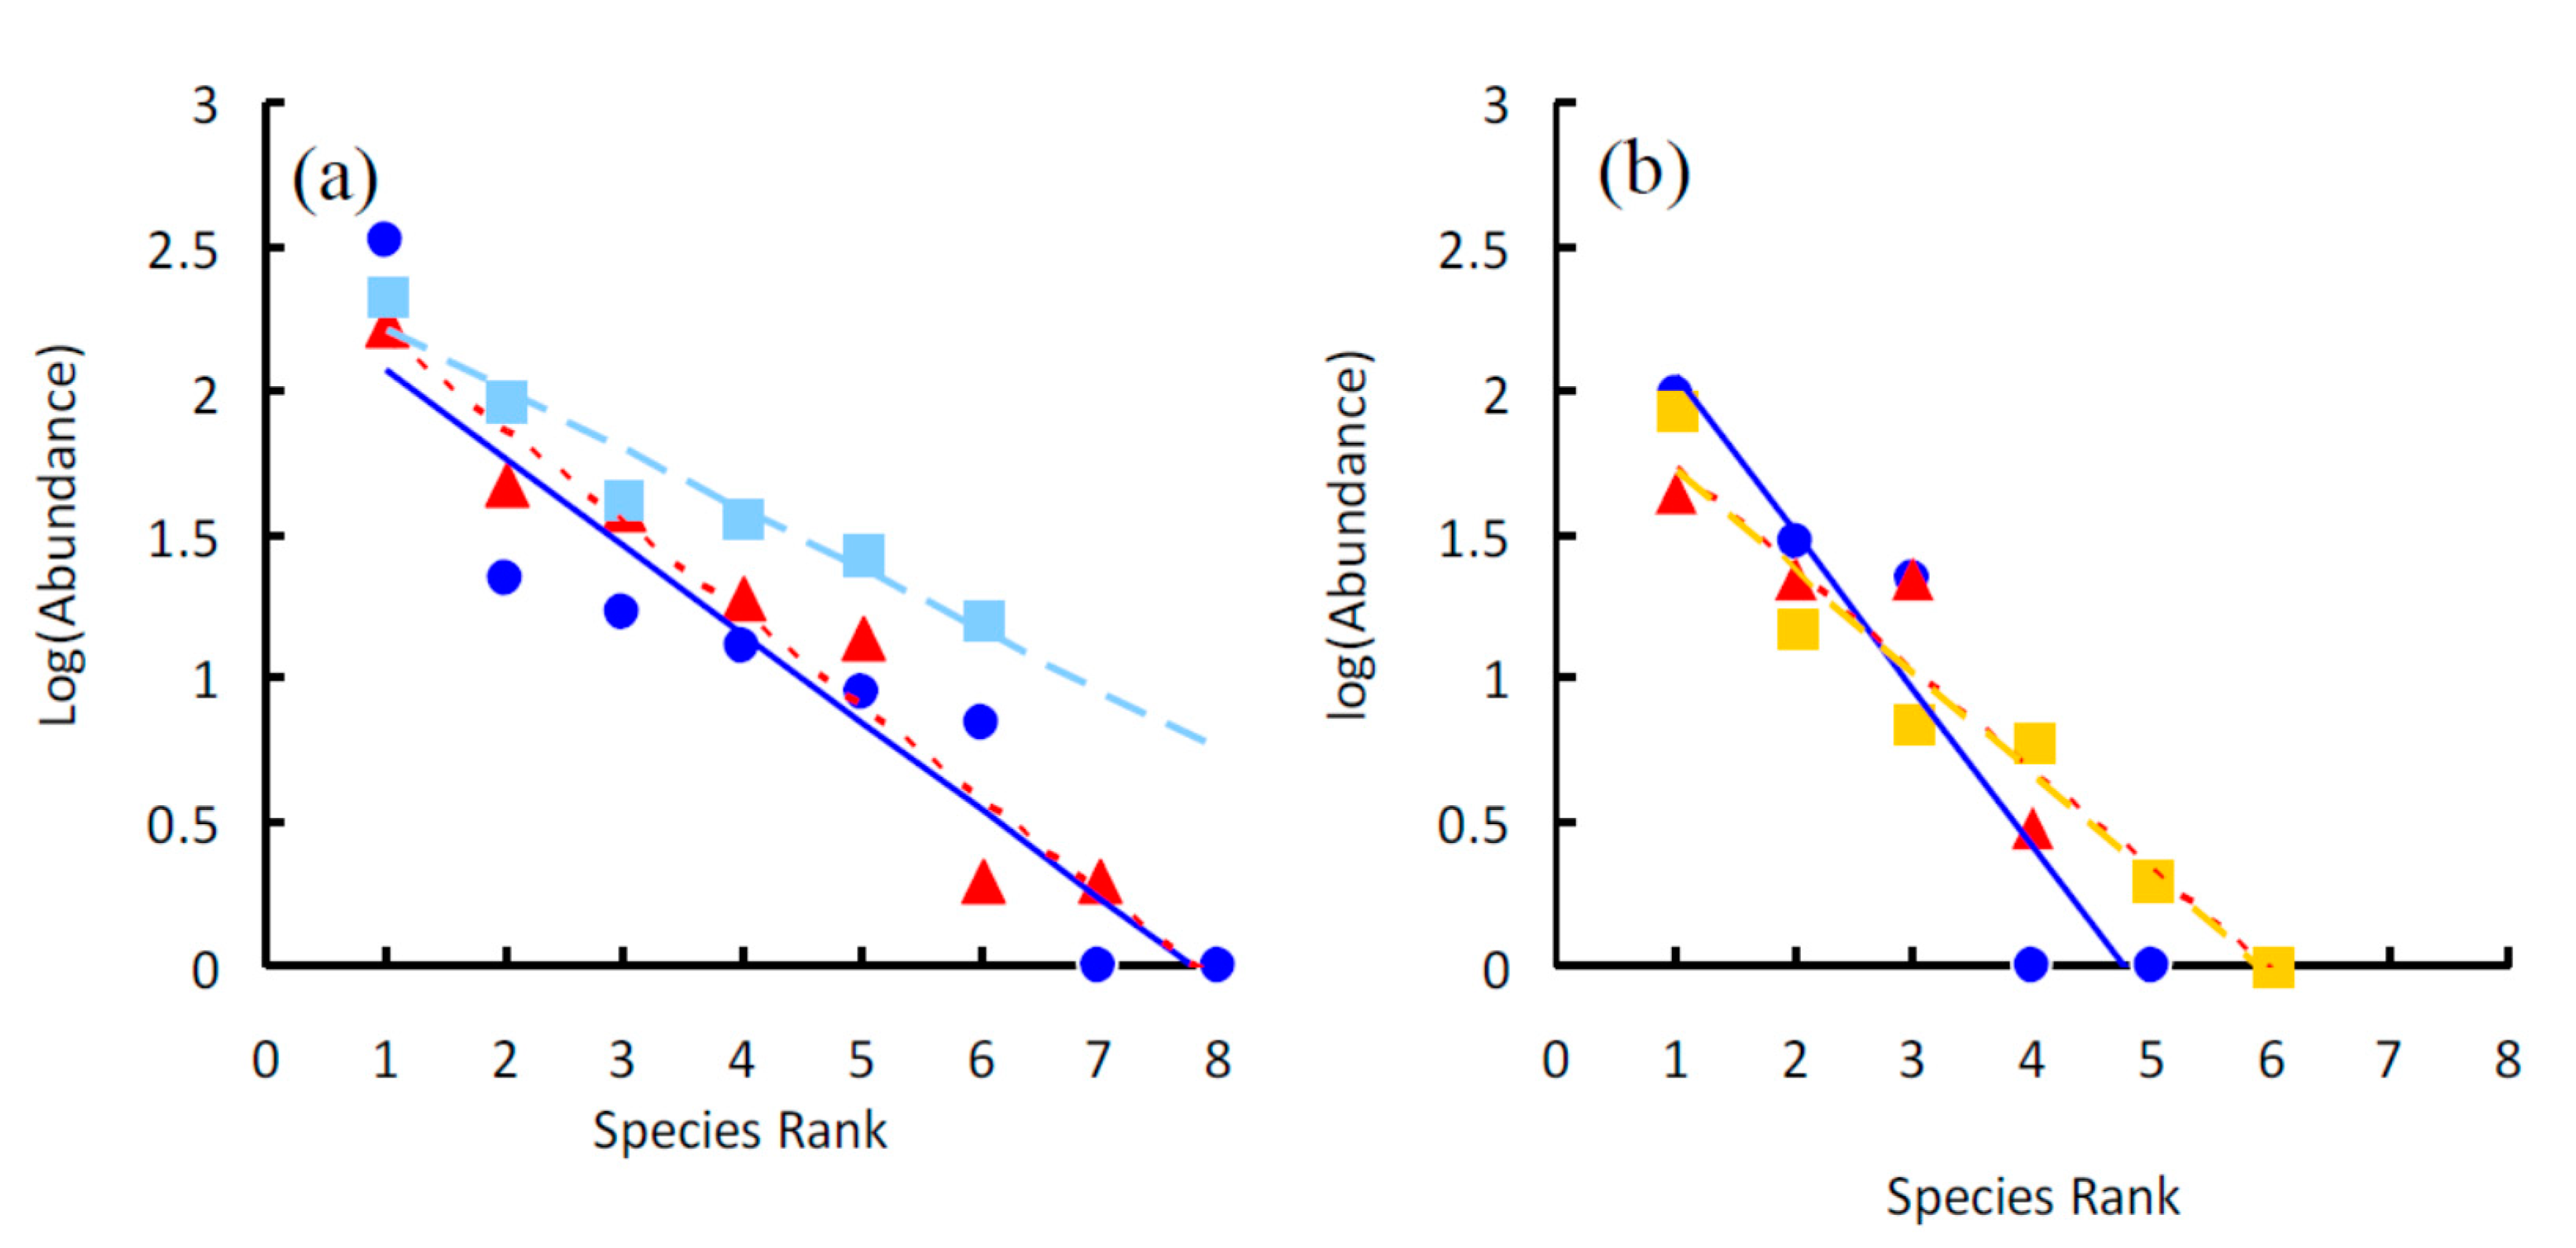
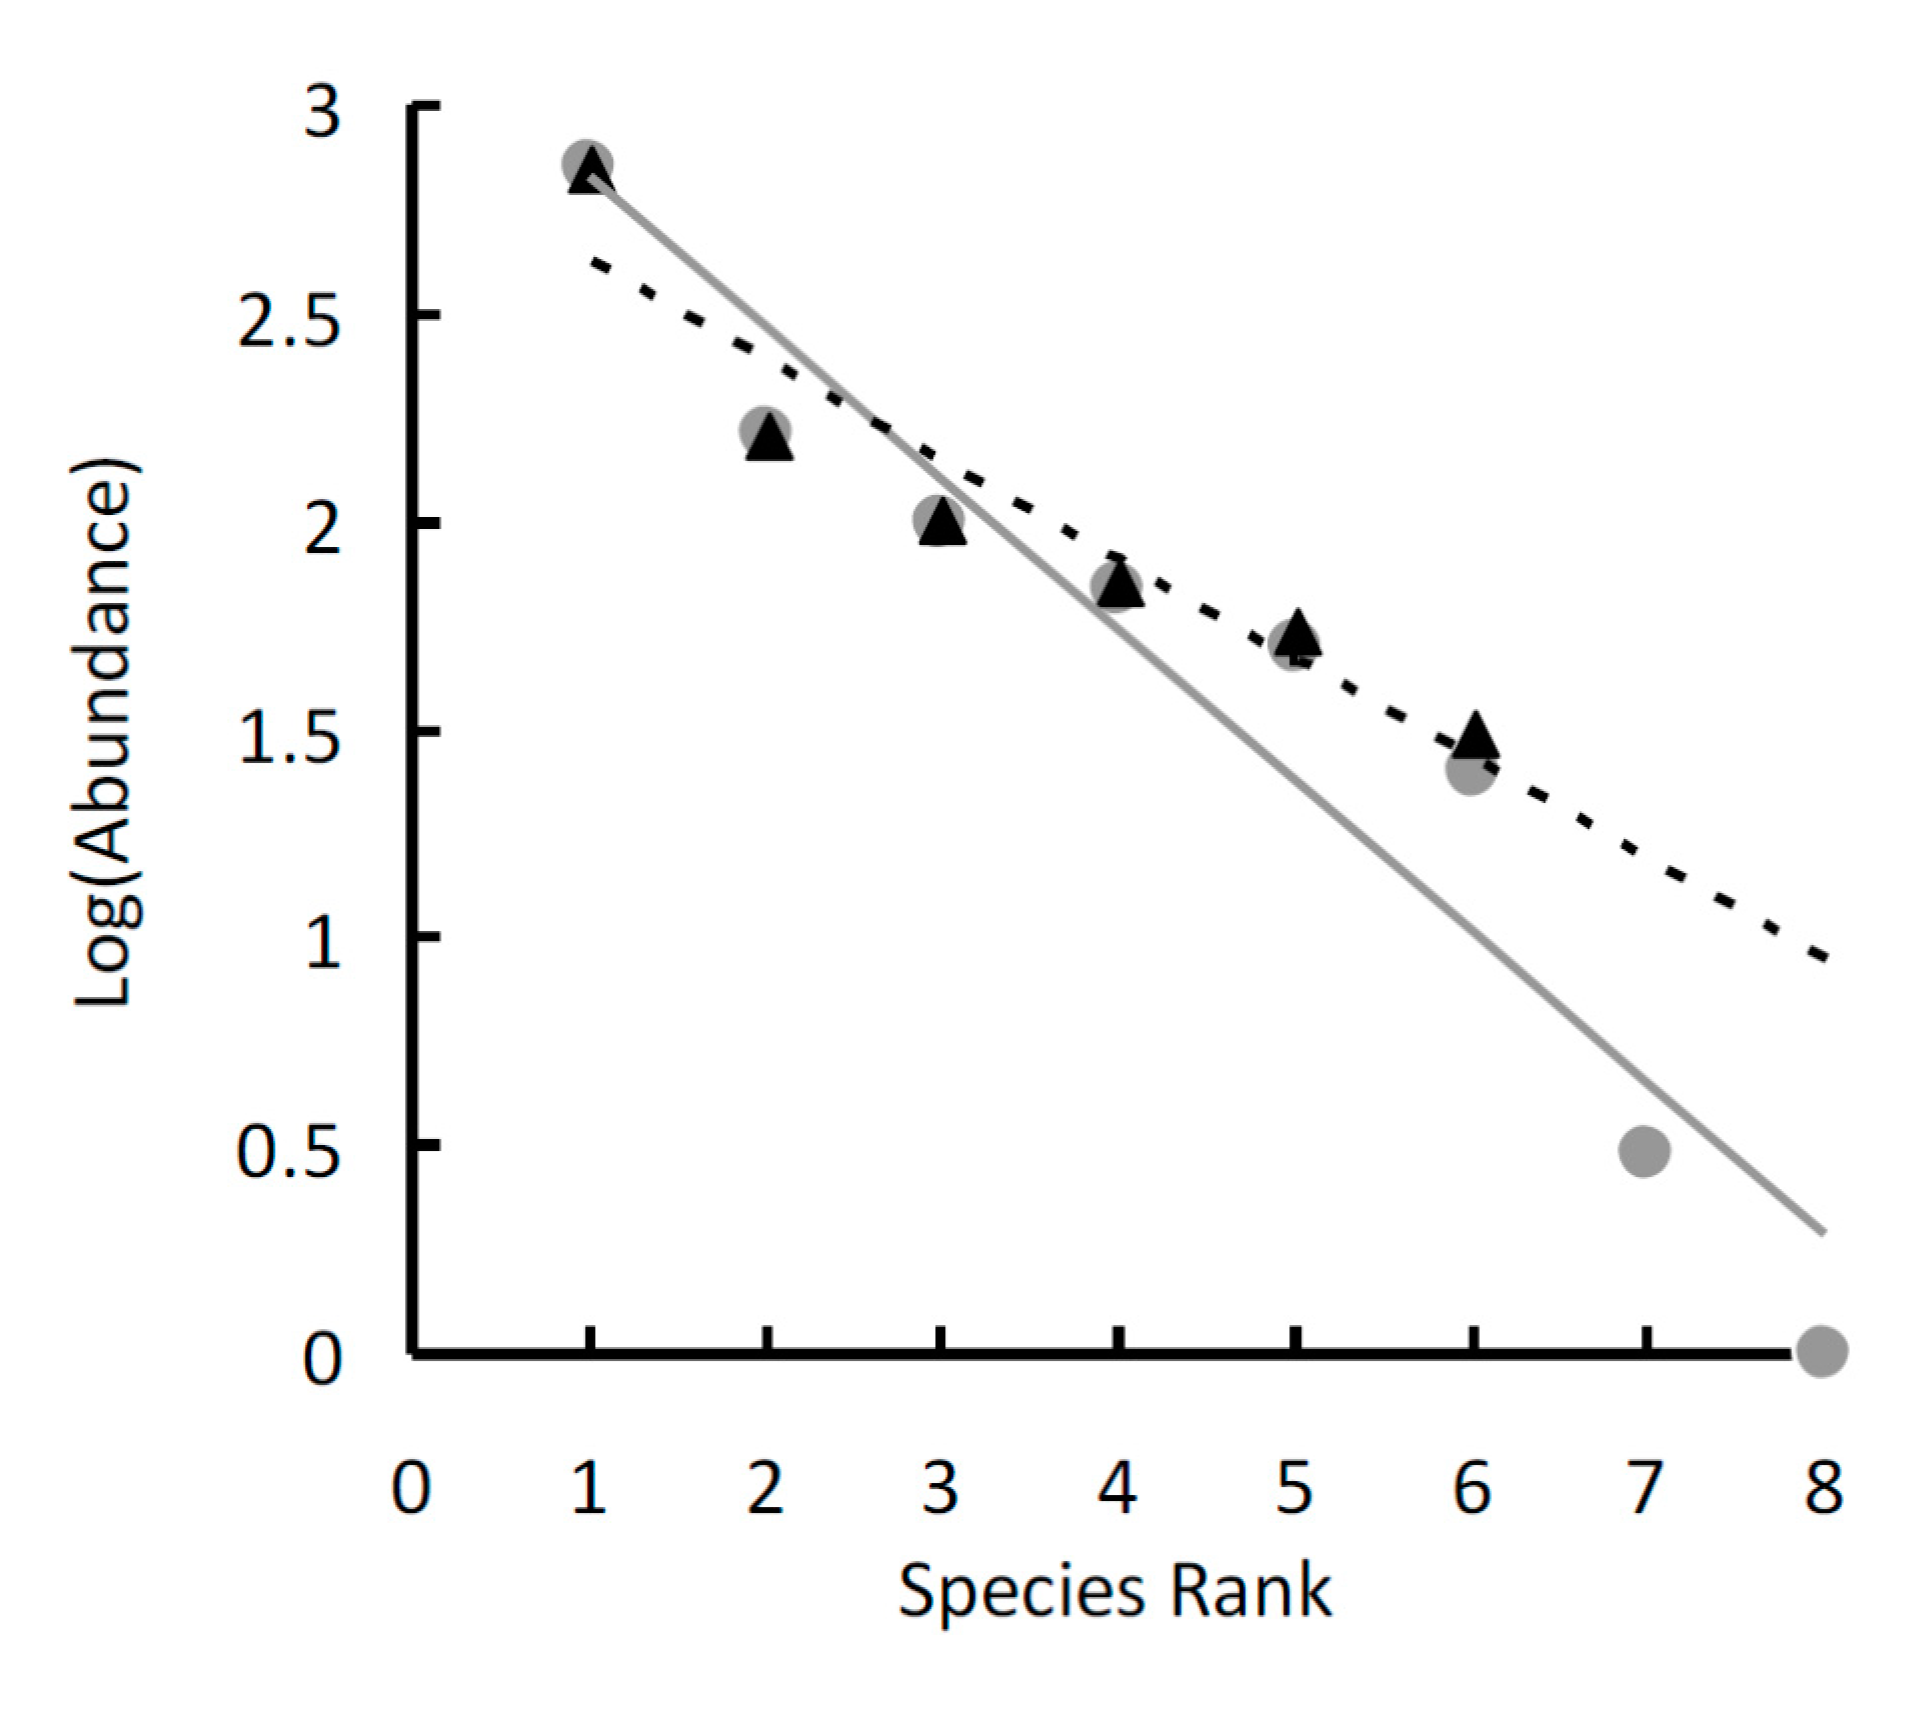
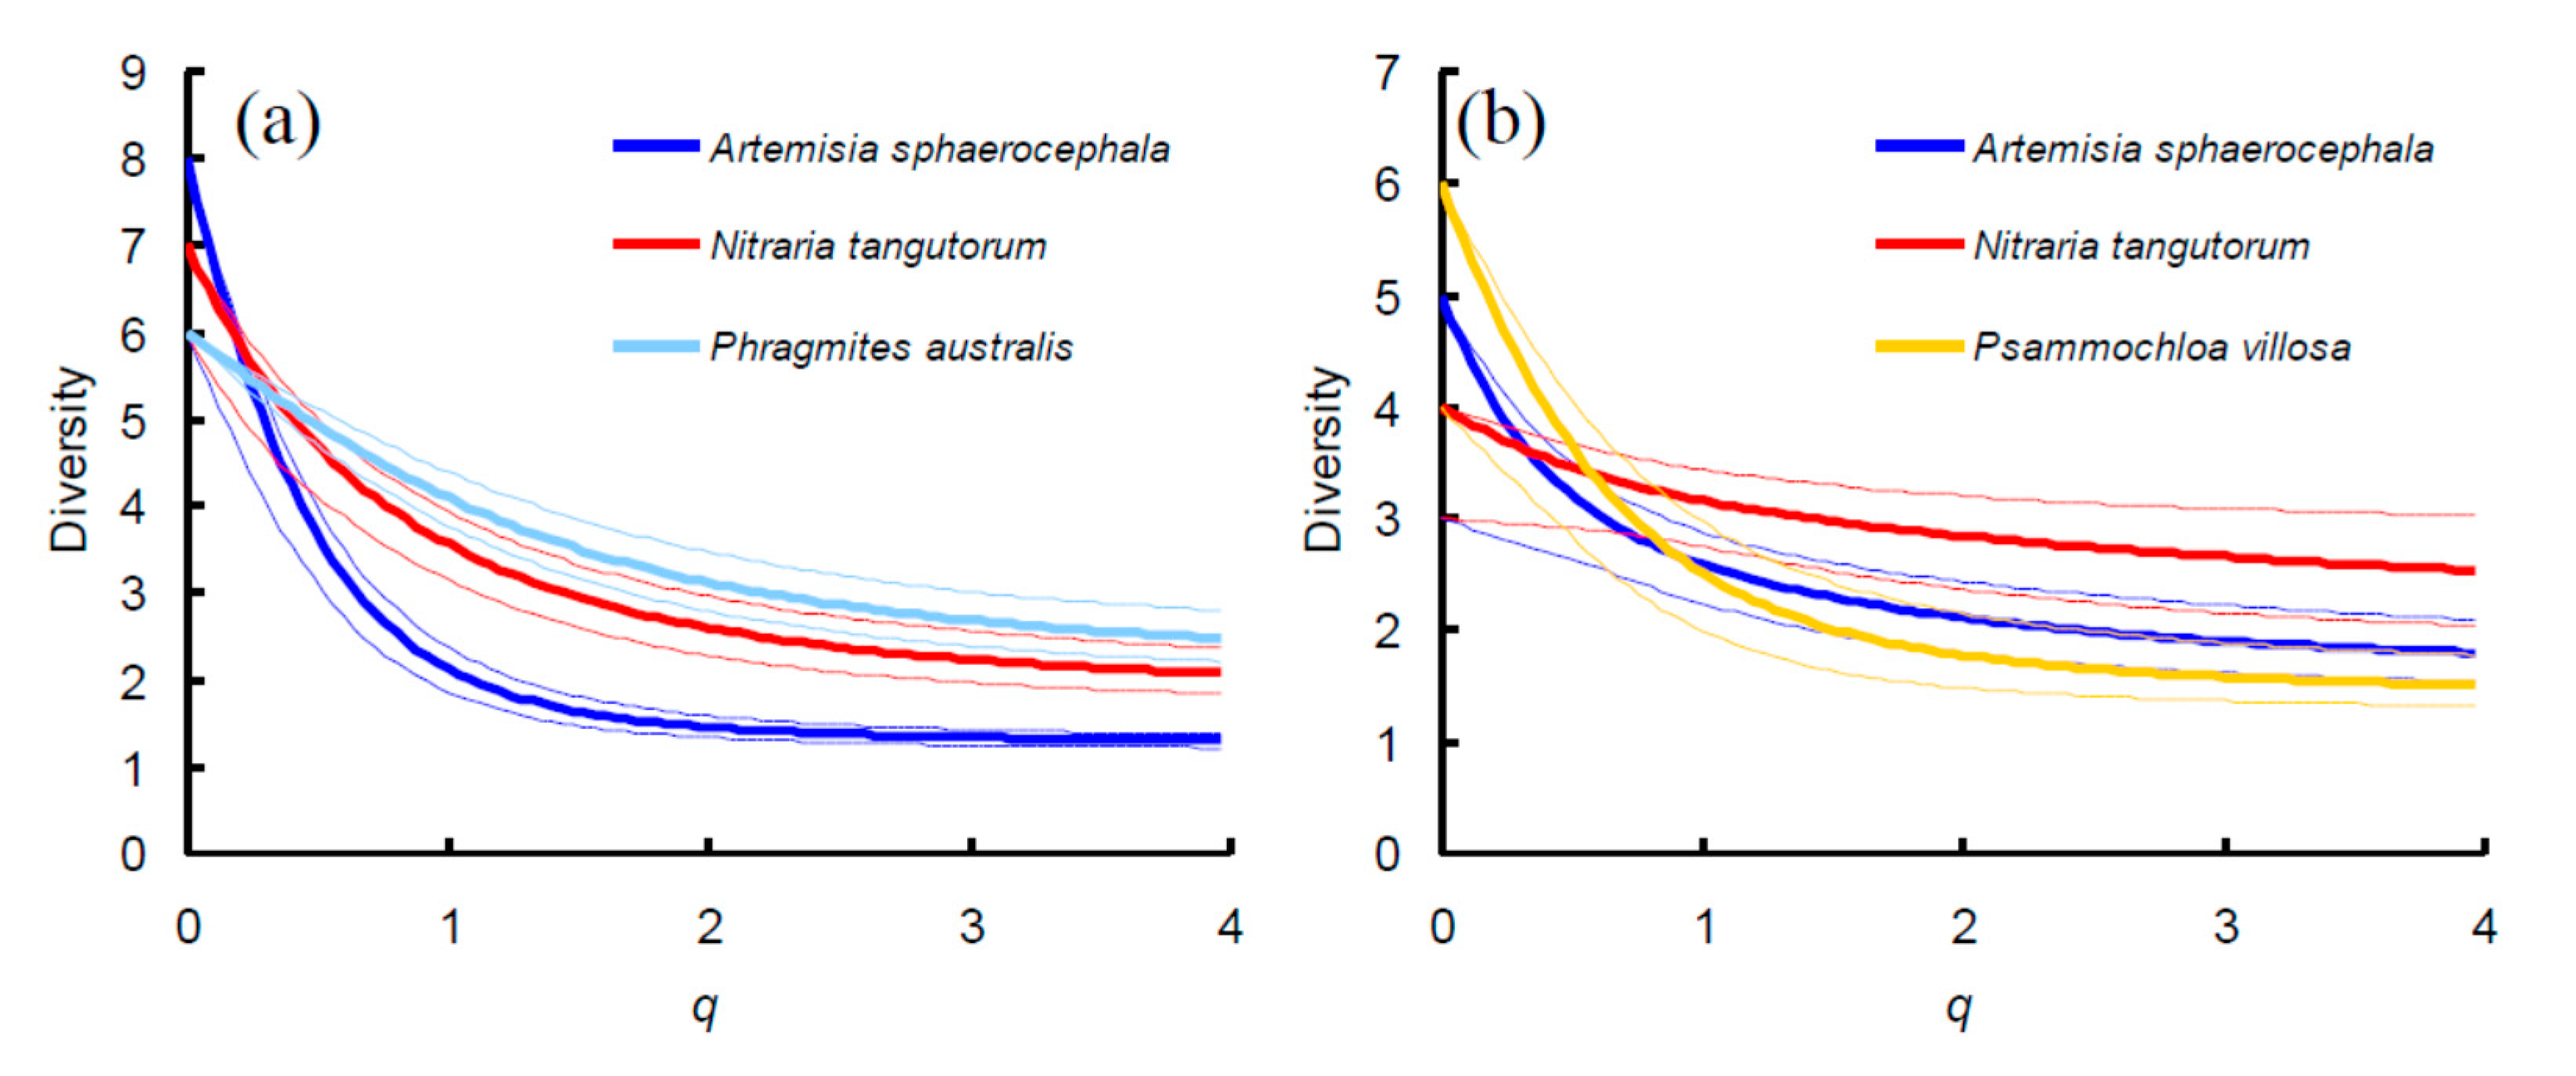
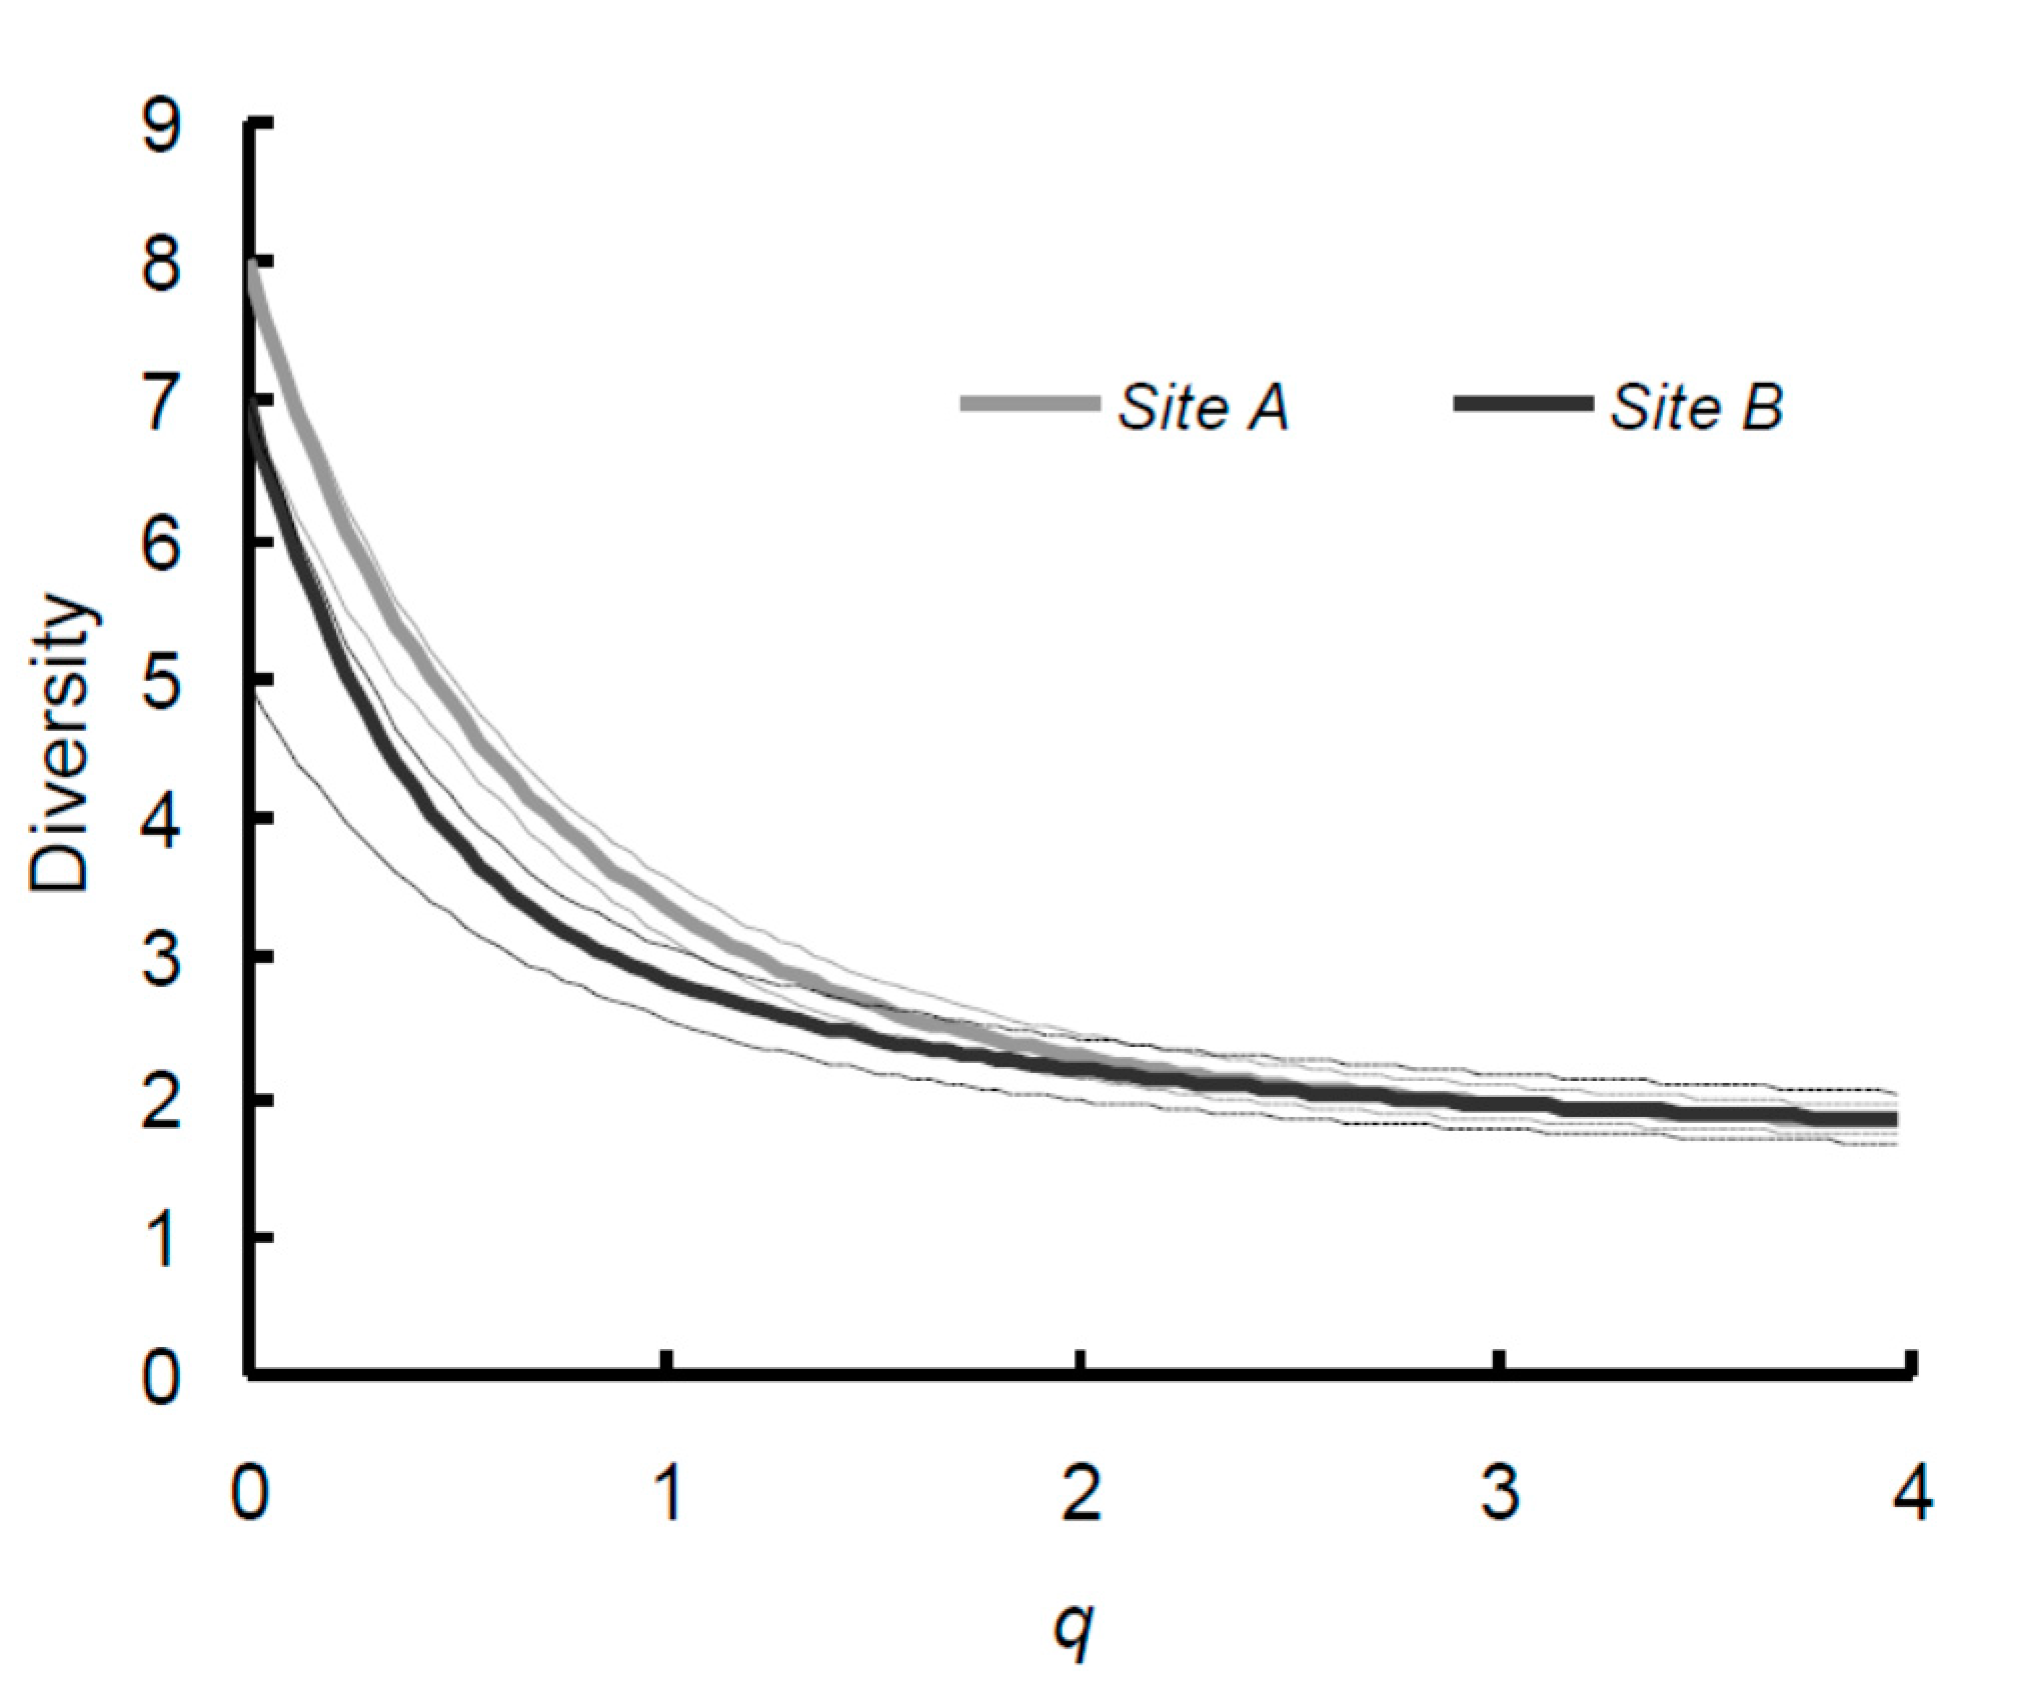
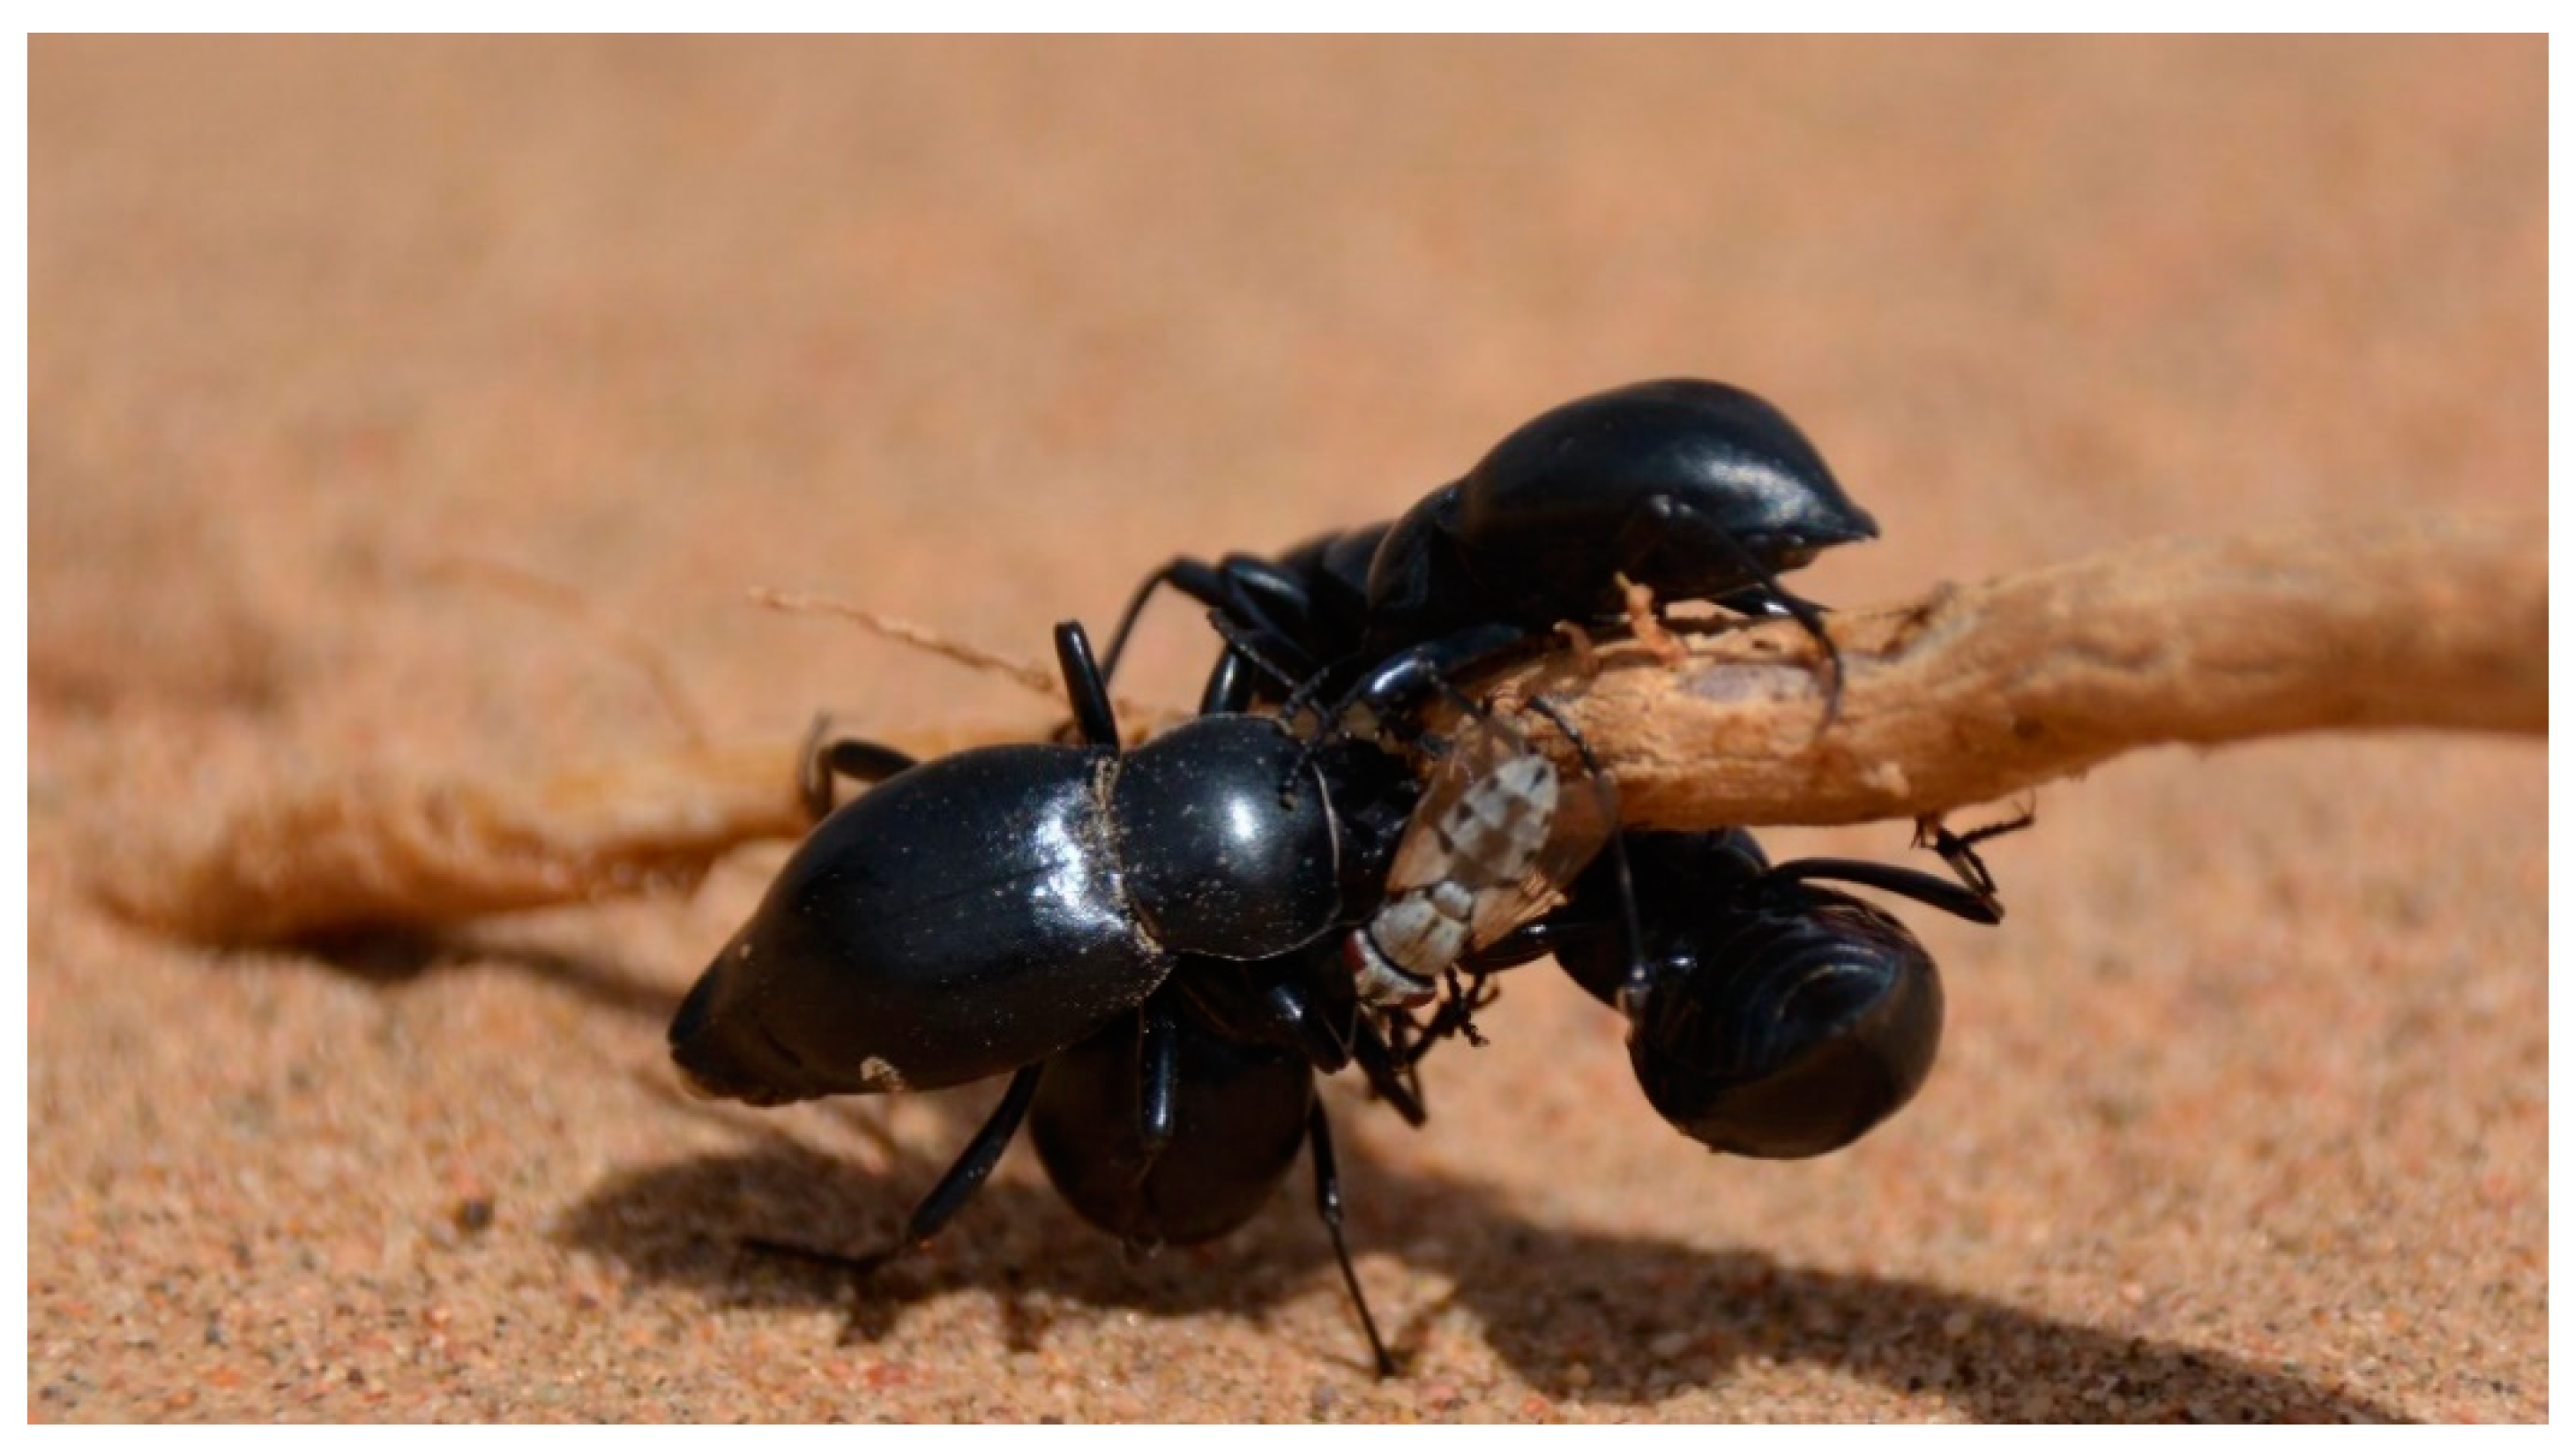
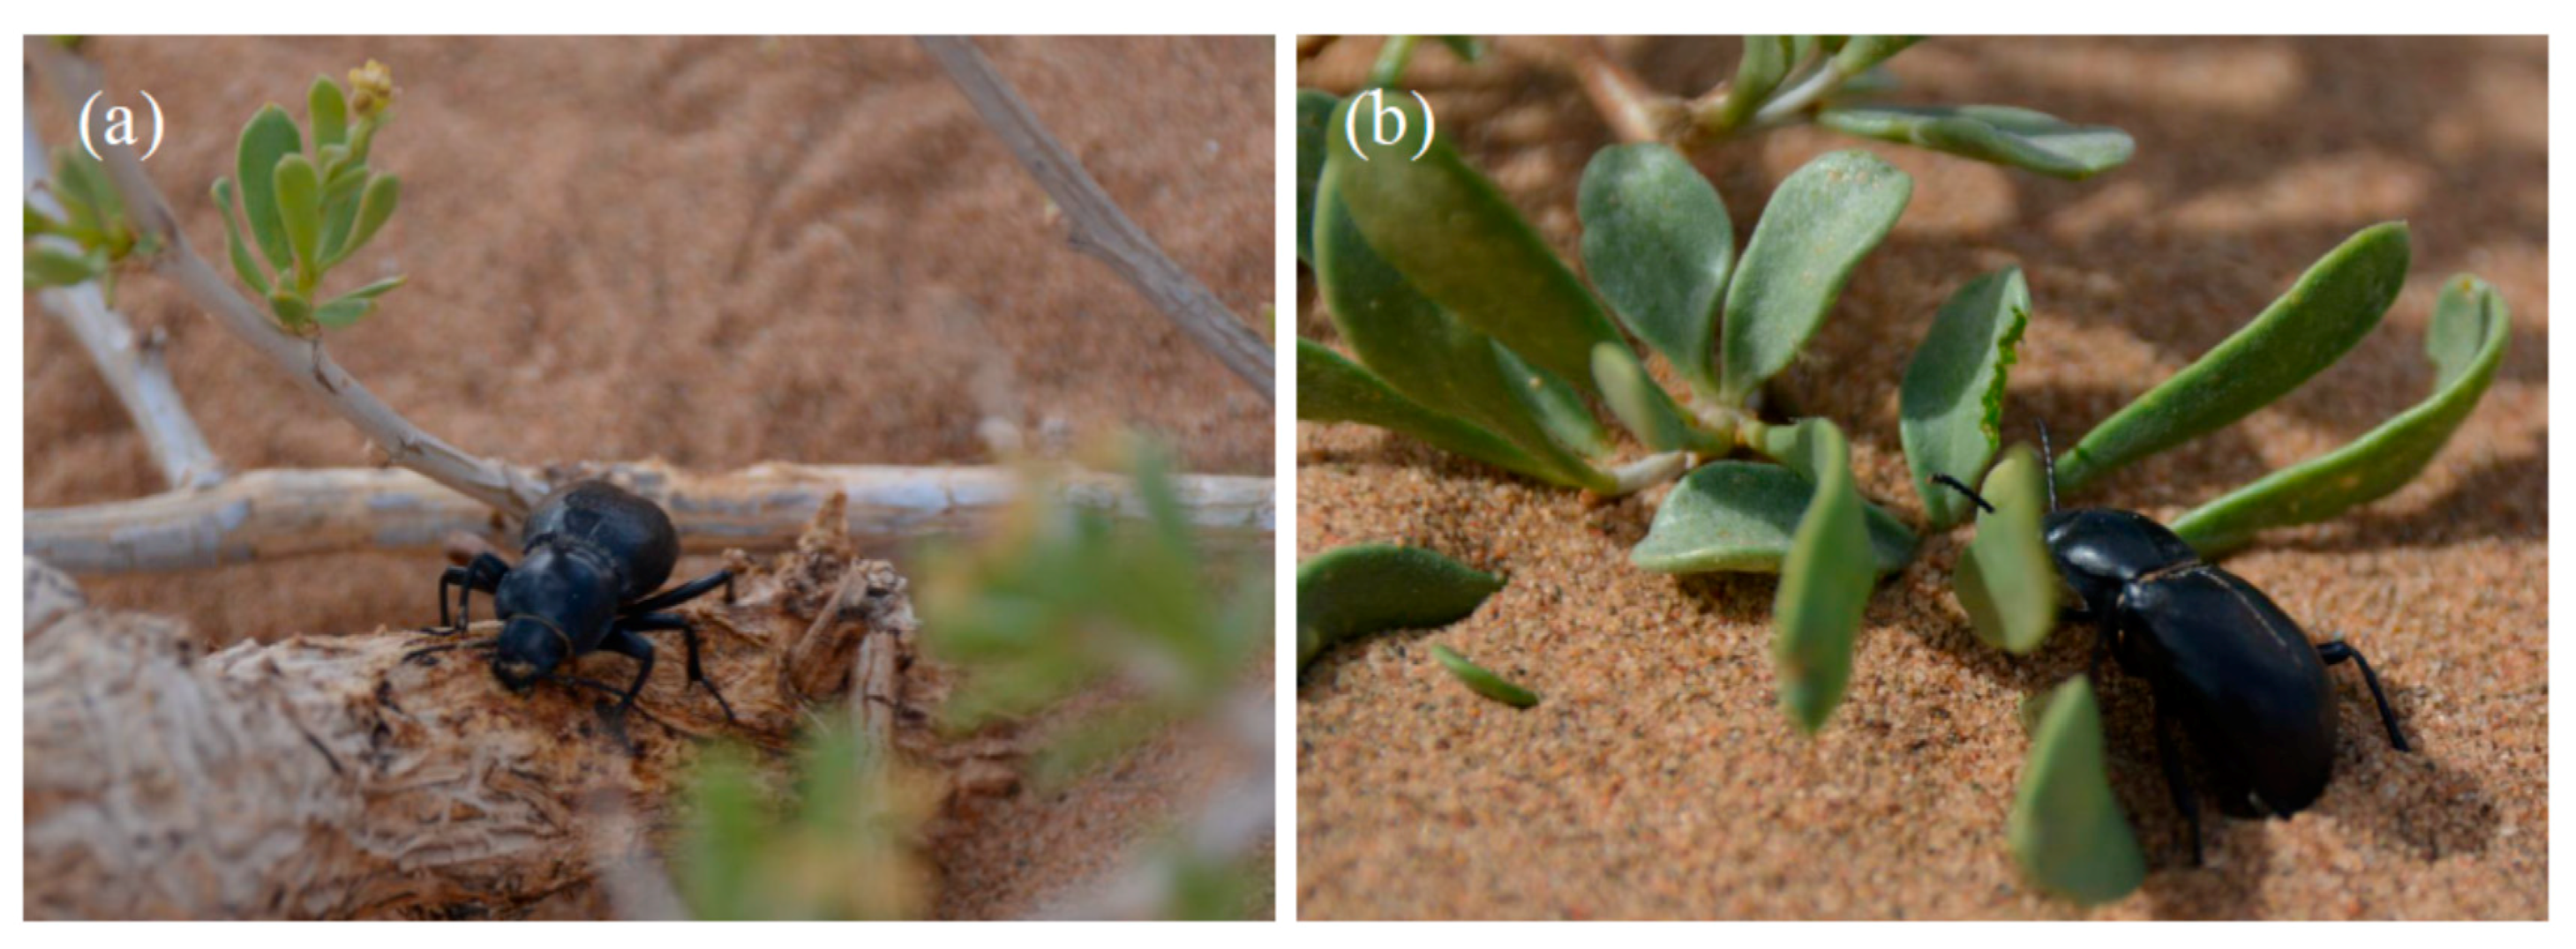
3. Results
4. Discussion
5. Conclusions
Author Contributions
Funding
Acknowledgments
Conflicts of Interest
References
- Fauth, J.E.; Bernardo, J.; Camara, M.; Resetarits, W.J., Jr.; Van Buskirk, J.; McCollum, S.A. Simplifying the jargon of Community Ecology: A conceptual approach. Am. Nat. 1996, 147, 282–286. [Google Scholar] [CrossRef]
- Stroud, J.T.; Bush, M.R.; Ladd, M.C.; Nowicki, R.J.; Shantz, A.A.; Sweatman, J. Is a community still a community? Reviewing definitions of key terms in community ecology. Ecol. Evol. 2015, 5, 4757–4765. [Google Scholar] [CrossRef]
- Freckleton, R.P.; Watkinson, A.R. Large-scale spatial dynamics of plants: Metapopulations, regional ensembles and patchy populations. J. Ecol. 2002, 90, 419–434. [Google Scholar] [CrossRef]
- Hilt, N.; Fiedler, K. Diversity and composition of Arctilidae moth ensembles along a successional gradient in the Ecuadorian Andes. Divers. Distrib. 2005, 11, 387–398. [Google Scholar] [CrossRef]
- Spengler, A.; Hartmann, P.; Buchon, D.; Schulze, C.H. How island size and isolation affect bee and wasp ensembles on small tropical islands: A case study from Kepulauan Seribu Indonesia. J. Biogeogr. 2011, 38, 247–258. [Google Scholar] [CrossRef]
- Estrada-Villegas, S.; McGill, B.J.; Kalko, E.K.V. Determinants of species evenness in a Neotropical bat ensemble. Oikos 2012, 121, 927–941. [Google Scholar] [CrossRef]
- Cantarino, C.M.; Roman, E.S. Morphological indices and resource portioning in a guild of Coleoptera Tenebrionidae at the coastal sand-dunes of Alicante (SE Spain). In Advances in Coleopterology; Zunino, M., Bellés, X., Blas, M., Eds.; European Association of Coleopterology: Barcelona, Spain, 1991; pp. 211–222. [Google Scholar]
- Frenzel, M.; Brandl, R. Diversity and composition of phytophagous insect guilds on Brassicaceae. Oecologia 1998, 113, 391–399. [Google Scholar] [CrossRef] [PubMed]
- Krasnov, B.R.; Shenbrot, G.I. Structure of communities of ground-dwelling animals at the junction of two phytogeographic zones. J. Biogeogr. 1998, 25, 1115–1131. [Google Scholar] [CrossRef]
- Olivier, R.D.S.; Aranda, R.; Godoi, M.N.; Graciolli, G. Effects of environmental heterogeneity on the composition of insect trophic guilds. Appl. Ecol. Environ. Res. 2014, 12, 209–220. [Google Scholar] [CrossRef]
- Istock, C.A. Population Characteristics of a Species Ensemble of Waterboatmen (Corixidae). Ecology 1973, 54, 535–544. [Google Scholar] [CrossRef]
- Cardoso, P.; Erwin, T.L.; Borges, P.A.V.; New, T.R. The seven impediments in invertebrate conservation and how to overcome them. Biol. Conserv. 2011, 144, 2647–2655. [Google Scholar] [CrossRef] [Green Version]
- Ahearn, G.A. Ecological factors affecting population sampling of desert tenebrionid beetles. Am. Midl. Nat. 1971, 86, 385–406. [Google Scholar] [CrossRef]
- Holm, E.; Edney, E.B. Daily activity of Namib Desert arthropods in relation to climate. Ecology 1973, 54, 45–56. [Google Scholar] [CrossRef]
- Slobodchikoff, C.N. Water balance and temperature preferences and their role in regulating activity times of tenebrionid beetles. Oikos 1983, 40, 113–119. [Google Scholar] [CrossRef]
- Ayal, Y.; Merkl, O. Spatial and temporal distribution of tenebrionid species (Coleoptera) in the Negev Highlands, Israel. J. Arid Environ. 1994, 27, 347–361. [Google Scholar] [CrossRef]
- Dajoz, R. Les Coléoptères Carabides et Ténébrionidés. Ecologie et Biologie; Lavoisier: Paris, France, 2002; pp. 1–522. [Google Scholar]
- Allsopp, P.G. The biology of false wireworms and their adults (soil-inhabiting Tenebrionidae) (Coleoptera): A review. Bull. Entomol. Res. 1980, 70, 343–379. [Google Scholar] [CrossRef]
- Holm, E.; Scholtz, C.H. Structure and pattern of the Namib Desert dune ecosystem at Gobabeb. Madoqua 1980, 12, 5–39. [Google Scholar]
- Louw, S. Species composition and seasonality of pitfall trapped Coleoptera at a site in the Central Orange Free State, South Africa. Navors. Nas. Mus. Res. Natl. Mus. 1987, 5, 415–453. [Google Scholar]
- Fattorini, S. Darkling beetle communities in two geologically contrasting biotopes: Testing biodiversity patterns by microsite comparisons. Biol. J. Linn. Soc. 2009, 98, 787–793. [Google Scholar] [CrossRef] [Green Version]
- Liu, J.-L.; Li, F.-R.; Liu, C.; Liu, Q.-J.; Niu, R.-X. Influences of shrub vegetation on distribution and diversity of a ground beetle community in a Gobi desert ecosystem. Biodivers. Conserv. 2012, 21, 2601–2619. [Google Scholar] [CrossRef]
- Liu, J.-L.; Zhao, W.-Z.; Li, F.-R. Effects of shrub presence and shrub species on ground beetle assemblages (Carabidae, Curculionidae and Tenebrionidae) in a sandy desert, northwestern China. J. Arid Land 2015, 7, 110–121. [Google Scholar] [CrossRef]
- Li, F.-R.; Liu, J.-L.; Sun, T.-S.; Ma, L.-F.; Liu, L.-L.; Yang, K. Impact of established shrub shelterbelts around oases on the diversity of ground beetles in arid ecosystems of Northwestern China. Insect Conserv. Diver. 2016, 9, 135–148. [Google Scholar] [CrossRef]
- Fattorini, S. Ecology and conservation of tenebrionid beetles in Mediterranean coastal areas. In Insect Ecology and Conservation; Fattorini, S., Ed.; Research Signpost: Trivandrum, Kerala, India, 2008; pp. 165–297. [Google Scholar]
- Gunter, N.L.; Levkaničová, Z.; Weir, T.H.; Ślipiński, A.; Cameron, S.L.; Bocak, L. Towards a phylogeny of darkling beetles, the Tenebrionoidea (Coleoptera). Mol. Phylogenet. Evol. 2014, 79, 305–312. [Google Scholar] [CrossRef] [PubMed]
- Kergoat, G.J.; Soldati, L.; Clamens, A.L.; Jourdan, H.; Jabbour-Zahab, R.; Genson, G.; Bouchard, P.; Condamine, F.L. Higher level molecular phylogeny of darkling beetles (Coleoptera: Tenebrionidae). Syst. Entomol. 2014, 39, 486–499. [Google Scholar] [CrossRef]
- Garner, W.; Steinberger, Y. A proposed mechanism for the formation of ‘fertile islands’ in the desert ecosystem. J. Arid Environ. 1989, 16, 257–262. [Google Scholar] [CrossRef]
- Vetaas, O.R. Micro-site effects of trees and shrubs in dry savannas. J. Veg. Sci. 1992, 3, 337–344. [Google Scholar] [CrossRef]
- Alpert, P.; Mooney, H.A. Resource heterogeneity generated by shrubs and topography on coastal sand dunes. Vegetatio 1996, 122, 83–93. [Google Scholar] [CrossRef]
- Shumway, S.W. Facilitative effects of a sand dune shrub on species growing beneath the shrub canopy. Oecologia 2000, 124, 138–148. [Google Scholar] [CrossRef]
- Facelli, J.M.; Temby, A.M. Multiple effects of shrubs on annual plant communities in arid lands of South Australia. Aust. Ecol. 2002, 27, 422–432. [Google Scholar] [CrossRef]
- Li, F.-R. Presence of shrubs influences the spatial pattern of soil seed banks in desert herbaceous vegetation. J. Veg. Sci. 2008, 20, 847–859. [Google Scholar] [CrossRef]
- Cushman, J.H.; Waller, J.C.; Hoak, D.R. Shrubs as ecosystem engineers in a coastal dune: Influences on plant populations, communities and ecosystems. J. Veg. Sci. 2010, 21, 821–831. [Google Scholar] [CrossRef] [Green Version]
- Rogers, L.E.; Woodley, N.E.; Sheldon, J.K.; Beedlow, P.A. Diets of darkling beetles (Coleoptera: Tenebrionidae) within a shrub-steppe ecosystem. Ann. Entomol. Soc. Am. 1988, 81, 782–791. [Google Scholar] [CrossRef] [Green Version]
- Peterson, A.C.; Hendrix, P.F.; Haydu, C.; Graham, R.C.; Quideau, S.A. Single-shrub influence on earthworms and soil macroarthropods in the southern California chaparral. Pedobiologia 2001, 45, 509–522. [Google Scholar] [CrossRef]
- Pen-Mouratov, S.; Rakhimbaev, M.; Barness, G.; Steinberger, Y. Spatial and temporal dynamics of nematode populations under Zygophyllum dumosum in arid environments. Eur. J. Soil Biol. 2004, 40, 31–46. [Google Scholar] [CrossRef]
- Mazía, C.N.; Chaneton, E.J.; Kitzberger, T. Small-scale habitat use and assemblage structure of ground dwelling beetles in a Patagonian shrub steppe. J. Arid Environ. 2006, 67, 177–194. [Google Scholar] [CrossRef]
- Liu, R.-T.; Zhao, H.-L.; Zhao, X.-Y.; Drake, S. Facilitative effects of shrubs in shifting sand on soil macrofaunal community in Horqin sand land of inner Mongolia, northern China. Eur. J. Soil Biol. 2011, 47, 316–321. [Google Scholar] [CrossRef]
- Wardle, D.A. Communities and Ecosystems: Linking the Aboveground and Belowground Components; Princeton University Press: Princeton, NJ, USA, 2002; pp. 1–400. [Google Scholar]
- Milcu, A.; Partsch, S.; Langel, R.; Scheu, S. The response of decomposers (earthworms, springtails and microorganisms) to variations in species and functional group diversity of plants. Oikos 2006, 112, 513–524. [Google Scholar] [CrossRef]
- Sylvain, Z.A.; Wall, D.H. Linking soil biodiversity and vegetation: Implications for a changing planet. Am. J. Bot. 2011, 98, 517–527. [Google Scholar] [CrossRef]
- Li, G.-Q.; Jin, M.; Chen, X.-M.; Wen, L.-J. Environmental changes in the Ulan Buh Desert, southern Inner Mongolia, China since the middle Pleistocene based on sedimentology, chronology and proxy indexes. Quat. Sci. Rev. 2015, 128, 69–80. [Google Scholar] [CrossRef]
- Chen, F.-H.; Li, G.-Q.; Zhao, H.; Jin, M.; Chen, X.-M.; Fan, Y.-X.; Liu, X.-K.; Wu, D.; Madsen, D. Landscape evolution of the Ulan Buh Desert in northern China during the late Quaternary. Quat. Res. 2013, 81, 476–487. [Google Scholar]
- Chun, X.; Chen, F.-H.; Fan, Y.-X. Formation of Ulan Buh Desert and its environmental changes during the Holocene. Front. Earth Sci. China 2008, 2, 327–332. [Google Scholar] [CrossRef]
- Yang, W.-B.; Feng, W.; Jia, Z.-Q.; Zhu, Y.-J.; Guo, J.-Y. Soil water threshold for the growth of Haloxylon ammodendron in the Ulan Buh desert in arid northwest China. S. Afr. J. Bot. 2014, 92, 53–58. [Google Scholar] [CrossRef] [Green Version]
- Pfeiffer, M.; Bayannasan, E. Diversity and Community Pattern of Darkling Beetles (Coleoptera: Tenebrionidae) along an Ecological Gradient in Arid Mongolia. In Erforschung Biologischer Ressourcen der Mongolei/Exploration into the Biological Resources of Mongolia; Martin-Luther-Universität Halle-Wittenberg: Halle & Wittenberg, Germany, 2012; Volume 12, pp. 251–266. [Google Scholar]
- Khurelpurev, O.; Pfeiffer, M. Coleoptera in the Altai Mountains (Mongolia): Species richness and community patterns along an ecological gradient. J. Asia Pac. Biodivers. 2017, 10, 362–370. [Google Scholar] [CrossRef]
- Giller, P.S. Community Structure and the Niche; Chapman and Hall: London, UK, 1984; pp. 1–176. [Google Scholar]
- Fattorini, S. A simple method to fit geometric series and broken stick models in community ecology and island biogeography. Acta Oecol. 2005, 28, 199–205. [Google Scholar] [CrossRef]
- McGill, B.J.; Etienne, R.S.; Gray, J.S.; Alonso, D.; Anderson, M.J.; Benecha, H.K.; Dornelas, M.; Enquist, B.J.; Green, J.L.; He, F.; et al. Species abundance distributions: Moving beyond single prediction theories to integration within an ecological framework. Ecol. Lett. 2007, 10, 995–1015. [Google Scholar] [CrossRef]
- May, R.M. Patterns of species abundance and diversity. In Ecology and Evolution of Communities; Cody, M.L., Diamond, M.J., Eds.; Harvard University Press: Cambridge, MA, USA, 1975; pp. 81–120. [Google Scholar]
- Magurran, A.E. Ecological Diversity and its Measurement; Princeton University Press: Princeton, NJ, USA, 1988; pp. 1–192. [Google Scholar]
- Hayek, L.C.; Buzas, M.A. Surveying Natural Populations. Quantitative Tools for Assessing Biodiversity; Columbia University Press: New York, NY, USA, 2010; pp. 1–616. [Google Scholar]
- He, F.; Tang, D.-L. Estimating the niche pre-emption of the geometric series. Acta Oecol. 2008, 33, 105–107. [Google Scholar] [CrossRef]
- Chao, A.; Gotelli, N.J.; Hsieh, T.C.; Sander, E.L.; Ma, K.H.; Colwell, R.K.; Ellison, A.M. Rarefaction and extrapolation with Hill numbers: A framework for sampling and estimation in species diversity studies. Ecol. Monogr. 2014, 84, 45–67. [Google Scholar] [CrossRef] [Green Version]
- Hammer, Ø.; Harper, D.A.T.; Ryan, P.D. PAST—Palaeontological statistics software package for education and data analysis, ver. 1.89. Palaeontol. Electron. 2001, 4, 9. [Google Scholar]
- Thomas, D.B. Tenebrionid beetle diversity and habitat complexity in the Eastern Mojave Desert. Coleopt. Bull. 1983, 37, 135–147. [Google Scholar]
- Aldryhim, Y.N.; Mills, C.W., III; Aldawood, A.S. Ecological distribution and seasonality of darkling beetles (Coleoptera: Tenebrionidae) in the central region of Saudi Arabia. J. Arid Environ. 1992, 23, 415–422. [Google Scholar] [CrossRef]
- Doyen, J.T.; Tschinkel, W.R. Population size, microgeographic distribution and habitat separation in some tenebrionid beetles (Coleoptera). Ann. Entomol. Soc. Am. 1974, 67, 617–626. [Google Scholar] [CrossRef]
- Fattorini, S.; Santoro, R.; Maurizi, E.; Acosta, A.T.R.; Di Giulio, A. Environmental tuning of an insect ensemble: The tenebrionid beetles inhabiting a Mediterranean coastal dune zonation. Comptes Rendus Biol. 2012, 335, 708–711. [Google Scholar] [CrossRef] [PubMed]
- Fattorini, S.; Bergamaschi, D.; Mantoni, C.; Acosta, A.T.R.; Di Giulio, A. Niche partitioning in tenebrionid species (Coleoptera: Tenebrionidae) inhabiting Mediterranean coastal dunes. Eur. J. Entomol. 2016, 113, 462–468. [Google Scholar] [CrossRef] [Green Version]
- Fattorini, S.; Bergamaschi, D.; Galassi, D.M.P.; Biondi, M.; Acosta, A.T.R.; Di Giulio, A. Spatial organization of an insect ensemble in a Mediterranean ecosystem: The tenebrionid beetles (Coleoptera Tenebrionidae) inhabiting an Adriatic coastal sand dune area. Acta Zoo. Bulg. 2017, 69, 201–208. [Google Scholar]
- Whittaker, R.H. Evolution and measurement of species diversity. Taxon 1972, 21, 213–251. [Google Scholar] [CrossRef] [Green Version]
- Bazzaz, F.A. Plant species diversity in old-field successional ecosystems in southern Illinois. Ecology 1975, 56, 485–488. [Google Scholar] [CrossRef]
- Gray, J.S. The Ecology of Marine Sediments—An Introduction to the Structures and Functions of Benthic Communities (Cambridge Studies in Modern Biology 2); Cambridge University Press: Cambridge, UK, 1981; pp. 1–185. [Google Scholar]
- Nummelin, M. Log-normal distribution of species abundances is not a universal indicator of rain forest disturbance. J. Appl. Ecol. 1998, 35, 454–457. [Google Scholar] [CrossRef]
- Nummelin, M.; Kaitala, S. Do species dominance indices indicate rain forest disturbance by logging? Biotropica 2004, 36, 628–632. [Google Scholar] [CrossRef]
- Whittaker, R.H. Dominance and diversity in land plant communities. Science 1965, 147, 250–260. [Google Scholar] [CrossRef]
- Keeley, J.E.; Fotheringham, C.J. Species-area relationships in Mediterranean climate plant communities. J. Biogeogr. 2003, 30, 1629–1657. [Google Scholar] [CrossRef]
- Niu, Y.-P.; Ren, G.-D.; Lin, G.; Di Biase, L.; Fattorini, S. Community structure of tenebrionid beetles in the Ulan Buh Desert (Inner Mongolia, China) (Coleoptera: Tenebrionidae). Fragm. Entomol. 2019, 51, 193–200. [Google Scholar] [CrossRef]
- Morris, E.K.; Caruso, T.; Buscot, F.; Fischer, M.; Hancock, C.; Maier, T.S.; Meiners, T.; Müller, C.; Obermaier, E.; Prati, D.; et al. Choosing and using diversity indices: Insights for ecological applications from the German Biodiversity Exploratories. Ecol. Evol. 2014, 4, 3514–3524. [Google Scholar] [CrossRef] [PubMed] [Green Version]
- Ba, Y.-B.; Ren, G.-D. Taxonomy and distribution of Sternotrigon Skopin in China (Coleoptera, Tenebrionidae). Zootaxa 2013, 3693, 568–578. [Google Scholar] [CrossRef] [PubMed]
- Ren, G.D.; Ba, Y.-B. Fauna of Soil Darkling Beetles in China. Volume 2 Tentyriforms (Coleoptera: Tenebrionidae); Science Press: Beijing, China, 2009; pp. 1–225. [Google Scholar]
- Zhao, Z.-H.; Reddy, G.V.; Wei, S.-H.; Zhu, M.-M.; Zhang, K.-Y.; Yu, H.-Q.; Wang, Z.-J.; Jiang, Q.; Zhang, R. Plant cover associated with aboveground net primary productivity (ANPP) mediates insect community composition in steppes of Northwest China. J. Asia Pac. Entomol. 2018, 21, 361–366. [Google Scholar] [CrossRef] [Green Version]
- Carpaneto, G.M.; Fattorini, S. Spatial and seasonal organisation of a darkling beetle (Coleoptera Tenebrionidae) community inhabiting a Mediterranean coastal dune system. Ital. J. Zool. 2001, 68, 207–214. [Google Scholar] [CrossRef]
- Fattorini, S.; Carpaneto, G.M. Tenebrionid density in Mediotyrrhenian coastal dunes: Habitat and temporal variations (Coleoptera, Tenebrionidae). Fragm. Entomol. 2001, 33, 97–118. [Google Scholar]


| Tenebrionid Species | Ar. sph. | N. tan. | Ph. aus. | Total A | Ar. sph. | N. tan. | P. vil. | Total B |
|---|---|---|---|---|---|---|---|---|
| Anatolica mucronata Reitter, 1889 | 328 | 170 | 215 | 713 * | 22 | 22 | 7 | 51 * |
| Anatolica potanini Reitter, 1889 | 17 | 14 | 16 | 47 | 97 | 44 | 86 | 227 * |
| Anatolica immarginata Reitter, 1889 | 22 | 39 | 92 | 153 * | 0 | 0 | 0 | 0 |
| Anatolica suturalis Reitter, 1889 | 7 | 2 | 36 | 45 * | 0 | 0 | 0 | 0 |
| Microdera kraatzi alashanica Skopin, 1964 | 1 | 2 | 0 | 3 | 0 | 3 | 6 | 9 |
| Epitrichia semenovi Bogachev, 1949 | 13 | 48 | 27 | 88 * | 1 | 0 | 2 | 3 |
| Sternotrigon zichyi (Csiki, 1901) | 0 | 0 | 0 | 0 | 30 | 22 | 15 | 67 |
| Mantichorula semenowi Reitter, 1889 | 9 | 19 | 42 | 70 * | 1 | 0 | 0 | 1 |
| Melanesthes jenseni meridionalis Kaszab, 1968 | 0 | 0 | 0 | 0 | 0 | 0 | 1 | 1 |
| Blaps kiritshenkoi Semenov et Bogatshev, 1936 | 1 | 0 | 0 | 1 | 0 | 0 | 0 | 0 |
| Total | 398 | 294 | 428 | 1120 | 151 | 91 | 117 | 359 |
| Ensemble | Intercept | Slope | R2 | t | P | k |
|---|---|---|---|---|---|---|
| Site A | ||||||
| Artemisia sphaerocephala | 2.374 ± 0.245 | −0.305 ± 0.049 | 0.868 | −6.284 | 0.001 | 0.563 |
| Nitraria tangutorum | 2.503 ± 0.161 | −0.321 ± 0.036 | 0.941 | −8.943 | <0.001 | 0.518 |
| Phragmites australis | 2.416 ± 0.104 | −0.209 ± 0.027 | 0.938 | −7.783 | 0.001 | 0.340 |
| Total Site A | 3.194 ± 0.214 | −0.364 ± 0.042 | 0.925 | −8.590 | <0.001 | 0.609 |
| Site B | ||||||
| Artemisia sphaerocephala | 2.597 ± 0.353 | −0.545 ± 0.106 | 0.897 | −5.119 | 0.014 | 0.681 |
| Nitraria tangutorum | 2.076 ± 0.333 | −0.350 ± 0.122 | 0.806 | −2.880 | 0.102 | 0.591 |
| Psammochloa villosa | 2.076 ± 0.166 | −0.353 ± 0.043 | 0.945 | −8.302 | 0.001 | 0.590 |
| Total Site B | 2.865 ± 0.157 | −0.239 ± 0.040 | 0.899 | −5.951 | 0.004 | 0.611 |
© 2020 by the authors. Licensee MDPI, Basel, Switzerland. This article is an open access article distributed under the terms and conditions of the Creative Commons Attribution (CC BY) license (http://creativecommons.org/licenses/by/4.0/).
Share and Cite
Niu, Y.; Ren, G.; Lin, G.; Di Biase, L.; Fattorini, S. Fine-Scale Vegetation Characteristics Drive Insect Ensemble Structures in a Desert Ecosystem: The Tenebrionid Beetles (Coleoptera: Tenebrionidae) Inhabiting the Ulan Buh Desert (Inner Mongolia, China). Insects 2020, 11, 410. https://doi.org/10.3390/insects11070410
Niu Y, Ren G, Lin G, Di Biase L, Fattorini S. Fine-Scale Vegetation Characteristics Drive Insect Ensemble Structures in a Desert Ecosystem: The Tenebrionid Beetles (Coleoptera: Tenebrionidae) Inhabiting the Ulan Buh Desert (Inner Mongolia, China). Insects. 2020; 11(7):410. https://doi.org/10.3390/insects11070410
Chicago/Turabian StyleNiu, Yiping, Guodong Ren, Giulia Lin, Letizia Di Biase, and Simone Fattorini. 2020. "Fine-Scale Vegetation Characteristics Drive Insect Ensemble Structures in a Desert Ecosystem: The Tenebrionid Beetles (Coleoptera: Tenebrionidae) Inhabiting the Ulan Buh Desert (Inner Mongolia, China)" Insects 11, no. 7: 410. https://doi.org/10.3390/insects11070410