A Mathematical Solution for Calculating the Springback of Laminated Beech Stacks Molded within the Elastic Range


Faculty of Wood Engineering, Eberswalde University for Sustainable Development, Schicklerstraße 5, D-16225 Eberswalde, Germany
*
Author to whom correspondence should be addressed.
Forests 2020, 11(7), 725; https://doi.org/10.3390/f11070725
Submission received: 15 May 2020
/
Revised: 21 June 2020
/
Accepted: 30 June 2020
/
Published: 2 July 2020
(This article belongs to the Special Issue Selected Contributions from WSE2019—The 15th Annual Meeting of the Northern European Network for Wood Science and Engineering)
Abstract
:The springback effect in molded wood laminations within the elastic range has, to date, not yet been mathematically described. Once cured, residual internal stresses within the laminations cause the final form to deviate from that of the die. Test pieces of beech laminations of 1 mm, 2 mm and 4 mm thicknesses and stack sizes of between 2 and 16 laminations were used. The elasticity value of each stack was obtained using non-glued laminations in a three-point bending test within the elastic region. The laminations were glued with polyurethane resin and mounted in a radius form die. The stress induced by the die onto the stack is within the elastic region of the material without any prior chemical or physical plasticisation of the wood. After curing was complete and the laminations removed from the die, the actual radius was calculated using a circular equation within the CAD program, using three measurement points taken from the stack. The radius of the die within the limits of this study has a negligible effect when predicting the springback of the stack. The exponential correlation between springback and the number of laminations, was used to calculate the springback effect on molded laminated stacks.
1. Introduction
Springback is the ability of a material to return partially or fully to its original form after a stress inducing force is released. The question of how much of the deformation is lost to springback is important in multiple disciplines, e.g., metal forming and molded composites. Most research is done in the bending, stamping and forming of metals where different alloys are investigated to determine the value of springback [1,2,3]. In all cases, metal sheets have to be bent past the plasticity region in order to achieve a permanent deformation. In contrast to molded metal sheets, multilayer wood moldings prefer the linear elastic area to obtain the maximum strength. With lighter weight materials in more common usage, there is additional focus on composite laminations. Springback, warping, spring-forward and other deformation modes were investigated on multi composite structures with flexible materials such as carbon fabrics and heat-cured resins to avoid additional post-manufacture processes [4,5,6,7]. In each of the aforementioned scenarios, the springback must be accounted for by the design of the die. Currently, trial and error, and finite elements analysis (FEA) are the two main approaches to achieve the desired results. However, an accurate prediction of residual stresses puts high demands on the material modelling during the forming simulation [8].
The latest findings on springback in form-laminated plywood, showed a relationship of temperature and moisture content [9] and contributed to an empirical equation [10]. In both studies the 3-ply laminates were pre-softened in water prior to assembly, before being cured at high temperatures whilst set in the die. Similar pre-softening processes were performed with simultaneous form fixation with single wood veneer by Herold and Pfriem [11]. Here, the shape retentions of one layer of Beech veneer impregnated with furfuryl alcohol was measured after curing and over time in differing humidity. The study indicates that there was no significant springback when the cured samples were removed from the molds. According to the current research the mechano-sorptive effect has a significant influence on shape retention where the shrinkage and swelling deform the material [12]. This effect can be used to deform wooden planks intentionally for e.g., architectural purposes [13]. In conclusion, a permanent form of stabilization with wood is not possible if the moisture content changes or the swelling pressure is not accounted for in the construction design.
Even though the springback of wooden materials is commonly known, there is no scientific study available to calculate the springback effect of molded solid plank laminations within the elastic range. The practical application, where a pre-softening is not possible, would be in timber construction and modern furniture. Articles about laminated wood processes that have been found are rudimentary and not validated [14,15]. The empirical method used and the experience of the referred cabinetmakers with formed laminations led to the assumption that there is a quadratic relationship between the number of laminations and springback obtained. The inversely proportional relationship between the number of laminations and springback needed to include a proportionality constant and the subtraction of one lamination to solve the issue of only one sheet in the lamination. A brief summary of those articles and additional practical comments were made by Jones [16]. As previously stated the springback of single laminations and plasticized laminates is known but, however, does not follow true when testing multiple laminations.
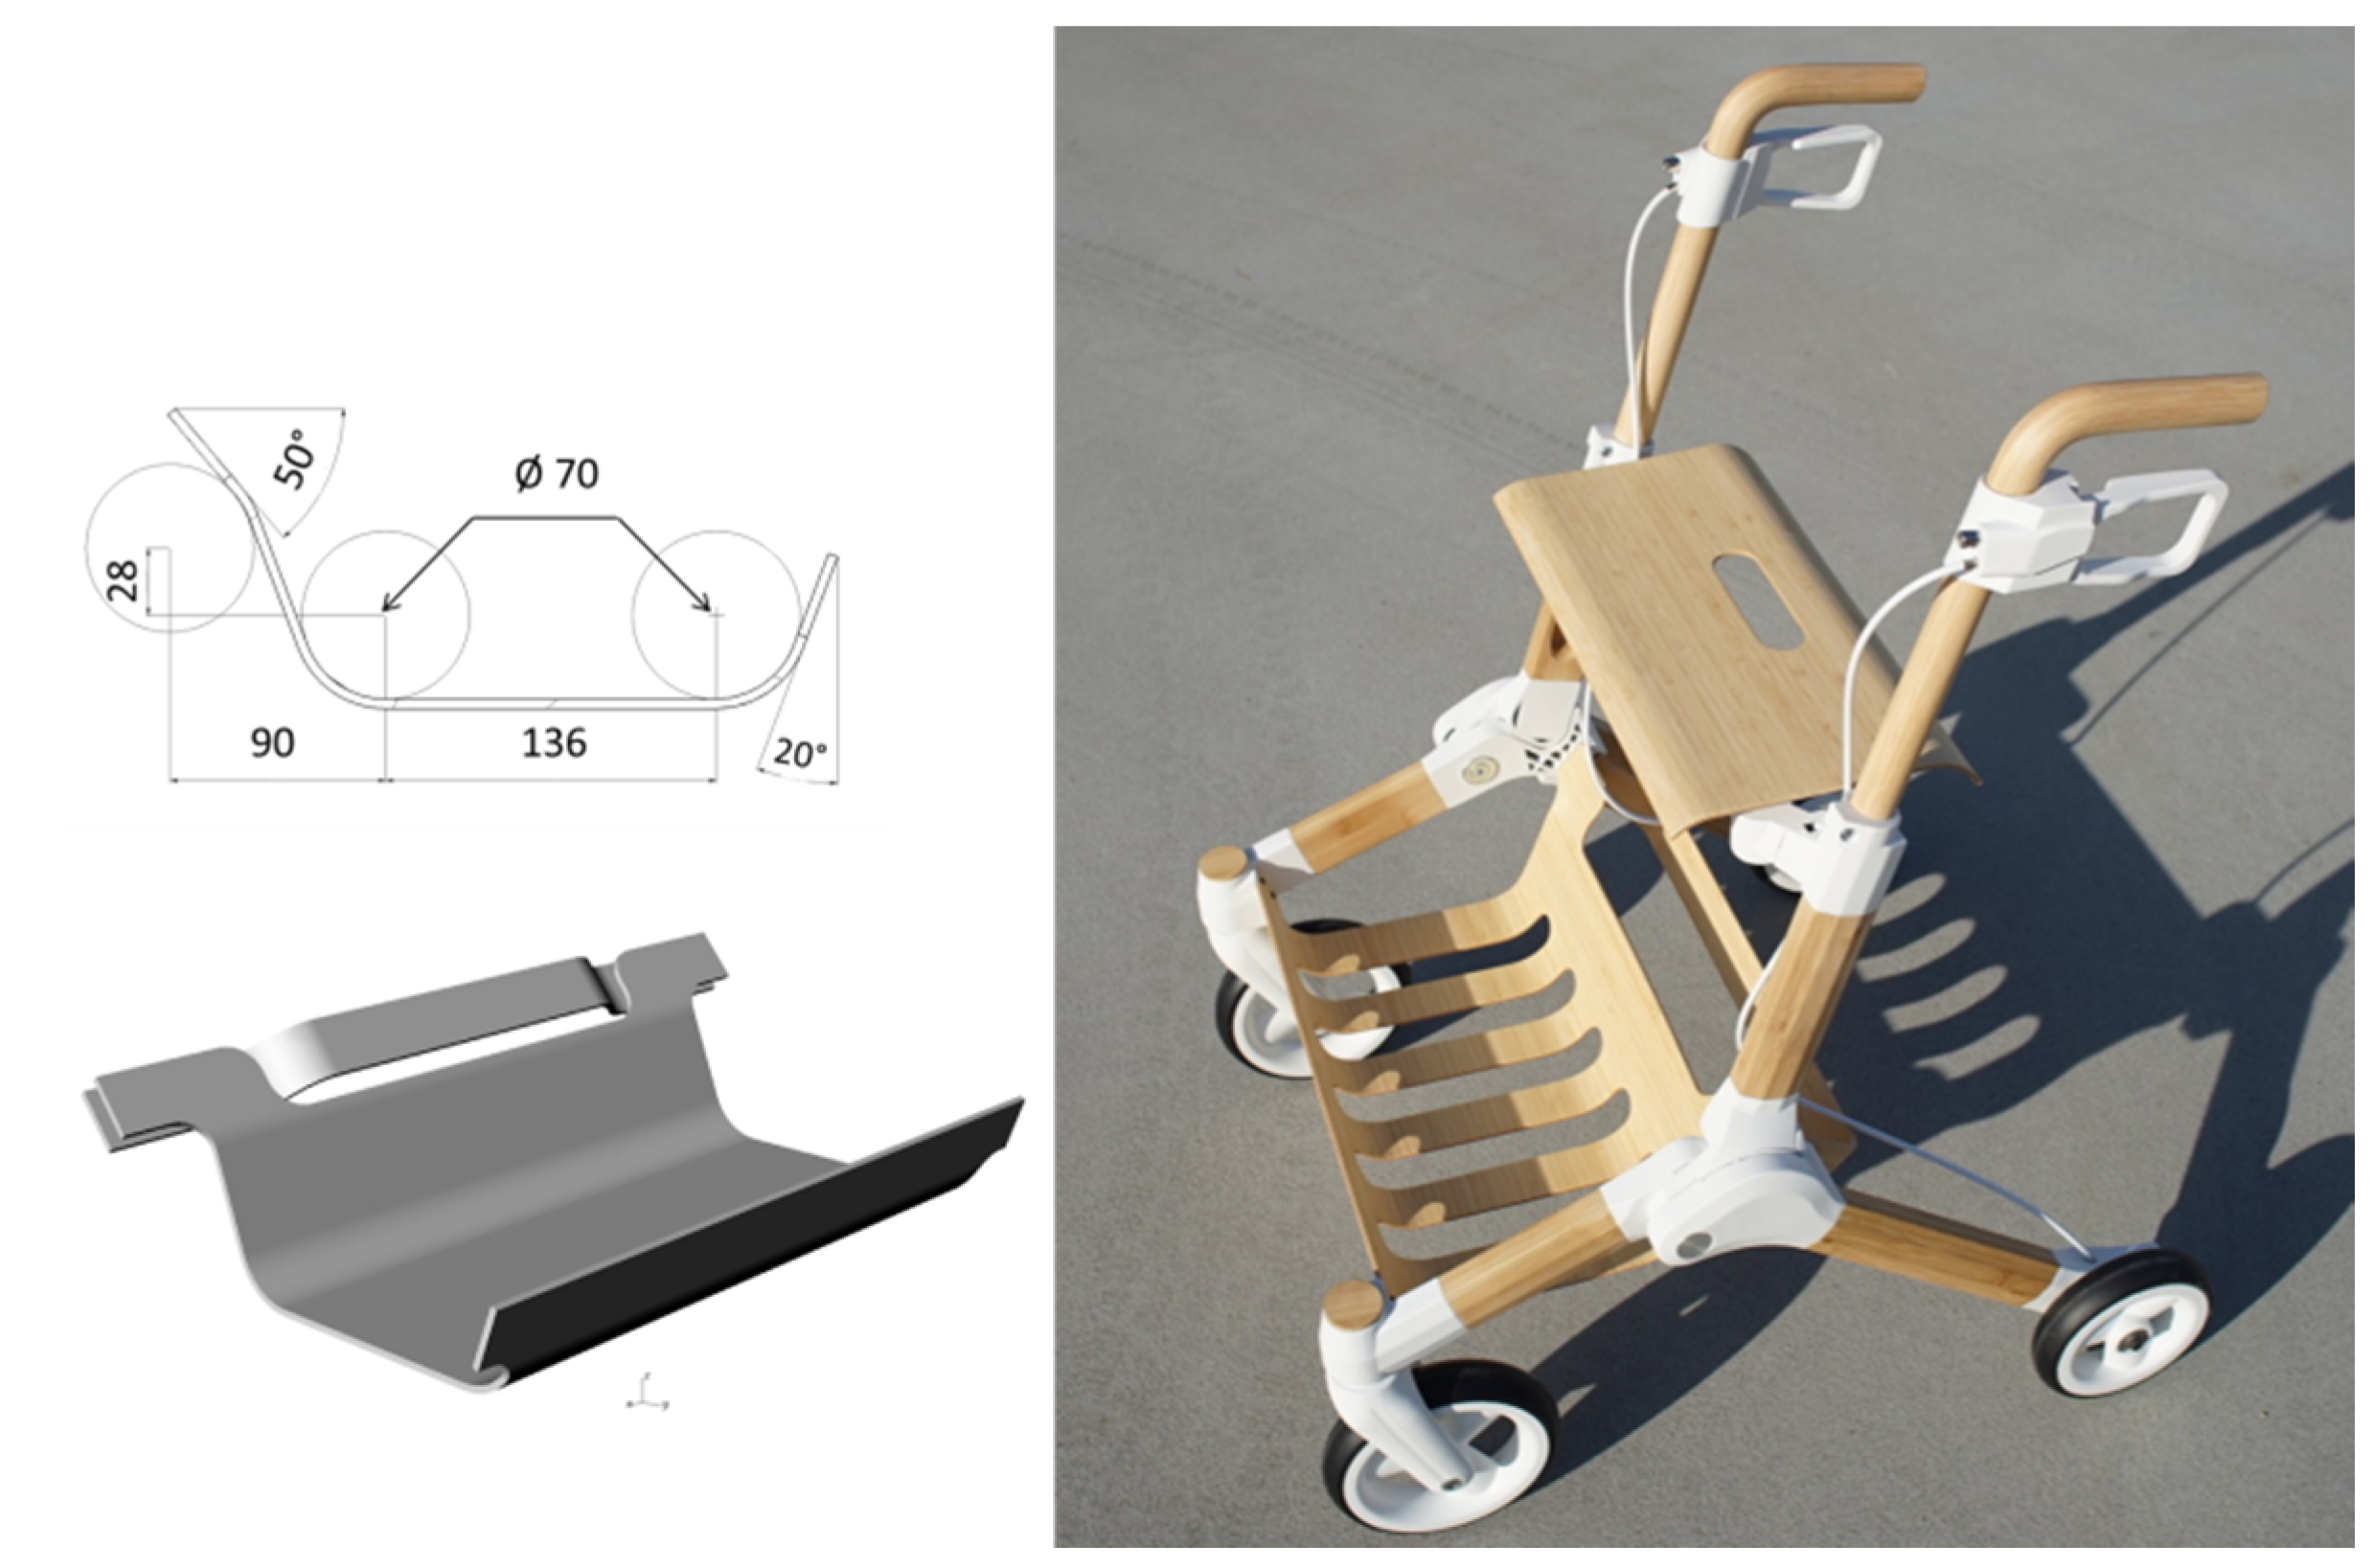
A practical example where the springback effect of wooden laminations plays an important role is a walker based on renewable materials. This “Bambulator project” was not only a best practice of bioeconomy but it also demonstrates the challenges of multilayer form part usage in an industrial application. Due to its unique design the form parts like the seat, basket or handle have to fit perfectly to accomplish mass production (Figure 1). Therefore the springback during the production of those parts has to be accounted for.
Our approach was to simplify the problem into a common form. A stack of wooden laminations can be molded into quite complex forms. The simplest form would be the shape of an arc. Just like in a three-point bending machine scenario, the internal radius is under compression while the external radius is under tension. In contrast to Chanda et al. [10], the wooden material was not damaged during the bending.
The stack of beech laminations appears similar to a multi-leaf spring found in a motor vehicle, which is comprised of curved flat metal pieces. The functionality of both examples is dependent on the material properties such as the modulus of elasticity (MOE) and the modulus of resistance (MOR) and only operate in the linear elastic region. These physical operating constraints, limit the maximum stress load and therefore the maximum deflection [17]. When the stack is glued together into an arc the radius of the stack deviates from the radius of the die.
The present preliminary study on beech wood was performed with the aim of investigating the springback effect as a function of the number of laminations, the elasticity value of the stack, the thickness of the laminations and/or the residual radius. The goal was to derive a formula based on the results to calculate the springback on wood without the need to employ FEA.
2. Materials and Methods
This work is the result of two consecutive experiments where the framework was set by Makowski [18]. The first study used three samples of each configuration, but focused primarily on the overall height of the sample rather than on the number of laminations represented in the sample. To provide complementary data, a second test was carried out focusing primarily on the number of laminations, testing one sample for each configuration. The mean values of Makowski’s results per sample set were used from here onwards and annotated with a 1 e.g., 6 1 in Table 1. The two data sets were merged for this research.
Beech (Fagus silvatica L.) was chosen as the sample material because it is a widely used wood for veneers in the furniture industry and has recently been introduced as a building material. Currently also used in steam bending, this wood has very good mechanical bending properties [19]. They were sawn and then machined in a thickness planer to avoid cracks in the structure.
The thicknesses of the laminations were 1 mm, 2 mm and 4 mm and the total stack size was between 8 mm and 32 mm, with a maximum number of 16 laminations (see Table 1). The length of the wood laminations is 600 mm although some of the length protrudes from the die and is, therefore, not deformed. The laminations were conditioned in a climate chamber at 20 °C and 65% humidity. Every sample stack of laminations was tested according to the Deutsches Institut für Normung-DIN 52186: 1978-06-to determine the bending elasticity similar to find the elasticity value. A universal testing machine (TIRAtest 28025—Tira GmbH, Schalkau, Germany) was used to obtain the elasticity value with a bearing support length of maximum 190 mm. The required supporting span was calculated using the equation supplied by the standard, where the span is at least 15 times the thickness of the material. Minor changes to the specifications of the standard were made to the bearing support span if the elasticity of the stack was too low to get a proper reading or the maximum length of the support was reached. In those cases the span was shorter than desired. Additionally the density of 10 random stacks was taken as well as the MOE of the Beech material.
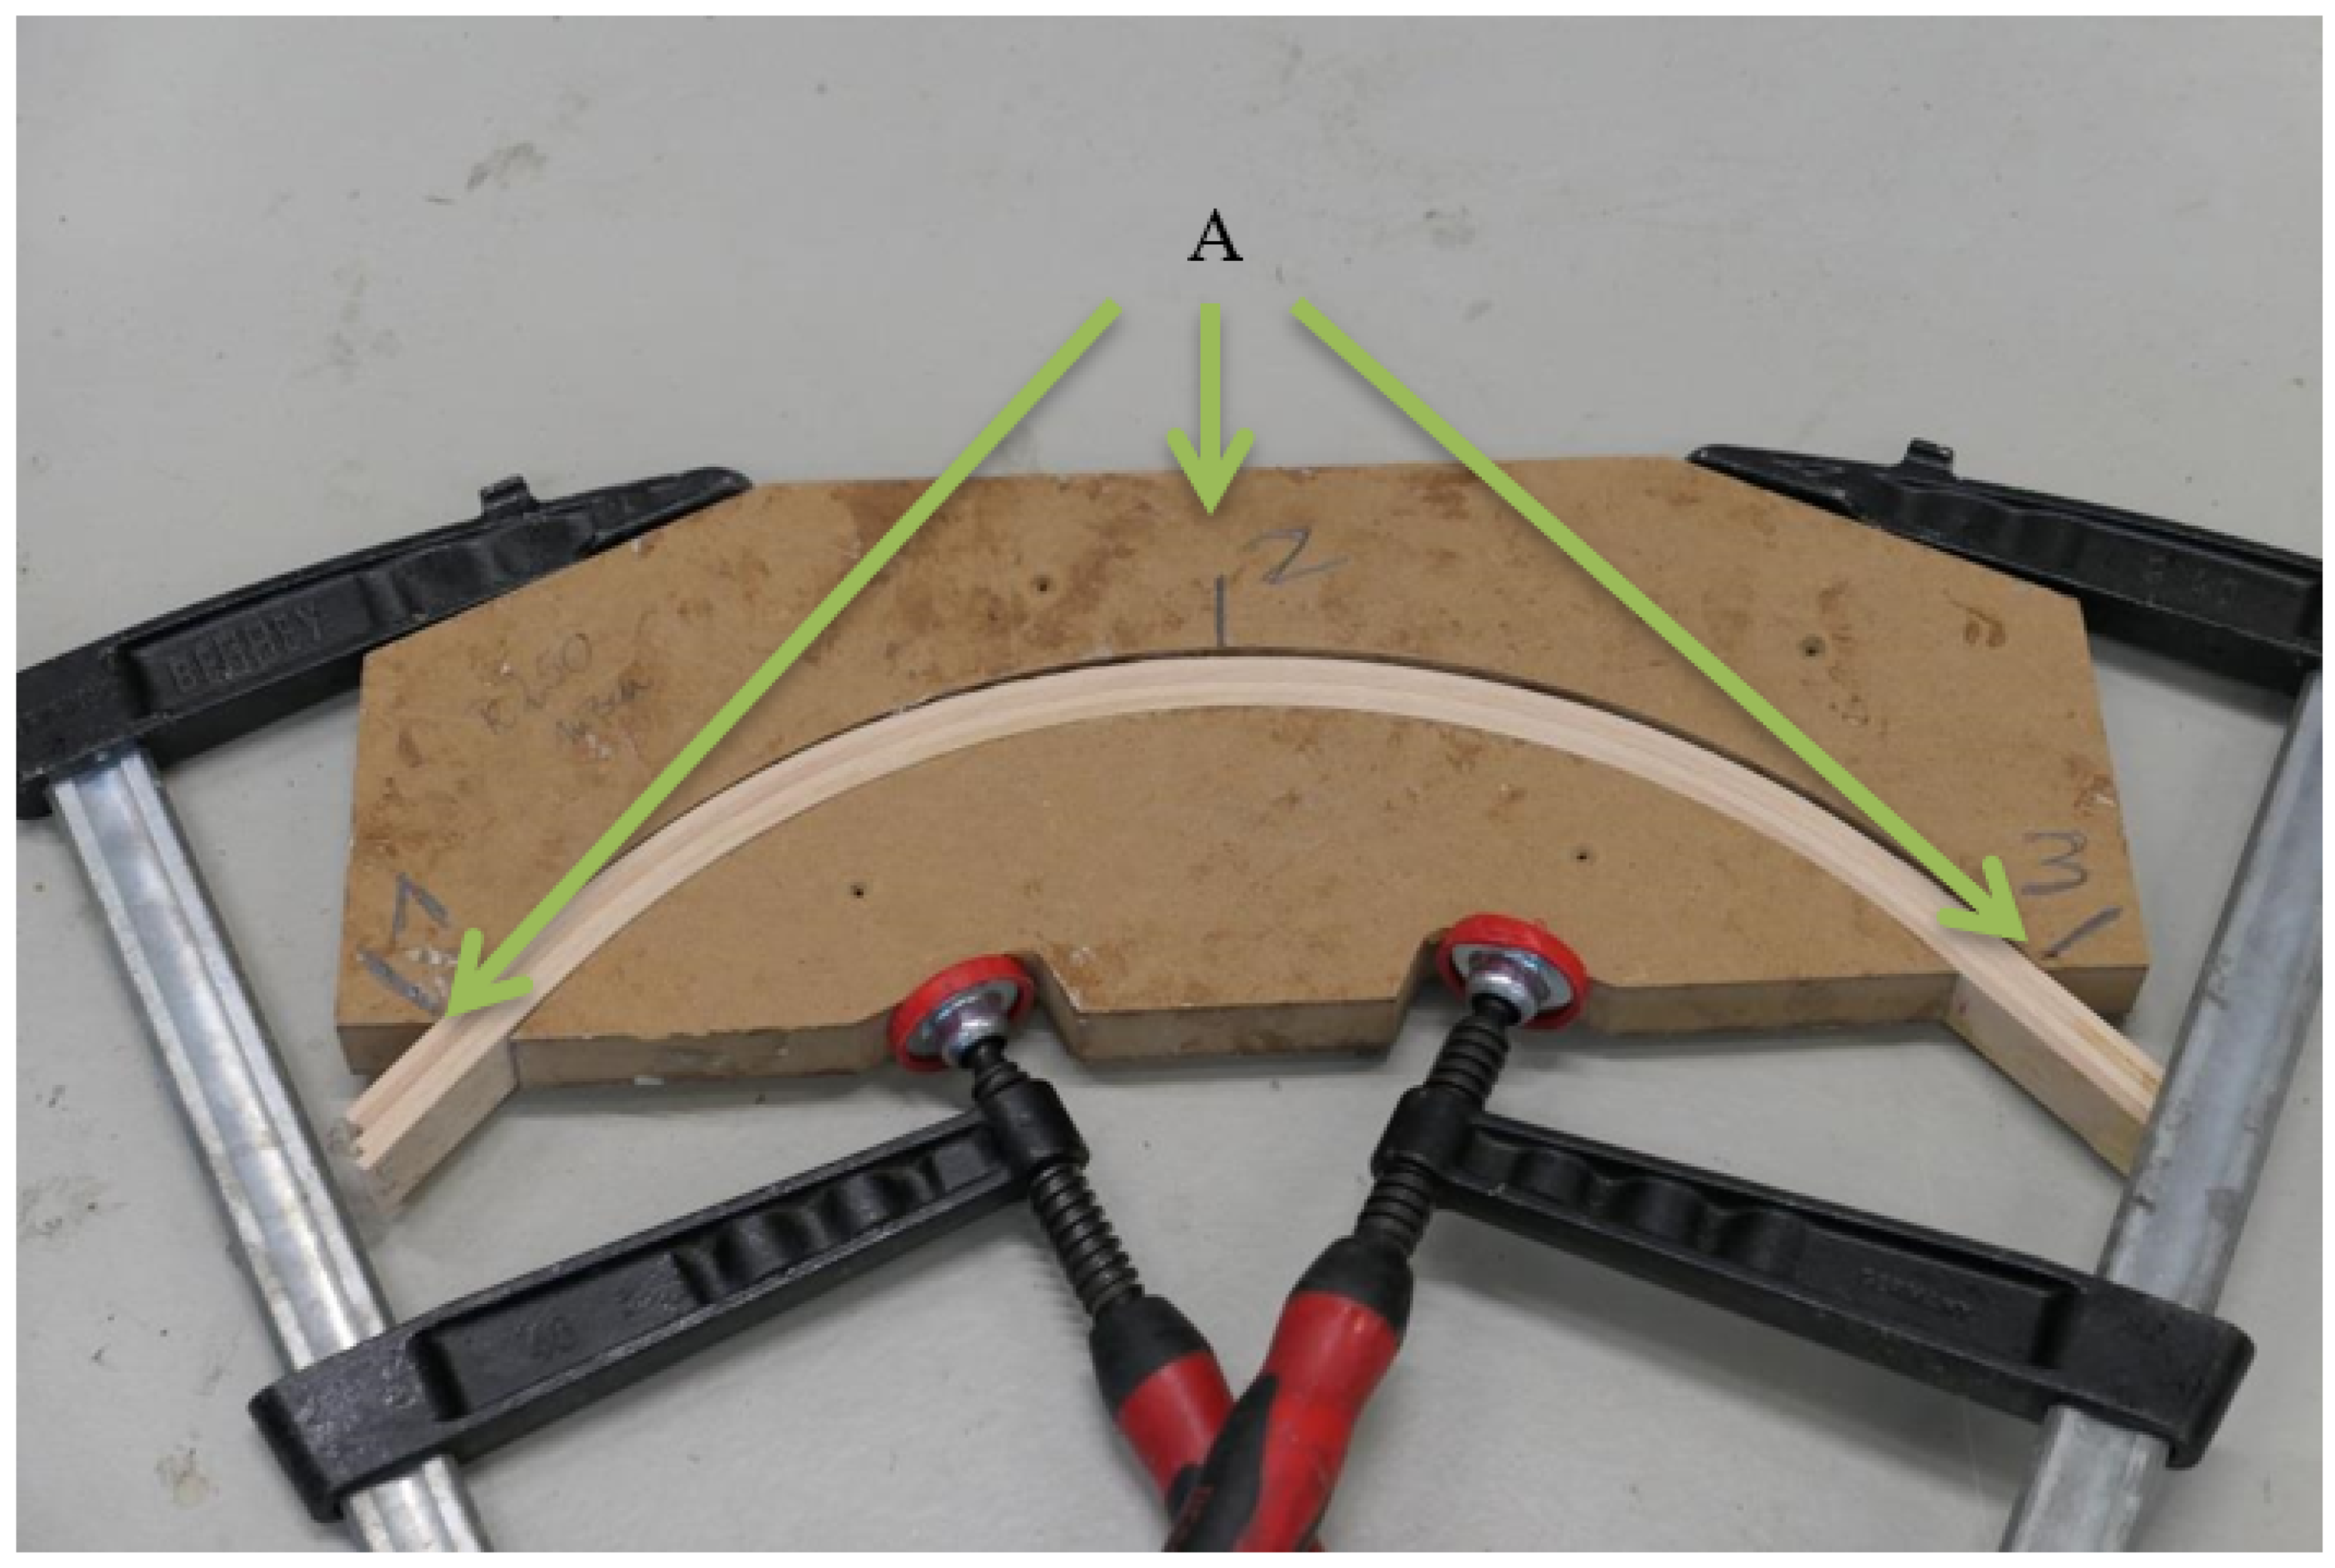
Three sample stacks with radii of 250 mm, 300 mm and 350 mm with the same circular arc of about 500 mm were produced using the following procedure. The sample stacks were glued with Kleiberit PUR 501.8, a single compound polyurethane resin (PUR) which is common in wood lamination processes and results in rapid and strong bonds. The resin was applied with a notched trowel to achieve an application quantity of 180 to 220 g/m2. The stack was then pressed into a two-piece die made of MDF (Middle Density Fiberboard) (Figure 2) and secured with clamps for 1 h at room temperature.
After curing and prior to removing the stack from the die, the stack was marked at three points, the two ends of the stack and the middle of the stack (Figure 2). This provided a repeatable method with which to measure the springback of each stack. In this way the radius was always calculated from the same point of the die. Afterwards the three points of each sample were transferred onto millimeter paper. The coordinates were then used to calculate the actual radius in a technical drawing program (AutoCAD® 2019). A springback value (sb) could then be determined as a percentage, from the difference between the radius of the die (r1) and the final radius of the glued stack (r2).
sb = r2/r1·100 − 100,
The mathematical approach for the formula was undertaken by using the simple and empirical attempt of Jones [16] to calculate the springback (sb) with the number of laminations (n) and the proportionality constant (A):
This equation led to the rational function:
with the polynomials p(x) and q(x). Therefore, the simplified function:
has in the domain of real numbers two poles 1 and −1. So for improving the simplified function, a 3rd degree polynomial function was chosen:
Providing that the three poles x01, x02 and x03 may only take the values 1 or −1, then:
With two solutions to the poles:
sb = A·1/(n2 − 1) n ≥ 2,
y = p(x)/q(x),
y = A·1/(x2 − 1),
y = (a0 + a1 x + a2 x2 + a3 x3)/(b0 + b1 x + b2 x2 + b3 x3),
b0 + b1 x + b2 x2 + b3 x3 = (x − x01) (x − x02) (x − x03).
x01 = 1, x02 = −1, x03 = 1 or x01 = 1, x02 = −1, x03 = −1
As the problem to be solved is in the definition range of natural numbers, the double pole at 1 is the preferred one to highlight the importance of this quadrant. This leads to:
and subsequently to:
with a partial fractional decomposition the transformed model function is:
This model function corresponds to the following linear regression model:
b0 + b1 x + b2 x2 + b3 x3 = 1 − x − x2 + x3,
y = (a0 + a1 x + a2 x2 + a3·x3)/((x − 1)2·(x + 1)),
y = β1 ·1/(x2 − 1) + β2 ·1/(x − 1) + β3 ·1/((x2 − 1) (x − 1)),
Y = β1 X1 + β2 X2 + β3 X3.
A regression analysis of all values is performed in the language R [20] and then by using the command “lm()” from the ‘stats’ package of R for the Model function 9.
3. Results
3.1. Characterization of the Material Properties of Beech
The wood tested shows no discrepancies when compared to known data. The random samples of beech had a density of 570–700 kg/m3, which falls within the average of the known range of values of 540–660–840 kg/m3. Also, the mean MOE of 13850 N/mm2 can be found in the middle of the range of MOE in the literature of 12300–16400 N/mm2 [21].
3.2. Radius Impact to Springback
Different permutations of Radius, Lamination thickness and Number of Laminations were used to produce the results. The radius shows no significant impact on the percentage of springback. Of course the absolute springback was different, with smaller radii having the highest springback percentages. Although the number of samples tested is small with only one support values, the trend within the test series with different radii is congruent. Further analysis did not include the radius as a factor.
Looking only at the five 9-element groups with 2,3,4,6,8 laminations, one can see that although the standard deviation is higher at smaller numbers of laminations, the coefficient of variation seems to increase with more laminations. The trend is visible within Table 2 but more samples are needed for validation.
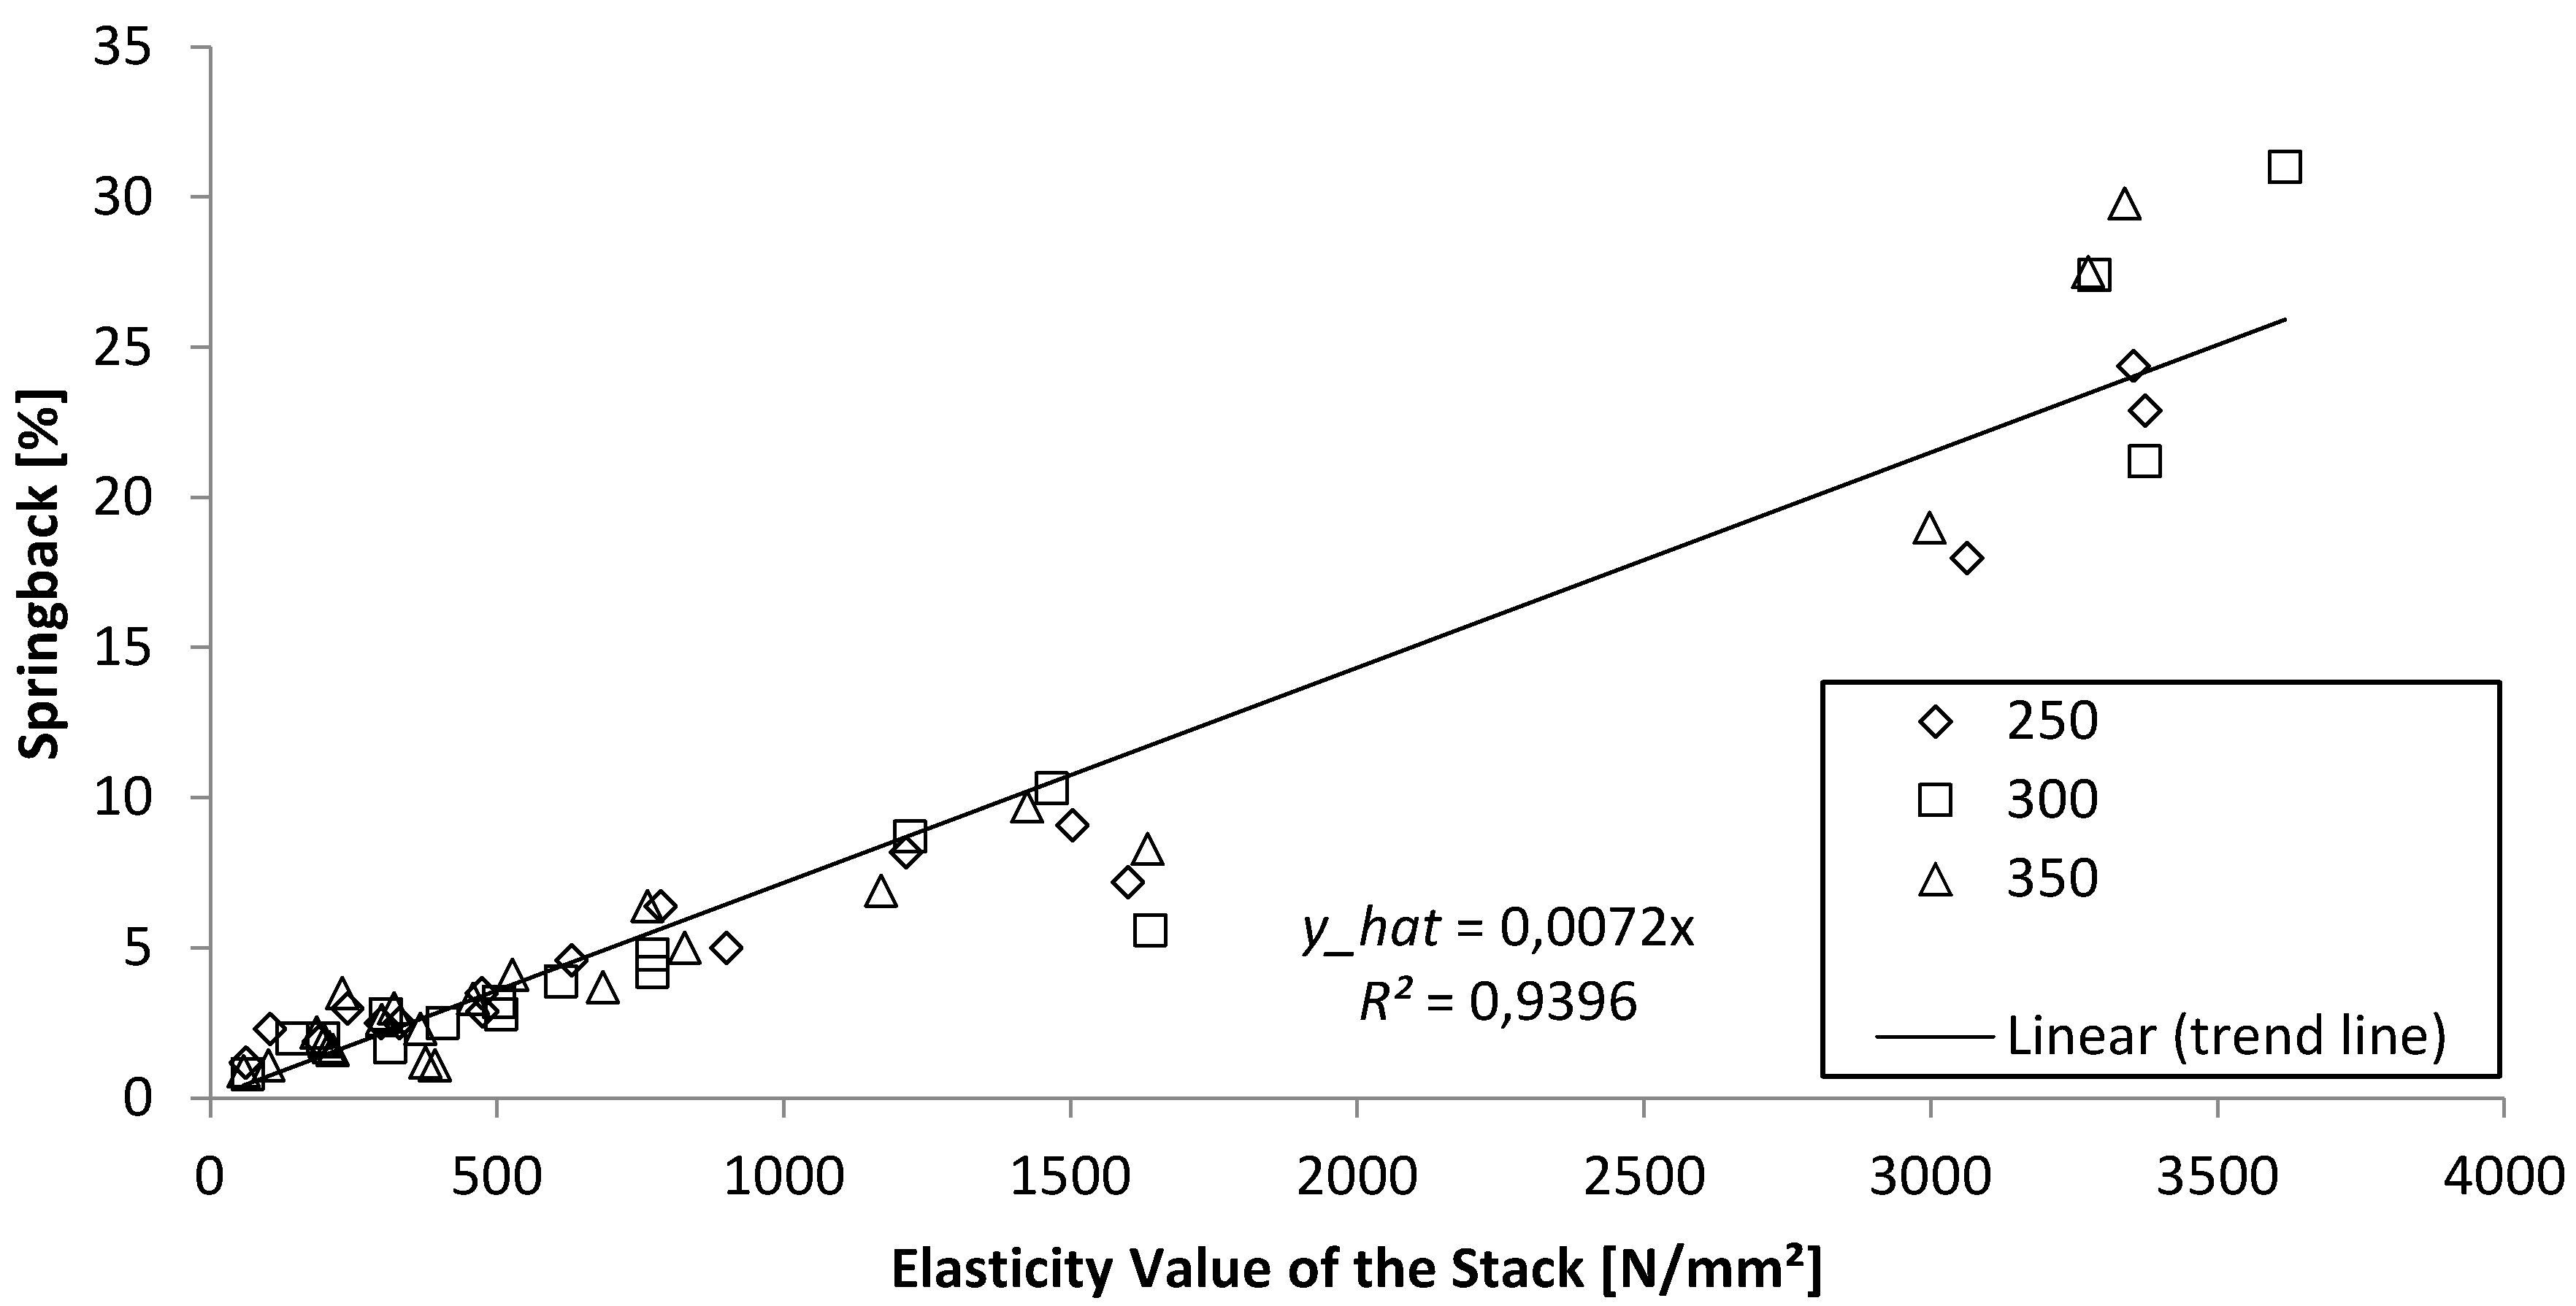
3.3. Elasticity Value
The elasticity value of the stack directly correlates to the number of laminations. The more laminations used in the stack, the smaller the measured elasticity value of the stack. Elasticity value and springback of the sample behave linearly, where higher elasticity values lead to higher springback (Figure 3). The sample values suggest a line from the origin. For obvious reasons, a natural material will never reach zero elasticity and, therefore, zero springback. But it shows that formed parts should be made from multilayer materials to minimize springback. According to the calculation in R, the p value of the slope is very small at 7.487725 × 10−43, which means that the slope value to determine y_hat is significant. The gap between 1600 N/mm2 and 3000 N/mm2 is a natural phenomenon due to the fact that the sheets were not glued yet. There is an exponential correlation between the number of laminations and the elasticity value which explains the increasingly smaller distances between clusters, e.g., the number of laminations for the elasticity value from approximately 300 N/mm2 is two, while stacks with three laminations can be found to have a value of elasticity between 1200 N/mm2 and 1700 N/mm2. The higher the number of laminations, the lower the elasticity value. However, an overlap of elasticity values can be seen in samples with more laminations.
3.4. Number of Laminations and Springback
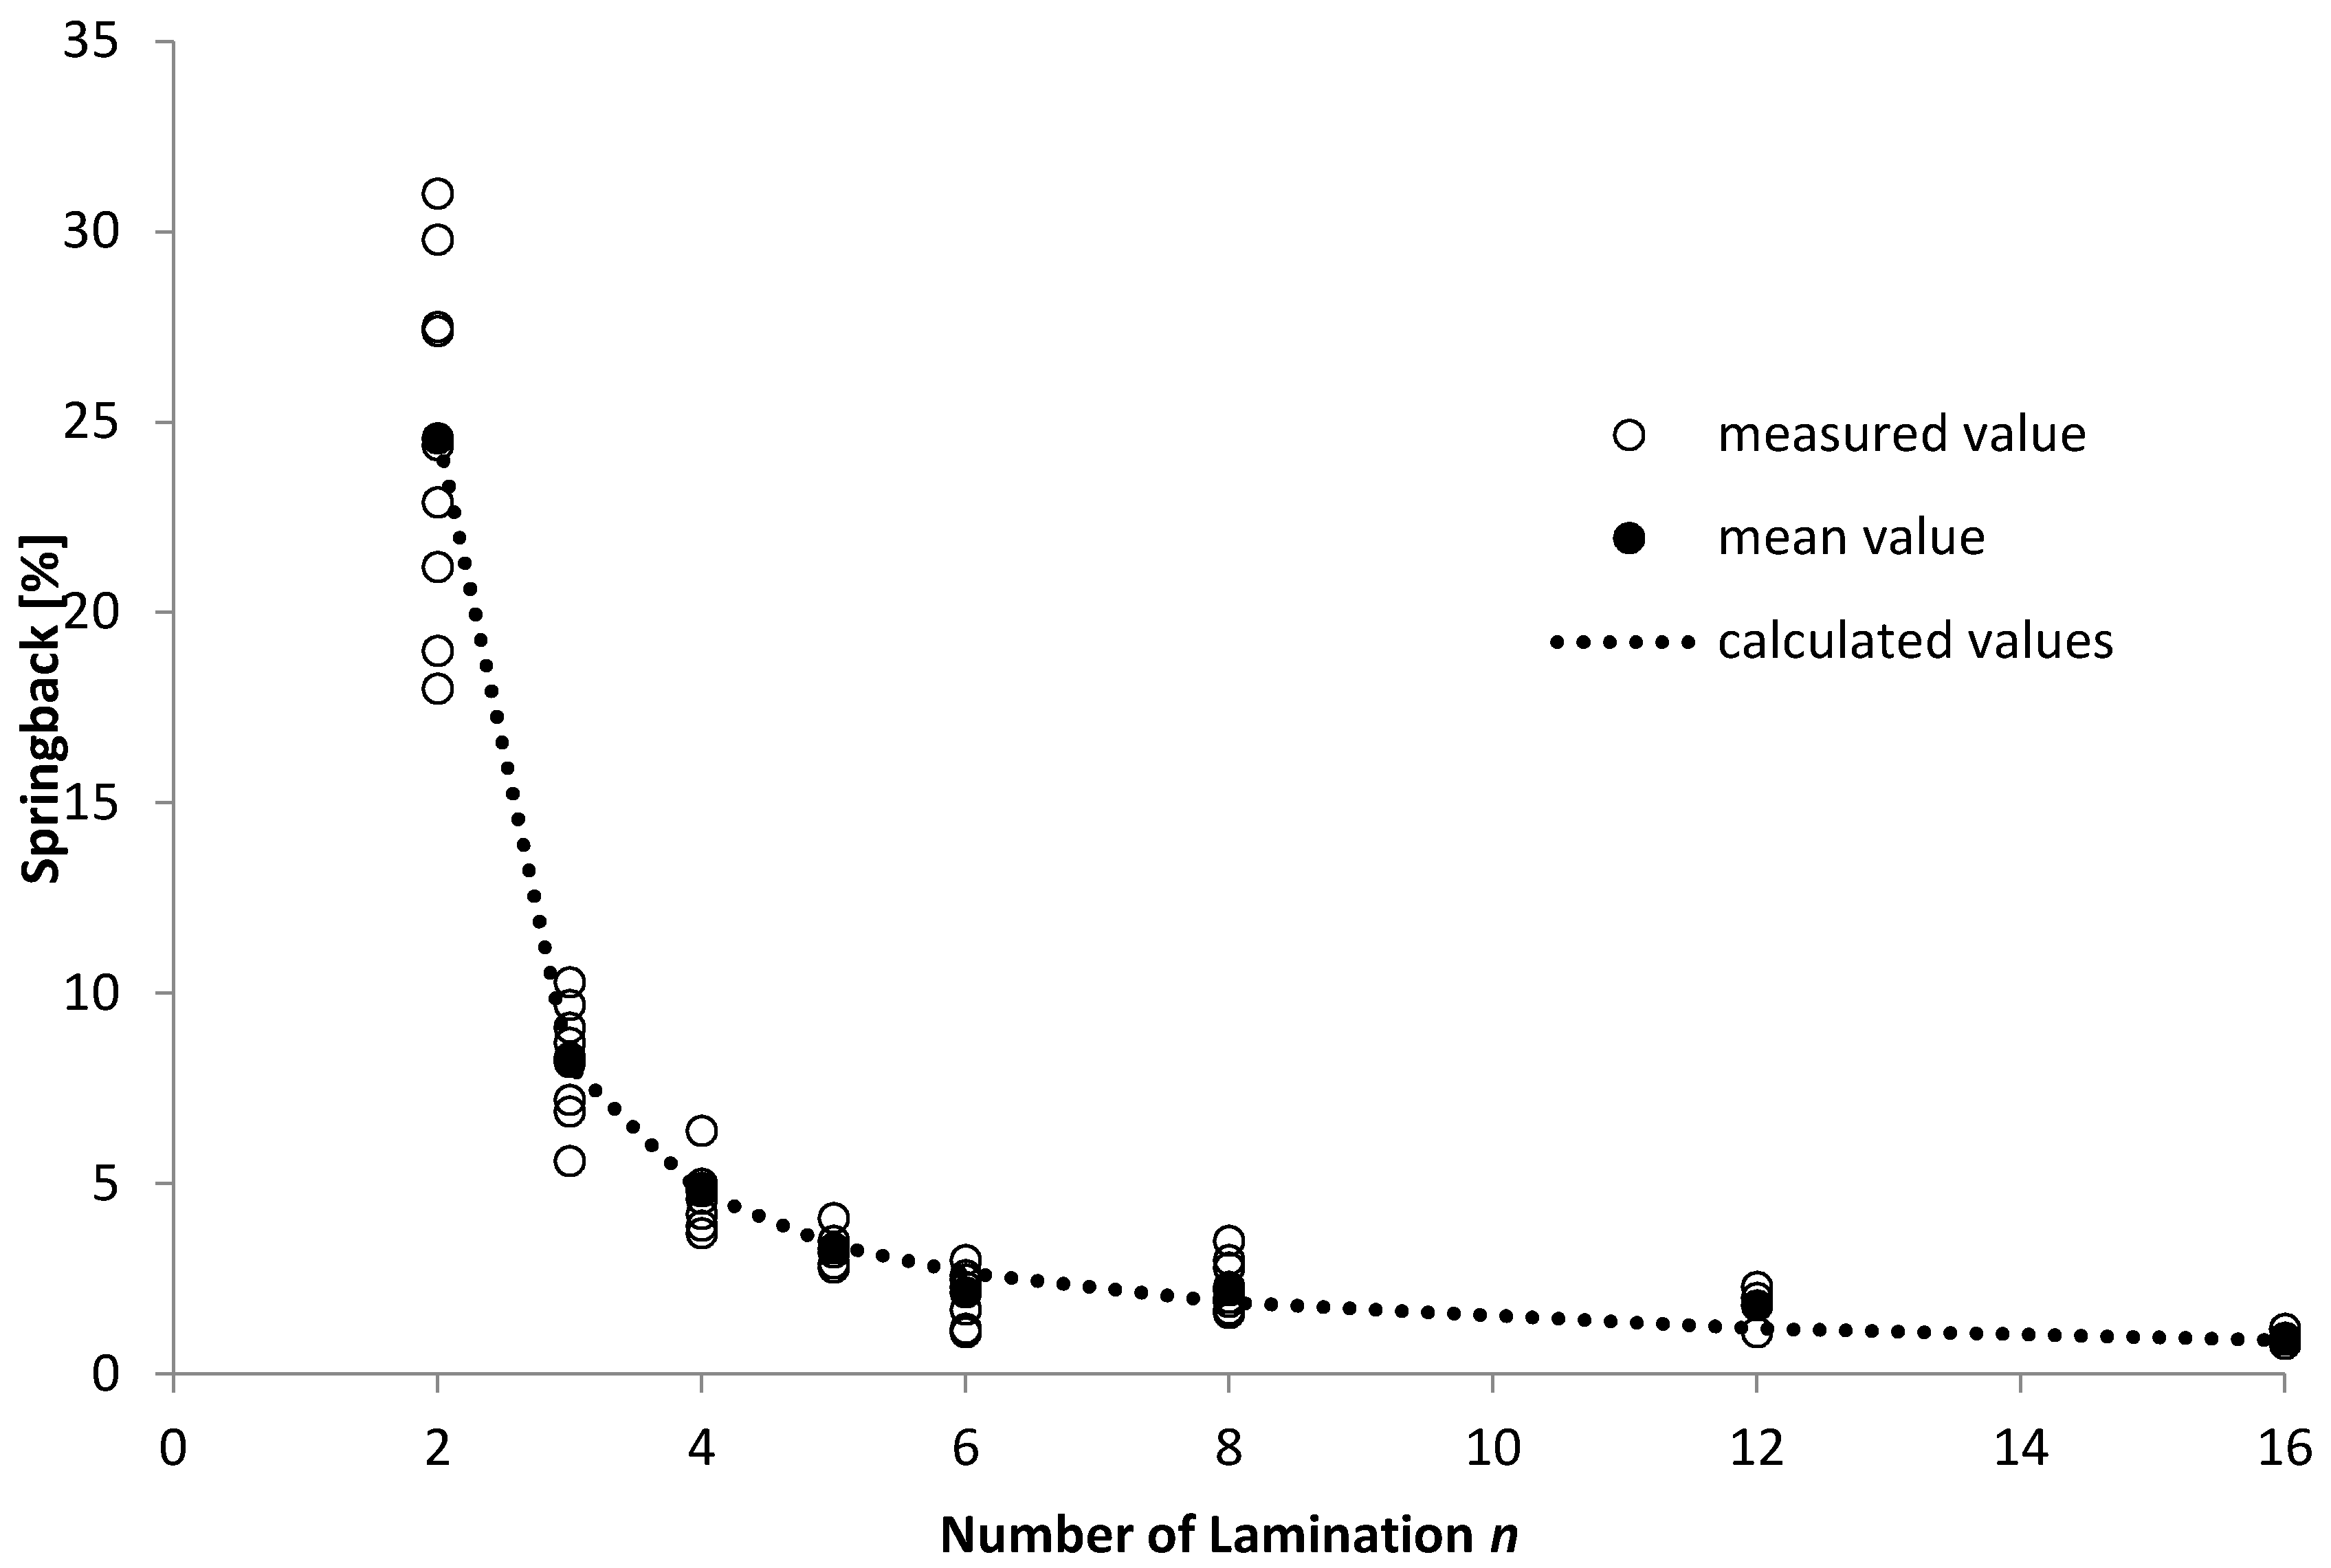
In general, one can see the more laminations in a stack, the smaller the springback will be. A marked decrease in springback can be seen by increasing the number of laminations from 2 to 3. Higher numbers of laminations show that the springback is distributed within the standard deviation. Although the deviation is highest in those samples with two and three laminations, a trend is noticeable. Figure 4 shows the correlation between the number of laminations in a stack and the springback value in %. The trend line is the solved power function (function 15) and is quite accurate considering that stacks consist of laminations with different thicknesses.
3.5. Mathematical Solution
The regression analysis with R for all 57 samples returns as a result for function 9:
β1 = −14.43354, β2 = 14.22949, β3 = 45.50878 with R2 = 0.9429418,
Rounding the numbers leads to a provisionally mathematical formula for the springback calculation:
sb ≈ −14·1/(n2 − 1) + 14·1/(n − 1) + 46·1/((n2 − 1)·(n − 1)),
R2 ≈ 0.94
R2 ≈ 0.94
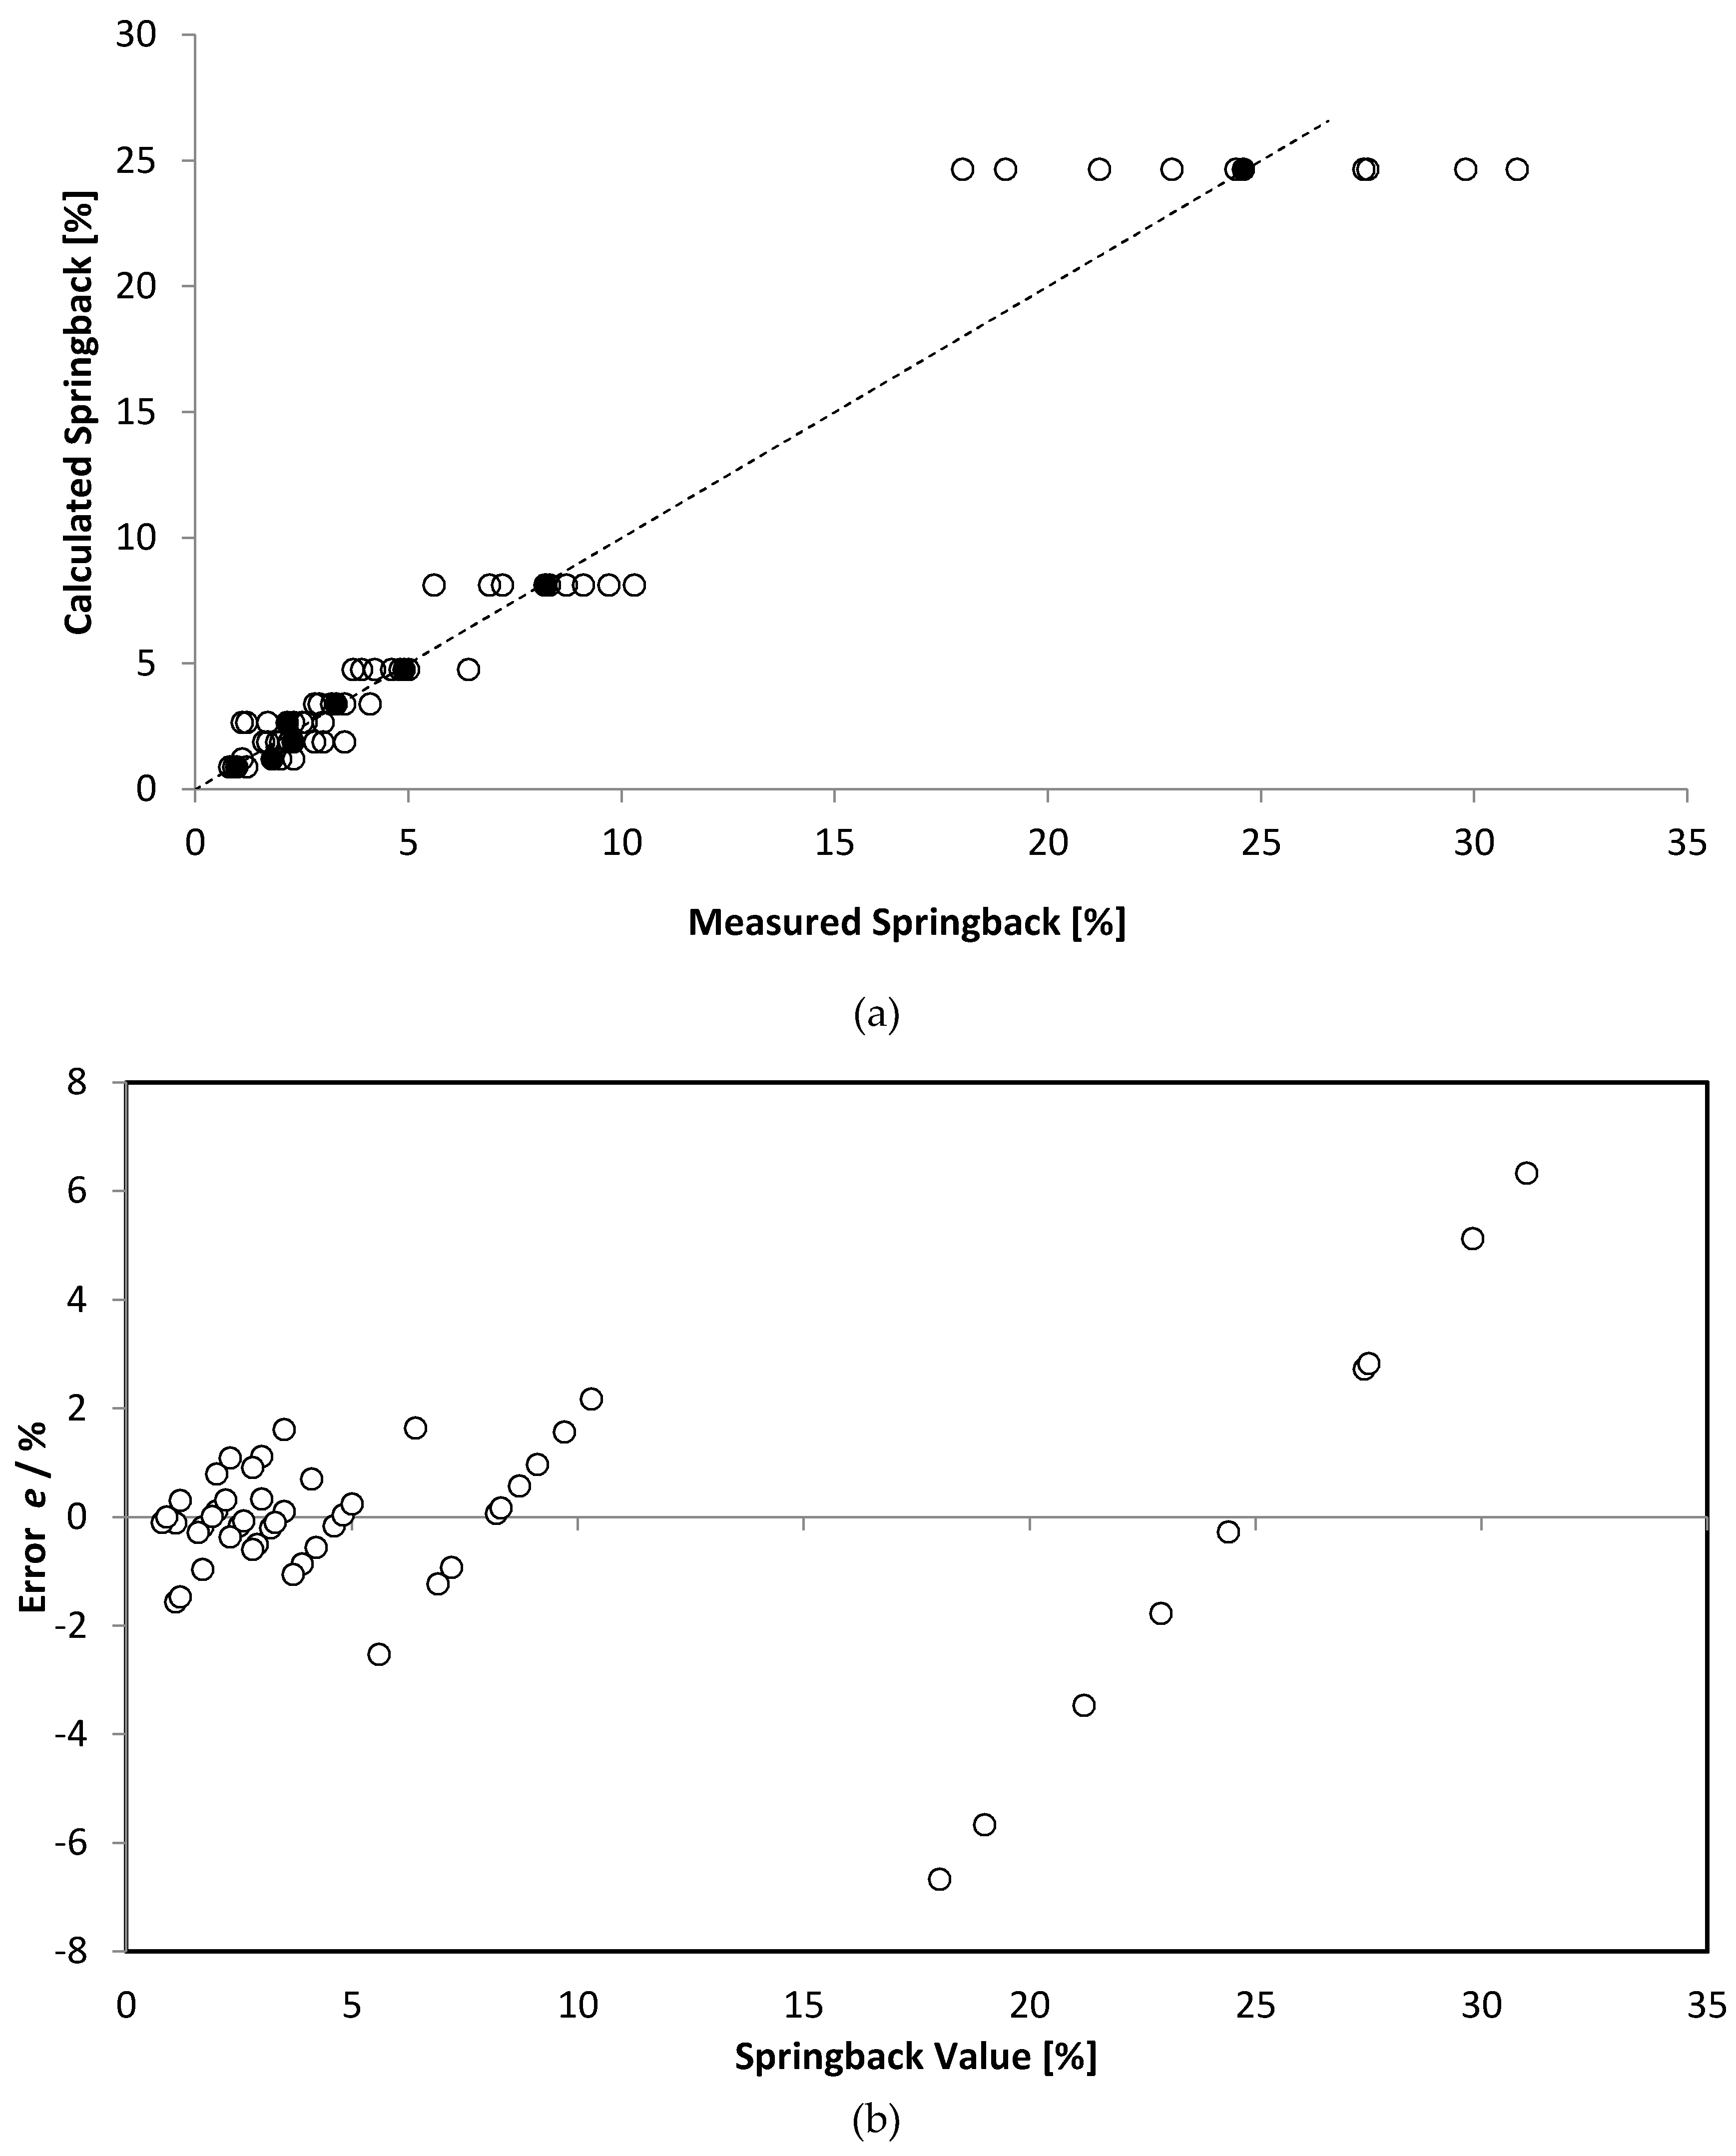
The statistical analysis in R shows that the chosen polynomials are significant for the function. The residuals were tested as being randomly distributed. The parity plot (Figure 5) compares as a scatterplot the experimental data of Table 1 against the estimated data obtained by the model formula (9) with parameters (14).
The formula calculates accurate values for springback, given a value of 24.6% against a measured value of 24.4%. However, the calculated data show no systematic deviation, while both negative and positive deviation exists in equal measure, from the measurement data.
The deviations of the estimated data from the experimental data, the errors (e)
are shown in Figure 5b. The errors are relatively evenly distributed above and below zero.
e = sb − sbcalc
4. Discussion
The springback of the laminated wood in this study varies from a minimum of 0.8% with high numbers of laminations, and a maximum springback value of 31% with only two laminations used. Although the standard deviation is higher with smaller numbers of laminations, as Table 2 shows, the variance coefficient increases with more laminations. This would mean that the calculation for springback when using more than 8 laminations is not as accurate. However, this is not yet statistically significant and more data is needed.
It was observed that the change in radius had no impact on the springback effect within the test-series. Thus the assumption for the formula of Clayden and Roberts is also confirmed [14,15]. The radius is also limited to the maximum of the elasticity range—in this case 250 mm. The springback of the laminations will behave differently exceeding this point. To test any changes caused by a change in radius, a maximum radius of 350 mm was chosen as well. The moisture content of the glued laminas differs from the conditioned equilibrium because of the isocyanate in the polyurethane glue and is presumably lower. Therefore, the springback radius was immediately determined to avoid any mechano-sorptive effect.
The linear correlation between the springback percentage and the elasticity value of a stack, is clearly visible and is caused by the equally occurring exponential correlation of number of laminations and those values. The mathematical approach supports the use of the number of laminations as an important parameter. Also, since the measurement of an elasticity value is very elaborate to be implemented in industrial processes or in workshops, a formula with only simple parameters would remedy the situation. The results obtained show a positive correlation of the springback effect and the number of laminations. Here the model function with the calculated factors ß1, ß2 and ß3 results in an R2 value of 0.94. Under conditional circumstances one can say that a springback can be obtained from the developed formula.
To validate the results, further tests with identical numbers of laminations in each stack and different thicknesses of laminations need to be performed. Additionally, different species of wood and grain orientations would need to be investigated. Any evidence of the influence of the MOE of the wood material should then be included in the formula. There may be similarity with a leaf spring calculation where the dimension, the number of layers and the MOE are factors to determine the maximal deflection, which represents the linear elastic region [22]. Further studies by providing more data will continue to refine the formula, however a small error will always exist between a calculated value and a measured value due to the inhomogeneous nature of the material.
5. Conclusions
Our preliminary tests on beech laminations formed in an arc of three radii resulted in a reliable formula to be able to predict the percentage springback effect. Even if the field of application of the formula is limited to smaller parts, the springback of laminations form-fixed within the elastic range is calculated differently to the existing formulas for plasticizing processes. To determine the springback effect of laminated wood moldings, the elasticity value of the stack provided the best option, since results showed a linear correlation. But usually there is no equipment in an industrial or handicraft workshop to test for elasticity. The number of laminations does an equally good job to predict the springback value and was, therefore, used in the formula.
A summary of our findings is as follows:
- Radii are not important if the springback is given in percent;
- There is a linear correlation between the springback value and elasticity value;
- Elasticity value and springback are exponentially linked by the number of laminations;
- The springback is independent of the thickness of the laminations;
- For an increase in the number of laminations, the springback value decreases;
- The proposed polynomial functions are statistically proven and can be used to calculate the springback.
Further studies could show the influence of more wood properties when different wood species are used.
Author Contributions
Conceptualization, A.P., G.A.-E. and M.S.; methodology, A.P., G.A.-E. and M.S.; validation, A.P., G.A.-E. and M.S.; formal analysis, G.A.-E.; investigation, M.S.; data curation, G.A.-E.; writing—original draft preparation, G.A.-E. and M.S.; writing—review and editing G.A.-E. and M.S.; visualization, G.A.-E. and M.S.; supervision, A.P.; project administration, A.P. and M.S.; funding acquisition, A.P. All authors have read and agreed to the published version of the manuscript.
Funding
This research was funded by the Federal Ministry of Education and Research, grant number 031B0476A and the APC was funded by the Federal Ministry of Education and Research, grant number 16PGF0245.
Acknowledgments
Special thanks to Sebastian Makowski, René Vierheilig, Leonardo Becker and Ben Eckhardt of the University of Sustainable Development Eberswalde for their technical support and performing the tests and to James Grimes for language check. We greatly acknowledge the donation of PUR resin by Klebchemie GmbH Germany.
Conflicts of Interest
The authors declare no conflict of interest.
References
- Chatti, S.; Hermes, M.; Weinrich, A.; Ben-Khalifa, N.; Tekkaya, A.E. New Incremental Methods for Springback Compensation by Stress Superposition. Int. J. Mater. Form. 2009, 2 (Suppl. S1), 817–820. [Google Scholar] [CrossRef]
- Xie, Y.-M.; Huang, R.-Y.; Tang, W.; Pan, B.-B.; Zhang, F. An Experimental and Numerical Investigation on the Twist Springback of Transformation Induced Plasticity 780 Steel Based on Different Hardening Models. Int. J. Precis. Eng. Manuf. 2018, 19, 513–520. [Google Scholar] [CrossRef]
- Jiang, H.-J.; Dai, H.-L. A novel model to predict U-bending springback and time-dependent springback for a HSLA steel plate. Int. J. Adv. Manuf. Technol. 2015, 8, 1055–1066. [Google Scholar] [CrossRef]
- Kappel, E.; Stefaniak, D.; Fernlund, F. Predicting process-induced distortions in composite manufacturing—A pheno-numerical simulation strategy. Compos. Struct. 2015, 120, 98–106. [Google Scholar] [CrossRef]
- Mezeix, L.; Seman, A.; Nasir, M.N.M.; Aminanda, Y.; Rivai, A.; Castanié, B.; Olivier, P.; Ali, K.M. Spring-back simulation of unidirectional carbon/epoxy flat laminate composite manufactured through autoclave process. Compos. Struct. 2015, 124, 196–205. [Google Scholar] [CrossRef]
- Johnston, A.; Vazir, R.; Poursartip, A. A Plane Strain Model for Process-Induced Deformation of Laminated Composite Structures. J. Compos. Mater. 2001, 35. [Google Scholar] [CrossRef]
- Zahlan, N.; O’Neill, J.M. Design and fabrication of composite components; The spring-forward phenomenon. Composites 1989, 20, 77–81. [Google Scholar] [CrossRef]
- Eggertsen, P.-A.; Mattiasson, K. Material Modelling for Accurate Springback Prediction. Int. J. Mater. Form. 2009, 2 (Suppl. S1), 793–796. [Google Scholar] [CrossRef]
- Chanda, A.; Bhattacharyya, D. Formability of wood veneers: A parametric approach for understanding some manufacturing issues. Holzforschung 2018, 72, 881–887. [Google Scholar] [CrossRef]
- Chanda, A.; Dutta, S.; Bhattacharyya, D. Shape conformance via spring-back control during thermo-forming of veneer plywood into a channel section. Mater. Manuf. Process. 2020, 35, 859–868. [Google Scholar] [CrossRef]
- Herold, N.; Pfriem, A. Shape Retention of Furfurylated and Moulded Wood Veneer. BioResources 2014, 9 (Suppl. S1), 545–553. [Google Scholar] [CrossRef] [Green Version]
- Mund, A.; Munier, L.F.; Franke, T.; Herold, N.; Pfriem, A. Investigating the shape stability of moulded phenol-formaldehyde modified Beech veneers by means of digital image correlation. In Proceedings of the 21st International Nondestructive Testing and Evaluation of Wood Symposium, Forest Research Institute Baden-Württemberg (FVA) in Freiburg, Baden-Württemberg, Germany, 24–27 September 2019; General Technical Report FPL-GTR-272; Wang, X., Sauter, U.H., Ross, R.J., Eds.; U.S. Department of Agriculture, Forest Service: Madison, WI, USA, 2019. [Google Scholar]
- Grönquist, P.; Wood, D.; Hassani, M.M.; Wittel, F.K.; Menges, A.; Rüggeberg, M. Analysis of hygroscopic self-shaping wood at large scale for curved mass timber structures. Sci. Adv. 2019, 5. [Google Scholar] [CrossRef] [PubMed] [Green Version]
- Roberts, P. Wood Bending Using Laminations. The Woodworking Association of Pretoria Newsletter “Tambotie” 2018, Volume 11. Available online: http://ptawoodworkers.com/tambotie/tambotie-2018/ (accessed on 1 July 2020).
- Clayden, B. Predicting the Spring. In Furniture & Cabinetmaking; GMC Publications LTD: Lewes, UK; Volume 8, pp. 37–39. Available online: https://www.gmcsubscriptions.com/product/furniture-and-cabinetmaking/ (accessed on 1 July 2020).
- Springback Calculation for Laminated Work. Available online: http://www.richardjonesfurniture.com/PDFs/LaminateSpringback.pdf (accessed on 6 May 2020).
- Saelem, S.; Chantranuwathana, S.; Panichanun, K.; Prempreeda, P.; Wichienprakarn, P.; Kruo-ongarjnukool, P. Experimental Verification of Leaf Spring Model by Using a Leaf Spring Test Rig. In Proceedings of the 2009 23rd Conference of the Mechanical Engineering Network of Thailand, Chiang Mai, Thailand, 4–7 November 2009. [Google Scholar]
- Makowski, S. Parameterstudie zum Springback Effekt an in Form Verklebten Holzlagewerstoffen. Bachelor’s Thesis, University for Sustainable Development Eberswalde, Eberswalde, Germany, 28 June 2019. [Google Scholar]
- Heller Holzbiegewerk GmbH. Personal Communication; Heller Holzbiegewerk GmbH: Losau, Germany, 2020. [Google Scholar]
- R Core Team. R: A Language and Environment for Statistical Computing; R Foundation for Statistical Computing: Vienna, Austria, 2019. [Google Scholar]
- Niemz, P.; Sonderegger, W. Physik des Holzes und der Holzwerkstoffe, 1st ed.; Carl Hanser Verlag München: München, Germany, 2017. [Google Scholar]
- Gross, S. Berechnung und Gestaltung von Metallfedern (engl. Calculating and Designing of Metal. Springs), 3rd ed.; Ing, K., Ed.; Kollmann: Karlsruhe, Germany, 1960. [Google Scholar]
Figure 1.
Bambulator—form parts.

Figure 2.
MDF die design and clamp setup. The measurement points (A) to determine the radius are marked with arrows.
Figure 2.
MDF die design and clamp setup. The measurement points (A) to determine the radius are marked with arrows.

Figure 3.
Linear correlation of springback and elasticity value. The different radii are separately marked.
Figure 3.
Linear correlation of springback and elasticity value. The different radii are separately marked.

Figure 4.
Trend curve from springback and number of laminations of all 57 samples. The black dot represents the arithmetic mean springback for each given value of n (circle).
Figure 4.
Trend curve from springback and number of laminations of all 57 samples. The black dot represents the arithmetic mean springback for each given value of n (circle).

Figure 5.
(a) Parity plot of all 57 springback values (circle) and mean values (black dot) obtained by measurement and calculation with the formula (12). (b) Error plot of all 57 springback values (circle) obtained by measurement and calculation with the formula (12).
Figure 5.
(a) Parity plot of all 57 springback values (circle) and mean values (black dot) obtained by measurement and calculation with the formula (12). (b) Error plot of all 57 springback values (circle) obtained by measurement and calculation with the formula (12).


Table 1.
Springback values [%] and elasticity value of the stack [N/mm2] sorted by their lamination and stack thickness [mm] as well as the number of laminations. The three radii are present in all combinations of lamination thickness and number of laminations except samples 52–57.
Table 1.
Springback values [%] and elasticity value of the stack [N/mm2] sorted by their lamination and stack thickness [mm] as well as the number of laminations. The three radii are present in all combinations of lamination thickness and number of laminations except samples 52–57.
| Sample No | Thickness of Lamination [mm] | Radius [mm] | Number of Laminations | Elasticity Value of Stack [N/mm2] | Springback [%] |
|---|---|---|---|---|---|
| 1 | 1 | 250 | 2 | 3372.5 | 22.9 |
| 2 | 1 | 250 | 3 | 1212.2 | 8.2 |
| 3 | 1 | 250 | 4 | 629 | 4.6 |
| 4 | 1 | 250 | 5 | 472.9 | 3.5 |
| 5 | 1 | 250 | 6 | 296.8 | 2.5 |
| 6 1 | 1 | 250 | 8 | 238.5 | 3 |
| 7 1 | 1 | 250 | 12 | 103.4 | 2.3 |
| 8 1 | 1 | 250 | 16 | 62 | 1.2 |
| 9 | 2 | 250 | 2 | 3352.8 | 24.4 |
| 10 | 2 | 250 | 3 | 1503.1 | 9.1 |
| 11 1 | 2 | 250 | 4 | 784.5 | 6.4 |
| 12 | 2 | 250 | 5 | 474 | 2.9 |
| 13 1 | 2 | 250 | 6 | 328.6 | 2.5 |
| 14 1 | 2 | 250 | 8 | 188.5 | 1.9 |
| 15 1 | 4 | 250 | 2 | 3062.7 | 18 |
| 16 1 | 4 | 250 | 3 | 1600 | 7.2 |
| 17 1 | 4 | 250 | 4 | 899.1 | 5 |
| 18 | 1 | 300 | 2 | 3617.2 | 31 |
| 19 | 1 | 300 | 3 | 1220.5 | 8.7 |
| 20 | 1 | 300 | 4 | 612.1 | 3.9 |
| 21 | 1 | 300 | 5 | 506.9 | 2.8 |
| 22 | 1 | 300 | 6 | 313.1 | 1.7 |
| 23 1 | 1 | 300 | 8 | 306.7 | 2.8 |
| 24 1 | 1 | 300 | 12 | 143 | 2 |
| 25 1 | 1 | 300 | 16 | 65.7 | 0.8 |
| 26 | 2 | 300 | 2 | 3285.4 | 27.4 |
| 27 | 2 | 300 | 3 | 1466.6 | 10.3 |
| 28 1 | 2 | 300 | 4 | 770.8 | 4.8 |
| 29 | 2 | 300 | 5 | 504 | 3.2 |
| 30 1 | 2 | 300 | 6 | 405.4 | 2.5 |
| 31 1 | 2 | 300 | 8 | 196.6 | 2 |
| 32 1 | 4 | 300 | 2 | 3372.9 | 21.2 |
| 33 1 | 4 | 300 | 3 | 1638.6 | 5.6 |
| 34 1 | 4 | 300 | 4 | 771 | 4.2 |
| 35 | 1 | 350 | 2 | 3273.7 | 27.5 |
| 36 | 1 | 350 | 3 | 1169.1 | 6.9 |
| 37 | 1 | 350 | 4 | 684.2 | 3.7 |
| 38 | 1 | 350 | 5 | 525.8 | 4.1 |
| 39 | 1 | 350 | 6 | 298.4 | 2.6 |
| 40 1 | 1 | 350 | 8 | 229.7 | 3.5 |
| 41 1 | 1 | 350 | 12 | 101.7 | 1.1 |
| 42 1 | 1 | 350 | 16 | 57.8 | 0.9 |
| 43 | 2 | 350 | 2 | 3336.9 | 29.8 |
| 44 | 2 | 350 | 3 | 1424.1 | 9.7 |
| 45 1 | 2 | 350 | 4 | 762 | 6.4 |
| 46 | 2 | 350 | 5 | 457.4 | 3.3 |
| 47 1 | 2 | 350 | 6 | 320.7 | 3 |
| 48 1 | 2 | 350 | 8 | 184.8 | 2.2 |
| 49 1 | 4 | 350 | 2 | 2997.6 | 19 |
| 50 1 | 4 | 350 | 3 | 1633.8 | 8.3 |
| 51 1 | 4 | 350 | 4 | 827.3 | 5 |
| 52 | 4 | 350 | 6 | 366.4 | 2.3 |
| 53 | 4 | 350 | 6 | 392 | 1.1 |
| 54 | 4 | 350 | 6 | 375.4 | 1.2 |
| 55 | 4 | 350 | 8 | 207.1 | 1.7 |
| 56 | 4 | 350 | 8 | 199.2 | 1.9 |
| 57 | 4 | 350 | 8 | 213.2 | 1.6 |
1 Mean values from [11].
Table 2.
Statistical analysis of the springback mean values of a number of laminations.
| Sample No | Number of Laminations n | Mean Value of Springback [%] | Degree of Freedom | Standard Deviation | Coefficient of Variance |
|---|---|---|---|---|---|
| 1 | 2 | 24.5777778 | 9 | 4.6590712 | 0.1895644 |
| 2 | 3 | 8.2222222 | 9 | 1.4652455 | 0.1782055 |
| 3 | 4 | 4.8888889 | 9 | 0.9713965 | 0.1986947 |
| 4 | 5 | 3.3000000 | 6 | 0.4690416 | 0.1421338 |
| 5 | 6 | 2.1555556 | 9 | 0.6635343 | 0.3078252 |
| 6 | 8 | 2.2888889 | 9 | 0.6565905 | 0.2868599 |
| 7 | 12 | 1.8000000 | 3 | 0.6244998 | 0.3469443 |
| 8 | 16 | 0.9666667 | 3 | 0.2081666 | 0.2153448 |
© 2020 by the authors. Licensee MDPI, Basel, Switzerland. This article is an open access article distributed under the terms and conditions of the Creative Commons Attribution (CC BY) license (http://creativecommons.org/licenses/by/4.0/).
Share and Cite
MDPI and ACS Style
Sanne, M.; Ahn-Ercan, G.; Pfriem, A. A Mathematical Solution for Calculating the Springback of Laminated Beech Stacks Molded within the Elastic Range. Forests 2020, 11, 725. https://doi.org/10.3390/f11070725
AMA Style
Sanne M, Ahn-Ercan G, Pfriem A. A Mathematical Solution for Calculating the Springback of Laminated Beech Stacks Molded within the Elastic Range. Forests. 2020; 11(7):725. https://doi.org/10.3390/f11070725
Chicago/Turabian StyleSanne, Moritz, Gudrun Ahn-Ercan, and Alexander Pfriem. 2020. "A Mathematical Solution for Calculating the Springback of Laminated Beech Stacks Molded within the Elastic Range" Forests 11, no. 7: 725. https://doi.org/10.3390/f11070725
Note that from the first issue of 2016, this journal uses article numbers instead of page numbers. See further details here.