Biological Effects of Korean Red Ginseng Polysaccharides in Aged Rat Using Global Proteomic Approach

 , ,
, ,
Abstract
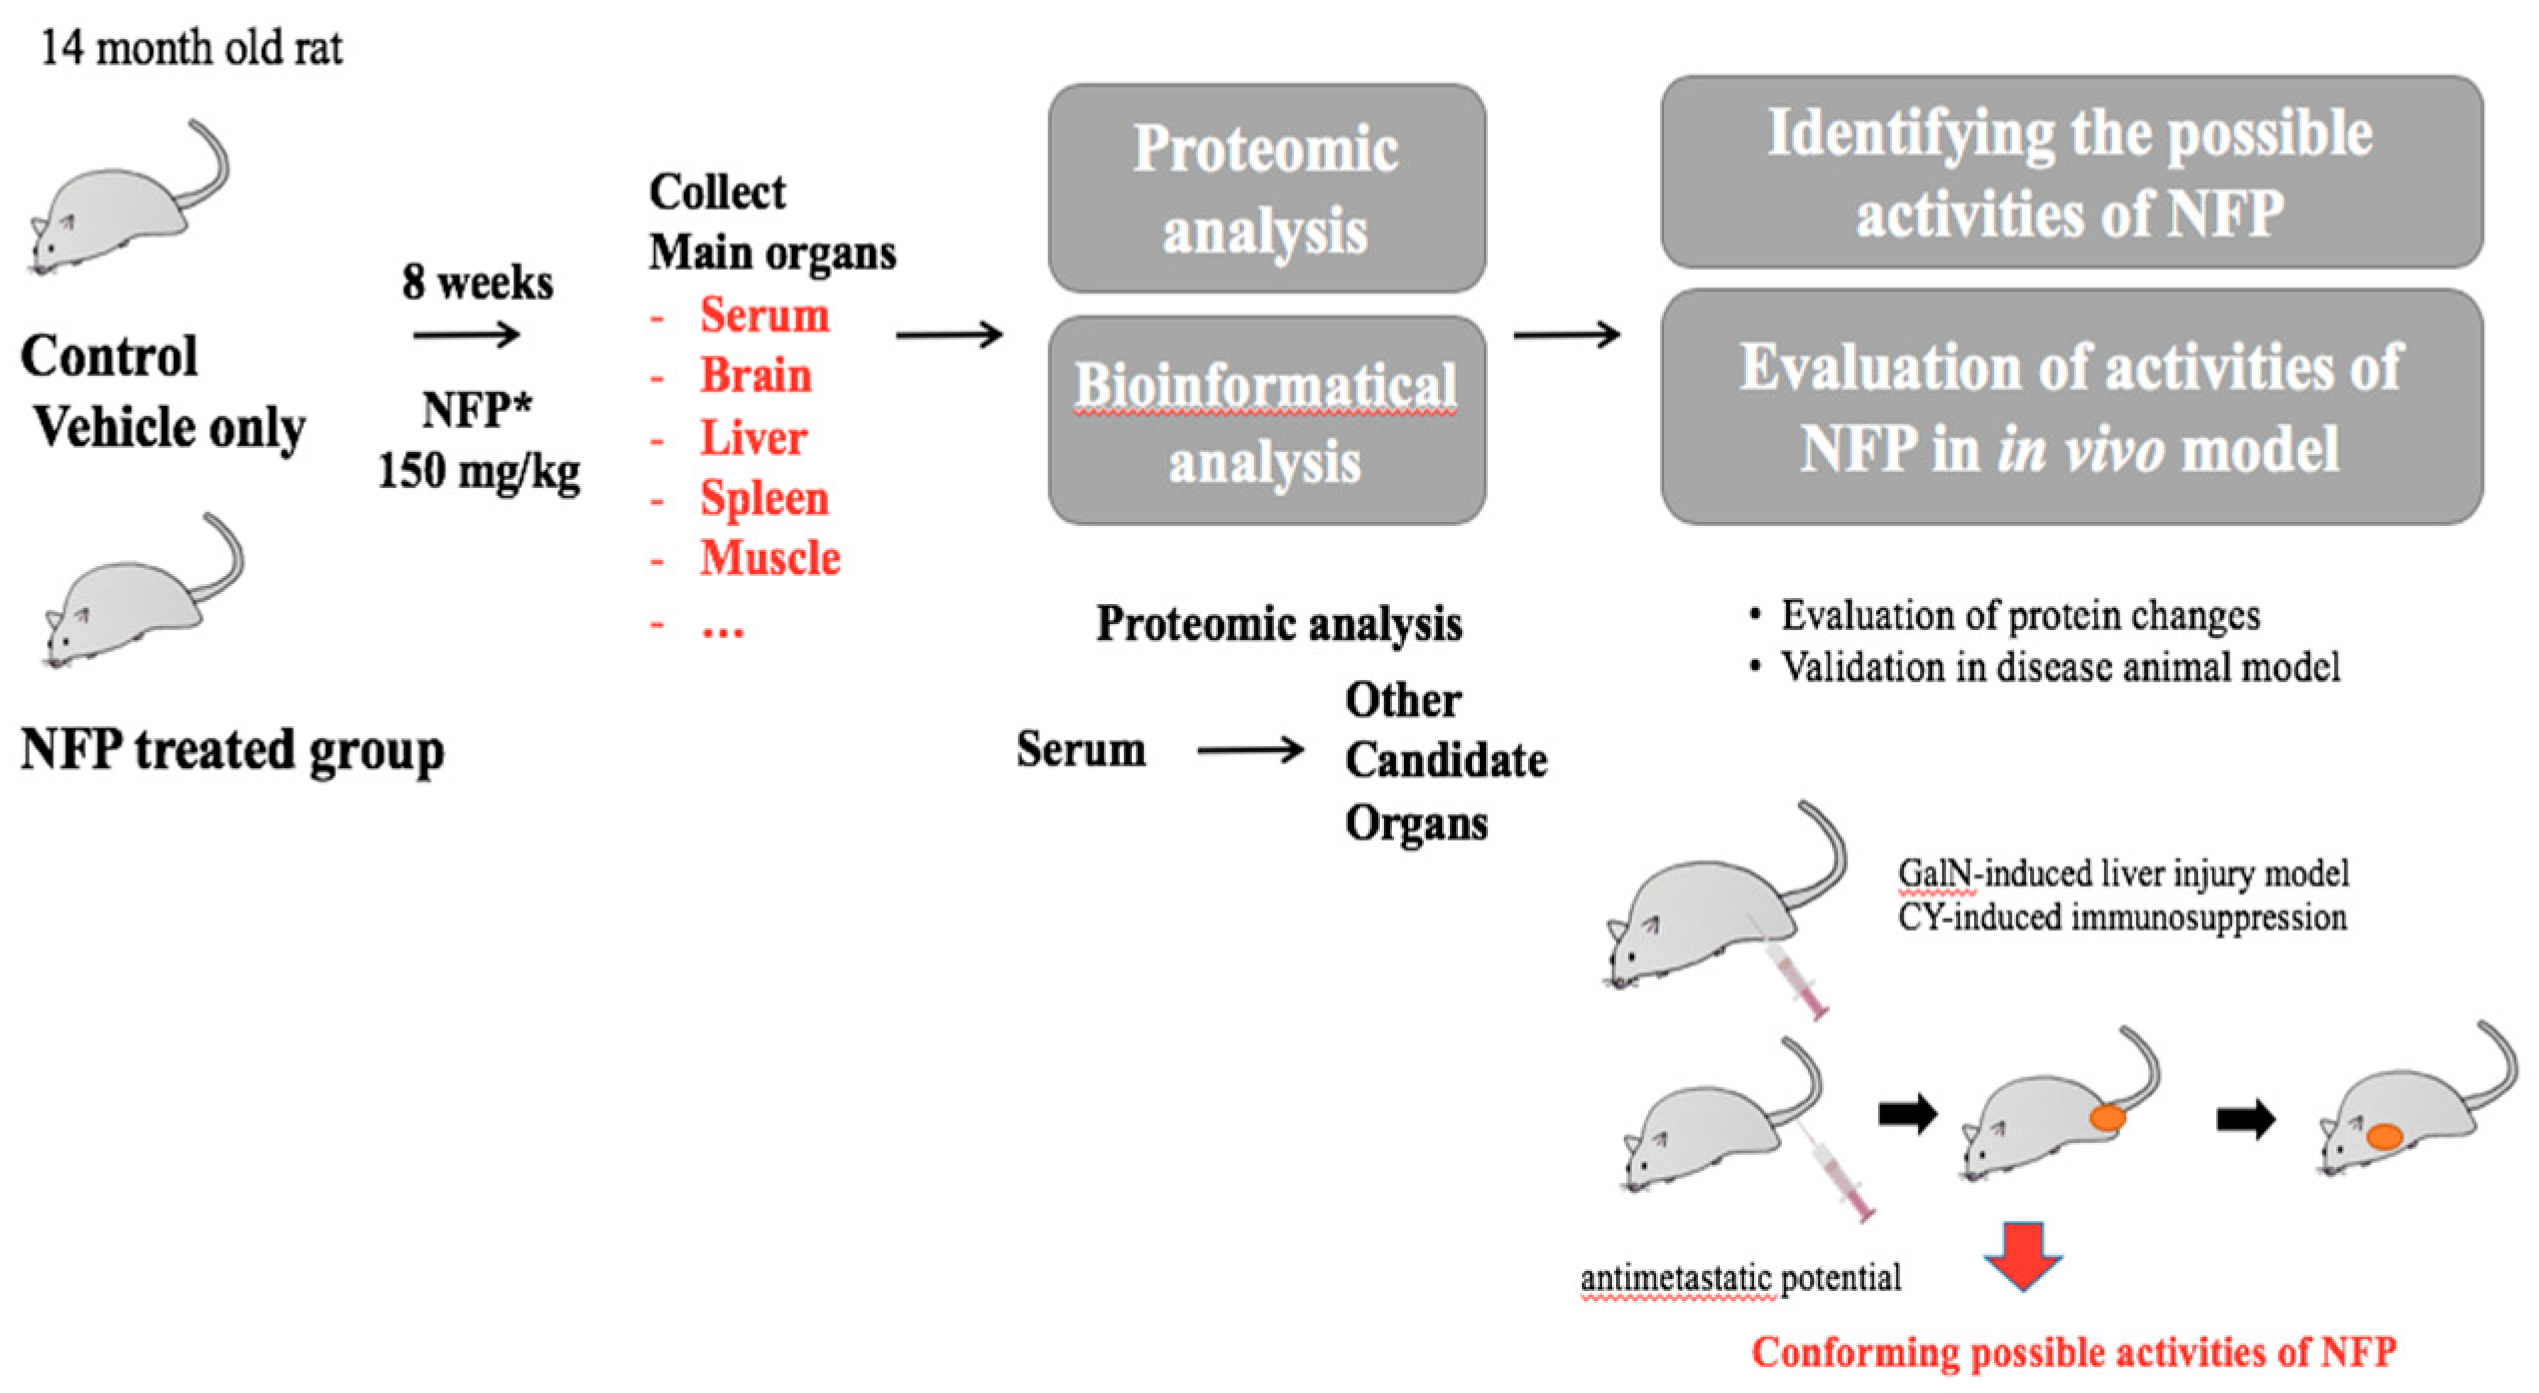
:1. Introduction
2. Results
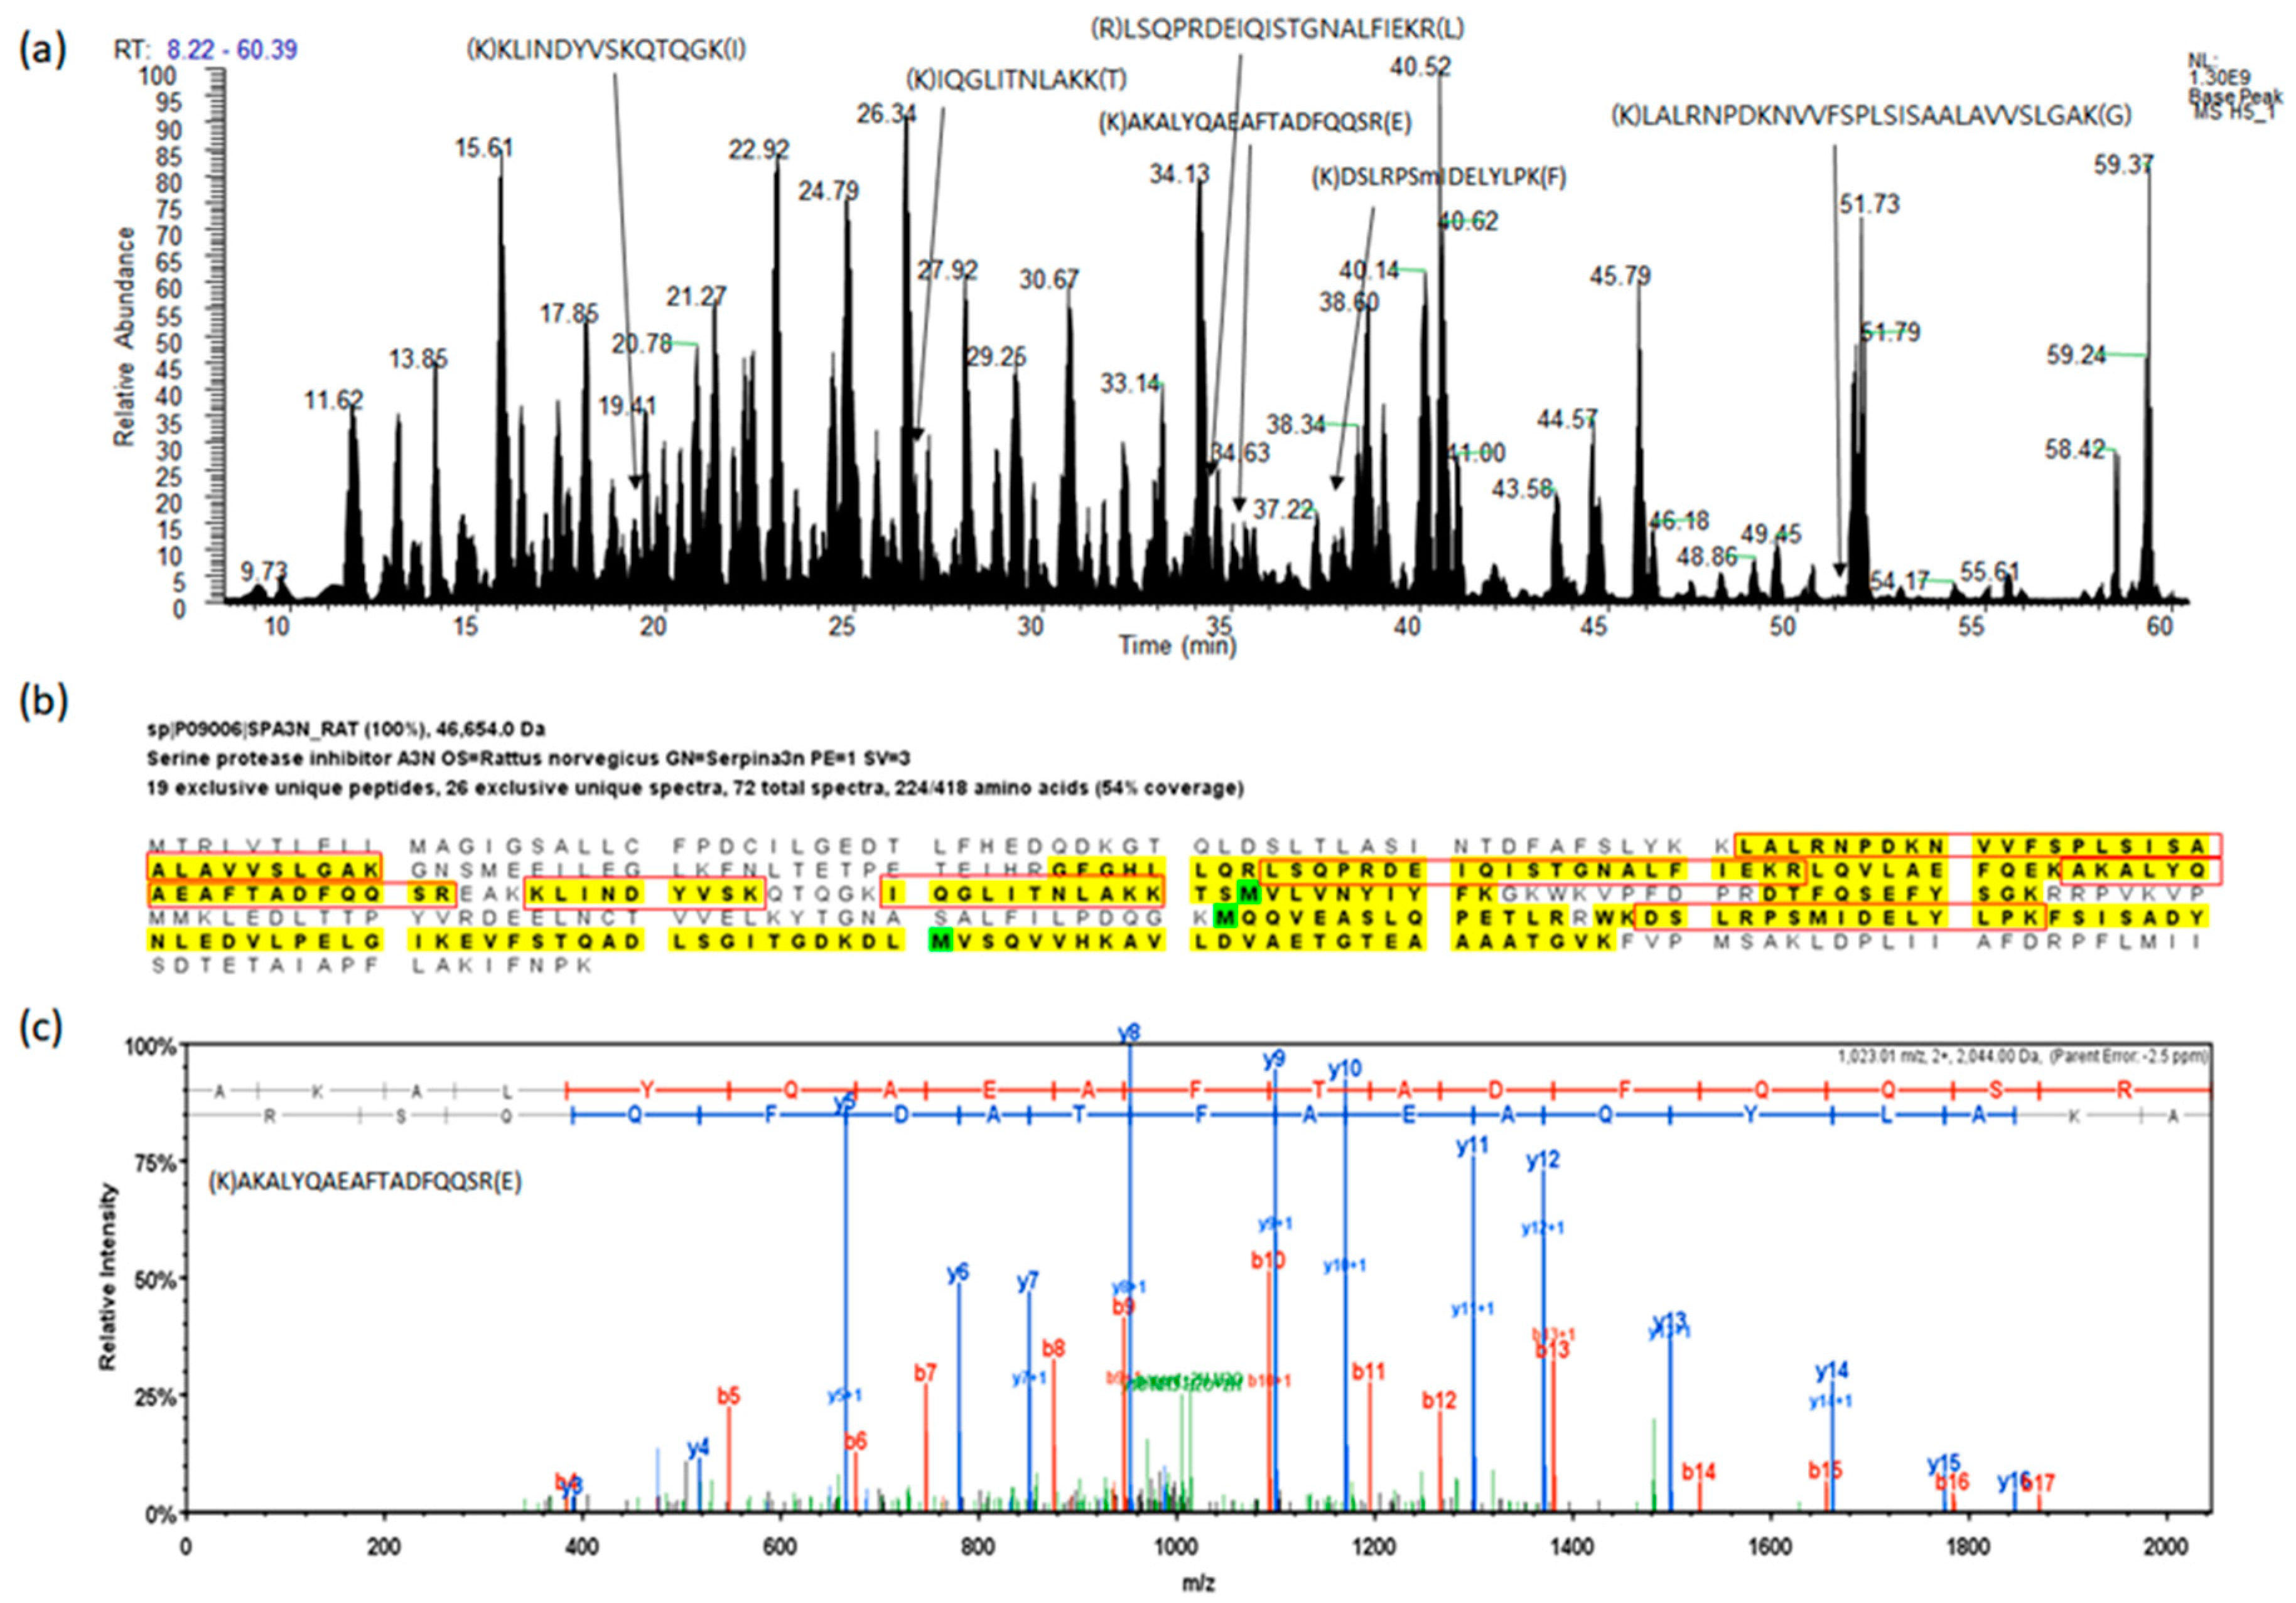
2.1. Protein Identification for Serum Proteins
2.2. Protein Identification: Spleen and Liver as Select Target Organs
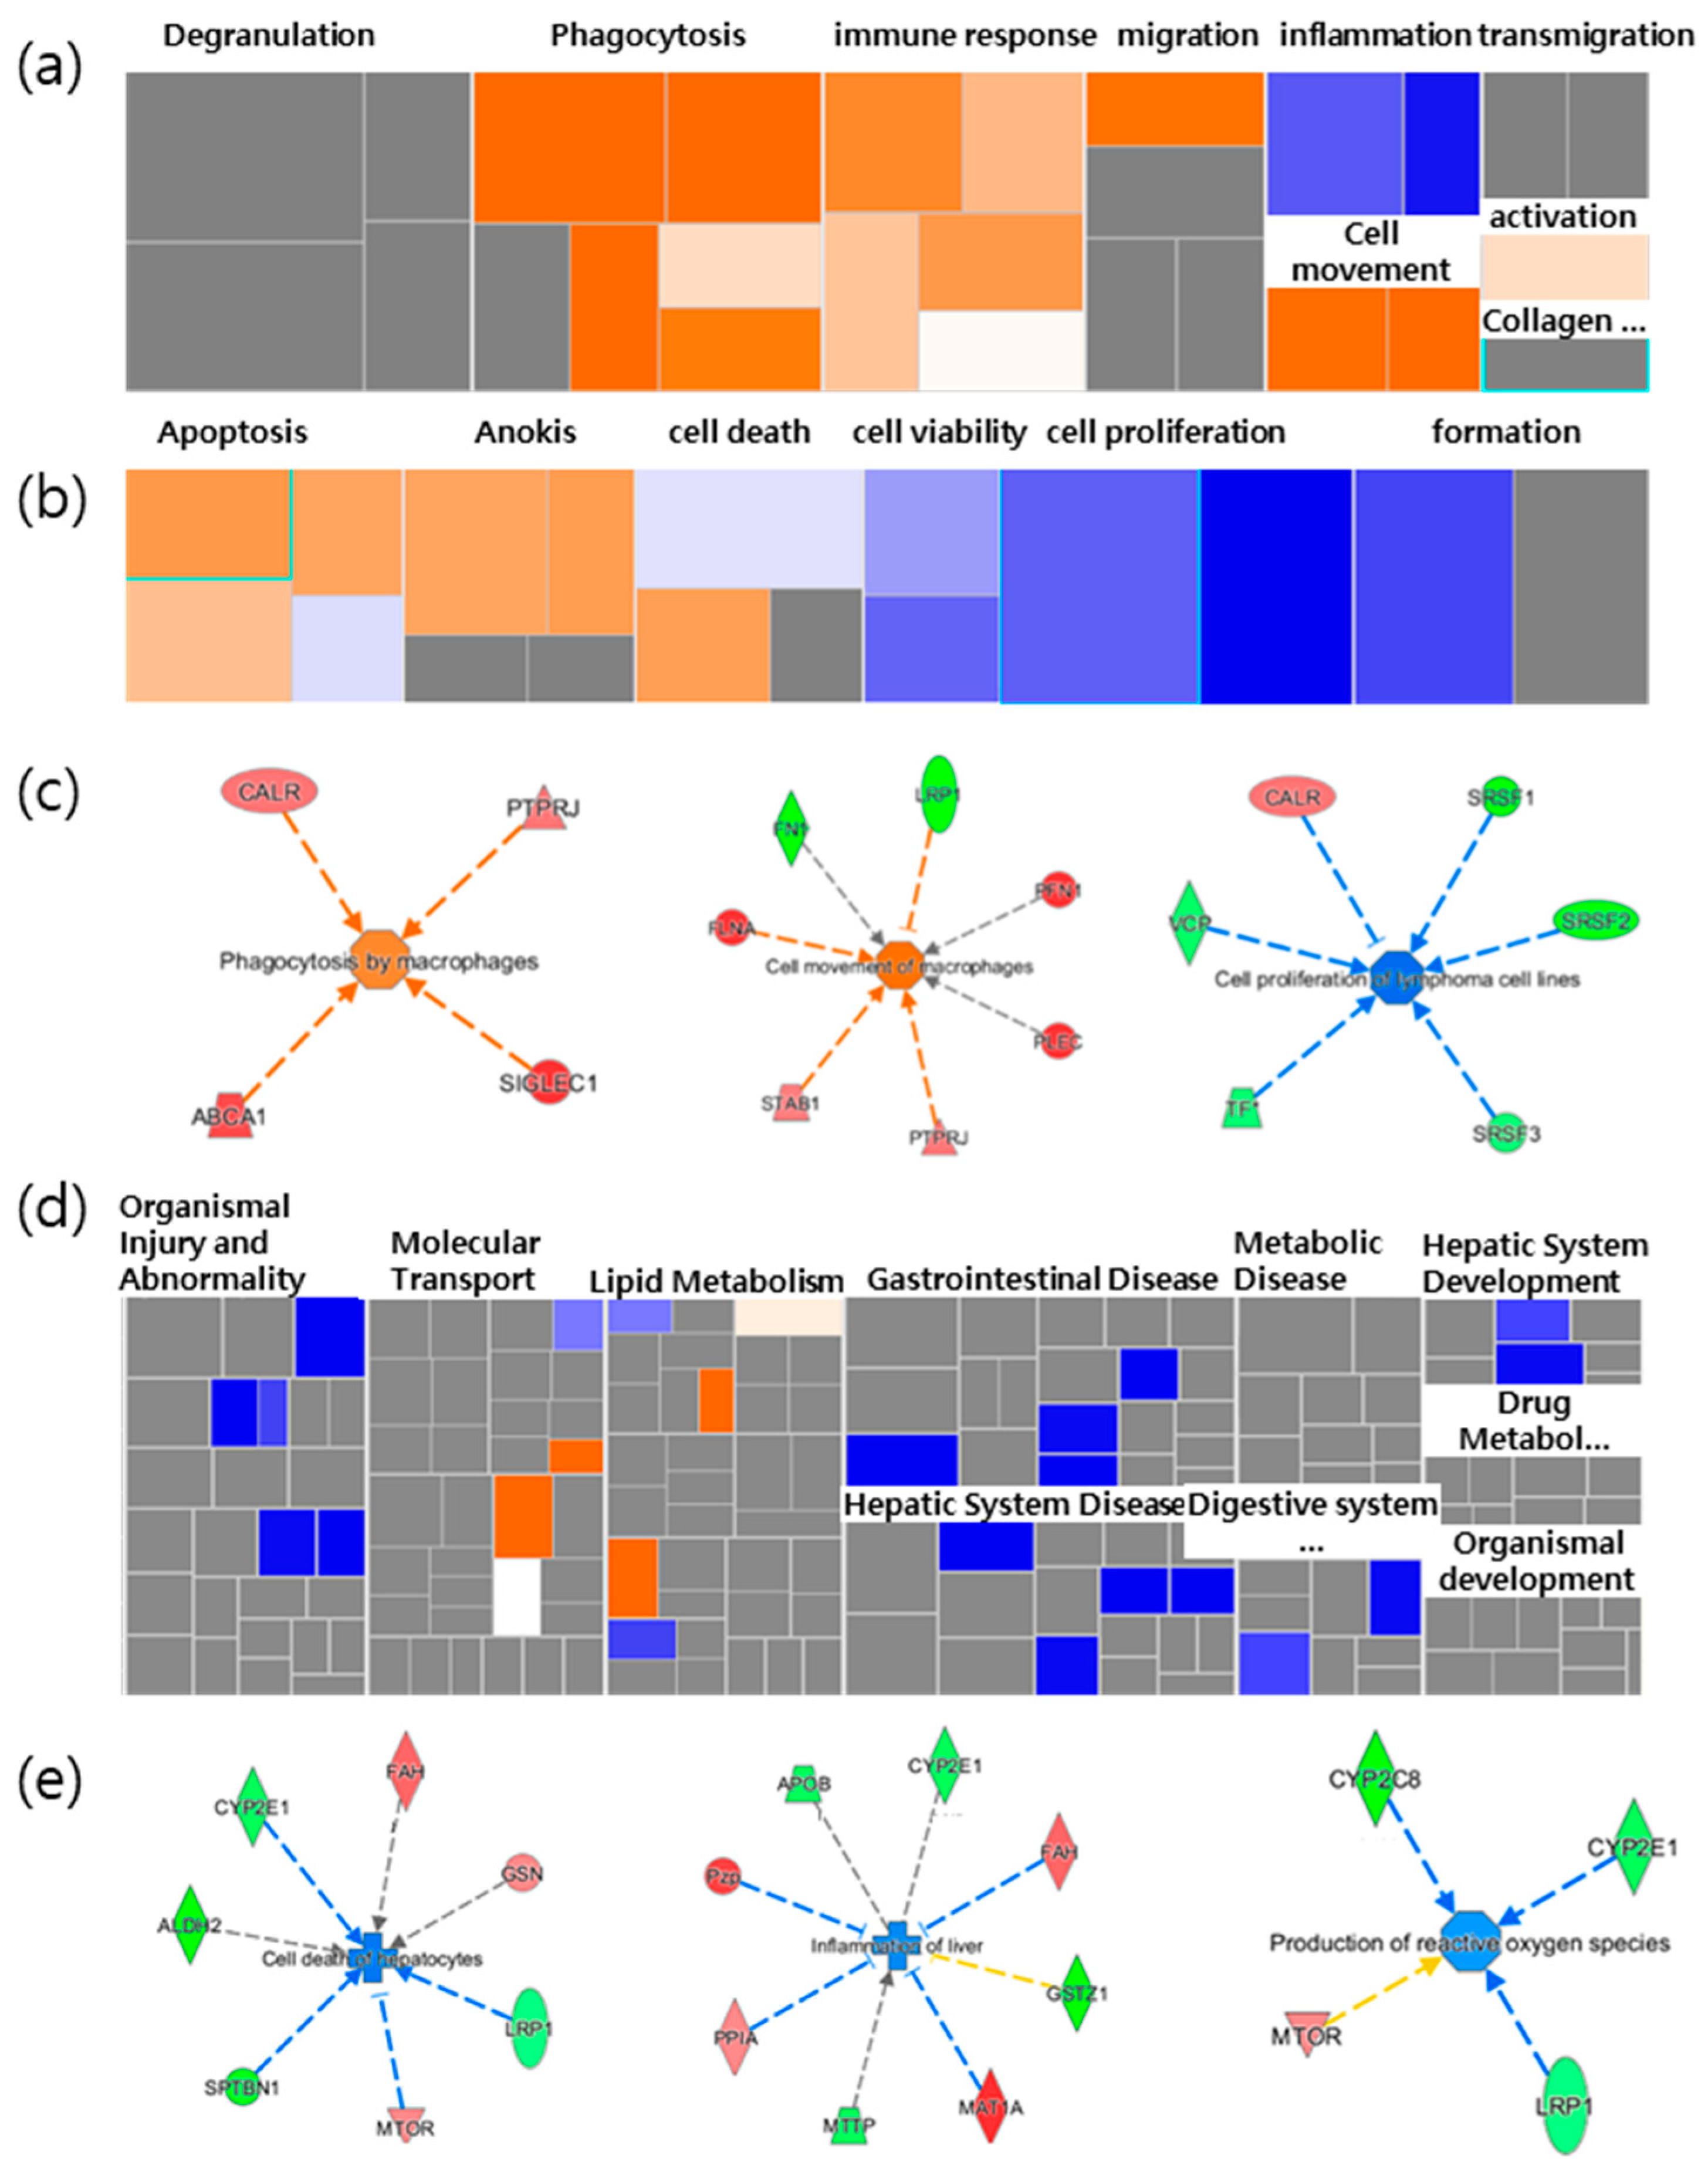
2.3. A More Detailed Function Analysis of the Proteins
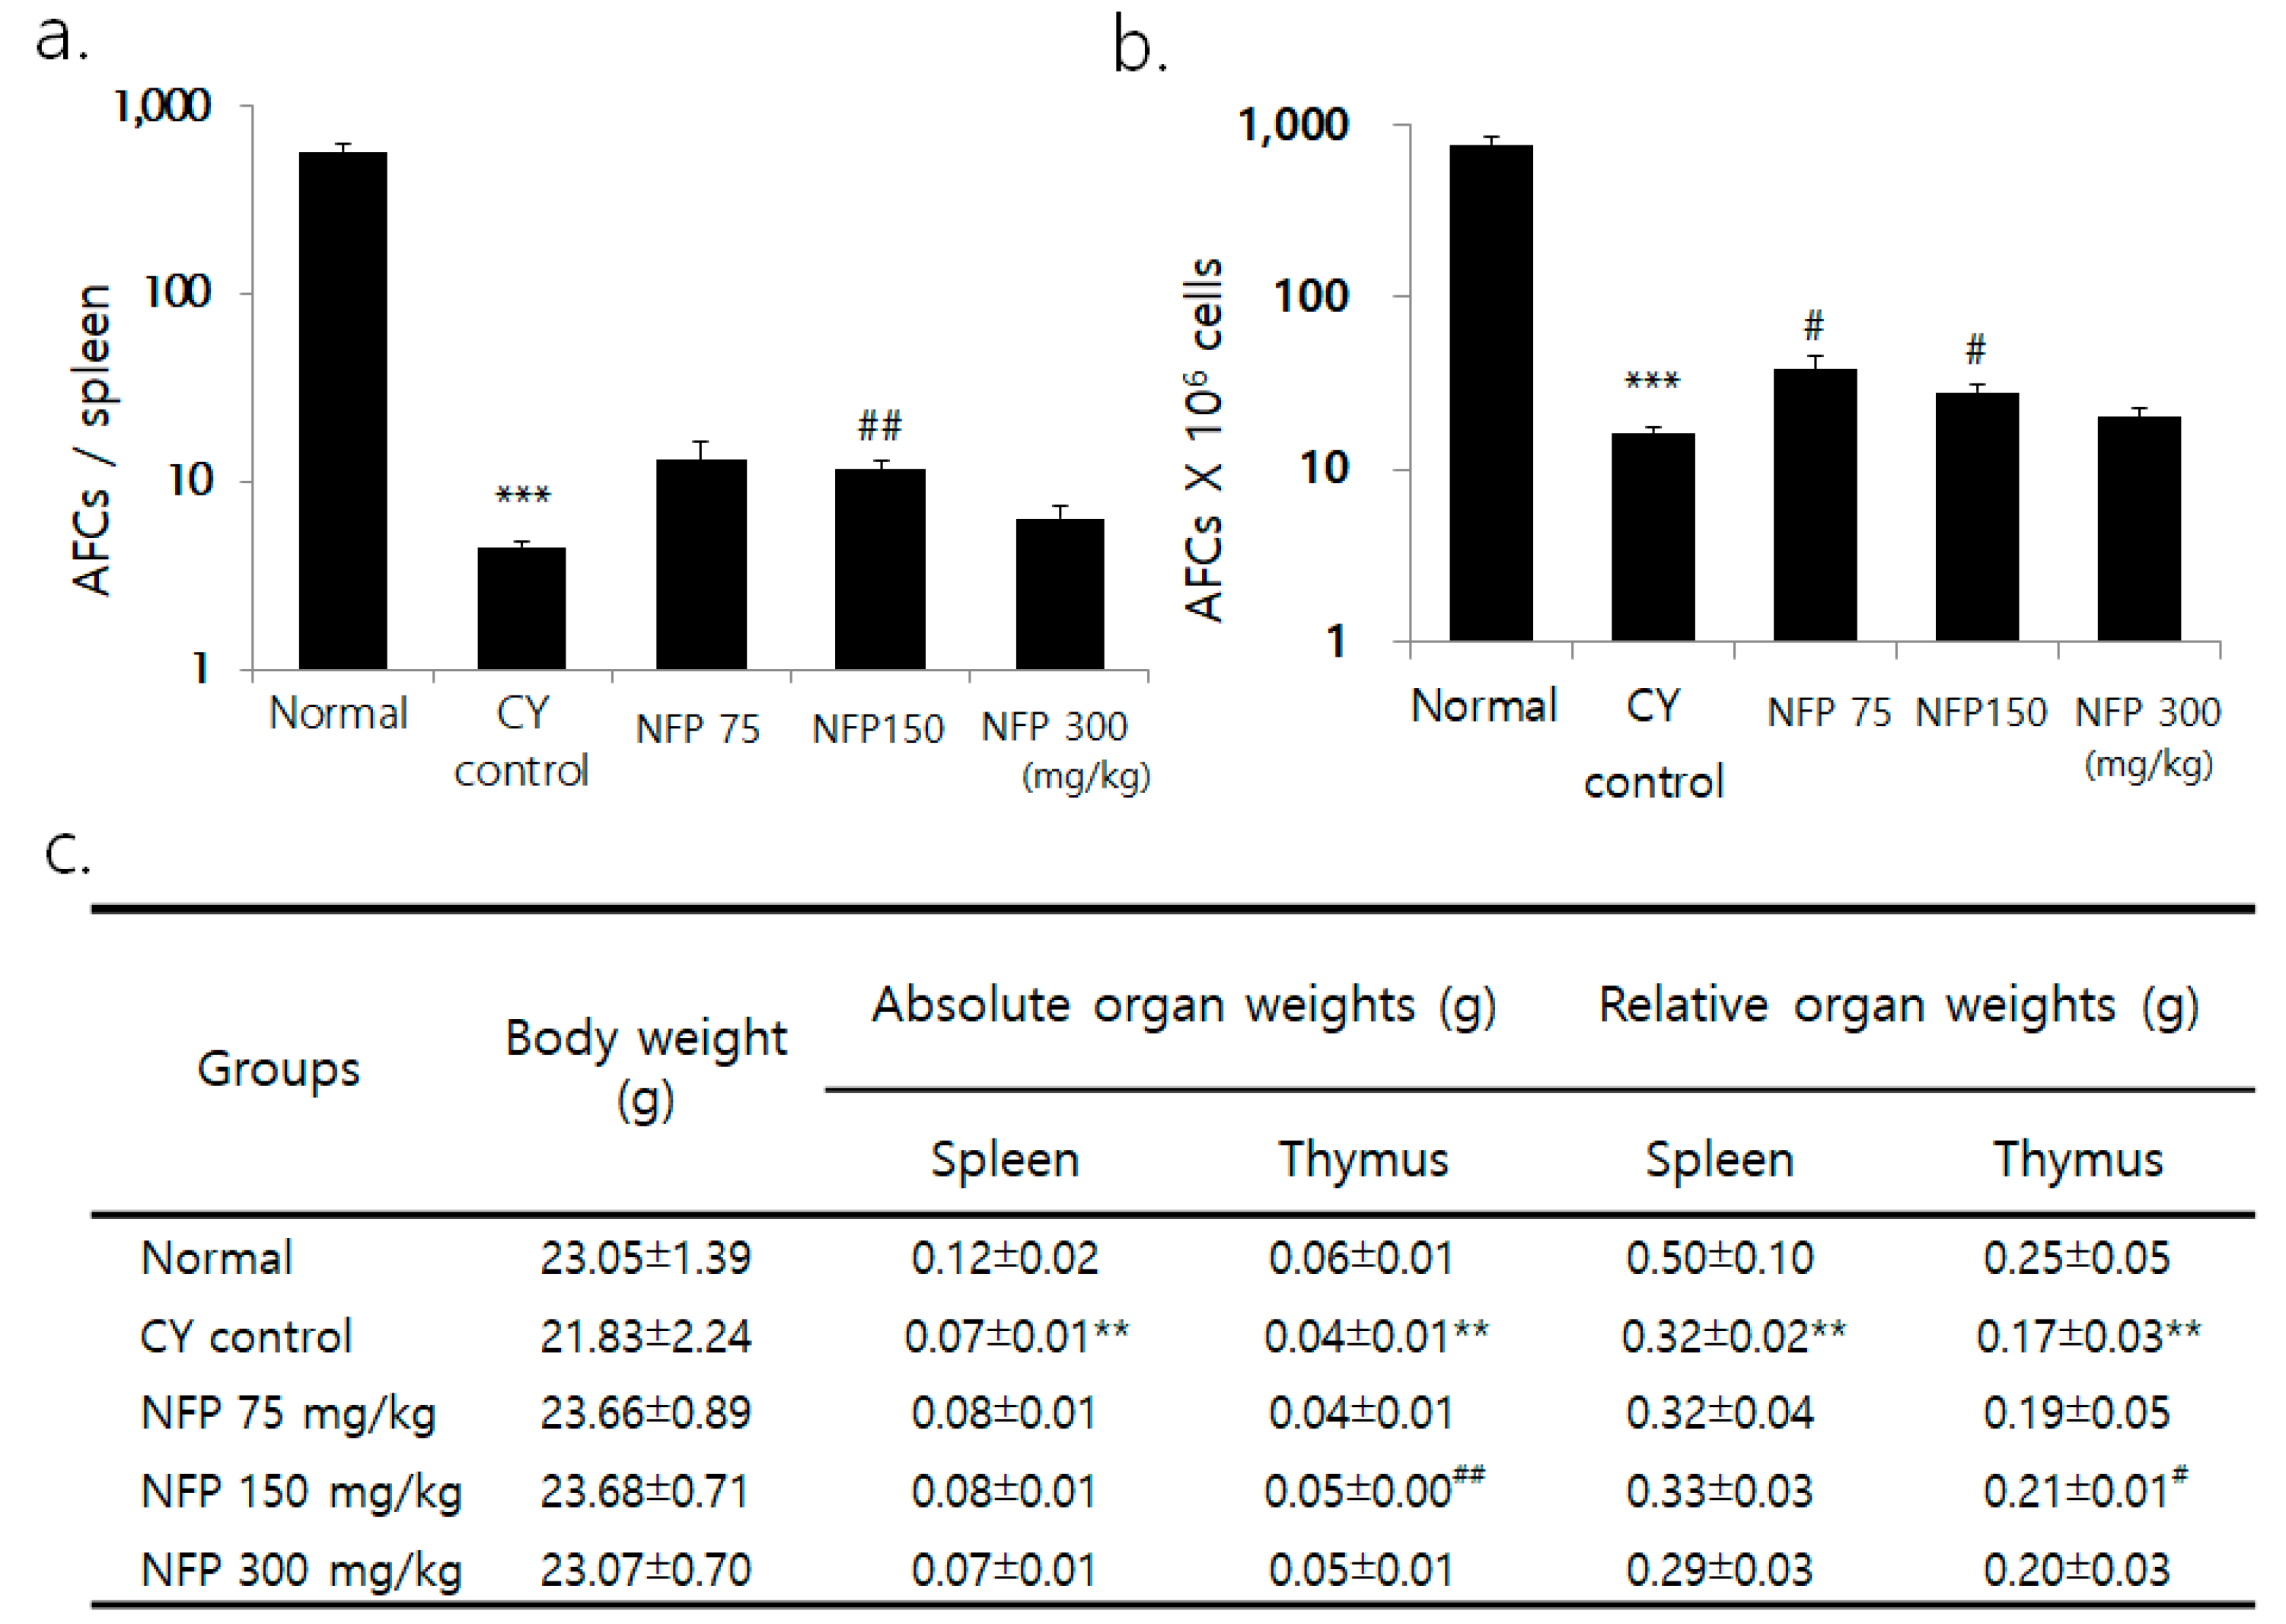
2.4. IgM Antibody-Producing Cells in the Spleen
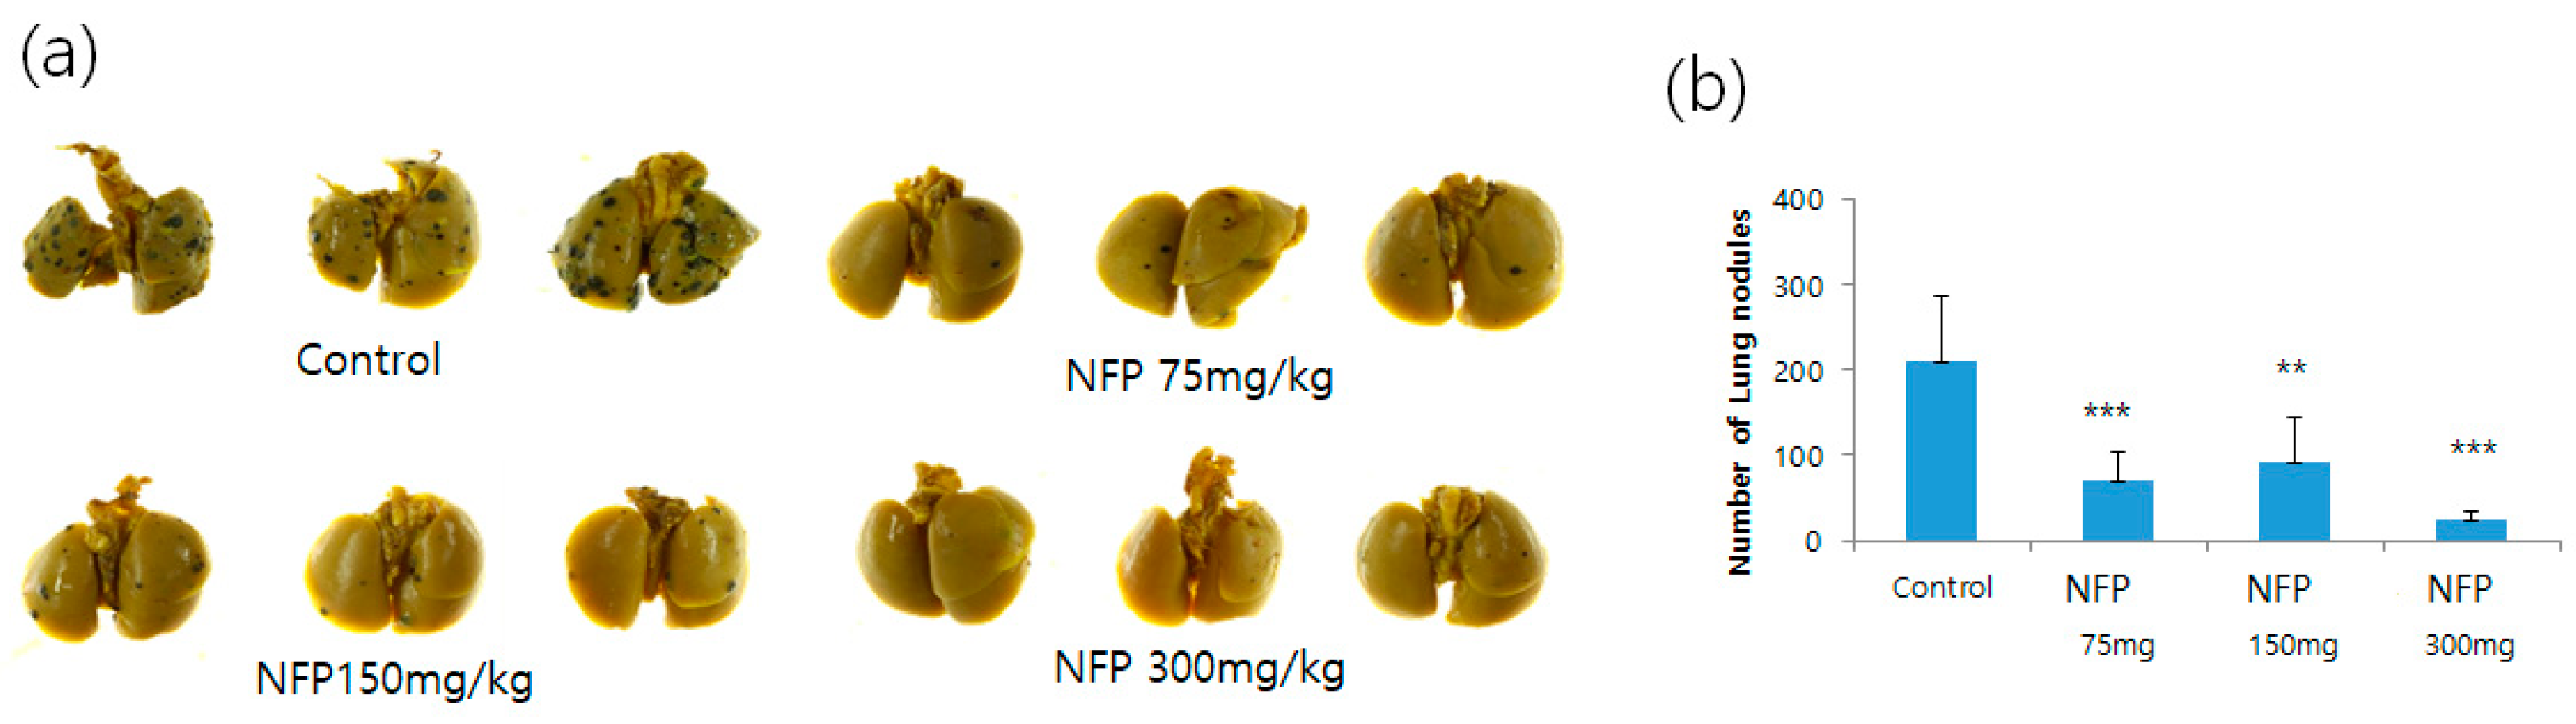
2.5. Evaluation for the Antimetastatic Potential of NFP in the Lungs
2.6. Galactosamine (GalN)-Induced Rat for Liver Injury Model
3. Discussion
4. Materials and Methods
4.1. Preparation of the KRG Water Extract and General Chemicals
4.2. Extraction of the NFP Fraction
4.3. Global Proteomic Profiling Analysis
4.3.1. Animal Model
4.3.2. Serum Depletion
4.3.3. Protein Extraction
4.3.4. 1D SDS-PAGE Fractionation and In-gel Digestion
4.3.5. Protein Identification Using LC-MS/MS Analysis
4.3.6. Data Search, Statistical Analysis, and Bioinformatic Analysis
4.4. IgM Antibody-Producing Cells in the Spleen
4.5. Experimental Murine Lung Metastasis
4.6. Galactosamine (GalN)-Induced Rat for Liver Injury Model
4.6.1. Evaluation of Liver Function and Oxidative Stress Markers
4.6.2. Histologic Examination
Supplementary Materials
Author Contributions
Funding
Conflicts of Interest
References
- Yang, M.; Lee, H.S.; Hwang, M.W.; Jin, M. Effects of Korean Red Ginseng (Panax ginseng Meyer) on bisphenol A exposure and gynecologic complaints: Single blind, randomized clinical trial of efficacy and safety. BMC Complement Altern. Med. 2014, 14, 265. [Google Scholar] [CrossRef] [PubMed] [Green Version]
- So, S.H.; Lee, J.W.; Kim, Y.S.; Hyun, S.H.; Han, C.K. Red ginseng monograph. J. Ginseng Res. 2018, 42, 549–561. [Google Scholar] [CrossRef] [PubMed]
- Lee, S.M.; Bae, B.S.; Park, H.W.; Ahn, N.G.; Cho, B.G.; Cho, Y.L.; Kwak, Y.S. Characterization of Korean Red Ginseng (Panax ginseng Meyer): History, preparation method, and chemical composition. J. Ginseng Res. 2015, 39, 384–391. [Google Scholar] [CrossRef] [PubMed] [Green Version]
- Lee, S.J.; In, G.; Han, S.-T.; Lee, M.-H.; Lee, J.-W.; Shin, K.-S. Structural characteristics of a red ginseng acidic polysaccharide rhamnogalacturonan I with immunostimulating activity from red ginseng. J. Ginseng Res. 2014, 44, 570–579. [Google Scholar] [CrossRef]
- Chandramouli, K.; Qian, P.Y. Proteomics: Challenges, techniques, and possibilities to overcome biological sample complexity. Hum. Genom. Proteom. 2009, 239204. [Google Scholar] [CrossRef] [Green Version]
- Lee, Y.Y.; Seo, H.W.; Kyung, J.S.; Hyun, S.H.; Han, B.C.; Park, S.; So, S.H.; Lee, S.H.; Yi, E.C. Proteomic studies of putative molecular signatures for biological effects by Korean Red Ginseng. J. Ginseng Res. 2019, 43, 666–675. [Google Scholar] [CrossRef] [PubMed]
- Wang, Y.; Xu, A. Zheng: A systems biology approach to diagnosis and treatments. Science 2014, 346, S13–S15. [Google Scholar]
- Leung, E.L.-H.; Wong, V.K.-W.; Jiang, Z.-H.; Li, T.; Liu, L. Integrated network-based medicine: The role of traditional Chinese medicine in developing a new generation of medicine. SCIEAS 2014, 346, S16–S18. [Google Scholar]
- Palazzotto, E.; Weber, T. Omics and multi-omics approaches to study the biosynthesis of secondary metabolites in microorganisms. Curr. Opin. Microbiol. 2018, 45, 109–116. [Google Scholar] [CrossRef]
- Merwin, N.J.; Mousa, W.K.; Dejong, C.A.; Skinnider, M.A.; Cannon, M.J.; Li, H.; Dial, K.; Gunabalasingam, M.; Johnston, C.; Magarvey, N.A. DeepRiPP integrates multiomics data to automate discovery of novel ribosomally synthesized natural products. Proc. Natl. Acad. Sci. USA 2020, 117, 371–380. [Google Scholar] [CrossRef]
- Benjamin, S.A.; Finch, C.E.; Guerin, J.C.; Nelson, J.F.; Olshansky, S.J.; Roth, G.; Smith, R.G. Handbook of Models for Human Aging; Elsevier: Burlington, MA, USA, 2002. [Google Scholar]
- Jin, K.; Simpkins, J.W.; Ji, X.; Leis, M.; Stambler, I. The Critical Need to Promote Research of Aging and Aging-related Diseases to Improve Health and Longevity of the Elderly Population. Aging Dis. 2015, 6, 1–5. [Google Scholar] [CrossRef] [Green Version]
- Pillai, S.; Netravali, I.A.; Cariappa, A.; Mattoo, H. Siglecs and immune regulation. Annu. Rev. Immunol. 2012, 30, 357–392. [Google Scholar] [CrossRef] [Green Version]
- Jones, C.; Virji, M.; Crocker, P.R. Recognition of sialylated meningococcal lipopolysaccharide by siglecs expressed on myeloid cells leads to enhanced bacterial uptake. Mol. Microbiol. 2003, 49, 1213–1225. [Google Scholar] [CrossRef]
- Pankov, R.; Yamada, K.M. Fibronectin at a glance. J. Cell Sci. 2002, 115, 3861–3863. [Google Scholar] [CrossRef] [Green Version]
- Grinnell, F.; Billingham, R.E.; Burgess, L. Distribution of fibronectin during wound healing in vivo. J. Investig. Dermatol. 1981, 76, 181–189. [Google Scholar] [CrossRef] [Green Version]
- Wiche, G. Role of plectin in cytoskeleton organization and dynamics. J. Cell Sci. 1998, 111, 2477–2486. [Google Scholar]
- Kamal, A.H.M.; Chakrabarty, J.K.; Udden, S.M.N.; Zaki, M.H.; Chowdhury, S.M. Inflammatory Proteomic Network Analysis of Statin-treated and Lipopolysaccharide-activated Macrophages. Sci. Rep. 2018, 8, 164. [Google Scholar] [CrossRef] [Green Version]
- Ruhrberg, C.; Hajibagheri, M.A.; Parry, D.A.; Watt, F.M. Periplakin, a novel component of cornified envelopes and desmosomes that belongs to the plakin family and forms complexes with envoplakin. J. Cell Biol. 1997, 139, 1835–1849. [Google Scholar] [CrossRef] [PubMed] [Green Version]
- Leung, C.L.; Green, K.J.; Liem, R.K. Plakins: A family of versatile cytolinker proteins. Trends Cell Biol. 2002, 12, 37–45. [Google Scholar] [CrossRef]
- Yang, H.D.; Nam, S.W. Pathogenic diversity of RNA variants and RNA variation-associated factors in cancer development. Exp. Mol. Med 2020, 52, 582–593. [Google Scholar] [CrossRef]
- Hagopian, J.C.; Ma, C.T.; Meade, B.R.; Albuquerque, C.P.; Ngo, J.C.; Ghosh, G.; Jennings, P.A.; Fu, X.D.; Adams, J.A. Adaptable molecular interactions guide phosphorylation of the SR protein ASF/SF2 by SRPK1. J. Mol. Biol. 2008, 382, 894–909. [Google Scholar] [CrossRef] [Green Version]
- O’Neill, L.A.; Bryant, C.E.; Doyle, S.L. Therapeutic targeting of Toll-like receptors for infectious and inflammatory diseases and cancer. Pharmacol. Rev. 2009, 61, 177–197. [Google Scholar] [CrossRef] [Green Version]
- Savinko, T.; Guenther, C.; Utila, L.M.; Llort Asens, M.; Yao, S.; Tojkander, S.; Fagerholm, S.C. Filamin A Is Required for Optimal T Cell Integrin-Mediated Force Transmission, Flow Adhesion, and T Cell Trafficking. J. Immunol. 2018, 200, 3019–3116. [Google Scholar] [CrossRef] [Green Version]
- Ghosh, S.; Ahrens, W.A.; Phatak, S.U.; Hwang, S.; Schrum, L.W.; Bonkovsky, H.L. Association of filamin A and vimentin with hepatitis C virus proteins in infected human hepatocytes. J. Viral Hepat. 2011, 18, e568–e577. [Google Scholar] [CrossRef]
- Han, L.; Wang, L.; Zeng, Y.; Chen, H.; Zhu, Q.; Xu, S. Filamin A inhibits the replication of H5N6 influenza virus via activating the type I interferon signaling pathway. Sci. Sin. Vitae 2018, 48, 1279–1286. [Google Scholar]
- Malathi, K.; Siddiqui, M.A.; Dayal, S.; Naji, M.; Ezelle, H.J.; Zeng, C.; Zhou, A.; Hassel, B.A. RNase L interacts with Filamin A to regulate actin dynamics and barrier function for viral entry. mBio 2014, 5, e02012–e02014. [Google Scholar] [CrossRef] [Green Version]
- Loh, S.H.; Park, J.Y.; Cho, E.H.; Nah, S.Y.; Kang, Y.S. Animal lectins: Potential receptors for ginseng polysaccharides. J. Ginseng Res. 2017, 41, 1–9. [Google Scholar] [CrossRef] [Green Version]
- Hyun, S.H.; Kim, S.W.; Seo, H.W.; Youn, S.H.; Kyung, J.S.; Lee, Y.Y.; Gyo, I.; Park, C.-K.; Han, C.-K. Physiological and pharmacological features of the non-saponin components in Korean Red ginseng. J. Ginseng Res. 2020, 44, 527–537. [Google Scholar] [CrossRef]
- Shin, H.-J.; Kim, Y.-S.; Kwak, Y.-S.; Song, Y.-B.; Kyung, J.-S.; Wee, J.-J.; Park, J.-D. A Further Study on the Inhibition of Tumor Growth and Metastasis by Red Ginseng Acidic Polysaccharide (RGAP). Nat. Prod. Sci. 2004, 10, 284–288. [Google Scholar]
- Kwak, Y.-S.; Shin, H.-J.; Song, Y.-B.; Kyung, J.-S.; Wee, J.-J.; Park, J.-D. Effect of Oral Administration of Red ginseng acidic polysaccharide (RGAP) on the Tumor Growth Inhibition. J. Ginseng Res. 2005, 29, 176–181. [Google Scholar]
- Kim, W.R.; Brown, R.S., Jr.; Terrault, N.A.; El-Serag, H. Burden of liver disease in the United States: Summary of a workshop. Hepatology 2002, 36, 227–242. [Google Scholar] [CrossRef]
- Park, T.Y.; Hong, M.; Sung, H.; Kim, S.; Suk, K.T. Effect of Korean Red Ginseng in chronic liver disease. J. Ginseng Res. 2017, 41, 450–455. [Google Scholar] [CrossRef] [PubMed]
- Shim, J.Y.; Kim, M.H.; Kim, H.D.; Ahn, J.Y.; Yun, Y.S.; Song, J.Y. Protective action of the immunomodulator ginsan against carbon tetrachloride-induced liver injury via control of oxidative stress and the inflammatory response. Toxicol. App. Pharm. 2010, 242, 318–325. [Google Scholar] [CrossRef] [PubMed]
- Li, H.; Gu, L.; Zhong, Y.; Chen, Y.; Zhang, L.; Zhang, A.R.; Sobol, R.W.; Chen, T.; Li, J. Administration of polysaccharide from Panax notoginseng prolonged the survival of H22 tumor-bearing mice. Onco. Targets Ther. 2016, 9, 3433–3441. [Google Scholar] [PubMed] [Green Version]
- Sanyal, A.J. NASH: A global health problem. Hepatology Res. 2011, 41, 670–674. [Google Scholar] [CrossRef] [PubMed]
- Vernon, G.; Baranova, A.; Younossi, Z.M. Systematic review: The epidemiology and natural history of non-alcoholic fatty liver disease and non-alcoholic steatohepatitis in adults. Aliment. Pharmacol. Ther. 2011, 34, 274–285. [Google Scholar] [CrossRef]
- Main, P.A.; Angley, M.T.; O’Doherty, C.E.; Thomas, P.; Fenech, M. The potential role of the antioxidant and detoxification properties of glutathione in autism spectrum disorders: A systematic review and meta-analysis. Nutr. Metab. 2012, 9, 35. [Google Scholar] [CrossRef] [Green Version]
- Rotruck, J.T.; Pope, A.L.; Ganther, H.E.; Swanson, A.B.; Hafeman, D.G.; Hoekstra, W.G. Selenium: Biochemical role as a component of glutathione peroxidase. Science 1973, 179, 588–590. [Google Scholar] [CrossRef]
- Manu Pereira, M.D.; Ropero, P.; Loureiro, C.; Vives Corrons, J.L. Low affinity hemoglobinopathy (Hb Vigo) due to a new mutation of beta globin gene (c200 A>T.; Lys>Ile). A cause of rare anemia misdiagnosis. Am. J. Hematol. 2017, 92, E38–E40. [Google Scholar] [CrossRef] [Green Version]
- Chen, C.H.; Ferreira, J.C.; Gross, E.R.; Mochly-Rosen, D. Targeting aldehyde dehydrogenase 2: New therapeutic opportunities. Physiol. Rev. 2014, 94, 1–34. [Google Scholar] [CrossRef] [Green Version]
- Finkelstein, J.D. Methionine metabolism in mammals. J. Nutr. Biochem. 1990, 1, 228–237. [Google Scholar] [CrossRef]
- Kotb, M.; Mudd, S.H.; Mato, J.M.; Geller, A.M.; Kredich, N.M.; Chou, J.Y.; Cantoni, G.L. Consensus nomenclature for the mammalian methionine adenosyltransferase genes and gene products. Trends Genet. 1997, 13, 51–52. [Google Scholar] [CrossRef]
- Garcia-Trevijano, E.R.; Latasa, M.U.; Carretero, M.V.; Berasain, C.; Mato, J.M.; Avila, M.A. S-adenosylmethionine regulates MAT1A and MAT2A gene expression in cultured rat hepatocytes: A new role for S-adenosylmethionine in the maintenance of the differentiated status of the liver. FASEB J. 2010, 14, 2511–2518. [Google Scholar]
- Murphy, S.K.; Yang, H.; Moylan, C.A.; Pang, H.; Dellinger, A.; Abdelmalek, M.F.; Garrett, M.E.; Ashley-Koch, A.; Suzuki, A.; Tillmann, H.L.; et al. Relationship between methylome and transcriptome in patients with nonalcoholic fatty liver disease. Gastroenterology 2013, 145, 1076–1087. [Google Scholar] [CrossRef] [Green Version]
- Martinez-Chantar, M.L.; Corrales, F.J.; Martinez-Cruz, L.A.; Garcia-Trevijano, E.R.; Huang, Z.Z.; Chen, L.; Kanel, G.; Avila, M.A.; Mato, J.M.; Lu, S.C. Spontaneous oxidative stress and liver tumors in mice lacking methionine adenosyltransferase 1A. FASEB J. 2002, 16, 1292–1294. [Google Scholar] [CrossRef] [Green Version]
- Kwak, Y.-S.; Kim, Y.-S.; Shin, H.-J.; Song, Y.-B.; Park, J.-D. Anticancer activities by combined treatment of red ginseng acidic polysaccharide (RGAP) and anticancer agents. J. Ginseng Res. 2003, 27, 47–51. [Google Scholar]
- Choi, H.S.; Kim, K.H.; Sohn, E.; Park, J.D.; Kim, B.O.; Moon, E.Y.; Rhee, D.K.; Pyo, S. Red ginseng acidic polysaccharide (RGAP) in combination with IFN-gamma results in enhanced macrophage function through activation of the NF-kappaB pathway. Biosci. Biotechnol. Biochem. 2008, 72, 1817–1825. [Google Scholar] [CrossRef]
- Kim, K.-S.; Pyo, S.-K.; Sohn, E.-H. Immunomodulation of NK cell activity by red ginseng acidic polysaccharide (RGAP) in ovariectomized rats. J. Ginseng Res. 2009, 33, 99–103. [Google Scholar]
- Lee, J.-W.; Do, J.-H. Extraction condition of acidic polysaccharide from Korean Red Ginseng marc. J. Ginseng Res. 2002, 26, 202–205. [Google Scholar]
- Son, H.-J.; Ryu, G.-H. Chemical compositions and antioxidant activity of extract from a extruded white ginseng. J. Korean Soc. Food Sci. Nutr. 2009, 38, 946–950. [Google Scholar] [CrossRef]
- Kwak, Y.-S.; Han, M.W.; Bae, B.-S.; Ahn, N.-G.; Yu, H.Y.; Park, C.-S.; Baeg, I.-H.; Cho, B.-G. The Changes of Physicochemical Characteristics and Quality Stability of Korean Red Ginseng (Panax ginseng CA Meyer) Stored over 20 Years. Korean J. Physiol. Pharmacol. 2017, 48, 329–338. [Google Scholar]
- Shin, S.J.; Jeon, S.G.; Kim, J.I.; Jeong, Y.O.; Kim, S.; Park, Y.H.; Lee, S.K.; Park, H.H.; Hong, S.B.; Oh, S.; et al. Red Ginseng Attenuates Abeta-Induced Mitochondrial Dysfunction and Abeta-mediated Pathology in an Animal Model of Alzheimer’s Disease. Int. J. Mol. Sci. 2019, 20, 3030. [Google Scholar] [CrossRef] [PubMed] [Green Version]
- Lee, Y.Y.; McKinney, K.Q.; Ghosh, S.; Iannitti, D.A.; Martinie, J.B.; Caballes, F.R.; Russo, M.W.; Ahrens, W.A.; Lundgren, D.H.; Han, D.K.; et al. Subcellular tissue proteomics of hepatocellular carcinoma for molecular signature discovery. J. Proteome Res. 2011, 10, 5070–5083. [Google Scholar] [CrossRef] [PubMed]
- Hyun, S.H.; Kim, E.S.; Lee, S.M.; Kyung, J.S.; Lee, S.M.; Lee, J.W.; Kim, M.R.; Hong, J.T.; Kim, Y.S. Comparative study on immuno-enhancing effects of red ginseng fractions. J. Korean Soc. Food Sci. Nutr. 2014, 43, 1665–1673. [Google Scholar] [CrossRef]
- Yun, J.; Kim, B.G.; Kang, J.S.; Park, S.K.; Lee, K.; Hyun, D.H.; Kim, H.M.; In, M.J.; Kim, D.C. Lipid-soluble ginseng extract inhibits invasion and metastasis of B16F10 melanoma cells. J. Med. Food 2015, 18, 102–108. [Google Scholar] [CrossRef] [Green Version]
Sample Availability: An NFP sample is available from the authors. |


| Up/Down | Identified Proteins | Gene | Accession Number | Functional Annotation Clustering | STN | p-Value |
|---|---|---|---|---|---|---|
| Upregulated Protein | Serine protease inhibitor A3N | Serpina3n | P09006 | Secreted protein, cellular response to interleukin-6, phosphoprotein | 8.58 | 0.00094 |
| Ac1873 | Fga | Q7TQ70 | Glycoprotein, cellular response to interleukin-6, acute-phase response, structural molecule activity | 6.65 | 0.00206 | |
| Alpha-2-macroglobulin | LOC100911545 | M0R9G2 | 6.56 | 0.00211 | ||
| Fibrinogen beta chain | Fgb | P14480 | Secreted protein, structural molecule activity | 6.43 | 0.00251 | |
| Retinol-binding protein 4 | Rbp4 | P04916 | Disulfide bond | 4.78 | 0.00439 | |
| Aa1249 | Crp | Q7TMA9 | Cellular response to interleukin-6, acute-phase response, glycoprotein, secreted protein, disulfide bond | 4.30 | 0.00533 | |
| Murinoglobulin-1 | Mug1 | Q03626 | Acute-phase response, glycoprotein, disulfide bond | 4.24 | 0.00648 | |
| Keratin, type I cytoskeletal 17 | Krt17 | Q6IFU8 | Structural molecule activity, phosphoprotein | 4.09 | 0.00711 | |
| Isoform Gamma-A of Fibrinogen gamma chain | Fgg | P02680-2 | 3.68 | 0.00931 | ||
| Myoglobin | Mb | Q9QZ76 | Phosphoprotein | 3.44 | 0.01052 | |
| Keratin, type II cytoskeletal 5 | Krt5 | A0A0G2K509 | Structural molecule activity, phosphoprotein | 3.21 | 0.01164 | |
| Keratin, type II cytoskeletal 5 | Krt5 | Q6P6Q2 | Structural molecule activity, phosphoprotein | 3.14 | 0.01193 | |
| Keratin, type I cytoskeletal 10 | Krt10 | Q6IFW6 | Structural molecule activity, phosphoprotein | 3.07 | 0.01207 | |
| Glutathione S-transferase Mu 1 | Gstm1 | P04905 | Glutathione metabolism, thioredoxin-like fold, metabolism of xenobiotics by cytochrome P450 | 2.67 | 0.01427 | |
| Glutathione S-transferase alpha-3 | Gsta3 | P04904 | Glutathione metabolism, thioredoxin-like fold, metabolism of xenobiotics by cytochrome P450 | 2.58 | 0.01500 | |
| Carbonic anhydrase 3 | Ca3 | P14141 | Phosphoprotein | 2.55 | 0.01516 | |
| Fatty acid-binding protein, adipocyte | Fabp4 | P70623 | Phosphoprotein | 2.55 | 0.01516 | |
| Ribonuclease UK114 | Hrsp12 | P52759 | Phosphoprotein | 2.39 | 0.01642 | |
| Keratin, type I cytoskeletal 14 | Krt14 | Q6IFV1 | Structural molecule activity, phosphoprotein | 2.36 | 0.01667 | |
| LOC367586 protein | LOC367586 | Q5M7V3 | 2.33 | 0.01697 | ||
| Glutathione S-transferase Mu 2 | Gstm2 | P08010 | Glutathione metabolism, thioredoxin-like fold, metabolism of xenobiotics by cytochrome P450 | 2.09 | 0.01979 | |
| Fibrinogen-like protein 1 | Fgl1 | Q5M8C6 | Secreted protein | 1.85 | 0.02379 | |
| Downregulated Protein | Apolipoprotein A-IV | Apoa4 | P02651 | Secreted protein | −1.91 | 0.02326 |
| Hemopexin | Hpx | P20059 | Secreted protein | −1.95 | 0.02255 | |
| Coactosin-like protein | Cotl1 | B0BNA5 | Actin binding | −1.97 | 0.02220 | |
| Transforming growth factor beta-1 | Tgfb1 | P17246 | Hepatitis B, secreted protein | −1.98 | 0.02218 | |
| 14-3-3 protein theta | Ywhaq | P68255 | Hepatitis B, viral carcinogenesis, actin binding | −2.09 | 0.02070 | |
| 14-3-3 protein eta | Ywhah | P68511 | Hepatitis B, viral carcinogenesis, actin binding | −2.17 | 0.01986 | |
| Myl6 protein | Myl6 | B2GV99 | −2.19 | 0.01966 | ||
| Vinculin | Vcl | P85972 | Platelet aggregation, cell–cell adhesion, actin binding | −2.27 | 0.01831 | |
| Hemoglobin subunit beta-1 | Hbb | P02091 | Platelet aggregation, secreted protein | −2.29 | 0.01812 | |
| Tropomyosin alpha-4 chain | Tpm4 | P09495 | Actin binding | −2.36 | 0.01740 | |
| Cofilin-1 | Cfl1 | P45592 | Actin binding | −2.37 | 0.01739 | |
| Afamin | Afm | G3V9R9 | Actin binding, secreted protein | −2.46 | 0.01643 | |
| Adenylyl cyclase-associated protein 1 | Cap1 | Q08163 | Actin binding | −2.57 | 0.01562 | |
| Profilin-1 | Pfn1 | P62963 | cell-cell adhesion, actin binding | −2.69 | 0.01463 | |
| 14-3-3 protein zeta/delta | Ywhaz | P63102 | Viral carcinogenesis, actin binding | −3.09 | 0.01227 | |
| Transgelin-2 | Tagln2 | Q5XFX0 | Cell–cell adhesion | −3.55 | 0.01006 | |
| Filamin alpha | Flna | C0JPT7 | Platelet aggregation | −4.18 | 0.00688 | |
| Protein Tln1 | Tln1 | G3V852 | Platelet aggregation | −4.98 | 0.00399 | |
| Actin, cytoplasmic 1 | Actb | P60711 | Platelet aggregation, actin binding | −5.39 | 0.00301 | |
| Apolipoprotein C-III | Apoc3 | A0A0G2K8Q1 | Secreted protein | −5.76 | 0.00292 |
| Up/Down | Total Function | Cancer-Specific | Except Cancer |
|---|---|---|---|
| Upregulated | Quantity of cells | Concentration of lipid, fatty acid | Activation of phagocytes, macrophages |
| - myeloid cells | Concentration of lipopolysaccharide | Quantity of cells | |
| - blood cells | Conjugation of glutathione | - myeloid cells | |
| Quantity of cells | Cellular infiltration by leukocytes | - leukocytes | |
| Activation of cells | - blood cells | ||
| - phagocytes | Quantity of connective tissue | ||
| - macrophages | |||
| Quantity of connective tissue | |||
| Downregulated | Cancer | Cancer Type | Apoptosis, cell death |
| - Non-Hodgkin lymphoma | - Abdominal carcinoma, malignant solid tumor | - microvascular endothelial cells | |
| - Non-small cell lung carcinoma | - Nonhematologic malignant neoplasm, lung cancer | Damage of epithelial, endothelial tissue | |
| - Binding of tumor cell lines | - Liver cancer | Apoptosis, cell death | |
| - Lung carcinoma | - Non-Hodgkin lymphoma | - Endothelial cells | |
| Brain | - Non-melanoma solid tumor | Damage of nervous system | |
| - Tauopathy | - Extracranial solid tumor | Production of reactive oxygen species | |
| - Dementia | - Digestive system cancer | Damage of endothelial cells | |
| - Ischemia of brain | - Tumorigenesis of epithelial neoplasm | Synthesis of reactive oxygen species | |
| Viral Infection | Anticancer function | Necrosis of epithelial tissue | |
| Chronic kidney disease | - Metastasis of breast cancer cell lines | Binding of neutrophils | |
| Neuromuscular disease | - Cell spreading of tumor cell lines | Organismal death | |
| Thrombosis | - Development of malignant tumor | Adhesion of myeloid cells | |
| - Thrombosis of vein | - Incidence of tumor | ||
| - Coagulation of blood | - Angiogenesis | ||
| Fibrogenesis | |||
| Synthesis of reactive oxygen species |
| Up/Down | Top 60 Spleen Proteins | Gene | Accession Number | Signal to Noise (STN) | p-Value | Top 60 Liver Proteins | Gene | Accession Number | STN | p-Value |
|---|---|---|---|---|---|---|---|---|---|---|
| Upregulated Protein | Spectrin, alpha, erythrocytic 1 | Spta1 | D4A678 | 32.1 | 0.00002 | Hemoglobin subunit alpha 1/2 | Hba1 | P01946 | 16.9 | 0.00000 |
| Myosin 9 | Myh9 | Q62812 | 22.7 | 0.00005 | Globin a4 | Hbb | A0A0G2JSW3 | 15.7 | 0.00000 | |
| Spectrin beta chain | Sptb | A0A140UHX6 | 18.3 | 0.00005 | Alpha-2-macroglobulin | A2m | P06238 | 7.7 | 0.00000 | |
| Spectrin beta chain | Sptbn1 | G3V6S0 | 14.7 | 0.00009 | Beta-glo | Hbb-b1 | Q6PDU6 | 6.8 | 0.00000 | |
| Sialic acid-binding Ig-like lectin 1 | Siglec1 | A0A0G2K320 | 11.8 | 0.00016 | Spectrin beta chain | Sptb | A0A140UHX6 | 6.3 | 0.00000 | |
| DnaJ heat shock protein family (Hsp40) member C13 | Dnajc13 | D3ZN27 | 9.8 | 0.00016 | Fatty acid-binding protein, liver | Fabp1 | P02692 | 6.0 | 0.00000 | |
| Myosin, heavy polypeptide 9, non-muscle | Myh9 | G3V6P7 | 9.7 | 0.00016 | Elongation factor 1-alpha 1 | Eef1a1 | P62630 | 5.7 | 0.00000 | |
| Pre-mRNA processing factor 8, isoform CRAa | Prpf8 | G3V6H2 | 9.3 | 0.00017 | Betaine--homocysteine S-methyltransferase 1 | Bhmt | A0A0G2JSK9 | 5.5 | 0.00000 | |
| Spectrin alpha chain, non-erythrocytic 1 | Sptan1 | Q6IRK8 | 9.0 | 0.00017 | Cystathionase (Cystathionine gamma-lyase) | LOC103691744 | Q9EQS4 | 4.9 | 0.00000 | |
| Stabilin 2/HARE | Stab2 | E0X583 | 8.9 | 0.00017 | Brefeldin A inhibited guanine nucleotide-exchange protein 2 | Arfgef2 | Q7TSU1 | 4.6 | 0.00000 | |
| Microtubule-actin crosslinking factor 1 | Macf1 | A0A0G2K9T4 | 8.8 | 0.00017 | Leucyl-tRNA synthetase | Lars | Q5PPJ6 | 4.3 | 0.00000 | |
| Insulin-like growth factor 2 receptor | Igf2r | G3V824 | 8.4 | 0.00017 | Peroxiredoxin 1 | Prdx1 | Q63716 | 4.3 | 0.00001 | |
| Profilin-1 | Pfn1 | P62963 | 8.2 | 0.00017 | Aldehyde oxidase 1 | Aox1 | F1LRQ1 | 4.1 | 0.00001 | |
| Serine/threonine/tyrosine kinase 1 | Styk1 | D3ZHY0 | 8.1 | 0.00018 | S-adenosylmethionine synthase | Mat1a | F1LZ34 | 4.1 | 0.00001 | |
| Fatty acid synthase | Fasn | P12785 | 8.1 | 0.00018 | AHNAK nucleoprotein | Ahnak | A0A0G2JU96 | 4.0 | 0.00001 | |
| Telomerase protein component 1 | Tep1 | O08653 | 7.7 | 0.00019 | Microtubule-associated protein | Map4 | A0A0G2JW88 | 3.9 | 0.00001 | |
| Filamin A | Flna | C0JPT7 | 7.5 | 0.00019 | Sperm-associated antigen 9 | Spag9 | E9PSJ4 | 3.9 | 0.00001 | |
| von Willebrand factor | Vwf | F1M957 | 7.3 | 0.00019 | RAN-binding protein 2 | Ranbp2 | M0R3M4 | 3.7 | 0.00002 | |
| Plectin | Plec | Q6S399 | 6.9 | 0.00019 | Spectrin, alpha, erythrocytic 1 | Spta1 | D4A678 | 3.6 | 0.00002 | |
| Nuclear pore membrane glycoprotein 210 | Nup210 | P11654 | 6.6 | 0.00020 | Glutathione S-transferase alpha 3 | Gsta3 | P04904 | 3.6 | 0.00003 | |
| Filamin B | Flnb | A0A0G2JXT8 | 6.4 | 0.00020 | Isoform 2 of E3 ubiquitin-protein ligase TRIP 12 | Trip12 | F1LP64-2 | 3.5 | 0.00003 | |
| Isoform 3 of electrogenic sodium bicarbonate cotransporter 1 | Slc4a4 | Q9JI66-3 | 6.4 | 0.00020 | Tyrosine-protein phosphatase non-receptor type 23 | Ptpn23 | F1M951 | 3.5 | 0.00003 | |
| Vacuolar protein sorting 13 homolog C | Vps13c | D4A4K4 | 6.2 | 0.00021 | Ubiquitin-specific peptidase 24 | Usp24 | F1LSM0 | 3.4 | 0.00004 | |
| ATP-binding cassette subfamily A member 1 | Abca1 | F1LNL3 | 5.8 | 0.00025 | Alpha-1-inhibitor 3 | A1i3 | P14046 | 3.4 | 0.00004 | |
| MHC class I alpha chain (Fragment) | O02953 | 5.7 | 0.00025 | Phosphoserine aminotransferase | Psat1 | Q68FU2 | 3.4 | 0.00004 | ||
| Hemoglobin subunit alpha 1/2 | Hba1 | P01946 | 5.5 | 0.00029 | Activating signal cointegrator 1 complex subunit 3 | Ascc3 | A0A0A0MY43 | 3.4 | 0.00004 | |
| Alpha-2-macroglobulin | A2m | P06238 | 5.2 | 0.00030 | Myosin 11 | Myh11 | E9PTU4 | 3.4 | 0.00004 | |
| Mx2 | J7JVB9 | 5.1 | 0.00030 | Similar to KIAA0368 | Ecpas | F1M446 | 3.3 | 0.00004 | ||
| 3-ketoacyl-CoA thiolase, mitochondrial | Acaa2 | A0A0G2K642 | 4.7 | 0.00037 | Glutamyl-prolyl-tRNA synthetase | Eprs | A0A0G2JZI2 | 3.3 | 0.00004 | |
| Structural maintenance of chromosomes protein | Smc4 | F1MAD9 | 4.7 | 0.00037 | Eukaryotic translation initiation factor 4 gamma, 1 | Eif4g1 | D3ZU13 | 3.3 | 0.00004 | |
| Downregulated Protein | Fibrillin 1 | Fbn1 | G3V9M6 | −24.1 | 0.00005 | Plectin | Plec | Q6S395 | −10.2 | 0.00000 |
| Collagen type IV alpha 1 chain | Col4a1 | F1MA59 | −18.8 | 0.00005 | Carbamoyl-phosphate synthase [ammonia], mitochondrial | Cps1 | P07756 | −10.2 | 0.00000 | |
| Collagen type IV alpha 2 chain | Col4a2 | F1M6Q3 | −18.8 | 0.00005 | Fatty acid synthase | Fasn | P12785 | −8.6 | 0.00000 | |
| Laminin subunit alpha 5 | Lama5 | F1MAN8 | −13.3 | 0.00016 | Desmoplakin | Dsp | F1LMV6 | −6.4 | 0.00000 | |
| Laminin subunit gamma 1 | Lamc1 | F1MAA7 | −13.3 | 0.00016 | RCG34348, isoform CRAa | Krt33a | Q6IFW1 | −6.2 | 0.00000 | |
| Uncharacterized protein | F1LTJ5 | −13.2 | 0.00016 | Spectrin alpha chain, non-erythrocytic 1 | Sptan1 | A0A0G2JZ69 | −5.9 | 0.00000 | ||
| Collagen type VII alpha 1 chain | Col7a1 | D3ZE04 | −13.1 | 0.00016 | Amylo-1, 6-glucosidase, 4-alpha-glucanotransferase (glycogen debranching enzyme, glycogen storage disease type III) (Predicted), isoform CRAa | Agl | D4AEH9 | −5.7 | 0.00000 | |
| Fibronectin | Fn1 | A0A096P6L8 | −12.7 | 0.00016 | Filamin B | Flnb | A0A0G2JXT8 | −5.2 | 0.00000 | |
| Laminin subunit beta 2 | Lamb2 | M0R6K0 | -12.0 | 0.00016 | Lysophospholipase-like 1 | Lyplal1 | D3ZFS7 | -4.9 | 0.00000 | |
| RCG34610, isoform CRAc | Srsf1 | D4A9L2 | −10.8 | 0.00016 | Peroxisomal bifunctional enzyme | Ehhadh | P07896 | −4.3 | 0.00000 | |
| Collagen type VI alpha 2 chain | Col6a2 | F1LNH3 | −10.8 | 0.00016 | Glycogen phosphorylase, liver form | Pygl | P09811 | −4.2 | 0.00000 | |
| Collagen alpha-1(I) chain | Col1a1 | P02454 | −8.8 | 0.00017 | Ornithine carbamoyltransferase, mitochondrial | Otc | P00481 | −4.2 | 0.00000 | |
| Ferritin light chain 1 | Ftl1 | P02793 | −8.6 | 0.00017 | Endoplasmin | Hsp90b1 | A0A0A0MY09 | −4.2 | 0.00000 | |
| Transglutaminase 2, C polypeptide | Tgm2 | Q6P6R6 | −7.8 | 0.00019 | Mitochondrial pyruvate carrier 1 | Mpc1 | P63031 | −4.1 | 0.00000 | |
| Junction plakoglobin | Jup | Q6P0K8 | −7.5 | 0.00019 | Aldehyde dehydrogenase, mitochondrial | Aldh2 | F1LN88 | −4.1 | 0.00001 | |
| Collagen, type I, alpha 2 | NEWGENE_621351 | A0A0G2K5E8 | −7.3 | 0.00019 | Spectrin beta chain | Sptbn2 | F1MA36 | −4.0 | 0.00001 | |
| Nephronectin | Npnt | A0A0G2JW46 | −7.2 | 0.00019 | D-beta-hydroxybutyrate dehydrogenase, mitochondrial | Bdh1 | P29147 | −3.9 | 0.00001 | |
| Transformer-2 protein homolog beta | Tra2b | P62997 | −7.1 | 0.00019 | Syntaxin 3 | Stx3 | Q08849 | −3.7 | 0.00002 | |
| Collagen type VI alpha 1 chain | Col6a1 | D3ZUL3 | −7.0 | 0.00019 | Maleylacetoacetate isomerase | Gstz1 | P57113 | −3.7 | 0.00003 | |
| LDL receptor-related protein 1 | Lrp1 | G3V928 | −6.5 | 0.00020 | Dimethylaniline monooxygenase [N-oxide-forming] | Fmo5 | A0A0G2JSQ2 | −3.6 | 0.00003 | |
| Latent-transforming growth factor beta-binding protein 1 | Ltbp1 | D3ZAA3 | −6.4 | 0.00020 | Membrane-associated progesterone receptor component 1 | Pgrmc1 | P70580 | −3.6 | 0.00003 | |
| Ferritin | M0R5T8 | −6.4 | 0.00020 | Inositol 1,4,5-trisphosphate receptor type 2 | Itpr2 | P29995 | −3.6 | 0.00003 | ||
| Serine/arginine-rich splicing factor 2 | Srsf2 | Q6PDU1 | −6.2 | 0.00021 | Cytochrome P450, family 2, subfamily c, polypeptide 7 | Cyp2c7 | Q4QQW7 | −3.4 | 0.00004 | |
| RCG61762, isoform CRA_d | Srsf7 | D4A720 | −5.7 | 0.00025 | Paternally-expressed 3 | Peg3 | D4AB33 | −3.4 | 0.00004 | |
| Desmoplakin | Dsp | F1LMV6 | −5.7 | 0.00025 | Elongation factor 2 | Eef2 | P05197 | −3.3 | 0.00005 | |
| Nidogen 1 | Nid1 | F1LM84 | −5.6 | 0.00026 | 3-Ketoacyl-CoA thiolase, peroxisomal | Acaa1a | P21775 | −3.3 | 0.00005 | |
| Eosinophilroxidase | Epx | D3ZSY4 | −5.2 | 0.00030 | Vacuolar protein sorting 13 homolog A | Vps13a | D4A899 | −3.2 | 0.00006 | |
| Histone H2A type 2A | Hist2h2aa3 | P0CC09 | −5.2 | 0.00030 | Pyruvate carboxylase, mitochondrial | Pc | P52873 | −3.2 | 0.00007 | |
| Histone H4 | Hist1h4b | P62804 | −5.1 | 0.00031 | Spectrin beta chain | Sptbn1 | G3V6S0 | −3.1 | 0.00007 | |
| Pre-mRNA processing factor 40 homolog A (Yeast) (Predicted) | Prpf40a | D3ZJ92 | −4.9 | 0.00037 | ATP-binding cassette, subfamily A (ABC1), member 8a | Abca8a | D3ZCF8 | −3.1 | 0.00007 |
| A. Spleen | ||
| Selected DAVID Analysis for Functional Annotation | p-Value | Proteins |
| Innate immune response | 3.00E-01 | C4bpa, Fga, Mx1, Styk1 |
| Biosynthesis of antibiotics | 4.00E-02 | Acaa2, Adsl, Aldoc, Eno1, Hadhb, Pgd, Prps2 |
| ATP-binding | 7.20E-02 | Abca1, Ddx5, Rock2, Ilk, Mthfd1, Myh9, Myh9l1, Prps2, Prkacb, Smc1a, Tep1, Vcp |
| Amoebiasis | 4.80E-06 | Col1a1, Col4a1, Col4a2, Col4a5, NEWGENE_621351, Fn1, Lama5, Lamb2, Lamc1, Prkacb |
| Main Disease and Biofunction | Activation z-Score | Related Proteins |
| Cell movement of macrophages | 1.951 | Calr, Srsf1, Srsf3, Tf, Srsf2, Vcp |
| Cell movement of phagocytes | 1.488 | Plec, Col4a1, Fn1, Pfn1, Flna, Abca1, Lrp1, Stab1, Vwf, Col1a1, Ptprj, Alb |
| Cell proliferation of lymphoma cell lines | −2.4 | Plec, Fn1, Pfn1, Flna, Stab1, Lrp1, Ptprj |
| Inflammation of body cavity | −1.455 | Tf, Srsf2, Abca1, Fasn, Fga, Stab1, Col1a1, Ptprj, Myh9, Calr, Fn1, Epx, Alb |
| B. Liver | ||
| Selected DAVID Analysis for Functional Annotation | p-Value | Genes |
| Mitochondrion | 3.10E-08 | Decr1, Bdh1, Hibadh, Atp5a1, Atp5b, Cox2, Acsf2, Acsl1, Agxt2, Aldh2, Cps1, Dmgdh, Gstp1, Hspe1, Hadh, Mtor, Mpc1, Otc, Phb, Pc, Rmdn3, Sardh, Slc25a20 |
| Glutathione metabolic process | 1.20E-04 | Gsta1, Gstm2, Gstp1, Gstz1, Gpx1, Hbb |
| Wound healing | 6.30E-03 | Aqp1, Dsp, Fn1, Gsn, Mtor, Tnc |
| Main Disease and Bio Function | Activation z-Score | Related Proteins |
| Liver lesion | −2.205 | Itpr2, Gsta5, Atp1a1, Ass1, Cyp2e1, Tln2, Eef2, Aldob, Actb, Aox1, Lrp1, Eef1a1, Ugt2b7, Spag9, Cltc, Bdh1, Fabp7, Sptbn2, Fabp1, Pdia4, Apob, Gsn, Birc6, Lars, Decr1, Mat1a, Usp47, Flnb, Cps1, Comt, Hectd1, Fasn, Pc, Aqp1, Polr2b, Fah, Sptbn1, Eprs, Acsl1, Fn1, Aldh2, Arfgef2, Usp24, Gstp1, Trip11, Pzp, Cobll1, Arfgef1, Mtor, Pygl, Pklr, Ppia, Acaa1, Bhmt, Plec, Gstz1, Parp1, Copa, Cyp2c8, Cast, Araf, Mttp |
| Cell death of hepatocytes | −1.954 | Sptbn1, Fah, Mtor, Gsn, Aldh2, Lrp1, Cyp2e1 |
| Necrosis of liver | 1.584 | Sptbn1, Fah, Gstz1, Mtor, Gsn, Aldh2, Lrp1, Cyp2e1, Pzp |
| Inflammation of liver | −1.432 | Fah, GSstz1, Apob, Ppia, Mat1a, Cyp2e1, Pzp, Mttp |
| Production of reactive oxygen species | −1.114 | Mtor, Cyp2c8, Lrp1, Cyp2e1 |
© 2020 by the authors. Licensee MDPI, Basel, Switzerland. This article is an open access article distributed under the terms and conditions of the Creative Commons Attribution (CC BY) license (http://creativecommons.org/licenses/by/4.0/).
Share and Cite
Lee, Y.Y.; Kim, S.-W.; Youn, S.-H.; Hyun, S.H.; Kyung, J.-S.; In, G.; Park, C.-K.; Jung, H.R.; Moon, S.J.; Kang, M.J.; et al. Biological Effects of Korean Red Ginseng Polysaccharides in Aged Rat Using Global Proteomic Approach. Molecules 2020, 25, 3019. https://doi.org/10.3390/molecules25133019
Lee YY, Kim S-W, Youn S-H, Hyun SH, Kyung J-S, In G, Park C-K, Jung HR, Moon SJ, Kang MJ, et al. Biological Effects of Korean Red Ginseng Polysaccharides in Aged Rat Using Global Proteomic Approach. Molecules. 2020; 25(13):3019. https://doi.org/10.3390/molecules25133019
Chicago/Turabian StyleLee, Yong Yook, Sung-Won Kim, Soo-Hyun Youn, Sun Hee Hyun, Jong-Su Kyung, Gyo In, Chae-Kyu Park, Hye Ryeon Jung, Seung Ju Moon, Min Jeung Kang, and et al. 2020. "Biological Effects of Korean Red Ginseng Polysaccharides in Aged Rat Using Global Proteomic Approach" Molecules 25, no. 13: 3019. https://doi.org/10.3390/molecules25133019