

Abstract
Beavers are starting to colonize low arctic tundra regions in Alaska and Canada, which has implications for surface water changes and ice-rich permafrost degradation. In this study, we assessed the spatial and temporal dynamics of beaver dam building in relation to surface water dynamics and thermokarst landforms using sub-meter resolution satellite imagery acquired between 2002 and 2019 for two tundra areas in northwestern Alaska. In a 100 km2 study area near Kotzebue, the number of dams increased markedly from 2 to 98 between 2002 and 2019. In a 430 km2 study area encompassing the entire northern Baldwin Peninsula, the number of dams increased from 94 to 409 between 2010 and 2019, indicating a regional trend. Correlating data on beaver dam numbers with surface water area mapped for 12 individual years between 2002 and 2019 for the Kotzebue study area showed a significant positive correlation (R2 = 0.61; p < .003). Beaver-influenced waterbodies accounted for two-thirds of the 8.3% increase in total surface water area in the Kotzebue study area during the 17 year period. Beavers specifically targeted thermokarst landforms in their dam building activities. Flooding of drained thermokarst lake basins accounted for 68% of beaver-influenced surface water increases, damming of lake outlets accounted for 26%, and damming of beaded streams accounted for 6%. Surface water increases resulting from beaver dam building likely exacerbated permafrost degradation in the region, but dam failure also factored into the drainage of several thermokarst lakes in the northern Baldwin Peninsula study region, which could promote local permafrost aggradation in freshly exposed lake sediments. Our findings highlight that beaver-driven ecosystem engineering must be carefully considered when accounting for changes occurring in some permafrost regions, and in particular, regional surface water dynamics in low Arctic and Boreal landscapes.
Export citation and abstract BibTeX RIS
1. Introduction
Arctic landscapes are in a state of transition due to changes in climate (Hinzman et al 2005, Rowland et al 2010, Vincent et al 2017). In the summer, increased warmth and longer growing seasons have been linked to increases in tundra productivity and shrub-dominated vegetation over the last three decades (Tape et al 2006, Myers-Smith et al 2011, Berner et al 2018, Bonney et al 2018). Summertime arctic lake area dynamics have been linked to long-term climate driven changes and permafrost degradation (Yoshikawa and Hinzman 2003, Smith et al 2005, Jones et al 2011, Nitze et al 2018), as well as to short-term weather events and annual patterns of precipitation and evaporation (Riordan et al 2006, Cooley et al 2019, Swanson 2019). Near-surface permafrost degradation in the form of melting ice wedges (Jorgenson et al 2006, Liljedahl et al 2016), formation of retrogressive thaw slumps (Ward Jones et al 2019), and degradation of palsas (Borge et al 2017) have all been attributed to warmer summer conditions. In the winter, landscape-scale impacts include shorter snow-cover duration periods (Niittynen et al 2018), earlier river ice break up (Brubaker et al 2011b, Brown et al 2018), increasing river discharge (Rawlins et al 2019), and thinner seasonal ice growth on lakes (Arp et al 2012, Surdu et al 2014).
Scattered observations indicate that beavers (Castor canadensis) have moved from the forest into tundra areas during the last 20 years (Brubaker et al 2011a, Jung et al 2017, Tape et al 2018). Jung et al (2017) noted the presence of a new beaver dam in 2015 near the Babbage River, located within 25 km of the Beaufort Sea coast on the Yukon Coastal Plain in northwestern Arctic Canada. Tape et al (2018) found an increase in the number and spatial distribution of beavers in two predominantly tundra watersheds in northwestern Alaska between 1999 and 2014. Tape et al (2018) postulated that ongoing landscape-scale changes in the Arctic, combined with population rebound from over-trapping (Bockstoce 2009), are responsible for beavers recent colonization of Alaska tundra regions. The implications of beaver inhabitation in the Arctic and Boreal are unique relative to other ecosystems due to the presence of permafrost and its vulnerability associated with beaver dams and inundation.
Few studies have directly addressed beaver-permafrost interactions in Arctic and Boreal regions. Lewkowicz and Coultish (2004) documented the likely effects of beaver damming on the formation and degradation of palsa mounds in the southern Yukon Territory in Canada. Analysis of high resolution satellite imagery in the Noatak and Wulik River watersheds in northwestern Alaska showed that extensive inundation and other hydrologic changes associated with pond construction can initiate thermokarst in and around beaver dam complexes (Tape et al 2018). Beavers in this study area were observed to cause lake expansion and drainage, thaw slump initiation, thermoerosional gully formation, ice wedge degradation, thermokarst shore fen development, and possibly development of taliks associated with water impoundment (Jones et al 2018). In general, however, beaver dam building and surface water impoundment in ice-rich permafrost terrain has not been examined as a potential driver of thermokarst dynamics in Arctic and Boreal regions.
In this study, we use very high resolution remote sensing imagery to explore changes in beaver activity and the impact of their colonization on an arctic tundra area in northwestern Alaska. Our study specifically examines the role of beavers in controlling surface water dynamics and related thermokarst development in low Arctic tundra regions. We mapped the number of beaver dams visible in sub-meter resolution satellite images acquired between 2002 and 2019 for a 100 km2 study area (12 individual years of imagery) near Kotzebue, Alaska and a 430 km2 study area (3 individual years of imagery) encompassing the entire northern Baldwin Peninsula, Alaska (figure 1). We show that during the last two decades beaver-driven ecosystem engineering is responsible for the majority of surface water area changes and inferred thermokarst development in the study area. This has implications for interpreting surface water area changes and thermokarst dynamics in other Arctic and Boreal regions that may also result from beaver dam building activities.

Figure 1. Location of the beaver dam mapping study area in northwestern Alaska. (a) Overview map showing location of the study area in Alaska. (b) NLCD landcover map showing the study area and surrounding region consisting of predominantly tundra and wetland vegetation (light brown and light blue) with forested areas indicated in green (Jin et al 2017). (c) IfSAR digital terrain model for the Kotzebue (100 km2) and northern Baldwin Peninsula (430 km2) study areas.
Download figure:
Standard image High-resolution image2. Study area
The Baldwin Peninsula, located in northwestern Alaska, is a middle Pleistocene-aged push-moraine complex composed of marine, fluvial, and glaciogenic sediments (Huston et al 1990) capped with late Pleistocene-aged syngenetic ice-rich permafrost (yedoma). The landscape has been extensively reworked by thermokarst lake processes during the Holocene (McCulloch and Hopkins 1966, Jongejans et al 2018). The peninsula lies at the boundary between continuous and discontinuous permafrost zones (Jorgenson et al 2008), and consists of tundra vegetation (figure 2). Vegetation is characterized by moist tundra, dominated by tussock-forming sedges and dwarf shrubs <40 cm tall, as well as wetland complexes, dominated by sedges and low shrubs >40 cm tall (Walker et al 2005). Paleoecological studies have shown that the treeline extended to the Baldwin Peninsula during past warm intervals (Hamilton and Brigham-Grette 1991). Coastal exposures dating to the holocene thermal maximum (HTM), roughly 10 kya, include beaver-gnawed wood, dam complexes, and show that beavers had a widespread role in thermokarst lake dynamics (McCulloch and Hopkins 1966). While we currently lack detailed historical records on the presence of beavers in the study region (McCulloch and Hopkins 1966), local observations from the Kotzebue area indicate that there has been an increase of beavers since 2000 (Kantner S personal communication).
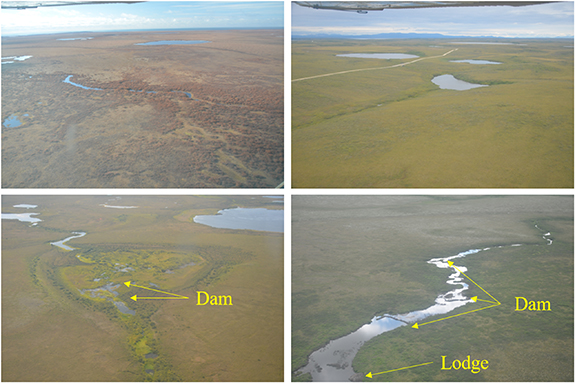
Figure 2. Oblique field photos from northwestern Alaska. The upper two images are photos taken within the study area in 2016 showing the tundra region setting. The bottom two images are taken from similar tundra across Hotham Inlet in 2015 (lower left) and 2011 (lower right) showing beaver dams in a drained lake basin outlet and along a beaded stream course, respectively.
Download figure:
Standard image High-resolution image2.1. Remote sensing analysis
The Baldwin Peninsula was selected as the study area due to the optimum availability of sufficiently high spatial and temporal resolution satellite imagery and the presence of tundra vegetation and permafrost (figure 2). Beaver dams were mapped using high-resolution satellite imagery available from the DigitalGlobe Inc. imagery archive in two areas to account for spatial and temporal differences in cloud-free image availability between 2002 and 2019. The spatial resolution of the panchromatic imagery ranged from 40 cm to 70 cm and the frequent image acquisition dates provided an opportunity for cloud-free observations suitable for identifying beaver dams across the study period (figure 3). The imagery was orthorectified using the 2 arc-second resolution U.S. Geologic Survey National Elevation Dataset for Alaska and corrected to top-of-atmosphere reflectance to facilitate time series analysis. Beaver dam mapping positions were based on the orthorectification results from the 2019 images to account for subtle differences in image geolocation in prior years.
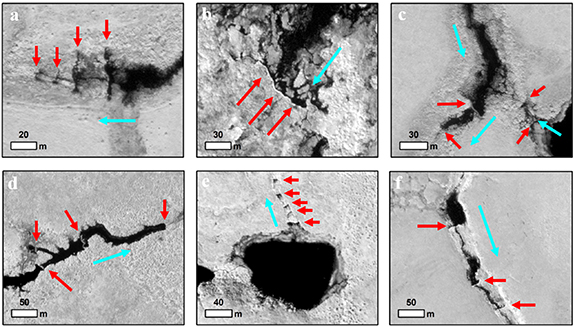
Figure 3. Mapping beaver dams in high-resolution satellite imagery available for the northern Baldwin Peninsula, Alaska. The location of individual dams indicated with red arrow and the flow direction with a light blue arrow. (a) A series of four dams at the outlet of a lake, (b) a ∼60 m long dam built in a drained lake basin, (c) a series of dams at the outlet of a lake near a confluence with a beaded stream, (d) a series of dams in a channel running through the middle of a drained lake basin, (e) five dams progressing down the outlet channel of a thermokarst lake, and (f) a series of dams in a beaded stream gulch. Examples shown here taken from 2019 images; note differences in scale across image frames. All dams were constructed after 2002. Imagery (104001004E669400—©2019 DigitalGlobe) copyright DigitalGlobe, Inc.
Download figure:
Standard image High-resolution imageBased on suitable and available imagery, the Kotzebue study area (100 km2) was mapped each year in 2002, 2007–14, and 2017–2019 (in total 12 individual years) and the entire northern Baldwin Peninsula (430 km2) was mapped in 2010, 2013, and 2019 (3 individual years). This hybrid approach was designed to optimize our spatial and temporal perspective and to assess whether the changes being observed near Kotzebue were reflective of changes occurring in the surrounding region. Beaver dams were manually mapped in each image in both study areas at a scale of 1:1000. All individual, apparently active dams were designated as a point feature in a GIS database in each image. If a dam failed or was abandoned in a subsequent year it was not counted in the latter time series unless it was re-established. Dams were also grouped as complexes to track the inhabitation of new dam building sites over time in the study region. The location of dams relative to permafrost-region landforms (thermokarst lakes, drained thermokarst lake basins, and tundra/beaded streams) was also determined manually. Surface water area change between 2002 and 2019 was then compared at beaver-influenced versus non-beaver-influenced waterbodies that were classified as either thermokarst lake, drained thermokarst lake basin, or tundra/beaded stream to assess whether there was a preference for dam building relative to thermokarst landforms and their potential connection to surface water changes.
We analyzed changes in surface water extent in the Kotzebue study area using the best available high-resolution panchromatic images available for a particular year. Image selection focused on cloud-free, ice-free, and calm surface water conditions with images being acquired between late-June and mid-August in a given year. All images were resampled to a spatial resolution of 70 cm to match the lowest resolution image in the time series prior to analysis. Within year image dates range from 25 June to 22 August with the average date of image acquisition being 17 July (table 1). Object-based image analysis was conducted in eCognition Essentials 1.3. Image pixels were grouped into objects using the multiresolution segmentation algorithm with a scale of 20, a color to shape parameter of 0.1, and a smoothness to compactness factor of 0.4. A supervised classification scheme was developed for each image by selecting water and non-water object samples. At least 500 samples were manually selected for each class in each image. Objects were classified using the object-based k-Nearest Neighbor (KNN) classifier with a k value of 1. The KNN is a simple machine learning algorithm where an object is classified by a majority vote of its neighbors, with the object being assigned to the class most common amongst its k nearest neighbors. Using a k value of 1 emphasizes stark contrasts between disparate object class types. An accuracy assessment was conducted using the eCognition workflow for each image object classification using the input training samples. The user and producer accuracy of surface water classification was >96% in each case. Classified objects were then merged and only those objects classified as water were extracted for further analysis in a GIS database. All objects smaller than 250 m2 were removed from the surface water inventory, objects that fell outside of the overlapping extent of all images were removed from further analysis, and stable water feature centroids were used to reposition lake polygon files from prior years to match the orthorectification positioning of the 2019 images. Surface water area was summed in each time step and its changes were compared against the number of beaver dams mapped in the Kotzebue study area and their relation to thermokarst landforms between 2002 and 2019.
Table 1. High resolution remote sensing time series imagery used for mapping beaver dams and surface water area in the 100 km2 Kotzebue study area from 2002 to 2019.
| Year | Image date | Image source | Spatial resolution (m) | Beaver dams (n) | New dams (n/yr) | New dam complexes (n/yr) | Surface water area (ha) |
|---|---|---|---|---|---|---|---|
| 2002 | 22 August | QB2 | 0.7 | 2 | — | — | 594 |
| 2007 | 4 July | QB2 | 0.7 | 6 | 0.8 | 0.6 | 610 |
| 2008 | 3 July | WV1 | 0.6 | 7 | 1.0 | 4.0 | 623 |
| 2009 | 16 August | WV1 | 0.6 | 10 | 2.7 | 1.8 | 600 |
| 2010 | 4 August | WV2 | 0.5 | 15 | 5.2 | 4.1 | 618 |
| 2011 | 9 July | WV2 | 0.6 | 31 | 17.2 | 6.5 | 625 |
| 2012 | 22 July | WV2 | 0.5 | 34 | 2.9 | 3.9 | 610 |
| 2013 | 11 July | WV1 | 0.5 | 42 | 8.2 | 10.3 | 611 |
| 2014 | 25 June | WV2 | 0.5 | 55 | 13.6 | 13.6 | 630 |
| 2017 | 26 July | WV3 | 0.4 | 79 | 7.8 | 3.6 | 627 |
| 2018 | 1 July | WV3 | 0.5 | 93 | 15.0 | 4.3 | 630 |
| 2019 | 8 July | WV3 | 0.4 | 98 | 4.9 | 3.9 | 644 |
3. Results
3.1. Beaver dam increases—2002 to 2019
The number of beaver dams in the Kotzebue study area increased from 2 in 2002 to 98 in 2019, or ∼5000% (figure 4 and table 1). The rate of increase followed that of a 2nd order polynomial regression (R2 = 0.99), with the years 2011 (+17.2), 2014 (+13.6), and 2018 (+15) exhibiting the largest annualized increase in dam numbers (figure 5). The area-weighted rate of dam increases for the Kotzebue study area based on the 17 year period was 5.6 dams per year per 100 km2. The number of dams in the larger northern Baldwin Peninsula study area followed a similar trajectory between 2010 and 2019, increasing from 94 (2010), to 174 (2013), to 409 (2019) in the 430 km2 study area (figures 4 and 5). The rate of increase also followed that of a 2nd order polynomial regression, and the area-weighted rate of dam increases was 8.1 dams per year per 100 km2 over the shorter and more recent time interval. Over this same period, the area-weighted rate of dam increases was 9.2 dams per year per 100 km2 for the Kotzebue study area.
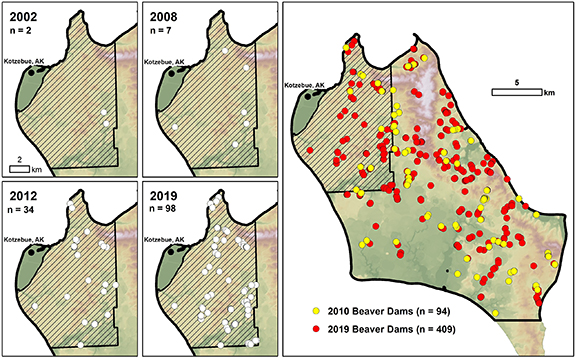
Figure 4. Increase in beaver dams on the northern Baldwin Peninsula in northwestern Alaska between 2002 and 2019. The detailed temporal analysis study area located near Kotzebue is shown in the four frames on the left representing a subset of the time series of beaver dams from 2002 (n = 2), 2008 (n = 7), 2012 (n = 34), and 2019 (n = 98). The northern Baldwin Peninsula study region is shown on the right with two of the three time stamps plotted (2010 and 2019) representing an increase from 94 to 409 beaver dams.
Download figure:
Standard image High-resolution image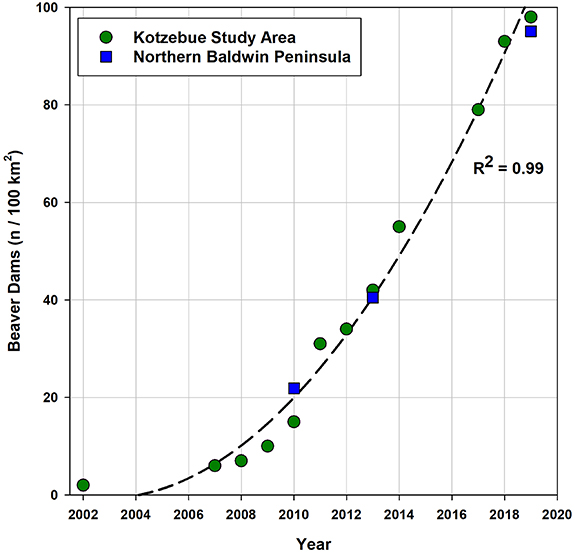
Figure 5. Increase in beaver dams on the northern Baldwin Peninsula since 2002. Twelve images were available for the 100 km2 Kotzebue study area and three mosaics were possible with available and suitable imagery for the 430 km2 northern Baldwin Peninsula study region. The increasing pattern in the number of dams overtime in the study area around Kotzebue (green circles) is mirrored across the entire northern Baldwin Peninsula (blue squares). Data plotted as the number of beaver dams per 100 km2.
Download figure:
Standard image High-resolution imageAs of 2019, there are now 42 distinct beaver dam/pond complexes in the Kotzebue study area. On average, 2.5 new beaver dam sites, or the initiation of new beaver dam complexes, were established per year over the 17 year period; however, there was substantial interannual variation (range of 13.0). In particular, 10.3 new sites were established between 2012 and 2013, and 13.6 new sites were established between 2013 and 2014, and less than one new site per year was established between 2002 and 2007. Analyzing the increase in the number of new dams relative to the number of new dam complexes shows periods of localized building versus expansion into new sites. The year 2011 and period 2014–2018 experienced a ratio of more than 2:1 new dams relative to new complexes in the study area, indicating development of existing dam complexes. In contrast, the years 2008 and 2013 experienced the opposite pattern, with more new sites being established relative to dam building at pre-existing complex sites. Between 2012 and 2013, the number of dams at existing sites and the establishment of new complexes were equally high at 13.6.
3.2. Beaver dam impacts on surface water dynamics
Total surface water area mapped in the Kotzebue study area showed a variable but increasing trend between 2002 and 2019 (figure 6 and table 1). Total surface water area increased from 594 ha in 2002 to 643 ha in 2019, or 8.3%. The mapped surface water area increase was significantly correlated with the increase in beaver dams over the 17 year period (R2 = 0.61; p < .003). We further investigated the 8.3% increase in surface water area between 2002 and 2019 at beaver-influenced versus non-beaver-influenced waterbodies. Partitioning the 49 ha increase in surface water area between 2002 and 2019 into beaver influenced (+33 ha) versus non-beaver influenced (+16 ha) waterbodies establishes the role of beavers on controlling surface water area increases. Beaver-influenced waterbody areas increased by 14.3% over this period, whereas non-beaver influenced waterbody areas increased 4.6% (figure 7(a)). Thus, beaver-influenced waterbodies accounted for the majority (66%) of the increase in surface water area in the Kotzebue study area between 2002 and 2019.

Figure 6. The role of beavers in affecting surface water variability near Kotzebue. (a) The number of beaver dams mapped in high resolution satellite imagery in the Kotzebue study area increased from 2 in 2002 to 98 in 2019. (b) Surface water area mapped in 70 cm resolution satellite imagery fluctuated but in general increased in the Kotzebue study area between 2002 and 2019. (c) Correlating surface water extent with the increase in the number of beaver dams for the Kotzebue study area shows a positive and statistically significant relationship (R2 = 0.61; p < .003).
Download figure:
Standard image High-resolution image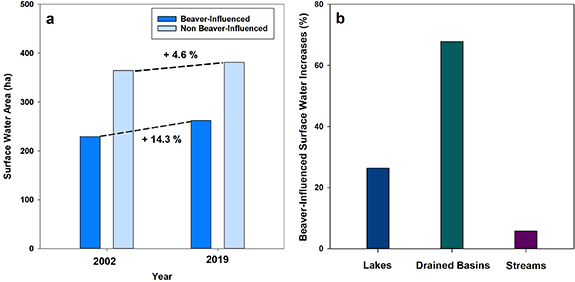
Figure 7. The impacts of beaver dams on changes in surface water extent in the Kotzebue study area. (a) Comparing surface water area mapped in high resolution satellite imagery from 2002 and 2019 relative to the presence of beaver dams in 2019 shows that beavers likely accounted for 66% of the increase in surface water area over this time period. (b) Beaver-influenced surface water area increases were dominated by damming of drained thermokarst lake basins (68%) relative to thermokarst lakes (26%) and beaded streams (6%).
Download figure:
Standard image High-resolution image3.3. Beaver damming of thermokarst landforms
All but one beaver dam was associated with at least one of three thermokarst landforms in the study region: thermokarst lakes, drained thermokarst lake basins, or tundra/beaded streams (figure 7(b)). Beaver damming of drained lake basin outlets accounted for 68% of the increase in beaver-influenced waterbody area increases since 2002. In some cases, beaver dams led to more than a doubling in surface water area in specific drained lake basins over the study period. Damming of lake outlets accounted for 26% of the increase in surface water area. Damming at lake outlets tended to amplify natural expansion occurring along thermokarst lake margins due to permafrost degradation. Damming of beaded stream courses, though representing only a small fraction of total beaver influenced surface water area, increased in area by more than 150% (1.1–2.7 ha) between 2002 and 2019.
4. Discussion
4.1. Beaver dams—surface water—permafrost interactions
Our analysis adds the Baldwin Peninsula in northwestern Alaska to the scattered recent evidence that beavers are establishing themselves as a key disturbance agent in low arctic tundra regions (Jung et al 2017, Tape et al 2018). In the Kotzebue study area, we found an 8.3% increase in surface water extent between 2002 and 2019, with short term annual variation on the order of −0.2 to +3.7%. Over the twelve years of images analyzed, only three (2009, 2012, and 2017) experienced a reduction in total surface water based on the previous year, with one of the years being influenced by a partial lake drainage event. The 4.6% increase in non-beaver-influenced waterbodies likely results from natural thermokarst processes associated with expanding lakes in ice-rich permafrost terrain as well as annual variability in surface water area to some degree. The 14.3% increase in surface water area in beaver-influenced waterbodies likely results from the cumulative effects of beaver damming and inundation of low-lying areas, as well as the degradation of permafrost and expansion of waterbodies through thermokarst processes. Surface waterbodies in the Arctic are known to fluctuate seasonally and annually, but also to interact with permafrost through thermokarst processes that may cause both increases and decreases in surface water area (Bowling et al 2003, Smith et al 2005, Jones et al 2011, Cooley et al 2019, Nitze et al 2018). While it is difficult to separate the combined effects of seasonal and annual variability and geomorphic factors when analyzing regional surface water dynamics using remote sensing snapshots in time, the general trend over the 17 year study period for the Kotzebue study area was increasing surface water area resulting primarily from an increase in beaver dams (R2 = 0.61, p < .003).
Few studies have directly addressed beaver-permafrost interactions (Lewkowicz and Coultish 2004, Jones et al 2018, Tape et al 2018). In this study, which represents a typical ice-rich permafrost landscape in the Arctic interspersed with thermokarst lakes, drained thermokarst lake basins, and beaded streams, we showed that beavers preferentially build dams and facilitate inundation of thermokarst landforms, which likely promotes permafrost degradation. Water impoundment on the landscape is known to drive permafrost degradation (Lachenbruch et al 1962, Jorgenson et al 2010, Arp et al 2016). Surface water inundation more readily conducts heat and therefore impacts the ground thermal regime almost instantaneously (Langer et al 2016). If the water depth is sufficient such that the mean annual water bottom temperature exceeds 0 °C (Burn 2002), permafrost thaw commences and in the case of ice-rich permafrost, thermokarst occurs (Grosse et al 2013). Several studies have highlighted the prominent role of permafrost degradation, and in particular abrupt permafrost thaw and thermokarst development on mobilizing carbon previously stored in permafrost (Schuur et al 2015, Walter Anthony et al 2018, Turetsky et al 2020). Future research should focus on the potential role of beavers on altering the carbon cycle in Arctic and Boreal regions (Gatti et al 2018, Nummi et al 2018).
Beaver colonization and dam building has substantial implications for the short-term dynamics and long-term evolution of permafrost lowlands (figure 8). On the Baldwin Peninsula, northwestern Alaska, fossil beaver dams and beaver-gnawed wood dating to the early Holocene (10 kya) have been found in association with pond sediments and in ice wedge casts below the pond sediments, which were inferred to represent ice wedge melting as a result of beaver dam building (McCulloch and Hopkins 1966). We likewise found that damming of drained thermokarst lake basin outlets accounted for the largest increase in surface water area. Presumably this extensive inundation due to beavers is accompanied by extensive permafrost degradation in the inundated basin floors and adjacent tundra slopes (figure 8(a)). Beaver damming of existing lake outlets was also observed to increase lake surface area, similarly promoting sub-aqueous and lateral degradation of permafrost (figure 8(b)). Lake drainage was also observed through dam failure, abandonment, or bank overtopping (figure 8(c)). While bank overtopping is a commonly attributed lake drainage mechanism (Hinkel et al 2007, Jones et al 2011, 2020), the ability of beavers to exacerbate this process has only been recognized once before (Lewkowicz and Coultish 2004) and at least for sites like the Baldwin Peninsula it could help explain some of the recent widespread lake drainage occurring in the region (Swanson 2019). Future work will need to take into account the potential role of beavers on driving these large regional differences in thermokarst lake dynamics and thus, permafrost landscape changes.
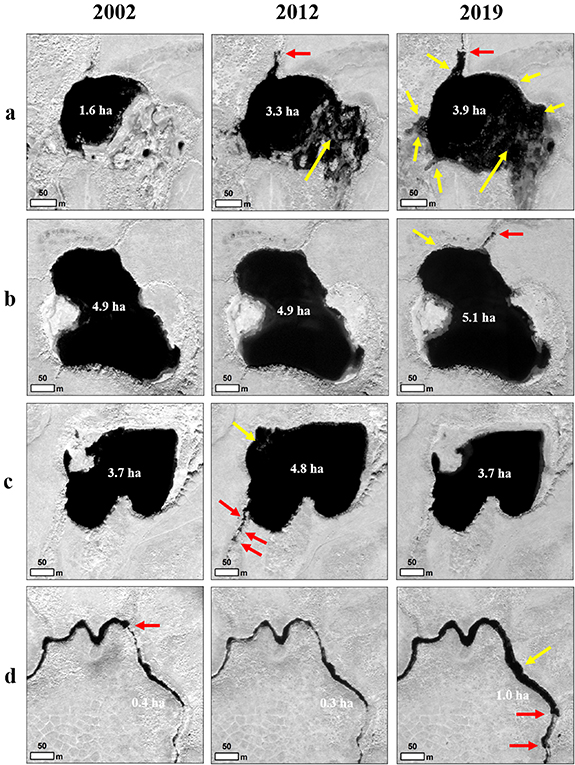
Figure 8. Examples showing beaver controls on surface water and permafrost degradation in the high resolution imagery time series for three time stamps—2002, 2012, and 2019 in the Kotzebue study area. Beaver dams are depicted with a red arrow, surface water area changes are indicated with white text, and locations of likely permafrost degradation with yellow arrows. (a) Dam building at a partially drained lake basin beginning in 2012 caused a doubling in surface water area that increased another 18% by 2019, causing extensive permafrost degradation. (b) Beaver damming of a lake outlet in 2017 led to a small increase in surface area and permafrost degradation in the northwest corner of a previously stable lake. (c) Dam building of a lake outlet in 2011 caused a temporary 30% increase in surface water area and permafrost degradation by 2012 which reverted back to 3.7 ha in area following dam failure or abandonment in 2017 that persisted to 2019. (d) A dam present along a beaded stream course failed or was abandoned between 2002 and 2009. The site remained largely inactive until 2017 when a series of dams were built further downstream that persisted to 2019, increasing surface water area by a factor of 3. Imagery (10100100010DFC00—©2002 DigitalGlobe, 103001001A61DB00—©2012 DigitalGlobe, 104001004E669400—©2019 DigitalGlobe) copyright DigitalGlobe, Inc.
Download figure:
Standard image High-resolution image
4.2. Reconsidering regional surface water dynamics in Arctic and Boreal regions
Numerous regional remote-sensing based studies of changing lake surface water dynamics have been conducted in Arctic and Boreal regions (Smith et al 2005, Riordan et al 2006, Carroll et al 2011, Jones et al 2011, Roach et al 2011, Nitze et al 2017, 2018, Cooley et al 2019, Pastick et al 2019, Swanson 2019), yet beavers have seldom been considered among the primary drivers (Hood and Bayley 2008). Our observations showed that newly beaver influenced waterbodies accounted for 66% of the increase in surface water area between 2002 and 2019. This is comparable to observations from the Boreal forest in Canada when assessing the role of beavers relative to climatic variable controls on open water extent. Hood and Bayley (2008) found that beavers were responsible for 80% of the increase in open water extent in their study area in east-central Alberta, which dwarfed the effects of climate variables. Our results challenge the idea that current and future surface water changes in some Arctic and Boreal regions are, or will be, directly linked to changes in permafrost and thermokarst resulting from increased air temperature, through-going talik penetration, and precipitation and/or evaporation trends (Yoshikawa and Hinzman 2003, Smith et al 2005, Riordan et al 2006, Jones et al 2011, Roach et al 2011, Nitze et al 2018, Cooley et al 2019, Pastick et al 2019). Including the potential impact of beaver-driven engineering on Arctic and Boreal aquatic ecosystems may help explain the heterogeneity of lake area changes reported for a number of regions at the treeline and tundra ecotone or continuous to discontinuous permafrost zone transition.
4.3. Beaver dam increases in arctic tundra regions
While we have not addressed the causes of increases in beaver dam building in this study, it could be linked to three key components of changes occurring in the Arctic. First, the increased growing season length and increase in shrub cover and extent provide new forage and shelter necessary for beavers to survive in these landscapes (Tape et al 2006, 2018). Second, changes in winter climate are dominating the annual climate change signal in this region (Stafford et al 2000). The increase in winter air temperatures combined with more winter snowfall in Arctic Alaska is likely increasing the over-wintering habitat potential for beavers in a number of different types of thermokarst water bodies and as a result of thinner seasonal winter ice growth (Arp et al 2018). The shorter winters also reduce the duration that beavers must remain in their lodges relying on caches from the previous summer. Third, the change in native subsistence and hunting lifestyles that has occurred in this region and the reduction in the desire of beaver pelts and underfur for fashionable attire could be contributing to our observations of increased beaver activity (Bockstoce 2009, Tape et al 2018). Other factors such as changes in disease or predation seem less likely but cannot be eliminated as possibilities. We hope to tease apart the driving forces responsible for the increase in beaver dam activity in future studies to assist in the development of models to predict future Arctic landscape dynamics.
An interesting analogue to our observations of rampant beaver dam building in tundra regions in Alaska comes from Tierra del Fuego, Patagonia. The introduction of ∼20–50 beavers from northern Manitoba, Canada in southern Patagonia in the 1940s has swelled to an estimated 100 000 beavers in the region over a 60–70 year period (Choi 2008, Pietrek and Fasola 2014). Interestingly, one possible factor behind the explosive population growth has resulted from beavers moving out of the forests in which they were initially introduced, and establishing in adjacent steppe ecosystems which were previously thought to be subprime habitat (Pietrek et al 2017). The ability of beavers to utilize a range of habitat types in Patagonia, and to thrive in largely herbaceous vegetation-dominated ecosystems, has implications for what appears to be an ongoing beaver invasion of low Arctic tundra ecosystems.
5. Conclusions
Detailed analysis of high-resolution satellite remote sensing data implicates beavers as key contributors to surface water area changes in an ice-rich permafrost region in northwestern Alaska tundra. The 5000% increase in the number of beaver dams between 2002 and 2019 was positively correlated (R2 = 0.61; p < .003) with an 8.3% increase in surface water area in a 100 km2 study area located near Kotzebue, Alaska. Beaver influenced waterbodies accounted for 66% of the observed increase in surface water area associated with various permafrost region landforms that included drained thermokarst lake basins, thermokarst lakes, and beaded streams. Drained thermokarst lake basin flooding as a result of beaver dam building accounted for 68% of the increase in open water area in beaver influenced waterbodies and likely resulted in localized permafrost degradation in and around the basin floors. In addition, dam building at thermokarst lake outlets resulted in both lake area increases through permafrost degradation driven lake expansion but also resulted in lake area decreases through beaver-induced lake drainage. Similar increases in the relative number of beaver dams across the northern Baldwin Peninsula indicate that increased dam building is a regional phenomenon. Beavers should likely be incorporated into models of landscape change in permafrost regions and be considered when interpreting surface water changes in Arctic and Boreal systems.
Acknowledgments
Funding for this research was provided by National Science Foundation grants OPP-1850578 (KDT and BMJ), NSF OPP-1806213 (BMJ), NSF OIA-1833056 (KDT and JAC), and NSF OIA-1929170 (BMJ). IN and GG were supported through ESA CCI+ Permafrost and HGF AI-CORE. DigitalGlobe, Inc. imagery provided by the University of Minnesota Polar Geospatial Center (PGC) through NSF OPP-1850578 grant.
Data availability statement
The data that support the findings of this study are openly available at the NSF-Funded Arctic Data Center.