T-EDGE: Temporal WEighted MultiDiGraph Embedding for Ethereum Transaction Network Analysis
 Dan Lin
 Jiajing Wu
 Qi Yuan1,2
 - 1School of Data and Computer Science, Sun Yat-sen University, Guangzhou, China
- 2National Engineering Research Center of Digital Life, Sun Yat-sen University, Guangzhou, China
Recently, graph embedding techniques have been widely used in the analysis of various networks, but most of the existing embedding methods omit the network dynamics and the multiplicity of edges, so it is difficult to accurately describe the detailed characteristics of the transaction networks. Ethereum is a blockchain-based platform supporting smart contracts. The open nature of blockchain makes the transaction data on Ethereum completely public and also brings unprecedented opportunities for transaction network analysis. By taking the realistic rules and features of transaction networks into consideration, we first model the Ethereum transaction network as a Temporal Weighted Multidigraph (TWMDG) where each node is a unique Ethereum account and each edge represents a transaction weighted by amount and assigned a timestamp. We then define the problem of Temporal Weighted Multidigraph Embedding (T-EDGE) by incorporating both temporal and weighted information of the edges, the purpose being to capture more comprehensive properties of dynamic transaction networks. To evaluate the effectiveness of the proposed embedding method, we conduct experiments of node classification on real-world transaction data collected from Ethereum. Experimental results demonstrate that T-EDGE outperforms baseline embedding methods, indicating that time-dependent walks and the multiplicity characteristic of edges are informative and essential for time-sensitive transaction networks.
1. Introduction
The network is a kind of data form that is often used to describe the relationship between objects. The past decade has witnessed an explosive growth in network data, which have been used to present information in various areas, such as social networks, biological networks, computer networks, and financial transaction networks [1]. Analysis of large-scale networks has attracted increasing attention from both academia and industry. With the rapid development of machine learning technology, the question of how to analyze the data effectively for large-scale complex networks is becoming a hot topic in the field of artificial intelligence.
Financial transaction networks are widespread in the real world. However, there have been relatively few analytical studies on financial transaction networks because the transaction data are usually private for the sake of security and interest. Fortunately, the recent emergence of blockchain technology makes transaction data mining more feasible and reliable. Blockchain is a new technology that is described as an innovative application mode of distributed data storage, peer-to-peer transmission, consensus mechanisms, encryption algorithms, and other computer technologies in the Internet era [2, 3]. Generally speaking, blockchain is a new distributed ledger, and the transaction data is stored on the chain in chronological order. Ethereum [4] is the largest blockchain platform that supports smart contracts. The Ethereum system introduces the concept of account and allocates storage space for recording account balance, transaction time, codes, etc. Compared with a traditional database, blockchain technology naturally has the characteristics of traceability, anti-tampering, and publicity. The openness of public blockchain provides favorable conditions for transaction data mining [5].
In fact, cryptocurrency and blockchain are highly coupled, since blockchain technology is born from Bitcoin. The study of cryptocurrency transaction networks has very high application value and there have already been some studies, including graph analysis, price prediction, portfolio management, anti-market manipulation, ponzi scheme detection, and so on [6–12]. In 2013, Ron et al. [6] described Bitcoin schemes and investigated a large number of statistical properties of the full Bitcoin transaction network. By analyzing the subgraph of the largest transactions, they revealed several characteristics in the Bitcoin transaction graph: long chains, fork-merge patterns with self-loops, keeping bitcoins in “savings accounts,” and binary tree-like distributions. In 2017, Jiang and Liang [7] presented a deterministic deep reinforcement learning method for cryptocurrency portfolio management. The trading algorithm takes the historical prices of a set of financial assets as input and outputs the portfolio weights of the set. In 2018, Liang et al. [8] traced the properties of three representative cryptocurrencies, Bitcoin, Ethereum, and Namecoin, over time and characterized their dynamics by constructing a monthly transaction network.
Since it is extremely time-consuming to process the whole blockchain transaction network, it is necessary to find an effective and efficient way to analyze Ethereum transaction data. As we know, the performance of machine learning tasks depends to a large extent on the selection of data features, so a key problem is how to reasonably represent the feature information in large-scale transaction networks. In addition, using a machine learning-based algorithm often requires feature information for samples, but the account profiles of the transaction networks are often difficult to obtain. The implicit characteristics of the accounts can be mined by means of graph embedding algorithms.
Graph embedding is an effective method for representing node features in a low-dimensional space for network analysis and downstream machine learning tasks [13]. Graph embedding algorithms can effectively reduce the data dimension of the transaction network and transform the large-scale and sparse high-dimensional one-hot node vectors into dense low-dimensional node vectors. Previous graph embedding research has been conducted in domains, such as social networks, language networks, citation networks, collaboration networks, webpage networks, biological networks, communication networks, and traffic networks [13]. This implies that existing graph embedding techniques may not be suitable for a transaction network. Using the traditional network embedding algorithm for transaction network analysis will present the following challenges. New transactions are generated over time, but existing methods ignore the multiplicity and dynamics of transactions. Random walks in transaction networks are meaningful and sequential, but existing methods based on social networks, like DeepWalk and node2vec, do not incorporate temporal information.
The random walk mechanism has been widely proved to be an effective technique for measuring the local similarity of networks for a variety of domains [14]. Among various graph embedding methods, a series of random-walk based approaches have been proposed for learning a mapping function from an original graph to a low-dimensional vector space by maximizing the likelihood of co-occurrence of neighbor nodes. For the traditional graph embedding method, DeepWalk [15], it was verified through experiments that nodes in the random walk sequence and words in the document all follow the power-law, so word2vec [16] was applied to learn node representations. Similar to DeepWalk, node2vec [17] introduced biased random walks, which smoothly search between breadth-first sampling and depth-first sampling strategies. Recently, to better extract temporal information from dynamic networks, Nguyen et al. [18] proposed a general framework called Continuous-Time Dynamic Network Embeddings (CTDNE) to incorporate temporal dependencies into existing random walk-based network embedding models. However, these previous methods omit the network dynamics and the multiplicity of edges, so it is difficult to accurately describe the detailed characteristics of the transaction networks.
To this end, to capture more comprehensive properties of dynamic transaction networks, we propose a novel framework named Temporal WEighted MultiDiGraph Embedding (T-EDGE) for the Ethereum transaction network. The main contributions of our paper are as follows:
• To the best of our knowledge, this is the first work to understand Ethereum transaction records via graph embedding, aiming to capture the non-negligible temporal properties and important money-transfer tendencies of time-sensitive transaction networks.
• We propose a novel graph embedding method called Temporal Weighted Multidigraph Embedding (T-EDGE), which incorporates transaction information from both time and amount domains, and experiments on realistic Ethereum data demonstrate its superiority over existing methods.
• To evaluate our proposed algorithm, we consider an important and practical machine learning task, namely node classification with transaction records of phishing and non-phishing accounts collected from Ethereum. The dataset can be accessed on XBlock (xblock.pro).
The remainder of this paper is organized as follows. First, section 2 demonstrates our workflow for Ethereum transaction network analysis. Then, section 3 describes how we model the transaction records as a temporal weighted multidigraph. Then, we introduce our proposed network embedding algorithm, T-EDGE, in section 4 and evaluate our algorithm by conducting node classification in section 5. Finally, section 6 concludes the paper.
2. Framework
In this section, we describe the workflow of Ethereum transaction network analysis presented in this work. As Figure 1 shows, the four main steps of the proposed framework for Ethereum transaction network analysis are data acquisition, network construction, graph embedding, and downstream tasks.
(a) Data acquisition. The data collection is the basis of transaction network analysis. Thanks to the openness of blockchain, researchers are able to autonomously access Ethereum transaction records. Through the API of Etherscan (etherscan.io), a block explorer and analytics platform for Ethereum, we can easily obtain the historical transaction data of the target account. As the size of the total transaction records is extremely large, we adopt the K-order subgraph sampling method [19], to obtain the local structure of the target accounts.
(b) Network construction. This step abstracts the original transaction record into a network structure for further analysis. In most existing studies on blockchain transaction networks, the transaction networks are constructed as simple graphs, that is, multiple transactions between a pair of accounts are merged into one edge, thus ignoring the multiplicity and dynamics of transactions between accounts. Differently from prior work, in this work, we model the multiple interactions between accounts as a Temporal Weighted Multidigraph [19] to facilitate a more comprehensive analysis of transaction behaviors.
(c) Graph embedding. In the framework of Ethereum transaction network analysis, the role of network embedding is to mine the implicit features of accounts in the transaction network and reduce the transaction data dimension. In order to learn the meaningful node representation vectors in the dynamic transaction network, we propose an improved embedding algorithm called Temporal Weighted Multidigraph Embedding (T-EDGE) based on temporal random walk. T-EDGE aims to capture the time and amount information that cannot be ignored in the Ethereum transaction network.
(d) Downstream tasks. We evaluate our model by conducting experiments on a typical machine learning task, namely node classification. Good performance of the downstream tasks reflects the effectiveness of embedding methods. Besides, analytical applications can be regarded as the ultimate goal of the Ethereum transaction network embedding. In this paper, we incorporate two current hot topics—cryptocurrency transaction analysis and machine learning, and use machine learning technology to help us make more accurate predictions about the future of the Ethereum transaction network.
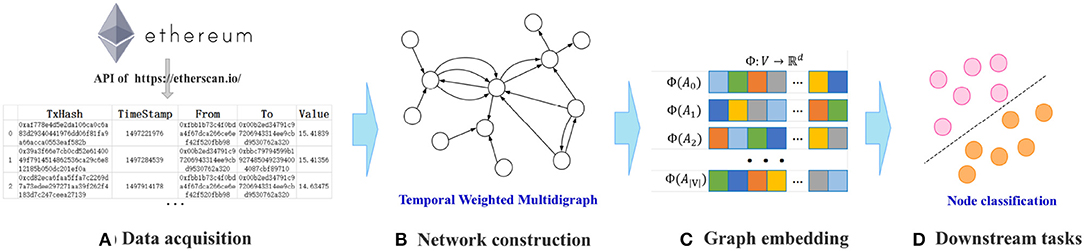
Figure 1. The architecture of the proposed framework for network analysis of Ethereum.
3. Ethereum Transaction Network
Being the largest public blockchain-based platform that supports smart contracts, Ethereum introduces the concept of account to facilitate the implementation of smart contracts. An Ethereum account is formally an address but adds storage space for recording account balances, transactions, codes, etc. Ethereum addresses are composed of the prefix “0x,” a common identifier for hexadecimal, concatenated with the rightmost 20 bytes of the public key. One example is: “0x00b2ed34791c97206943314ee9cbd9530762a320.” The corresponding cryptocurrency on Ethereum, known as Ether, can be transferred between accounts and used to compensate participant mining nodes.
The Ethereum blockchain consists of infinite linked blocks, which can be viewed as data-packages, including a series of transactions and some other information. In detail, the transaction data packages obtained from the Etherscan website are as followed: the TxHash field is a unique 66-character identifier of a transaction, the Value field is the value being transacted in Ether, and the Timestamp field is the time at which a transaction is mined. Besides, the From and To fields are the sending party and receiving party of a transaction, respectively.
In this section, we abstract the original transaction record as a Temporal Weighted Multidigraph (TWMDG). Figure 2 is a microcosm of transaction activities on Ethereum. In prior work on blockchain transaction network analysis, the transaction network was constructed as a simple network, that is, multiple transactions between nodes were accumulated as one edge. The multiplicity and dynamics of transactions between accounts were ignored. Therefore, we adopt Temporal Weighted Multidigraph (TWMDG) to represent Ether transfer between accounts more comprehensively.
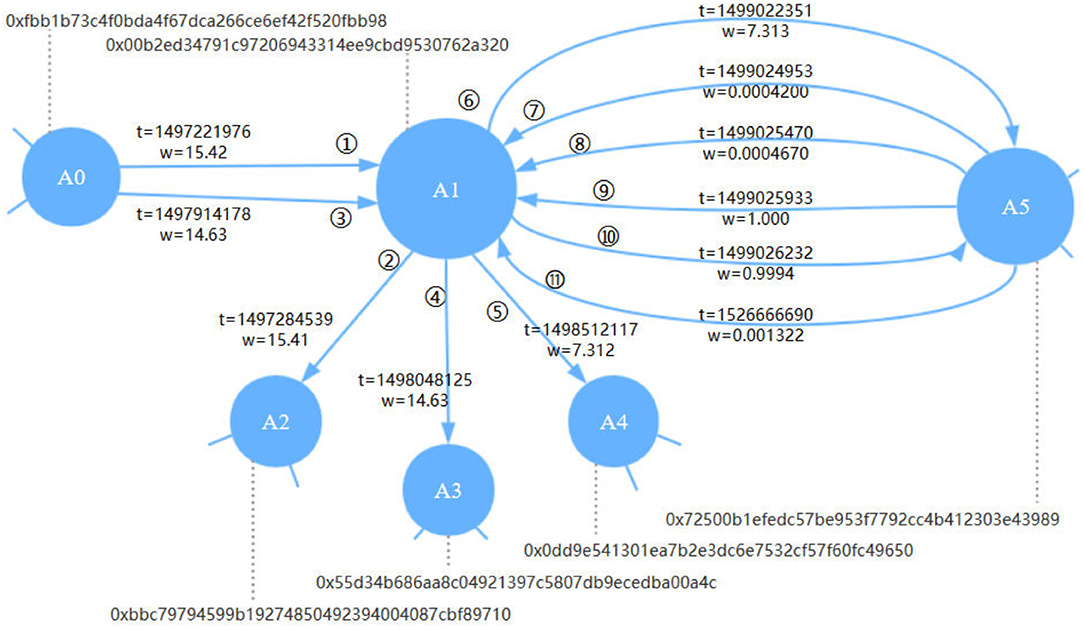
Figure 2. Schematic of the Ethereum transaction network. Each node represents an Ethereum account. Each edge represents a transaction, with a timestamp t and amount value w (in Ether) attached to it and indexed in increasing order of t.
Based on collected four-tuples (From, To, Value, Timestamp), we can model the Ethereum transaction records as a Temporal Weighted Multidigraph G = (V, E), where each node represents a unique account and each edge represents a unique Ether transfer transaction. In such a graph, V is the set of nodes and E is the set of edges. Each edge is unique and is represented as e = (u, v, w, t), where u is the source node, v is the target node, w is the weight value and t is the timestamp.
4. Network Embedding
In the analysis of the Ethereum transaction network, our goal is to learn an embedding vector for each node, the purpose being to mine the implicit characteristics of nodes in the transaction network and incorporate the time and amount information of the transaction network into the node vector. For the network model TWMDG built in the previous section, this paper proposes an improved network embedding algorithm based on a random walk. We now define the specific problem as follows.
Temporal WEighted MultiDiGraph Embedding (T-EDGE): Given a temporal weighted multidigraph G = (V, E), let V be the set of nodes and E be the set of edges. Each edge is unique and is represented as e = (u, v, t, w), where u is the source node, v is the target node, t is the timestamp, and w is the weight (Specifically, w is the amount value of a transaction in Ethereum transaction network). We define the following mapping functions: for ∀e ∈ E, Src(e) = u, Dst(e) = v. Function W(e) = w maps an edge to its weight, and function T(e) = t maps an edge to its timestamp. Our principal goal is to learn an embedding function Φ : V → ℝd (d ≪ |V|) that preserves the original network information.
The learned representations aim to include node similarity as well as temporal and weighting properties specifically for financial transaction networks, thus enhancing predictive performance on downstream machine learning tasks. The proposed method, T-EDGE, learns more appropriate and meaningful dynamic node representations using a general embedding framework consisting of two main parts:
• The first part is the temporal walk generator with temporal restriction and walking strategies.
• The second part is the update process based on skip-gram, and the parameters are updated by a Stochastic Gradient Descent algorithm.
4.1. Random Walk
For scalable network representation learning, the random walk mechanism has been widely proven to be an effective technique for capturing structural relationships between nodes [15]. We employ a temporal walk for transaction networks by considering temporal dependencies and multiplicity of edges. This kind of random walk sequence contains the practical meaning of money flow in transaction networks.
In a temporal weighted multidigraph, the temporal walk is defined as the sequential incremental path from the beginning node to the end node. Such a temporal walk is represented as a sequence of l nodes walkn = {v1, v2, ..., vl} together with a sequence of (l − 1) edges walke = {e1, e2, ..., el − 1}, where Src(ei) = vi, Dst(ei) = vi+1 (1 ≤ i ≤ (l − 1)), and T(ei) ≤ T(ei+1) (1 ≤ i ≤ (l − 2)). This temporal restriction is a novel idea designed for the temporal walk.
Consider a temporal walk that just traversed edge ei−1 and is now stopping at node vi at time t = T(ei−1). The next node vi+1 of the random walk is decided by selecting a temporally valid edge ei. We define the temporal edge neighborhood for a node u as Nt(u) = {e | Src(e) = u, T(e) ≥ t}. Let to be a function that maps the timestamps of edges to a descending ranking, and let be a function that maps the timestamps of edges to an ascending ranking. Here are our walking strategies used in Ethereum transaction network embedding.
4.1.1. T-EDGE
In the temporal weighted multidigraphs discussed here, a random walk generator of T-EDGE samples uniformly from the neighbors. All candidate edges in Nt have the same probability of being selected as the next edge of the random walk. The expression of the probability is
4.1.2. T-EDGE (TBS)
TBS refers to Temporal Biased Sampling. For financial transaction networks, the similarity between accounts is time-dependent and dynamic. Naturally, there is a strong transaction relationship between accounts with frequent transactions. The probability of selecting each edge e ∈ Nt(vi) can be given as:
4.1.3. T-EDGE (WBS)
WBS refers to Weighted Biased Sampling. The weight value of each transaction indicates the significance of interactions between the two accounts involved. The transaction amount can reflect the importance of transactions between accounts and then reflect the degree of correlation between accounts. In most cases, there is a strong similarity between accounts with a large amount of transactions. The probability of each edge e ∈ Nt(vi) being selected is
4.1.4. T-EDGE (TBS+WBS)
We combine the aforementioned sampling probabilities considering information from both temporal and weighted domains by
for ∀e ∈ Nt(vi). Here, α = 0.5 is the default value for balancing between TBS (time domain) and WBS (amount domain).
When ending up with a leaf node, we return the walk immediately. This setting is just the same as in the methods used for comparison, DeepWalk and node2vec.
Note that T-EDGE can be regarded as a specific version of DeepWalk for temporal and directed multigraphs like the transaction networks. As Table 1 shows, all candidate edges (temporal edge neighborhood) are equally likely to be selected by T-EDGE. T-EDGE (TBS) and T-EDGE (WBS) denote adding sampling preference on the time domain and the amount domain, respectively. T-EDGE (TBS+WBS) means adding sampling preference on both the time domain and the amount domain.
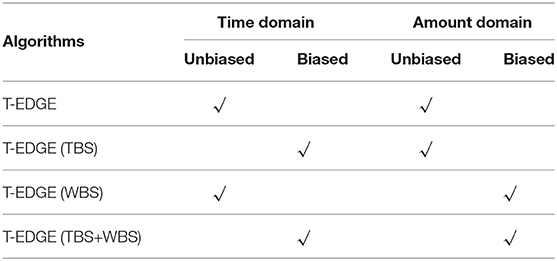
Table 1. Four types of T-EDGE variation for the Ethereum transaction network.
4.2. Learning Process
In the previous subsection, we described how to get the sampling sequence of temporal walk related to time and weight. In this part, we will formally describe the process of learning node vectors using the skip-gram model [16, 20].
The essence of the skip-gram model is a three-layer neural network model, including an input layer, hidden layer, and output layer. First, we train a neural network model based on the sampling walk sequences, but the purpose of training is not to use the model to predict the test set but to use the parameters learned from the model, namely the hidden layer parameters, as our node vectors. Then, by making an analogy between a natural language sentence and a truncated random walk sequence (as shown in Table 2), node representations are learned by maximizing the probability of observing the neighborhood of a node conditioned on its embedding. This cost function is as follows:
where k is the window size. According to the conditional independent assumption in the skip-gram model, we have:
Similar to DeepWalk, we employ the “hierarchical softmax” technique [15] to accelerate the computation of Pr(vj|Φ(vi)). We first apportion |V| nodes to the leaf nodes of a Huffman Tree and then transform the computation of Pr(vj|Φ(vi)) into computing the probability of walking randomly from the root of the Huffman Tree with inputting node vi and outputting node vj. The probability is
where bt is from {b0 = root, b1, ..., b⌈log|V|⌉ = vj}. We then model Pr(bt|Φ(vi) with a sigmoid function:
where Φ(bt−1) is the representation of bt's parent node in the Huffman tree. The skip-gram model then uses a back-propagation algorithm and Stochastic Gradient Descent to update the weight.
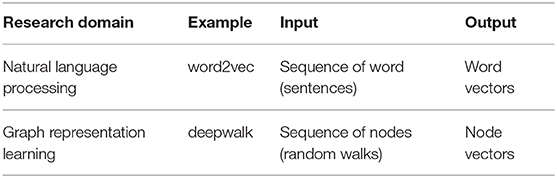
Table 2. Comparison between language model word2vec and graph model Deepwalk.
Random walk-based graph embedding methods have been proved to be scalable and effective for large graphs. The time complexity of the temporal walk part and the skip-gram learning procedure is O(r|V|L) and O(|V| log |V|), respectively, where |V| is the number of nodes, r denotes walks per node, and L refers to the length of random walk.
5. Experiments and Results
Downstream tasks, such as node classification are commonly considered for the verification of graph embedding methods. To evaluate the performance of the proposed T-EDGE algorithms, we conduct node classification experiments to classify the labeled phishing accounts and unlabeled accounts (treated as non-phishing accounts) on Ethereum. The better performance of classification demonstrates that our T-EDGE algorithms outperform baseline embedding methods, and at the same time, node classification for detecting phishing accounts on Ethereum is also of great value. A phishing scam is a new type of cybercrime that arises along with the emergence of online business [21]. It is reported to account for more than 50% of all cyber-crimes on Ethereum since 2017 [22].
5.1. Data Acquisition
To train our node classification model using supervised learning, we obtain 445 phishing nodes labeled by Etherscan and the same number of randomly selected unlabeled nodes as our objective nodes.
K-order sampling is an effective method for obtaining the local information of objective accounts [19]. Centered by each objective account, we obtain a directed K-order subgraph, where K-in and K-out are two parameters for controlling the depth of sampling inward and outward from the center, respectively. As shown in Figure 3, we make an assumption that for a typical Ether transfer flow centered on a phishing node, the previous node of the phishing node may be a victim, and the next one to three nodes may be bridge nodes with money-laundering behaviors. Therefore, we collect subgraphs with K-in = 1, K-out = 3 for each of the 890 objective nodes and then splice them into a large-scale network with 86,623 nodes.
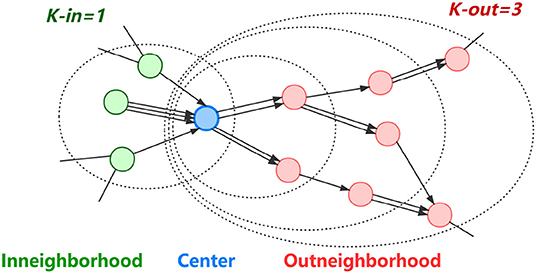
Figure 3. Schematic illustration of a directed K-order subgraph for phishing node-classification.
5.2. Setting
In the experiments, we compare the proposed T-EDGE algorithms with two baseline random walk-based graph embedding methods:
• DeepWalk is the pioneering work in employing random walks to learn a latent space representation of social interactions. Borrowing the idea of word2vec, the learned representation encodes community structure so that it can be easily exploited by standard classification methods [15].
• Node2vec further exploits a flexible neighborhood sampling strategy, i.e., Breadth-First Sampling (BFS) and Depth-First Sampling (DFS), with parameters p and q to capture both local and global structure [17].
To ensure a fair comparison, we implement the directed versions of DeepWalk and node2vec using OpenNE (an open-source package for network embedding, github.com/thunlp/openne). For these random walk-based embedding methods, we set several hyperparameters: the node embedding dimension d = 128, the size of window k = 4, the length of walk l = 10, and walks per node r = 4. For node2vec, we grid search over p, q ∈ {0.50, 1.0, 1.5, 2.0} according to [17]. For DeepWalk, we set p = q = 1.0, as it is a special case of node2vec. We implement the skip-gram model by using a Python library named Gensim [23], a framework for fast Vector Space Modeling.
5.3. Metrics
To make a comprehensive evaluation, we randomly select {50%, 60%, 70%, 80%} of the objective nodes as a training set and the remaining objective nodes as the test set, respectively. We train a classic binary classifier, namely, a Support Vector Machine (SVM), with the training set to classify the samples of the test set. Note that we use 5-fold cross-validation to train the classifier and evaluate it on the test set.
For a binary classification task based on a supervised learning framework, it can be divided into the following four cases according to the actual labels of the samples and the prediction results of the classifier.
• True Positive (TP): Samples whose labels are positive and are also predicted to be positive.
• True Negative (TN): Samples whose labels are positive but are predicted to be negative.
• False Positive (FP): Samples whose labels are negative but are predicted to be positive.
• False Negative (FN): Samples whose labels are negative and are also predicted to be positive.
In classification tasks, micro-F1 (Mi-F1) and macro-F1 (Ma-F1) are generally used to evaluate classification accuracy. First, we have
• precision:
• recall:
F1-score is an indicator used to measure the accuracy of the binary classification model. The calculation formula is
Macro-F1 refers to calculating the total precision and recall of all categories for F1-score, while Micro-F1 refers to the calculation of F1-score after calculating the average of precision and recall for each category.
5.4. Results
The results of micro-F1 (Mi-F1) and macro-F1 (Ma-F1) are shown in Figure 4. According to Figure 4, we have the following observations:
1. Our proposed methods T-EDGE, T-EDGE (TBS), T-EDGE (WBS), and T-EDGE (TBS+WBS) overwhelmingly outperform DeepWalk and node2vec;
2. Both T-EDGE (TBS) and T-EDGE (WBS) attain better performance than T-EDGE, in which the random walk generator has uniform probability;
3. Both T-EDGE (TBS) and T-EDGE (WBS) perform better than T-EDGE (TBS+WBS), which considers both temporal and amount information with parameter α = 0.5.
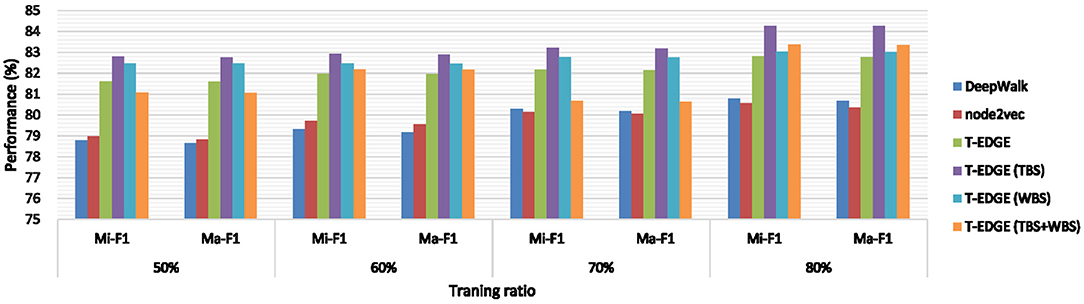
Figure 4. Node classification performance with different training ratios.
All in all, our proposed methods learn effective node representations incorporating rich information, which does help us get better performance in the classification task. The result also indicates that time-dependent walks and edge information are essential in transaction networks.
5.5. Parameter Analysis of α
Furthermore, the third observation mentioned above inspires us to analyze the coupling parameter α. Larger α means more time-domain information is considered in the random walk, while smaller α means more amount domain information is considered. Figure 5 compares the classification performance on the parameter α with different training ratios in terms of precision, recall, and F1-score. We find that α = 0.8 is a poor choice, but there is no single α that is a clear winner. Nevertheless, we can observe that α ∈ [0.2, 0.3] and α = 1 are relatively better choices. This result indicates that it is better to consider or favor a single strategy than to consider both strategies equally at the same time.
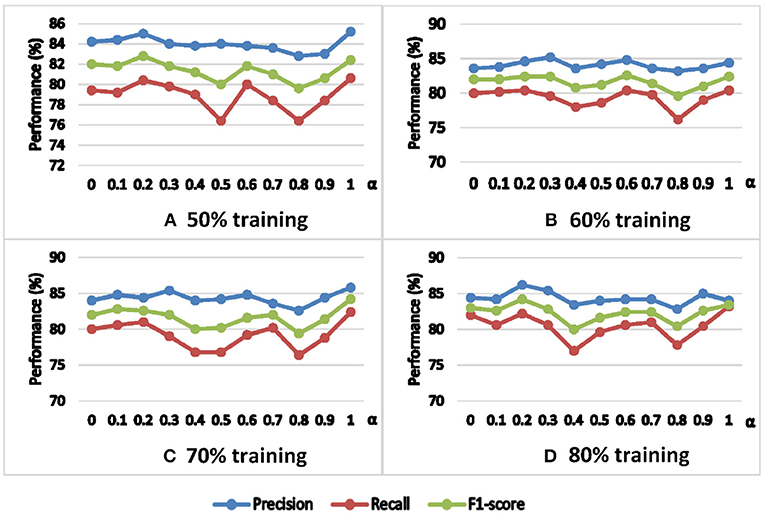
Figure 5. Classification performance on the parameter α with different training ratios.
6. Conclusion
In this work, we proposed a novel framework for Ethereum analysis via network embedding. Particularly, we constructed a temporal weighted multidigraph to retain information as much as possible and present a graph embedding method called T-EDGE that incorporates temporal and weighted information of financial transaction networks into node embeddings. We implemented the proposed and two baseline embedding methods on a realistic Ethereum network for a predictive task with practical relevance, namely phishing/non-phishing node classification. Experimental results demonstrated the effectiveness of the proposed T-EDGE embedding method while indicating that a temporal weighted multidigraph can more comprehensively represent the temporal and financial properties of dynamic transaction networks. Moreover, this work opens up research on graph embedding in a new domain, financial transaction networks. Traditional random walk-based methods can be extended to a temporal version with temporal walks and edge sampling strategies. For future work, we could use the proposed embedding method to investigate more applications of Ethereum or extend the current framework to analyze other large-scale temporal or domain-dependent networks.
Data Availability Statement
The datasets presented in this study can be found in online repositories (https://github.com/lindan113/xblock-network_analysis/tree/master/Phishing%20node%20classification) and are also accessible on our dataset website, XBlock (http://xblock.pro).
Author Contributions
All authors listed have made a substantial, direct and intellectual contribution to the work, and approved it for publication.
Funding
The work described in this paper was supported by the National Key Research and Development Program (2016YFB1000101), the National Natural Science Foundation of China (61973325, 61503420), and the Fundamental Research Funds for the Central Universities under Grant No. 17lgpy120.
Conflict of Interest
The authors declare that the research was conducted in the absence of any commercial or financial relationships that could be construed as a potential conflict of interest.
Acknowledgments
This manuscript has been released as a pre-print at https://arXiv.org [24].
References
1. Volpp L. Complex networks: structure and dynamics. Phys Rep. (2006) 424:175–308. doi: 10.1016/j.physrep.2005.10.009
3. Nakamoto S. Bitcoin: A Peer-to-Peer Electronic Cash System. (2008). Available online at: https://bitcoin.org/bitcoin.pdf
4. Wood G. Ethereum: a secure decentralised generalised transaction ledger. Ethereum Project Yellow Pap. (2014) 151:1–32. Available online at: https://files.gitter.im/ethereum/yellowpaper/VIyt/Paper.pdf
5. Chen W, Zheng Z. Blockchain data analysis: a review of status, trends and challenges. J Comput Res Dev. (2018) 55:1853–70. doi: 10.7544/issn1000-1239.2018.20180127
6. Ron D, Shamir A. Quantitative analysis of the full bitcoin transaction graph. In: International Conference on Financial Cryptography and Data Security. Okinawa: Springer (2013). p. 6–24. doi: 10.1007/978-3-642-39884-1_2
7. Jiang Z, Liang J. Cryptocurrency portfolio management with deep reinforcement learning. In: 2017 Intelligent Systems Conference (IntelliSys). IEEE (2017). p. 905–13. Available online at: https://ieeexplore.ieee.org/abstract/document/8324237
8. Liang J, Li L, Zeng D. Evolutionary dynamics of cryptocurrency transaction networks: an empirical study. PLoS ONE. (2018) 13:e0202202. doi: 10.1371/journal.pone.0202202
9. Feder A, Gandal N, Hamrick J, Moore T. The impact of DDoS and other security shocks on Bitcoin currency exchanges: evidence from Mt. Gox. J Cybersec. (2018) 3:137–44. doi: 10.1093/cybsec/tyx012
10. Chen T, Zhu Y, Li Z, Chen J, Li X, Luo X, et al. Understanding ethereum via graph analysis. In: IEEE INFOCOM 2018-IEEE Conference on Computer Communications. Honolulu, HI: IEEE (2018). p. 1484–92. Available online at: https://ieeexplore.ieee.org/abstract/document/8486401/
11. Chen W, Wu J, Zheng Z, Chen C, Zhou Y. Market manipulation of bitcoin: evidence from mining the Mt. Gox transaction network. In: IEEE INFOCOM 2019-IEEE Conference on Computer Communications. IEEE (2019). p. 1484–92. Available online at: https://ieeexplore.ieee.org/abstract/document/8737364/
12. Chen W, Zheng Z, Cui J, Ngai E, Zheng P, Zhou Y. Detecting Ponzi Schemes on ethereum: towards healthier blockchain technology. In: Proceedings of the 2018 World Wide Web Conference. International World Wide Web Conferences Steering Committee. (2018). p. 1409–18. Available online at: https://dl.acm.org/doi/abs/10.1145/3178876.3186046
13. Cai H, Zheng VW, Chang KCC. A comprehensive survey of graph embedding: problems, techniques and applications. IEEE Trans Knowl Data Eng. (2018) 30:1616–37. doi: 10.1109/TKDE.2018.2807452
15. Perozzi B, Al-Rfou R, Skiena S. Deepwalk: online learning of social representations. In: Proceedings of the 20th ACM SIGKDD International Conference on Knowledge Discovery and Data Mining. ACM (2014). p. 701–10. Available online at: https://dl.acm.org/doi/abs/10.1145/2623330.2623732
16. Mikolov T, Chen K, Corrado G, Dean J. Efficient estimation of word representations in vector space. arXiv. (2013). Available online at: https://arxiv.org/abs/1301.3781
17. Grover A, Leskovec J. Node2Vec: scalable feature learning for networks. In: Proceedings of the 22nd ACM SIGKDD International Conference on Knowledge Discovery and Data Mining. ACM (2016). p. 855–64. Available online at: https://dl.acm.org/doi/abs/10.1145/2939672.2939754
18. Nguyen GH, Lee JB, Rossi RA, Ahmed NK, Koh E, Kim S. Continuous-time dynamic network embeddings. In: Companion Proceedings of the The Web Conference 2018. International World Wide Web Conferences Steering Committee. (2018). p. 969–76. Available online at: https://dl.acm.org/doi/abs/10.1145/3184558.3191526
19. Lin D, Wu J, Yuan Q, Zheng Z. Modeling and understanding ethereum transaction records via a complex network approach. IEEE Transactions on Circuits and Systems-II: Express Briefs. (2020). Available online at: https://ieeexplore.ieee.org/abstract/document/8964468/
20. Mikolov T, Sutskever I, Chen K, Corrado GS, Dean J. Distributed representations of words and phrases and their compositionality. In: Burges CJC, Bottou L, Welling M, Ghahramani Z, Weinberger KQ, editors. Advances in Neural Information Processing Systems 26. Curran Associates, Inc. (2013). p. 3111–9. Available online at: http://papers.nips.cc/paper/5021-distributed-representations-of-words-and-phrases-and-their-compositionality.pdf
21. Liu J, Ye Y. Introduction to E-Commerce Agents: Marketplace Marketplace Solutions, Security Issues, and Supply and Demand. Berlin; Heidelberg: Springer Berlin Heidelberg (2001).
22. Konradt C, Schilling A, Werners B. Phishing: An economic analysis of cybercrime perpetrators. Comput Sec. (2016) 58:39–46. doi: 10.1016/j.cose.2015.12.001
23. Řehůřek R, Sojka P. Software framework for topic modelling with large corpora. In: Proceedings of the LREC 2010 Workshop on New Challenges for NLP Frameworks. Valletta: Springer (2010). p. 45–50.
24. Wu J, Lin D, Yuan Q, Zheng Z. T-EDGE: Temporal WEighted MultiDiGraph Embedding for ethereum transaction network analysis. arXiv. (2019) 190508038. Available online at: https://arxiv.org/abs/1905.08038
Keywords: network embedding, ethereum, machine learning, temporal network, transaction network
Citation: Lin D, Wu J, Yuan Q and Zheng Z (2020) T-EDGE: Temporal WEighted MultiDiGraph Embedding for Ethereum Transaction Network Analysis. Front. Phys. 8:204. doi: 10.3389/fphy.2020.00204
Received: 25 March 2020; Accepted: 11 May 2020;
Published: 30 June 2020.
Edited by:
Jianguo Liu, Shanghai University of Finance and Economics, ChinaReviewed by:
Shiyuan Wang, Southwest University, ChinaYongxiang Xia, Hangzhou Dianzi University, China
Zhihai Rong, University of Electronic Science and Technology of China, China
Copyright © 2020 Lin, Wu, Yuan and Zheng. This is an open-access article distributed under the terms of the Creative Commons Attribution License (CC BY). The use, distribution or reproduction in other forums is permitted, provided the original author(s) and the copyright owner(s) are credited and that the original publication in this journal is cited, in accordance with accepted academic practice. No use, distribution or reproduction is permitted which does not comply with these terms.
*Correspondence: Jiajing Wu, wujiajing@mail.sysu.edu.cn