Modelling Changes in Soil Phosphorus When Phosphorus Fertiliser Is Reduced or Ceases
 Jessica Tyson1
  Lucy Burkitt
- 1Biosecurity Tasmania, Department of Primary Industries, Parks, Water and Environment, Mt Pleasant, TAS, Australia
- 2Tasmanian Institute of Agriculture, University of Tasmania, Sandy Bay, TAS, Australia
- 3Farmed Landscapes Research Centre, School of Agriculture and Environment, Massey University, Palmerston North, New Zealand
- 4New South Wales Department of Primary Industries, Elizabeth Macarthur Agricultural Institute, Menangle, NSW, Australia
In order for land managers and policy makers to manage excessive soil phosphorus (P) concentrations and reduce the risk of this particular source of P from impacting water bodies, models of soil P decline under various scenarios are needed. We modelled the decrease in calcium chloride-extractable P (CaCl2-P), and sodium bicarbonate-extractable P (Olsen-P and Colwell-P) using data from six Australian grazed pasture soils with contrasting P sorption properties, over a period of 4.5 years. Each soil had four initial soil P concentrations (Pinit), each of which received four on-going rates of P fertiliser (Pfert). The model predicts the final P concentration (Pfinal) by taking into account the P concentration previously measured (CaCl2-P, Olsen-P or Colwell-P), Pfert applied since measurement, and time since previous measurement: Final P concentration = (previously measured P concentration + ep x P fertiliser applied) exp (-dp x years since previous P concentration measurement). Where ep is the increase in soil P for each unit of applied P and dp is the decay constant representing how quickly the soil P decreased. The greatest decreases in proportion to Pinit occurred for CaCl2-P, followed by Olsen-P, and then Colwell-P. The model tended to fit the dataset well for Olsen-P and Colwell-P, with mean overestimation (modelled Pfinal concentration greater than actual Pfinal) of the Pfinal concentrations of 6.1 (32%) and 4.3 mg/kg (10%), respectively. Although there was less CaCl2-P data, the model successfully described it, with a mean overestimation of Pfinal CaCl2 of 3.1 mg/kg (26%). The overestimation of Pfinal CaCl2 was possibly due to the high CaCl2-P concentrations of the low P buffering index soils. The model predicted an average of 32 years (ranging from 26 to 49 years) for Olsen-P concentrations of between 55 and 96 mg/kg to decrease to an agronomic optimum of 17 mg/kg. Agronomic optimum was not a reliable indicator of environmental risk as some soils did not exceed the CaCl2-P environmental threshold until Olsen-P concentrations were twice the agronomic optimum, whereas low P sorbing soils tended to exceed the threshold before reaching agronomic optimum. Further work with more soils is required to examine the influence of soil properties – such as P sorption – on decreases in soil P.
Introduction
Excessive soil phosphorus (P) concentrations are a concern in parts of Europe, the United States of America and Australia (Paulter and Sims, 2000; Sharpley et al., 2001; Gourley et al., 2015). Soils with more P than is needed for agronomic purposes can result in unnecessarily high concentrations of P in runoff (Sharpley and Rekolainen, 1997; Burkitt et al., 2010) which can, in addition to other landscape and land management factors, contribute to eutrophication of waterways (Carpenter et al., 1998). These excessive soil P concentrations can be the result of P inputs (fertiliser, livestock feeds and manures) exceeding P removal in produce. Some land managers still apply P fertiliser when soil P concentrations are above agronomic optimum, despite being aware of the environmental risks, especially in intensive pasture industries (Nicon Rural Services, 2010). This practice is used as a form of risk management to ensure that soil P does not suddenly decrease below the agronomic optimum and result in a subsequent decrease in pasture production and consequent economic loss. However, this approach results in inefficient use of P fertiliser, a finite resource which is in increasing world demand (Smil, 2000; Condron et al., 2005).
In response to increasing P concentrations in some water resources, policies have been implemented in some countries to prevent further increases in soil P concentrations that are already above agronomic optimum (European Parliament, 2000). Models predicting increases in plant available P concentrations are well established, however, few models predict declines. In order for land managers and policy makers to better understand how to manage soil P so as to decrease excessive concentrations without risking production losses, models of the changes in soil P – particularly decreases – under various scenarios are needed.
A number of researchers have described an exponential decrease in extractable soil P after P fertiliser application has ceased (McCollum, 1991; Paris et al., 2004; van der Salm et al., 2009). A number of mechanistic (Russell, 1977) and descriptive (Cox et al., 1981; Schulte et al., 2010; Dodd et al., 2012) models have been devised to model soil P decline. Schulte et al. (2010) and Dodd et al. (2012) developed models across a range of initial P (Pinit) concentrations and soils, with Schulte et al. (2010) also presenting a number of negative P-balance scenarios. However, these models did not include the influence of different on-going P fertiliser (Pfert) rates on decreases in extractable soil P, a practice which commonly occurs for intensive pasture soils and agricultural enterprises more generally. Coad et al. (2014) described changes in extractable soil P in a range of field soils which each had a wide range of initial soil P concentrations and on-going fertiliser P rates.
In this current paper, we use a Bayesian statistical framework to describe the changes in environmental P (CaCl2-P) (Houba et al., 2000) and agronomic P (Olsen-P and Colwell-P) (Olsen et al., 1954; Colwell, 1963) using datasets from the field study of Coad et al. (2014). We use a Bayesian approach to allow for uncertainty in measurement and parameters to be incorporated in a natural way through the appropriate prior specification. Bayesian methods also allow complex models to be more easily constructed (Brooks, 2003). Our aim was to develop a model to predict the final extractable soil P concentration (Pfinal) after a specified time period for various soil and P fertiliser scenarios. This model could be used by policy makers and land managers to assist their decision making and to set realistic timeframes to return soils that have excessive soil P to agronomic optimum concentrations and/or concentrations that pose low environmental risk.
Materials and Methods
Site Management and Soil Characterisation
The materials and methods employed to obtain the dataset used to develop the Bayesian model are published in Coad et al. (2014). Briefly, six field sites were selected that had a wide range of P sorption capacities (Table 1). Subsequently a wide range of P rates were applied as a single initial application to generate varying initial soil P concentrations. Then P was applied every 6 months at rates of zero, 0.5, 1, and 2 times maintenance rates for up to 4.5 years. The experimental design was fully factorial with 3 replicates at each site. The sites were sampled regularly for up to 4.5 years. Agronomic (Colwell and Olsen) measures of P and an environmental indicator (0.01 M CaCl2–P) of P status were measured on soil samples. We also measured both unadjusted P buffering index (PBI) (Burkitt et al., 2008) – commonly used in Australia – and the amount of P sorbed after addition of 1000 mg P/kg (Ps1000) for the initial and final soil samples for all treatments. Both PBI and Ps1000 were undertaken using the PBI method (Burkitt et al., 2008; Rayment and Lyons, 2011). Briefly, 1 g of soil was shaken for 17 h in 0.01 M CaCl2 with an addition of 1000 mg P/kg soil (Burkitt et al., 2008). The difference between the added P and the final P concentration in the equilibrating solution was the amount of P sorbed (Ps1000), with PBI calculated as P sorbed (mg/kg)/[final P solution (mg/L)0.41]. Phosphorus sorption capacity (PSC) was calculated for each soil according to Borling et al.(2001; Table 1).
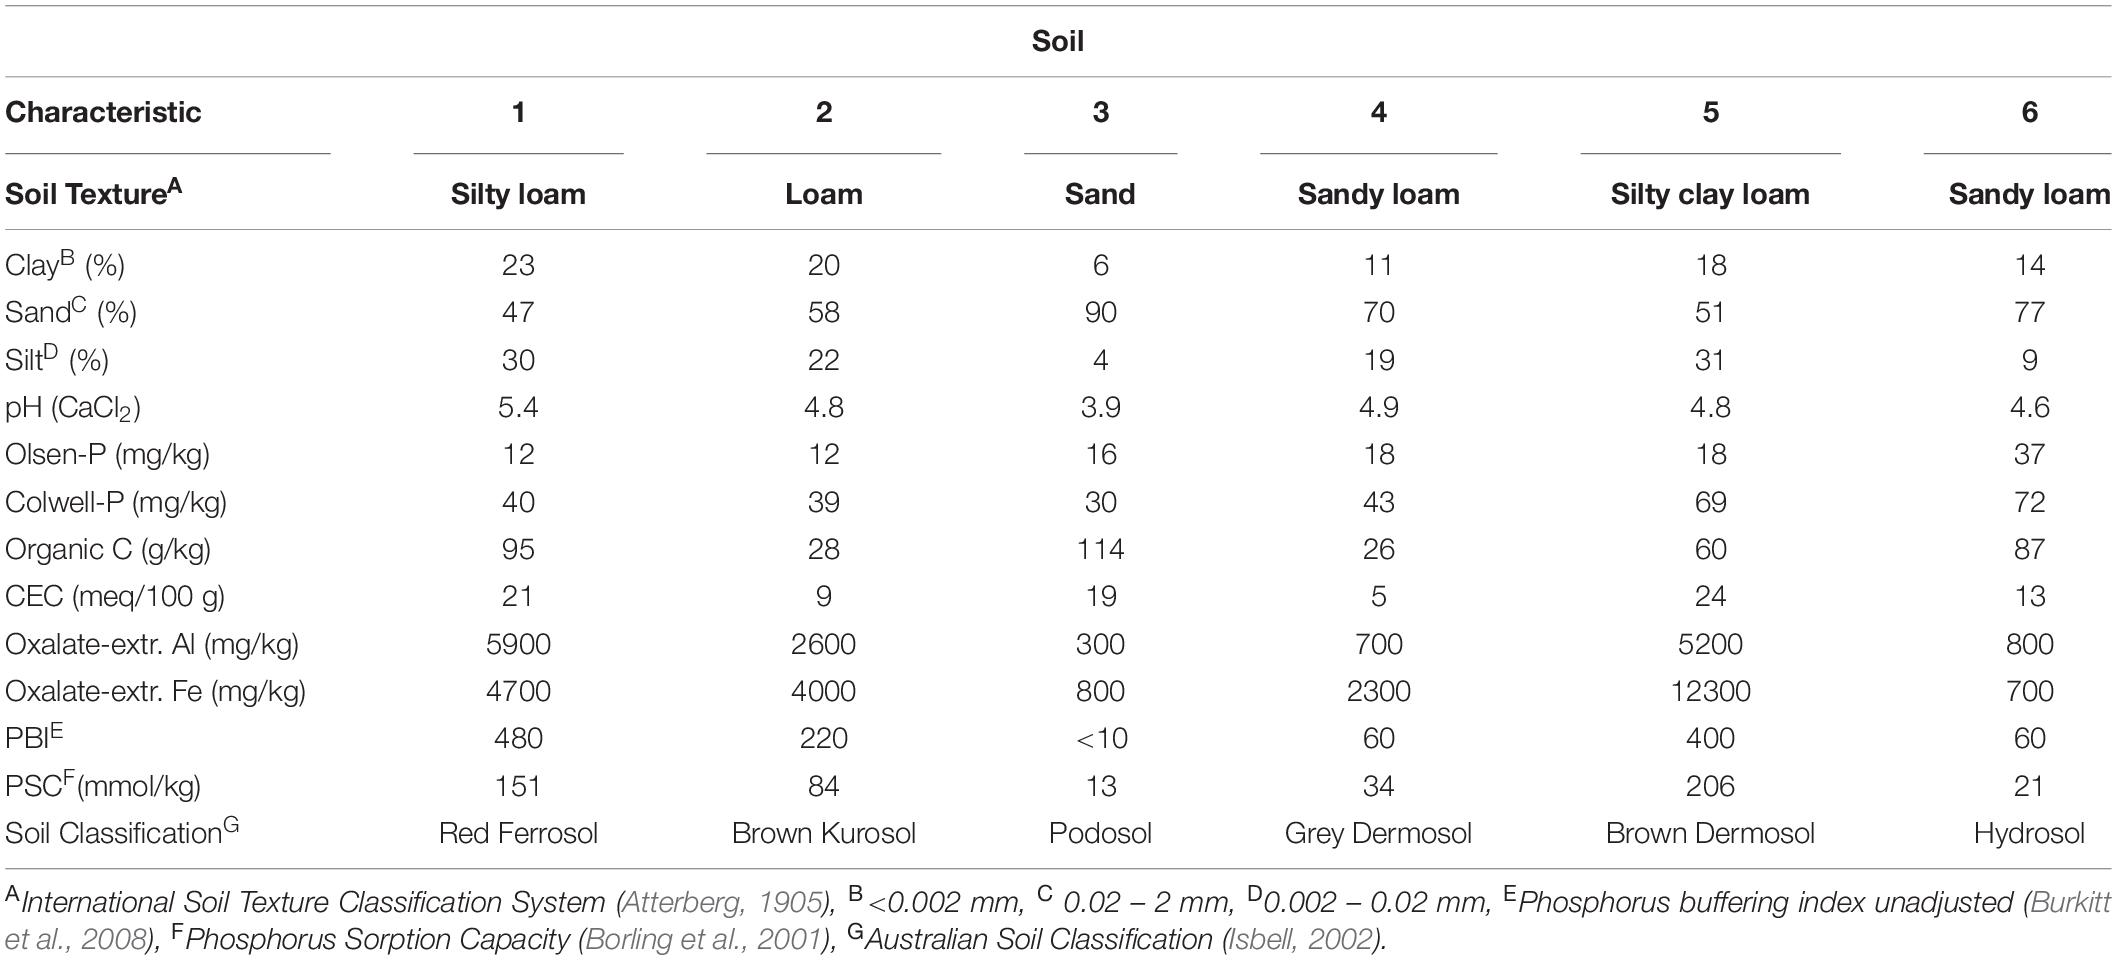
Table 1. Selected chemical and physical properties of the surface 10 cm of pasture soils sampled from the six field sites prior to P fertiliser treatment.
Bayesian Statistics
Bayesian inference is the process of fitting a probability model to a set of data and summarising the results via probability distributions on the parameters of the model. In a Bayesian model, the parameters are considered to be uncertain and are therefore represented by probability distributions, known as prior distributions, or priors. These are combined with the model likelihood to obtain posterior distributions that provide their most probable values given the data and modelling assumptions (Berger, 1993). The posterior distributions are summarised using summary statistics. Using a Bayesian framework allows the inclusion of uncertainty in parameters and models, the probabilistic representation of the model outcomes, as well as conveniently constructing very complex models.
Model Construction
We had previously observed that the greater the P concentration, the greater the rate of decline in soil P (Coad et al., 2014). Consequently we developed a model with an exponential decay function. The model was based on (1) P concentration previously measured (Pinit concentration), and (2) the amount of P added as on-going Pfert, with P concentration for each plot being repeatedly measured over time. Although Pinit and Pfert were used in constructing data summaries, they were not independent of each other within the model due to the overlapping treatment structure i.e., the 16 treatments comprised the combination of the four Pferts with the four Pinit concentrations. Time was measured in 12 month intervals for CaCl2-P and 6 month intervals for Olsen-P and Colwell-P. Thus, the CaCl2-P parameter estimates were based on less than half the data of Olsen-P and Colwell-P. All treatments were measured for Olsen-P and Colwell-P, while CaCl2-P was measured from nine selected treatments; the two lowest and the highest Pinit concentrations receiving either zero or one of the two highest Pfert rates. The model was fitted using Markov Chain Monte Carlo techniques by means of JAGS software, version 3.1, using 500 000 iterations, a burn-in of 250 000, and thinning every 250 iterations.
The model used Eq. 1 to reflect the changes in soil P that were offset by Pfert application. In Eq. 1 Yp,t was the soil P concentration at time (t) for each treatment plot (p); Yp,t–1 represented the previous soil P concentration (Pinit); Ap,t–1 was the amount of P applied since the previous soil P concentration measurement (divided by 1000 for numerical convenience); S represented the time in years since previous measurement; and ep and dp were parameters which were estimated and were required to be positive. ep represented the increase in extractable soil P for each unit of applied P, and dp represented a decay constant that reflects how quickly the extractable soil P decreases i.e., moves from the labile to unavailable pools, is removed in product, or otherwise lost from the soils.
The model is universal for all three P extractions (mg/kg), P fertiliser applied is expressed as kg P/ha, and estimated soil specific e and d values are provided (see Table 4). The observed Pfinal concentrations for each of the measures were denoted by Pp,t, which was assumed to be normally distributed, with means given by the modelled value Yp,t, and with reciprocal varianceτ (Eq. 3).
Prior distributions were assigned to the parameters of the Bayesian model (Table 2). Vague priors were used since they make minimal assumptions, resulting in the inferences being informed by the data rather than the prior parameters. The parameters ep and dp were assumed to be normally distributed, each with soil specific means, es and ds, where the subscripts p and s are indices for plot and soil. The es and ds were assumed to be normally distributed with common global means, e0 and d0, respectively. Thus, plot parameters could vary around their soil means, which themselves were distributed around a global mean. The normal distributions were truncated on the left at zero so that the parameters remained positive (Table 2).
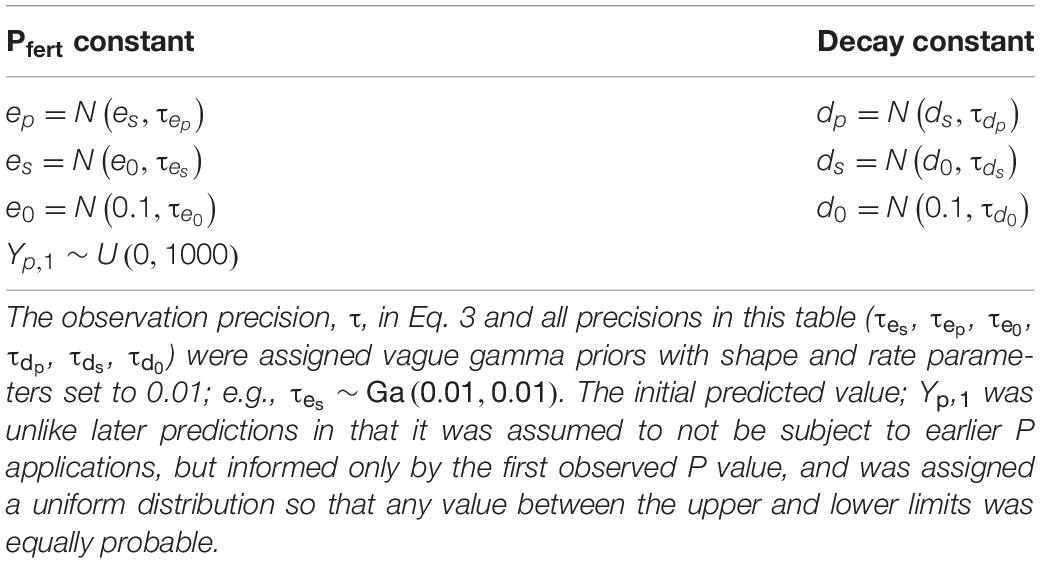
Table 2. Assignment of priors to parameters ep and dp for a Bayesian model of soil P concentration change across six soils, each with a range of Pinit concentrations and Pferts.
Using the model, the time required for Pinit to decrease to agronomic optimum – defined as 17 mg/kg for Olsen-P (Gourley et al., 2007) and as 55, 40, 23, 29, 55, and 29 mg/kg for Soils 1 to 6, respectively, for Colwell-P (Gourley et al., 2007) and an environmental threshold (defined as <0.25 mg/kg for CaCl2-P), was calculated. We chose the CaCl2-P threshold of 0.25 mg/kg (equivalent to solution concentration of 0.05 mg/L based on a 5:1 solution:soil extraction ratio) because the phosphorus trigger value for slightly disturbed lowland streams in Tasmania and Victoria at the time of the study was 0.05 mg/L (ANZECC, 2000) and CaCl2 extractable P (mg/L) has been shown to approximate runoff P concentrations in a number of studies (Dougherty et al., 2008; Burkitt et al., 2010).
Results and Discussion
Predicted Versus Observed Final CaCl2-, Olsen- and Colwell-P Concentrations
Posterior predictions and observed soil CaCl2-P, Olsen-P and Colwell-P concentrations (Figure 1) were highly correlated (r2 > 0.85), showing the model successfully fitted the dataset well for all three P extractions based on 4.5 years of data for 6 soil which ranged from extremely low to high P sorption capacity. Final Olsen-P and Colwell-P concentrations, which were initially approximately twice agronomic optimum or lower, were the most accurately predicted. The precision of the model for P concentrations which were initially near agronomic optimum should be reassuring to land managers and policy makers as it limits the chances of soil P concentrations decreasing below agronomic optimum faster than predicted. However, the large range in extractable soil P concentrations of the dataset resulted in modelled values diverging from observed values as soil P concentrations increased (Figure 1). This divergence meant that the model overestimated the Pfinal concentration i.e., the greater the Pinit concentration, the greater the predicted Pfinal concentration was compared to the actual Pfinal concentration (Figure 1). This may have been the result of the smaller population of data at high Pinit concentrations, for example, Soil 3 did not contain high Olsen and Colwell Pinit concentrations.
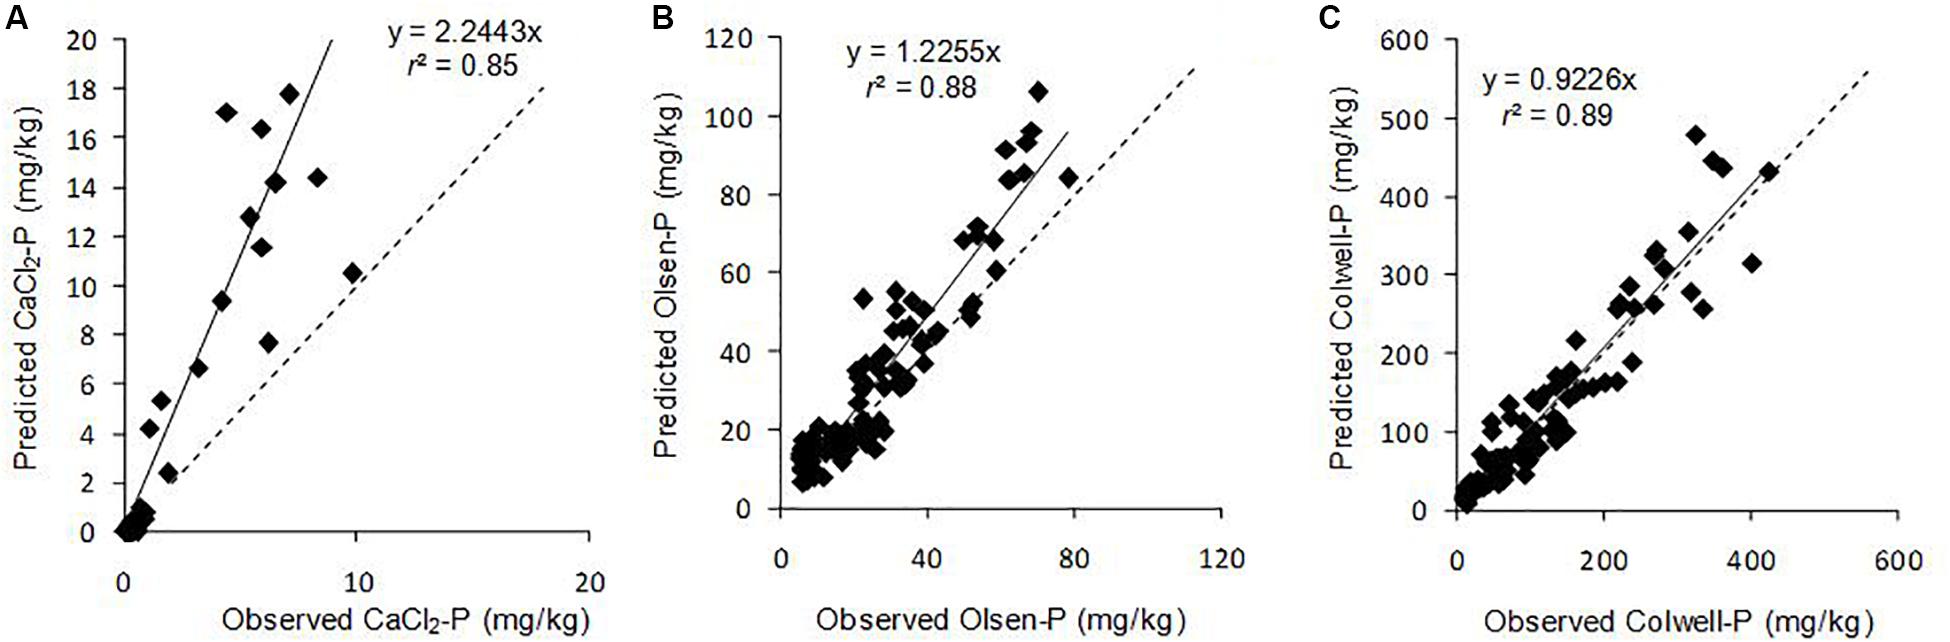
Figure 1. Relationship between observed and predicted final (A) CaCl2-P, (B) Olsen-P, and (C) Colwell-P concentrations of the surface 10 cm for six Australian grazed pasture soils and all Pinit concentrations and Pferts. Solid line is the fitted regression and dashed line represents x = y. Points above the dashed line represent overestimation of Pfinal concentration (modelled Pfinal concentration greater than actual Pfinal), while points below represent underestimation of Pfinal concentration.
Since the dataset used to develop this model was sourced from grazed pasture field soils, some decreases in extractable soil P would be the result of P being exported in grazing animal products (estimated to be between 2.9 and 12.3 kg P/ha.yr depending on site), and environmental losses. These estimated exports changed according to soil and Pinit concentration, as would any environmental losses which may occur. The current model includes these exports as contributing to the decreases in extractable soil P concentrations. Further population of the model with data which compares decreases in extractable soil P and various rates of P export from a soil is required, and may lead to incorporation of a P export term. Nevertheless, the majority of the decrease in extractable soil P may be driven by readily extractable P being sorbed by the soil (Barrow, 1980) and conversion to forms not extractable by CaCl2 or bicarbonate, for example organic P (Po) or recalcitrant inorganic-P (Pi).
It could be postulated that our model was predicting decreases in the effectiveness of the capital fertiliser applied at trial site establishment. As a result, the Pfinal concentrations we observed may be expected to be lower than those in soils where similarly high Pinit concentrations were established over a longer period. However, if that were the case, our model would more closely represent the higher Pfinal concentrations since the model overestimated Pfinal, primarily for high Pinit soils. Irrespective of this, greater decreases in soil extractable P have been reported for high Pinit concentrations, whether built-up over a short or long period (McCollum, 1991). McCollum (1991) found that the loss constants for Mehlich-1 Pinit, when the Pinit was achieved either through a single application of P fertiliser or progressively over 8 years of P fertiliser applications, had similar loss constants of −0.097 (r2 = 0.89) and −0.073 (r2 = 0.81), respectively, for initial Mehlich-1 P of 100 g m–3; −0.068 (r2 = 0.73) and −0.080 (r2 = 0.72) for initial values of 40–60 g m–3; and −0.047 (r2 = 0.52) and −0.048 (r2 = 0.41) for initial values of 20–30 g m–3. When averaged across all soils Pinit concentrations and Pfert, our model overestimated final Olsen-P and Colwell-P concentrations by 6.1 mg/kg (32%) and 4.3 mg/kg (10%), respectively (Table 3). The overestimation for final Colwell-P was within analytical error, suggesting that the model was most successful at predicting final Colwell-P concentrations. Still, the overestimation for Olsen-P was relatively small considering the range in Pinit concentrations and soils. The Olsen-P method involves a short extraction (0.5 h) and generally extracts soluble orthophosphate P, including P that can be rapidly desorbed from soil particles (Coventry et al., 2001). The longer extraction time (16 h) for the Colwell-P method measures orthophosphate as well as some molybdate-reactive non-orthophosphate P compounds (Coventry et al., 2001). Thus, in addition to the background P exports, the model reflects the conversion of P from readily available to less available forms, and to lesser degree, the rapid and reversible sorption reactions which would have influenced the decreases in CaCl2-P and Olsen-P concentrations.
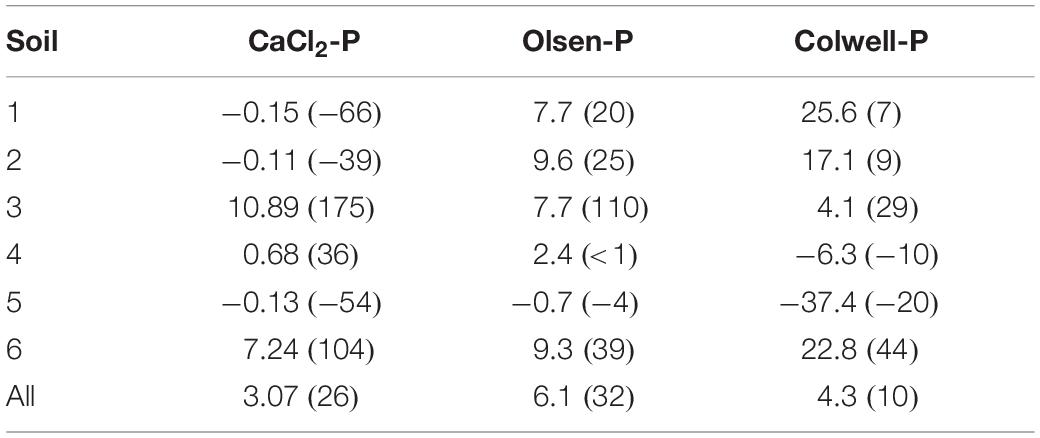
Table 3. Absolute and percentage error (in brackets) model prediction, compared to the observed Pfinal concentrations for each P measure and soil, and across all soils.
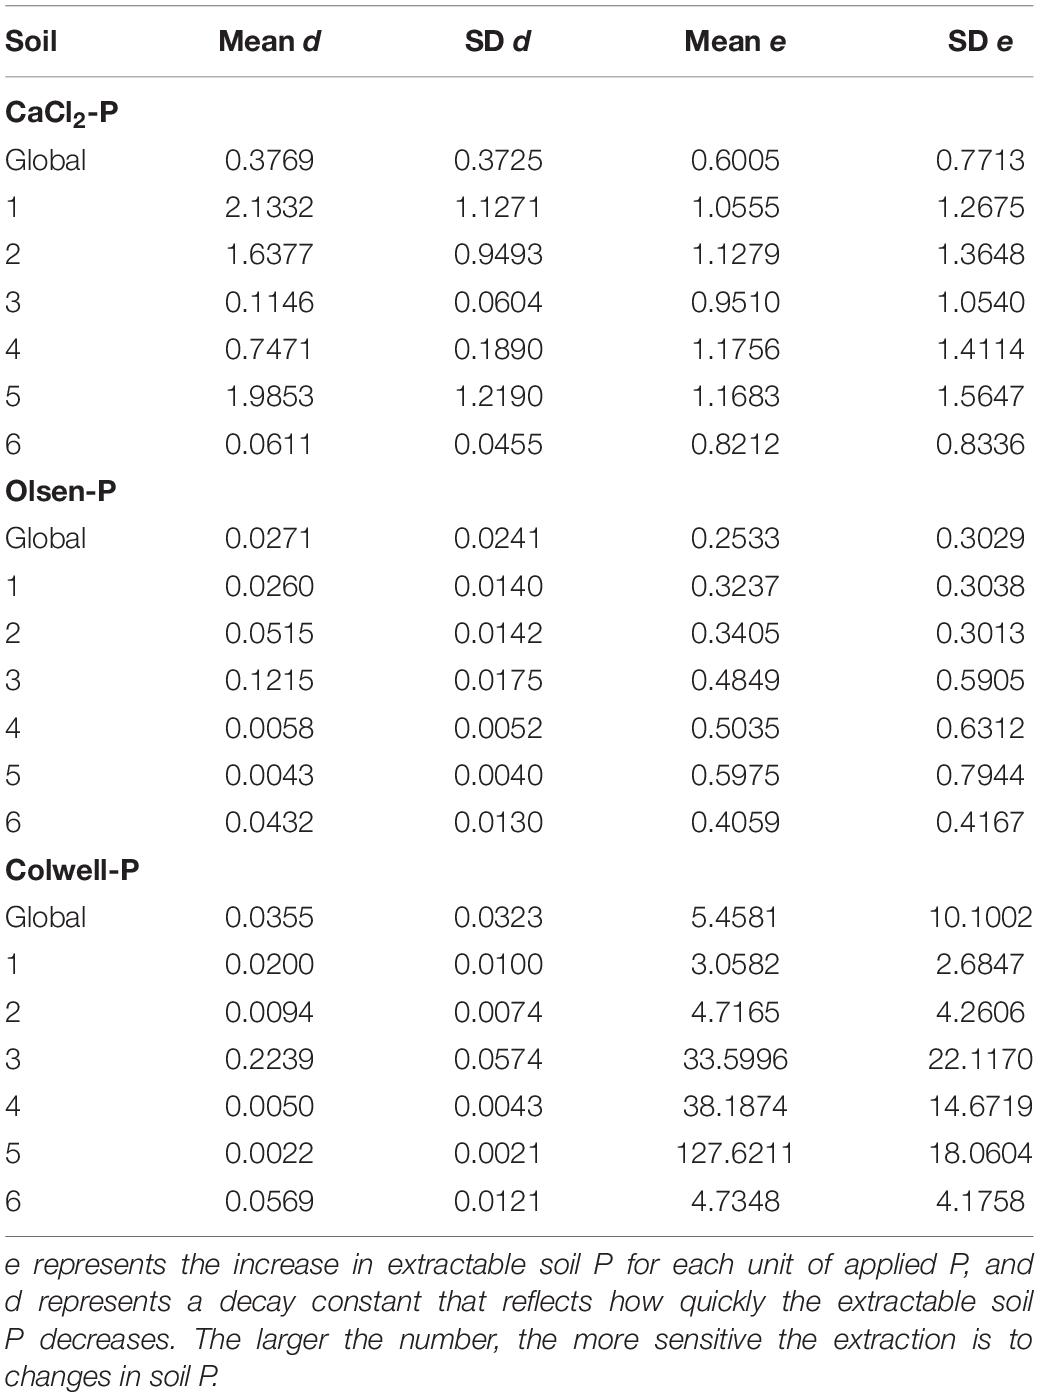
Table 4. The CaCl2-P, Olsen-P and Colwell-P posterior statistics of d and e in isolation from each other, on a global (d0 and e0) and soil (ds and es) level.
Similar to Olsen-P and Colwell-P, the divergence of the predicted CaCl2-P concentrations from the observed concentrations was greater as Pinit concentrations increased (Figure 1). The greater a soil’s CaCl2-P concentration, the greater the amount of P available to be converted to less available P through processes such as sorption and precipitation, to be removed in animal products, and to be lost to the surrounding environment. The model overestimated average final CaCl2-P concentrations by 3.07 mg/kg (26%) (Table 3). The Pfinal concentrations for Soils 3 and 6, with the highest CaCl2-P concentrations and lowest PBIs, were overestimated by a mean of 9.1 mg/kg (140%) (Table 3). Whilst these may be large overestimations when compared to the environmental CaCl2-P threshold i.e., ≤0.25 mg/kg (0.05 mg/L), they were not when compared to the initial CaCl2-P concentration range of the dataset (Table 5). We hypothesise that the extremely high CaCl2-P concentrations measured from Soils 3 and 6, and the fewer data available for CaCl2-P, contributed to the overestimation. The extreme CaCl2-P concentrations of Soils 3 and 6 appear to be due to these soil’s low PBI. Soils 3 and 6 contained the lowest oxalate-extractable iron and aluminium contents, lowest clay and highest sand contents, and some of the highest organic carbon contents, of all the soils examined in the study (Table 1).
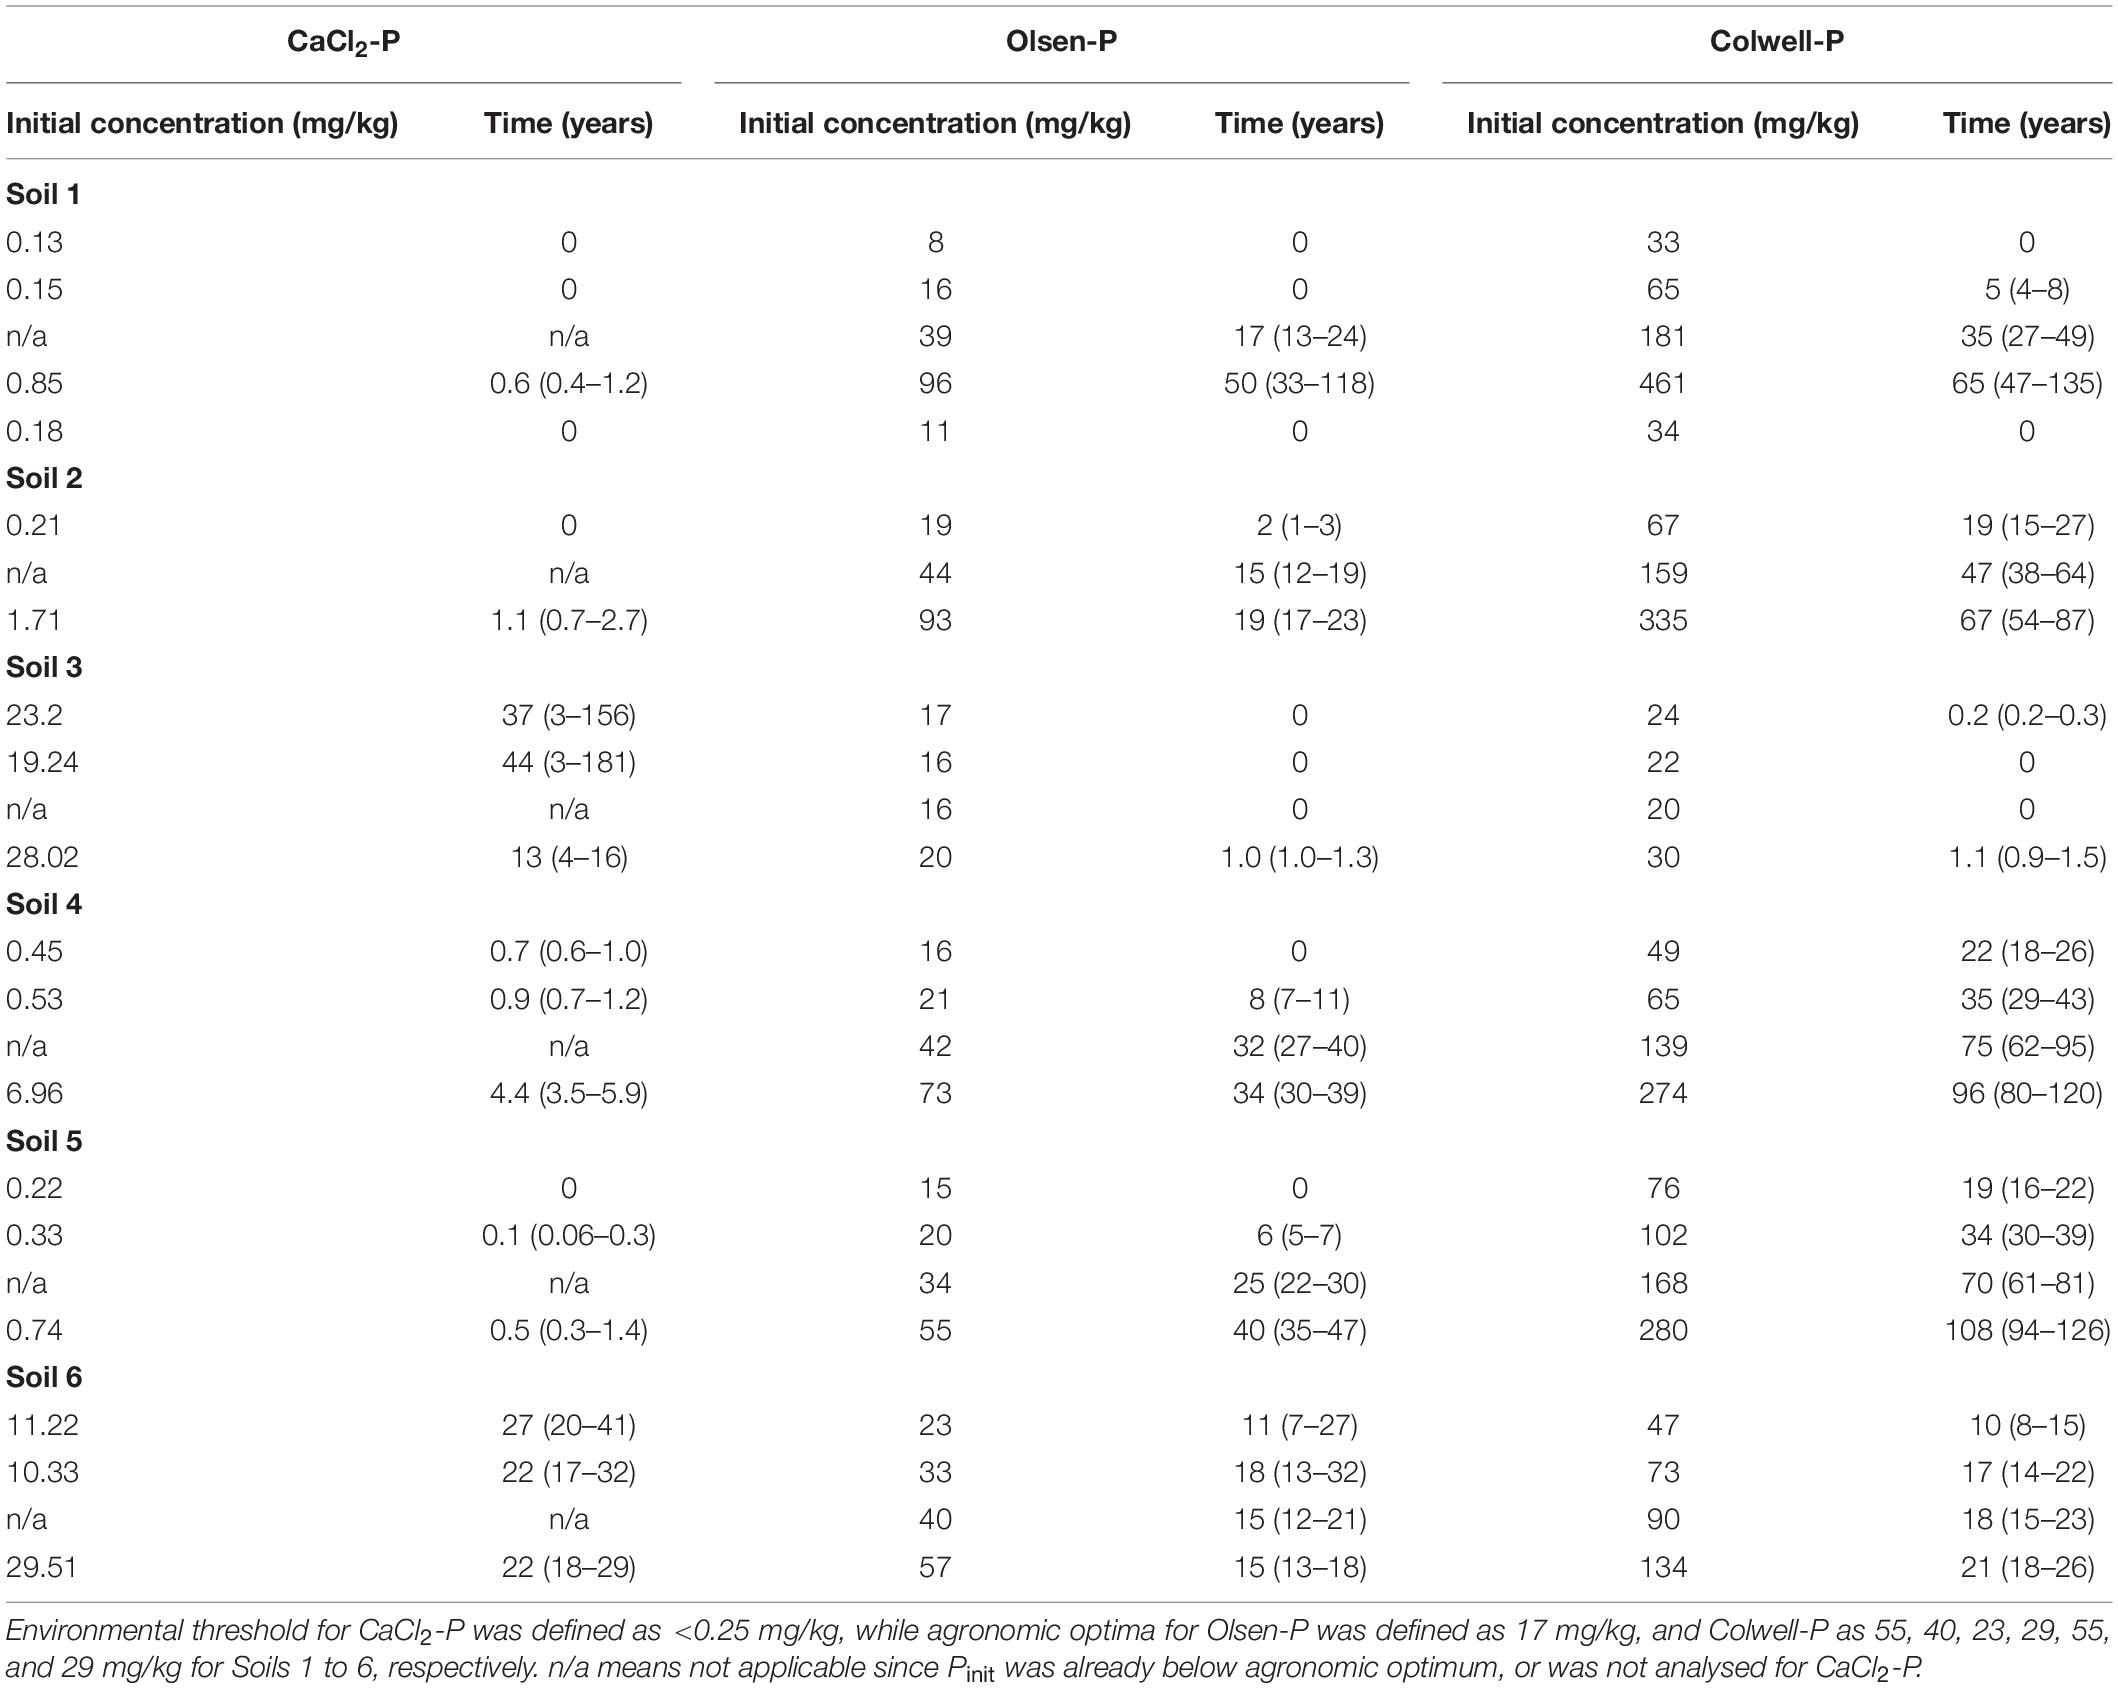
Table 5. Modelled mean time (years) and range in time (in brackets) until various initial CaCl2-P, Olsen-P and Colwell-P concentrations (mg/kg) reach environmental threshold or agronomic optima, averaged across all on-going Pferts for each soil.
Phosphorus movement from the surface 10 cm, and conversion to forms not CaCl2-P extractable, may have had a greater contribution to P decreases compared to sorption processes for Soils 3 and 6. Indeed, the greater a CaCl2-P concentration, the greater the risk of environmental loss (Burkitt et al., 2010). This is supported by the modelled Pfinal concentrations being much closer to the observed Pfinal concentrations for the very low PBI Soil 4 which had lower initial CaCl2-P concentrations than the extremely low and very low PBI Soils 3 and 6, respectively (Table 3). Final CaCl2-P concentrations for Soils 1, 2, and 5, which had much lower initial CaCl2-P concentrations and higher PBIs than Soils 3, 4, and 6, were underestimated by an average of −0.13 mg/kg (−53%).
Influence of Pfert on the Modelled Pfinal Concentration
It is important to examine the influence of Pfert on the modelled Pfinal concentration because it is a variable that the land manager can control. Whilst some land managers would rather not omit Pfert inputs altogether, soil P concentrations may still decrease if the Pfert applied is less than that required to maintain soil P concentrations. There was a range in es values (increase in extractable soil P concentration for each unit of applied P) across the soils, where smaller es values indicated soils which were less responsive to Pfert when presented in isolation from the soil effect (Table 4). Changes in P concentrations of Soils 3 and 6 were the least sensitive to Pfert when extracted with CaCl2 (Table 4); contrasting with current assumptions that relatively low rates of P fertiliser are required to increase fertility of low PBI soils (Burkitt et al., 2001). This is likely to largely be due to the on-going Pfert moving beyond the surface 10 cm of these very low PBI, coarse textured soils which receive high annual rainfall (∼1100 mm). Indeed, difficulty was encountered in increasing agronomic extractable soil P concentrations for the extremely low PBI Soil 3. Despite application of 500 kg P/ha, split over 12 months, the Olsen-P of Soil 3 only increased from 13 to 19 mg/kg. Alternatively, the high initial CaCl2-P concentrations of these soils, and conversion of the applied Pfert to forms unextractable by CaCl2, such as Po through incorporation into the plant biomass and microbial population, may have also contributed to this low sensitivity to the applied Pfert. Olsen-P and Colwell-P concentrations of Soils 3 and 6 were more sensitive to Pfert than Soils 1 and 2 which had higher PBI (Table 4). This suggests that Soils 3 and 6 had some capacity to weakly sorb P which was not CaCl2-P extractable, and/or desorb molybdate-reactive non-orthophosphate P compounds.
Influence of Soil on the Modelled Pfinal Concentration
Despite soil PBI being an important factor in determining the appropriate P fertiliser rate to increase soil P concentrations, few studies have modelled P decreases across a range of soils. Kerridge et al. (1990) reported that the negligible P sorption capacity of the soils they studied meant that a soil term did not need to be included in the model they used. However, the dataset that was used to construct the current model, showed that extractable P concentration decreases did vary according to soil.
Olsen-P and Colwell-P concentrations decreased fastest (highest ds values) for Soils 3 and 6 (Table 4 and Figure 2), despite having some of the lowest Pinit concentrations. It is thought that vertical movement of P beyond the soil sampling depth, and conversion to forms not directly extractable, were the two most likely pathways responsible for the decreases in extractable P for Soils 3 and 6. However, despite absolute decreases in CaCl2-P concentrations of Soils 3 and 6 being the largest, they had the lowest ds, suggesting the CaCl2-P concentrations of the two lowest PBI soils decreased more gradually than those of higher PBI soils (Table 4, and Figure 2). Since the CaCl2-P concentrations of Soils 3 and 6 were similar to the Olsen-P concentrations, it is possible that their high organic carbon content may have led to greater hydrolysis of Po to readily available P. The acidic molybdate-solution may cause hydrolysis of Po so that the molybdate-blue colour reaction of Murphy and Riley (1962) does not exclusively represent Pi (Haygarth and Sharpley, 2000). Thus, it is possible that the gradual decreases in CaCl2-P concentrations were partly due to decreases in Po.
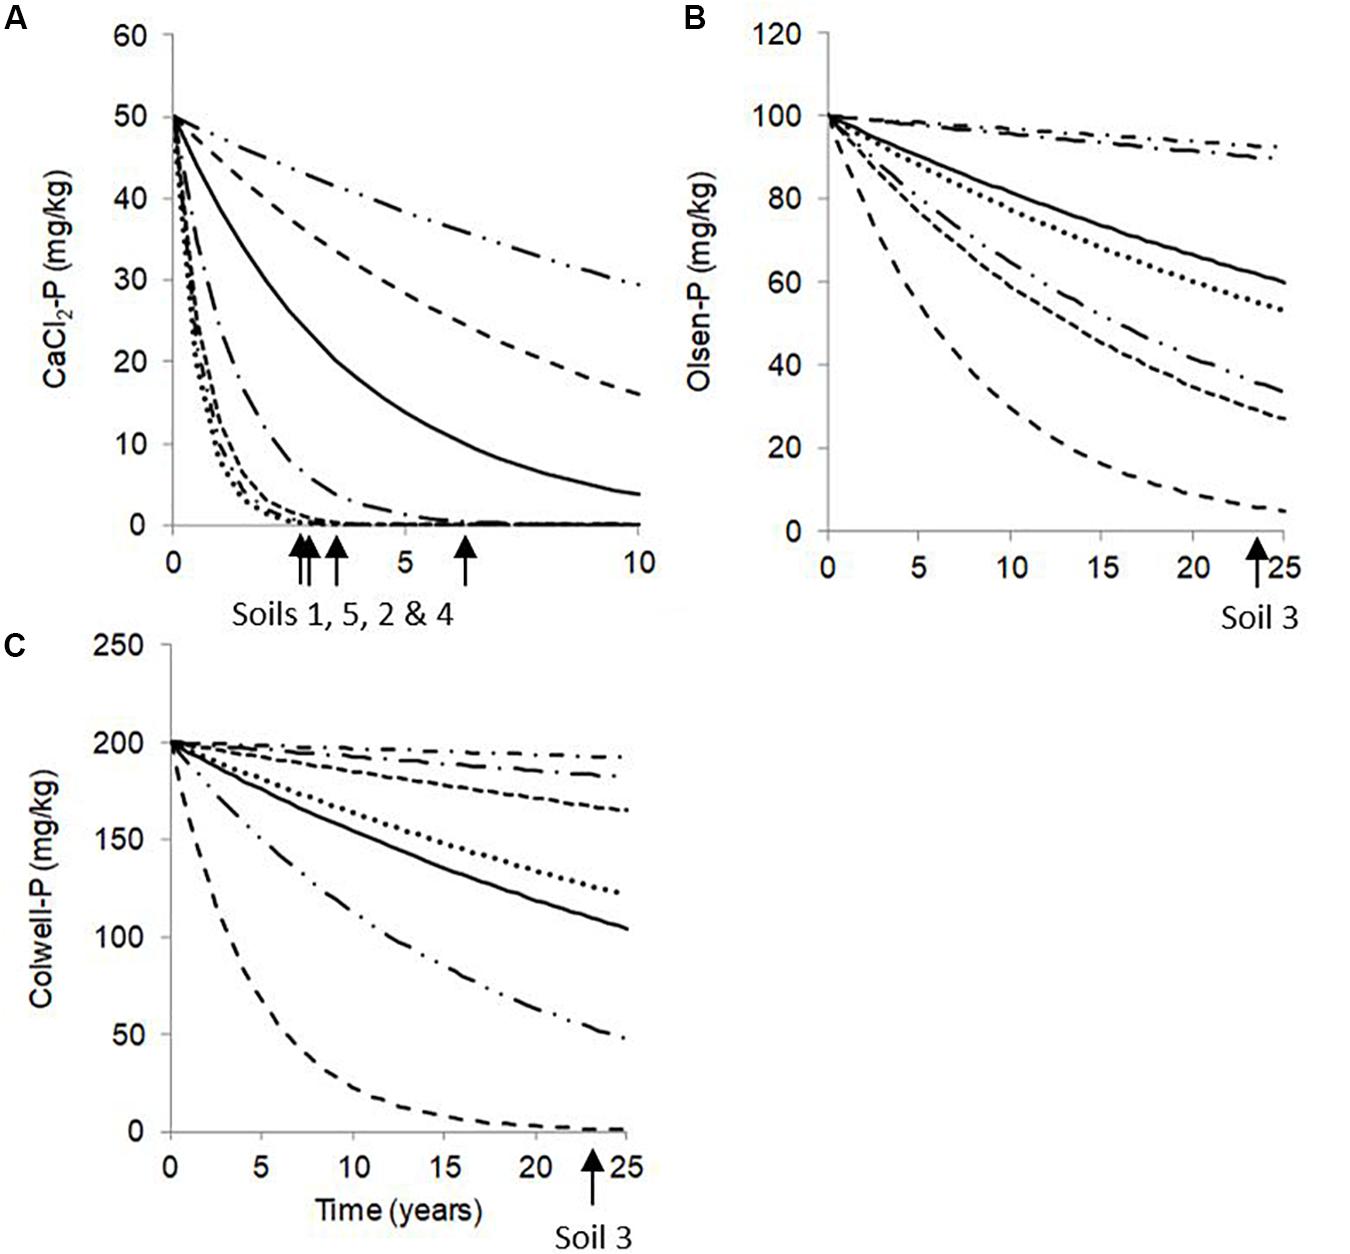
Figure 2. Predicted (A) CaCl2-P, (B) Olsen-P, and (C) Colwell-P generic curves with zero Pfert (solid lines) which used the global parameters across all soils (d0); and for Soil 1 (…), Soil 2 (- - -), Soil 3 (– –), Soil 4 (–.–), Soil 5 (-.-), and Soil 6 (–..–), using soil parameters (ds). Labelled arrows indicate the estimated time required for soils to reach environmental and agronomic thresholds. Note x- and y-axes are differently scaled.
We have successfully modelled decreases across a range of soil types, and identified varying decreases according to P extraction, soil type, and PBI. However, we acknowledge that these findings are based on a limited data set of 6 soils sampled over a period of 4.5 years and we suggest more data on P decreases across a wider range of soil types are needed before a term based on PBI can be incorporated into our model. If such a soil term could be incorporated, we suggest the accuracy of the predictions would increase further.
Influence of Pfert and Soil on Modelled P Decrease
The magnitude of the effect of Pfert was less than soil since the decreases in P were more variable between soils than between rates of Pfert (Table 4). This may in part be due to different animal product exports (2.9 to 12.3 kg P/ha.yr according to soil and soil P concentration), and potential for surface runoff and leaching of P according to soil, from the trial sites which populated our model. Schulte et al. (2010) reported that their large P deficit due to P export in fodder removed from their trial sites was the driver of P decreases (contributing 63%) for eight moderate to low PBI soils. Despite this, and the small range in PBI of the soils studied by Schulte et al. (2010) they reported a relationship between Morgan-P decreases and parent material of the individual soils that was marginally insignificant (P = 0.052). The greater influence of soil than Pfert in the current study was thought to be due to the large range of soils examined and supports the need to investigate P decreases across a more diverse set of soils which cover a wider range of P sorption and their properties.
Since there was one experimental site per soil, each of the site-level parameters corresponds to a soil type with associated properties such as PBI. However, a highly significant (P < 0.001; r2 = 0.95) linear relationship existed between Ps1000 and the dp parameter for CaCl2-P. Due to the PBI scale not being linear; i.e., a PBI of 400 does not have double the sorption capacity of a PBI of 200, there was a highly significant (P < 0.001) logarithmic relationship between PBI and the dp parameter for CaCl2-P (r2 = 0.97). There was also a significant (P < 0.05) linear relationship between Ps1000 and dp for Olsen-P and Colwell-P (r2 = 0.24 and 0.38, respectively). However, the polynomial relationship for dp of Olsen-P was stronger (r2 = 0.40) than the linear relationship, as was the exponential relationship for Colwell-P dp (r2 = 0.57). Although the parameters for this model are soil specific, information on their magnitude and interrelationship will assist in estimating decreases for other soils. For example, changes in P concentrations of low PBI soils which are coarse textured, contain high organic matter contents, and have low clay and oxalate-aluminium and oxalate-iron contents, would be expected to be different to medium and high PBI soils.
Time Until Environmental and Agronomic Optimum P Concentrations Are Reached
Based on the current data set, the model estimated that for the majority of the soils, it would take up to 2.7 years for CaCl2-P concentrations of ≤1.71 mg/kg (CaCl2-P concentrations of Soils 1, 2, 4 and 5) to decrease to an environmentally acceptable level of ≤0.25 mg/kg (0.05 mg/L) (Table 5). This is a shorter period of time than that reported by Dodd et al. (2012) of 22–44 years for surface 7.5 cm water extractable-P (WEP) concentrations of 0.039–0.141 mg/L to decrease to an environmentally acceptable level of 0.02 mg/L (0.10 mg/kg). When Dodd et al. (2012) reported WEP and CaCl2-P concentrations were plotted, there was no relationship between the two measures. This explains why Dodd et al. (2012) did not report exponential decreases in CaCl2-P for three of their four sites, while they did report exponential decreases in WEP for three sites.
Dodd et al. (2012) estimated that WEP concentrations of the two soils with the greatest P retentions (PR) would take twice as long to reach the target concentration than a soil with a lower PR. We converted the PR (%) reported by Dodd et al. (2012) to approximate PBI values using data from Burkitt et al. (2002) to conclude that the PBI range was approximately 90–600 for their lowest P fertiliser treated soils. Based on this conversion, the PBI’s of two of Dodd et al. (2012) soils were less than 150, as were three of our soils. When we modelled our two lowest PBI soils the model estimated it would take on average 20 years, ranging from 3 to 35 years, for CaCl2-P concentrations to decrease from between 19 and 28 mg/kg for Soil 3, and on average 34 years, ranging from 17 to 41 years, to decrease from between 10 and 29 mg/kg for Soil 6; to ≤0.25 mg/kg (Table 5). For our CaCl2-P concentrations to decrease to Dodd et al. (2012) WEP threshold of 0.10 mg/kg, our model predicted it would take 37 years, ranging from 4 to 53 years for Soil 3, and 47 years, ranging from 21 to 51 years, for Soil 6. While the latter mean estimates were similar to those reported by Dodd et al. (2012) for WEP, in contrast to Dodd et al. (2012) our lowest PBI soils took longer to decrease than higher PBI soils. This may be due to our initial CaCl2-P concentrations, which were greatest for the lowest PBI soils, being much greater than the respective CaCl2-P and WEP concentrations of Dodd et al. (2012). This suggests that the extreme CaCl2-P concentrations of our two lowest PBI soils, and high CaCl2-P concentrations of our high PBI soils, decreased more rapidly than those reported by Dodd et al. (2012) supporting the exponential decrease we modelled for CaCl2-P.
Our findings are in line with simple model calculations by Schoumans and Groenendijk (2000) which showed that it would take many decades before high soil P concentrations in non-calcareous low P sorbing sandy soils would be reduced to environmentally acceptable concentrations. It is assumed that Po at least partly buffers the decreasing extractable P concentrations. Considering Pi is the dominant P form in highly P fertilised soils (Dougherty et al., 2006) that are able to hold P, it is assumed that in low PBI soils which only hold small amounts of Pi, Po supply via microbial processes can buffer loss of Pi that occur via desorption.
An important finding of the model is that even if some soils are at or close to agronomic optimum, environmental losses can still occur. For the extremely low PBI Soil 3 and very low PBI Soil 6, CaCl2-P concentrations were above the environmental threshold when Olsen-P and Colwell-P concentrations were at or just above agronomic optima. These findings suggest the use of such soils for agricultural purposes could pose a long-term elevated risk to the environment as optimum agronomic production is unlikely to be achieved without a high risk of P loss. Similarly, for the low PBI Soil 4, Olsen-P concentrations below agronomic optima resulted in CaCl2-P concentrations above the environmental threshold. Since the CaCl2-P concentrations of Soil 4 were not as great as those of Soils 3 and 6, the time taken to reach the environmental threshold was less than 6 years. However, not all soils will pose an environmental risk when soil P concentrations are at agronomic optimum. From Table 5, CaCl2-P concentrations of Soils 1 and 2 were not above the environmental threshold until Olsen-P concentrations were twice, and Colwell-P concentrations three to four times the agronomic optima. For Soil 5, Olsen-P and Colwell-P concentrations at or near the agronomic optima were associated with CaCl2-P concentrations close to the environmental threshold.
The current model predicts it would take, on average, 14 years, ranging from 11 to 20 years for Olsen-P concentrations of between 34 and 44 mg/kg to decrease to agronomic optimum of 17 mg/kg. An initial Olsen-P concentration of between 55 and 96 mg/kg would take on average 32 years, ranging from 26 to 49 years, depending on the soil (Table 5). In comparison, Dodd et al. (2012) reported a shorter period of up to 7 years for initial Olsen-P concentrations (0–7.5 cm) to decrease from 51 to 25 mg/kg. This is equivalent to an initial Olsen-P of ∼43 mg/kg decreasing to 22 mg/kg if sampled to 10 cm (Coad et al., 2010) which our model suggests would take 25 years when using global d and e values. The time reported by Dodd et al. (2012) for Olsen-P concentrations to decrease to agronomic optimum was shorter than the time they reported for WEP concentrations to decrease to the environmental threshold, despite WEP decreasing at a greater rate. This suggests that the majority of the soils they studied may have soil properties similar to Soils 3, 4 and 6 of the current study, in that they cannot be maintained at agronomic optimum without environmental loss. Colwell-P agronomic optimum varies according to soil and as such, it would take on average 9 (mean range of 7 to 11 years), 47 (mean range of 39 to 59 years), and 84 years (mean range of 69 to 117 years) for initial Colwell-P concentrations of 30–90, 102–181, and 274–461 mg/kg to decrease to their respective agronomic optima for Soils 1 to 6 (Table 5).
From Table 5, and as mentioned above, there is a large range in predicted decreases for our model. Schulte et al. (2010) reported an uncertainty in their model predictions of 3 to >20 years for Morgan-P to decrease from Index 4 to 3. Dodd et al. (2012) reported an estimate of 23 years could be 21 or 31 years for WEP. Our greater range in predicted decrease period may be due to the greater range of soils used. In addition, our model extrapolated our dataset more than Dodd et al. (2012) who had field data for 7, 16, 21, and 26 years, depending on site. However, the advantage of our model, as opposed to a purely descriptive empirical one, is that the predictions beyond the observed data range are reasonable, as long as the model assumptions are valid. We suggest that the large range in Pinit concentrations of the dataset used for the current model contributed to these wide ranges, since some of our low Pinit concentrated soils had low prediction ranges, similar to those reported by Dodd et al. (2012), with the range widening as Pinit concentrations increased. In addition, the on-going Pfert would have extended some of our periods of decrease.
Conclusion
The model developed in this study has provided critical information for our long term management of soil P concentrations, as we found that decreases in soil P are generally slow (14 years (ranging from 11 to 20 years) for Olsen-P concentrations of between 34 and 44 mg/kg to decrease to an agronomic optimum of 17 mg/kg). As a result of our findings, we suggest that policy makers need realistic expectations about achievable P decreases, and land managers can be reassured of the implications of withholding P fertiliser, as soil P concentrations are unlikely to decline rapidly on these Australian pasture soils. Our findings also highlight the risk of using agronomic soil test concentration as a reliable guide to environmental risk, as some soils in the study did not exceed the environmental threshold until Olsen-P concentrations were twice, and Colwell-P concentrations three to four times the agronomic optima, whereas soils with extremely low and very low PBI values exceeded the threshold, despite Olsen-P and Colwell-P concentrations being at or just above agronomic optima.
To achieve more rapid decreases in soil P concentrations, increases in P exports in plant and animal products would need to occur in addition to withholding P fertiliser application. To enable modelling of scenarios where various P exports occur, a P export term needs to be incorporated into future versions of the model. Within the 6 soils examined in the current study, results have shown that soil with inherently very low and extremely low PBIs, require different management than higher PBI soils, in order to limit P losses i.e., application of different quantities and forms of P. However, further work on a greater range of soils types is needed to understand the influence of soil properties such as PBI on extractable soil P decreases, in order to refine this model.
Data Availability Statement
The datasets generated for this study are available on request to the corresponding author.
Author Contributions
JT completed all field sampling, laboratory and non-Bayesian data analysis, and presentation, and drafted the manuscript. RC undertook all the Bayesian modelling and assisted JT with the interpretation of these data. LB planned the field experiment and made a substantial intellectual contribution to the research, and the interpretation of data presented in this manuscript. WD made a substantial intellectual contribution in terms of the interpretation and presentation of results presented in this manuscript. All authors contributed to the article and approved the submitted version.
Funding
The authors declare that this study received funding from Dairy Australia, Impact Fertilisers Australia Proprietary Limited, and Incitec Pivot Limited. The funders were not involved in the study design, collection, analysis, interpretation of the data, the writing of this article or the decision to submit it for publication.
Conflict of Interest
The authors declare that the research was conducted in the absence of any commercial or financial relationships that could be construed as a potential conflict of interest.
The reviewer LC declared a past co-authorship with one of the authors LB to the handling Editor.
Acknowledgments
We wish to thank John and Joan Van Loon, Paul and Bernadette Bennett, Tim and Simon Bennett, David Riddoch and Jason Hall, and the Tasmanian Institute of Agriculture Dairy Research Facility for allowing us to have trial sites on their properties. This paper contains material previously published as a Ph.D. thesis (Coad, 2013).
References
ANZECC (2000). Australian and New Zealand Guidelines for Fresh and Marine Water Quality. Canberra: Australian and New Zealand Environment and Conservation Council.
Atterberg, A. (1905). Die rationalle klassifikation der sande und kiese. Chemiker Zeitung 29, 195–198.
Barrow, N. (1980). “Evaluation and utilisation of residual P in soils,” in The Role of Phosphorus in Agriculture, eds F. E. Khasawneh, E. C. Sample, and E. J. Kamprath (Madison, USA: American Society of Agronomy, Crop Science Society of America, Soil Science Society of America), 333–359.
Berger, J. O. (1993). Statistical Decision Theory and Bayesian Analysis. New York, NY: Springer-Verlag.
Borling, K., Otabbong, E., and Barberis, E. (2001). Phosphorus sorption in relation to soil properties in some cultivated Swedish soils. Nutr. Cycl. Agroecosys. 59, 39–46.
Brooks, S. P. (2003). Bayesian computation: a statistical revolution. Philos. Trans. R. Soc. Lond. Ser. A 361, 2681–2697.
Burkitt, L. L., Dougherty, W. J., Carlson, S. M., and Donaghy, D. J. (2010). Effect of variable soil phosphorus on phosphorus concentrations in simulated surface runoff under intensive dairy pastures. Aust. J. Soil Res. 48, 231–237.
Burkitt, L. L., Gourley, C. J. P., Sale, P. M. G., Uren, N. C., and Hannah, M. C. (2001). Factors affecting the change in extractable phosphorus following the application of phosphatic fertiliser on pasture soils in southern Victoria. Aust. J. Soil Res. 39, 759–771.
Burkitt, L. L., Moody, P. W., Gourley, C. J. P., and Hannah, M. C. (2002). A simple phosphorus buffering index for Australian soils. Aust. J. Soil Res. 40, 1–18.
Burkitt, L. L., Sale, P. W. G., and Gourley, C. J. P. (2008). Soil phosphorus buffering measures should not be adjusted for current phosphorus fertility. Soil Res. 46, 676–685.
Carpenter, S. R., Caraco, N. F., Correll, D. L., Howarth, R. W., Sharpley, A. N., and Smith, V. H. (1998). Nonpoint pollution of surface waters with phosphorus and nitrogen. Ecol. Appl. 8, 559–568. doi: 10.1890/1051-0761(1998)008[0559:nposww]2.0.co;2
Coad, J. (2013). Managing phosphorus in intensive pasture soils to improve the long-term environmental sustainability of the Dairy Industry. PhD thesis, University of Tasmania, Burnie.
Coad, J. R., Burkitt, L. L., Dougherty, W. J., and Sparrow, L. A. (2014). Decrease in phosphorus concentrations when P fertiliser application is reduced or omitted from grazed pasture soils. Soil Res. 52, 282–292.
Coad, J. R., Burkitt, L. L., and Gourley, C. J. P. (2010). Influence of sample depth on extractable nutrient concentration, pH and the phosphorus buffering index of pasture soils in south-eastern Australia. Aust. J. Soil Res. 48, 355–360.
Colwell, J. D. (1963). The estimation of the phosphorus fertilizer requirements of wheat in southern New South Wales by soil analysis. Aust. J. Exp. Agric. Anim. Husb. 3, 190–198.
Condron, L. M., Turner, B. L., and Cade-Menun, B. J. (2005). “Chemistry and dynamics of soil organic phosphorus,” in The Role of Phosphorus in Agriculture, eds F. E. Khasawneh, E. C. Sample, and E. J. Kamprath (Madison: American Society of Agronomy, Crop Science Society of America, Soil Science Society of America), 87–122.
Coventry, J. L., Halliwell, D. J., and Nash, D. M. (2001). The orthophosphate content of bicarbonate soil extracts. Aust. J. Soil Res. 39, 415–421.
Cox, F. R., Kamprath, E. J., and McCollum, R. E. (1981). A descriptive model of soil test nutrient levels following fertilization. Soil Sci. Soc. Am. J. 45, 529–532. doi: 10.2136/sssaj1981.03615995004500030018x
Dodd, R. J., McDowell, R. W., and Condron, L. M. (2012). Predicting the changes in environmentally and agronomically significant phosphorus forms following the cessation of phosphorus fertiliser applications to grassland. Soil Use Man. 28, 135–147. doi: 10.1111/j.1475-2743.2012.00390.x
Dougherty, W. J., Nash, D. M., Chittleborough, D. J., Cox, J. W., and Fleming, N. K. (2006). Stratification, forms, and mobility of phosphorus in the topsoil of a Chromosol used for dairying. Aust. J. Soil Res. 44, 277–284.
Dougherty, W. J., Nash, D. M., Cox, J. W., Chittleborough, D. J., and Fleming, N. K. (2008). Small-scale, high-intensity rainfall simulation under-estimates natural runoff P concentrations from pastures on hill-slopes. Aust. J. Soil Res. 46, 694–702.
European Parliament. (2000). Directive 2000/60/EC of the European Parliament and of the Council of 23 October 2000 establishing a framework for community action in the field of water policy. Official J. Eur. Commun. 372, 1–77.
Gourley, C. J. P., Aarons, S. R., Hannah, M. C., Awty, I. M., Dougherty, W. J., and Burkitt, L. L. (2015). Soil phosphorus, potassium and sulphur excesses, regularities and heterogeneity in grazing-based dairy farms. Agric. Ecosys. Environ. 201, 70–82. doi: 10.1016/j.agee.2014.12.010
Gourley, C. J. P., Melland, A. R., Waller, R. A., Awty, I. M., Smith, A. P., Peverill, K. I., et al. (2007). Data From: Making Better Fertiliser Decisions for Grazed Pastures in Australia. Ellinbank: Victorian Government Department of Primary Industries.
Haygarth, P. M., and Sharpley, A. N. (2000). Terminology for phosphorus transfer. J. Environ. Qual. 29, 10–15. doi: 10.2134/jeq2000.00472425002900010002x
Houba, V. J. G., Temminghoff, E. J. M., Gaikhorst, G. A., and van Vark, W. (2000). Soil analysis procedures using 0.01 M calcium chloride as extraction reagent. Commun. Soil. Sci. Plant Anal. 31, 1299–1396. doi: 10.1080/00103620009370514
Kerridge, P. C., Gilbert, M. A., and Coates, D. B. (1990). Phosphorus and beef production in northern Australia 8. The status and management of soil phosphorus in relation to beef production. Trop. Grass. 24, 221–230.
McCollum, R. E. (1991). Buildup and decline in soil phosphorus: 30-year trends on a typic umprabuult. Agron. J. 83, 77–85. doi: 10.2134/agronj1991.00021962008300010019x
Murphy, J., and Riley, J. P. (1962). A modified single-solution method for the determination of phosphate in natural waters. Anal. Chim. Acta. 27, 31–36. doi: 10.1016/s0003-2670(00)88444-5
Nicon Rural Services (2010). Identifying Current Limitations to Achieving Optimum Nutrient Management Practices on Dairy Farms. Contract Report, Dairy Australia. Available online at: http://www.dairyingfortomorrow.com.au/wp-content/uploads/Final-Report-Nutrient-Management-Market-Research.pdf
Olsen, S. R., Cole, C. V., Watanabe, F. S., and Dean, L. A. (1954). Estimation of Available Phosphorus in Soils by Extraction with Sodium Bicarbonate. Washington, DC: Government Printing Office.
Paris, P., Gavazzi, C., and Tabaglio, V. (2004). Rate of soil P decline due to crop uptake. Long-term curves of depletion. Agricolt. Mediter. 134, 236–245.
Paulter, M. C., and Sims, J. T. (2000). Relationships between soil test phosphorus, soluble phosphorus, and phosphorus saturation in Delaware soils. Soil Sci. Soc. Amer. J. 64, 765–773. doi: 10.2136/sssaj2000.642765x
Rayment, G. E., and Lyons, D. J. (2011). Soil Chemical Methods - Australasia. Collingwood: CSIRO Publishing.
Russell, J. S. (1977). Evaluation of residual nutrient effects in soils. Aust. J. Agric. Res. 28, 461–475.
Schoumans, O. F., and Groenendijk, P. (2000). Modeling soil phosphorus levels and phosphorus leaching from agricultural land in the Netherlands. J. Environ. Qual. 29, 111–111.
Schulte, R. P. O., Melland, A. R., Fenton, O., Herlihy, M., Richards, K., and Jordan, P. (2010). Modelling soil phosphorus decline: expectations of water framework directive policies. Environ. Sci. Polic. 13, 472–484. doi: 10.1016/j.envsci.2010.06.002
Sharpley, A. N., McDowell, R. W., and Kleinman, P. J. A. (2001). Phosphorus loss from land to water: integrating agricultural and environmental management. Plant Soil 237, 287–307.
Sharpley, A. N., and Rekolainen, S. (1997). “Phosphorus in agriculture and its environmental implications,” in Phosphorus Loss from Soil to Water, eds H. Tunney, O. T. Carton, P. C. Brookes, and A. E. Johnston (Oxon: CAB International), 1–54.
Smil, V. (2000). Phosphorus in the environment: natural flows and human interferences. Ann. Rev. Energ. Environ. 25, 53–88. doi: 10.1146/annurev.energy.25.1.53
Keywords: omit, withdraw, withhold, decline, reduce, Bayesian
Citation: Tyson J, Corkrey R, Burkitt L and Dougherty W (2020) Modelling Changes in Soil Phosphorus When Phosphorus Fertiliser Is Reduced or Ceases. Front. Environ. Sci. 8:93. doi: 10.3389/fenvs.2020.00093
Received: 19 December 2019; Accepted: 04 June 2020;
Published: 30 June 2020.
Edited by:
Tim George, The James Hutton Institute, United KingdomReviewed by:
Leo Condron, Lincoln University, New ZealandRichard McDowell, AgResearch Ltd., New Zealand
Copyright © 2020 Tyson, Corkrey, Burkitt and Dougherty. This is an open-access article distributed under the terms of the Creative Commons Attribution License (CC BY). The use, distribution or reproduction in other forums is permitted, provided the original author(s) and the copyright owner(s) are credited and that the original publication in this journal is cited, in accordance with accepted academic practice. No use, distribution or reproduction is permitted which does not comply with these terms.
*Correspondence: Lucy Burkitt, L.Burkitt@massey.ac.nz