Understanding Failure and Runout Mechanisms of the Flims Rockslide/Rock Avalanche
 Jordan Aaron
 Andrea Wolter1,2
  Simon Loew
- 1Department of Earth Sciences, Geological Institute, ETH Zürich, Zurich, Switzerland
- 2Engineering Geology, GNS Science, Lower Hutt, New Zealand
- 3Geoformer igp AG, Brig-Glis, Switzerland
The Flims rockslide/rock avalanche (FRRA) is the largest long runout landslide in Europe. This event provides a unique opportunity to study the pre-failure and failure behavior of a large rock slope, as both the source zone and deposit of this event are accessible. In this study, we perform engineering geological and geomorphic field mapping as well as stability and runout modeling in order to explore the preconditioning and triggering factors that resulted in failure of this event, and to infer the mechanisms that governed its runout. By combining these analyses, we qualitatively comment on the mechanisms that lead to the transition from a rockslide to a long runout, catastrophic rock avalanche. Our engineering geological and geomorphic field mapping has revealed that the FRRA failed along a sliding zone that features numerous, large scale steps. Previous work at the site, as well as new analysis of thin sections, has revealed the presence of marl-like layers within the failed stratigraphic unit. Our stability analysis shows that the presence of low strength layers at the depth of the rupture surface is required for failure to initiate, and that failure could be triggered either by strong seismic shaking, elevated pore-water pressures, or a combination of both. The results of the runout analysis show that this event likely remained coherent for a large portion of its motion, and that liquefaction of alluvial sediments at the toe of the slope may have enhanced the runout distance of this rock avalanche. Combining the mapping, stability and runout modeling has shown that the basal shear strength required for the runout analysis is ∼6°–10° lower than that back-analyzed for the stability of this event. Thus, a mechanism to reduce strength along the rupture surface immediately following the initial instability was required for catastrophic failure of this event. This mechanism is poorly understood at present, but is likely crucial for understanding the transition from an initially stable slope to a catastrophic, long runout rock avalanche.
Introduction
Rockslides that undergo sudden failure and transition into flow-like rock avalanches are among the most catastrophic landslide types. Understanding the mechanics governing failure and runout of these events is important to quantify the risk to people and infrastructure, and to understand how they alter landscapes. The Flims rockslide/rock avalanche (FRRA) is the largest long runout landslide in Europe. The age and deposit stratigraphy of the event have been studied extensively, however, relatively little work has been done to quantitatively investigate the source zone initiation and runout mechanisms that acted during this catastrophic event. Given its large volume, well-constrained deposit extent, and accessible location, this event provides a unique opportunity to study the transition of a rockslide into a catastrophic rock avalanche.
The drivers of rock slope failure are often divided into three categories (Glade and Crozier, 2004): (1) preconditioning factors, such as structural setting (e.g., Agliardi et al., 2001), (2) preparatory factors, such as damage propagation due to minor seismic activity (e.g., Gischig et al., 2016; Wolter et al., 2016), and (3) triggering factors, such as heavy rainfall and earthquakes. Structural preconditioning factors are often investigated through field mapping and remote sensing methods, such as photogrammetry (e.g., Wolter et al., 2016; Clayton et al., 2017). One preconditioning factor often implicated in large-scale dip slope failures in the Alps is the presence of thin, low strength layers, such as marl interbeds within a limestone sequence (Thuro and Hatem, 2010; Grämiger et al., 2016). Preparatory and triggering factors are often investigated using numerical models, in order to simulate damage accumulation over long timescales (Gischig et al., 2011), as well as the effect on short-term slope stability of transient triggering conditions (Preisig et al., 2016).
Once a rockslide has failed, several runout scenarios are possible, which depend on site specific phenomena. The rockslide may displace a few meters or tens of meters (Glueer et al., 2019), disintegrate over a number of hours (Schneider et al., 1993), or transition into a catastrophic, flow-like rock avalanche (Coe et al., 2016). If catastrophic failure occurs, a rockslide may initially slide for a significant distance, translating and rotating over 3D topography, before fragmenting and becoming flow-like (Davies et al., 1999; De Blasio, 2011; Bowman et al., 2012; Aaron and Hungr, 2016b; Moore et al., 2017). Aaron and McDougall (2019) have shown that the bulk basal shear strength that acts on the rupture surface of rock avalanches soon after failure appears to be dependent on the volume of the rock avalanche. These friction angles are often 5°–10° lower than that required for static stability (Aaron and Hungr, 2016a). Hungr and Evans (2004) noted that the failed mass typically increases its volume by about 25% as the initial rock slope fragments and becomes flow-like. This increase in volume dissipates any pre-failure pore pressures present within the failed rockslide, meaning that other mechanisms, including those that may cause pore pressure to increase again, must explain these low basal strengths.
Once fragmented, the resulting flow spreads out as a frictional fluid, with high internal strength corresponding to intergranular friction (Hungr, 2017). Rock avalanche deposits exhibit distinctive sedimentological features, which can be used to infer dynamic characteristics of rock avalanche motion (e.g., Pollet and Schneider, 2004). Examination of the sedimentology of rock avalanche deposits has revealed that the comminuted rock avalanche debris often preserves the source stratigraphy, and features numerous internal shear planes (e.g., Dufresne et al., 2016). A mixing zone is often present at the base of rock avalanche debris, where the rock avalanche has incorporated slope substrate. Taken together, these observations suggest that rock avalanches move as a high internal strength body overriding a low strength basal layer, without turbulence.
In this paper, we present a detailed analysis of the FRRA. We perform geologic and geomorphic mapping, engineering geological rock mass characterization and terrestrial digital photogrammetry. The field data is used to investigate the geologic structures controlling failure, and the geometry and lateral constraints of the failure surface. We then incorporate this data into two-dimensional stability and three-dimensional runout modeling. The stability modeling results are used to quantitatively investigate failure of the rockslide, as well as the effects of various triggers, such as increases in pore water pressure and seismic loading. A preliminary version of this work was presented by Volken et al. (2016). Runout modeling is used to quantify the strength loss required in the source zone for catastrophic failure, and to understand basal and internal mechanisms that may have acted during runout to produce the observed deposit stratigraphy. We then qualitatively combine the results from the stability and runout modeling to interpret the mechanisms that lead to the transition of this event from a rockslide to a rock avalanche.
Site Description
Since we analyze the preconditioning and triggering factors, as well as emplacement characteristics, of this event, we will refer to it as the Flims Rockslide/Rock Avalanche (FRRA), following the classification of Hungr et al. (2014). The FRRA has been the subject of numerous studies, reviewed by Poschinger et al. (2006). Here we briefly summarize some of the previous work, as well as our own observations, relevant to the present study.
The study area is located in eastern Switzerland, between Tamins and Ilanz in the Vorderrhein Valley (Figure 1). This valley trends east-west and follows the tectonic boundary between the Helvetic and Penninic zones of the Alps. The bedrock in the study area comprises para-autochthonous Mesozoic sedimentary rocks of the Panära, Mirutta, and Tschepp nappes, overlying crystalline basement of the Aar Massif. The stratigraphic sequence involved in the FRRA belongs to the Jurassic and Cretaceous Tschepp Nappe, and includes (from bottom to top) carbonates of the Quintnerkalk, Öhrlikalk, Kieselkalk, Drusberg, and Schrattenkalk units. These units have a complex tectonic history, and were affected by multiple deformation events. A regional thrust fault (Glarus Thrust) separates Permian Verrucano metasediments from the carbonates on the top of Flimserstein.
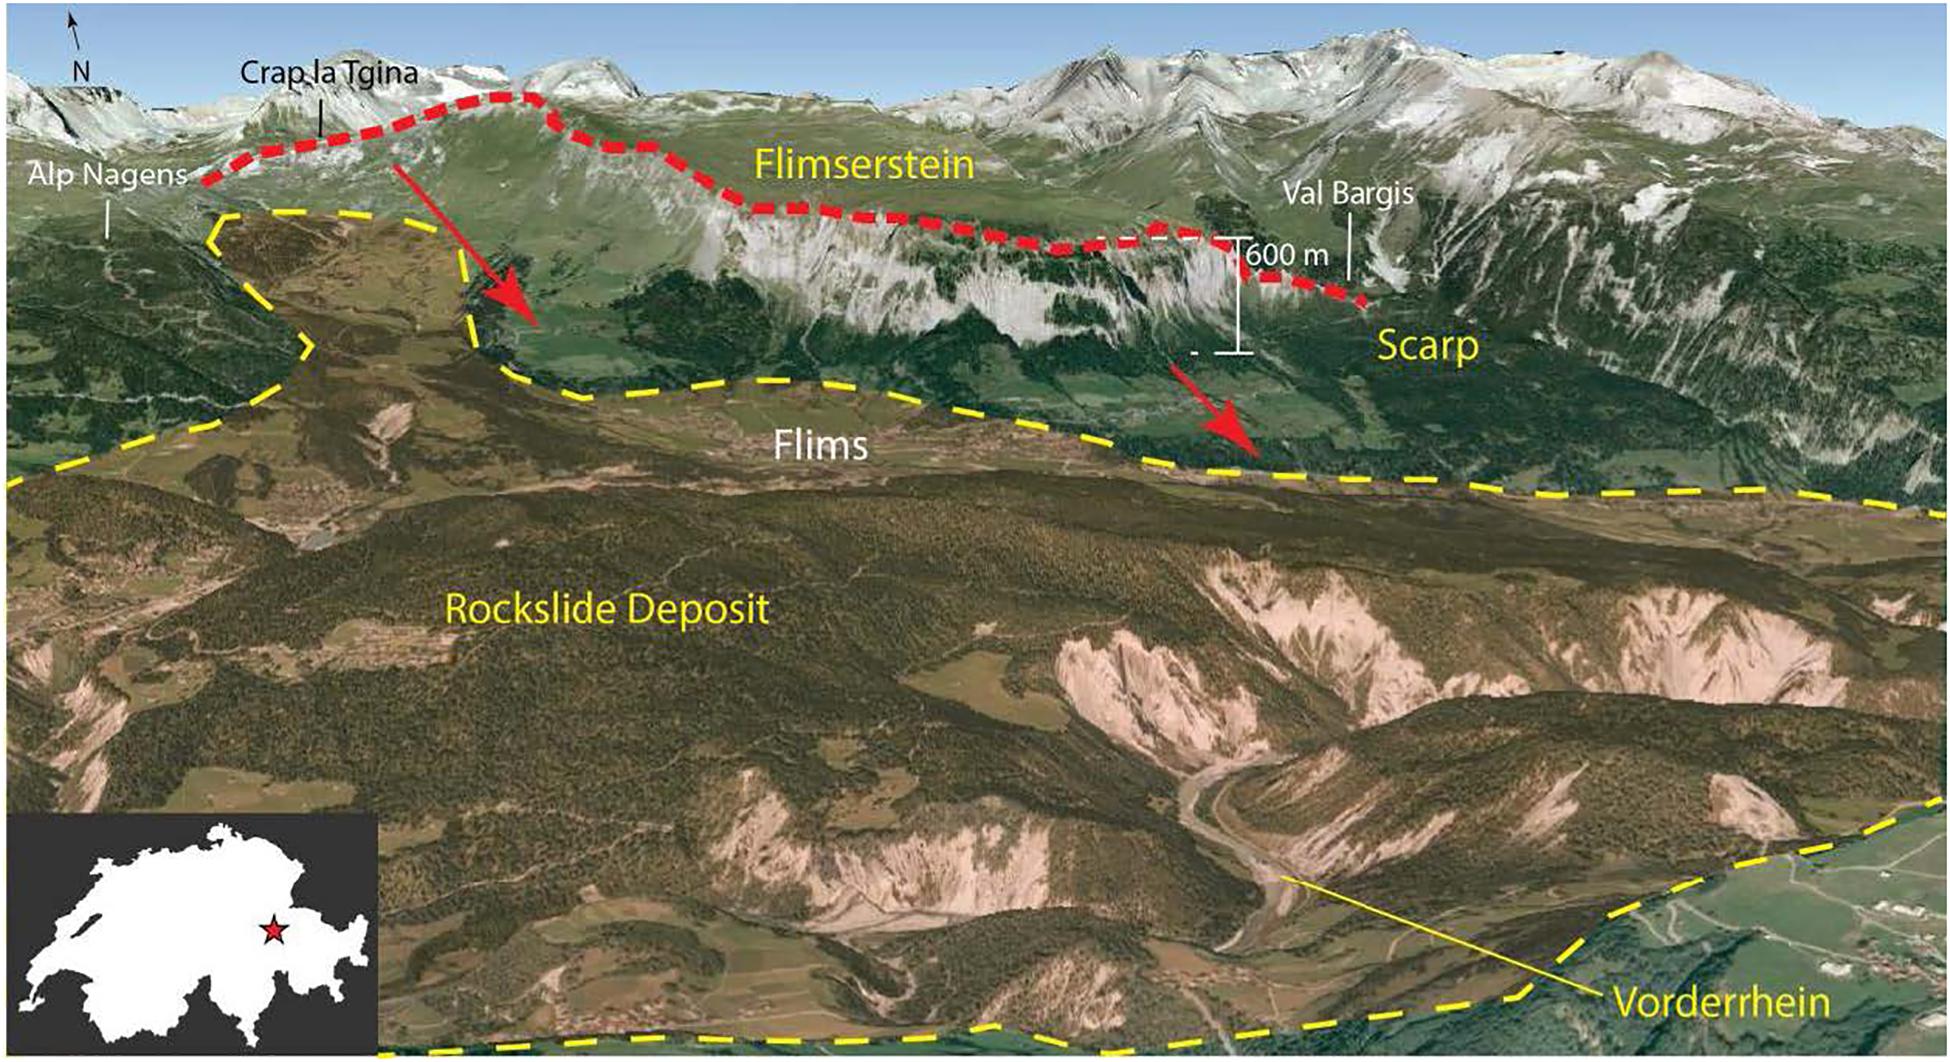
Figure 1. Overview of the study area (Imagery: Google Earth, 2009).
The FRRA was first dated by Poschinger and Haas (1997) using radiocarbon dating of wood found within the event deposits, and subsequently by Deplazes and Anselmetti (2007) using radiocarbon dating of organics found in lake deposits. The event was subsequently dated by Ivy-Ochs et al. (2009) using cosmogenic 36Cl and 10Be. These studies resulted in an event age of ∼8900 years BP, and suggested that the FRRA occurred as a single event. This age corresponds to the early Holocene, a warmer and wetter period (Ivy-Ochs et al., 2009).
Caprez (2008) provides what is, to the authors knowledge, the most detailed estimate of the volume of both the source zone and deposit of the FRRA. The deposit was subdivided into fragmented rock deposits in the valley, fragmented rock deposits on the rupture surface, mobilized alluvium (which formed the Bonaduz Gravel, discussed below), and fragmented rock deposits that have been eroded by the Vorderrhein river after emplacement of the debris. Based on estimates of the deposit volume in these zones, Caprez (2008) suggested that the volume of fragmented rock is 10.1–10.8 km3, which includes an estimate of 1.48 km3 of debris that has been eroded by the Vorderrhein River after emplacement of the event. A further 0.7 km3 of alluvium was estimated to be mobilized. Caprez (2008) reconstructed the volume in the source zone, which resulted in an estimate of ∼7.2 km3. The bulking factor, defined as the ratio of the volume of fragmented rock to the initial source volume is therefore ∼1.5, which Caprez (2008) noted was higher than for other rock avalanches (a typical value of 1.25 is given in Hungr and Evans, 2004). As noted above, bulking is caused by the creation of pore space in the rock avalanche debris due to disaggregation along pre-existing joint planes, and fragmentation of intact rock.
The stratigraphy of the Flims deposit is complex, but has been divided into two main facies (Pollet and Schneider, 2004; Poschinger et al., 2006). These include a well-structured, internal facies, and a coarse upper facies, consistent with the facies model presented in Dufresne et al. (2016). The internal facies is intensely fractured; however, features of the source stratigraphy are preserved in the comminuted debris, despite being displaced several kilometers (Pollet and Schneider, 2004). The internal facies is separated by discrete internal shear planes, leading to a proposed “slab-on-slab” kinematic model for the displacement of the rockslide debris (Pollet et al., 2005).
The Bonaduz Gravel, comprising well-graded, coarse-grained material, outcrops on the eastern flank of the rock avalanche deposits and presents a unique feature associated with the FRRA event (Pavoni, 1968; Poschinger et al., 2006; Poschinger and Kippel, 2009; Calhoun and Clague, 2018). The most recent interpretation of the Gravel (Calhoun and Clague, 2018) suggests emplacement during a massive hyperconcentrated flow, triggered by the Flims rock avalanche impacting a lake. Of particular importance to the present study is an outcrop mapped at Trin station, where Bonaduz Gravel flows up through rockslide debris, providing field evidence for liquefaction of these alluvial sediments.
Morphology of the Source Zone
We have undertaken geologic and geomorphic mapping in order to interpret the morphology of the source zone, and the likely pre-failure stratigraphy of the FRRA. The headscarp and eastern lateral scarp of the FRRA are well-defined. The headscarp is 1800 m long and has a relatively low relief of ∼40 m. The western lateral margin of the FRRA is poorly defined; however, a bouldery ridge is located above Platta, corresponding to the assumed margin (Figure 2). The L-shaped eastern lateral scarp is ∼8500 m long and follows the cliffs of the Flimserstein (Figure 2). These cliffs have heights of 30–45 m in the headscarp area, and reach heights between 400 and 500 m at the front of the Flimserstein. The impressive side scarp of the FRRA is about 4450 m long, and has a height of over 500 m. This feature extends from Fil de Cassons in the north to Piz Aulta in the south (Figure 2) and has three dominant dip directions: (i) SW in the northern and mid sections (dip direction 240°–250°), (ii) SSW in the southern section faces (dip direction 220°), and (iii) S in some intermediate steps that are each less than 400 m in length (Volken et al., 2016).
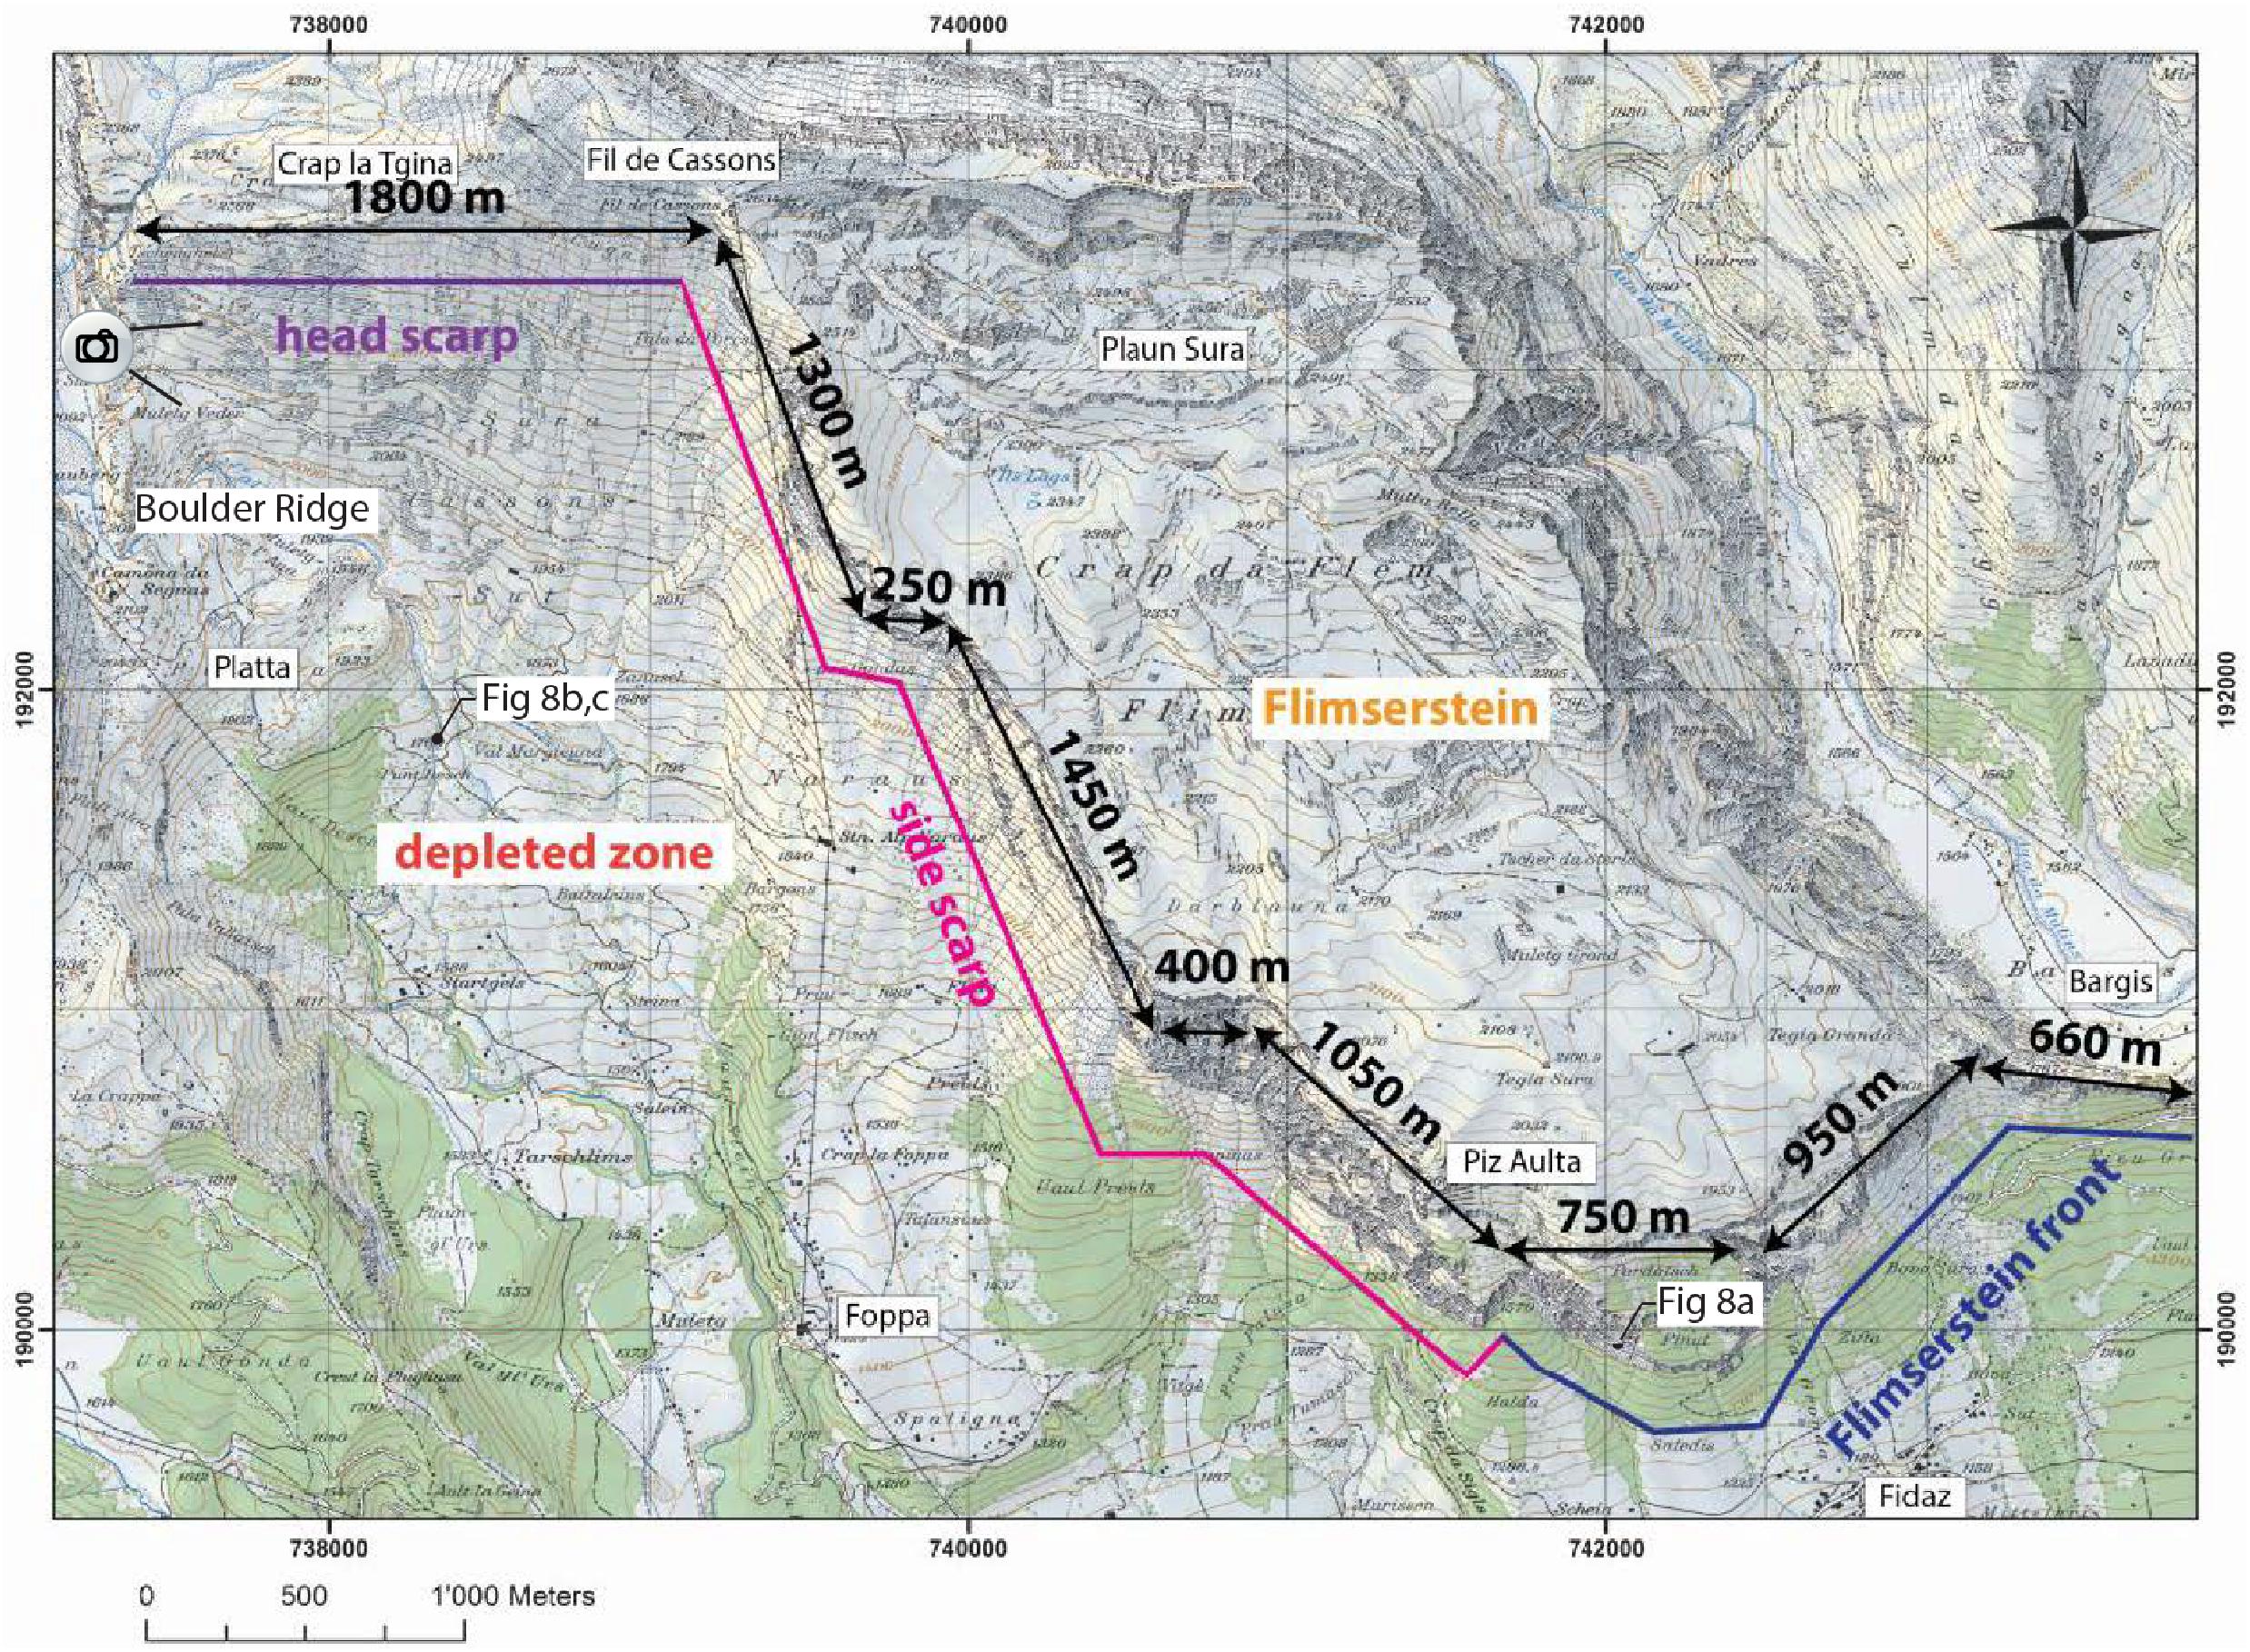
Figure 2. The Flims Rockslide scarp, separated into its headscarp, lateral scarp, and the front of the Flimserstein. The location of where the image shown on Figure 3, top was taken is shown above Platta.
As shown on Figure 3, the entire stratigraphic sequence is visible in the side scarp, and tectonic faults are visible in the Cretaceous carbonate units. These faults do not all appear to continue in the underlying Quintnerkalk. The faults at Fil de Cassons and Pala da Porcs show signs of tectonic movement. Faults also appear on the surface of Flimserstein (Volken et al., 2016). An interpreted geological cross section is shown in Figure 3, based on Volken (2015).
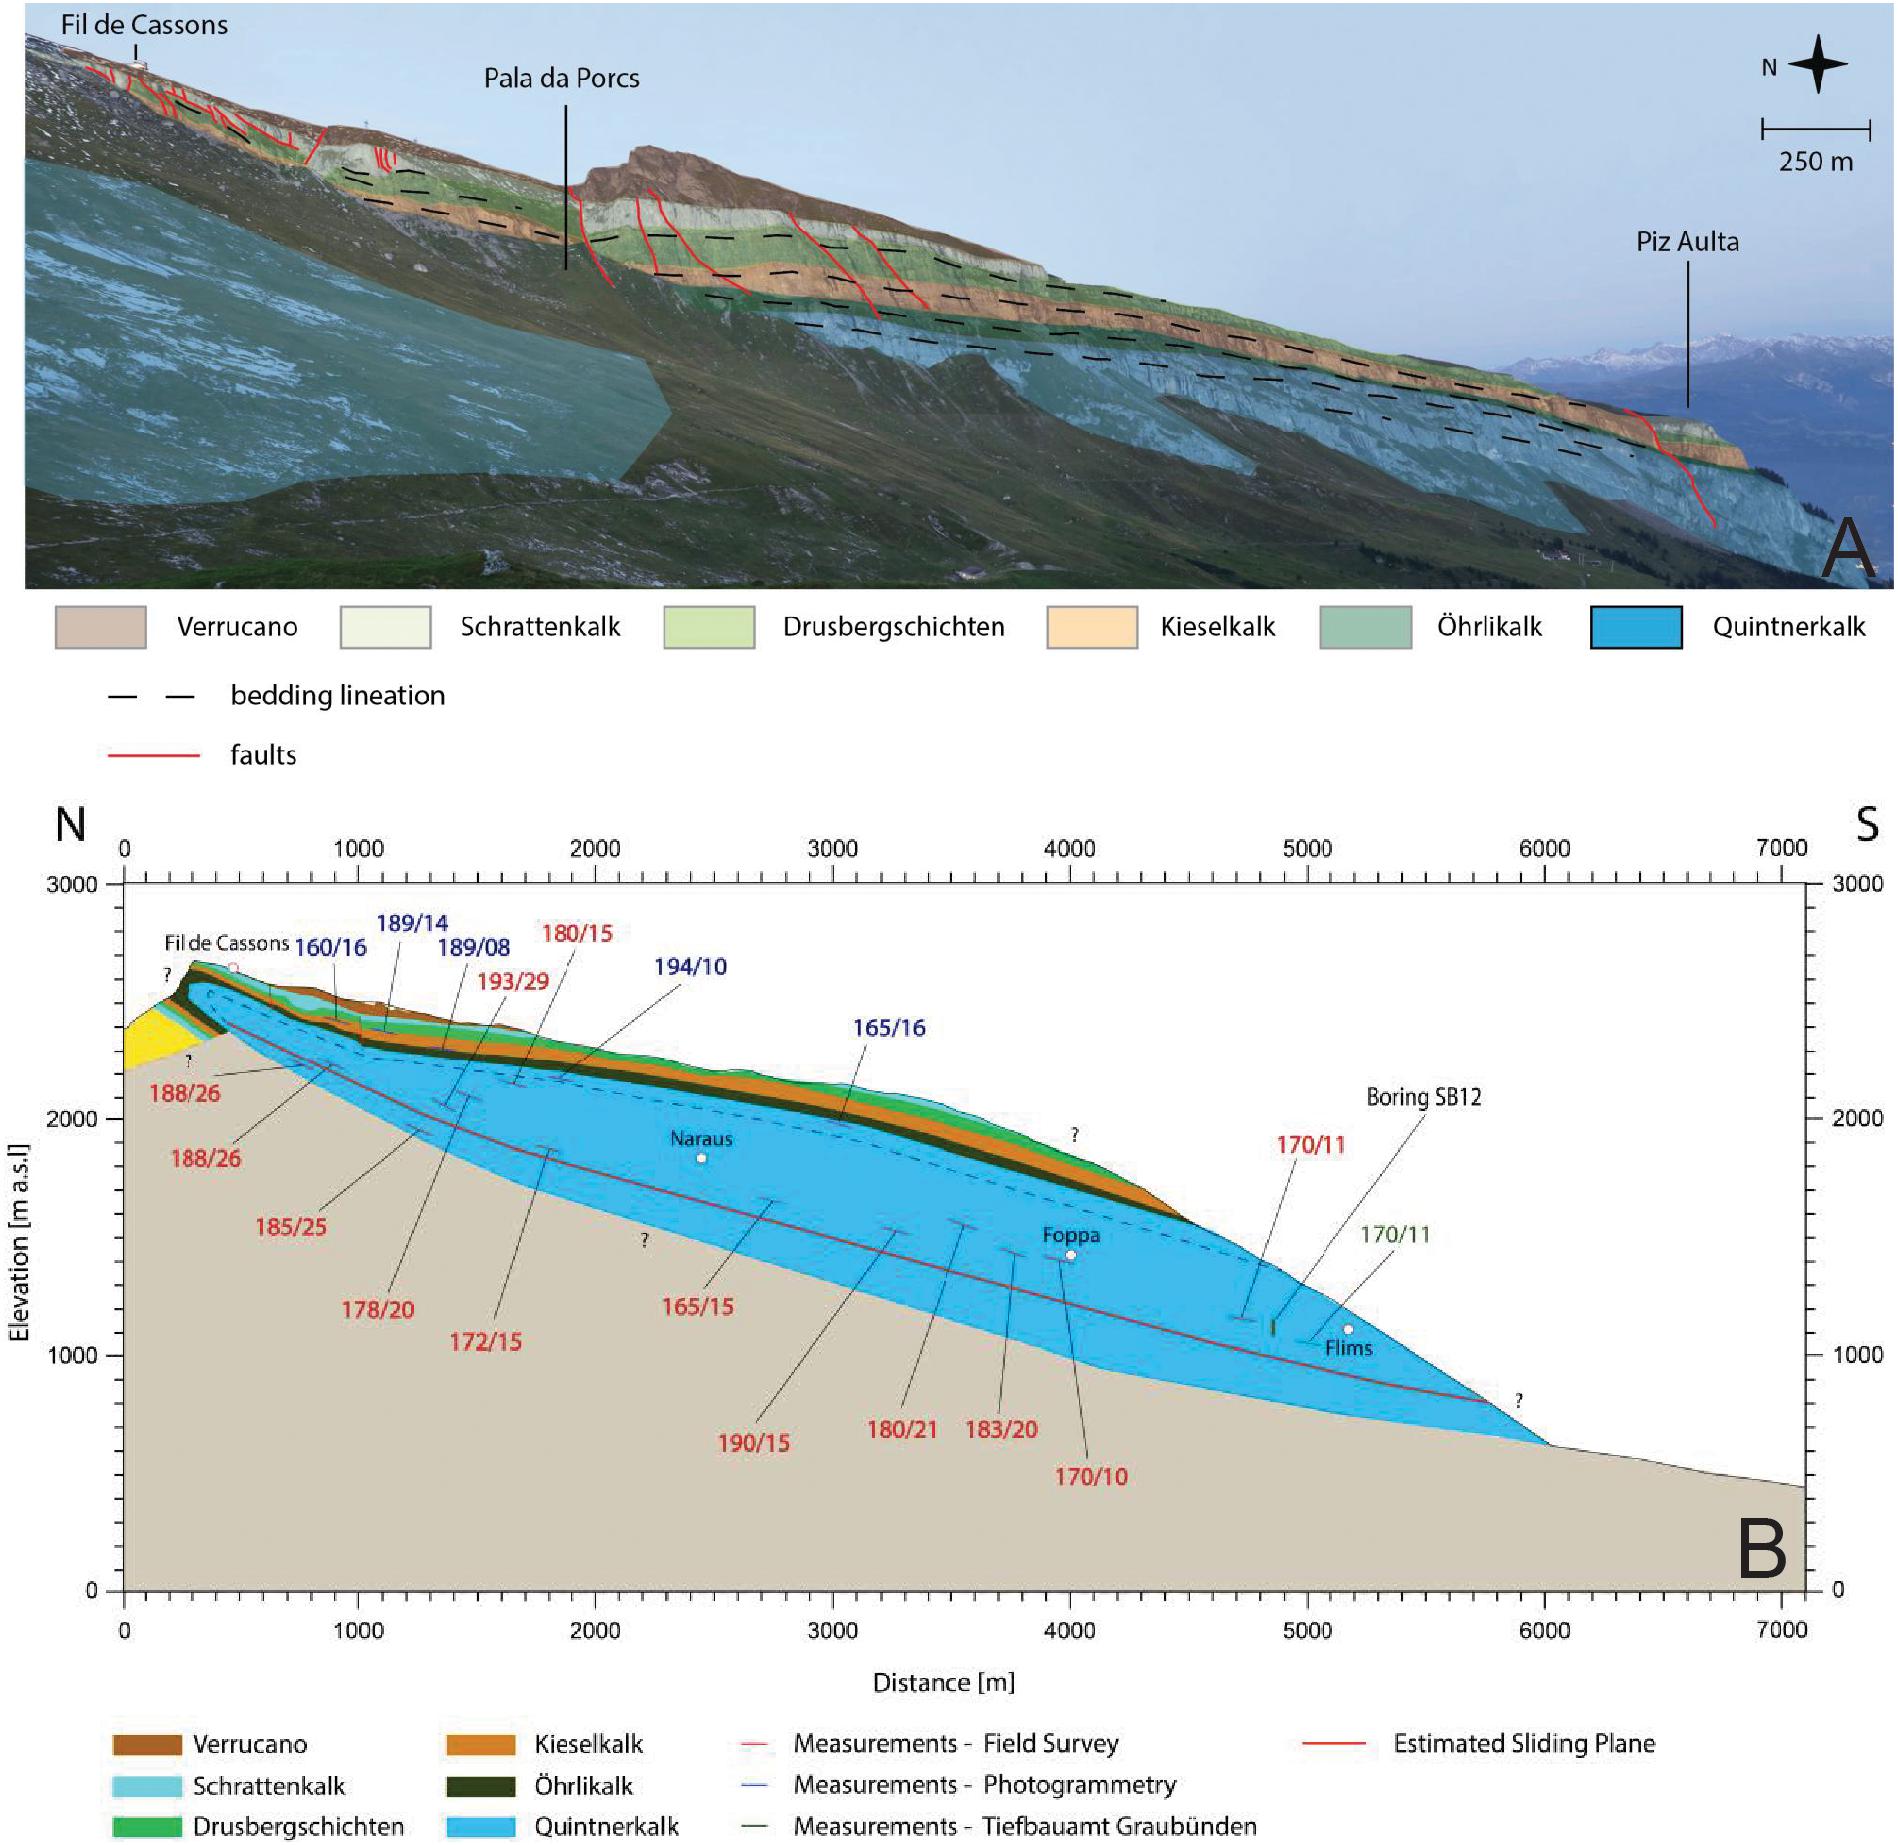
Figure 3. Top: Image of the side scarp, showing site stratigraphy and steep faulting. The location of where this image was taken is shown on Figure 2. Bottom: Reconstructed geological profile with bedding plane orientations; the section line is shown on Figure 4.
The main zone of depletion (Figure 2) is framed by the scarps and deposit of the FRRA. This zone features exposures of the sliding surface scar, rockslide deposits and colluvial material. Deplazes (2005) described the upper region of the depleted zone in detail. The sliding zone of the FRRA is located within the Quintnerkalk, which contains marl layers of 5–15 cm thickness (Buechi and Mueller, 1994). These marl layers are not very obvious in the field, but have been found in subsurface drillings (Buechi and Mueller, 1994). The sliding zone includes several very persistent (>1 km long) SW-NE to E-W oriented steps with heights up to 80–150 m. Thus, the rupture zone is not a discrete, single surface, and it likely exploits multiple horizons within the source stratigraphy. Dip directions of the sliding planes within the sliding zone range from 135° to 205°, and dip angles from 10° to 30°.
Materials and Methods
Rock Mass Characterization and Engineering Geomorphological Mapping
The rock masses involved in the FRRA were characterized through field investigations, such as mapping, scanlines, and spot measurements, laboratory and in situ testing, and mapping on aerial LiDAR and orthoimagery and long-range terrestrial digital photogrammetry models (cf. Figure 4).
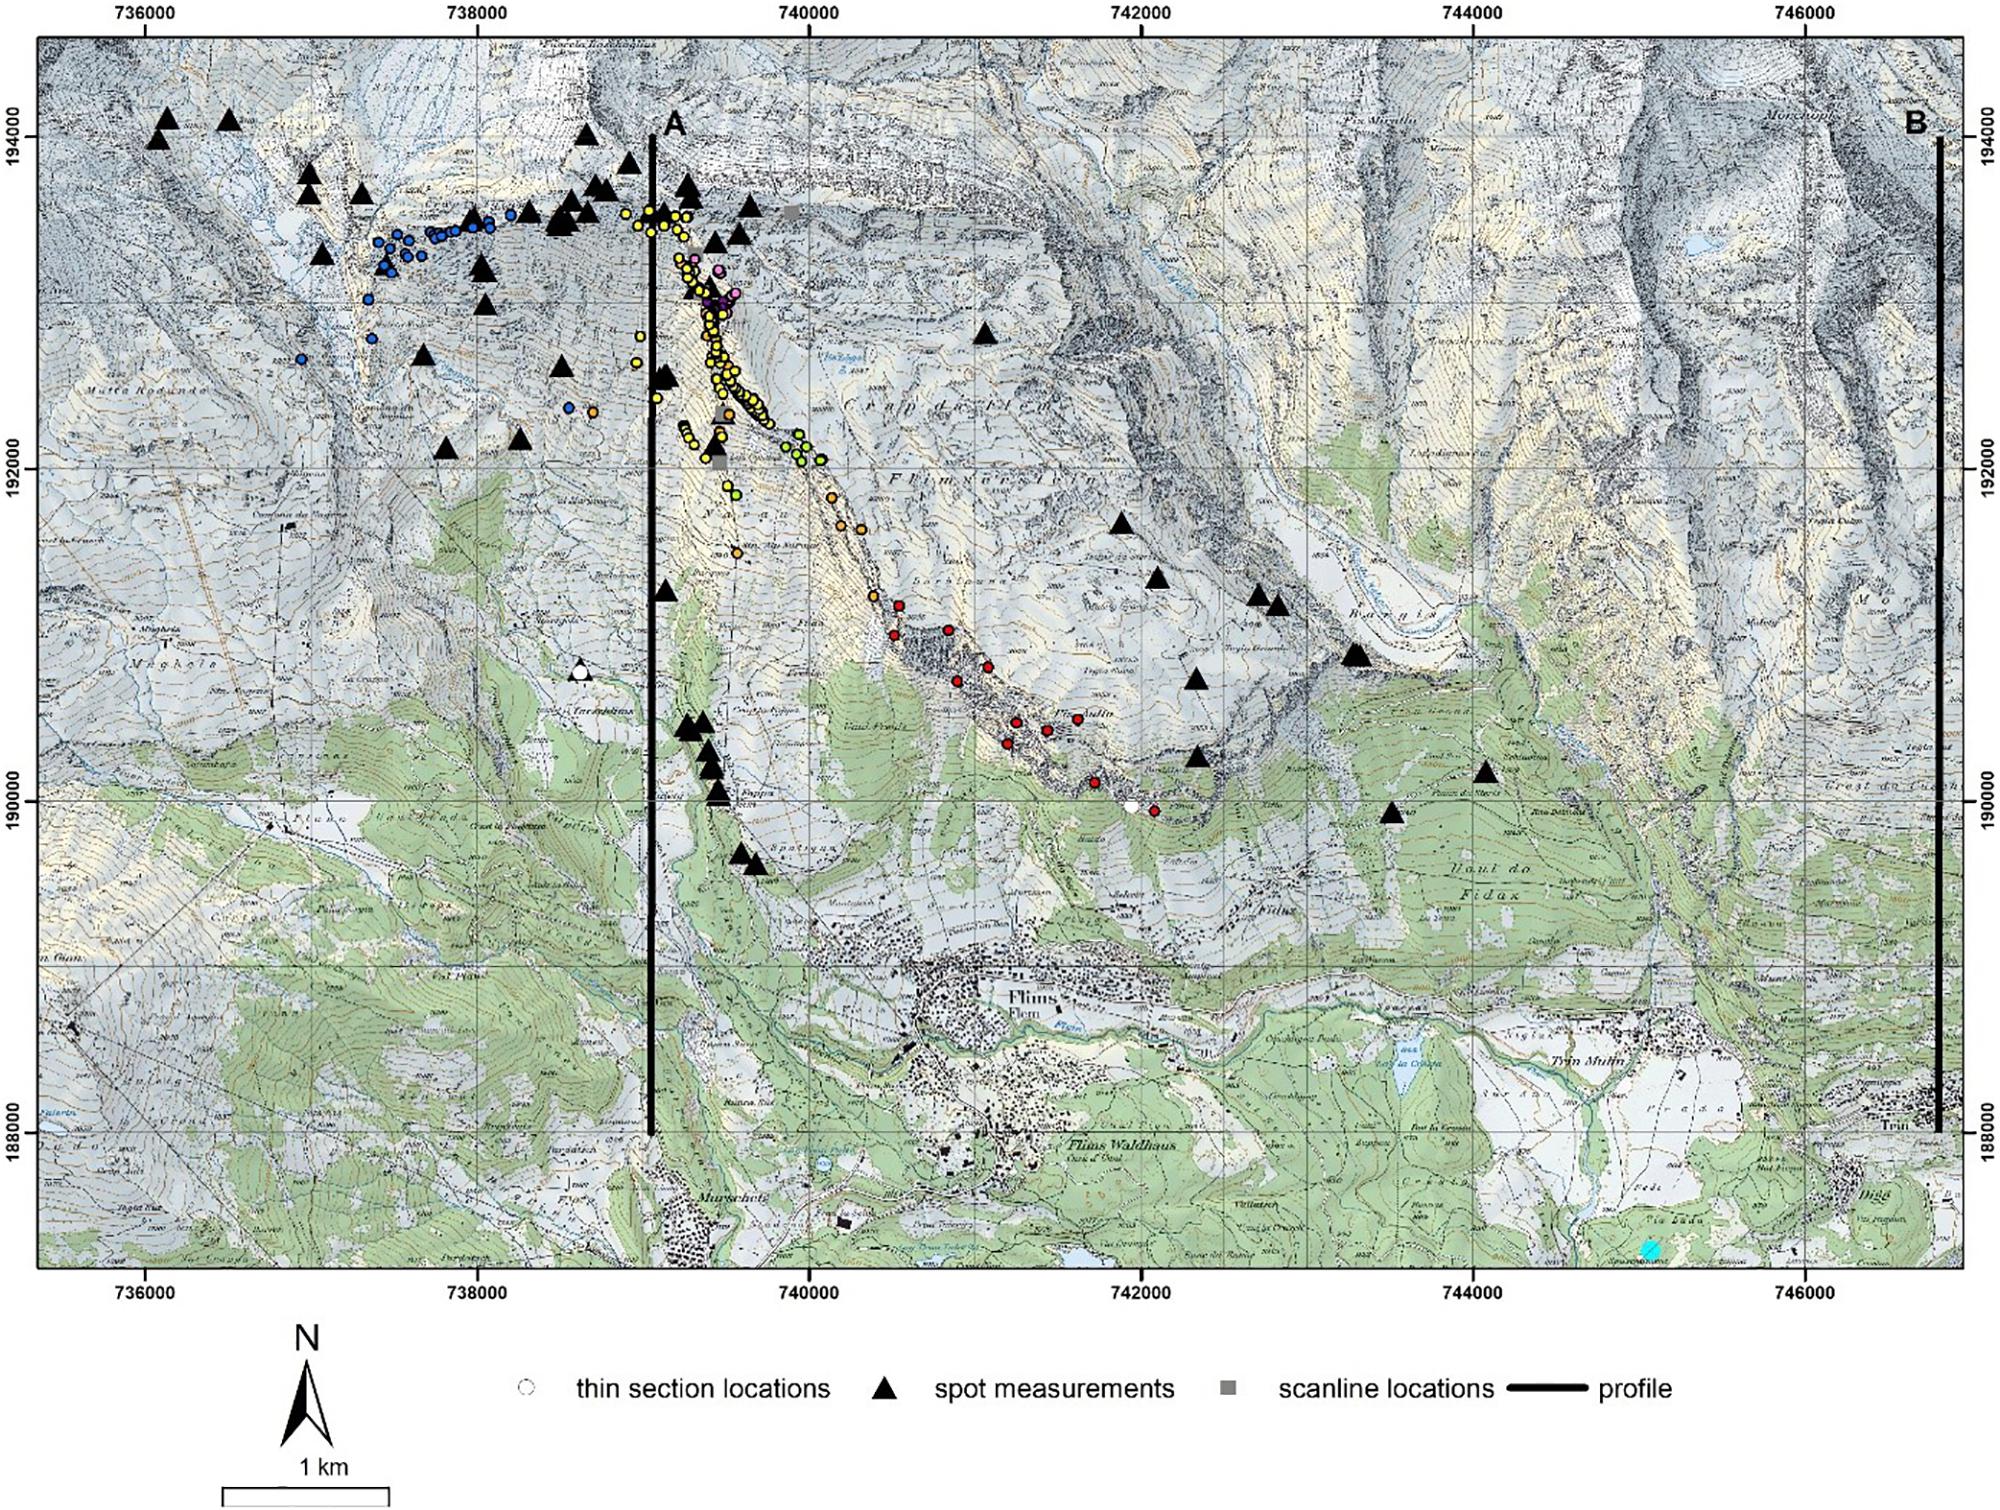
Figure 4. Locations of spot measurements, scanlines, and profiles. Profile B was used to reconstruct the pre-failure surface along profile A, given similar slope geometries. Profile A was used as the modeling profile (see section below). Colored points are reference points used in the 10 photogrammetry models, represented as different colors for each model generated.
Field mapping included a description of lithology, weathering grade, water condition, and geological strength index (GSI), as well as measurement and characterization of discontinuities. Discontinuity characterization included dip, dip direction, spacing, roughness, persistence, and aperture. Four scanlines along the side scarp and one on the surface of Flimserstein, as well as 223 spot measurements, were completed. In total, 431 discontinuities were measured and characterized in the field. Field and laboratory testing included Schmidt Hammer, Brazilian and Point Load tests on each of the lithological units (Quintnerkalk, Oerhlikalk, Kieselkalk, Drusbergschichten, Schrattenkalk, and Verrucano). Two thin sections of potential marl layers and the Flims basal sliding zone were analyzed to compare the properties of the sliding body and the equivalent in situ rock masses.
Given the large study area and mostly inaccessible outcrops, we created 10 long-range terrestrial photogrammetry models, using a Canon 6D camera with a 70 mm focal length lens and a Nikon D80 camera with a 135 mm lens. The imagery data was processed with the 3DM Analyst Suite (AdamTechnology, 2015), and georeferenced using control points measured with a Vectronix AG tachymeter. Overall accuracy ranged from 1.6 to 29 cm depending on distance to the face (55–1000 m). Mapping of discontinuity orientations and dimensions was conducted in 3DM, with a total of 1132 discontinuities mapped. Imagery of the surface of Flimserstein captured using a Hexacopter XR6-mounted Sony ILCE-6000 with a focal length of 19 mm supported terrestrial photogrammetry interpretations.
Engineering geomorphology mapping of the depletion zone of the FRRA and Flimserstein included identification of persistent tectonic structures, slope changes (concave, convex), and morphological features and processes.
Stability Modeling
To analyze the possible kinematic mechanisms, preconditioning factors and triggering mechanisms of the FRRA, we applied kinematic, limit equilibrium, and finite element (FEM) analysis. These analyses are the first of the FRRA; hence our aim was to test hypotheses related to the overall stability of the initiation zone using equivalent conceptual models, not to produce detailed models. In particular, we assessed (i) the need for an equivalent weak layer in the stratigraphy to initiate failure, (ii) the role of pre-existing discontinuities in governing failure kinematics, and (iii) the influence of high pore pressures and seismic loading as potential triggering mechanisms. As we use two-dimensional models, we do not explicitly capture the effect of lateral constraints on failure. Additionally, our model cross section does not intersect any large steps in the sliding surface, so we do not explicitly consider the role these steps may have played. Consideration of these more detailed aspects is beyond the scope of the present analysis.
Kinematic analyses were conducted in DIPS (RocScience, 2015), and provided initial constraints on the kinematic behavior of the FRRA, including a first estimate of the strength required to initiate planar sliding. The limit equilibrium and finite element models, performed using the numerical models Slide and Phase2/RS2 (RocScience, 2015), provided an estimate of the influence of weak layers on the stability of the slope, and the role of elevated pore pressures as a potential triggering mechanism. Finally, more advanced FEM simulations were used to further investigate how pre-existing discontinuities influence failure kinematics, as well as how seismicity may have acted as a triggering mechanism.
For the two-dimensional Slide and Phase2 models, a pre-failure cross-section was reconstructed based on Caprez (2008), as well as the geometry of the surrounding topography. Pre-failure geological contacts and the estimated sliding surface were projected onto this profile based on structural measurements. The resulting cross-section is shown in Figure 3B.
Since this is a prehistoric event, material properties needed for our stability models are difficult to directly measure. Therefore, we based the properties used in our models on a combination of field and laboratory data, literature values and back-analysis. Our approach was to initially test models that were parameterized using our field and laboratory data, and then adjust certain parameters, such as basal resistance, until failure is simulated to occur. The back-analysis results indicate the strength required for failure, and, as in the case of the potential role of weak layers in the site stratigraphy, can’t be directly measured in the field and/or laboratory. We also conducted an extensive sensitivity analyses of multiple parameter combinations before arriving at the most likely equivalent modeling scenarios.
For the kinematic analysis, we initially assumed a friction angle of 35°, to test whether sliding failure would be expected assuming the strength properties of the massive, strong Quintnerkalk unit. Material properties used for the Slide and Phase2 models are presented in Table 1, and the location of the main rupture plane was specified based on field investigations. Two sets of material properties were assigned to the rupture plane: (i) weak Quintnerkalk, to test if failure could occur in the absence of a weak layer, and (ii) marl-like properties. All other units were grouped into a single unit and assigned Quintnerkalk properties. The limestones (Öhrlikalk, Kieselkalk, Drusbergschichten, and Schrattenkalk) have similar geomechanical properties, and both these units and the Permian Verrucano units only act as body forces. Bedding parallel planes of weakness were represented using the generalized anisotropic material function in Slide.
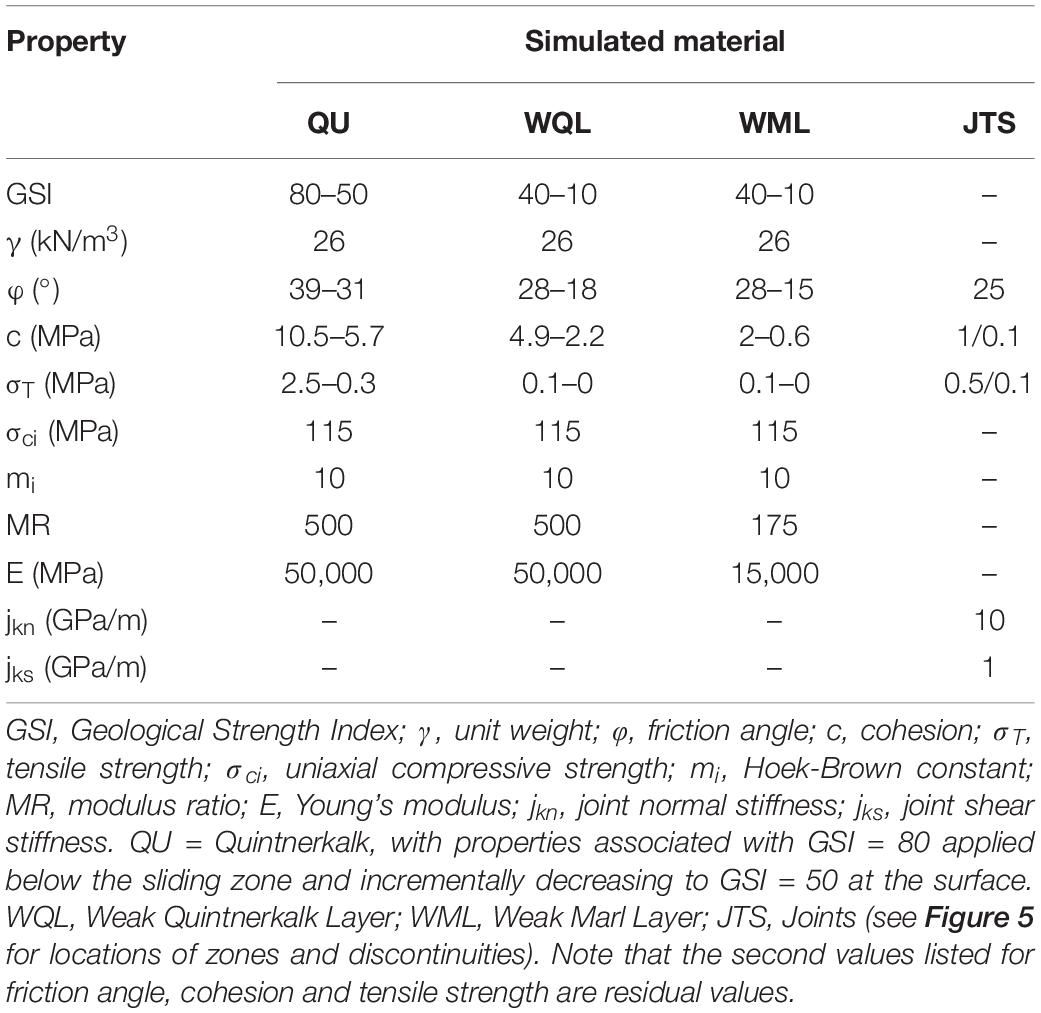
Table 1. Material and discontinuity properties used for the Slide and Phase2 models.
In Phase2, in-situ stresses were modeled as gravitational stresses, and materials were modeled as isotropic Mohr-Coulomb materials. Two methods were used to represent the rock mass: (i) equivalent rock mass strength properties using the GSI approach (Hoek, 2007), and (ii) direct integration of simplified fracture networks into the model. In both models, weathering and erosion were accounted for by using lower GSI values near surface (GSI = 50) than at the base of the model (GSI = 80).
Both high pore pressures and seismicity were considered as potential triggers. As data regarding pore pressures within the prehistoric failure cannot be obtained, we tested both high and low groundwater tables that are typical of fractured and karstified limestone aquifers in the Alps. The low water table was assumed to be below the failure surface, and hence would not have influenced failure; no groundwater level was included in models for this case. We assumed that the high water table lies between 100 and 300 m above the sliding zone, and generally follows the shape of the topography (Figure 5). The assumed high water table likely corresponds to a condition of elevated pore pressure within the sliding mass directly after a significant recharge event. The effect of seismicity as a potential trigger of the FRRA was analyzed using pseudo-static FEM simulations. The input seismic coefficients were selected based on the historical Churwalden earthquake, which occurred in 1295 ∼20 km south-east of the study site, and had an estimated magnitude of 6.5 (Schwarz-Zanetti et al., 2004). Using the methodology presented by Pyke (1991), this magnitude results in estimated seismic coefficients ranging between 0.1 and 0.3. These coefficients are in good agreement with those estimated for a 1:10,000 year return period earthquake in the study region by the Swiss Seismological Survey (Wiemer et al., 2016).
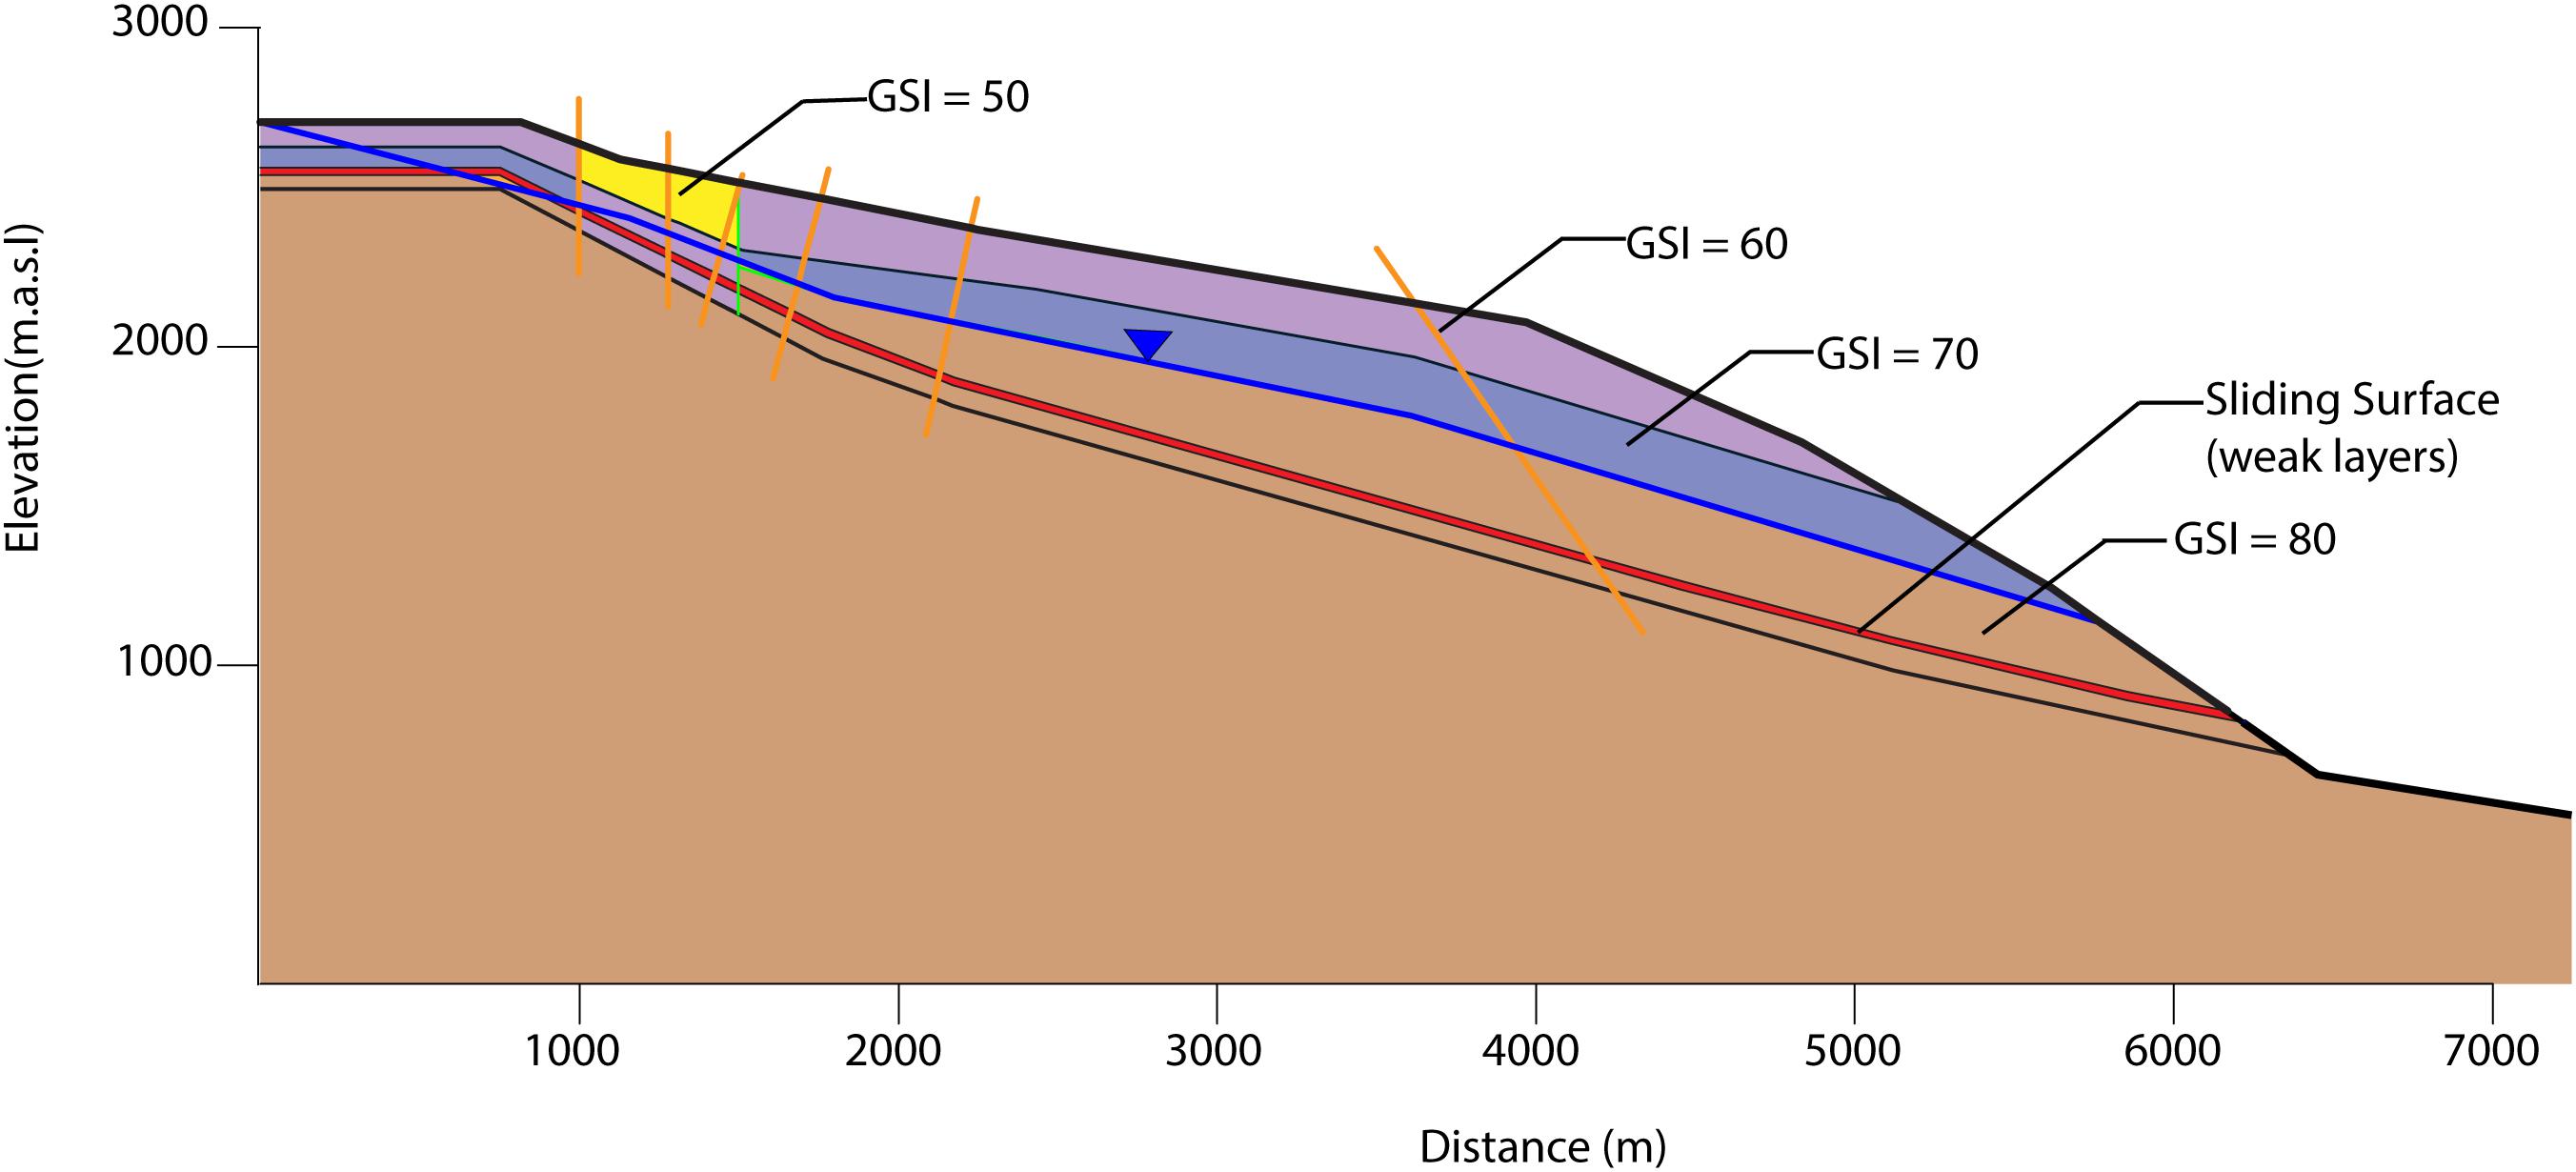
Figure 5. Example of geometry and material properties of a GSI model in Phase2. Orange lines indicate discrete fault locations and the expected sliding surface, shown in red, is modeled either as disintegrated Quintnerkalk or a marl-like layer in all models. The blue line represents the assumed groundwater table position (about 100–300 m above the failure surface) in the “wet” case.
Runout Modeling
Runout modeling was performed using Dan3D-Flex (Aaron and Hungr, 2016b; Aaron et al., 2017). Initially, Dan3D-Flex simulates the motion of a “flexible block,” which rotates and translates across 3D topography. At a user-specified time, the physics of the block changes to that of a frictional fluid, and the motion of the failed mass is simulated with the original Dan3D algorithm (McDougall and Hungr, 2004). By combining both a solid and fluid mechanics solver, Dan3D-Flex can, in a simplified way, simulate the initial sliding phase of motion, as well as the fluid phase after the mass has fragmented and turned flow-like. During the solid mechanics portion of the simulation, the motion of the block is governed by a simple basal rheology, and during the fluid mechanics portion motion is governed by both a basal and an internal rheology.
As input, Dan3D-Flex requires a topographic raster that represents the sliding surface, as well as a raster of the thickness of the initial source mass. To create these files, a topographic reconstruction was performed by manually modifying the present-day topography, based on Figure 3B, Caprez (2008) and our own geomorphic interpretation. The present-day topographic files used were based on 1m LiDAR data obtained from Swiss Topo. This resulted in the removal of 7.5 km3 from the present-day topography, which when combined with the estimate of 1.5 km3 eroded since deposition (Caprez, 2008), results in a deposit volume of 9 km3. Our reconstruction of the source zone resulted in a volume estimate of 7.5 km3. This results in a bulking factor of ∼1.2, comparable to but slightly lower than that estimated for other rock avalanches (∼1.25) by Hungr and Evans (2004). Our estimated deposit volume is ∼1 km3 less than Caprez (2008), however, it well matches our estimated source volume, assuming a reasonable bulking ratio (volume increase due to expansion along pre-existing discontinuities and fragmentation of source material). Dan3D-Flex does not explicitly simulate the bulking process, so a source mass with a total source volume of 9 km3 was used as input for the runout modeling.
Three sets of simulations were performed in the present work. The first used a single basal rheology, with parameters calibrated using the Bayesian calibration technique described in Aaron et al. (2019). Briefly, this methodology uses an extensive parametric sweep to determine the posterior distribution of the basal resistance parameters. The second set of simulations used two rheologies, a frictional rheology in the source zone and a Voellmy rheology along the path, to separate the basal resistance in the source zone from that provided by the valley fill (Aaron and McDougall, 2019). For this set of simulations, the friction angle was selected based on Aaron and McDougall (2019), and the Voellmy coefficients for the path were calibrated. The third simulation used the same zonation of rheologies from simulation 2, however, a source zone friction angle of 15° was selected based on the results of the rock mass characterization and stability analysis (Table 1). This set of simulations allows for the link to be made between the rock mass stability and runout characteristics.
Results
Rock Mass Characterization and Engineering Geomorphological Mapping
The field and photogrammetry surveys resulted in over 1000 measurements, and six identified joint sets in addition to bedding (Figure 6). Bedding appears to be the dominant set, and is folded on both the local and regional scale. The dip of the bedding-parallel sliding surface scar is highest at the headscarp of the FRRA (30°), and decreases to 10° to the south. Sets 1 and 3 are common throughout the study area, whereas sets 2 and 4 are less common. Sets 5 and 6 are rarely found, and appear to be locally concentrated. Individual discontinuity orientations in sets 1, 2, 3, and 4 are consistent throughout the study area, whereas local variation was observed in the bedding and sets 5 and 6.
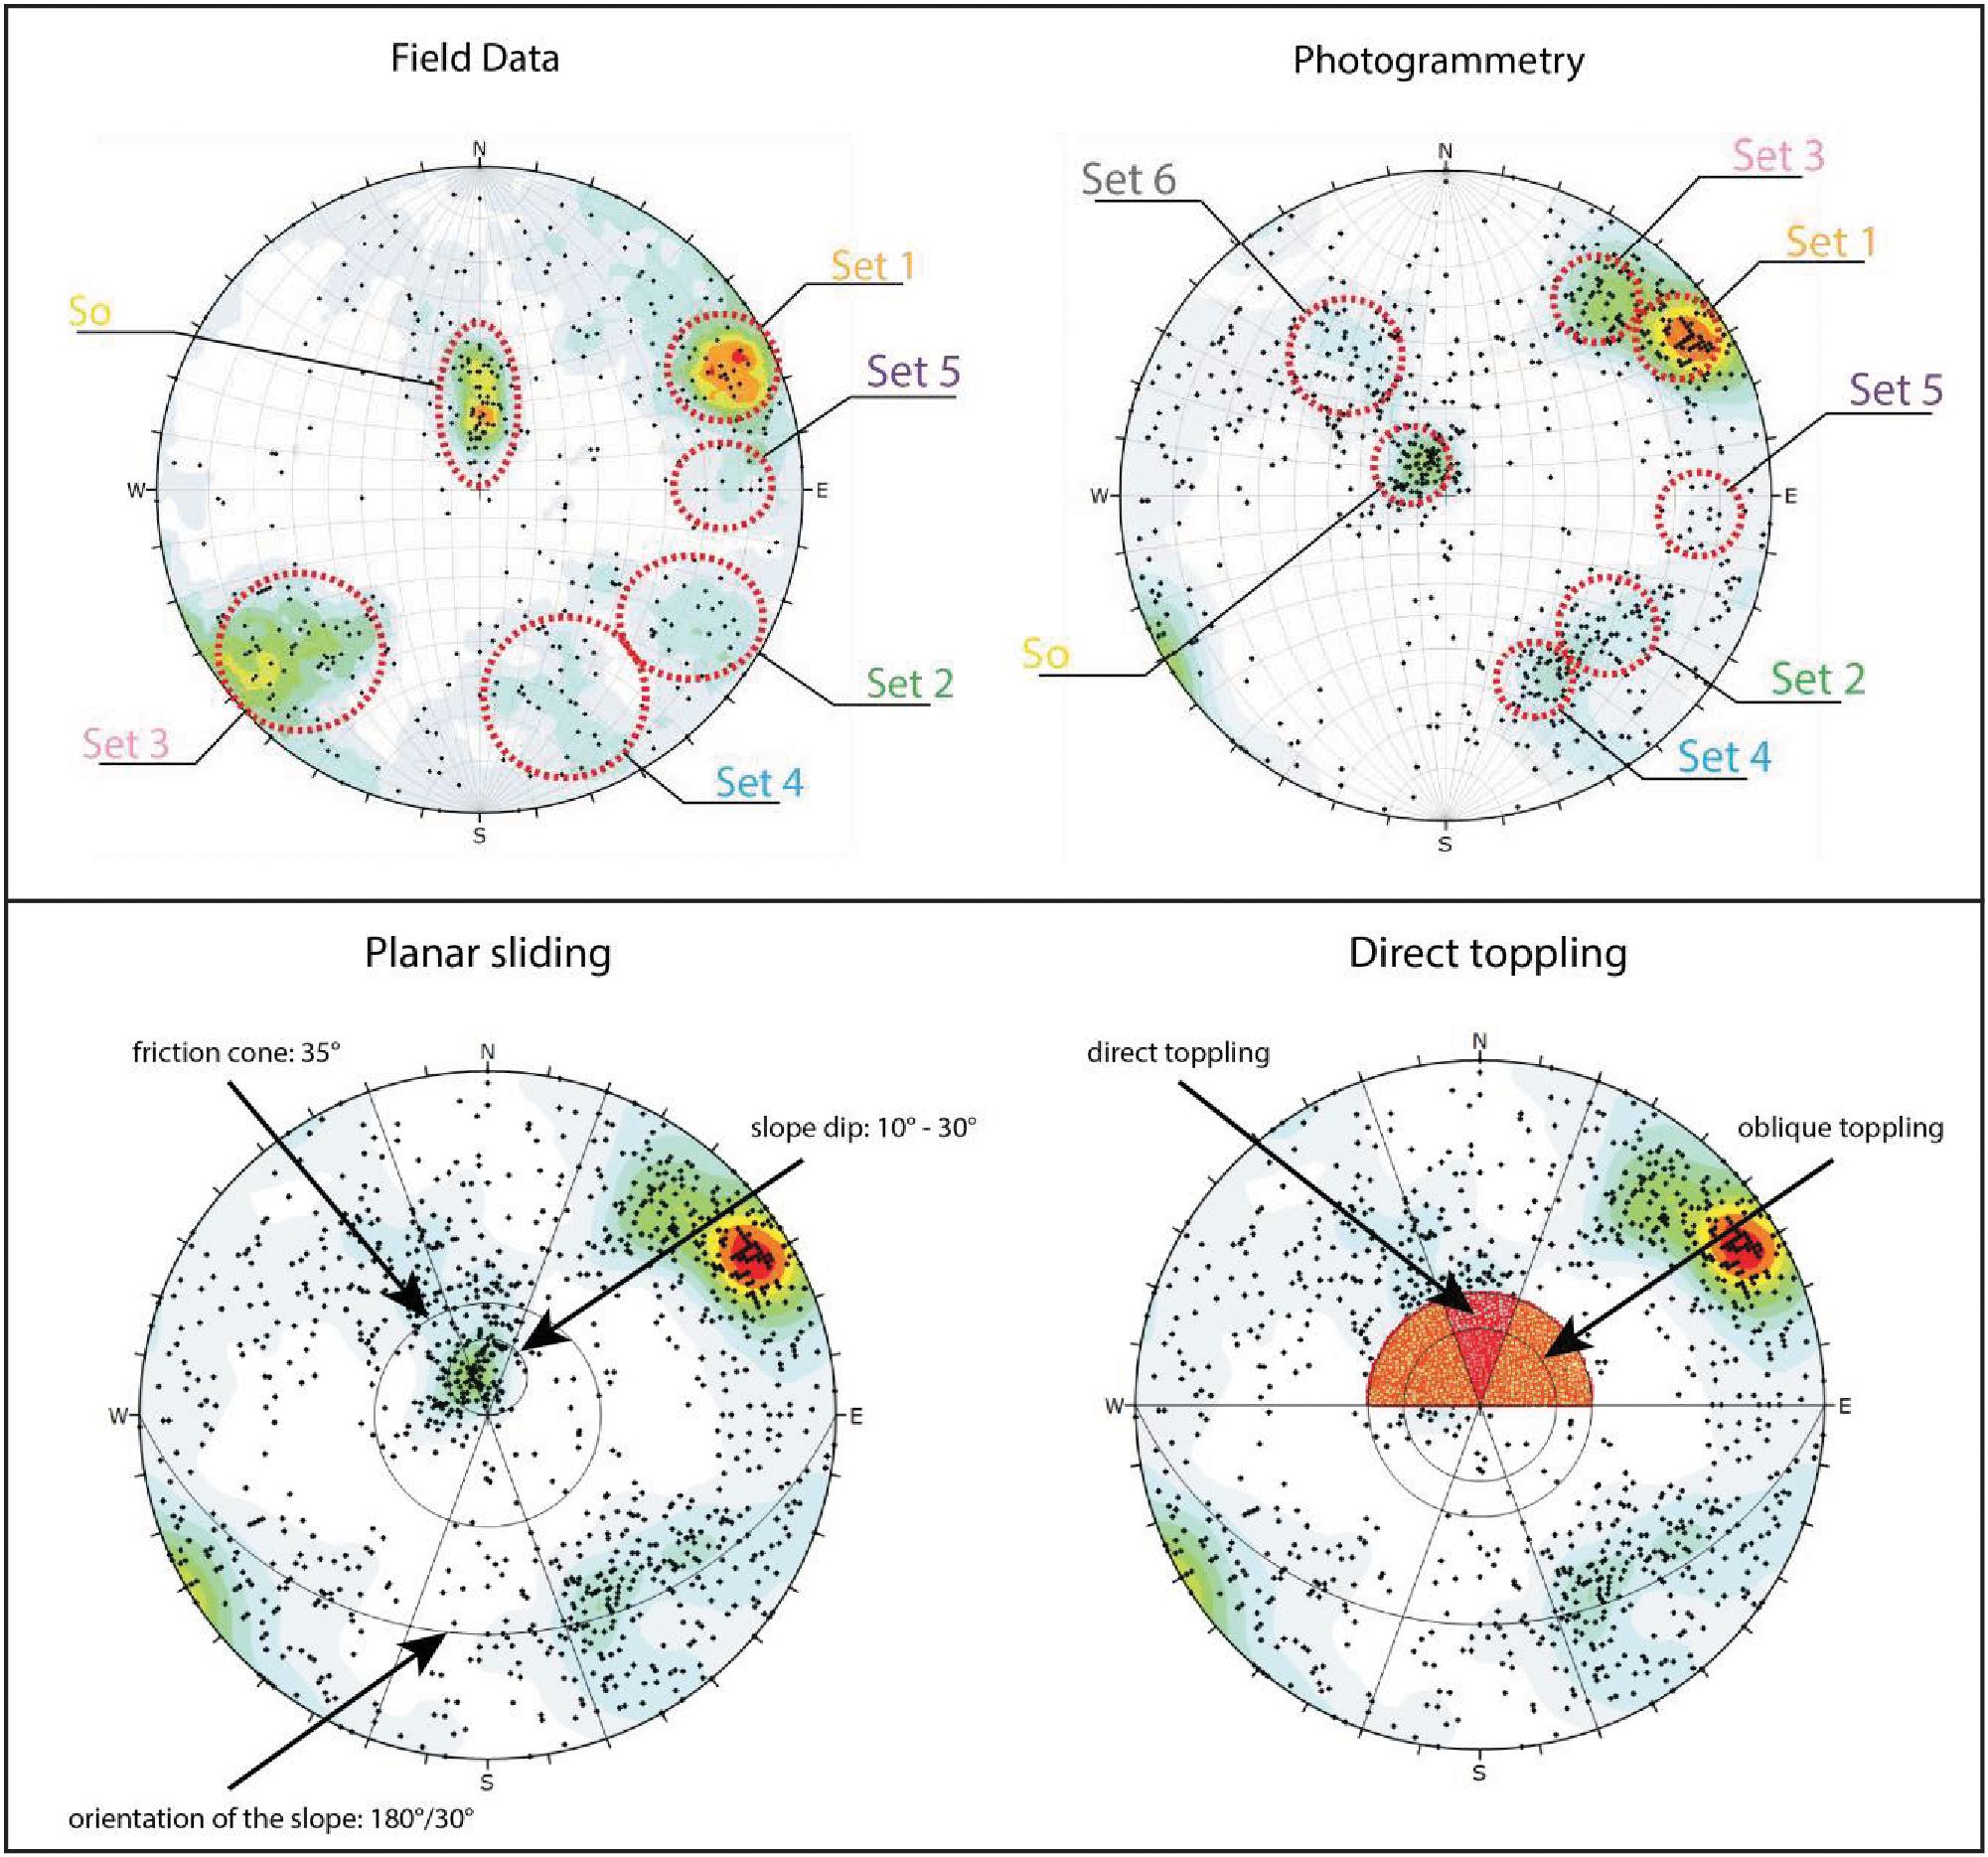
Figure 6. Top: discontinuity measurements taken from the field and from photogrammetry. Bottom: Results of the kinematic analysis.
The rock masses in the study area are highly variable, ranging from fairly strong and massive to weak and highly fractured. As shown on Figure 7, outcrop-scale GSI values are related to lithology. The lowest GSI values (30–50) are found in the Verrucano unit, and the highest (75–85) are found in the massive Quintnerkalk. Our results also show that GSI values are affected by proximity to thrust faults and fold hinges.
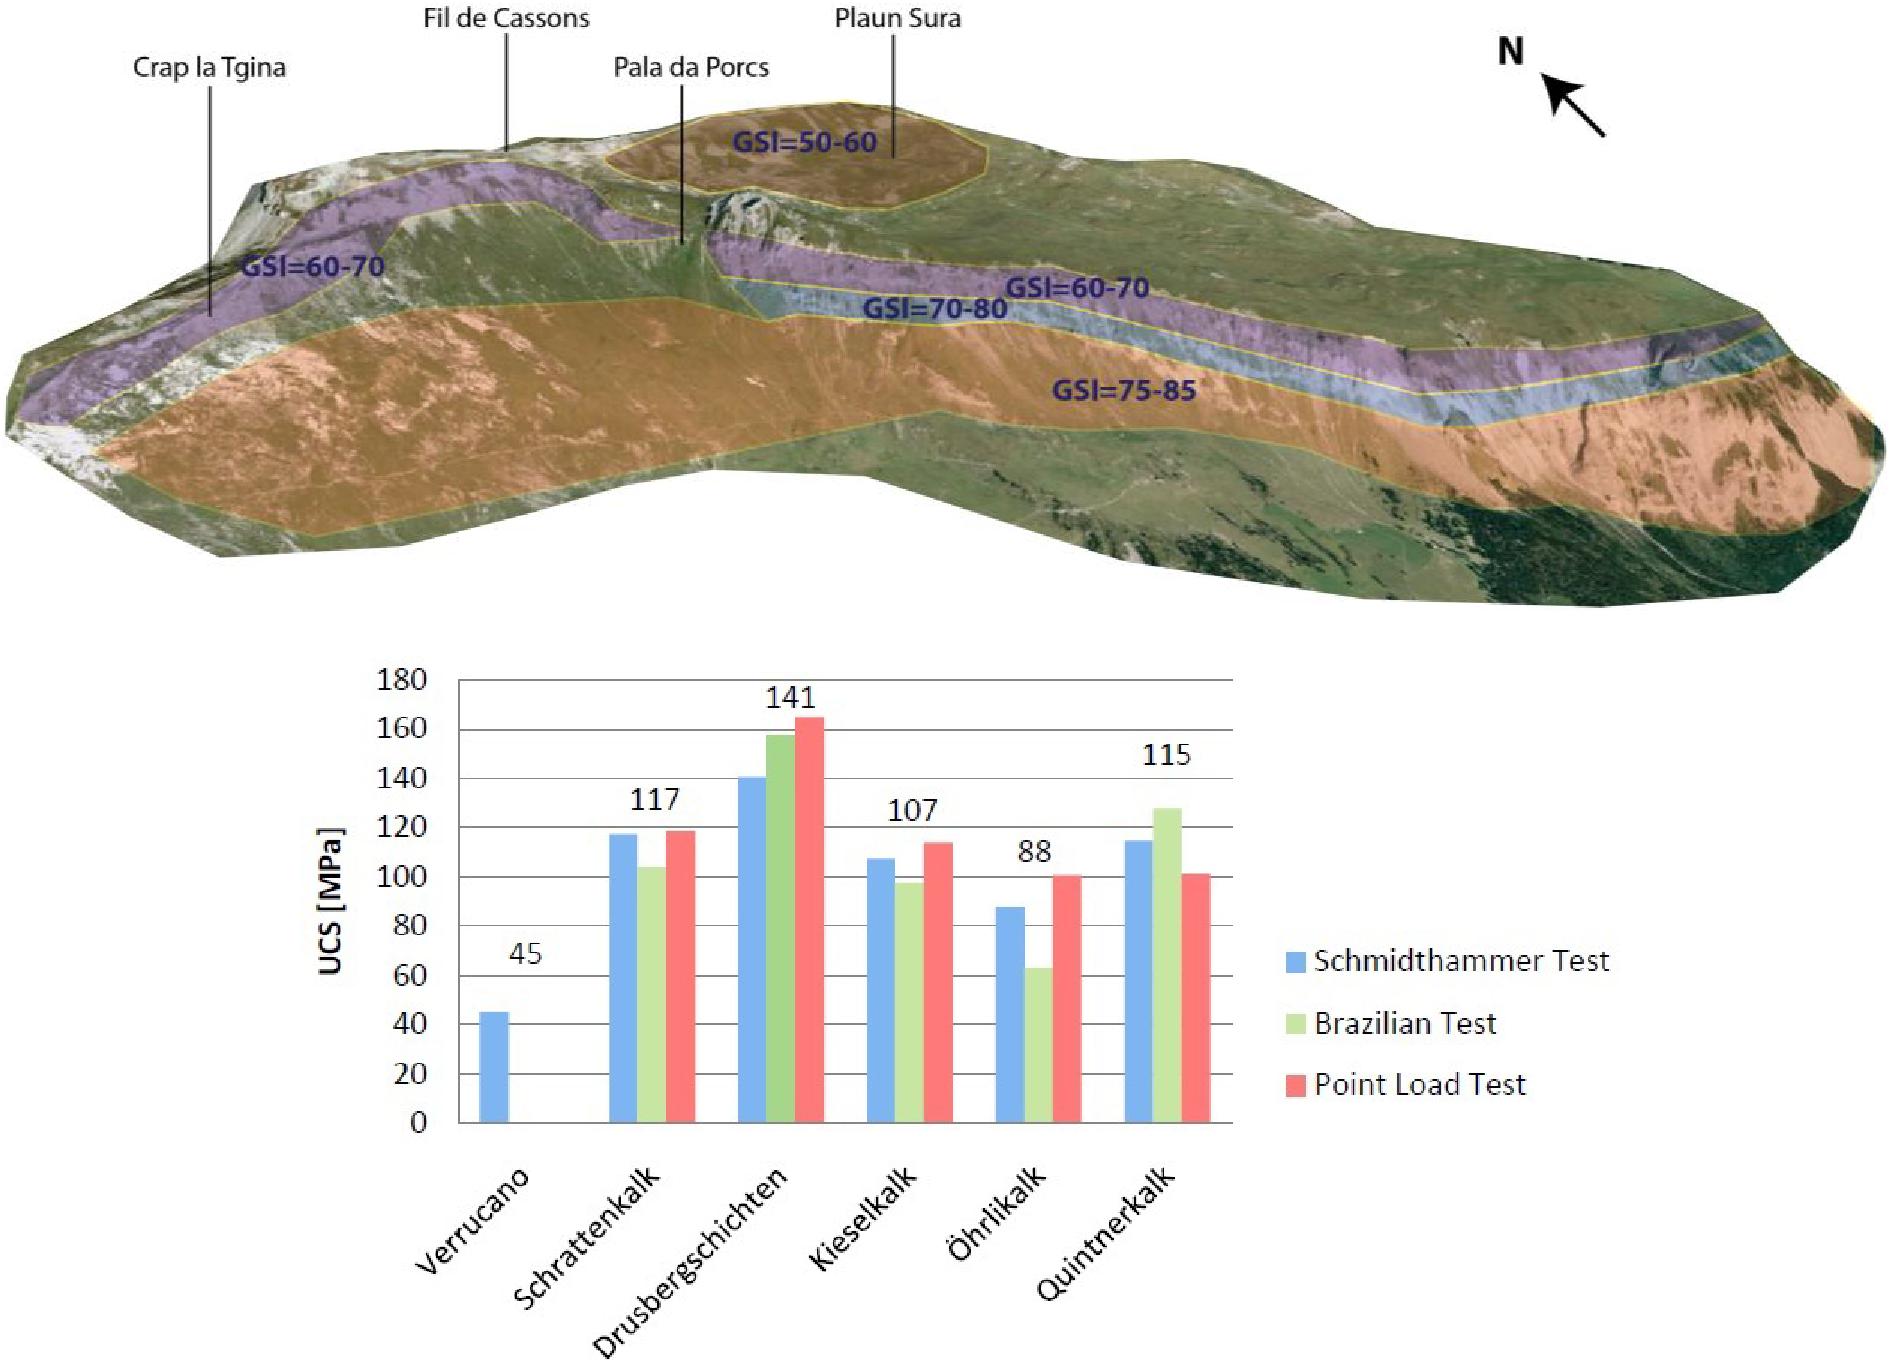
Figure 7. Top: GSI (Geological Strength Index) domains in the study area, based on outcrop-scale field observations. The GSI generally increases with depth in the sequence (Imagery: Google Earth, 2009). Bottom: Unconfined compressive strength values derived from different strength testing methods. Mean values from averaging across tests for each lithology are indicated.
Figure 7 summarizes the results of the Schmidt Hammer, Brazilian, and Point Load tests. The correlation of Altindag and Guney (2010) was used to transform Brazilian tensile strength into compressive strength. The strengths of the limestone units are between 80 and 150 MPa. The Drusbergschichten unit is the strongest (UCS = 141 MPa) and the Verrucano the weakest (UCS = 45 MPa). The Verrucano unit could not be tested in the laboratory as no suitable samples could be collected.
Thin sections of intact Quintnerkalk and the landslide body (cf. Figure 4) demonstrate the existence of marl-like layers within the Quintnerkalk (Figure 8). Microscopic clay bands are common at the level of the prehistoric failure zone. A thin section and outcrop image on the basal sliding surface (Figures 8b,c) shows comminuted limestone, with pulverized matrix, indicating high energy shear processes relatively close to the initiation zone.
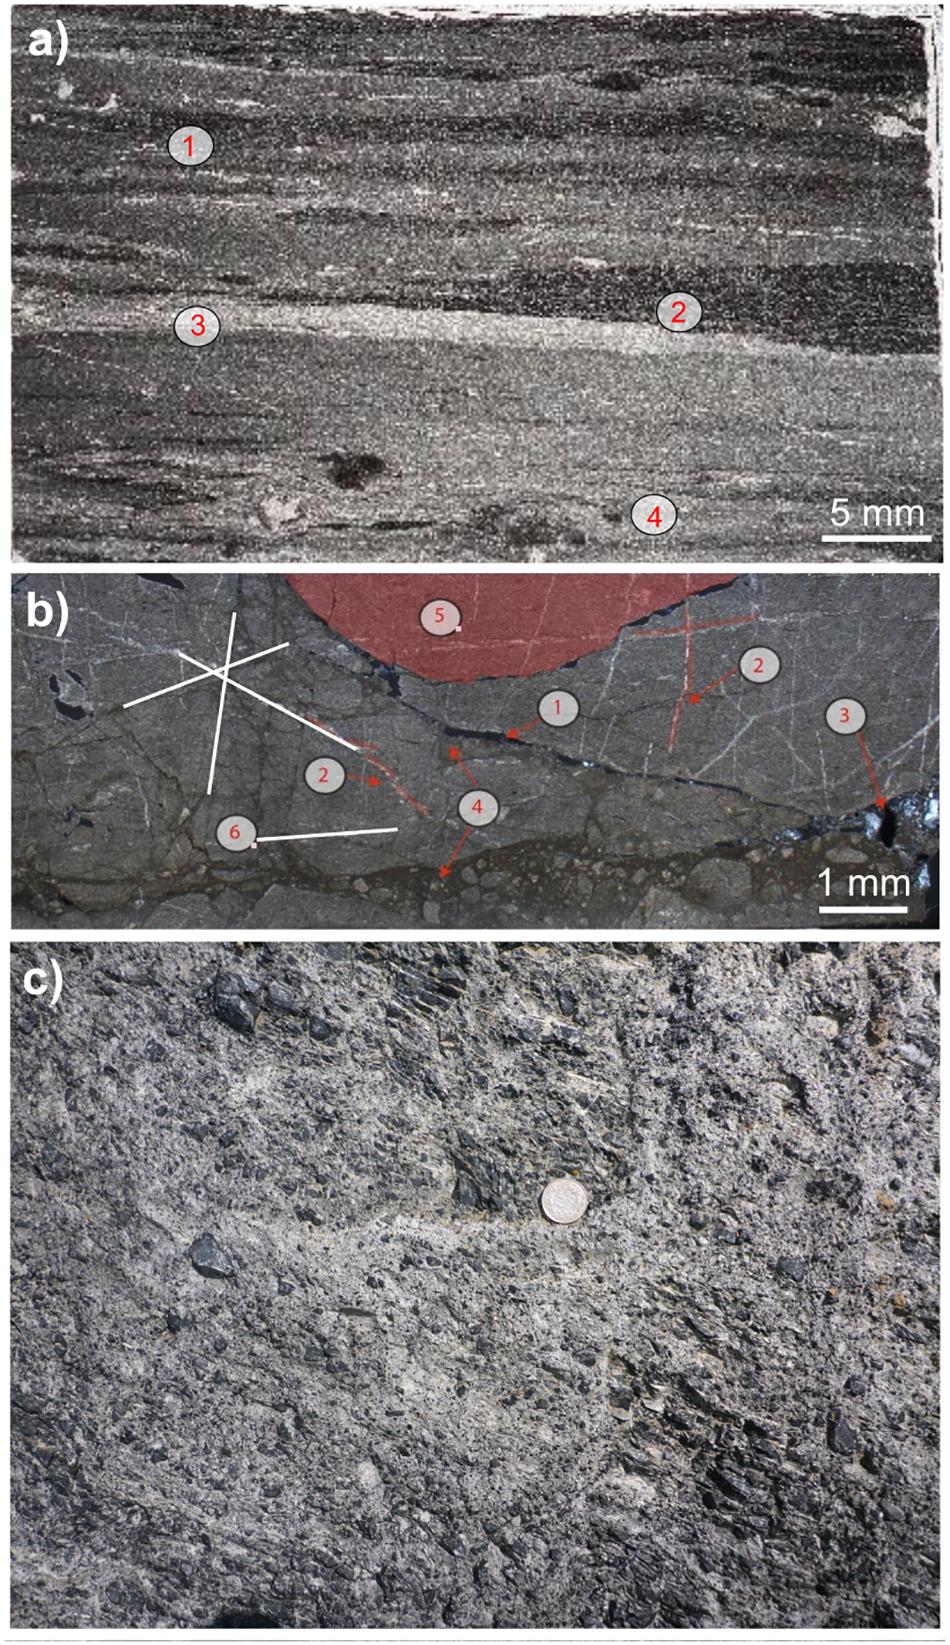
Figure 8. (a) Thin section of in situ Quintnerkalk at the level of the Flims failure zone, at the southern margin of Flimserstein (cf. Figure 4 for location). 1. marl layer, 2. fecal pellets (evidence of bioturbation), compressed during diagenesis, 3. calcite-rich layer, 4. bioturbated layer with larger calcite fragments. (b) Thin section taken at the contact between in situ Quintnerkalk and the failed mass at Punt Desch (cf. Figure 2 for location). 1. voids, 2. calcite veins, 3. calcite, 4. cataclastic, comminuted limestone material, 5. limestone block, 6. (white lines) discontinuity sets. (c) Image of material at the basal sliding zone near Punt Desch, showing pulverized debris and polished fracture surfaces.
The geomorphological map (Figure 9, top) highlights the large steps at the foot of the side scarp and front of Flimserstein. Steeply dipping faults are common in the study area, and generally follow orientations of discontinuity sets determined in the field and from remote sensing imagery (Figure 9 bottom, and see below). Shallowly dipping thrust faults are likely present in the area, although they are not visible on the geomorphic map given orientation bias. Ongoing rockfall activity (Cabernard et al., 2004) and tectonic, glacial, periglacial, and karst processes have affected the Flimserstein and FRRA scarps and sliding surface scar. Other morphological features within the depletion zone of FRRA include gullies, small organic plains, and colluvial deposits (see also Caprez, 2008). The ridge of boulders on the western margin mentioned above (Figure 2) could be a remnant rockfall talus apron, or could have been deposited during the FRRA.
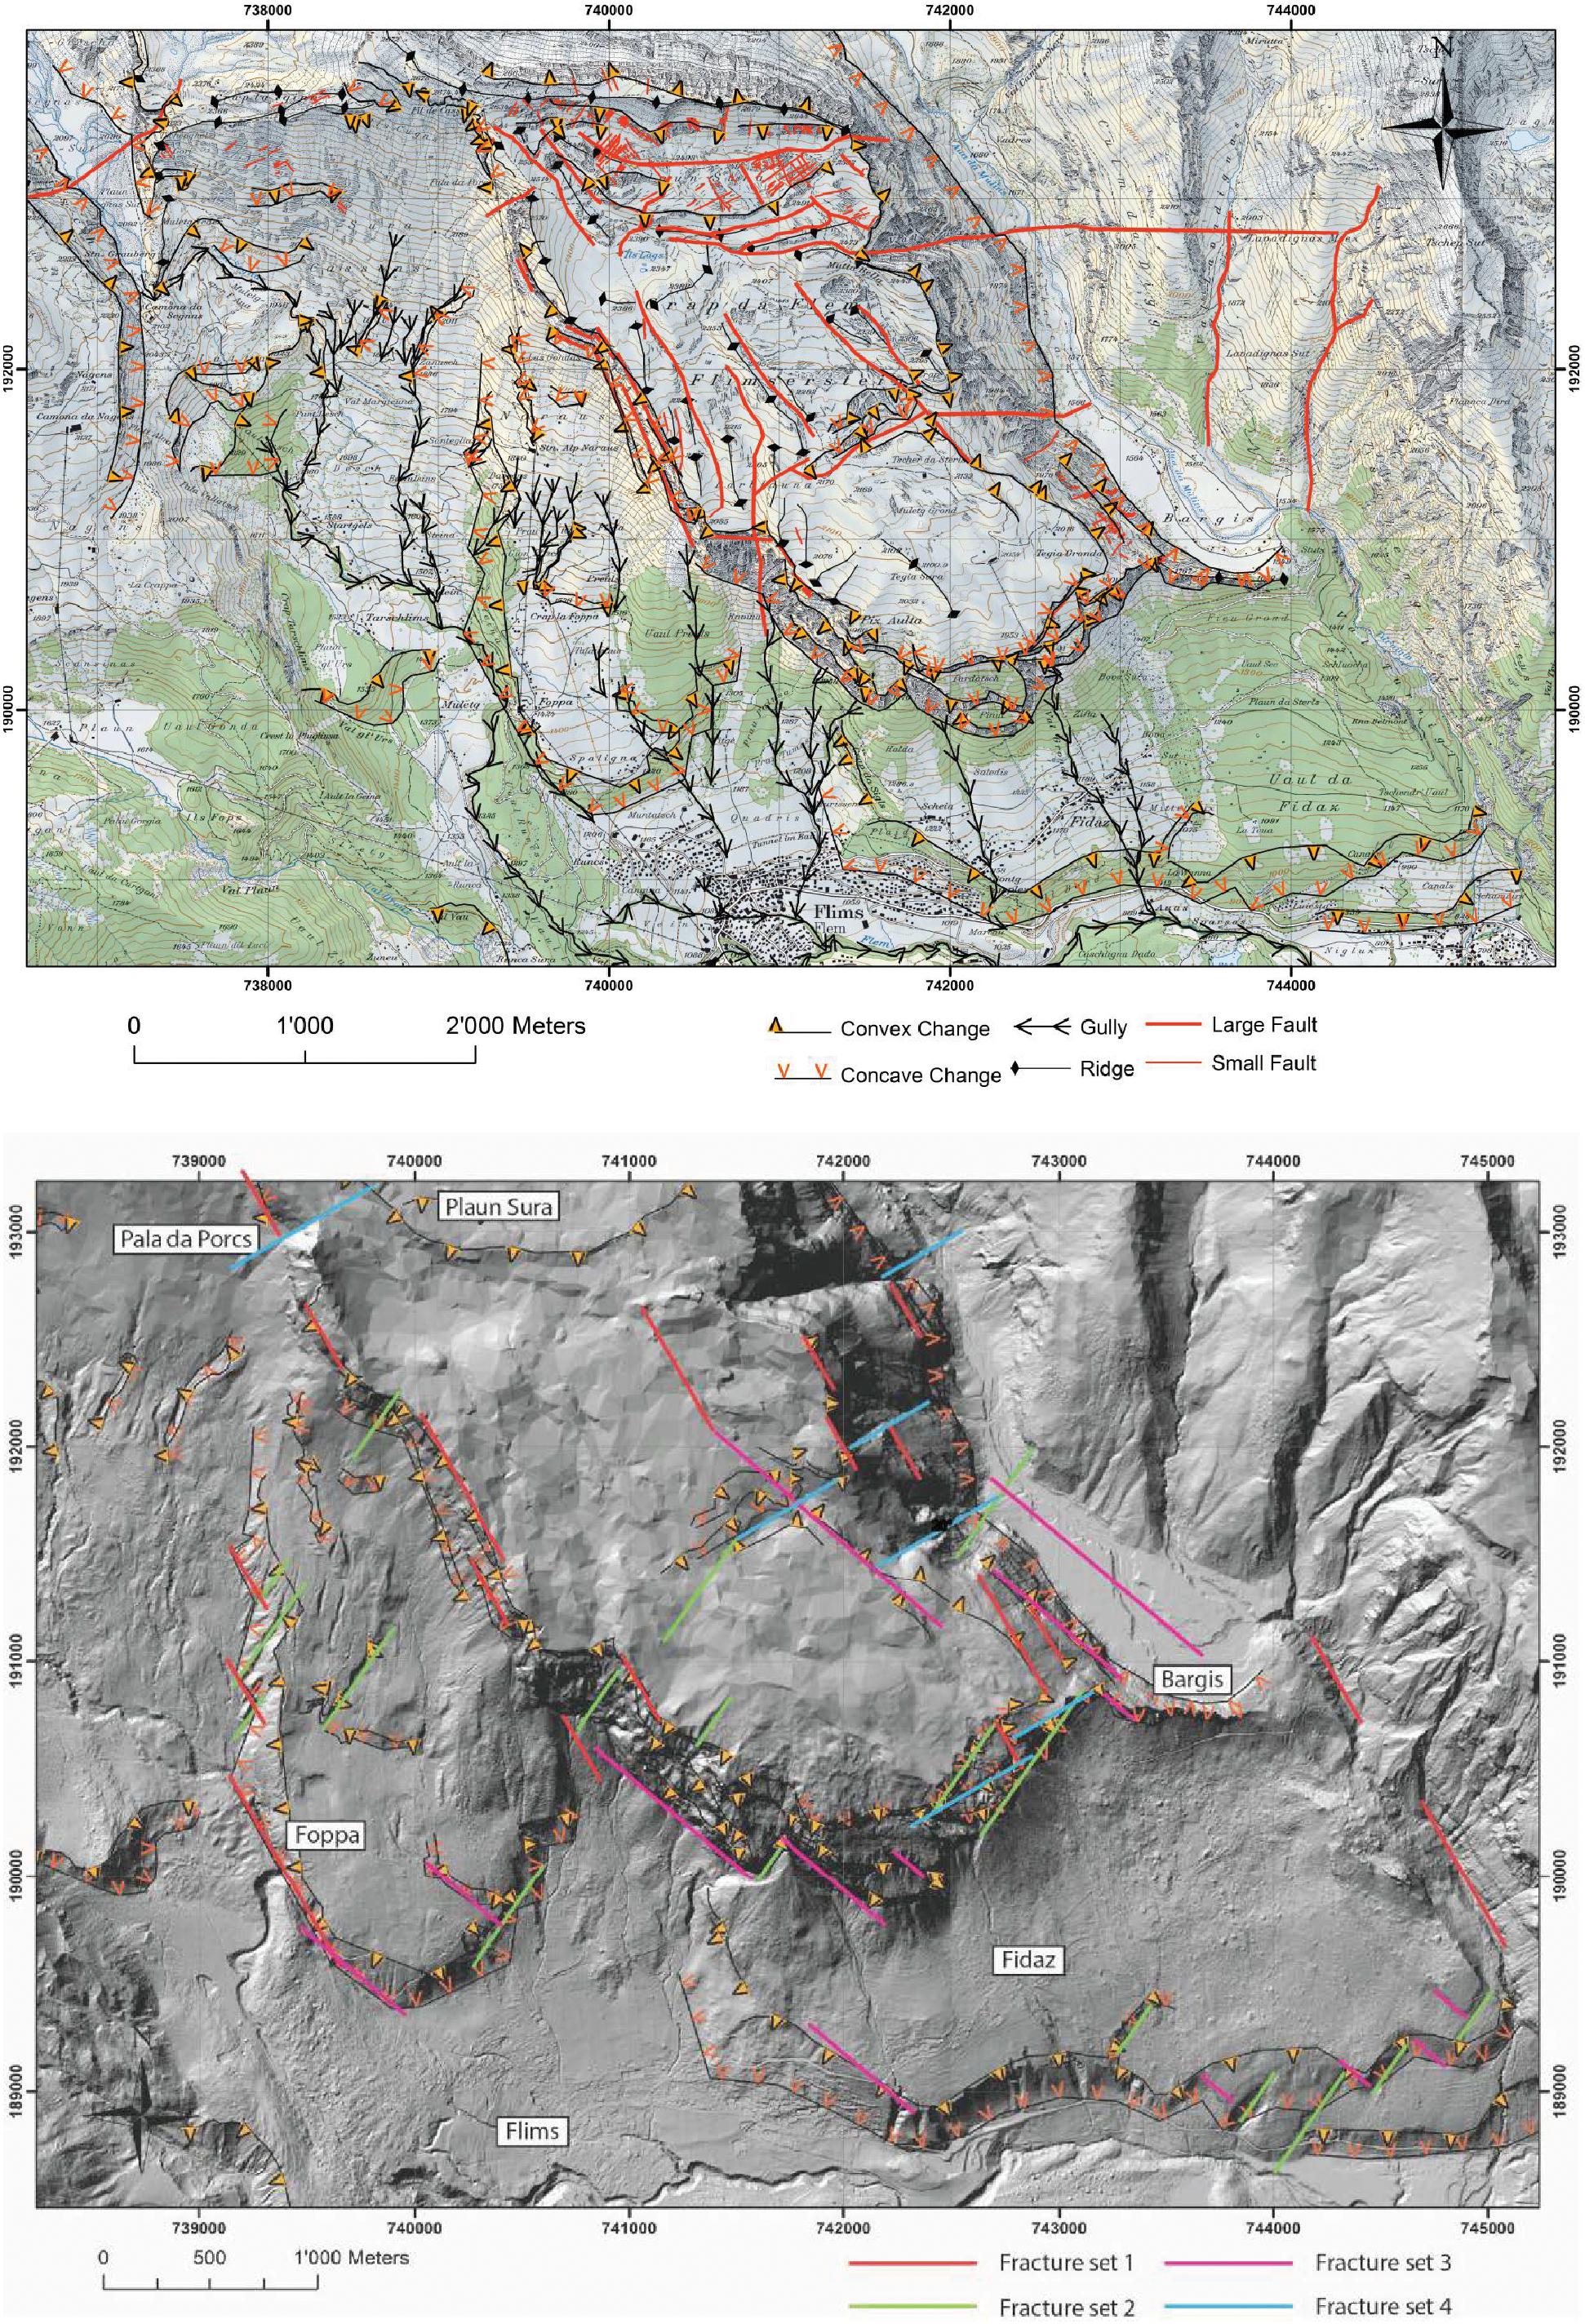
Figure 9. Top: Geomorphological and structural geological map, indicating convex and concave changes in slope, gullies, ridges, and faults. Bottom: Surface expression of fracture sets 1–4 overlain on the geomorphology of the study area.
Stability Modeling
The results of the kinematic analyses are shown in Figure 6. These results show that occurrence of planar sliding requires a friction angle lower than 25°, indicating that a weaker lithology or layer must be present within the limestone to facilitate sliding. The limit equilibrium analysis indicates that the inclusion of a heavily disintegrated limestone layer (WQL in Table 1) within the massive Quintnerkalk unit does not lead to failure [Factor of Safety (FS) = 1.69 with a water table and 1.9 without]. Integration of a marl-like layer (WML in Table 1), however, indicates FS = 1.0 (with water table) and FS = 1.2 (dry). The assumed water table location is indicated on Figure 5.
In Phase2, the critical strength reduction factor (SRF) results indicate that the slope is stable (critical SRF = 1.8 wet, 2 dry) when a weak Quintnerkalk layer with GSI = 10, φ = 18°, and c = 2 MPa is considered, corroborating the Slide results. However, when a marl layer equivalent is simulated, the critical SRF drops to 0.97 (with water table) and 1.16 (dry) when properties are GSI = 15, φ = 17°, and c = 0.7 MPa. The thickness of the weak sliding zone layer was also varied from 2 to 30 m to test the influence on stability. No significant differences were determined in model behavior.
Finally, the slope was subjected to seismic loading. The weak Quintnerkalk layer failed (critical SRF ∼1) with a seismic coefficient of 0.2 when GSI = 20 (φ = 22°, c = 3.2 MPa, σT = 0.028 MPa) properties were used. The marl-like layer failed when GSI = 50 (φ = 28°, c = 2 MPa, σT = 0.115 MPa).
Investigations on the development of secondary sliding surfaces show high shear stress concentrations mainly between 500 and 1800 m and 3000–6000 m along the horizontal axis (Figure 10). The assumed locations of the modeled secondary shear planes correlate with field observations of existing steeply dipping faults (Figure 3).
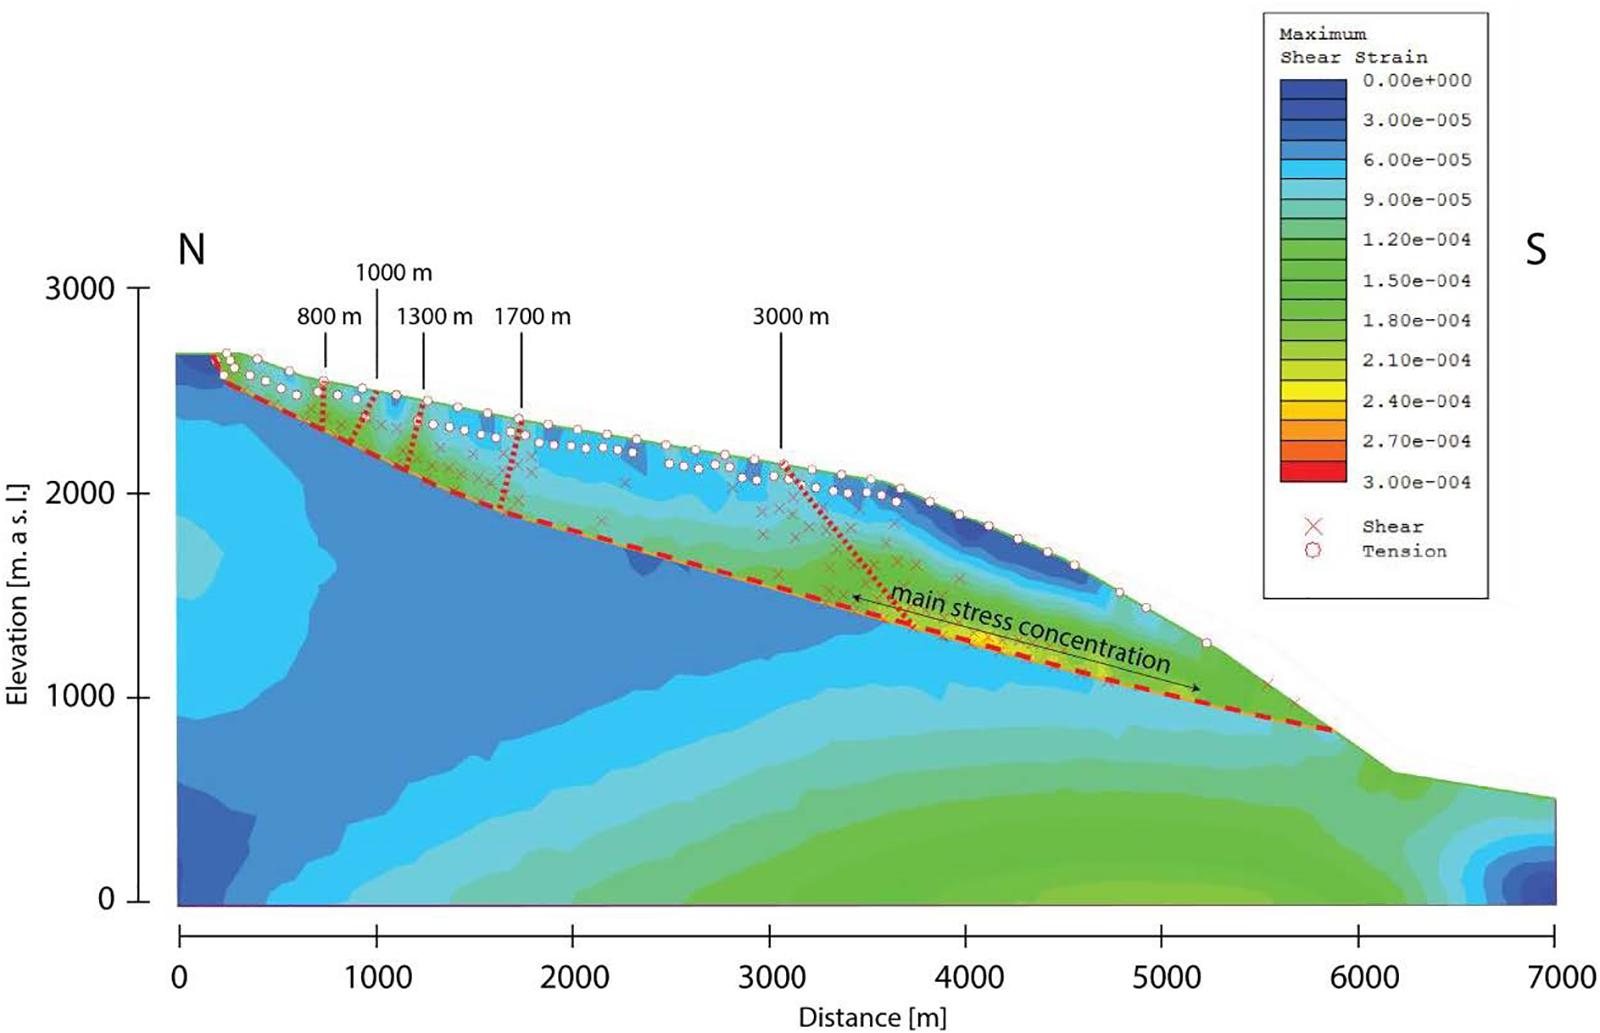
Figure 10. Maximum shear strain plot in Phase2, indicating areas of high strain that could correspond to locations of secondary shear surfaces. These correlate well with field and remote sensing observations, as shown in Figures 3A, 9.
The potential secondary surfaces were integrated as discrete surfaces in subsequent models. In these models, shear strain was focused in the main sliding zone at the toe of the slope (Figure 11A). Tensile failure was induced at the top of Flimserstein. Total displacement contours (Figure 11B) for static models (no seismic loading) show that the southernmost fault observed in the models and in the field is an important boundary for movement – it acts to separate an active compartment of the failure from inactive compartments above. These results suggest that the toe of the slope must have failed first to provide kinematic freedom for the rest of the rock mass.
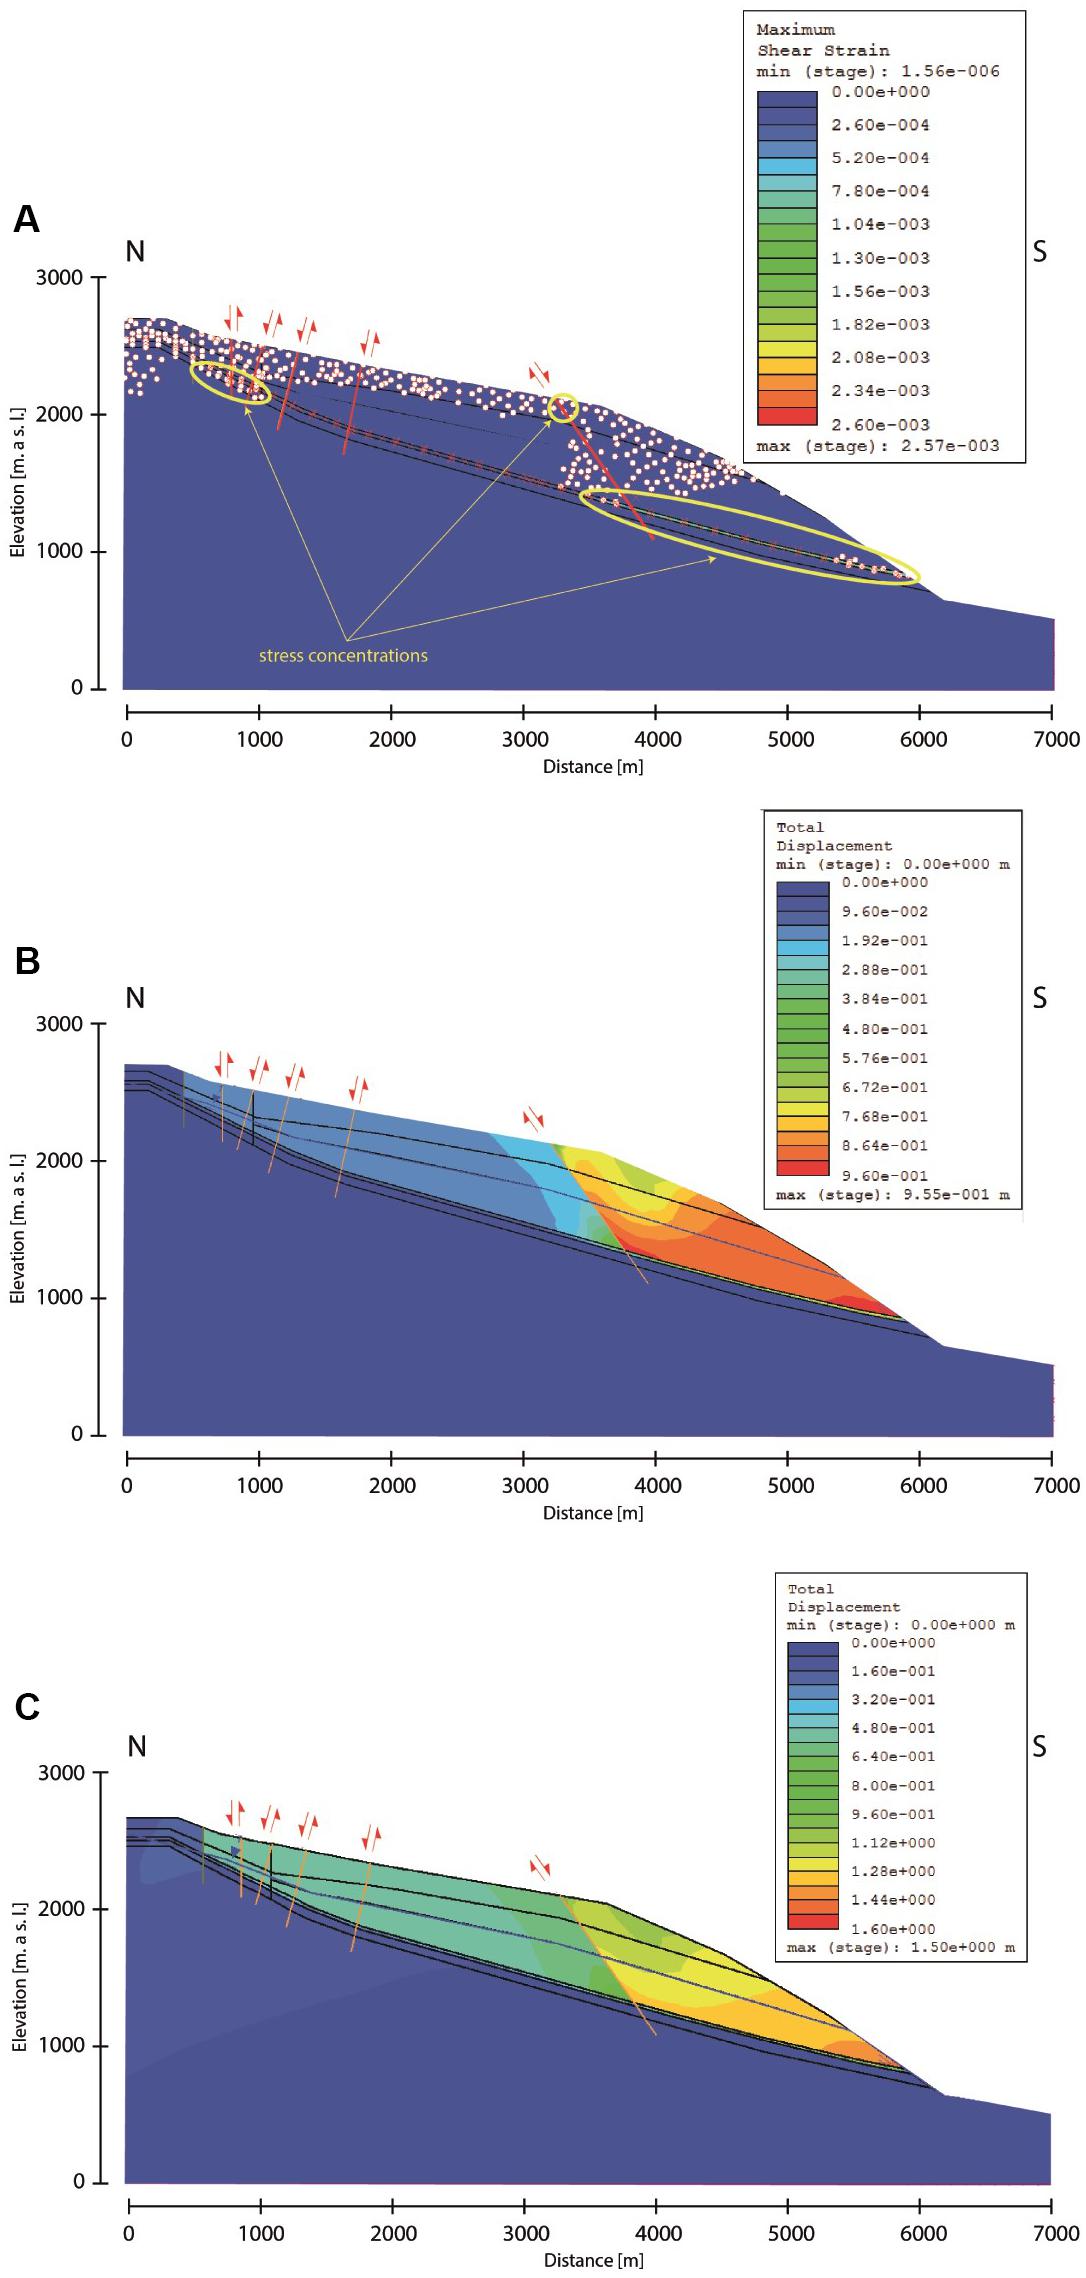
Figure 11. (A) Maximum shear strain plot of simulation with secondary shear surfaces integrated as discrete planes in Phase2. The highest stress concentrations occur between the toe and the southernmost (rightmost) fault. In addition, increased strain values and tension failure occur between 500 and 1000 m distance and along the south-dipping, southernmost fault. (B) Total displacement plot for a static model, showing the importance of the southernmost fault as a compartment boundary. (C) Total displacement plot for a pseudo-static model with a seismic coefficient of 0.1.
When seismic loading was included in this FEM model, total modeled displacement increased in general up to 1.5 m and was more evenly distributed throughout the sliding mass (Figure 11C). This result suggests that the compartments of the landslide could have failed contemporaneously during an earthquake.
A fracture network model, incorporating discontinuities explicitly, provided useful results for the possible kinematics and evolution of the landslide (Figure 12). The critical SRF of the model, including a water table but not seismic loading, is 1.33. It appears that the central part of the sliding mass underwent the most internal deformation and damage based on these preliminary models, perhaps indicating a Prandtl wedge transition zone. Additionally, Figure 12 shows that the failure mass likely dilated along pre-existing discontinuities. This increase in volume would result in a subsequent decrease of pore-water pressure. When we modeled additional marl-like layers above and below the assumed failure surface, we found that the lowermost marl layer always showed the highest strain concentration, regardless of depth, and that strain increased with depth.
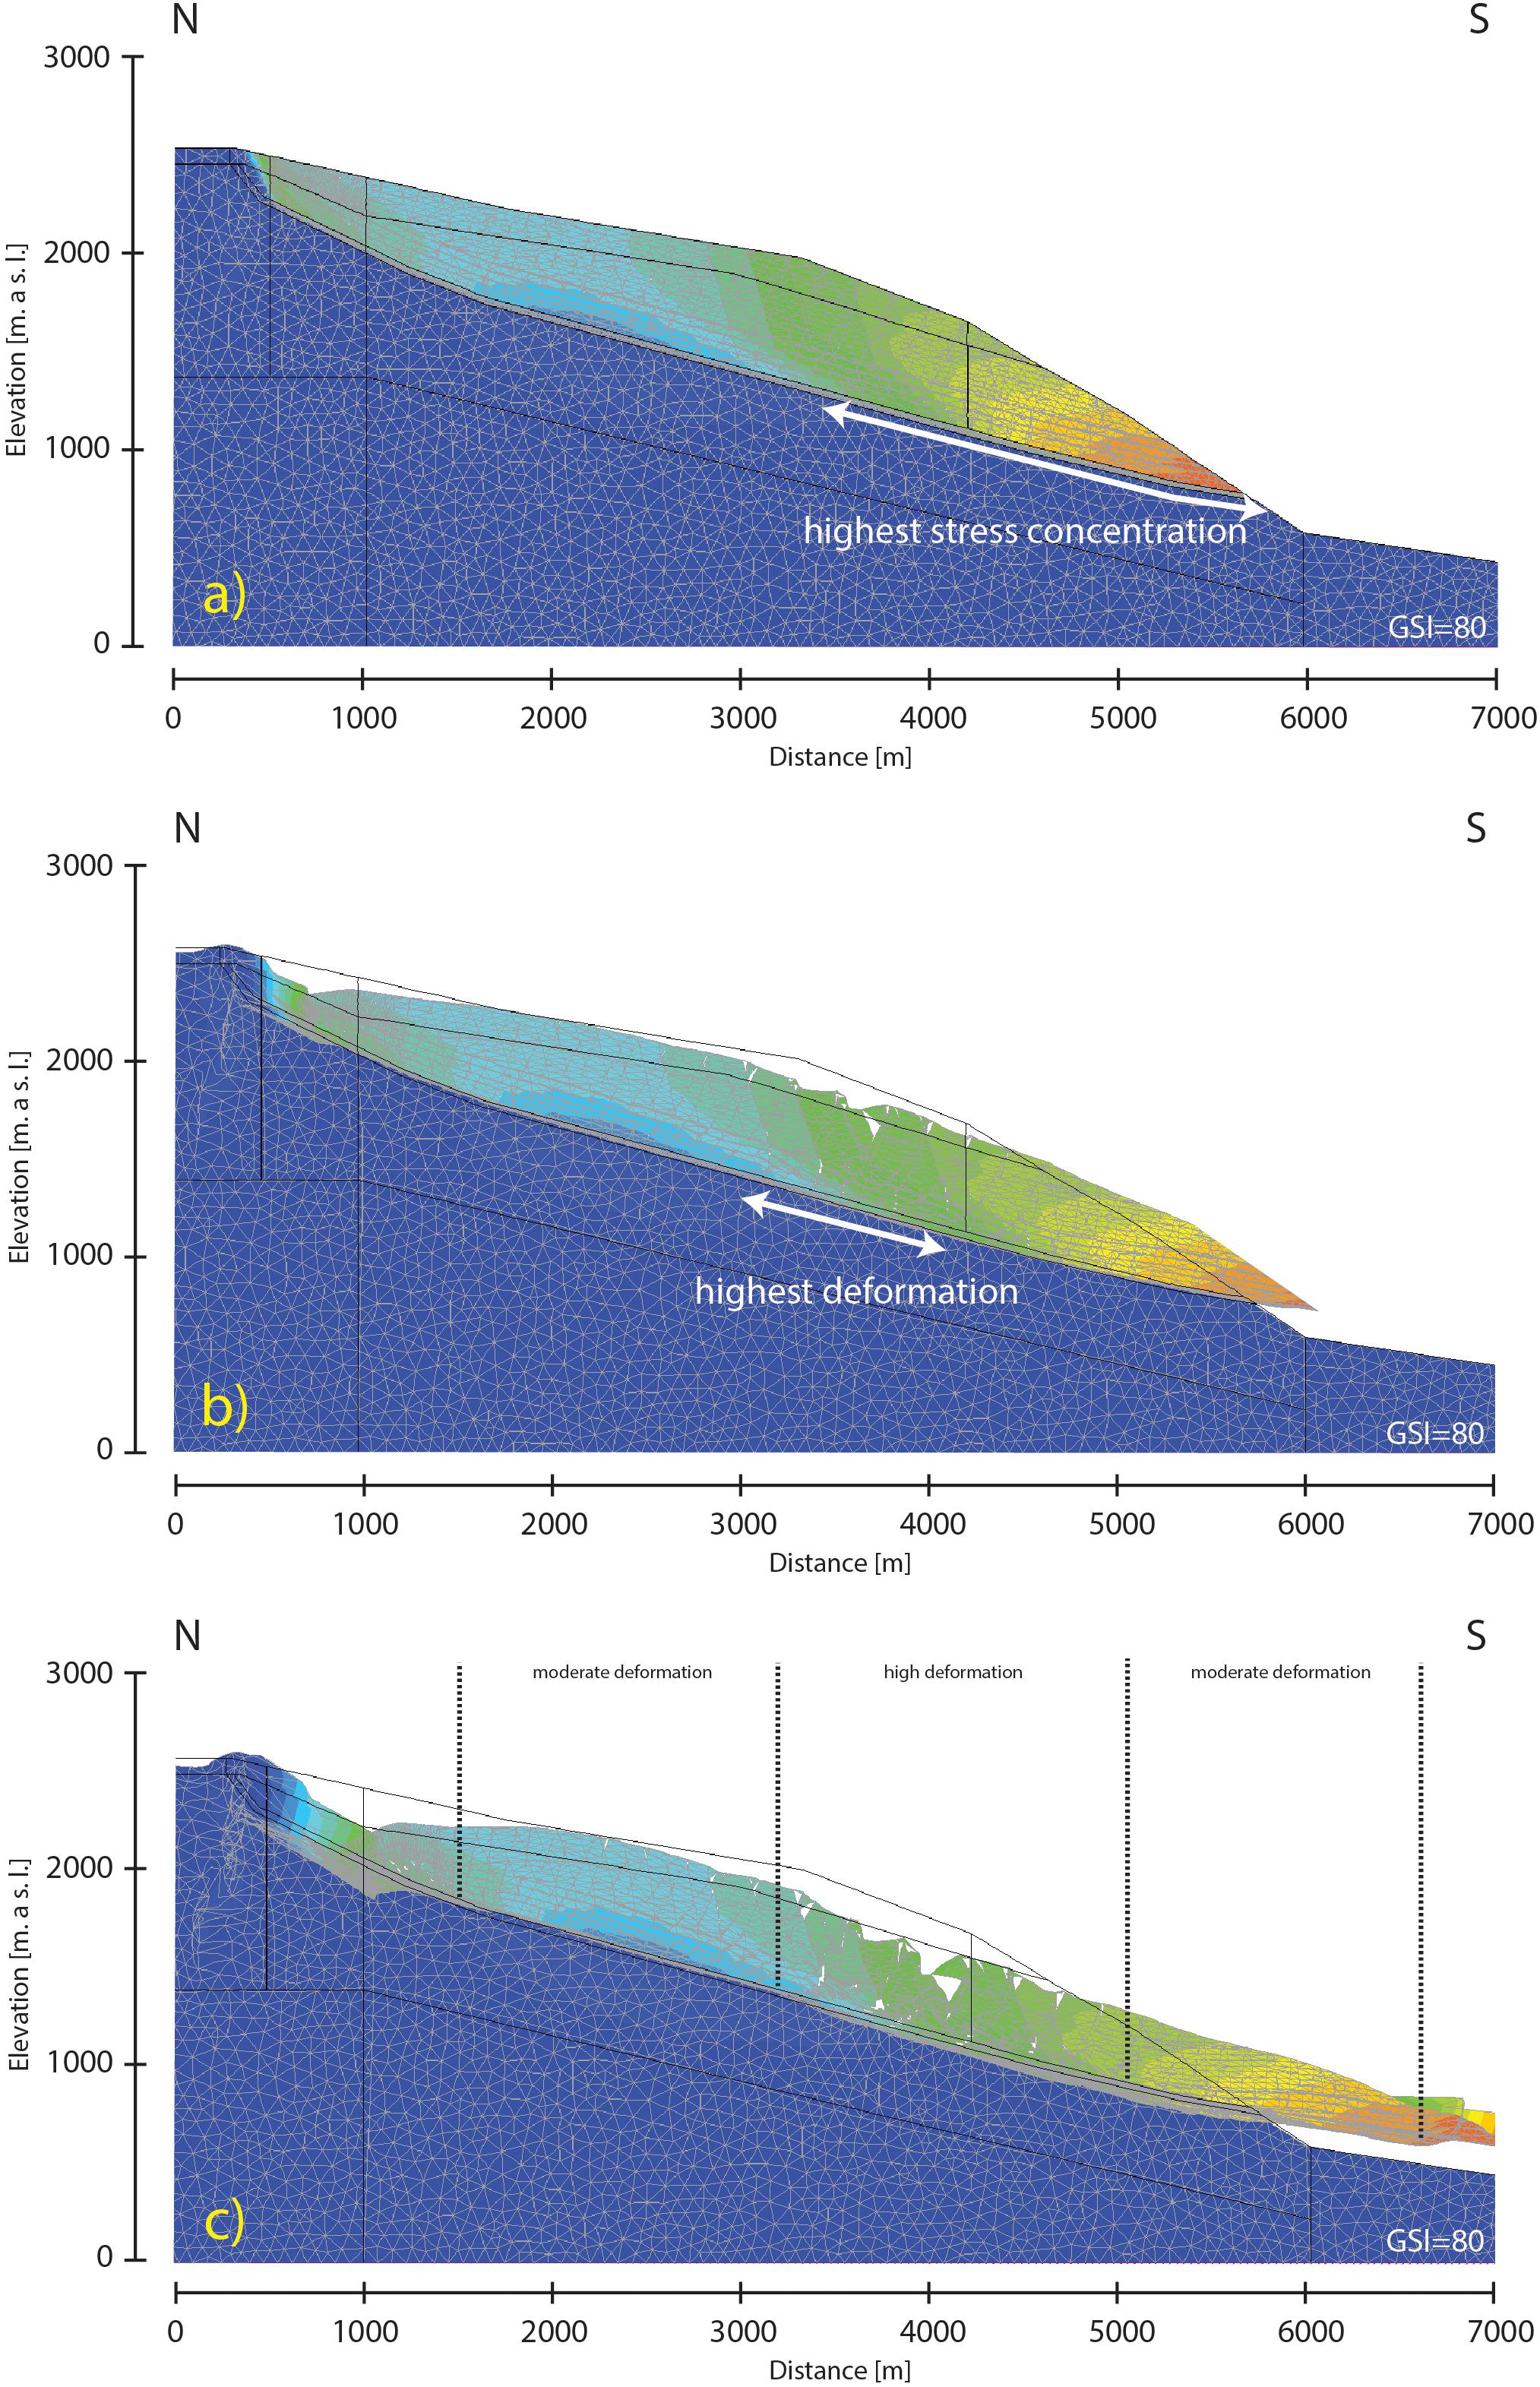
Figure 12. Results of the fracture network model. (a) Displacement contours indicate highest movement between 3500 and 6000 m distance, where displacement increases toward the slope toe. (b) The headscarp and the middle part of the rockslide mass are subjected to extensional processes and sliding mass is separated into three compartments. (c) The rockslide body can be separated into higher (middle part) and lower (upper and lower parts) deformation regions.
Runout Modeling
Runout modeling results from each of the three scenarios are presented in Figure 13. Figure 14 shows simulated deposit depths at different times for the two-rheology simulation. Overall, the simulation results reproduce the observed impact area well, and deposition is simulated to be thickest in areas that match the thickest deposits estimated, based on the volume reconstruction. Simulated deposit thicknesses are lower than those estimated from the topographic reconstruction in many areas. This could be caused by underestimating the initial source volume with our topographic reconstruction. Since this estimate matches that made by Caprez (2008), the likely source of volume underestimation is underestimating the eroded volume by the Vorderrhein river.
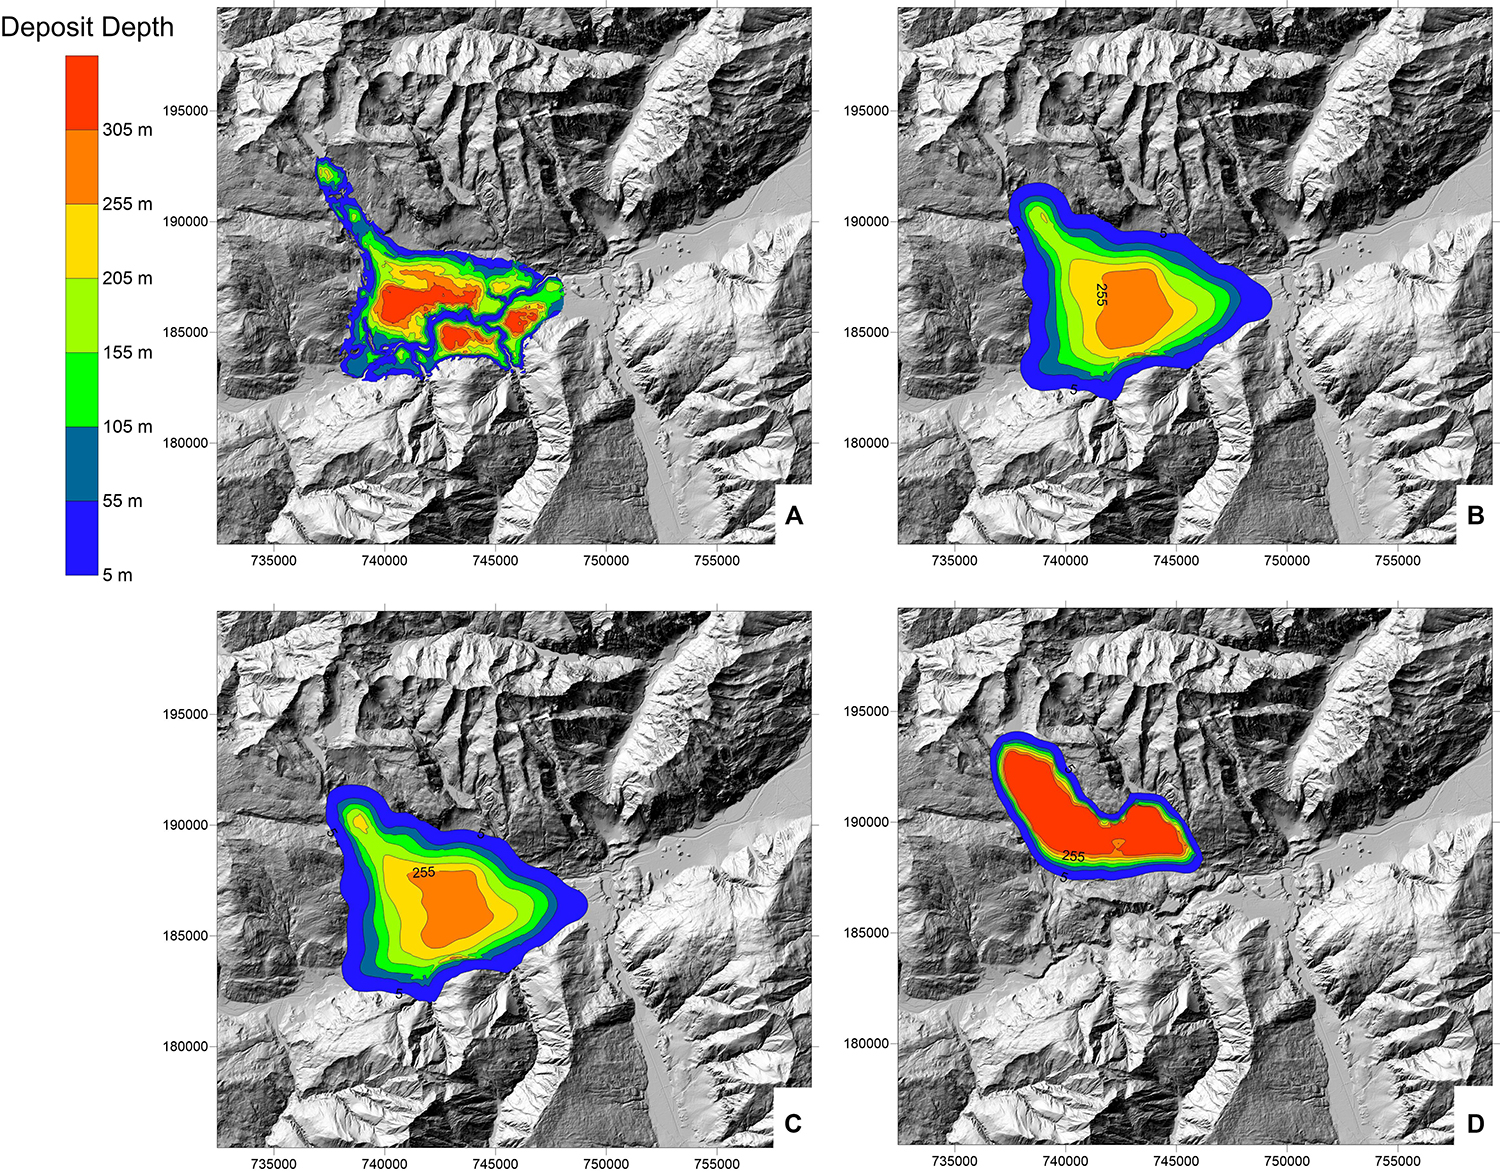
Figure 13. Dan3D results for the three scenarios. (A) Reconstructed deposit depth. (B) Two-rheology simulation. (C) One-rheology simulation. (D) Simulation assuming only cohesion loss along the rupture plane occurred.
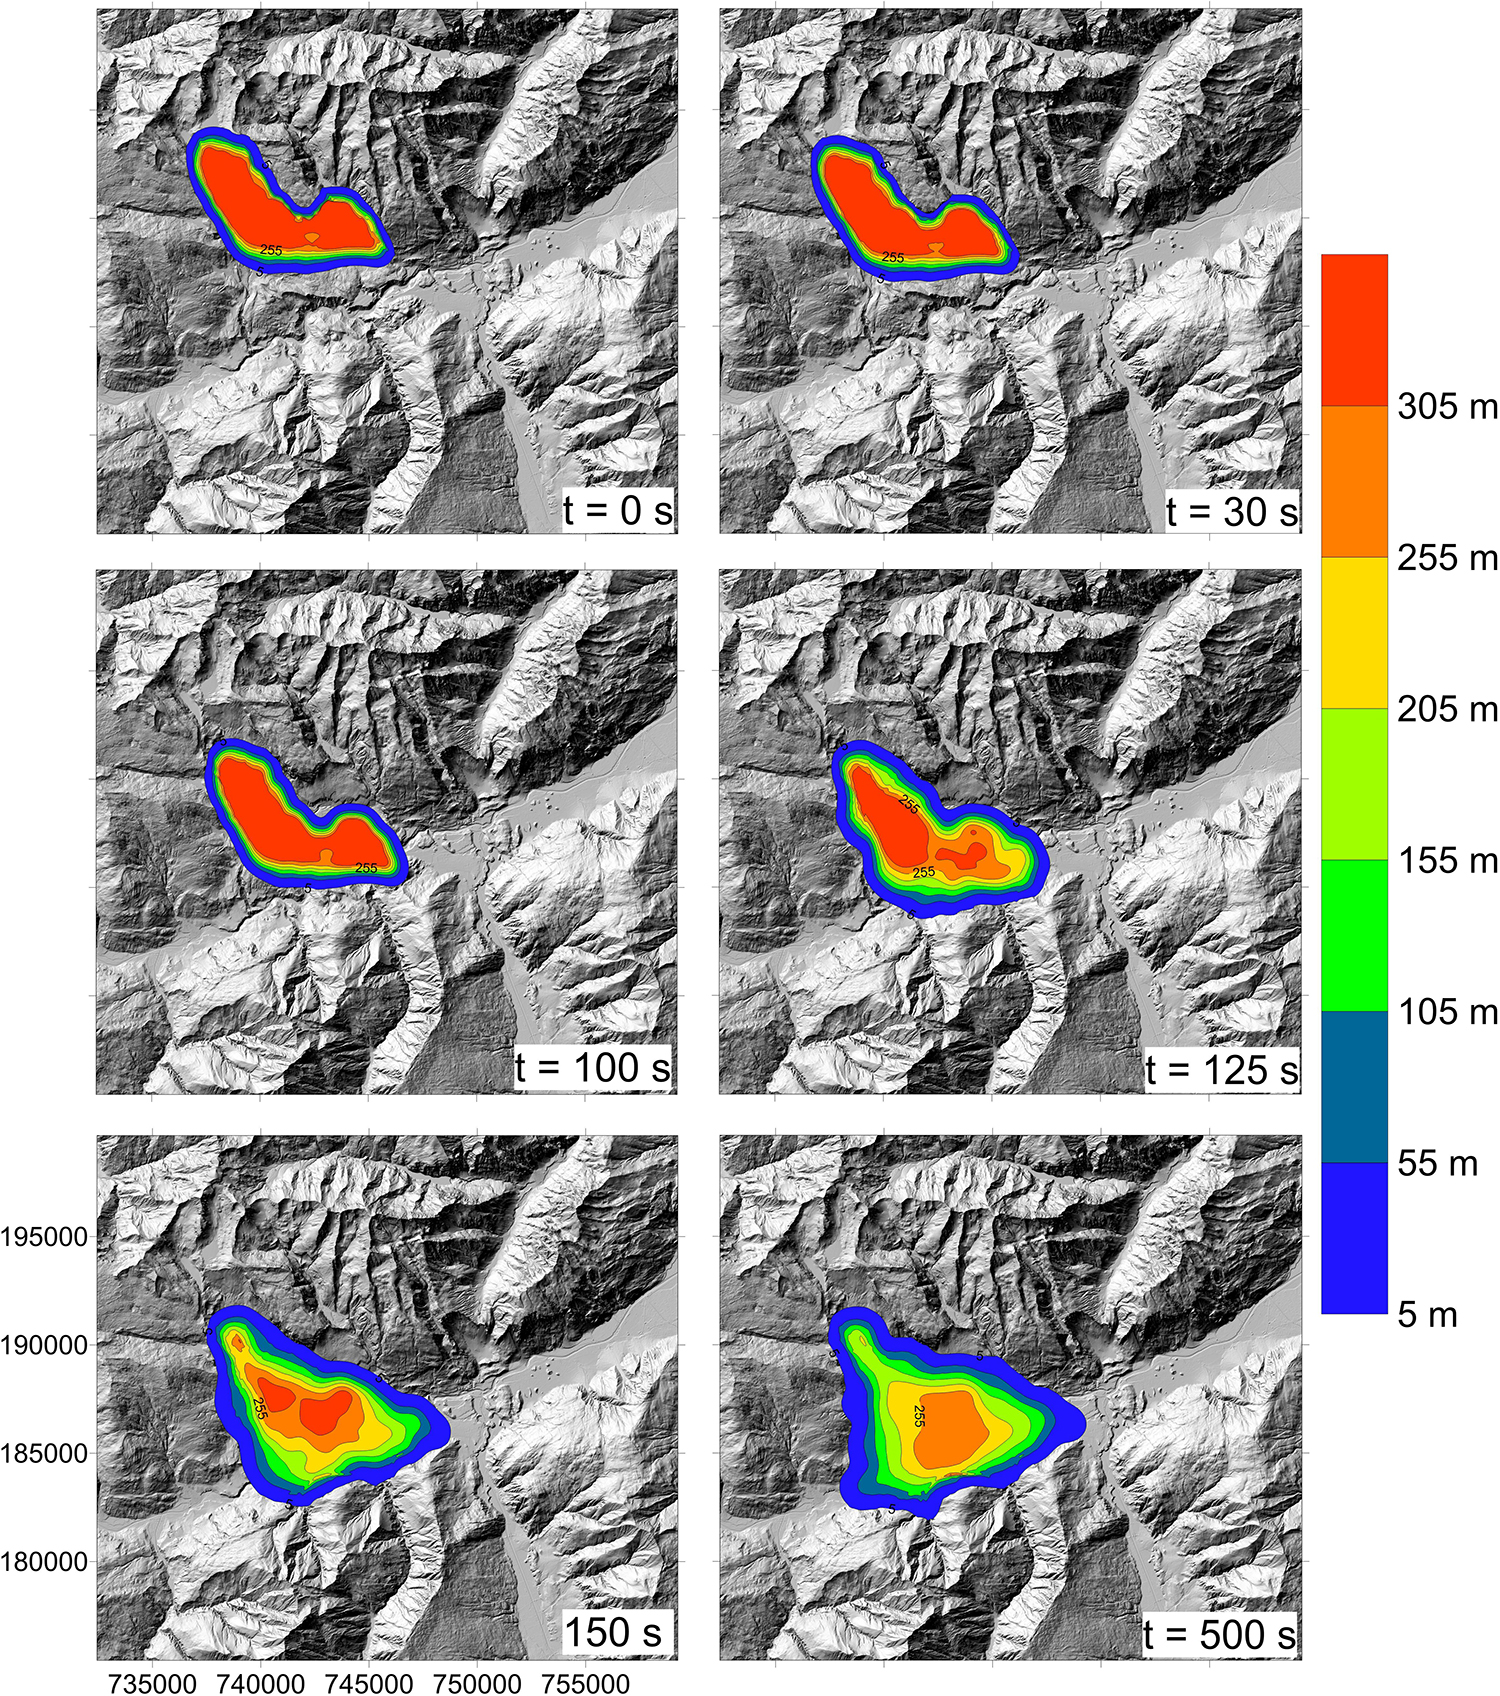
Figure 14. Simulated deposit depths at different times during the simulation overlain on the post-event topography. The mass is specified to turn flow-like at 100 s.
The rigid motion distance that produces the best-fit results is 2.5 km. This parameter is discussed further in the following section. The posterior analysis revealed that the best-fit Voellmy parameters are a friction parameter of 0.16, and a turbulence parameter of 600. These values are the same for both the one rheology simulation and the valley floor material zone of the two-rheology simulation. The back-analyzed parameters for the valley floor fit well with those determined for a number of case histories that likely overran and liquefied saturated sediments (Aaron and McDougall, 2019). Cases in the database that had similar back-analyzed parameters include the Frank Slide, the Hope Slide, and the Rautispitz rock avalanche (Cruden and Krahn, 1978; Mathews and McTaggart, 1978; Nagelisen et al., 2015). The available data for the impact area and deposit distribution constrained the friction parameter well, however, a large range of turbulence parameters, between about 200 and 2000, all give similar results. Further refining this calibration would require estimates of velocity (Aaron et al., 2019), which would be difficult to make for this prehistoric case.
The best-fit source zone friction angle is 9°, which is low, but follows the volume-dependent trend for source zone friction angles presented in Aaron and McDougall (2019). We note that this value cannot be directly compared to more commonly presented measurements of H/L (e.g., Scheidegger, 1973; Li, 1983), as the H/L ratio includes the effect of path material. The source zone friction angle is well-constrained with available field data, as there is minimal deposition in the upper part of the source zone. Reproducing this observation requires a low friction angle. When a higher friction angle of 15° is used, which corresponds to that required for stability in our 2D stability models, the mass is simulated to remain in the source zone (Figure 13D).
Discussion
Our analysis has revealed important information regarding the preparatory and triggering factors that governed the pre-failure behavior of the FRRA. Geomorphic and structural analyses show that the slide was structurally controlled – present-day features are bounded by discontinuities parallel to the discontinuity sets determined from rock mass characterization (Figure 9).
According to 2D modeling results, the presence of one or several weak layers, presumably marl layers, is required for sliding failure to occur. Such marl layers have been found in subsurface drilling at this site (Buechi and Mueller, 1994), and in outcrops and thin sections taken at the elevation of the sliding zone (Figure 8). However, at present only mm- to cm-thick layers have been identified, and our analysis results suggest that persistent weak layers must be present at multiple elevations in the site stratigraphy (due to the stepped rupture surface) to explain failure. We note that the modeled layer thickness and depth did not significantly change simulation results, but that layer persistence was important. Including multiple marl-like layers in our models suggested that the deepest always showed the most strain, but other weak layers were strained as well. It is thus feasible that multiple closely spaced weak layers would lead to similar initiation behavior as one “equivalent” weakness zone. In reality, a combination of factors could have contributed to creating these persistent “weak layers” within the otherwise competent limestones: (i) multiple thin stratigraphic layers with increased content in sheet silicates and marl-like properties (low friction and cohesion), (ii) multiple weak layers resulting from tectonic activity, such as shearing along bedding-parallel marly limestone layers or fractures. Periodic loading from pore pressures cycles in karst systems and moderate seismic activity might have potentially propagated damage along these pre-existing planes of weakness. Failure within the limestones was possible only with strong seismic activity, and still required a weak limestone layer. Thus, our stability analysis demonstrates that weak layers are required for failure. These seem to be pre-existing lithological units, which may have been further weakened by shearing.
Our 2D stability analyses also suggest that a strong trigger is required for failure to occur, particularly if only a weak limestone layer is considered. This could either be through strong seismic shaking, or high pore-water pressures. Both Poschinger and Haas (1997) and Ivy-Ochs et al. (2009) note that the FRRA occurred during the early Holocene, when the climate was warmer and wetter. This cannot rule out a seismic trigger, however, as PGA values of 0.2–0.3 have been estimated with a 1:10,000 year return period in the study region by Wiemer et al. (2016).
Once the factor of safety of the rock slide dropped below one, our morphological observations and modeling results suggest that the FRRA was separated into several compartments, with the material closest to the Vorderrhein valley bottom failing first, allowing the material above to start to move. Steps in the failure surface suggest complex development of the surface, most likely including pre-existing, bedding-parallel discontinuities and brittle fracture of rock bridges.
As shown by comparing Figures 13B,D, catastrophic failure is not simulated to occur through loss of basal cohesion alone. The basal strength along the rupture plane must be reduced by 6°–10° in order for rapid acceleration and runout to occur. This mechanism must act soon after failure, or the mass will not rapidly accelerate. This requirement rules out many rock avalanche strength loss mechanisms, such as rapid undrained loading of saturated path material, as it must occur when the mass is still intact in the initial sliding phase. Some potential mechanisms by which this may occur include polishing and shearing of asperities (Cruden and Krahn, 1978), as well as frictional heating (Hu et al., 2018). It is interesting to note that in the absence of this immediate strength reduction, a catastrophic failure would have been unlikely to develop, and the morphology of the slope would have been more similar to that of a suspended rockslide, albeit closer to the valley floor than is typical of this landslide type. The lack of a catastrophic strength loss mechanism has been recently cited as a reason for the absence of a sudden failure of an accelerating rockslide responding to glacial retreat (Glueer et al., 2019).
Aaron and Hungr (2016b) note that the simulated impact area is relatively insensitive to the transition distance from flexible block to rock avalanche, provided that the transition from solid to frictional fluid occurs once the mass has started to vacate the source zone. The same is true of the present simulation of the Flims rock avalanche; however, we note that the deposit distribution is sensitive to this distance. We find that increasing the rigid motion distance increases the thickness of the deposit at the distal end, due to less internal deformation. Simulation of the thickest deposit points, observed based on the dissection of the debris by the Vorderrhein River (Figure 13), requires that the block travels ∼2.5 km as a rigid body, before behaving as a frictional fluid, with distributed internal shear.
Our numerical runout models likely represent two end members of rock avalanche motion, simulating either the sliding of an intact block, or flow of a material undergoing distributed and fully developed internal shearing. Field evidence suggests that the motion of the Flims rock avalanche was between these two extremes, and our simulation results reflect this. Thus, certain features of the model of “slab-on-slab” sliding proposed by Pollet et al. (2005) are qualitatively supported by our long rigid motion distance. However, our simulations require very low basal strength (discussed further in the following paragraph), and higher internal strength.
Calhoun and Clague (2018) suggest that there was a lake present at the toe of the slope, prior to the FRRA. The Bonaduz Gravel, now found in an extensive area surrounding the deposit, is likely composed of valley fill deposits originally located in this lake. Our runout analysis does not explicitly consider the effects of this lake, and momentum transfer that occurred when the rock avalanche impacted the lake and overrode and plowed the valley fill deposits (Jiang and LeBlond, 1992; Tinti et al., 2006; Si et al., 2018) are implicitly accounted for in the values of the calibrated basal resistance parameters. Our analysis does show that the Bonaduz Gravel would have been overridden and plowed by an ∼300 m thick wall of debris in ∼100 seconds. This substantial impact appears to have triggered a hyperconcentrated flow that traveled for ∼14 km (Calhoun and Clague, 2018).
When the valley fill deposits were overridden, they likely liquefied. This interpretation is supported by the presence of “Pavoni Pipes,” as detailed in Pavoni (1968) and Calhoun and Clague (2018). This liquefied material likely accounts for the low basal resistance parameters required along the path to reproduce the observed runout, as our calibrated parameters are similar to other cases that overran saturated substrate (Aaron and McDougall, 2019). It is interesting to note that the basal resistance parameters determined for the Flims rock avalanche match those of these other case histories, despite a difference in volume of 4 orders of magnitude.
Thus, our results provide some interesting constraints on the preconditioning, triggering and runout behavior of the FRRA, which can be generalized to many other large rock slope failures. The main preconditioning factors for this event are the structural geology, and the presence of low strength layers. High pore pressures and/or strong (1:10,000 year) seismic shaking could have then triggered failure along thin marl-like layers. During failure, a mechanism, such as polishing or frictional heating would then have to immediately reduce the basal strength along the rupture plane by 6°–10°, to enable rapid acceleration and long runout. The mass would have moved in a coherent manner for about 2.5 km, impacting the pre-failure lake and liquefying the valley fill deposits through a combination of overriding and plowing. Overriding these liquefied sediments further increased the mobility of the rock avalanche, leading to a total impact area of ∼69 km2.
Conclusion
We have performed a detailed analysis of the FRRA, the largest catastrophic failure in the European Alps. Our analysis included detailed engineering geomorphological mapping, two-dimensional stability and three-dimensional runout modeling. Our mapping and stability analysis show that this event was structurally controlled, that failure likely exploited weak, marl-like layers within the stratigraphic sequence and that either high pore pressures, seismic shaking or a combination of the two could have triggered failure. Our runout analysis suggested that liquefaction of alluvial sediments likely increased the runout of the event, however, catastrophic failure would not have occurred without a mechanism to reduce basal strength on the rupture plane by ∼6°–10°. The mechanisms by which this strength reduction occur are poorly understood at present, but appear to be crucial in explaining the occurrence of catastrophic failure at Flims, as well as many other rock avalanches around the world.
Data Availability Statement
The raw data supporting the conclusions of this article will be made available by the authors, without undue reservation, to any qualified researcher.
Author Contributions
JA helped to conceive of the study, performed the runout analysis, and assisted with writing the manuscript. AW conceived of the study, assisted with the geomorphic mapping and stability analysis, and assisted with writing the manuscript. SL helped to conceive of the study, assisted with results interpretation, and writing the manuscript. SV performed the stability analysis and geomorphic mapping, and assisted with writing the manuscript. All authors contributed to the article and approved the submitted version.
Funding
Funding for this work was provided by the Chair of Engineering Geology, Department of Earth Sciences, ETH Zürich.
Conflict of Interest
SV was employed by geoformer igp AG during the preparation of this manuscript.
The remaining authors declare that the research was conducted in the absence of any commercial or financial relationships that could be construed as a potential conflict of interest.
The handling Editor declared a past co-authorship with one of the authors SL.
Acknowledgments
Thanks are due to Dr. Martin Ziegler and Dr. Matthew Perras for helping with the field data acquisition and sample preparation. We thank former BSc students Alicia Martinez for analyzing the thin sections, and Benjamin Ruf for his contributions to geomorphic mapping. Discussions with Andreas Von Poschinger, Jurgen Caprez, John Clague, and Adrian Pfiffner greatly improved this manuscript. Comments from two reviewers greatly improved this work.
References
Aaron, J., and Hungr, O. (2016a). Dynamic analysis of an extraordinarily mobile rock avalanche in the Northwest Territories, Canada. Can. Geotech. J. 53, 899–908. doi: 10.1139/cgj-2015-0371
Aaron, J., and Hungr, O. (2016b). Dynamic simulation of the motion of partially-coherent landslides. Eng. Geol. 205, 1–11. doi: 10.1016/j.enggeo.2016.02.006
Aaron, J., and McDougall, S. (2019). Rock avalanche mobility: the role of path material. Eng. Geol. 257:105126. doi: 10.1016/j.enggeo.2019.05.003
Aaron, J., McDougall, S., Moore, J. R., Coe, J. A., and Hungr, O. (2017). The role of initial coherence and path materials in the dynamics of three rock avalanche case histories. Geoenviron. Disasters 4:5. doi: 10.1186/s40677-017-0070-4
Aaron, J., McDougall, S., and Nolde, N. (2019). Two methodologies to calibrate landslide runout models. Landslides 16, 1–14. doi: 10.1007/s10346-018-1116-8
Agliardi, F., Crosta, G., and Zanchi, A. (2001). Structural constraints on deep-seated slope deformation kinematics. Eng. Geol. 59, 83–102. doi: 10.1016/S0013-7952(00)00066-1
Altindag, R., and Guney, A. (2010). Predicting the relationships between brittleness and mechanical properties (UCS, TS and SH) of rocks. Sci. Res. Essays 5, 2107–2118.
Bowman, E. T., Take, W. A., Rait, K. L., and Hann, C. (2012). Physical models of rock avalanche spreading behaviour with dynamic fragmentation. Can. Geotech. J. 49, 460–476. doi: 10.1139/t2012-007
Buechi, Mueller, A. G. (1994). A19 Oberalpstrasse Umfahrung Flims: Auflageprojekt Geologie, Hydrogeologie und Geotechnik. INFO TBA: Chur.
Cabernard, V., Stoffel, M., and Monbaron, M. (2004). “Der Fidazer Felssturz von 1939: analyse and simulation,” in Turbulenzen in der Geomorphologie. Publikation zur Jahrestagung der Schweizerischen Geomorphologischen Gesellschaft, 27.–29. März 2003, Erstfeld. Mitteilungen der Versuchanstalt für Wasserbau, Hydrologie und Glaziologie, Vol. 184, ed. H. E. Minor (Zürich: ETH Zürich), 1–12.
Calhoun, N. C., and Clague, J. J. (2018). Distinguishing between debris flows and hyperconcentrated flows: an example from the eastern Swiss Alps. Earth Surf. Process. Landf. 43, 1280–1294. doi: 10.1002/esp.4313
Caprez, J. (2008). Das Flimser Bergsturzereignis 3D-Geländerekonstruktion und Volumenberechnungen mit Hilfe von GIS - Diplomarbeit. Zürich: Universität Zürich.
Clayton, A., Stead, D., Kinakin, D., and Wolter, A. (2017). Engineering geomorphological interpretation of the Mitchell Creek Landslide, British Columbia, Canada. Landslides 14, 1655–1675. doi: 10.1007/s10346-017-0811-1
Coe, J. A., Baum, R. L., Allstadt, K. E., Kochevar, B. F., Schmitt, R. G., Morgan, M. L., et al. (2016). Rock-avalanche dynamics revealed by large-scale field mapping and seismic signals at a highly mobile avalanche in the West Salt Creek valley, western Colorado. Geosphere 12, 607–631. doi: 10.1130/GES01265.1
Cruden, D., and Krahn, J. (1978). Frank Rockslide, Alberta, Canada, ed. B. Voight (Amsterdam: Elsevier Scientific Publishing), 97–112.
Davies, T. R., McSaveney, M. J., and Hodgson, K. A. (1999). A fragmentation-spreading model for long-runout rock avalanches. Can. Geotech. J. 36, 1096–1110. doi: 10.1139/t99-067
De Blasio, F. V. (2011). Dynamical stress in force chains of granular media traveling on a bumpy terrain and the fragmentation of rock avalanches. Acta Mech. 221, 375–382. doi: 10.1007/s00707-011-0504-0
Deplazes, G. (2005). Quartärgeologische Kartierung des Oberen Teils der Gleitfläche des Flimser Bergsturzes. Zurich: ETH Zurich Engineering Geology.
Deplazes, G., and Anselmetti, F. S. (2007). Auf den spuren des flimser bergsurzes in lag la cauma und lag grond. Geosci. Actuel 3, 46–50.
Dufresne, A., Bösmeier, A., and Prager, C. (2016). Sedimentology of rock avalanche deposits – Case study and review. Earth Sci. Rev. 163, 234–259. doi: 10.1016/j.earscirev.2016.10.002
Gischig, V., Preisig, G., and Eberhardt, E. (2016). Numerical investigation of seismically induced rock mass fatigue as a mechanism contributing to the progressive failure of deep-seated landslides. Rock Mech. Rock Eng. 49, 2457–2478. doi: 10.1007/s00603-015-0821-z
Gischig, V. S., Moore, J. R., Evans, K. F., Amann, F., and Loew, S. (2011). Thermomechanical forcing of deep rock slope deformation: 1. Conceptual study of a simplified slope. J. Geophys. Res. 116, 1–18. doi: 10.1029/2011JF002006
Glade, T., and Crozier, M. J. (2004). “The nature of landslide hazard impact,” in Landslide Hazard and Risk, eds T. Glade, M. Anderson, and M. J. Crozier (Hobken, NJ: John Wiley and Sons), 43–74.
Glueer, F., Loew, S., Manconi, A., and Aaron, J. (2019). From toppling to sliding: progressive evolution of the Moosfluh Landslide, Switzerland. J. Geophys. Res. 124, 2899–2919. doi: 10.1029/2019JF005019
Grämiger, L. M., Moore, J. R., Vockenhuber, C., Aaron, J., Hajdas, I., and Ivy-Ochs, S. (2016). Two early Holocene rock avalanches in the Bernese Alps (Rinderhorn. Switzerland). Geomorphology 268, 207–221. doi: 10.1016/j.geomorph.2016.06.008
Hoek, E. (2007). Practical rock engineering. Environ. Eng. Geosci. 14, 55–57. doi: 10.2113/gseegeosci.14.1.55
Hu, W., Huang, R., McSaveney, M., Zhang, X., Yao, L., and Shimamoto, T. (2018). Mineral changes quantify frictional heating during a large low-friction landslide. Geology 46, 223–226. doi: 10.1130/g39662.1
Hungr, O. (2017). “Chapter 9 - Runout Analysis,” in Guidelines for Mine Waste Dump and Stockpile Design, eds M. Hawley and J. Cunning (Clayton: CSIRO Publishing).
Hungr, O., and Evans, S. G. (2004). Entrainment of debris in rock avalanches: an analysis of a long run-out mechanism. Geol. Soc. Am. Bull. 116, 1240–1252. doi: 10.1130/B25362.1
Hungr, O., Leroueil, S., and Picarelli, L. (2014). The Varnes classification of landslide types, an update. Landslides 11, 167–194. doi: 10.1007/s10346-013-0436-y
Ivy-Ochs, S., Poschinger, A. V., Synal, H. A., and Maisch, M. (2009). Surface exposure dating of the Flims landslide, Graubünden, Switzerland. Geomorphology 103, 104–112. doi: 10.1016/j.geomorph.2007.10.024
Jiang, L., and LeBlond, P. H. (1992). The coupling of a submarine slide and the surface waves which it generates. J. Geophys. Res. Oceans 97, 12731–12744. doi: 10.1029/92JC00912
Li, T. (1983). A mathematical model for predicting the extent of a major rockfall. Zeitschrift Geomorphol. Neue Folge 27, 473–482.
Mathews, W. H., and McTaggart, K. C. (1978). Hope rockslides, british columbia, canada. Develop. Geotech. Eng. 14, 259–275. doi: 10.1016/B978-0-444-41507-3.50015-5
McDougall, S., and Hungr, O. (2004). A model for the analysis of rapid landslide motion across three-dimensional terrain. Can. Geotech. J. 41, 1084–1097. doi: 10.1139/t04-052
Moore, J. R., Pankow, K. L., Ford, S. R., Koper, K. D., Hale, J. M., Aaron, J., et al. (2017). Dynamics of the Bingham Canyon rock avalanches (Utah, USA) resolved from topographic, seismic, and infrasound data. J. Geophys. Res. 122, 615–640. doi: 10.1002/2016JF004036
Nagelisen, J., Moore, J. R., Vockenhuber, C., and Ivy-Ochs, S. (2015). Post-glacial rock avalanches in the Obersee Valley. Glarner Alps, Switzerland. Geomorphology 238, 94–111. doi: 10.1016/j.geomorph.2015.02.031
Pavoni, N. (1968). Uber die Entstehung der Kiesmassen in Bergsturzgebiet von Bonaduz-Reichenau (Graubünden). Ecl. Geol. Helvetiae 61, 494–500.
Pollet, N., Cojean, R., Couture, R., Schneider, J., Strom, A. L., Voirin, C., et al. (2005). A slab-on-slab model for the Flims rockslide (Swiss Alps). Can. Geotech. J. 42, 587–600. doi: 10.1139/T04-122
Pollet, N., and Schneider, J.-L. (2004). Dynamic disintegration processes accompanying transport of the Holocene Flims sturzstrom (Swiss Alps). Earth Planet. Sci. Lett. 221, 433–448. doi: 10.1016/S0012-821X(04)00071-8
Poschinger, A. V., and Haas, U. (1997). Der Flimser Bergsturz, doch ein warmzeitliches Ereignis? Bull. Angewandte Geol. 2, 35–46.
Poschinger, A. V., and Kippel, T. (2009). Alluvial deposits liquefied by the Flims rock slide. Geomorphology 103, 50–56. doi: 10.1016/j.geomorph.2007.09.016
Poschinger, A. V., Wassmer, P., and Maisch, M. (2006). “The flims rockslide: history of interpretation and new insights,” in Landslides from Massive Rock Slope Failure, NATO Science Series, IV, Earth and Environmental Sciences, Vol. 49, eds S. Evans, G. Scarascia Mugnozza, A. L. Strom, and R. Hermans (Berlin: Springer), 329–356. doi: 10.1007/978-1-4020-4037-5_18
Preisig, G., Eberhardt, E., Smithyman, M., Preh, A., and Bonzanigo, L. (2016). Hydromechanical rock mass fatigue in deep-seated landslides accompanying seasonal variations in pore pressures. Rock Mech. Rock Eng. 49, 2333–2351. doi: 10.1007/s00603-016-0912-5
Pyke, R. (1991). Selection of Seismic Coefficients for Use in Pseudo-Static Slope Stability Analyses. Available at: https://tagasoft.com/seismic-coefficients/
Scheidegger, A. (1973). On the Prediction of the Reach and Velocity of Catastrophic Landslides. Rock Mech. 5, 231–236. doi: 10.1007/bf01301796
Schindler, C., Cuenod, Y., Eisenlohr, T., and Joris, C. L. (1993). Die Ereignisse vom 18. April und 9. Mai 1991 bei Randa (VS): ein atypischer Bergsturz in Raten. Eclogae. Geol. Helv. 86, 643–665.
Schwarz-Zanetti, G., Deichmann, N., Fäh, D., Masciadri, V., and Goll, J. (2004). The earthquake in Churwalden (CH) of September 3, 1295. Ecl. Geol. Helvetiae 97, 255–264. doi: 10.1007/s00015-004-1123-8
Si, P., Aaron, J., McDougall, S., Lu, J., Yu, X., Roberts, N. J., et al. (2018). A non-hydrostatic model for the numerical study of landslide-generated waves. Landslides 15, 711–726. doi: 10.1007/s10346-017-0891-y
Thuro, K., and Hatem, M. (2010). The 1806 Goldau Landslide Event–Analysis of a Large Rock Slide, (Zehnder 1988). 3693–3700. Available at: http://www.geo.tum.de/people/thuro/pubs/2010_iaeg_goldau.pdf (accessed January 30, 2014).
Tinti, S., Pagnoni, G., and Zaniboni, F. (2006). The landslides and tsunamis of the 30th of December 2002 in Stromboli analysed through numerical simulations. Bull. Volcanol. 68, 462–479. doi: 10.1007/s00445-005-0022-9
Volken, S. (2015). The Flims Rockslide: A New Perspective on Failure Mechanisms and Kinematics. MSc Thesis, ETH Zurich, Zurich.
Volken, S., Wolter, A., and Loew, S. (2016). The Flims Rockslide: new investigations of the kinematics and mechanics using an integrated geotechnical approach. Landslides and Engineered Slopes. Exp. Theor. Pract. 2005, 1995–2000. doi: 10.1201/b21520-250
Wiemer, S., Danciu, L., Edwards, B., Marti, M., Fäh, D., Hiemer, S., et al. (2016). Seismic Hazard Model 2015 for Switzerland (SUIhaz2015). Zurich: ETH Zurich, 164. doi: 10.12686/a2
Wolter, A., Gischig, V., Stead, D., and Clague, J. J. (2016). Investigation of geomorphic and seismic effects on the 1959 Madison Canyon, Montana, landslide using an integrated field, engineering geomorphology mapping, and numerical modelling approach. Rock Mech. Rock Eng. 49, 2479–2501. doi: 10.1007/s00603-015-0889-5
Keywords: Flims rockslide/rock avalanche, engineering geological mapping, failure mechanisms, runout modeling, initial coherence, rock slope failure
Citation: Aaron J, Wolter A, Loew S and Volken S (2020) Understanding Failure and Runout Mechanisms of the Flims Rockslide/Rock Avalanche. Front. Earth Sci. 8:224. doi: 10.3389/feart.2020.00224
Received: 25 March 2020; Accepted: 27 May 2020;
Published: 30 June 2020.
Edited by:
Tim Davies, University of Canterbury, New ZealandReviewed by:
Andreas Von Poschinger, Bavarian Environment Agency, GermanyGiovanni Battista Crosta, University of Milano-Bicocca, Italy
Copyright © 2020 Aaron, Wolter, Loew and Volken. This is an open-access article distributed under the terms of the Creative Commons Attribution License (CC BY). The use, distribution or reproduction in other forums is permitted, provided the original author(s) and the copyright owner(s) are credited and that the original publication in this journal is cited, in accordance with accepted academic practice. No use, distribution or reproduction is permitted which does not comply with these terms.
*Correspondence: Jordan Aaron, jordan.aaron@erdw.ethz.ch