The Blue Water Footprint of the Spanish Wine Industry: 1935–2015


1
Department of Economic Analysis, Universidad de Zaragoza, Gran Vía 2, 50005 Zaragoza, Spain
2
Department of Economic Analysis, Universidad de Zaragoza and Instituto Agroalimentario de Aragón (UNIZAR-CITA), Tarazanas 4, 44003 Teruel, Spain
3
Department of Economics, Universidad de Alcalá, Plaza de la Victoria 2, 28002 Alcalá de Henares, Spain
4
Department of Aplied Economics and Economic History, Universidad de Zaragoza and Instituto Agroalimentario de Aragón (UNIZAR-CITA), Gran Vía 2, 50005 Zaragoza, Spain
*
Author to whom correspondence should be addressed.
Water 2020, 12(7), 1872; https://doi.org/10.3390/w12071872
Submission received: 8 April 2020
/
Revised: 19 June 2020
/
Accepted: 28 June 2020
/
Published: 30 June 2020
(This article belongs to the Special Issue Virtual Water Trade and Water Resources Economics)
Abstract
:The impact of economic growth on natural resources and the environment constitutes a fundamental topic in current research. In particular, water, a fundamental resource for human beings, has been subject to intense pressure in recent decades. Within this context, this article examines the growth of the blue water footprint of the Spanish wine industry and its environmental impact. In order to do this, we will first calculate the blue water footprint of wine, using a bottom-up methodology. Our methodology introduces certain advances with respect to those usually used. Our results show a very fast increase of the blue water footprint from 1995, which has multiplied six-fold in twenty years with an extreme concentration in the region of Castilla-La Mancha, which accounts for 70% of this increase. The expansion of irrigated vine growing in this region has played a relevant role in the serious problems suffered by its aquifers.
1. Introduction
In economics, natural resources are traditionally considered as a crucial asset for driving growth [1]. Their abundance is seen as a “blessing” for those countries that are fortunate enough to have them. However, in recent decades, new views have emerged that take a more critical and less complacent perspective of the meaning of this abundance of resources [2,3,4,5,6]. On the other hand, from an environmental point of view, it has been emphasised that an excessive exploitation of these resources could lead to their exhaustion or the deterioration of their quality as well as possible harmful and irreversible impacts on the environment [7,8,9,10,11,12]. We could say that an abundance of natural resources drives economic growth, but also that this growth could be threatened by this abundance, or that the environmental impacts generated by the growth could be severe and outweigh the benefits obtained from their exploitation. It is not possible to determine a priori the net effect of this availability of natural resources; therefore, it is essential to complement the theoretical studies on this topic with empirical studies that analyse the situation for different geographic spaces, products or periods [6].
From this perspective, water is a highly important product for these types of studies. Economic growth has had a notable impact on water use. While global water withdrawals remained stable for centuries, they increased thirty-five-fold between 1687 and 1987 and there was a forty-fold increase in freshwater consumption from 1700 to 1900 and a seven-fold rise in the twentieth century [10,13]. Water use grew significantly due to the industrial revolution and the economic growth processes experienced initially by western countries. Water use has grown, mostly, because of the growth of agricultural production in the last two centuries and the resulting expansion of irrigation in arid or semi-arid regions [14,15].
In pre-industrial economies where agriculture was the principal economic activity, the availability of water was not only a basic conditioning factor for its productivity, together with other agroclimatic conditions, but it also determined, to a great extent, the type of activities developed or even their location within the space. Therefore, in arid or semi-arid countries, since ancient times intense efforts have been made by human beings to construct hydraulic infrastructures that enable agriculture to use ground water or river water [16,17]. The low level of technological development seriously limited the possibilities of this use but from the beginning of the twentieth century, the technological capacity gradually expanded, enabling increasingly larger hydraulic works to be constructed. Between 1900 and 1989 the irrigated area across the world grew from 48 to 235 million hectares [18]. In 2012, there were 324 million hectares equipped for irrigation [19]. Worldwide, irrigation is used on over 18% of cultivated land and provides between 30% and 40% of gross agricultural production, and these figures are higher in arid and semi-arid regions [20].
Irrigation has also been essential for using the modern agricultural technologies that emerged after the Second World War, such as high yield seeds [21]. This increasing technological capacity and the consequent expansion of hydraulic infrastructures have had a profound effect on the natural water cycle, the natural riverside spaces and the quality of water. Furthermore, the intensive exploitation of this resource has generated problems of scarcity, the depletion of water supplies in some areas and sometimes intense conflicts over its use.
In this context, this study focuses on how economic growth has affected water use, its availability and the pressure it is under. In our case, we seek to analyse the increase in water use in agriculture and how this has generated greater pressure on this resource. To achieve this objective, we have chosen as a case study the changes that have taken place in water use in wine production between 1935 and 2015. The selection of this product is interesting, as although between 1955 and 2010 wine only represented between 3% and 6% of the blue water consumption in agricultural production in Spain, it is one of the products that has produced the highest increase in the use of this kind of water. Furthermore, within the context of climate change and the growing concern for the reduction of the environmental impact of agricultural production, it is forecasted that the management of irrigation water in wine production will constitute a fundamental adaptation strategy in many areas, with an increase in the number of conflicts over its sustainable management and use [22].
The methodological approach adopted in this study is the water footprint. The water footprint is the total water required to produce goods or services and is usually expressed as the volume of water used per year. In this study, we focus on analysing the water necessary for agricultural production, in this case the production of wine. Therefore, it addresses the concept of virtual water or the volume of water required for the production of a given commodity. The virtual water content of products is classified into green water, rainwater precipitation evaporated as a result of the production, and blue water, surface or groundwater evaporated during a production process [23]. Although both are interrelated in the hydrological system, blue water has higher opportunity costs, given that it can be reallocated among different users [24]. Moreover, the increase in blue water use has very important economic implications, since it requires considerable capital investments. Consequently, we will analyse the blue water footprint, that is, the surface or groundwater that is consumed in wine production through irrigation. To do this, the methodology used is the so-called bottom-up approach which involves estimating the water footprint based on the physical production of the product or products that are being analysed.
This study can be considered as being novel because, to date, very few studies have addressed the analysis of the blue water footprint of wine [25,26,27,28,29,30], even though climate change and the intense water pressure have converted the appropriate management of irrigation for wine growing into a crucial issue [22,31]. An additional novelty of this study is that we believe that it is the first time that a study with such a long time frame has been conducted for a single agricultural product.
The choice of Spain as a geographic area of study is justified by the importance that wine has had historically and continues to have today in the country’s agri-food sector. Spain is also one of the world’s most important wine producers and exporters. In 2014–2016 it was the world’s leading wine exporter in terms of volume and the third in terms of value. It has the largest vineyard area in the world, representing more than 5% of the country’s cultivated area. This percentage is only exceeded by countries with a wine production of over 200 ML per year, by Chile, Italy and Portugal [32]. Although vine growing adapts extraordinarily well to the semi-arid climate predominant in the majority of Spain, its irrigated wine growing area has experienced considerable growth over the last two decades, from approximately 30,000 hectares between 1930 and 1990 to more than 180,000 today. Almost all of this growth took place between 1995 and 2015. An additional advantage of this case study is that in recent years abundant literature has been produced analysing the water footprint of Spanish agriculture from a long-term perspective, similar to our case [33,34,35,36,37,38,39,40]. This profuse literature can be explained by the important role that irrigation has played in the increase in Spain’s agricultural production since the mid twentieth century [41] and the intense conflicts that have arisen with respect to its distribution across territories and economic agents [33,42,43]. Furthermore, some studies have also conducted estimates of the water footprint of Spanish agriculture and some of its crops for the present day [44,45]. These analyses conclude that 80% of water use in Spain corresponds to agriculture [46]. The estimates of the blue water footprint of Spanish agricultural crop production oscillate between 11.9 km3 [47] and 15.6 km3 for the year 2001 [48] or 15.8 km3 for 2010 [35]. From a long-term perspective, the increase has been enormous. Between 1860 and 2008 the blue water footprint of Spanish agricultural production (vegetal and animal production) increased by 11.3 km3 [37]. If we consider only crop production, its blue water footprint approximately doubled between 1955 and 2010 [35].
As well as analysing the evolution in the blue water footprint of wine production for Spain, in order to study the impact of irrigated vineyards on water resources, we will focus on the region of Castilla-La Mancha, as this is where wine has the greatest participation in the blue water footprint of crop production. Castilla-La Mancha is located in south-eastern Spain and is made up of five provinces (Albacete, Ciudad Real, Toledo, Guadalajara and Cuenca). This region is an extensive central plateau with an area of around 30,500 km2 surrounded by several mountain systems (Cordillera Central, Sierra Morena and Montes de Toledo). Due to its location in the central part of Spain, it is characterised by Mediterranean weather with scarce precipitations, especially during the summer. Furthermore, this region typically has mild winters and hot summers. Castilla-La Mancha has two of the largest aquifers in Spain, the Western and Eastern La Mancha aquifers. The Western La Mancha aquifer with 5500 km2 is located in the upper Guadiana River Basin and close to the city of Ciudad Real. Meanwhile, the Eastern La Mancha aquifer, considered the largest aquifer in Spain, covers an area of over 7300 km2 and belongs to the Jucar River Basin, close to the city of Albacete. Around 90 percent of the entire water needs for irrigation in central and eastern Castilla-La Mancha rely on these two aquifers [49]. One of the main economic activities in Castilla-La Mancha is the agricultural sector, with its central and eastern parts dedicated to irrigation agriculture. Particularly important is the wine sector which has great economic and social relevance. Castilla-La Mancha is one of the regions with the largest vineyard areas in the world with 433,000 hectares in 2015. Furthermore, almost half of Spain’s total vineyards are concentrated in Castilla-La Mancha. Wine production is especially relevant in the provinces of Ciudad Real (170,000 ha), followed by Toledo (97,000 ha), Albacete (79,000 ha) and Cuenca (74,000 ha).
2. Material and Methods
In order to estimate the wine blue water coefficient for each province and for the period 1935–2015, we first take the average wine water intensities (m3/ton) for the period 1996–2005, drawn from Mekonnen and Hoekstra [23]. These coefficients express the volume of water consumption (m3) corresponding to water extracted from the soil or subsoil and applied through irrigation per unit of production, measured in tonnes, and are estimated as the ratio between evapotranspiration (ET) and yield (Y). These coefficients can be assumed to be representative at the province level since, as explained by Mekonnen and Hoekstra [50,51], the virtual water content of crops is obtained with a high-resolution level, using a grid-based dynamic water balance model applied on a global scale and a resolution level of 5 by 5 arc minute grid size (about 10 km by 10 km at the equator) [51]. These coefficients are provided for each Spanish region (17 Autonomous Regions) and we have applied each of them to the respective provinces of these regions. These wine water intensities take only into account the crop production in the field. They do not include the water used in the industrial process of wine making.
In the next step, these coefficients are updated for the period 1935–1995 and 2006–2015. The procedure for estimating environmental footprints for a long-term period has been the object of a wide scientific discussion, as it involves studying the historical ecological impacts of the long-term process of development [52]. One of the approaches has been to use fixed coefficients assuming constants yields in time. This assumption is not realistic if we take into account that the grape production per irrigated hectare in Spain increased approximately five-fold between 1935 and 2015. We will, therefore, use variable blue water footprints on the basis of changes in long-term yields. Following the approach of Doorenbos and Kassam, Dalin et al., Konar et al. and Duarte et al. [36,37,38,53,54,55] we will use crop yield series to estimate the changing blue virtual water content of wine as follows:
where Wcpt is the blue water coefficient for wine in the period of analysis (t from 1935 to 2015), Wcp represents the wine blue water intensity given by Mekonnen and Hoekstra [23], Ycp expresses the average wine yield of the reference period (1996–2005) and Ycpt is the annual wine yield for each specific year studied Equation (1) assumes a decreasing convex with respect to the origin, and a hyperbolic relationship whereby the virtual blue water content gradually declines as the crop yield increases [38]. As a result, we assume that the technological advances that have generated increasing yields over the long-term have also affected blue water consumption per tonne, which we can consider as efficiency gains.
However, although our study follows the above-mentioned articles, particularly those referring to Spain [36,37,38], assuming a variable blue water footprint, our approach differs to them in that we do not consider it appropriate to assume a constant proportion of irrigated cultivated land area, rather a variable. These studies apply the previously explained methodology to the total production of each crop and also use the total yields for their updating. These assumptions are reasonable when applied to agriculture as a whole, but if we do this for a single product, in which the proportion between the irrigated area and the total area has changed drastically, we would introduce a significant bias. Therefore, the case of wine in Spain requires an alternative methodology as the irrigated area for grape growing for wine production increased from 24,000 hectares in 1950 to 184,000 in 2013. Furthermore, the irrigated area of vineyard for winemaking has increased from 2% of the total vineyard area for winemaking to 21% today. Our alternative has been to only take into account the irrigated area of vineyard for winemaking and the wine production obtained from the irrigated vineyard. Therefore, in our case, in Equation (1), Wcpt is the blue water coefficient for wine in the period of analysis (t from 1935 to 2015), Wcp represents the wine blue water intensity given by Mekonnen and Hoekstra [23], Ycp expresses the average wine yield obtained from irrigated vineyards of the reference period (1996–2005) and Ycpt is the annual wine yield obtained from irrigated vineyards for each specific year studied. We have multiplied the coefficient obtained by the irrigated wine production of each province in each year, obtaining the blue water footprint. A limitation of our study is that although it reflects trend followed by the blue water footprint very well, the year on year variations of our historical series may show deviations between the blue water actually used and that calculated by us. However, we do not consider this to be a very significant problem for our objective.
In order to determine the importance of the wine blue water footprint on total crop production in Spain, we have used the calculations made by Cazcarro et al. [35].
Annual data on grape area and wine production at the provincial level from 1935 to 2015 have been taken from the Anuarios de Estadística of the Spanish Ministry of Agriculture. These series also tell us about the average yield of wine obtained from irrigated vineyards, also for each province.
3. Results
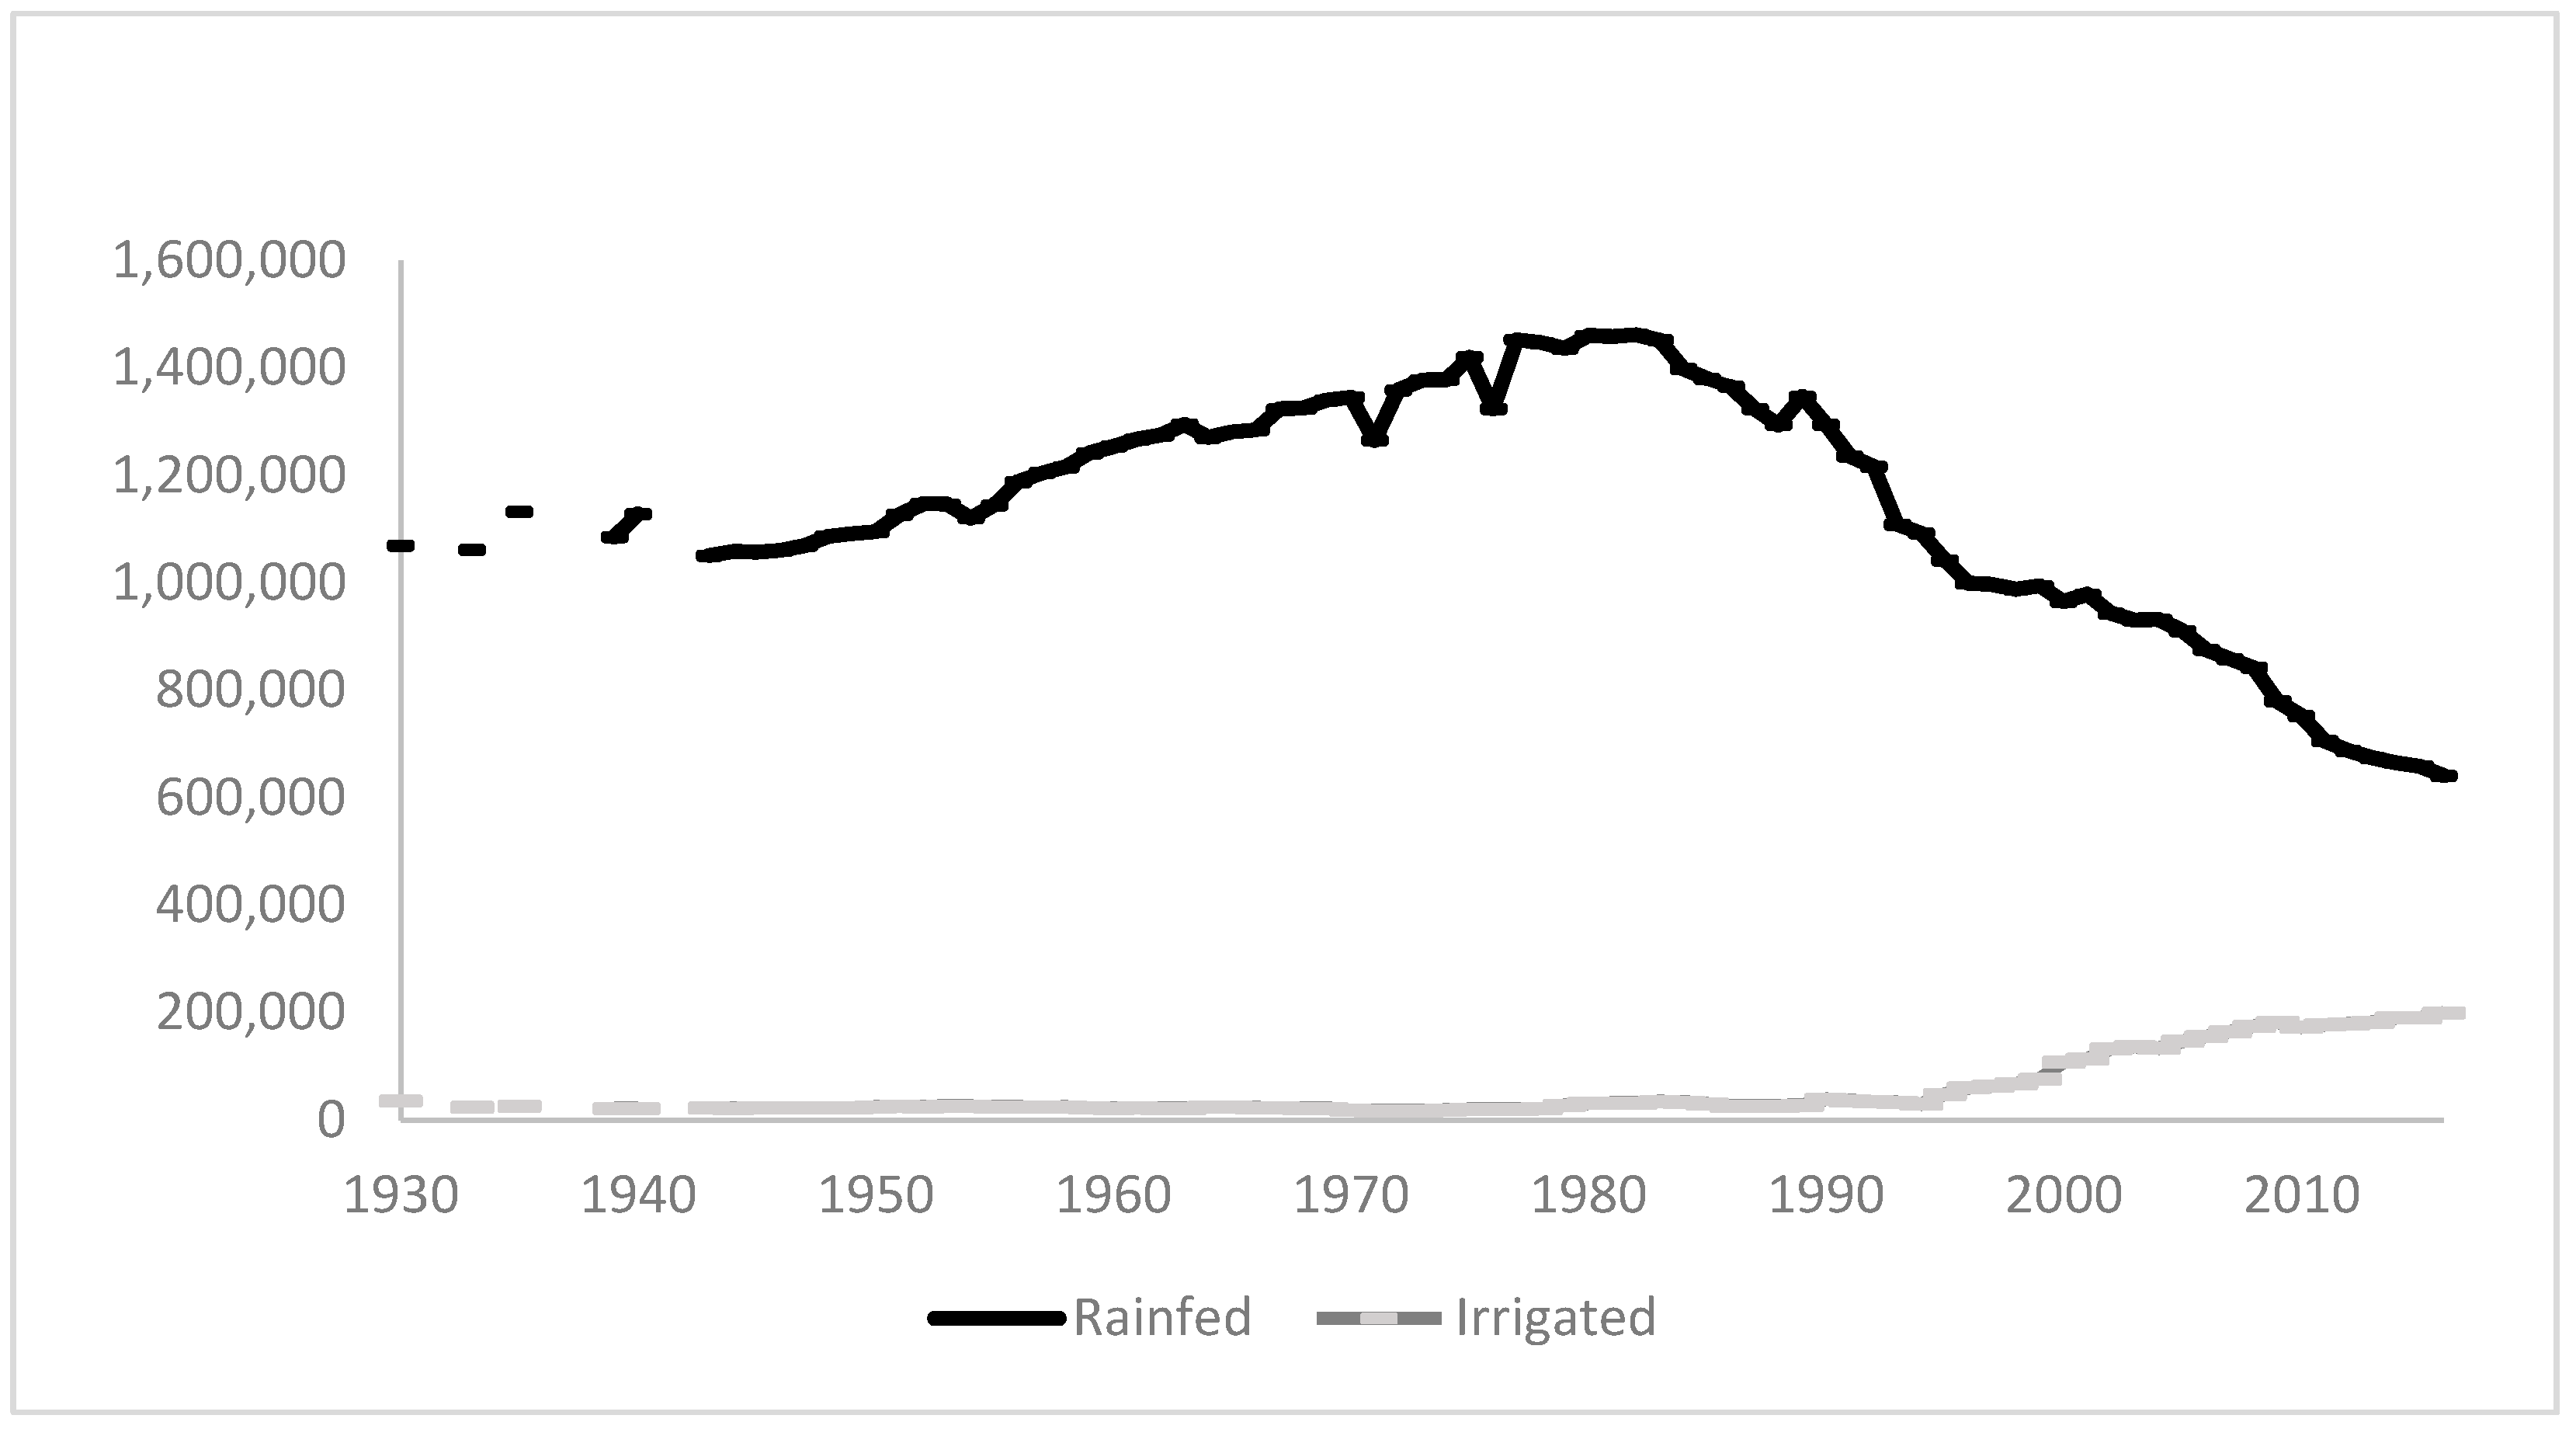
Traditionally, in Spain, vines occupied large areas of rainfed land and their presence on irrigated land was negligible. In the 1930s, irrigated vineyards accounted for less than 3% of total vineyards for wine production and in 1950 the figures continued at similar levels (Figure 1 and Table 1). In 1990, this percentage had not changed, standing at 2.5%; only 31,000 hectares of wine grape vineyards were irrigated while rainfed vineyards occupied an area of almost 1,300,000 hectares. The total vineyard area had hardly changed since the 1930s. However, from the mid 1990s, the changes took place at a very fast pace. On the one hand, the rainfed wine grape growing area contracted brutally by more than a third while the irrigated area increased substantially, exceeding 180,000 hectares.
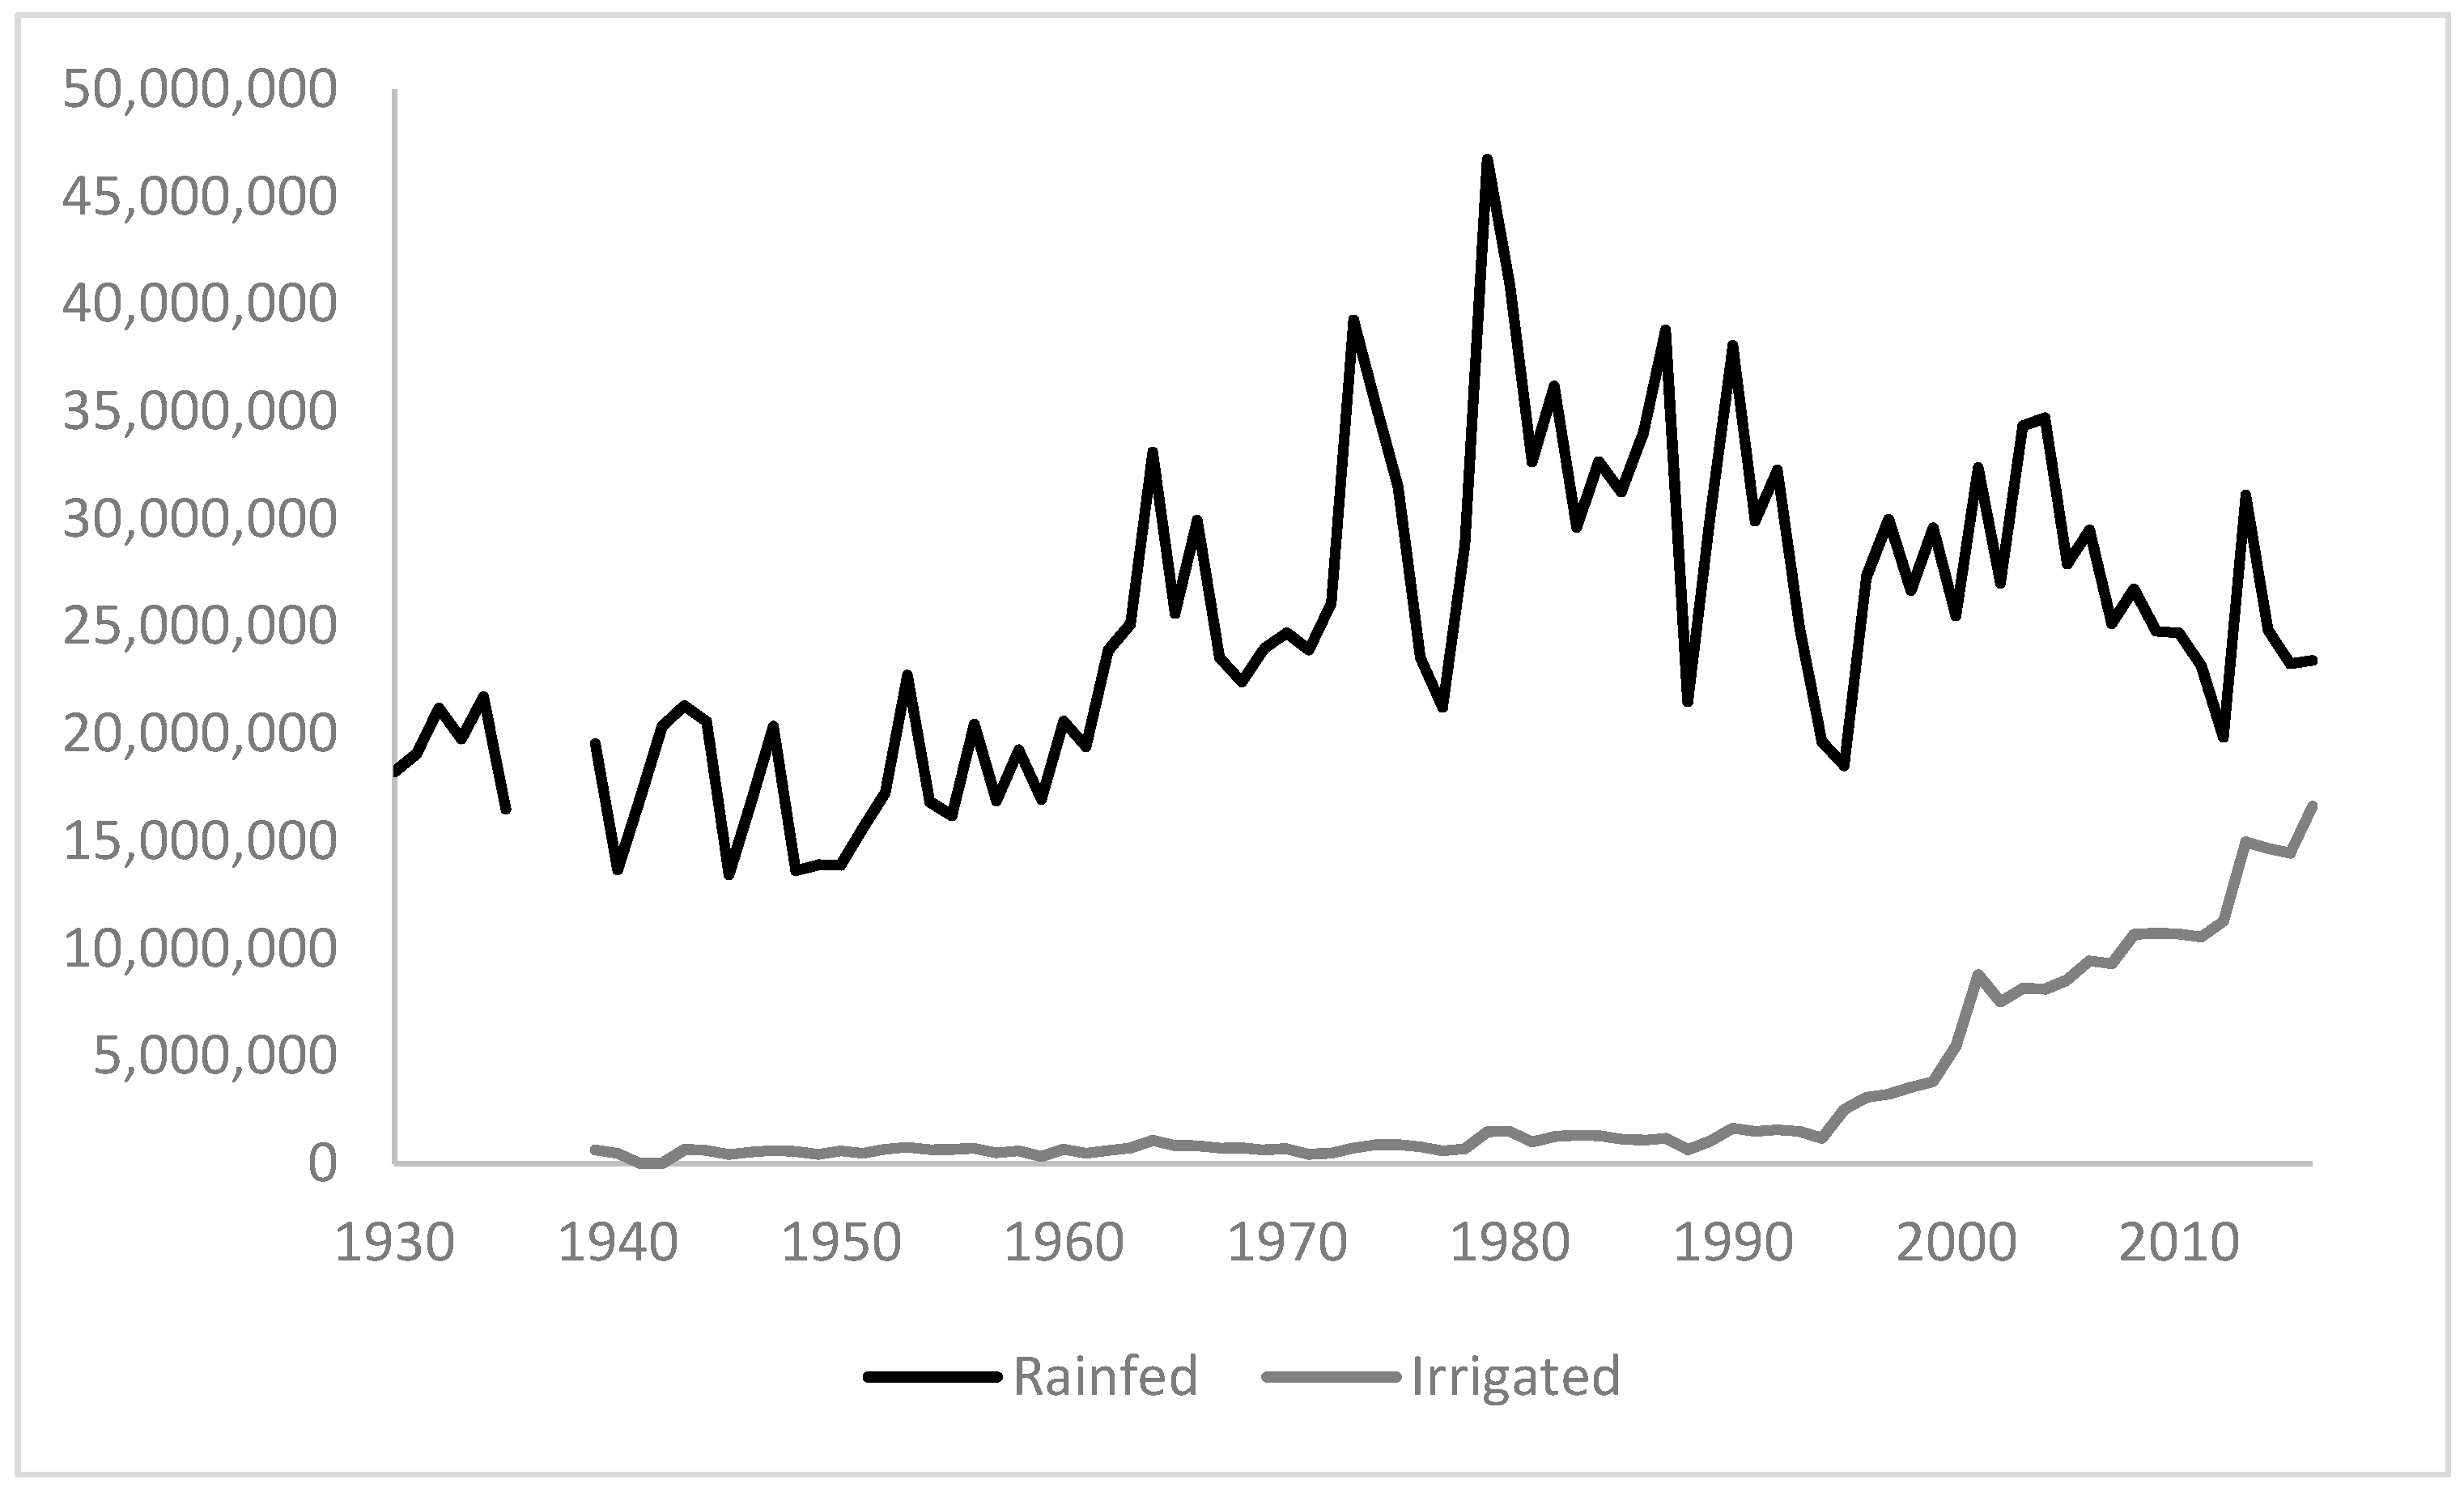
Although, as we have seen, the total area of vineyards and that of irrigated vineyards remained basically constant from 1930 until 1990, wine production grew strongly, particularly from the beginning of the 1960s and again from 1980, as a result of the technological changes introduced in wine growing (Figure 2 and Table 2). The weight of wine produced from irrigated grapes, in the same way as the irrigated area, barely changed and between 1930 and 1994 accounted for less than 4% of total wine production. After 1995, the increase in its share of the total was spectacular and today clearly accounts for over 50% of the wine produced.
In short, the analysis of the changes in the land area and production over the long term shows that until 1994 vineyards remained an almost exclusively rainfed crop and that the increase in wine production was due exclusively to technological improvements. After 1995, radical changes took place. While the area of rainfed vineyards decreased considerably and also their relative weight in total production, the increase in irrigated areas and production in absolute and relative terms has been spectacular.
However, the increase in the area of irrigated vineyards has not been distributed uniformly throughout the Spanish territory. In fact, the opposite is the case. This increase has been highly concentrated. Between 1988–1992 and 2011–2015 the area of irrigated vineyards in Spain increased by approximately 152,000 hectares (an increase of 479%). However, an increase of almost 114,000 hectares, that is, 75% of the total increase for the whole of Spain was concentrated in just five provinces (Table 1).
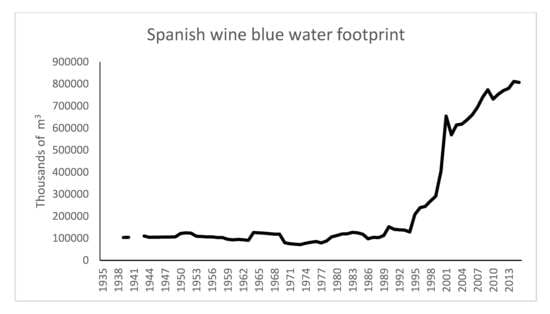
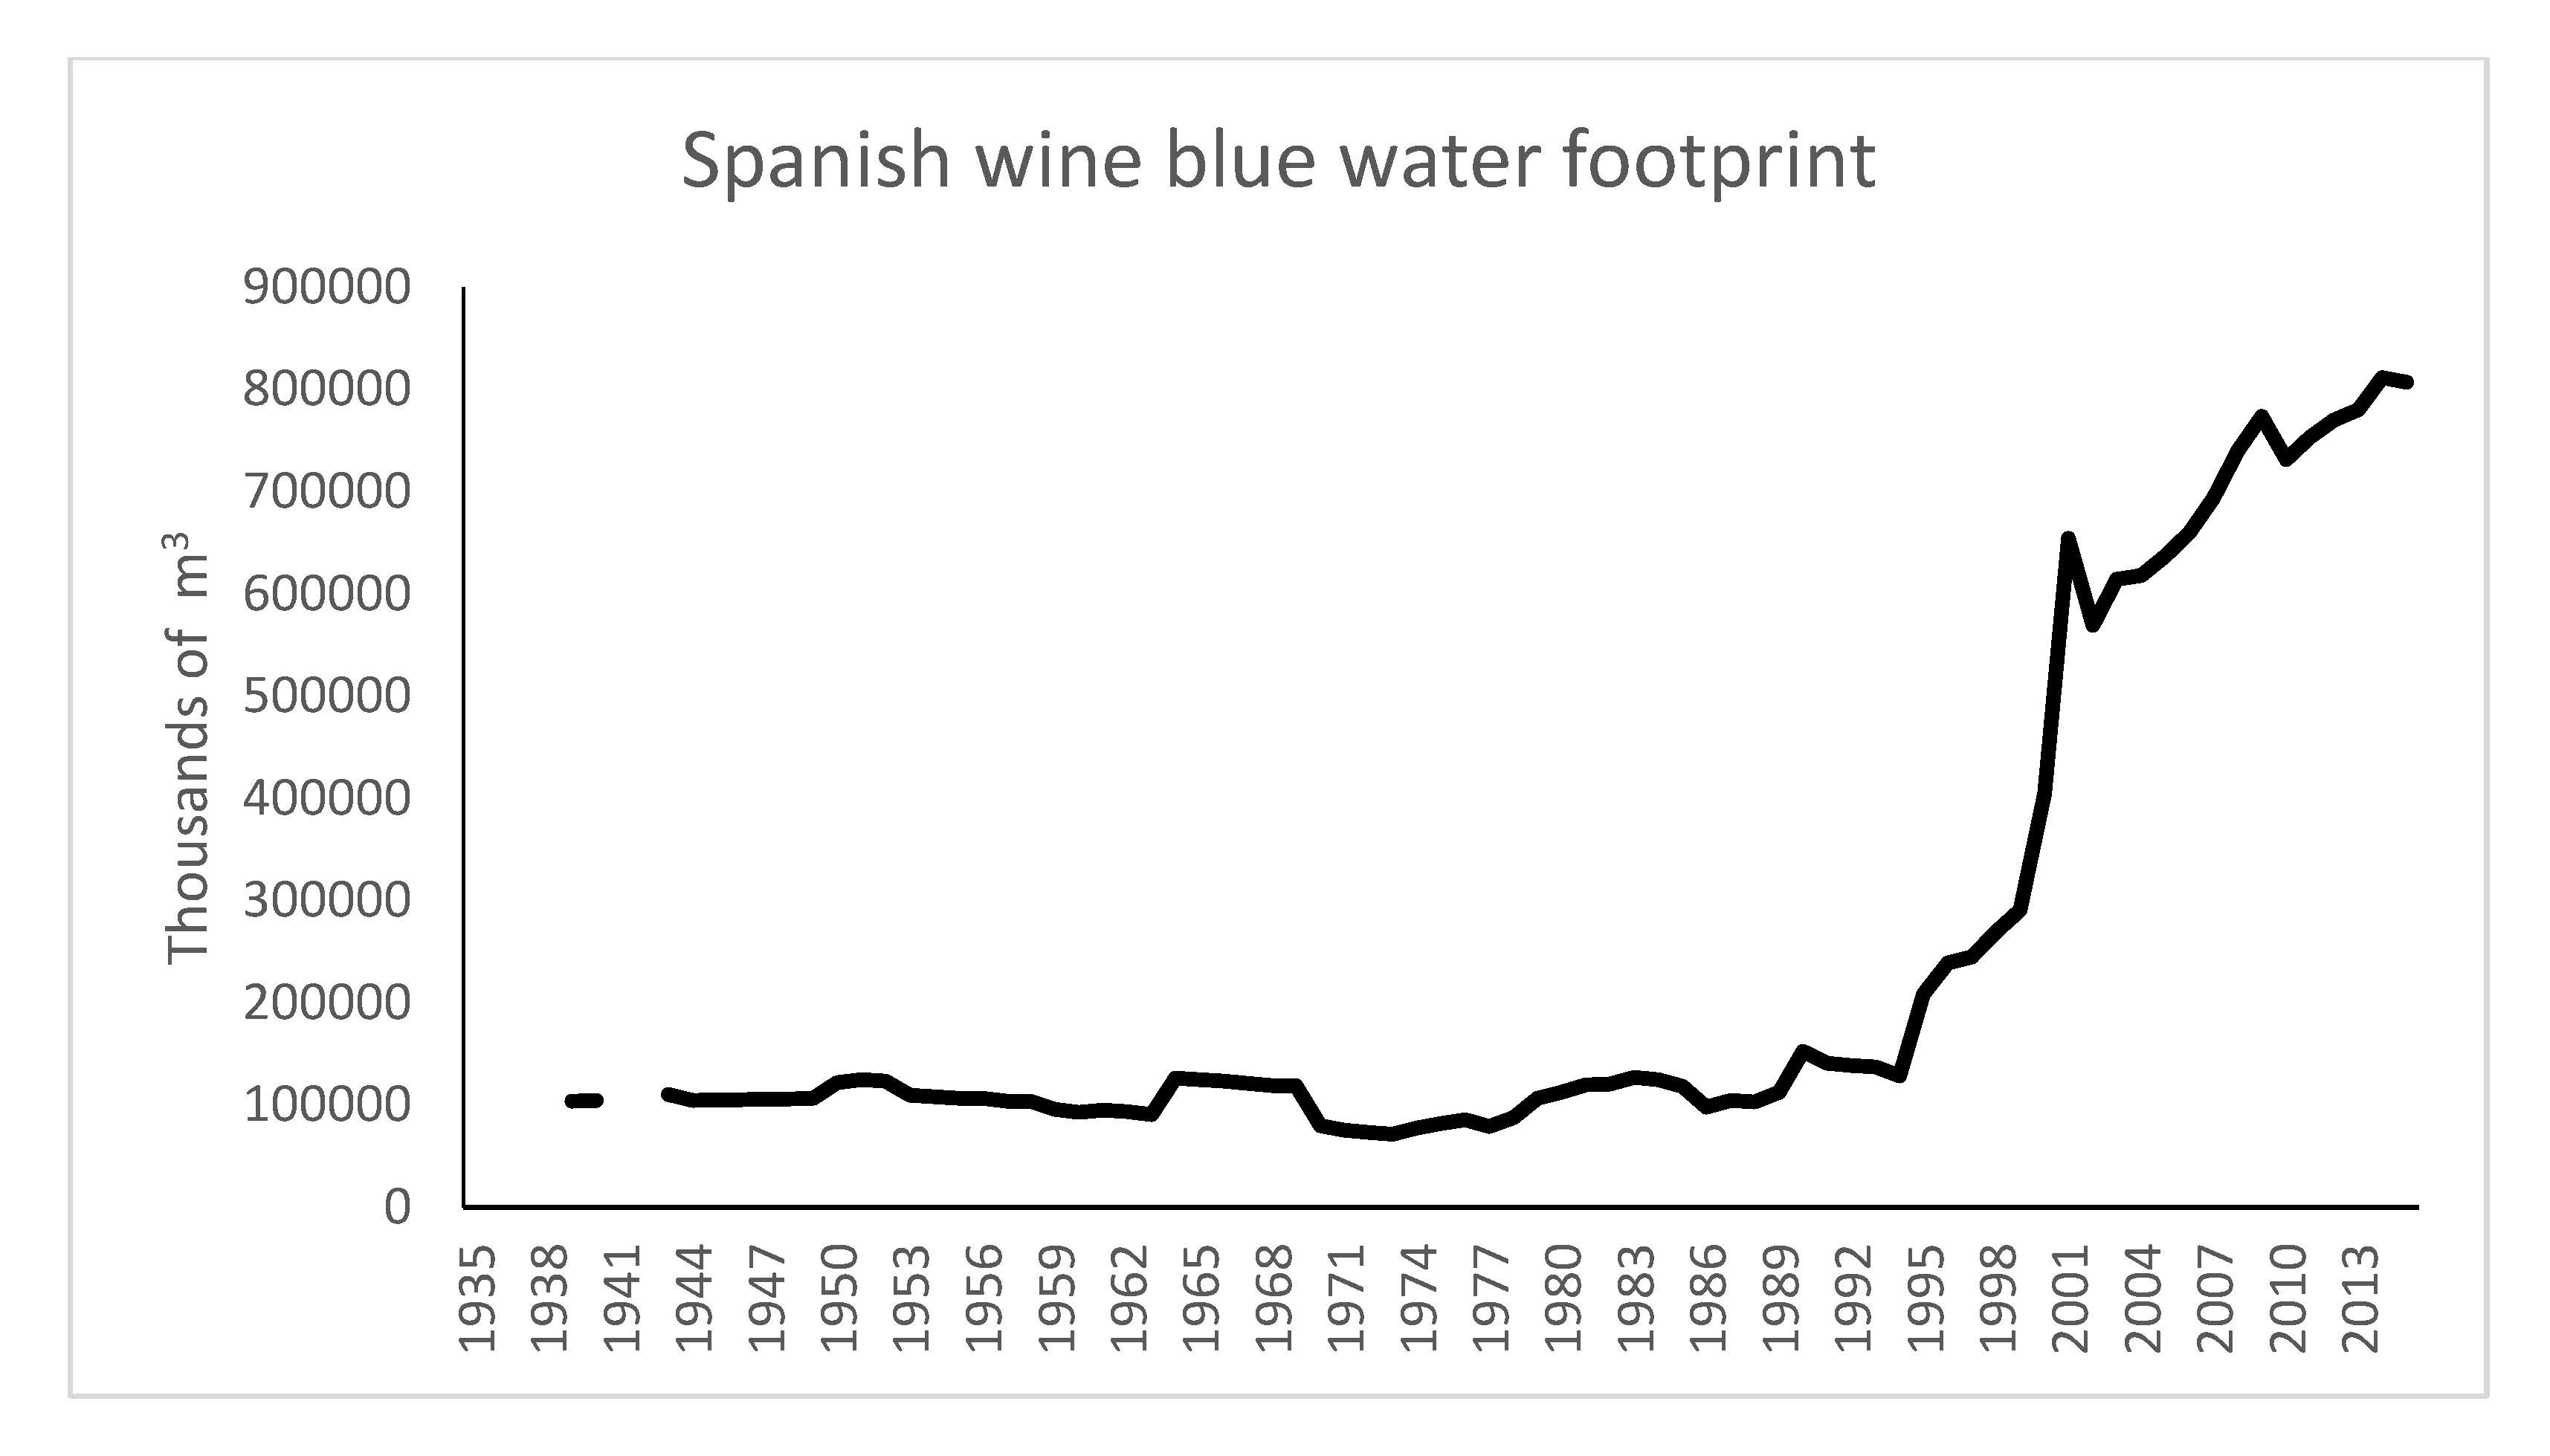
This trajectory of the evolution of the irrigated vineyards and wine production implies that the blue water footprint was practically constant from the 1930s until the mid 1990s with a slightly decreasing trend due to increased yields, implying certain efficiency gains (Figure 3). From 1994, the increase was very fast, as it more than quadrupled until 2001 and also continued to rise very quickly after this, although at a slower speed. In 2015, the blue water footprint of wine in Spain was six times higher than that of the first half of the 1990s. A spectacular increase in only twenty years.
The extreme concentration of irrigated vineyards in a few provinces also explains the extreme concentration in them of the blue water footprint of the wine industry in Spain. In the period 2011–2015, therefore, 71% was concentrated in just five provinces (Table 3).
Furthermore, these five provinces represented a 77% increase in the blue water footprint of the wine industry in Spain which took place between 1988–1992 and 2011–2015 (Table 4).
If we analyse the importance that the wine blue water footprint has had in total crop production, we can observe in Table 5 that for the whole of Spain it was almost marginal in 1955 as almost all of the vineyards were rainfed and in 2010, although it had increased significantly, it still accounted for a small part of the total. However, in the four provinces of Castilla-La Mancha studied in detail in this article (in Guadalajara, the fifth province of Castilla-La Mancha, there are practically no irrigated vineyards for wine making), we can appreciate a very significant change between these two years. In 1955, wine production incorporated a very small part of the blue water necessary for crop production as a whole. However, in 2010, the use of irrigation water in wine production constituted a very large part of that used by crop production as a whole. In these provinces, between 1955 and 2010, the weight of blue water incorporated in wine production over total crop production multiplied by 4.3, 8.5, 7.8 and 5.7 respectively. In these four provinces of Castilla-La Mancha, in 2010, only cereals incorporated more blue water in their production than wine.
The importance of the vineyards in the provinces of Castilla-La Mancha grew over the second half of the twentieth century. As we can observe in Table 5, this increasing relevance was reflected in the percentage that wine production represented of total crop production and in the incorporation of blue water by wine.
The strong increase in the blue water used in wine production in the provinces of Castilla-La Mancha led to it representing a substantial part of the increase in the water used in crop production (Table 6). As we can observe in Table 6, between 1955 and 2010, in the four provinces the increase in blue water used in wine production accounted for significant percentages with respect to the total increase in blue water incorporated in crop production, oscillating between a minimum of 17% in Cuenca and a maximum of 54% in Ciudad Real. For Spain as a whole, this contribution of wine to the total was modest as it only accounted for 6.5%.
4. Discussion
Vine growing in Spain has traditionally been a rainfed crop adapting well to the agroclimatic conditions of the country. Irrigation was reserved for staple crops in the traditional society. The modernisation of agriculture that took place mainly from the beginning of the twentieth century meant that irrigation was withdrawn from wheat and other crops that could also be rainfed and reserved for crops that could not grow without a supplementary supply of water. While the irrigated area was significantly extended, particularly after 1960, the vineyards continued to account for a very small share of this area. As a result, the blue water footprint of the wine industry in Spain was not very significant in both absolute and relative terms [36].
However, a transcendental change took place from 1994 onwards, when an exponential growth was experienced by the irrigated vine growing area and, consequently, by the blue water footprint of wine. The implementation of new irrigation technologies, such as drip irrigation, allowed the development of irrigated vineyards in areas with traditional water shortages. In recent years, Spain has become one of the European regions experiencing the greatest transformation of land dedicated to wine production [57]. The progressive increase in irrigated areas dedicated to vine growing was concentrated mainly in the region of Castilla-La Mancha, specialised in the production of grape juice and low quality wine, largely sold in bulk. The surplus was frequently distilled for producing alcohol. In terms of area, it is the largest vine growing region in the world and can almost be considered as a region in which the grape is almost a monoculture [58]. With the entry into the European Union in 1986, vine growing in Castilla-La Mancha underwent a profound restructuring process, with a strong reduction in the total area but a spectacular increase in irrigated vines through the drip system and a significant restructuring in terms of variety. The intense reduction in the area of the vines in the region (around 250,000 hectares less), has not led to a fall in production but just the opposite. The incorporation of irrigation into grape growing has mainly been implemented by the largest vineyards [59].
Within this context, support irrigation enabled a substantial increase in the yields per hectare of grapes, which gave rise to a greater profitability as the types of product obtained did not incur high costs in their industrial transformation. In Castilla-La Mancha, the yield of grapes per hectare is 50% higher where there is support irrigation than in the rainfed areas [56].The severe drought in the period 1991–1995 intensified the promotion of well-drilling to obtain ground water. Consequently, at the beginning of 1996, a law was passed with urgent measures to lift the ban on irrigating vineyards which had been established in the Statute of 1970 governing vines, wine and alcohol. In 2003, a new law confirmed the authorisation of irrigating vineyards. The Law 8/1996 of 15 January on Urgent Measures to Repair the Effects of the Drought lifted the ban on irrigation. The ban had been established in the Statue of 1970 governing vines, wine and alcohol in the Second Transitory Provision. Law 24/2003 on Vines and Wine confirmed the authorisation to irrigate. There is no question that these legislative changes favoured the expansion of irrigation in grape growing.
The expansion of the area of irrigated vines has given rise to an exponential increase in the blue water footprint of wine, even though the improved technology in production, with the result of higher yields, was contributing to reducing the water footprint of wine. Furthermore, the blue water footprint increase is particularly concentrated in the region of Castilla-La Mancha. The provinces of this region stand out for their very high share of the percentage that wine represents of the blue water footprint in crop production. Additionally in this region, the strong increase in the area of irrigated vineyards (more than 100,000 hectares of new irrigated vineyards between 1988–1992 and 2011–2015) fundamentally explains the significant increase in the blue water footprint, which has not been offset in any way by the appreciable rise in crop yields, which have led to a decrease in water intensity per hectolitre produced.
This expansion has had considerable consequences in terms of the contribution of wine to the blue water footprint of crop production. On the one hand, in the four provinces of Castilla-La Mancha taken together, and contrasting with Spain as a whole, wine-making grapes constitute the second most relevant crop in terms of the blue water that they incorporate in their production. On the other hand, in the increase in blue water use, vine growing represented a very important part in the four provinces of Castilla-La Mancha between 1955 and 2010. Furthermore, the contribution of the consumption of blue water in wine production in these provinces was highly relevant for understanding the greater needs of water resources in this region. In this way, the needs of the water resources in these provinces due to a wine production that makes a more intensive use of water increased during the second half of the twentieth century. Therefore, the agriculture of Castilla-La Mancha, particularly that related to wine growing, has, over these decades, followed the trend of Spanish agriculture towards crops that make a more intensive use of water, thanks, particularly to the incorporation of irrigation water [33,60]. Consequently, in any discussion on the water pressure in this region, wine, which is a fundamental part of its agriculture, plays a significant role in the use of irrigation water.
Water scarcity is a very important problem in the southern and eastern river basins in Spain where precipitations are traditionally limited. Furthermore, several regions, especially in the south of the country, suffer from recurrent droughts that aggravate the structural water scarcity of these areas. The water stress situation has intensified in recent decades because of economic growth and, especially due to the large development of irrigation agriculture that accounts for around 75 percent of all water consumption in the country. Irrigation has aggravated the lack of water with 60 percent of all irrigated lands suffering from scarcity [49]. Additionally, water stress problems are worsened by the overexploitation of the groundwater resources as reservoirs have been largely deteriorated. Two relevant cases are the Castilla-La Mancha aquifers, where the intense development of irrigation has led these resources to fall to critical levels with important threats to the economic activities but also to several ecosystems.
In the case of Castilla-La Mancha, water pressures arose from the development of the irrigation agriculture that emerged in the 1970s. As we have seen previously, vineyards have occupied an essential place in this expansion of irrigation and therefore it is important to take them into account in the discussion on water scarcity problems. The expansion of irrigation agriculture was possible because the improvement in technologies enabled water to be extracted from the large groundwater resources in this region. Groundwater resources were fundamental for boosting irrigation in this region [47]. Several studies have analysed the water scarcity problems in Castilla-La Mancha [61,62,63,64]. This study contributes to this literature by incorporating a new indicator in the debate on the sustainable use of water resources in a water stressed region. Some studies have already pointed out the usefulness of the water footprint as an indicator for water scarcity management [28,65].
The new water availability from the groundwater resources allowed the expansion of irrigation in Castilla-La Mancha. However, this expansion has intensified the traditional scarcity problems in a semi-arid region where water shortages and droughts are traditional issues. Groundwater extractions in the region of Ciudad Real, where irrigation increased from 30,000 ha in 1970 to more than 200,000 ha in the 2000s [66], caused the depletion of the Western La Mancha aquifer. In the 1980s, this aquifer was officially declared as being overexploited. Similarly, in the region of Albacete, where irrigation hectares increased by more than 100,000 ha, the Eastern La Mancha aquifer began to show significant signs of depletion. In the case of Castilla-La Mancha, the intensification of irrigation activities has largely triggered the pressures on the major groundwater resources of this region.
Two of the river basins in Spain that are suffering intense water problems are the Júcar and the Guadiana. The Júcar River Basin, located in south-eastern Spain, has an historical agricultural tradition in the region of Valencia (downstream). However, during the 1970s the development of irrigation agriculture upstream of the basin (in the region of Albacete, Castilla-La Mancha) that used the large underground water resources of this region triggered the expansion of irrigation activities in the entire basin, from 120,000 ha in 1970 to 350,000 ha in 1995 [67]. The overexploitation of the Eastern La Mancha aquifer aggravated the water scarcity in the entire basin because the Jucar River shifted from taking water from the aquifer to providing it with water [68]. This situation has intensified and worsened problems between water users that largely hinder the management of the water resources in this basin [69].
The Guadiana River Basin located in south-west Spain with a dry Mediterranean climate, is another basin where water scarcity represents a challenge for water management. Similarly to the Júcar Basin, since the 1980s the huge development of irrigation increased water demands that represent more than the 75 percent of the total water use [70]. Irrigation water problems are recurrent in this basin, especially in the two main irrigation areas: downstream, in the region of Extremadura, where irrigation relies on surface resources; and upstream, in the region of Castilla-La Mancha where irrigation relies on groundwater resources [71].
Conflicts between different water users and uses are frequent and the predicted impacts of climate change will aggravate the problems. Additionally, to meet the objectives set by the Water Framework Directive, which establish the good ecological status of all the water bodies of the EU state members, it is necessary to achieve an efficient water management. Finally, climate change scenarios with foreseeable decreases in precipitations, increases in evapotranspiration rates and a higher incidence of drought events will aggravate current water problems. In this context, vineyards play a key role because of the high relevance of this crop in the water use of Castilla-La Mancha. Especially in Albacete and Ciudad Real where around 60% of the vineyard hectares of this region are concentrated. Furthermore, irrigated vineyards in Castilla-La Mancha account for more than 50 percent of all irrigation [71]. Although this crop is not the most water intensive, vegetables are much more water intensive, the large area covered by irrigated vineyards make it a critical crop in terms of water needs. The recurrence of drought events in the region will aggravate water problems with negative consequences in vineyard productivity, especially in Castilla-La Mancha [72].
5. Conclusions
The calculation of the evolution of the blue water footprint of wine production in Spain has highlighted that the use of water to irrigate vineyards remained at very low levels from 1935 until the beginning of the 1990s. However, from 1994, the increase in the blue water footprint of Spanish wine was exponential. Moreover, this significant increase was concentrated in four provinces of Castilla-La Mancha. Although this region is specialised in the low-priced wine segment, the additional application of water has increased the productivity and profitability of the crop. However, it has generated a high level of pressure on the aquifers from where the water is obtained and this is not sustainable for the future and even less so in a context of climate change. The analysis of the wine blue water footprint has, therefore, enabled us to first, precisely determine the time horizon of its strong growth and its spatial distribution. The extreme concentration of the wine blue water footprint has also enabled us to determine the extent to which the increase in the area of irrigated vineyards has contributed to the problems of water pressure and the depletion of water resources in the region of Castilla-La Mancha.
Author Contributions
Conceptualization, M.-I.A., E.E., M.M.-R. and V.P.; Methodology; M.-I.A., E.E., M.M.-R. and V.P.; Investigation; M.-I.A., E.E., M.M.-R. and V.P.; Data Curation, M.-I.A., E.E., M.M.-R.; Writing-Original Draft Preparation; M.-I.A., E.E., M.M.-R. and V.P.; Writing-Review and Editing; V.P.; Funding Acquisition, M.-I.A., E.E. and V.P. All authors have read and agreed to the published version of the manuscript.
Funding
This study has received financial support from the Ministry of Science, Innovation and Universities of Spain, project PGC2018-095529-B-I00, Ministry of Science and Innovation of Spain, project PID2019-106822RB-100 and from the Government of Aragon, through the Research Groups, S40_20R and S55_20R and FEDER, and Fundación Bancaria IberCaja & Universidad de Zaragoza, project JIUZ-2019-SOC-07.
Conflicts of Interest
The authors declare no conflict of interest. The funders had no role in the design of the study; in the collection, analyses, or interpretation of data; in the writing of the manuscript, or in the decision to publish the results
References
- Barbier, E.B. Natural Resources and Economic Development; Cambridge University Press: Cambridge, UK, 2005. [Google Scholar]
- Badía-Miró, M.; Pinilla, V.; Willebald, H. (Eds.) Natural Resources and Economic Growth: Learning from History; Routledge: London, UK, 2015; p. 374. [Google Scholar]
- Sachs, J.D.; Warner, A.M. The curse of natural resources. Eur. Econ. Rev. 2001, 45, 827–838. [Google Scholar] [CrossRef]
- Auty, R.M. From resource curse to rent curse: A theoretical perspective. In Natural Resources and Economic Growth: Learning from History; Badía-Miró, M., Pinilla, V., Willebald, H., Eds.; Routledge: London, UK, 2015; pp. 26–53. [Google Scholar]
- Gylfasson, T. Natural resources and economic growth: From dependence to diversification. Discuss. Pap. 2004, 4804. [Google Scholar]
- Willebald, H.; Badía-Miró, M.; Pinilla, V. Introduction: Natural resources and economic development. What can we learn from history? In Natural Resources and Economic Growth: Learning from History; Badía-Miró, M., Pinilla, V., Willebald, H., Eds.; Routledge: London, UK, 2015; pp. 1–25. [Google Scholar]
- Commoner, B. The environmental cost of economic growth, in Population. In Resources and the Environment; Ridker, R.G., Ed.; Government Printing Office: Washington, DC, USA, 1971; pp. 339–363. [Google Scholar]
- Dietz, T.; Rosa, E.A.; York, R. Driving the human ecological footprint. Front. Ecol. Environ. 2007, 5, 13–18. [Google Scholar] [CrossRef]
- Grossman, G.M.; Krueger, A.B. Economic-growth and the environment. Q. J. Econ. 1995, 110, 353–377. [Google Scholar] [CrossRef] [Green Version]
- McNeill, J.R. Something New under the Sun: An. Environmental History of the Twentieth-Century World; W. W. Norton & Company: New York, NY, USA, 2000. [Google Scholar]
- Meadows, D.H.; Randers, J.; Meadows, D. The Limits to Growth: The 30-Year Update; Chelsea Green Publishing Company: White River Junction, VN, USA, 1972. [Google Scholar]
- Krausmann, F.; Fischer-Kowalski, M.; Schandl, H.; Eisenmenger, N. The global sociometabolic transition. J. Ind. Ecol. 2008, 12, 637–656. [Google Scholar] [CrossRef]
- L’Vovich, M.I.; White, G.F. Use and transformationof terrestrial water systems. In The Earth as Transformed by Human Action: Global and Regional Changes in the Biosphere over the Past 300 Years; Turner, B.L., II, Clark, W.C., Kates, R.W., Richards, J.F., Mathews, J.T., Meyer, W.B., Eds.; Cambridge University Press: Cambridge, UK, 1990; pp. 235–252. [Google Scholar]
- Duarte, R.; Pinilla, V.; Serrano, A. Is there an environmental Kuznets curve for water use? A panel smooth transition regression approach. Econ. Model. 2013, 31, 518–527. [Google Scholar] [CrossRef] [Green Version]
- Duarte, R.; Pinilla, V.; Serrano, A. Looking backward to look forward: Water use and economic growth from a long-term perspective. Appl. Econ. 2014, 46, 212–224. [Google Scholar] [CrossRef] [Green Version]
- Postel, S. Pillar of Sand: Can the Irrigation Miracle Last? W.W. Norton & Company: New York, NY, USA, 1999. [Google Scholar]
- Angelakιs, A.N.; Zaccaria, D.; Krasilnikoff, J.; Salgot, M.; Bazza, M.; Roccaro, P.; Jimenez, B.; Kumar, A.; Yinghua, W.; Baba, A.; et al. Irrigation of World Agricultural Lands: Evolution through the Millennia. Water 2020, 12, 1285. [Google Scholar] [CrossRef]
- Gleick, P.H. Water in Crisis: A Guide to the World’s Freshwater Resources; Oxford University Press for Pacific: New York, NY, USA, 1993. [Google Scholar]
- Aquastat Database. Available online: http://faostat.org (accessed on 25 May 2020).
- Federico, G. Feeding the World: An Economic History of World Agriculture, 1800–2000; Princeton University Press: Princeton, NJ, USA, 2005; p. 388. [Google Scholar]
- Hayami, Y.; Ruttan, V.W. Agricultural Development; an International Perspective; Johns Hopkins University Press: Baltimore, MD, USA, 1985. [Google Scholar]
- Compés, R.; Sotés, V. El Sector Vitivinícola frente al Desafío del Cambio Climático. Estrategias Públicas y Privadas de Mitigación y Adaptación en el Mediterráneo; Cajamar: Almería, España, 2018. [Google Scholar]
- Mekonnen, M.M.; Hoekstra, A.Y. The green, blue and grey water footprint of crops and derived crop products. Hydrol. Earth Syst. Sci. 2011, 15, 1577–1600. [Google Scholar] [CrossRef] [Green Version]
- Yang, H.; Wang, L.; Zehnder, A.J.B. Water scarcity and food trade in the Southern and Eastern Mediterranean countries. Food Policy 2007, 32, 585–605. [Google Scholar] [CrossRef]
- Lamastra, L.; Suciu, N.A.; Novelli, E.; Trevisan, M. A new approach to assessing the water footprint of wine: An Italian case study. Sci. Total Environ. 2014, 490, 748–756. [Google Scholar] [CrossRef] [PubMed]
- Miglietta, P.P.; Morrone, D.; Lamastra, L. Water footprint and economic water productivity of Italian wines with appellation of origin: Managing sustainability through an integrated approach. Sci. Total Environ. 2018, 633, 1280–1286. [Google Scholar] [CrossRef]
- Ene, S.A.; Teodosiu, C.; Robu, B.; Volf, I. Water footprint assessment in the winemaking industry: A case study for a Romanian medium size production plant. J. Clean. Prod. 2013, 43, 122–135. [Google Scholar] [CrossRef]
- Bonamente, E.; Scrucca, F.; Asdrubali, F.; Cotana, F.; Presciutti, F. The water footprint of the wine industry: Implementation of an assessment methodology and application to a case study. Sustainability 2015, 7, 12190–12208. [Google Scholar] [CrossRef] [Green Version]
- Airazidou, E.; Tsolakis, N. A water footprint review of Italian wine: Drivers, barriers, and practices for sustainable stewardship. Water 2020, 12, 1–15. [Google Scholar]
- Villanueva-Rey, P.; Quinteiro, P.; Vázquez-Rowe, I.; Rafael, S.; Arroja, L.; Moreira, M.T.; Feijoo, G.; Dias, A.C. Assessing water footprint in a wine appellation: A case study for Ribeiro in Galicia, Spain. J. Clean. Prod. 2018, 172, 2097–2107. [Google Scholar] [CrossRef]
- Pattara, C.; Raggi, A.; Cicchelli, A. Life Cycle Assessment and Carbon Footprint in the Wine Supply Chain. Environ. Manag. 2012, 49, 1247–1258. [Google Scholar] [CrossRef] [PubMed]
- Anderson, K.; Nelgen, S.; Pinilla, V. Global Wine Markets, 1860 to 2015: A Statistical Compendium; University of Adelaide Press: Adelaide, Australia, 2017. [Google Scholar]
- Cazcarro, I.; Duarte, R.; Martín-Retortillo, M.; Pinilla, V.; Serrano, A. Water scarcity and agricultural growth: From curse to blessing? A case study of Spain. In Natural Resources and Economic Growth: Learning from History; Badía-Miró, M., Pinilla, V., Willebald, H., Eds.; Routledge: London, UK, 2015; pp. 339–361. [Google Scholar]
- Cazcarro, I.; Duarte, R.; Martín-Retortillo, M.; Pinilla, V.; Serrano, A. How sustainable is the increase in the water footprint of the Spanish agricultural sector? A provincial analysis between 1955 and 2005–2010. Sustainability 2015, 7, 5094–5119. [Google Scholar] [CrossRef] [Green Version]
- Cazcarro, I.; Martín-Retortillo, M.; Serrano, A. Reallocating regional water apparent productivity in the long term: Methodological contributions and application for Spain. Reg. Environ. Chang. 2019, 19, 1455–1468. [Google Scholar] [CrossRef]
- Duarte, R.; Pinilla, V.; Serrano, A. The effect of globalization on water consumption: A case study of Spanish virtual water trade, 1849–1935. Ecol. Econ. 2014, 100, 96–105. [Google Scholar] [CrossRef]
- Duarte, R.; Pinilla, V.; Serrano, A. The water footprint of the Spanish agricultural sector: 1860–2010. Ecol. Econ. 2014, 108, 200–207. [Google Scholar] [CrossRef]
- Duarte, R.; Pinilla, V.; Serrano, A. Globalization and natural resources: The expansión of the Spanish agrifood trade and its impact on water consumption, 1965–2010. Reg. Environ. Chang. 2016, 16, 259–272. [Google Scholar] [CrossRef] [Green Version]
- Pinilla, V. Agua y crecimiento económico: Un análisis del caso español. In Recs històrics: Pagesia, historia y patrimoni; Vicedo, E., Ed.; Institut d’Estudis Ilerdencs: Lleida, Spain, 2018; pp. 13–29. [Google Scholar]
- Serrano, A. La modernización del sector agrario español: Una evaluación de su impacto sobre los recursos hídricos In Del Pasado al Futuro como Problema. La Historia Agraria Contemporánea Española en el Siglo XXI; Soto, D., Lana, J.M., Eds.; Prensas Universitarias de Zaragoza: Zaragoza, Spain, 2018; pp. 103–124. [Google Scholar]
- Clar, E.; Martín-Retortillo, M.; Pinilla, V. The Spanish path of agrarian change, 1950–2005: From authoritarian to export-oriented productivism. J. Agrar. Chang. 2018, 18, 324–347. [Google Scholar] [CrossRef] [Green Version]
- Arrojo, P. El Plan. Hidrológico Nacional a Debate; Bakeaz y Fundación Nueva Cultura del Agua: Bilbao, Spain, 2001. [Google Scholar]
- Gil Olcina, A. Conflictos autonómicos sobre trasvases de agua en España. Invest Geogr. 1995, 13, 17–28. [Google Scholar]
- Aldaya, M.; Garrido, A.; Llamas, M.R.; Varela-Ortega, C.; Novo, P.; Rodríguez Casado, R. Water footprint and virtual water trade in Spain. In Water Policy in Spain; Garrido, A., Llamas, M.R., Varela-Ortega., C., Novo, P., Rodríguez-Casado, R., Aldaya, M.M., Eds.; CRC Press Boca Raton: Boca Raton, FL, USA, 2010; pp. 49–59. [Google Scholar]
- Salmoral, G.; Aldaya, M.M.; Chico, D.; Garrido, A.; Llamas, M.R. The water footprint of olives and olive oil in Spain. Span. J. Agric. Res. 2011, 9, 1089–1104. [Google Scholar] [CrossRef] [Green Version]
- Aldaya, M.; Garrido, A.; Llamas, M.R.; Varela-Ortega, C.; Novo, P.; Rodríguez Casado, R. The water footprint of Spain. Sustain. Water Manag. 2008, 3–200, 15–20. [Google Scholar]
- MIMAM (Ministerio de Medio Ambiente, Spanish Ministry of Environment). El agua en la economía española: Situación y perspectivas; Spanish Ministry of the Environment: Madrid, Spain, 2007; 1p, Available online: http://circa.europa.eu/Public/irc/env/wfd/library?l=/framework_directive/implementation_documents_1/wfd_reports/member_states/spain/article_5/completo_nivel1pdf (accesed on 30 April 2020).
- Rodríguez, R.; Garrido, A.; Llamas, M.R.; Varela, V. La huella hidrológica de la agricultura española. Ingeniería del agua 2009, 16, 27–40. [Google Scholar]
- Ortega, J.F.; De Juan, J.A.; Tarjuelo, J.M. Improving water management: The irrigation advisory service of Castilla-La Mancha (Spain). Agric. Water Manag. 2005, 77, 37–58. [Google Scholar] [CrossRef]
- Mekonnen, M.M.; Hoekstra, A.Y. A global assessment of the water footprint of farm animal products. Ecosystems 2012, 15, 401–415. [Google Scholar] [CrossRef] [Green Version]
- Mekonnen, M.M.; Hoekstra, A.Y. A global and high-resolution assessment of the green, blue and grey water footprint of wheat. Hydrol. Earth Syst. Sci. 2010, 14, 1259–1276. [Google Scholar] [CrossRef] [Green Version]
- Haberl, H.; Erb, K.H.; Krausmann, F. How to calculate and interpret ecological footprints for long periods of time: The case of Austria 1926–1995. Ecol. Econ. 2001, 38, 25–45. [Google Scholar] [CrossRef]
- Doorenbos, J.; Kassam, A.H. Yield response to water. In FAO Irrigation and Drainage Paper, 33; FAO: Rome, Italy, 1986. [Google Scholar]
- Dalin, C.; Konar, M.; Hanasaki, N.; Rinaldo, A.; Rodriguez-Iturbe, I. Evolution of the global virtual water trade network. Proc. Natl. Acad. Sci. USA 2012, 109, 5989–5994. [Google Scholar] [CrossRef] [PubMed] [Green Version]
- Konar, M.; Hussein, Z.; Hanasaki, N.; Mauzerall, D.L.; Rodriguez-Iturbe, I. Virtual water trade flows and savings under climate change. Hydrol. Earth Syst. Sci. Discuss. 2013, 10, 67–101. [Google Scholar] [CrossRef]
- Ministerio de Agricultura (1930–2016). MAGRAMA (1965–2010) Anuario Estadístico de la Producción Agraria. Available online: http://www.magrama.gob.es/es/estadistica/temas/publicaciones/anuario-de-estadistica/default.aspx (accessed on 13 December 2019).
- Martínez-Carrión, J.M.; Medina-Albaladejo, F.J. Change and Development in the Spanish Wine Sector, 1950–2009. J. Wine Res. 2010, 21, 77–95. [Google Scholar] [CrossRef]
- Olmeda, M.; Castillo-Valero, J.S. la economía del vino en España y en el mundo; Compés, R., Castillo-Valero, J.S., Eds.; Cajamar: Almería, Spain, 2014; pp. 211–244. [Google Scholar]
- Castillo-Valero, J.S. (Ed.) Plan. Estratégico del Sector Vitivinícola Regional; Universidad de Castilla-La Mancha: Albacete, Spain, 2019. [Google Scholar]
- Martín-Retortillo, M.; Serrano, A.; Cazcarro, I. Double concentration explaining the outstanding increase in the Spanish crop production. Span. J. Agric. Res. 2020. forthcoming. [Google Scholar]
- Martín de Santa Olalla Mañas, F.; Brasa Ramos, A.; Fabeiro Cortes, C.; Fernandez Gonzalez, D.; Lopez Corcoles, H. Improvement of irrigation management towards the sustainable use of groundwater in Castilla-La Mancha, Spain. Agric. Water Manag. 1999, 40, 195–205. [Google Scholar] [CrossRef]
- Esteban, E.; Albiac; J. The problem of sustainable groundwater management: The case of La Mancha aquifers, Spain. Hydrogeol. J. 2012, 20, 851–863. [Google Scholar] [CrossRef]
- Martín de Santa Olalla, F.; Calera, A.; Domínguez, A. Monitoring irrigation water use by combining Irrigation Advisory Service, and remotely sensed data with a geographic information system. Agric. Water Manag. 2003, 61, 111–124. [Google Scholar] [CrossRef]
- Estrela, T.; Pérez-Martin, M.A.; Vargas, E. Impacts of climate change on water resources in Spain. Hydrol. Sci. J. 2012, 57, 1154–1167. [Google Scholar] [CrossRef]
- Ridoutt, B.G.; Pfister, S. A revised approach to water footprinting to make transparent the impacts of consumption and production on global freshwater scarcity. Glob. Environ. Chang. 2010, 20, 113–120. [Google Scholar] [CrossRef]
- Esteban, E.; Albiac, J. Groundwater and ecosystems damages: Questioning the Gisser–Sánchez effect. Ecol. Econ. 2011, 70, 2062–2069. [Google Scholar] [CrossRef] [Green Version]
- Albiac, J.; Esteban, E.; Tapia, J.; Rivas, E. Water Scarcity and Droughts in Spain: Impacts and Policy Measures. Drought in Arid and Semi-Arid Regions. In A Multi-Disciplinary and Cross-Country Perspective; Schwabe, K., Albiac, J., Connor, J.D., Hassan, R.M., Meza, L., Eds.; Springer: Dordrecht, The Netherlands, 2013; pp. 323–338. [Google Scholar]
- Sanz, D.; Castaño, S.; Cassiraga, E.; Sahuquillo, A.; Gómez-Alday, J.J.; Peña, S.; Calera, A. Modeling aquifer-river interactions under the influence of groundwater abstractions in the Mancha oriental system (SE Spain). Hydrogeol. J. 2011, 19, 475–487. [Google Scholar] [CrossRef] [Green Version]
- Esteban, E.; Dinar, A.; Albiac, J.; Calera, A.; García-Mollá, M.; Avellá, L. Interest group perceptions on water policy reforms: Insight from a water stressed basin. Water Policy 2018, 20, 794–810. [Google Scholar] [CrossRef]
- Pulido-Calvo, I.; Gutiérrez-Estrada, J.C.; Sanz-Fernández, V. Drought and Ecological Flows in the Lower Guadiana River Basin (Southwest Iberian Peninsula). Water 2020, 12, 677. [Google Scholar] [CrossRef] [Green Version]
- Aldaya, M.M.; Llamas, R. Water footprint analysis for the Guadiana river basin. UNESCO-IHE, Institute for Water Education. Value of Water. Res. Rep. Ser. 2008, 3, 35. [Google Scholar]
- Resco Sánchez, P.; Bardají Azcárte, I.; Iglesias Picazo, A.; Sotés Ruiz, V. Vulnerabilidad del viñedo español al cambio climático. In La economía del vino en España y en el mundo; Castillo Valero, J.S., Compes López, R., Eds.; Fundación Cajamar, Serie de Economía; Serie Economía: Almería, Spain, 2014; pp. 245–270. [Google Scholar]
Figure 1.
Evolution in Spain of the rainfed and irrigated areas dedicated to grape growing for wine, 1930–2015 (Ha). Source: Own calculation based on Anuario Estadístico de la Producción Agraria [56].
Figure 1.
Evolution in Spain of the rainfed and irrigated areas dedicated to grape growing for wine, 1930–2015 (Ha). Source: Own calculation based on Anuario Estadístico de la Producción Agraria [56].

Figure 2.
Evolution in Spain of wine production from rainfed and irrigated wine grape vineyards, 1930–2015. Source: Own calculation based on Anuario Estadístico de la Producción Agraria [56].
Figure 2.
Evolution in Spain of wine production from rainfed and irrigated wine grape vineyards, 1930–2015. Source: Own calculation based on Anuario Estadístico de la Producción Agraria [56].

Figure 3.
Evolution of the blue water footprint of wine in Spain, 1935–2015. Source: Own calculation based on data of Anuario Estadístico de la Producción Agraria [56].
Figure 3.
Evolution of the blue water footprint of wine in Spain, 1935–2015. Source: Own calculation based on data of Anuario Estadístico de la Producción Agraria [56].


Table 1.
Average rainfed and irrigated vineyard areas of Spain (in Ha).
| 1948–1952 | 1988–1992 | 2011–2015 | ||||
|---|---|---|---|---|---|---|
| PROV. | RAINFED AREA | IRRIGATED AREA | RAINFED AREA | IRRIGATED AREA | RAINFED AREA | IRRIGATED AREA |
| CIUDAD REAL | 178,356 | 0 | 240,466 | 7717 | 95,124 | 51,886 |
| ALBACETE | 56,393 | 120 | 111,716 | 448 | 52,973 | 26,860 |
| TOLEDO | 67,189 | 0 | 193,991 | 1494 | 88,231 | 18,695 |
| CUENCA | 37,157 | 0 | 118,997 | 102 | 65,582 | 15,340 |
| LA RIOJA | 23,848 | 5338 | 31,336 | 1287 | 30,633 | 12,114 |
| SPAIN | 1,109,201 | 24,039 | 1,284,938 | 31,757 | 678,020 | 183,905 |
Note: Spain and the five provinces with the highest irrigated vineyard area in the period 2011–15. Source: Own calculation based on Anuario Estadístico de la Producción Agraria [56].
Table 2.
Average wine production of rainfed and irrigated vineyard areas (in Hl).
| 1948–1952 | 1988–1992 | 2011–2015 | ||||||
|---|---|---|---|---|---|---|---|---|
| PROVINCES | RAINFED AREA | IRRIGATED AREA | PROVINCES | RAINFED AREA | IRRIGATED AREA | PROVINCES | RAINFED AREA | IRRIGATED AREA |
| CIUDAD REAL | 1,438,476 | 0 | CIUDAD REAL | 5,407,890 | 425,710 | CIUDAD REAL | 3,234,622 | 5,080,368 |
| ALBACETE | 1,021,525 | 2943 | ALBACETE | 2,160,371 | 17,970 | ALBACETE | 1,333,136 | 1,913,193 |
| TOLEDO | 1,262,619 | 0 | TOLEDO | 3,792,379 | 107,646 | TOLEDO | 2,933,739 | 1,625,509 |
| CUENCA | 456,975 | 139,753 | CUENCA | 2,618,759 | 77,586 | CUENCA | 1,861,318 | 661,485 |
| LA RIOJA | 431,720 | 0 | LA RIOJA | 992,704 | 3985 | LA RIOJA | 1,375,960 | 903,066 |
| SPAIN | 14,848,412 | 539,594 | SPAIN | 30,359,257 | 1,275,309 | SPAIN | 24,437,180 | 13,184,567 |
Note: Spain and the five provinces with highest production in irrigated vineyard areas in the period 2011–2015. Source: Own calculation based on Anuario Estadístico de la Producción Agraria [56].
Table 3.
Average provincial share in the blue water footprint of wine in Spain.
| 1948–1952 | 1988–1992 | 2011–2015 | ||||||
|---|---|---|---|---|---|---|---|---|
| PROVINCES | % | Thousands m3 | PROVINCES | % | Thousands m3 | PROVINCES | % | Thousands m3 |
| LA RIOJA | 32.7 | 38,094 | CIUDAD REAL | 25.4 | 32,870 | CIUDAD REAL | 28.2 | 221,011 |
| TARRAGONA | 24.7 | 28,798 | MURCIA | 20.3 | 26,245 | ALBACETE | 14.0 | 109,693 |
| NAVARRA | 15.9 | 18,549 | LLEIDA | 11.0 | 14,278 | TOLEDO | 11.3 | 88,860 |
| GRANADA | 6.3 | 7338 | NAVARRA | 9.8 | 12,658 | LA RIOJA | 11.0 | 86,447 |
| ZARAGOZA | 4.5 | 5211 | LA RIOJA | 7.1 | 9187 | CUENCA | 6.3 | 49,585 |
| SPAIN | 100.0 | 116,595 | SPAIN | 100.0 | 129,494 | SPAIN | 100.0 | 784,603 |
Note: Spain and the five top provinces in each period. Source: Own calculation based on data of Anuario Estadístico de la Producción Agraria [56].
Table 4.
Contribution to the change of the blue water footprint of wine from 1950 to 2013 of the five top Spanish provinces.
Table 4.
Contribution to the change of the blue water footprint of wine from 1950 to 2013 of the five top Spanish provinces.
| PROVINCES | % | Increase in Thousands of m3 |
|---|---|---|
| CIUDAD REAL | 33.1 | 221.011 |
| ALBACETE | 16.3 | 109.203 |
| TOLEDO | 13.3 | 88.860 |
| CUENCA | 7.4 | 49.585 |
| LA RIOJA | 7.2 | 48.353 |
| SPAIN | 100.0 | 668.008 |
* 1950-average 1948–1952. * 2013-average 2011–2015. Source: Own calculation based on data of Anuario Estadístico de la Producción Agraria [56].
Table 5.
Blue water footprint and production: Percentage represented by wine over all crops.
| Provinces | Blue Water Footprint (%) | Production (%) | ||
|---|---|---|---|---|
| 1955 | 2010 | 1955 | 2010 | |
| Albacete | 3.1 | 13.1 | 2.75 | 19.2 |
| Ciudad Real | 3.2 | 27.0 | 3.19 | 36.0 |
| Cuenca | 1.7 | 12.9 | 1.94 | 20.4 |
| Toledo | 2.2 | 12.7 | 2.16 | 25.6 |
| Spain | 0.7 | 3.3 | 0.71 | 5.5 |
Source: Cazcarro et al. [35].
Table 6.
Contribution in Castilla-La Mancha of wine to the increase of the blue water footprint of crop production (1955–2010) (%).
Table 6.
Contribution in Castilla-La Mancha of wine to the increase of the blue water footprint of crop production (1955–2010) (%).
| Provinces | % |
|---|---|
| Albacete | 17.3 |
| Ciudad Real | 53.9 |
| Cuenca | 31.4 |
| Toledo | 24.2 |
| Spain | 6.5 |
Source: Cazcarro et al. [35].
© 2020 by the authors. Licensee MDPI, Basel, Switzerland. This article is an open access article distributed under the terms and conditions of the Creative Commons Attribution (CC BY) license (http://creativecommons.org/licenses/by/4.0/).
Share and Cite
MDPI and ACS Style
Ayuda, M.-I.; Esteban, E.; Martín-Retortillo, M.; Pinilla, V. The Blue Water Footprint of the Spanish Wine Industry: 1935–2015. Water 2020, 12, 1872. https://doi.org/10.3390/w12071872
AMA Style
Ayuda M-I, Esteban E, Martín-Retortillo M, Pinilla V. The Blue Water Footprint of the Spanish Wine Industry: 1935–2015. Water. 2020; 12(7):1872. https://doi.org/10.3390/w12071872
Chicago/Turabian StyleAyuda, María-Isabel, Encarna Esteban, Miguel Martín-Retortillo, and Vicente Pinilla. 2020. "The Blue Water Footprint of the Spanish Wine Industry: 1935–2015" Water 12, no. 7: 1872. https://doi.org/10.3390/w12071872
Note that from the first issue of 2016, this journal uses article numbers instead of page numbers. See further details here.