Article

Magnetically Recoverable TiO2/SiO2/γ-Fe2O3/rGO Composite with Significantly Enhanced UV-Visible Light Photocatalytic Activity

by
Reyhaneh Kaveh
1,2,
Maryam Mokhtarifar
1,
Mojtaba Bagherzadeh
2,
Andrea Lucotti
1,
Maria Vittoria Diamanti
1,* and
MariaPia Pedeferri
1
1
Department of Chemistry, Materials and Chemical Engineering, Politecnico di Milano, 20124 Milano, Italy
2
Department of Chemistry, Sharif University of Technology, Tehran 145888-9694, Iran
*
Author to whom correspondence should be addressed.
Molecules 2020, 25(13), 2996; https://doi.org/10.3390/molecules25132996
Submission received: 30 May 2020 / Revised: 17 June 2020 / Accepted: 22 June 2020 / Published: 30 June 2020
(This article belongs to the Special Issue Hybrid Materials for Advanced Applications)

Abstract

:
In this paper, we report the preparation of a new composite (TiO2/SiO2/γ-Fe2O3/rGO) with a high photocatalytic efficiency. The properties of the composite were examined by different analyses, including X-ray diffraction (XRD), field emission scanning electron microscope (FE-SEM), photoluminescence (PL), UV-Visible light diffuse reflectance spectroscopy, Fourier transform infrared spectroscopy (FTIR), Raman, vibrating-sample magnetometer (VSM), and nitrogen gas physisorption (BET) studies. The photocatalytic efficiency of the proposed composite was evaluated by the degradation of methylene blue under UV and visible light, and the results were compared with titanium dioxide (TiO2), where degradation increased from 30% to 84% and 4% to 66% under UV and visible light, respectively. The significant increase in photocatalytic activity may be explained by the higher adsorption of dye on the surface of the composite and the higher separation and transfer of charge carriers, which in turn promote active sites and photocatalytic efficiency.

1. Introduction

Over the last decade, advanced oxidation processes (AOPs) have been productively applied in order to decrease a wide variety of recalcitrant and environmentally toxic products. Among AOPs, the photodegradation of contaminants in wastewater has found considerable interest [1]. Photocatalysts generate powerful reactive radicals, such as the hydroxyl radical (OH), which react with the contaminants in wastewater, inducing their degradation [2,3].
Titanium dioxide (TiO2) is considered one of the most effective photocatalytic materials for environmental remediation due to its physicochemical properties, such as high thermal and chemical stability, excellent electronic properties, low cost, availability and low toxicity. However, because of its high intrinsic bandgap, TiO2 can be activated under UV irradiation, which is expensive and hazardous to provide. On the other hand, the photocatalytic efficiency of TiO2 is limited by the rapid recombination of photogenerated electrons (e) and hole (h+) pairs [4,5,6]. In order to increase the photocatalytic activity of TiO2, many efforts, including doping with non-metal or metal elements [7,8], surface modification [9,10,11], and coupling with other semiconductors [12,13,14], have been devoted. One method is to improve the morphology and surface hydroxyls of TiO2 by adding SiO2, which is one of the best mesoporous support materials for improving the surface area of TiO2 [15,16]. Another method is to decrease the recombination rate of the photoinduced e/h+ pairs by coupling TiO2 with narrow band gap semiconductors like Ag3PO4/TiO2 [17], SnS2/TiO2 [18], and CdS/TiO2 [19] composite catalysts.
Maghemite (γ-Fe2O3) is an outstanding metal-oxide semiconductor with a narrow band gap (~2.2 eV), which possesses better light harvesting and charge transport properties. However, the photocatalytic activity of γ-Fe2O3 is low because of the photocorrosion and high recombination rate of photoinduced e/h+ pairs. The presence of γ-Fe2O3 in TiO2 composites can favor charge separation and improves the photocatalytic activity of the heterostructure dramatically. In addition, the presence of magnetic γ-Fe2O3 nanoparticles in TiO2 composites can overcome the difficulty of separating and recovering the prepared photocatalysts from the solution system [20,21,22,23].
Reduced graphene oxide (rGO) is considered a very promising material because of its superior charge separation ability between the intrinsic delocalized π–π electron. The rGO sheets could promote the transport of electrons between the organic pollutant molecules and composite photocatalysts. Due to the high surface area of rGO sheets, they can be applied as an excellent supporting material. Additionally, sheets of rGO remarkably enhance the surface area of the system and they can enhance the number of surface-active sites [24,25,26].
For instance, Phanichphant et al. reported the formation of BiVO4 via the method of co-precipitation. Synthesized BiVO4 nanoparticles were deposited on the sheets of rGO to prepare BiVO4/rGO by the hydrothermal method. The obtained results demonstrated that the BiVO4/rGO composite showed higher photocatalytic activity compared to neat BiVO4, with the photodegradation efficiency remaining stable up to multiple cycles. This improvement could be related to the high surface area available to adsorb more molecules of methylene blue (MB) and the effective charge separation of BiVO4 particles through the π electron in the structure of rGO [27]. Isari et al. used a simple sol-gel method to prepare a ternary nanocomposite of Fe-doped TiO2 that was decorated on reduced graphene oxide (Fe-doped TiO2/rGO), and the photocatalytic activity of the synthesized sample was investigated by the decontamination of rhodamine B under solar irradiation. According to the reported results, the value of the band gap energy of Fe-TiO2/rGO was remarkably lower than that of pure TiO2. Moreover, the quenched e/h+ recombination rate and increased specific surface area of the prepared sample could improve the photocatalytic activity of Fe-TiO2/rGO under solar irradiation [28].
In this study, we developed a new magnetically separable TiO2/SiO2/γ-Fe2O3/rGO nanocomposite using the sol-gel technique. The prepared material showed excellent activity for the degradation of methylene blue under UV and visible light (Vis) irradiation. The photocatalytic efficiency was investigated, with consideration of the synergistic effects of rGO, SiO2, and γ-Fe2O3 nanoparticles in TiO2 composites.

2. Results and Discussion
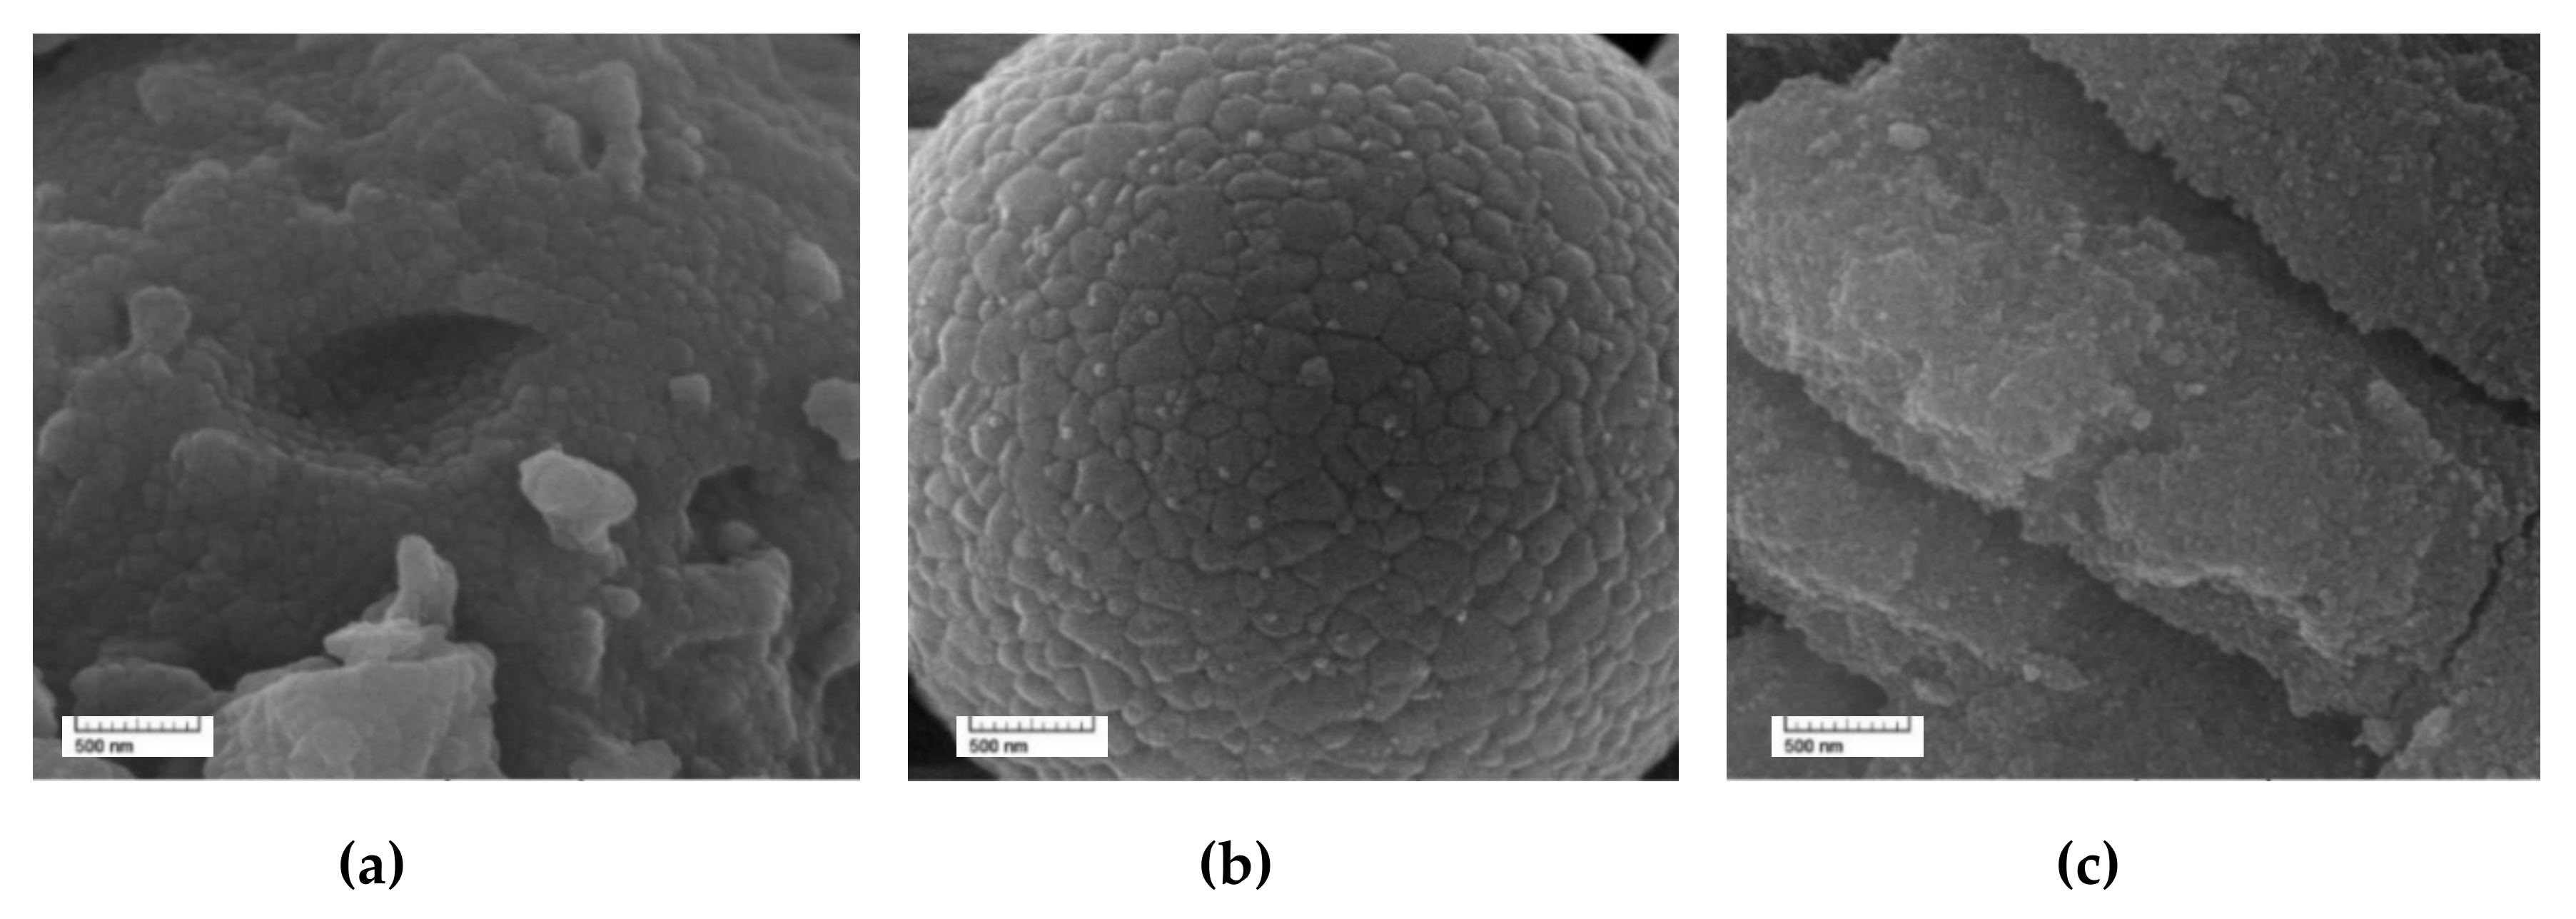
2.1. Morphology

For the morphology characterization of the synthesized samples, FE-SEM (field emission scanning electron microscope) images were taken and these are shown in Figure 1. As observed in Figure 1a, the TiO2 nanoparticles had a diameter between 50 and 60 nm and tended to form aggregates. In the titanium dioxide–silica (TS) nanoparticles (Figure 1b), the TiO2 nanoparticles had a smaller diameter and were dispersed on the SiO2 particles’ surfaces; hence, SiO2 suppresses the crystal growth of TiO2 nanoparticles, and it limits their aggregation. Figure 1c shows the morphology of the TiO2–SiO2–γ-Fe2O3–rGO (TSFG) sample. The particles of TiO2, SiO2, and γ-Fe2O3 were well distributed on the surface of the rGO nanosheets and served well as substrates for the homogeneous distribution of the aforementioned particles.

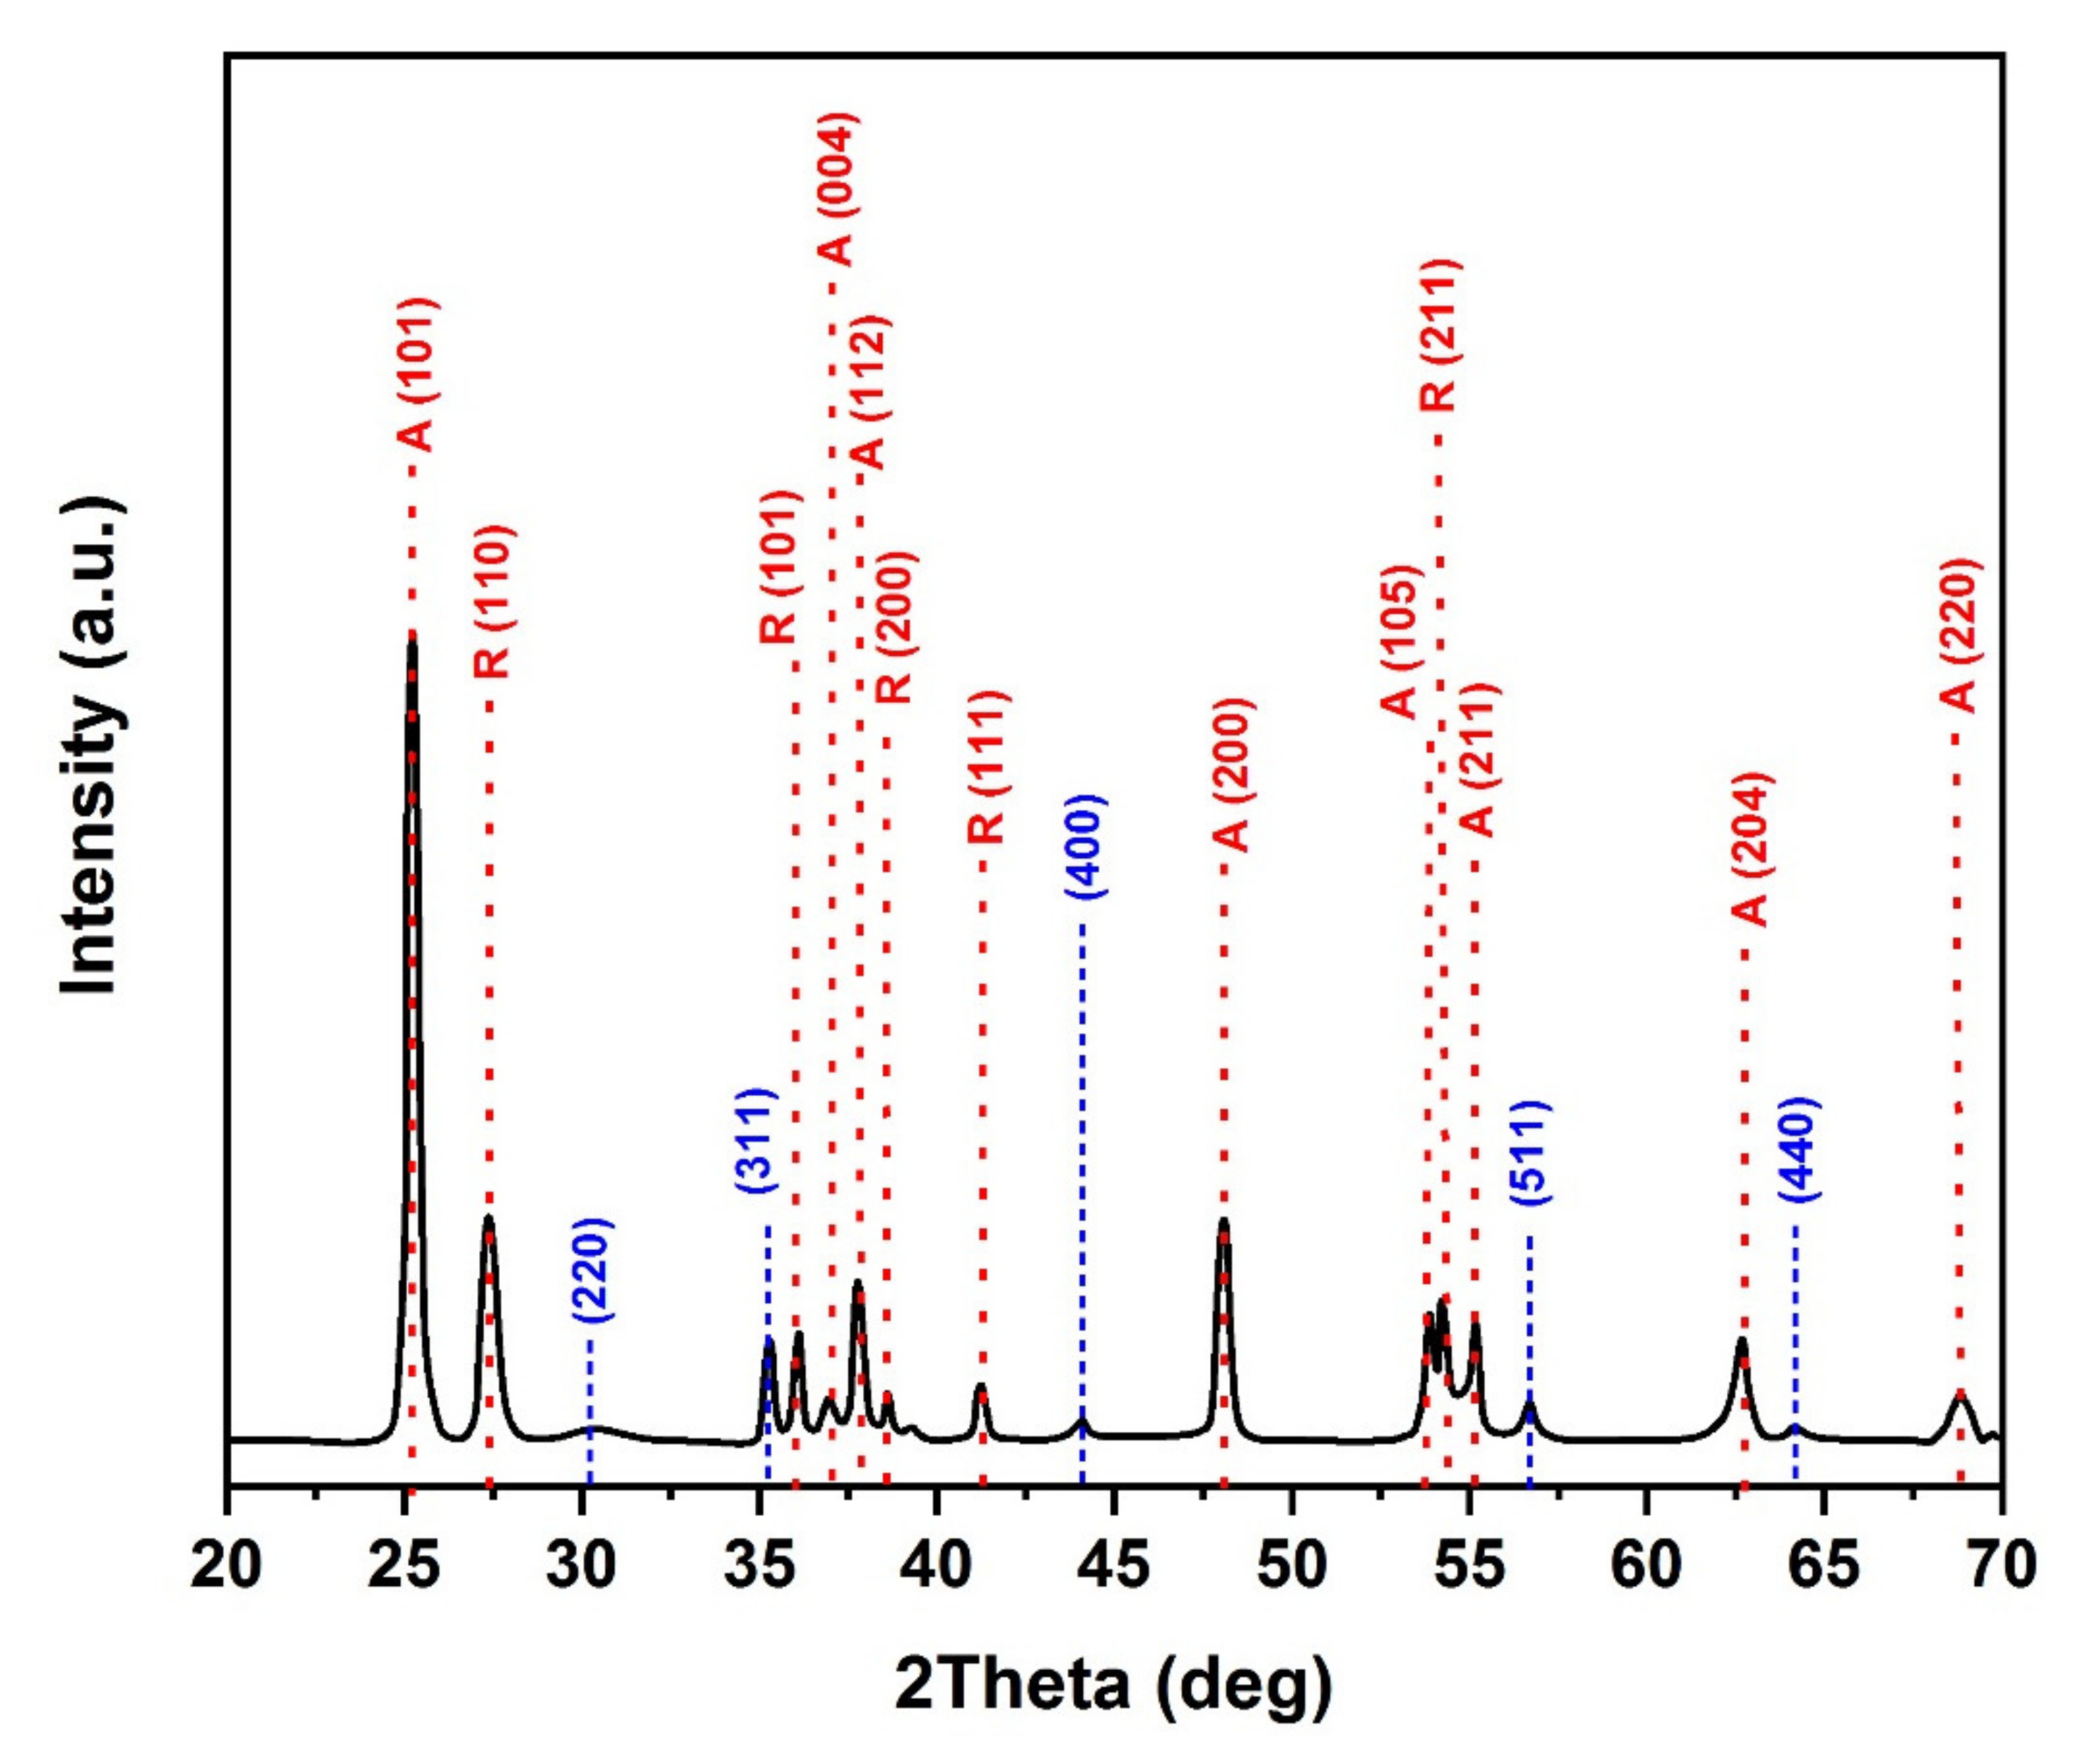
2.2. Crystal Structure of Catalyst Samples

The XRD patterns of the TiO2 and TS samples calcined at different temperatures are presented in Figure 2a,b, respectively. The crystalline composition is summarized in Table 1. The XRD pattern for the uncalcined TiO2 exhibits no peaks related to anatase or rutile, indicating that the material produced was amorphous prior to annealing. At 450 °C, anatase was detected, while the rutile phase was observed at temperatures equal to or higher than 550 °C. Increasing the calcination temperature to 650 °C resulted in a considerable improvement in the crystallinity of TiO2. With a calcination temperature of 750 °C, rutile became the dominant phase.
The addition of SiO2 to TiO2 enhanced the thermal stability of the TiO2 crystallites, resulting in the retardation of the anatase-to-rutile phase transition (Figure 2b). This is related to the presence of SiO2, which prevented the nucleation of rutile: this aspect will be further analyzed with other techniques in order to understand the origin of the phenomenon [29]. According to the obtained results, TiO2/SiO2 calcinated at 650 °C may result in the best photocatalytic performance (with about 66% for anatase and 34% for rutile) if compared with the best phase composition of Degussa (P25), which has been reported by many researchers [30]. The crystallite sizes obtained by the Scherrer equation were about 29 and 24 nm for the samples of TiO2 and TiO2/SiO2 calcined at 650 °C, respectively; therefore, the addition of SiO2 to TiO2 hindered the growth of anatase TiO2 crystallites. Moreover, in addition to the peaks related to TiO2 anatase and rutile, the XRD pattern of the TSFG sample shows diffraction peaks corresponding to the (220), (311), (400), (511), and (440) of γ-Fe2O3 (JCPDS card 39-1356) [31], without any characteristic peaks of GO (Figure 3). Furthermore, based on Figure S1, the main peak of GO (around 11°) is not presented in rGO, proving that the GO could be successfully reduced.

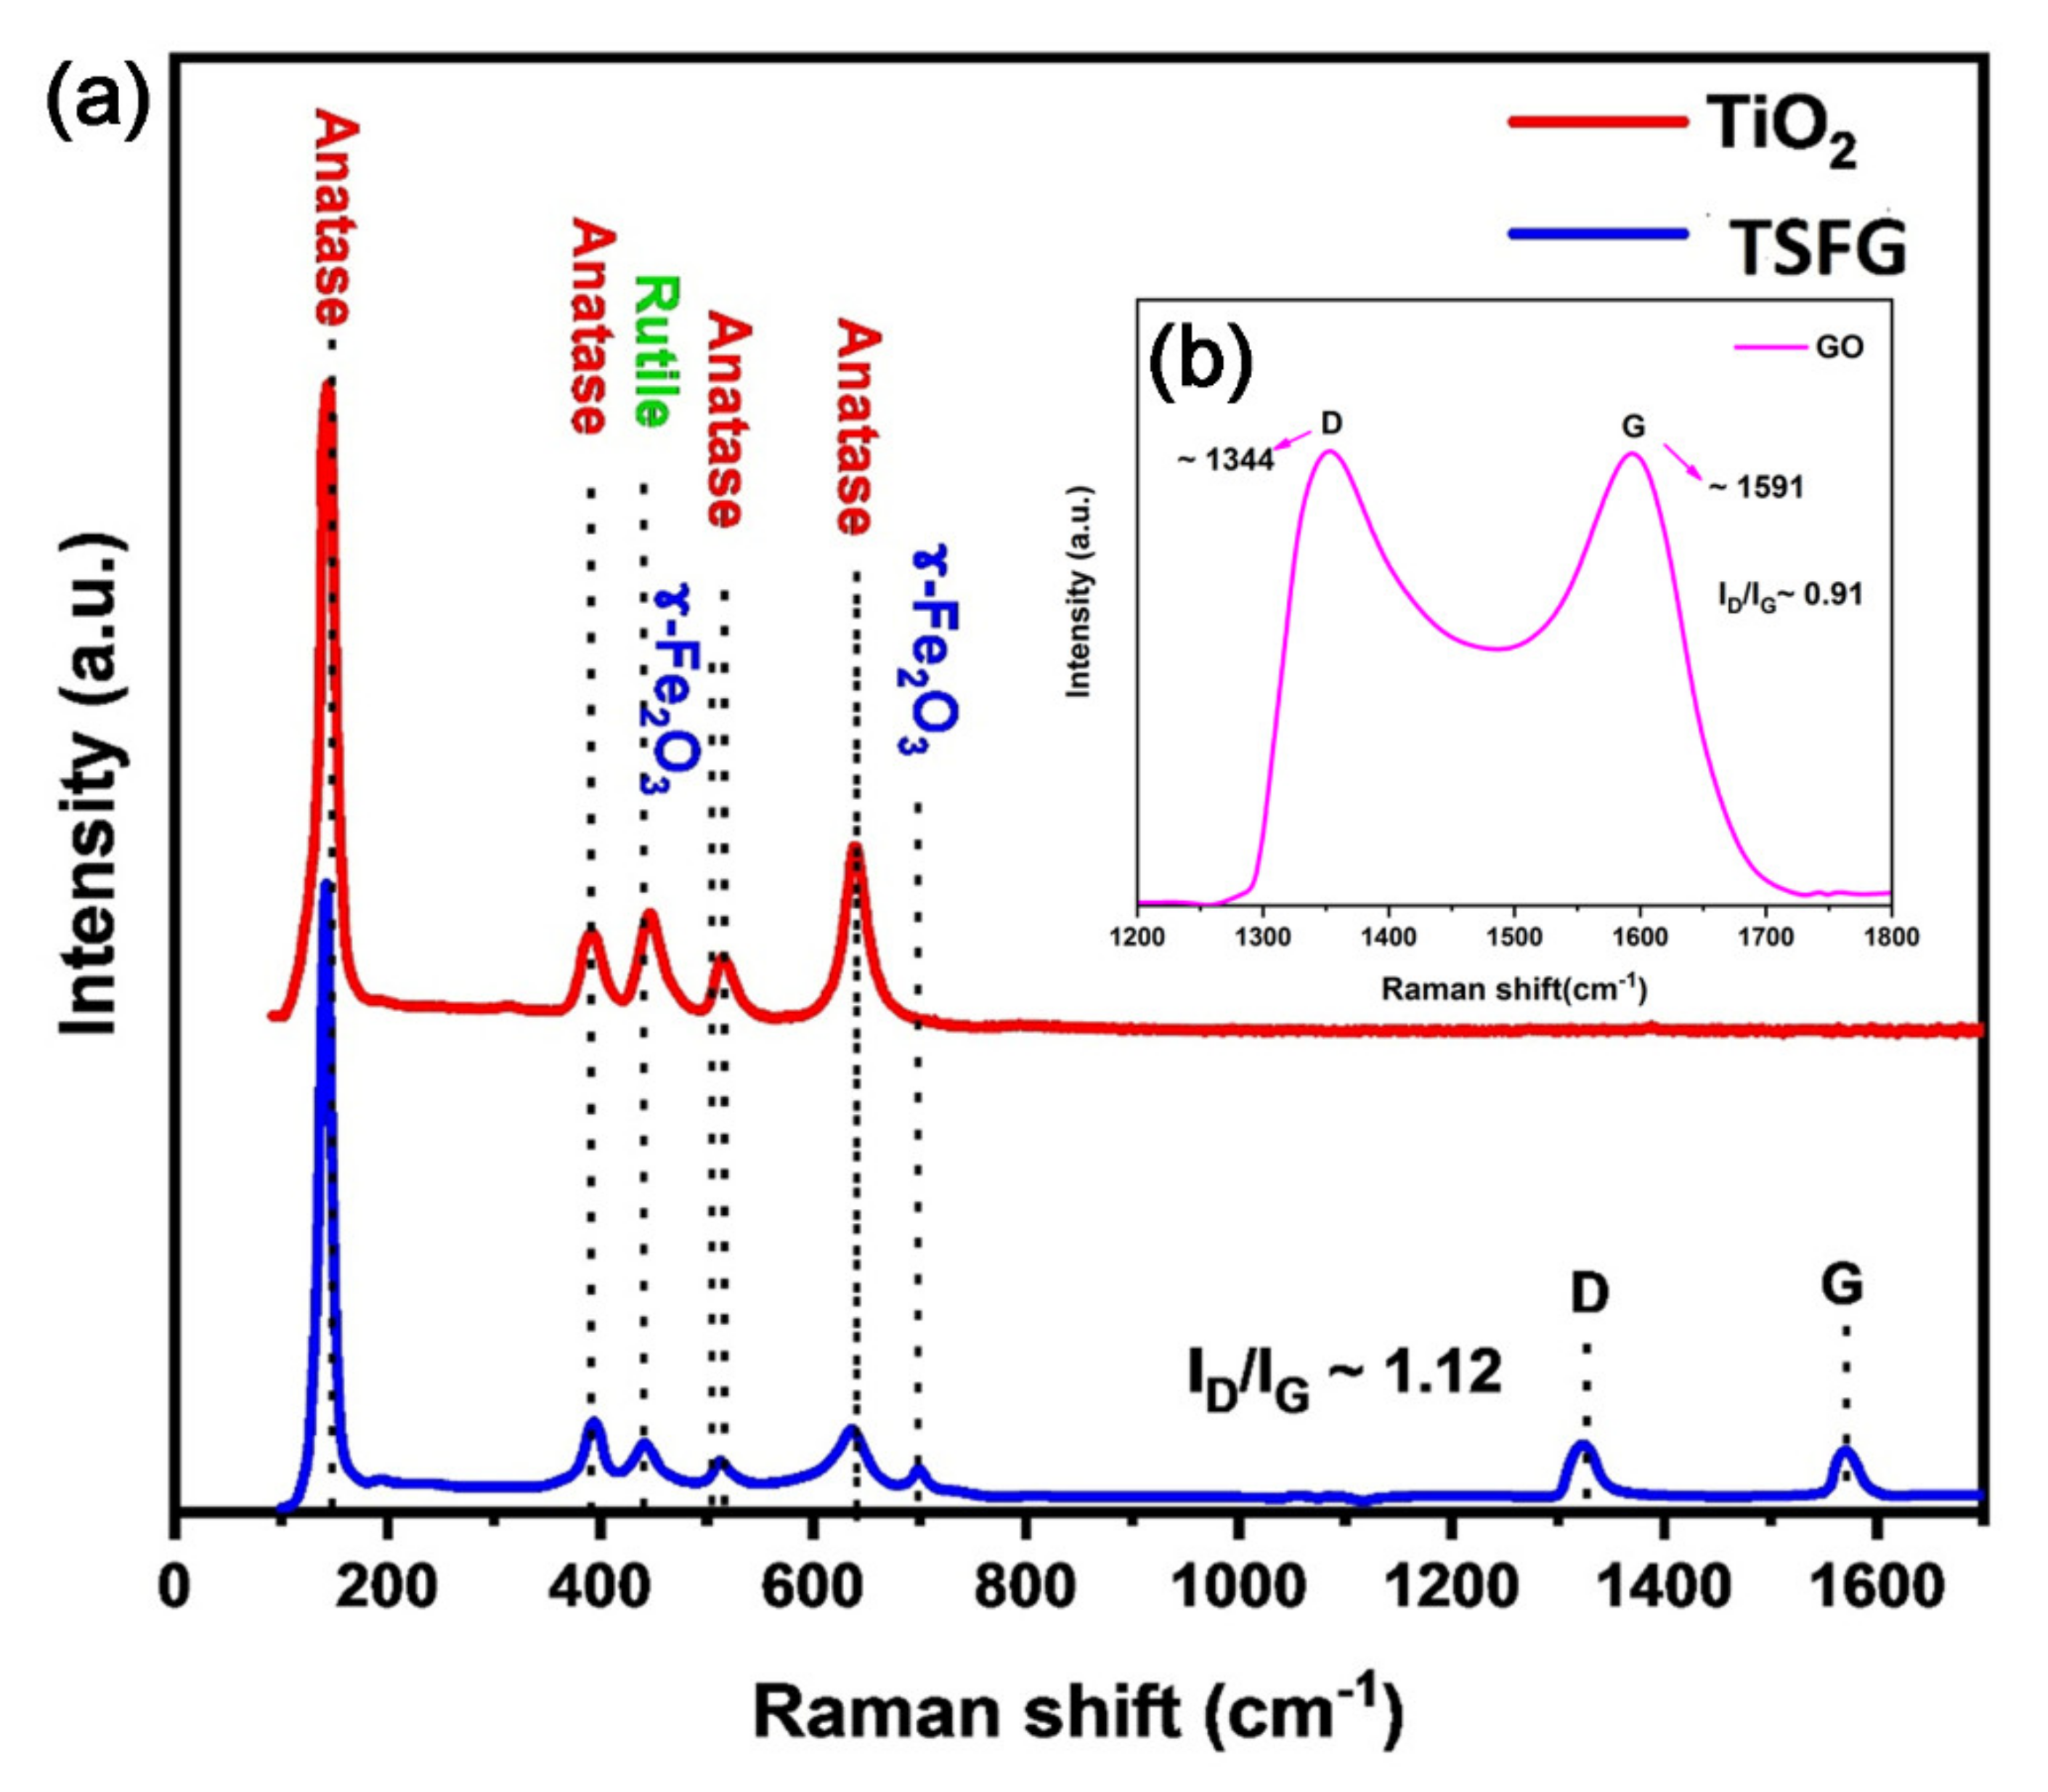
2.3. Raman Spectroscopy

The crystallographic structures of the prepared samples were investigated by Raman spectroscopy and the results are exhibited in Figure 4a,b. As observed in Figure 4a, the TiO2 anatase phase exhibited characteristic scatterings at 145, 393, and 638 cm−1, while the TiO2 rutile phase showed characteristic scatterings at 445 (Eg) [32]. The most interesting information that can be extracted from the Raman analysis is that the position of the characteristic scatterings shifted in the TSFG sample, in comparison with the neat TiO2, as a consequence of the decrease in crystallite size and the lack of adjacent atoms for the surface atoms, indicating that the surface atoms were in a relaxation state [33]. Moreover, no Raman peaks corresponding to SiO2 can be observed; hence, either Si4+ is present in the substitutional positions in the TiO2 crystal lattice, or it is present as amorphous SiO2. Peaks at 513 and 700 cm−1 can be attributed to γ-Fe2O3, respectively [34]. Moreover, for the sample of TSFG, both the D and G bands of GO, usually located at 1323 and 1570 cm−1, have shifted to lower frequencies in comparison with GO (Figure 4b). This is strong evidence that GO was successfully reduced and was therefore present as rGO.

2.4. FTIR Spectroscopy

Figure 5 shows the FTIR spectra of the TiO2, TS, γ-Fe2O3, and TSFG samples for wave numbers ranging from 300 to 4000 cm−1. TiO2 vividly exhibits three bands. The first broad absorption band could be observed at around 3500 cm−1, corresponding to the stretching vibration of the hydroxyl group O-H of TiO2, and the second absorption band at 1627 cm−1, corresponding to the bending modes of Ti-OH, indicating the surface hydroxylation of the nanoparticles. The third absorption band at 1381 cm−1 is attributed to Ti-O modes. The interaction between TiO2 and SiO2 in the sample of TS was exhibited in the Ti–O–Si bond (∼970 cm−1) [35,36]. This bond was considered to be responsible for the improvement in the thermal stability of anatase TiO2 that was observed by XRD, suppressing the anatase to rutile transformation.
The absorption band at 1104 cm−1 was attributed to the asymmetric Si–O–Si stretching vibration. Moreover, γ-Fe2O3 shows strong bands at 453 cm−1 and 544 cm−1 which are attributed to the Fe–O groups; however, TSFG exhibited vibrational bands at 448 cm−1 and 538 cm−1. This shift in the absorption band could be related to the TiO2/SiO2 surface augmentation by γ-Fe2O3 [37]. Finally, the absorption peak at 1542 cm−1 is related to the skeletal vibration of graphene [38,39]. Since surface hydroxyl groups are useful for photocatalytic reactions, and the TSFG sample has the largest hydroxyl peak among all samples, the samples are expected to show enhanced activity.

2.5. Magnetic Properties: Vibrating-Sample Magnetometer (VSM)

The room temperature magnetic properties of the γ-Fe2O3 and TSFG samples are depicted in Figure 6. γ-Fe2O3 nanoparticles have a saturation magnetization (Ms) of about 58.2 emu/g, while TSFG nanocomposites have an Ms of about 20.0 emu/g. This drop is related to the presence of TiO2, SiO2, and rGO. However, 20.0 emu/g is powerful enough to respond to an external magnetic field, and it can be effectively extracted, as depicted in the same figure. Such efficient separation is required for recyclable photocatalysts.

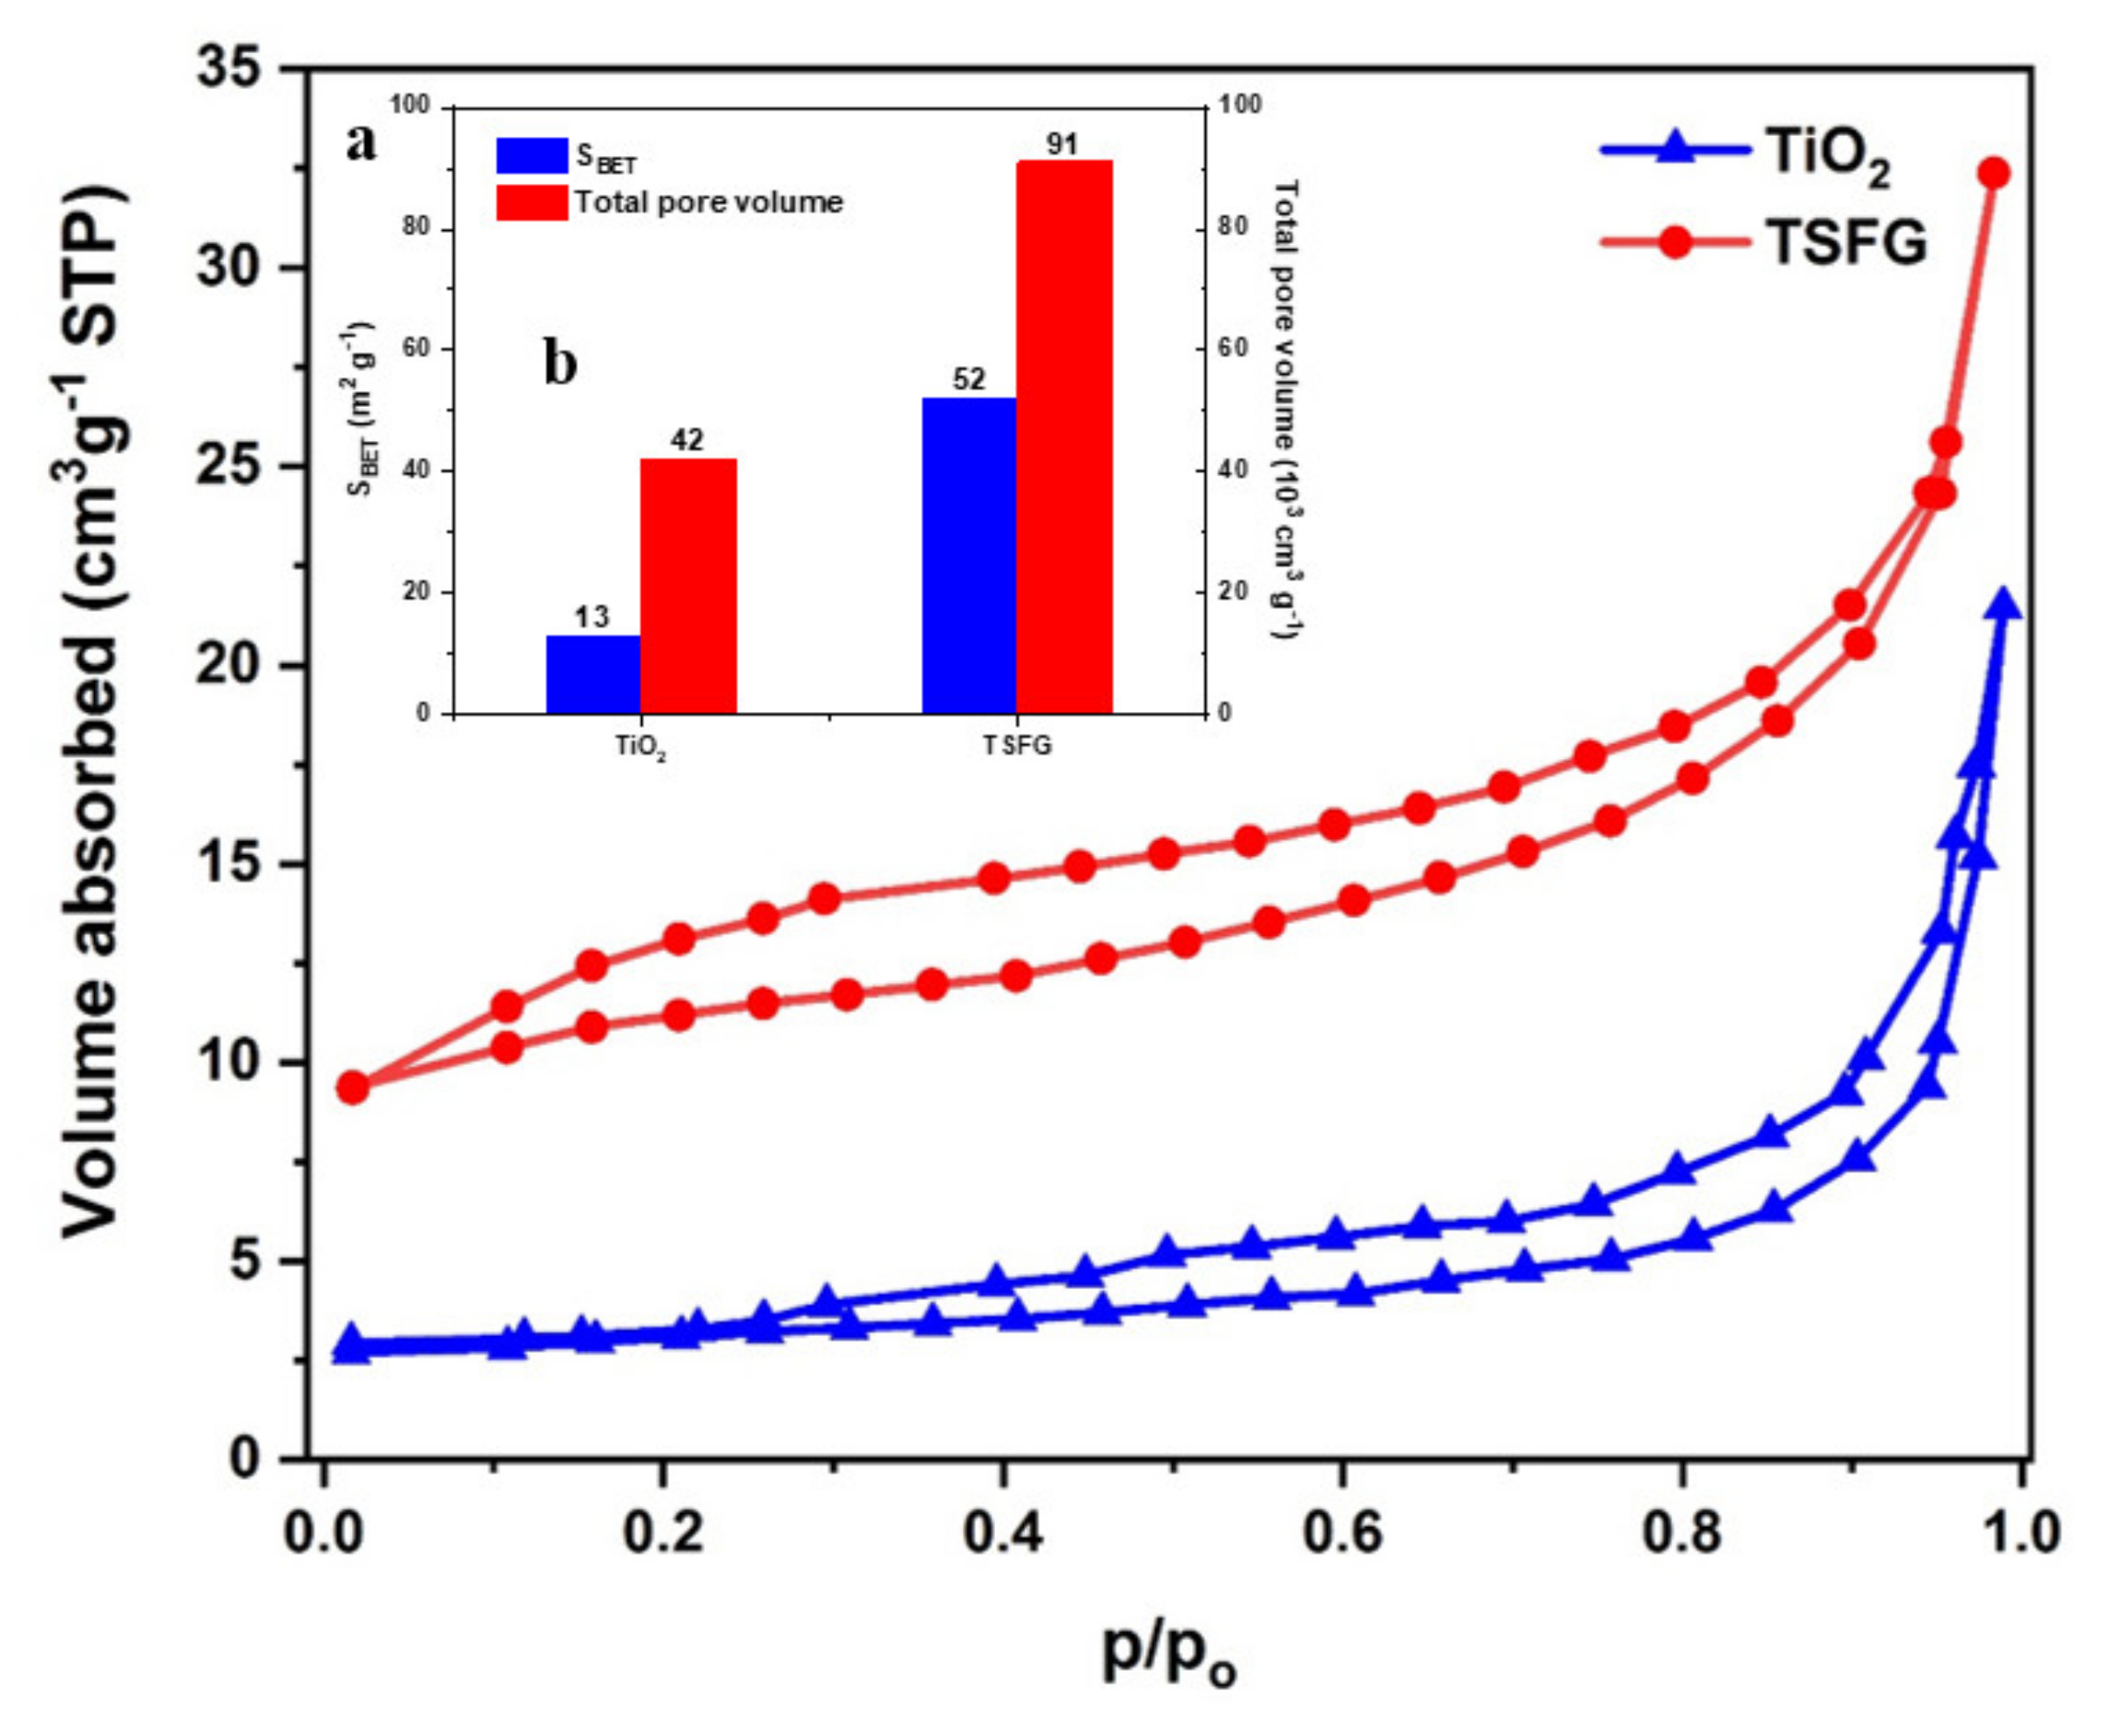
2.6. Nitrogen Gas Physisorption Studies

The porosity of the prepared samples was investigated by N2 adsorption–desorption studies. An effective photocatalyst needs a high surface area and optimum porosity. Figure 7a shows the nitrogen gas adsorption–desorption isotherms for the TiO2 and TSFG samples. The Brunauer–Emmett–Teller (BET) surface areas and pore volumes of these samples are given in the inset (Figure 7b). Type IV isotherms are obtained in the prepared samples, showing the presence of a mesoporous structure. The surface area of TSFG is remarkably larger than that of neat TiO2, owing to the incorporation of rGO sheets and SiO2 with netlike and porous structures [40,41]. The presence of SiO2 particles can retard the growth of TiO2 particles, and the netlike structure of SiO2 promoted the generation of a porous composite. The overall pore volume also increased in the TSFG composite. Enhancements in the surface area and porosity of the TSFG composite as compared to pure TiO2 can be beneficial, providing better interfacial contact between the surface of the catalyst and the reactants.

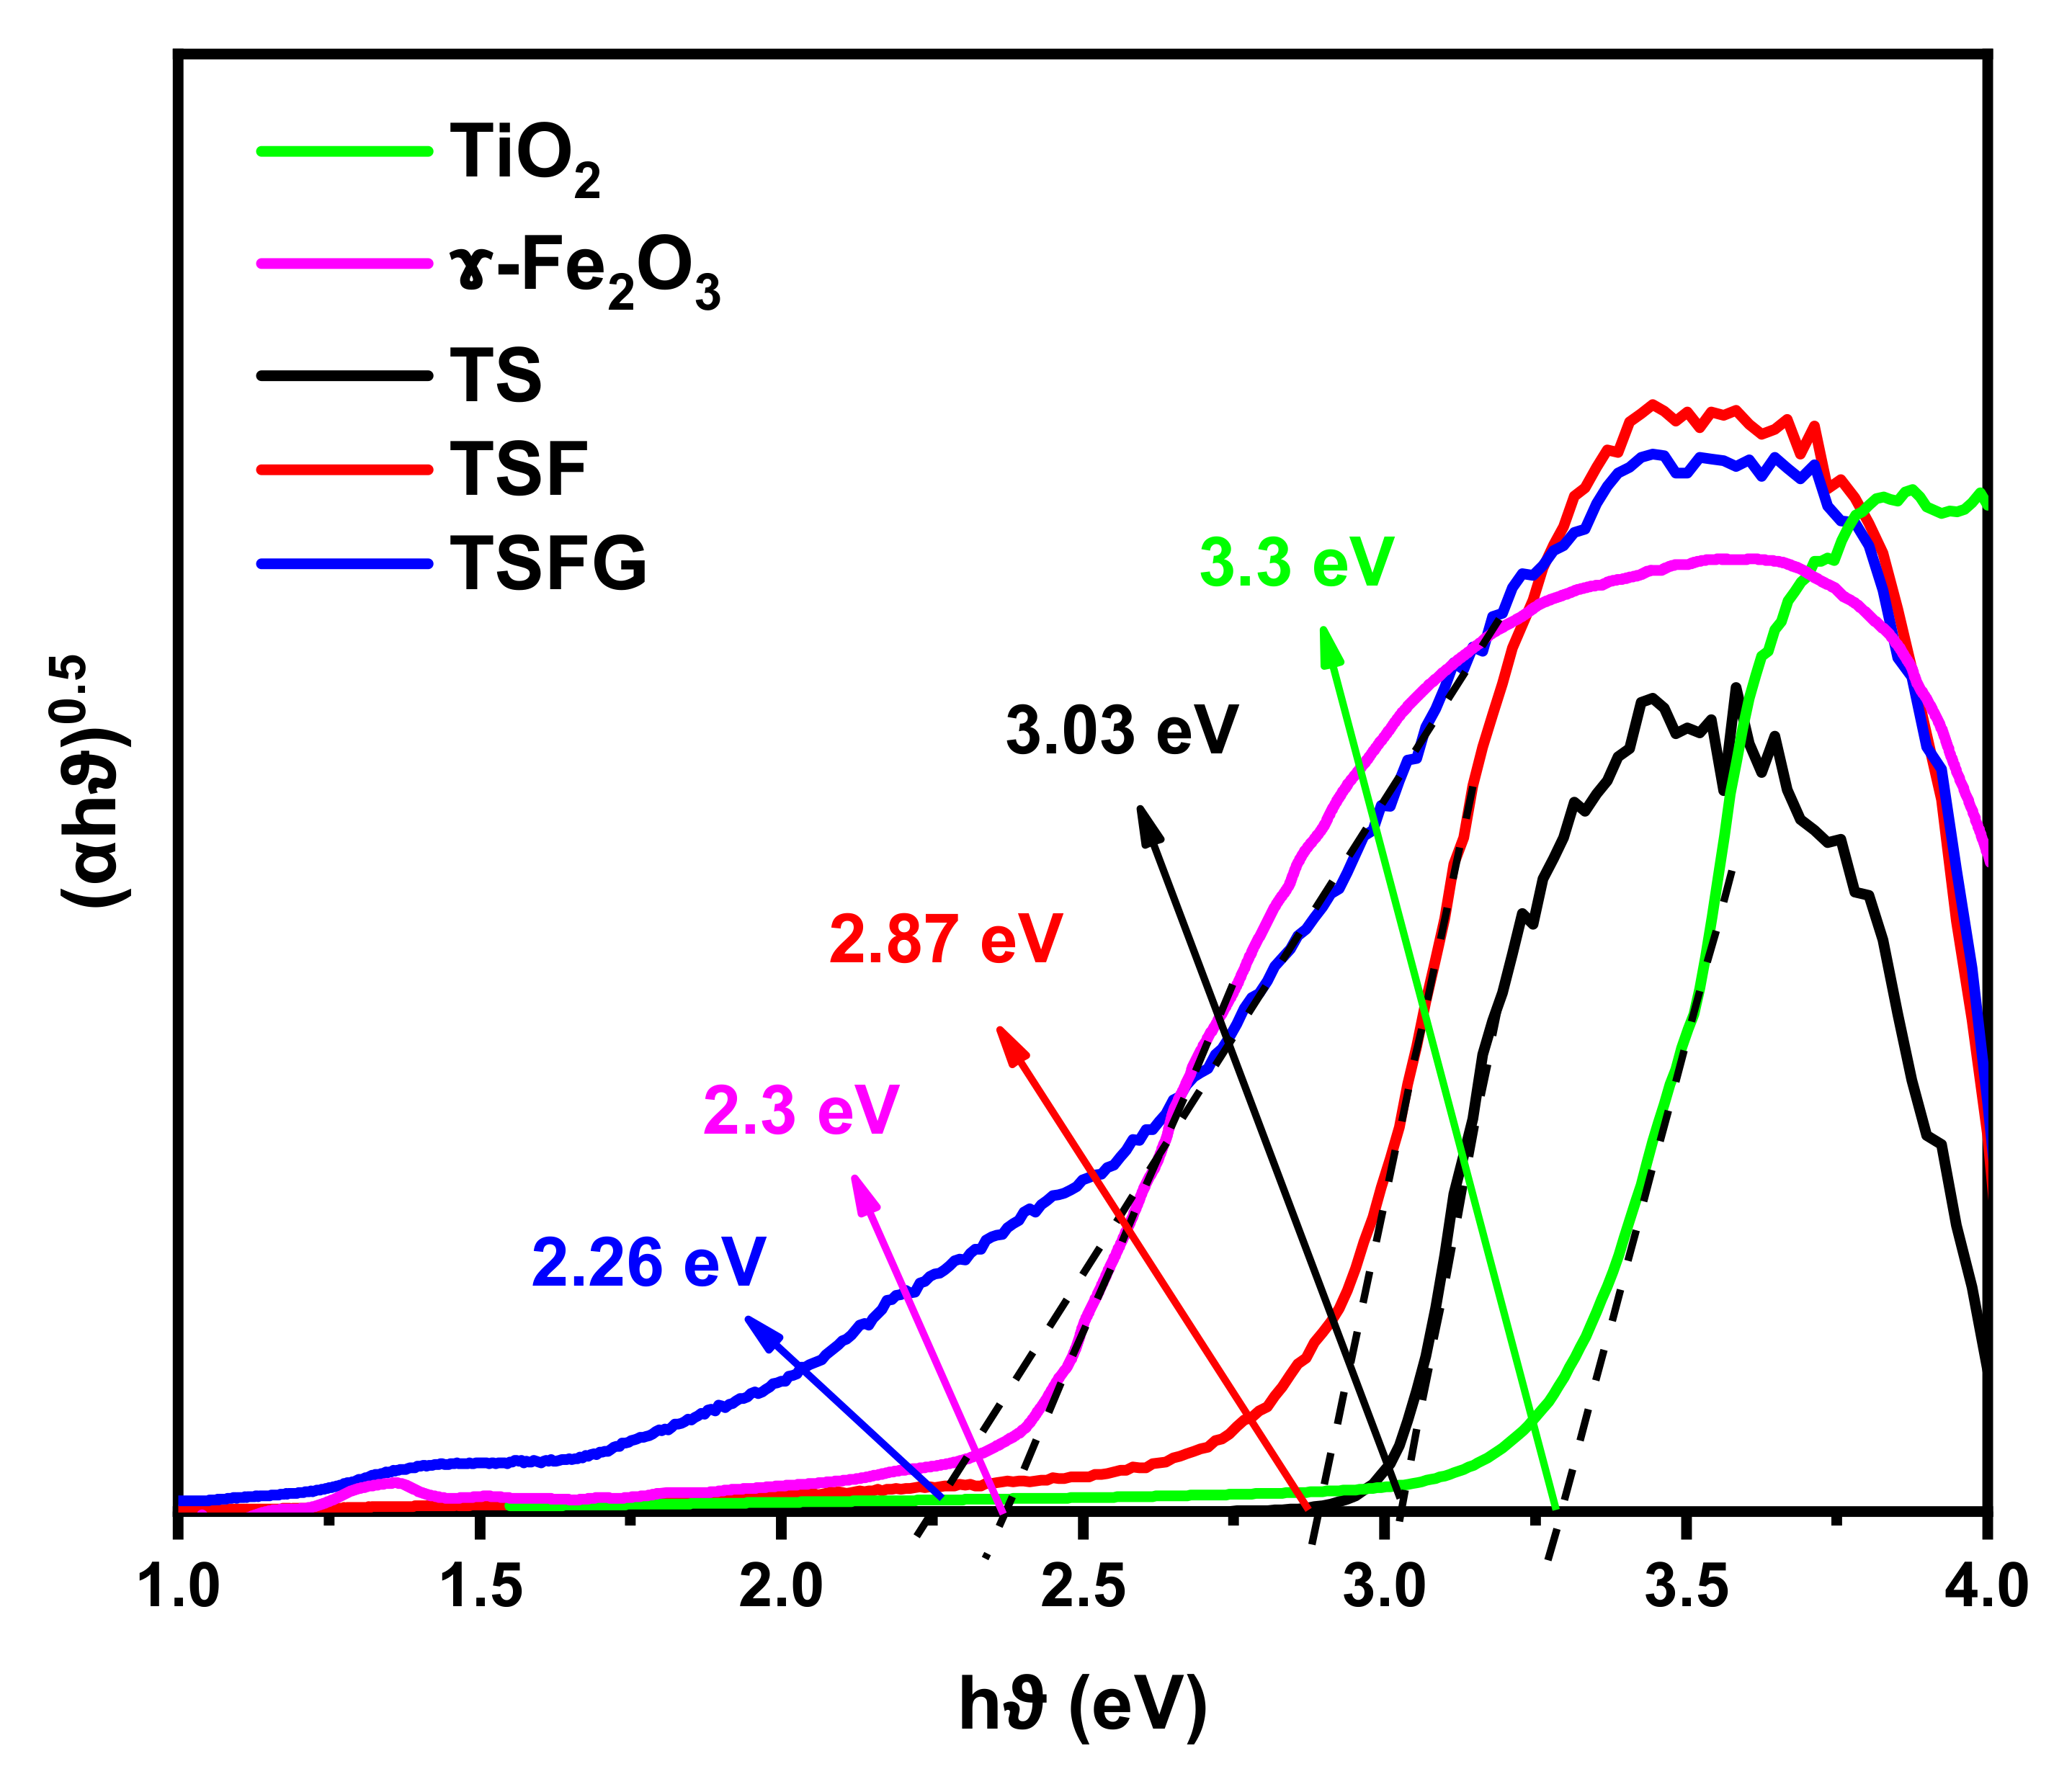
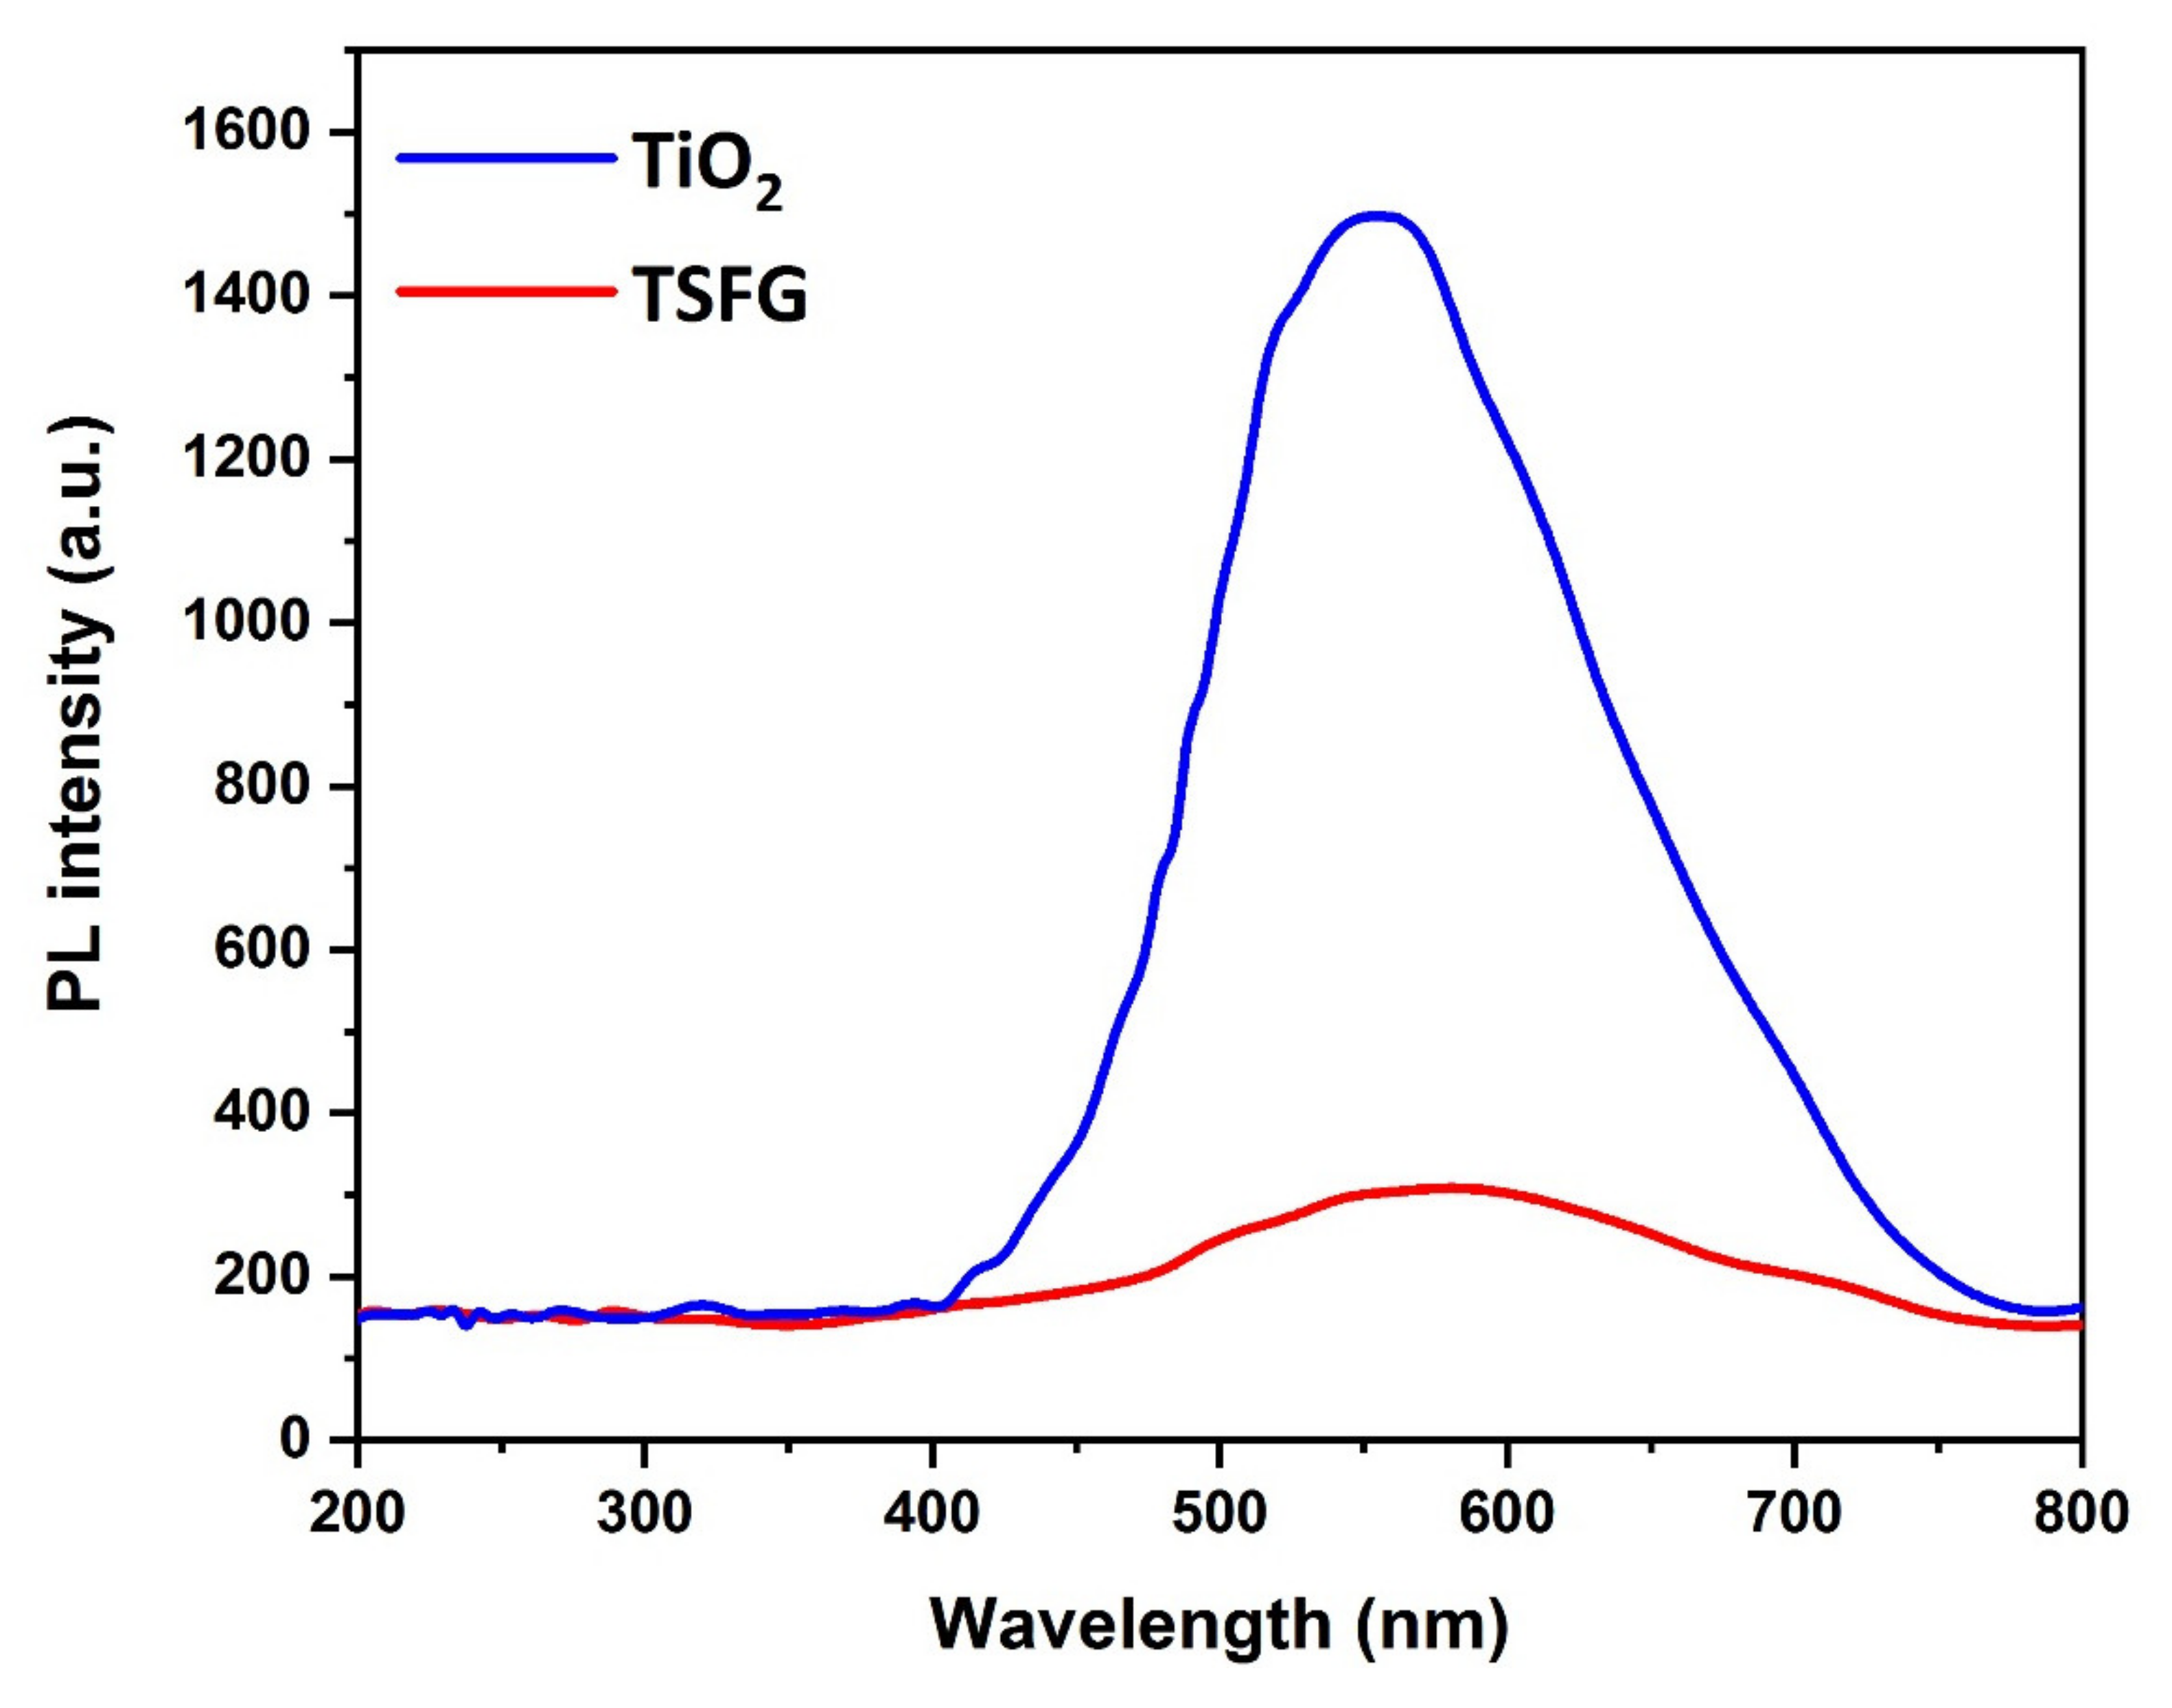
2.7. Optical Properties

Figure 8 presents the direct band gap values that were determined by extrapolating the linear region of the Tauc plot of (αhυ)0.5 against the photon energy. The band gap energy for TiO2 and γ-Fe2O3 is 3.3 eV and 2.3 eV, respectively. Eg was calculated as 3.03 eV and 2.87 eV for TS and TSF, confirming the decrease in band gap energy produced by the addition of γ-Fe2O3. However, Eg is the minimum for the sample of TSFG (2.26 eV).
Photoluminescence (PL) experiments were performed to investigate the recombination probability of bare TiO2 and TSFG photocatalysts (Figure 9). The PL intensity of the TSFG photocatalyst was significantly lower than that of the bare TiO2 nanoparticles. This could be related to the lower e/h+ recombination probability of the TSFG photocatalyst. Due to the generation of a heterojunction between TiO2 and γ-Fe2O3, the photogenerated electrons and holes were separated more effectively and efficiently. On the other hand, rGO speeded up the carrier mobility at the TiO2- γ-Fe2O3 heterojunction, increasing the photogenerated e/h+ separation and thus possibly enhancing the photocatalytic performance.

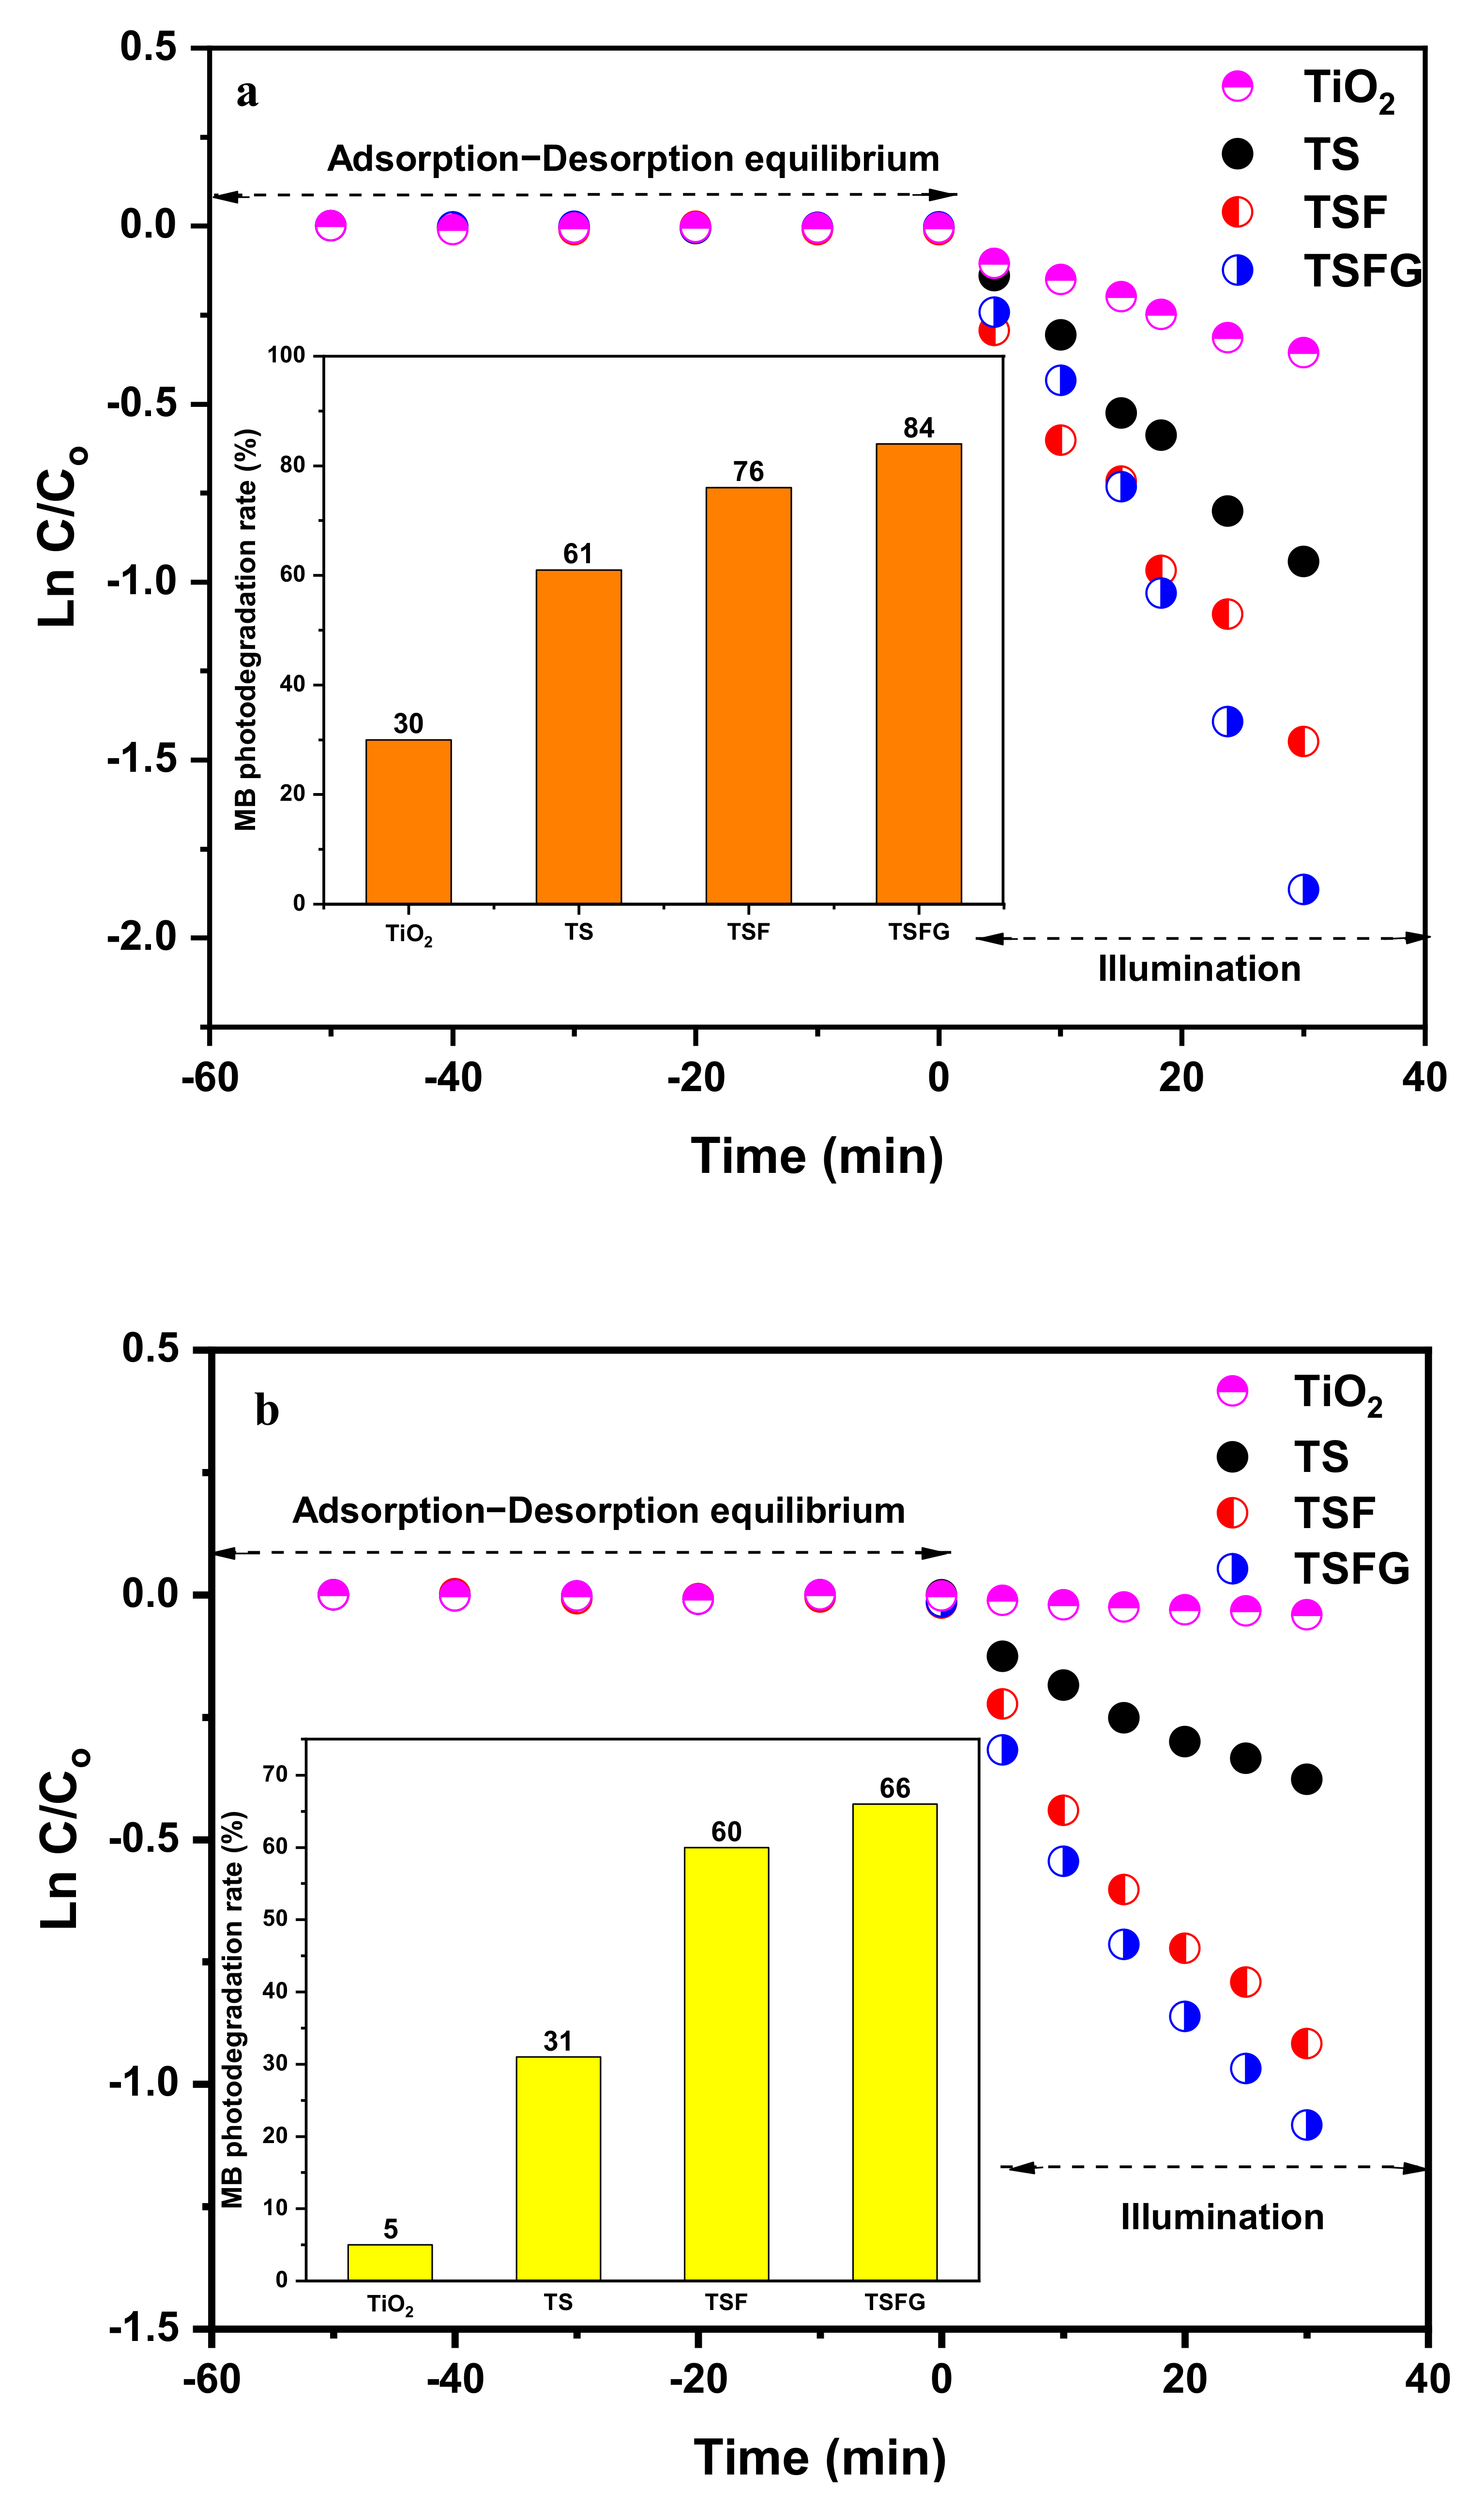
2.8. Photoactivity under UV and Visible Lights

The photocatalytic degradation of MB with TiO2, TS, TSF, and TSFG powder photocatalysts under UV and visible lights was investigated (Figure 10). After reaching the equilibrium adsorption state in the dark (50 min), it was found that the amount of MB that is adsorbed in all samples could be neglected. Additionally, in the absence of a photocatalyst, no photolysis was observed, indicating that the removal of MB only occurred through photocatalysis. As depicted in Figure 10a, pure TiO2 degraded only 30% of MB after 30 min under UV irradiation, while TS degraded about 61% of MB at the same condition. The samples of TSF and TSFG showed more than 76% and 84% removal under UV light irradiation, respectively. These amounts decreased to around 5%, 31%, 60, and 66% under visible light (Figure 10b). For comparison purposes, recent reports on the photodegradation of MB over different kinds of TiO2 composites, including Fe2O3 and graphene, are listed in Table 2.
All results displayed good linearity of ln C/C0 vs. time, with correlation coefficients (R2) higher than 0.9. Therefore, the pseudo-first-order kinetics model that was chosen was confirmed [42,43]. The kinetic constants (k) are reported in Table 3.
Some considerations are drawn here to understand the increase in photocatalytic efficiency in the different steps of composite production. Firstly, TS exhibited a higher content of anatase phase in TiO2 as well as an improved morphology, with smaller particle sizes and no aggregation, which made more surface sites available for reactions.
As observed in Figure 11, the band structures of the TiO2 and γ-Fe2O3 samples were estimated by Mott–Schottky plots. The positive slope of the plot confirms the extrinsic n-type conductivity of TiO2. On the contrary, the negative slope of the plot confirms the extrinsic p-type conductivity of γ-Fe2O3. In addition, the flat band position of the semiconductors is the interception on the X axis of the extrapolated linear flat of the Mott–Schottky plot and is close to the conduction band (CB) position of the semiconductors. Based on the obtained results, the evaluated CB positions of TiO2 and γ-Fe2O3 are −0.94 and −0.32 V, respectively, vs. Ag/AgCl (pH = 6.7). It should be noted that the obtained potential values are −0.34 and 0.27 V vs. NHE (pH = 0). With respect to the Eg of TiO2 (3.3 eV) and γ-Fe2O3 (2.3 eV), the valence band (VB) potentials of TiO2 and γ-Fe2O3 were calculated as 2.96 and 2.57 V, respectively. As mentioned, TiO2 is a n-type semiconductor whose Fermi energy level lies close to the CB position and γ-Fe2O3 is a p-type semiconductor whose Fermi energy level lies close to the VB position. When γ-Fe2O3 forms a heterojunction with TiO2, the Fermi energy levels of γ-Fe2O3 and TiO2 tend to rise and decrease, respectively, to reach a common value. As a result, the CB potential of γ-Fe2O3 is more negative than that of TiO2; hence, CB photogenerated electrons of γ-Fe2O3 could transfer to the CB of TiO2 and VB photogenerated holes of TiO2 could migrate to the VB of γ-Fe2O3 [44,45]. This could improve charge separation and reduce recombination. Moreover, TSFG presented a larger surface area than TiO2, according to the BET analyses; however, this increase is not sufficient to justify the improved efficiency observed, hence some synergistic effect is expected in the composite.

2.9. Effect of Reactive Species on Photodegradation Process

The types of reactive species produced in the TSFG system were determined using t-BuOH as a hydroxyl radical (OH) scavenger, p-benzoquinone BZQ as a superoxide radical (O2•−) scavenger, and KI as a hole (h+) scavenger (Figure 12). As 1 mM t-BuOH was added, there were significant inhibitory effects on MB degradation. As 1 mM BZQ and 1 mM KI were added, there were moderate effects. These results indicated that OH was the predominant reactive species for the photodegradation of MB, while a mild reduction in MB degradation was observed by hindering oxygen superoxide and hole reactive species.

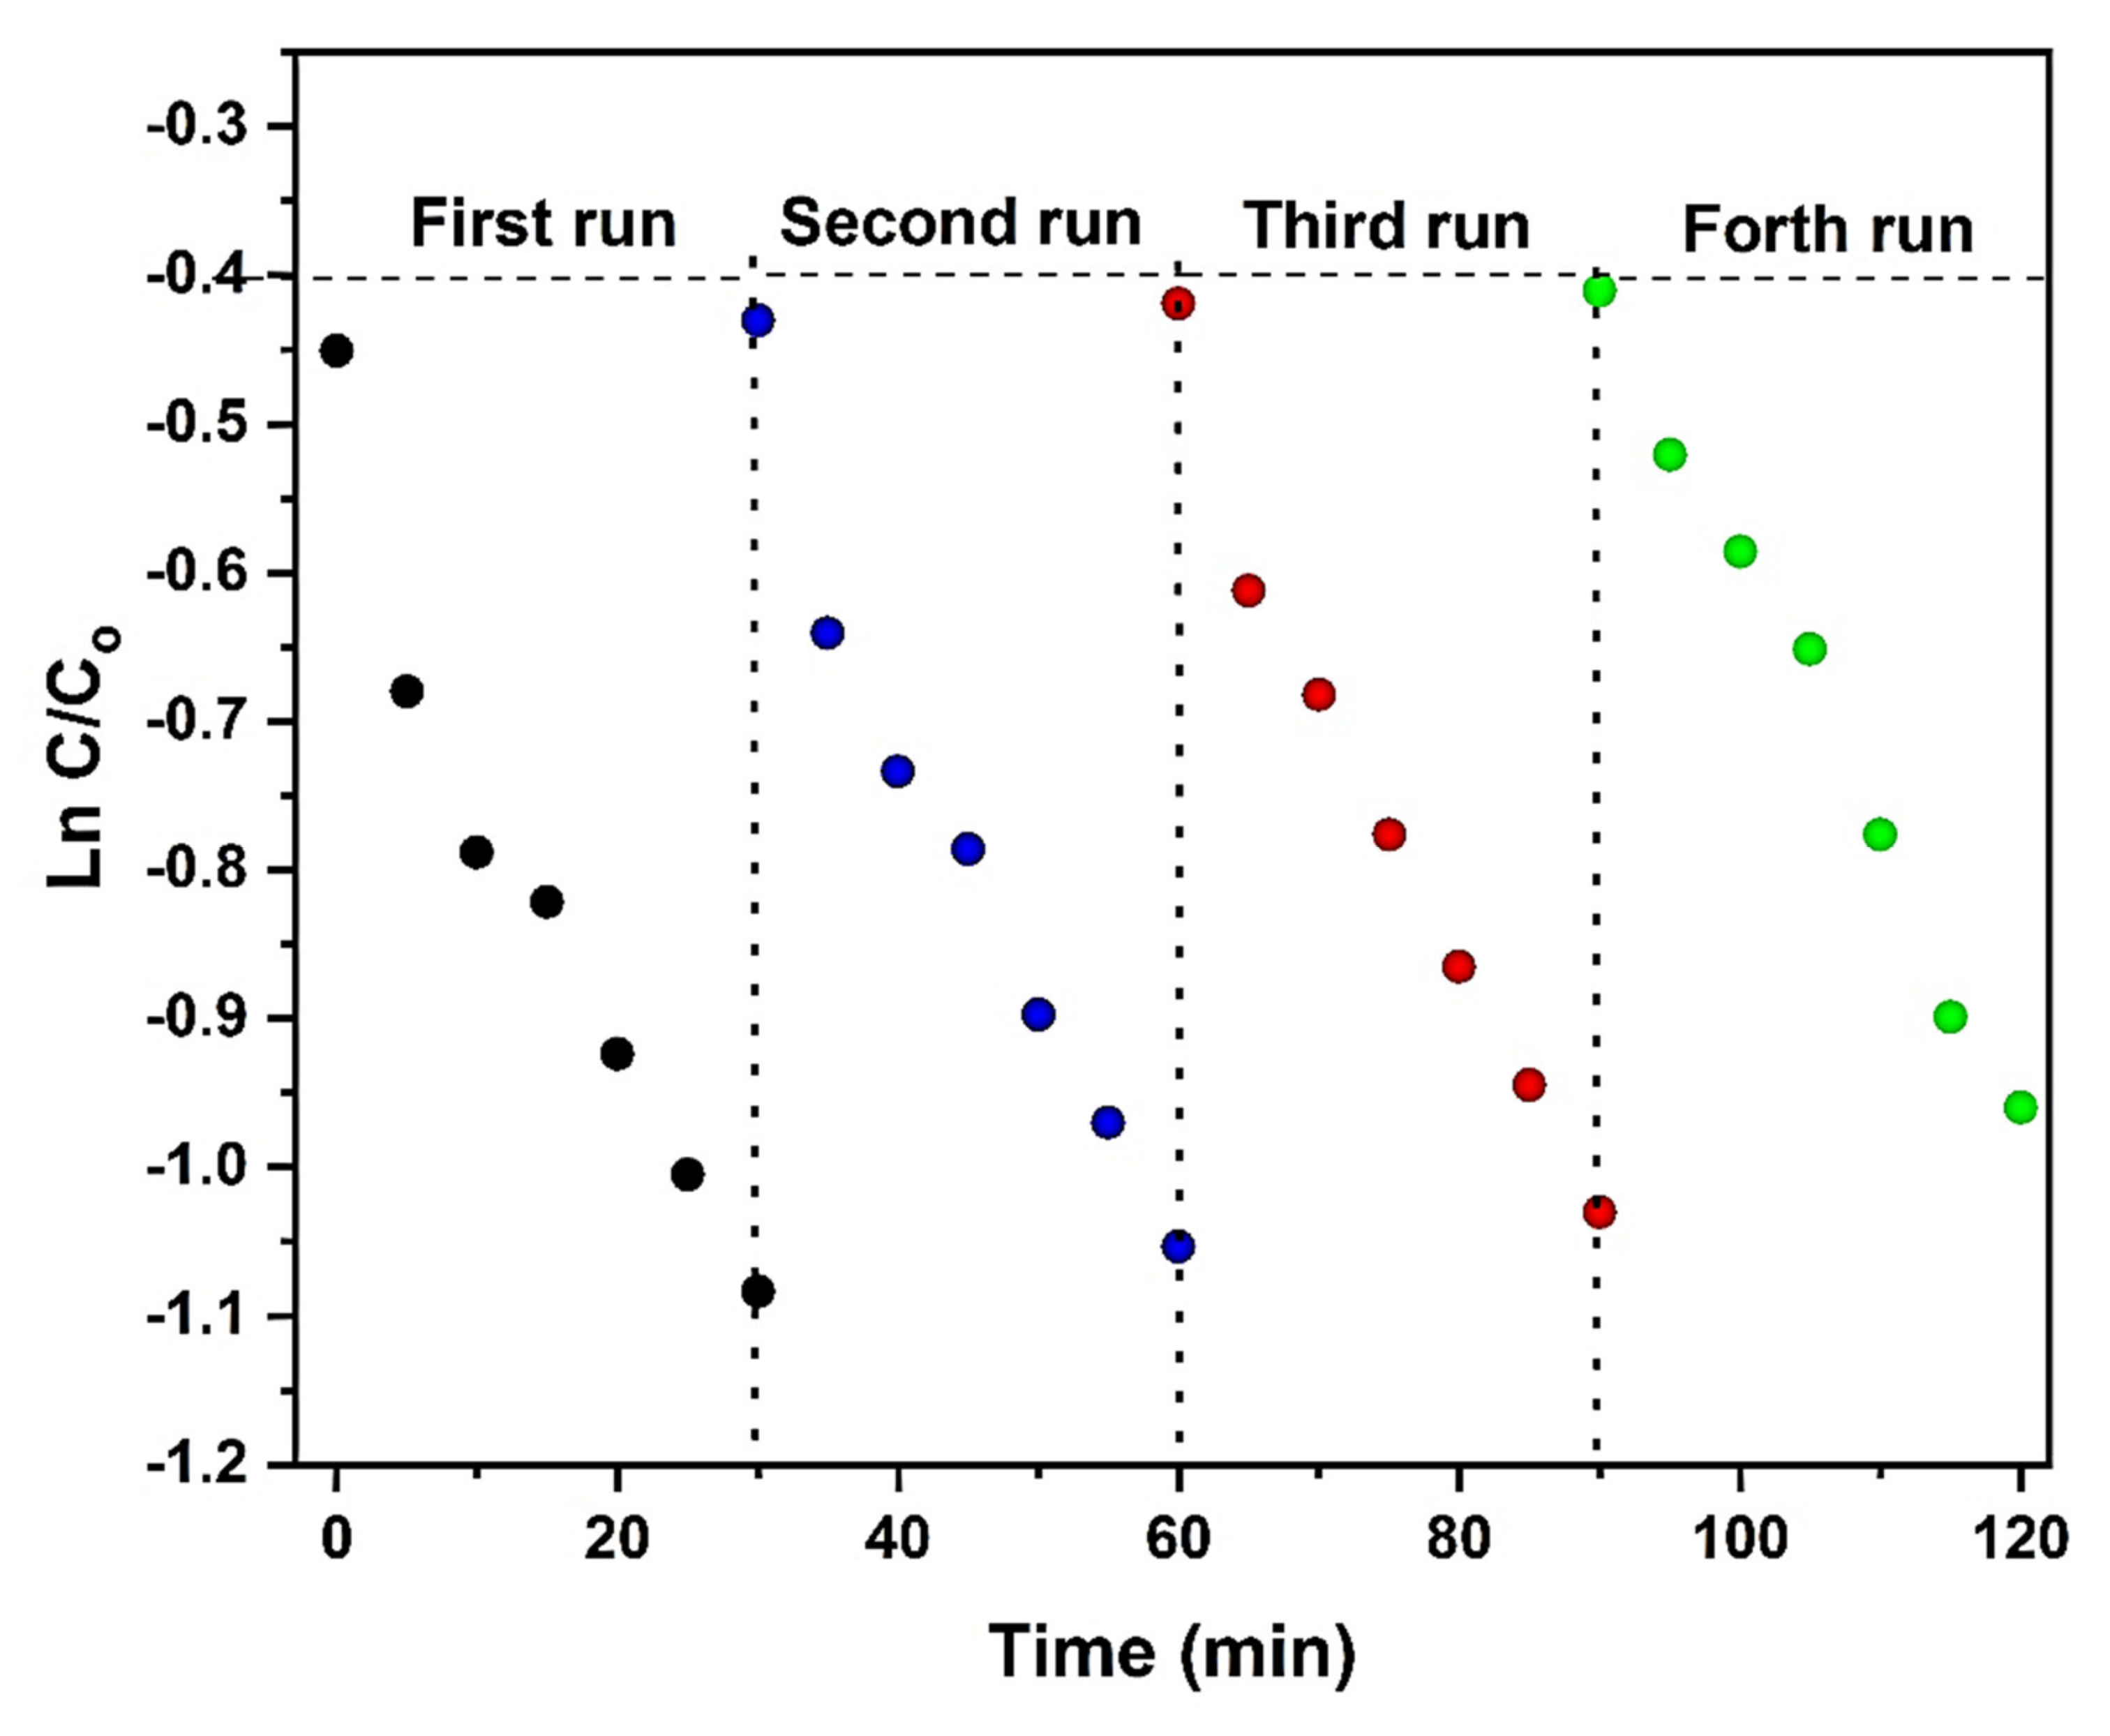
2.10. Photocatalytic Stability

The TSFG heterojunction was recycled in four successive photocatalytic tests. At the end of the test, the used photocatalyst, separated by an external magnetic field, was washed with distilled water and dried at 80 °C for 3 h. As observed in Figure 13 and Table 4, the photocatalytic degradation of the TSFG sample shows no serious loss after four runs for the photodegradation of the MB solution. It can be clearly observed that the composite is stable during the photodegradation process and it does not suffer from either photocorrosion or poisoning in the tested environment.

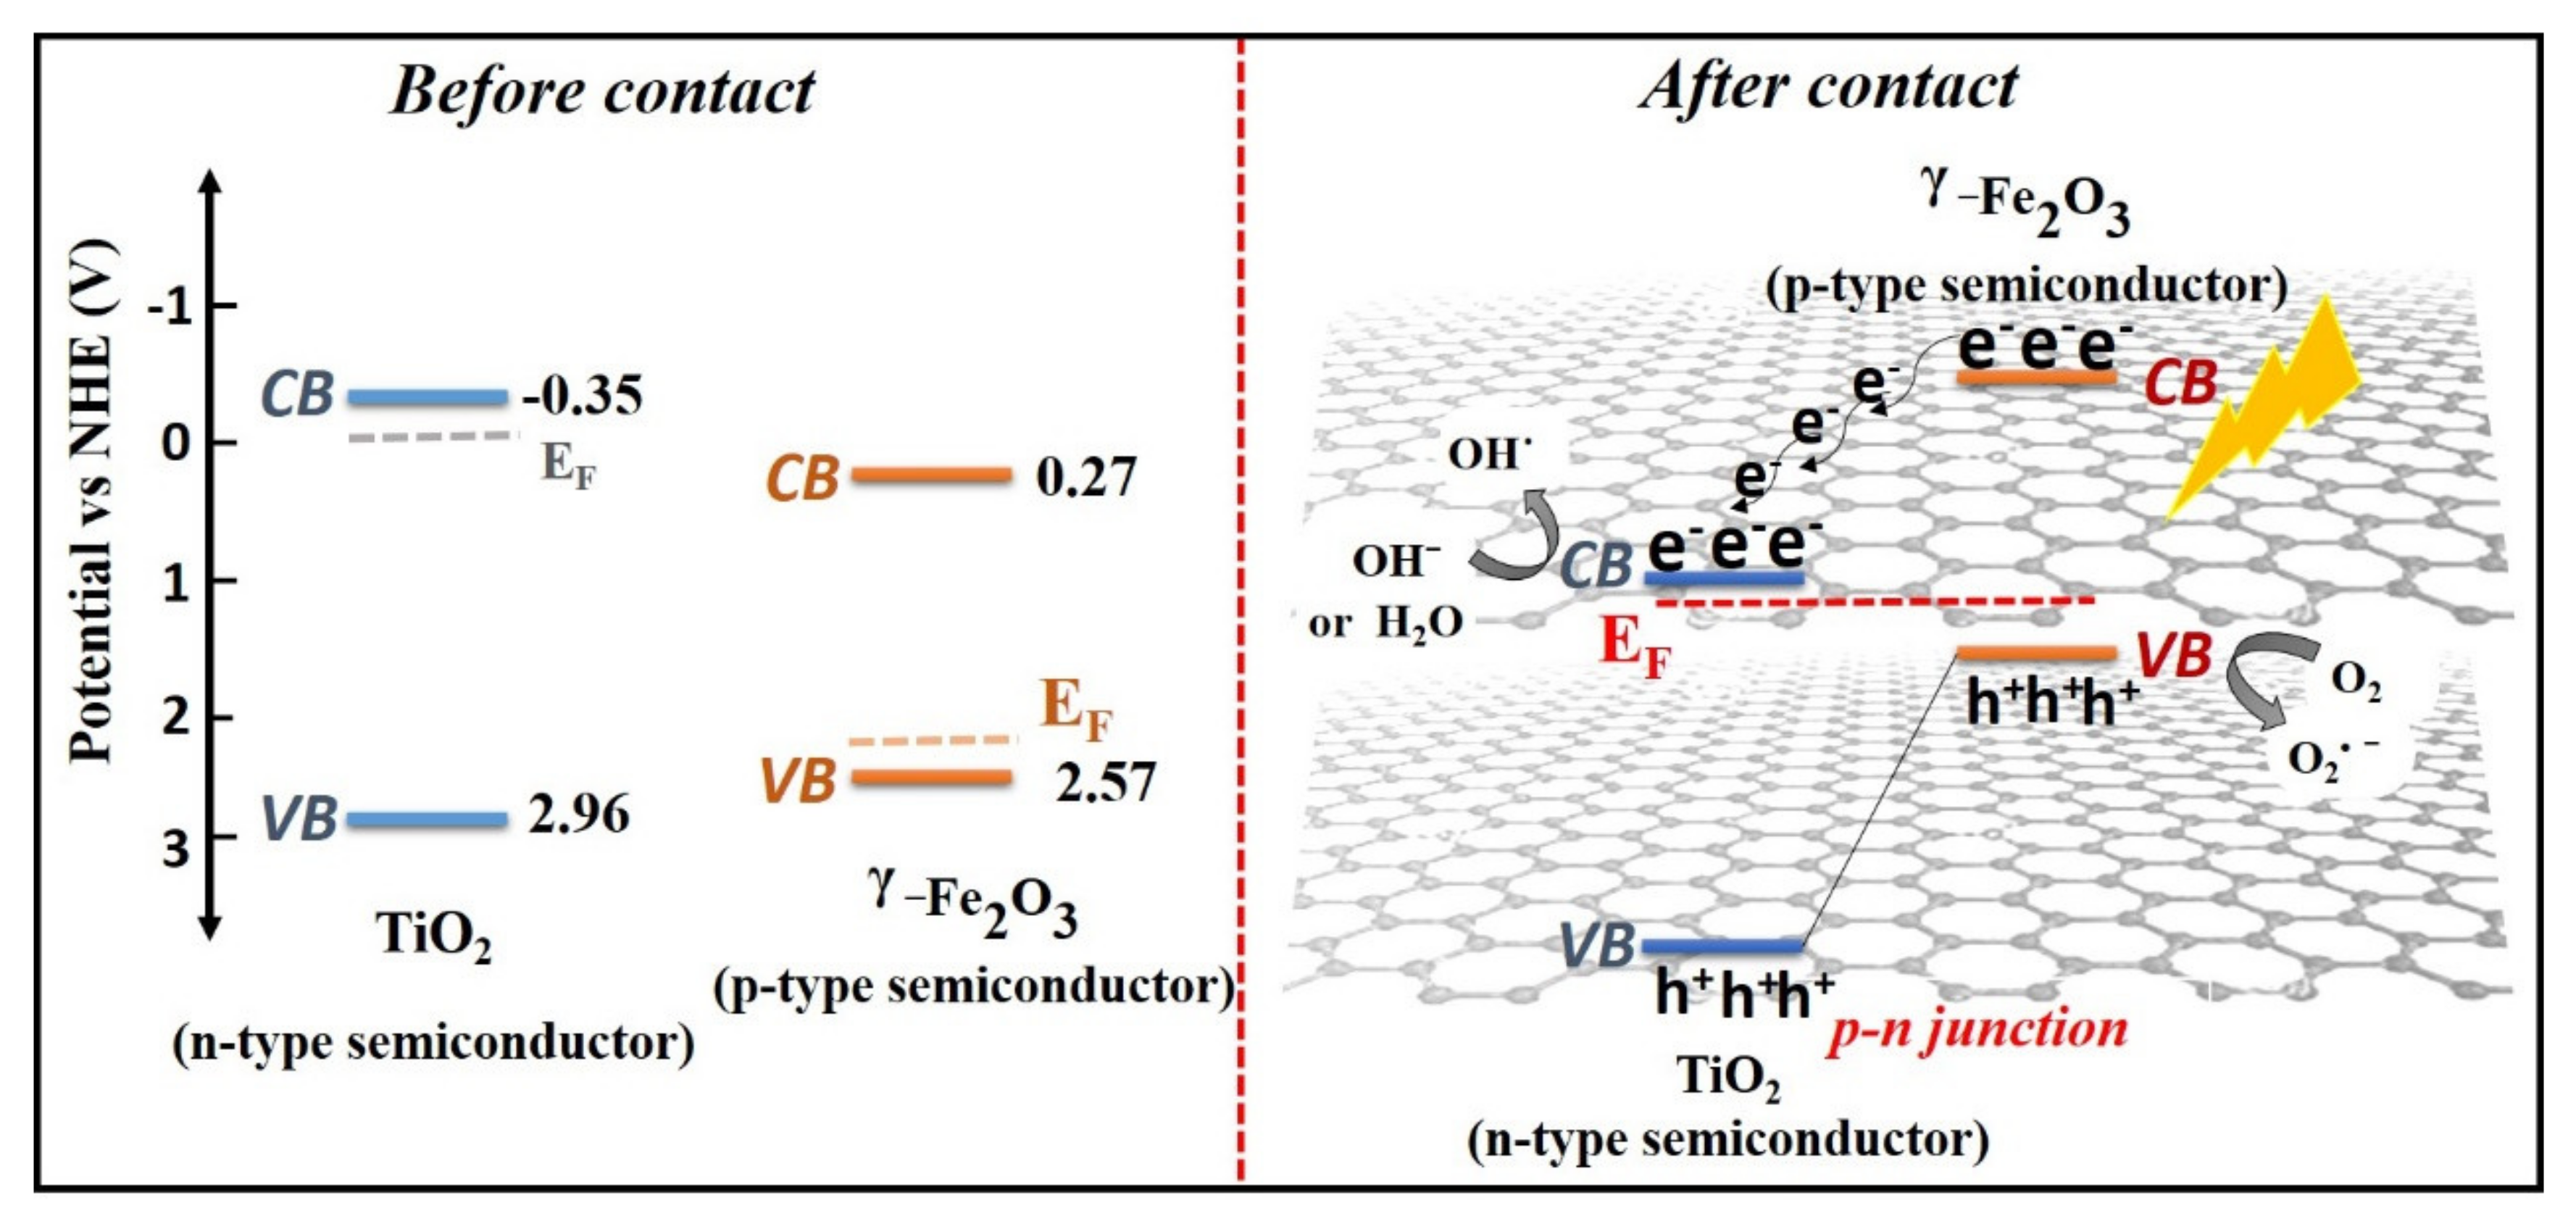
2.11. Possible Photocatalytic Mechanism in TSFG System

The activity of the photocatalytic degradation reaction is highly dependent on a great number of parameters, such as band gap energy, adsorption of dye at the catalyst surface, particle size, crystallinity, surface area, surface hydroxylation, and e/h+ recombination rate. For the prepared TSFG sample, the photocatalytic activity under UV and visible light illumination is related to several factors:
  • The addition of SiO2, enhancing the hydroxyl groups and surface area of the sample and stabilizing the anatase phase
  • The generation of a heterojunction between TiO2 and γ-Fe2O3, decreasing the rate of e/h+ recombination
  • rGO sheets have a high charge transfer ability that can increase the charge separation efficiency, also preventing recombination; they also act as nucleation sites for nanoparticle growth, allowing good distribution of nanoparticles and contrasting agglomeration.
Concerning visible light activity, it is negligible for pure TiO2 while the efficiency increases in the composite materials. Under visible light illumination, TiO2 cannot be excited to generate e/h+ pairs, whereas γ-Fe2O3 can be activated to yield charge carriers. The rGO sheets can serve as the electron reservoirs to rapidly capture or shuttle the photo-induced electrons from the CB of γ-Fe2O3. Subsequently, electrons are moved to the CB of TiO2 by the conductive network of rGO because of the coupling interfacial contact between rGO and TiO2, and the photoinduced holes are accumulated in the VB of γ-Fe2O3 (Figure 14). Moreover, rGO sheets can delay the agglomeration of nanoparticles. The negative electrons in the CB of TiO2 react with the O2 dissolved in the dye solution to form O2•−. Moreover, O2•− reacts with H+ to form OOH, followed by rapid decomposition to OH radicals, while the accumulated holes in the VB of γ-Fe2O3 could oxidize H2O and OH to form OH radicals that are involved in the photodegradation reaction of organic contaminants [52,53,54,55,56]. The photodegradation pathway of MB over the photocatalysts is schematically depicted in Figure 15 [57,58,59].

3. Materials and Methods

Iron chloride tetrahydrate (FeCl2·4H2O), propylene oxide, tetraethyl orthosilicate (TEOS), tetrabutyl titanate (TBT), sulfuric acid (H2SO4), graphene oxide solution (GO), sodium borohydride (NaBH4), ethanol (C2H5OH), and MB were purchased from Sigma–Aldrich, Milan, Italy. All reagents were used as received.

3.1. Preparation of γ-Fe2O3 Nanoparticles

A volume of 5 mmol of FeCl2·4H2O was dissolved in ethanol (0.3 M), and 50 mmol of propylene oxide was added to the solution, after which it was sonicated for 15 min. The obtained brown solution was stirred for 6 h and the mixture solution was boiled until powder was obtained [60].

3.2. Preparation of Reduced Graphene Oxide (rGO)

A volume of 6 mmol of NaBH4 was dissolved in diluted water (0.3 M) and then the solution was sonicated for 10 min. The aqueous solution was added dropwise to the 5 mL of homogeneous GO aqueous dispersion (2 mg/mL) while it was being stirred at 80 °C for 1 h. The suspension was centrifuged and washed several times to obtain the black powder of rGO [61].

3.3. Preparation of Nano Magnetic TiO2/SiO2/γ-Fe2O3/rGO Photocatalyst

A volume of 40 mmol of TEOS was added to 65% HNO3 and the solution was stirred for 1 h (molar ratio of TEOS and H+ was kept at 2.4). The product was centrifuged and dried at room temperature for 10 h. The obtained powder was dissolved in 10 mL of ethanol under sonification for 1 h, and then 400 mmol of propylene oxide and 40 mmol of TBT were added to the solution to form sol A, which was then aged for 72 h. The sol A was mixed with 0.032 g γ-Fe2O3 nanoparticles and the mixture was sonicated for 1 h. After this, 0.02 g of the obtained rGO powder was mixed with Sol A, which consisted of TiO2, SiO2, and γ-Fe2O3 nanoparticles, and the final sol was vigorously stirred for 2 h (γ-Fe2O3 and rGO amounts were optimized, see Figure S6). The sol was dried at 80 °C and then the obtained powder was calcinated for 2 h at different temperatures (Table 5). The synthesized sample was named as the TSFG photocatalyst.

4. Characterization

The morphologies of the prepared samples (TiO2, TS, and TSFG) were evaluated by field emission scanning electron microscopy (FE-SEM, TESCANMIRA ΙΙ, Brno-Kohoutovice, Czech Republic). For sample preparation, the synthesized nanoparticles were dispersed in ethanol and then a drop of the mixed solution was withdrawn and dried on an aluminum plate. X-ray diffraction (XRD) was used to investigate the crystalline structures present in the photocatalyst samples, and then the diffraction patterns were recorded on a Philips PW1830 powder diffractometer (Amsterdam, Netherlands) operating at a 40 kV voltage and a 40 mA filament current. Spectra were acquired at a scanning rate of 2.5° per min with Cu Kα1 radiation in the 2θ range of 20–60°. According to the Debye–Scherrer equation, the TiO2 crystal sizes of the samples were obtained, with reference to the strongest diffraction of the anatase (110) plane. The weight fraction of anatase with respect to the whole amount of the TiO2 crystalline phases (anatase, rutile) was calculated according to Equation (1) [62], where IR is the intensity of the strongest rutile reflection, (110), and IA is the intensity of the strongest anatase reflection, (101).
f A = f A = 1 1 + 1.26   I R I A   %
Raman spectra were measured with a LABRAM HR800 (Kyoto, Japan) equipped with a Peltier cooled CCD detector. The λ = 514 nm excitation was done by an argon ion laser (Stabilite 2017, Spectra Physics (Santa Clara, CA, USA)). The laser’s radiation was filtered by an interference filter and focused on the sample by an Olympus BX41 microscope (Tokyo, Japan). A 50X Olympus objective with a 0.7 numerical aperture was utilized. The Rayleigh radiation was rejected using Notch filters for the λ = 514 nm laser line.
Optical properties were investigated by UV-Vis-NIR diffused reflectance spectra, recorded in the 220–2600 nm range with a Shimadzu UV3600 Plus spectrophotometer that was equipped with an ISR-603 integrating sphere (Kyoto, Japan), and BaSO4 was used as the reference material. The band gap was calculated based on the reflectance of the UV-Vis spectra after Kubelka–Munk conversion using the Tauc plot method [63]. The fourier transform infrared spectroscopy (FTIR) spectra of the prepared samples were recorded on a Bruker Tensor 27 spectrometer (Billerica, MA, USA) using a KBr pellet for sample preparation at room temperature. PL measurements were performed using CARY ECLIPSE (Santa Clara, CA, USA).
The surface area was measured using nitrogen adsorption–desorption at 77 K on Micromeritics ASAP 2020 equipment (Norcross, GA, USA), and the samples’ BET specific surface areas (SBET) were estimated. The magnetization of the prepared samples was investigated with a VSM (Lake Shore Model 7400, Westerville, United States) operating at room temperature.
The photocatalytic activity of the nanoparticles prepared here was characterized in methylene blue (MB) degradation under UV and visible irradiation. In a typical experiment, the MB solution was prepared by adding dye to deionized water (10−5 M) and then the synthesized photocatalysts (0.01 g) were added to the MB solution (40 mL). Prior to photodegradation under UV and visible light, the mixture was stirred for 50 min in dark conditions to reach adsorption–desorption equilibrium. After this, UV LED (500 mA, 3.8 V) and visible LED (700 mA, 3 V) were directed onto the solution. The distance between the light source and dye/catalyst solution was kept at 3 cm. The variation in the MB absorbance at given time intervals of illumination was monitored by spectrophotometry (UV-Vis spectrophotometer, Thermoscientific Spectronic 200E) at a wavelength of 668 nm, at which MB has its maximum absorbance. In separate controlled experiments, the MB solution was illuminated with UV and visible light in the absence of the prepared catalysts (photolysis experiments); this enabled the investigation of the true photocatalytic nature of the synthesized nanocomposites by discarding the component of simple photolysis. MB absorbance was then correlated with its concentration through the Beer Lambert law, with a linear proportionality between the two. Eventually, the photodegradation of MB was calculated as a function of the relative MB concentration versus the time of the reaction, C/Co, where Co is the initial concentration of MB solution and C is the concentration at sampling time. A pseudo-first-order kinetics was hypothesized to control the rate of MB photodegradation, as observed in related scientific literature [36,64], so the slope of the curve of ln(C/Co) versus the time of the reaction was taken as the MB photodegradation rate constant k.
Mott–Schottky measurements were performed via an Autolab potentiostat/galvanostat apparatus in a three-electrode cell. Pt wire as the counter electrode, Ag/AgCl (saturated KCl) as the reference electrode, and 0.5 M Na2SO4 solution as the electrolyte were employed. The Mott–Schottky measurements were recorded at an open-circuit voltage in a frequency ranging from 0.1 Hz to 100 kHz, with an AC amplitude of 5 mV. To fabricate the working electrode, 30 mg of the synthesized photocatalyst powder and 1 mL ethanol solution were sonicated. The obtained mixture was sprayed on a 1 × 1 cm2 area of FTO (fluorine-doped tin oxide) glass and allowed to dry at 400 °C for 1 h in a furnace. These electrochemical tests were carried out at room temperature (25 °C).
To more deeply investigate the dominating reactive species of TSFG for MB photodegradation, a radical scavenging test was carried out. The photocatalytic degradation of MB was repeated in the presence of the prepared photocatalyst and with the addition of tert-butyl alcohol (t-BuOH) as the •OH scavenger, KI as the hole scavenger, and benzoquinone (BZQ) as the O2•− scavenger.

5. Conclusions

A TiO2/SiO2/ γ-Fe2O3/rGO composite was synthesized from an inexpensive sol-gel method. The investigations revealed that the addition of SiO2 improves the morphology, crystalline structure, and surface hydroxylation of TiO2 nanoparticles. A suitable amount of γ-Fe2O3 in the prepared composite can decrease the recombination rate of the e/h+ pairs and largely improve the photocatalytic activity under visible light, and its magnetic properties allow for the simple recovery of the photocatalyst nanoparticles from the effluent to be treated. The rGO sheets, as excellent electron acceptors and transporters, can also reduce recombination; moreover, in the synthesis phase, their large surface area serves as a nucleation surface for nanoparticles and improves their dispersion. On the basis of this study, the prepared TiO2/SiO2/γ-Fe2O3/rGO composite can serve as an efficient and magnetically reusable photocatalyst for the photocatalytic purification of effluents under UV and visible light illumination.

Supplementary Materials

The following are available online, Table S1: ɤ-Fe2O3 and rGO loading for different samples, Figure S1: XRD pattern of synthesized rGO, Figure S2: Weight loss curve profiles determined by TGA and DSC for TSFG, Figure S3: Photoactivity under UV illumination of TiO2/SiO2 before and after heat treatment at 450 °C to 750 °C for 120 min in a furnace, Figure S4: The photocatalytic activity for degradation of Methylene blue under UV illumination for different loadings of TSF and TSFG systems, Figure S5: Photoactivity under Visible illumination of TiO2/SiO2 before and after heat treatment at 450 °C to 750 °C for 120 min in a furnace, Figure S6: The photocatalytic activity for degradation of Methylene blue under Visible illumination for different loadings of TSF and TSFG systems.

Author Contributions

Methodology, investigation and writing, R.K.; investigation and writing, M.M.; supervision and resources, M.B.; investigation, A.L.; project administration, validation, and writing review/editing, M.V.D.; supervision and resources, M.P. All authors have read and agreed to the published version of the manuscript.

Funding

This work was supported by MIUR, PRIN 2015WBEP3H “Monitoraggio, Consolidamento, Conservazione e Protezione di Beni Culturali”.

Conflicts of Interest

The authors declare no conflict of interest.

References

  1. Mao, L.; Li, Q.; Dang, H.; Zhang, Z. Synthesis of nanocrystalline TiO2 with high photoactivity and large specific surface area by sol–gel method. Mater. Res. Bull. 2005, 40, 201–208. [Google Scholar] [CrossRef]
  2. Fujishima, A.; Rao, T.N.; Tryk, D.A. Titanium dioxide photocatalysis. J. Photochem. Photobiol. C Photochem. Rev. 2000, 1, 1–21. [Google Scholar] [CrossRef]
  3. Diamanti, M.V.; Gadelrab, K.R.; Pedeferri, M.P.; Stefancich, M.; Pehkonen, S.O.; Chiesa, M. Nanoscale investigation of photoinduced hydrophilicity variations in anatase and rutile nanopowders. Langmuir 2013, 29, 14512–14518. [Google Scholar] [CrossRef] [PubMed]
  4. Lee, K.; Yoon, H.; Ahn, C.; Park, J.; Jeon, S. Strategies to improve the photocatalytic activity of TiO2: 3D nanostructuring and heterostructuring with graphitic carbon nanomaterials. Nanoscale 2019, 11, 7025–7040. [Google Scholar] [CrossRef] [PubMed]
  5. Wu, X.P. A Review—The Properties and Applications of Nano-Structured Titanium Oxide Materials. Key Eng. Mater. 2017, 727, 314–321. [Google Scholar] [CrossRef]
  6. Qian, R.; Zong, H.; Schneider, J.; Zhou, G.; Zhao, T.; Li, Y.; Yang, J.; Bahnemann, D.W.; Pan, J. Charge carrier trapping, recombination and transfer during TiO2 photocatalysis: An overview. Catal. Today 2019, 335, 78–90. [Google Scholar] [CrossRef]
  7. Hashimoto, K.; Irie, H.; Fujishima, A. TiO2 Photocatalysis: A Historical Overview and Future Prospects. Jpn. J. Appl. Phys. 2005, 44, 8269–8285. [Google Scholar] [CrossRef]
  8. Ansari, S.A.; Khan, M.M.; Ansari, M.O.; Cho, M.H. Nitrogen-doped titanium dioxide (N-doped TiO2) for visible light photocatalysis. New J. Chem. 2016, 40, 3000–3009. [Google Scholar] [CrossRef]
  9. Humayun, M.; Raziq, F.; Khan, A.; Luo, W. Modification strategies of TiO2 for potential applications in photocatalysis: A critical review. Green Chem. Lett. Rev. 2018, 11, 86–102. [Google Scholar] [CrossRef] [Green Version]
  10. Park, H.; Park, Y.; Kim, W.; Choi, W. Surface modification of TiO2 photocatalyst for environmental applications. J. Photochem. Photobiol. C Photochem. Rev. 2013, 15, 1–20. [Google Scholar] [CrossRef]
  11. Dozzi, M.V.; Chiarello, G.L.; Selli, E. Effects of surface modification and doping on the photocatalytic activity of TiO2. J. Adv. Oxid. Technol. 2010, 13. [Google Scholar] [CrossRef]
  12. Li, X.; Xia, T.; Xu, C.; Murowchick, J.; Chen, X. Synthesis and photoactivity of nanostructured CdS–TiO2 composite catalysts. Catal. Today 2014, 225, 64–73. [Google Scholar] [CrossRef]
  13. Ji, L.; Liu, B.; Qian, Y.; Yang, Q.; Gao, P. Enhanced visible-light-induced photocatalytic disinfection of Escherichia coli by ternary Bi2WO6/TiO2/reduced graphene oxide composite materials: Insight into the underlying mechanism. Adv. Powder Technol. 2020, 31, 128–138. [Google Scholar] [CrossRef]
  14. Rawal, S.B.; Bera, S.; Lee, D.; Jang, D.-J. Design of visible-light photocatalysts by coupling of narrow bandgap semiconductors and TiO2: Effect of their relative energy band positions on the photocatalytic efficiency. Catal. Sci. Technol. 2013, 3, 1822. [Google Scholar] [CrossRef]
  15. Nilchi, A.; Janitabar-Darzi, S.; Rasouli-Garmarodi, S. Sol-Gel Preparation of Nanoscale TiO2/SiO2 Composite for Eliminating of Con Red Azo Dye. Mater. Sci. Appl. 2011, 2, 476–480. [Google Scholar] [CrossRef] [Green Version]
  16. Abbas, N.; Shao, G.N.; Imran, S.M.; Haider, M.S.; Kim, H.T. Inexpensive synthesis of a high-performance Fe3O4-SiO2-TiO2 photocatalyst: Magnetic recovery and reuse. Front. Chem. Sci. Eng. 2016, 10, 405–416. [Google Scholar] [CrossRef]
  17. Li, W.; Feng, C.; Yue, J.; Hua, F.; Bu, Y. Photocatalytic performance of hierarchical TiO2/Ag3PO4 composite under visible-light illumination. Chem. J. Chin. Univ. 2015, 36, 1194–1201. [Google Scholar] [CrossRef]
  18. Deng, L.; Liu, H.; Gao, X.; Su, X.; Zhu, Z. SnS2/TiO2 nanocomposites with enhanced visible light-driven photoreduction of aqueous Cr(VI). Ceram. Int. 2016, 42, 3808–3815. [Google Scholar] [CrossRef]
  19. Shi, J.-W.; Yan, X.; Cui, H.-J.; Zong, X.; Fu, M.-L.; Chen, S.; Wang, L. Low-temperature synthesis of CdS/TiO2 composite photocatalysts: Influence of synthetic procedure on photocatalytic activity under visible light. J. Mol. Catal. A Chem. 2012, 356, 53–60. [Google Scholar] [CrossRef]
  20. Wang, R.; Wang, X.; Xi, X.; Hu, R.; Jiang, G. Preparation and Photocatalytic Activity of Magnetic Fe3O4/SiO2/TiO2Composites. Adv. Mater. Sci. Eng. 2012, 2012, 1–8. [Google Scholar] [CrossRef] [Green Version]
  21. Guanghong, Z.; HongYan, D.; Yufu, Z.; Yuebin, L.; Peng, L. High Visible-light Photocatalytic Activity of γ-Fe2O3/TiO2 Nanotube Heterojunction Arrays. Rare Met. Mater. Eng. 2016, 45, 1117–1121. [Google Scholar] [CrossRef]
  22. Banisharif, A.; Khodadadi, A.A.; Mortazavi, Y.; Firooz, A.A.; Beheshtian, J.; Agah, S.; Menbari, S. Highly active Fe2O3-doped TiO2 photocatalyst for degradation of trichloroethylene in air under UV and visible light irradiation: Experimental and computational studies. Appl. Catal. B Environ. 2015, 165, 209–221. [Google Scholar] [CrossRef]
  23. Nasirian, M.; Lecompte, C.F.B.; Mehrvar, M. Photocatalytic efficiency of Fe2O3/TiO2 for the degradation of typical dyes in textile industries: Effects of calcination temperature and UV-assisted thermal synthesis. J. Environ. Manag. 2017, 196, 487–498. [Google Scholar] [CrossRef] [PubMed]
  24. Nguyen, P.T.; Salim, C.; Kurniawan, W.; Hinode, H. A non-hydrolytic sol–gel synthesis of reduced graphene oxide/TiO2 microsphere photocatalysts. Catal. Today 2014, 230, 166–173. [Google Scholar] [CrossRef]
  25. Zhang, H.; Qin, X.; Wang, M. Preparation and photocatalytic performance of RGO/TiO2 nano-composite material. 2016, 10, 167–174. [Google Scholar]
  26. Fang, D.; Li, X.; Liu, H.; Xu, W.; Jiang, M.; Li, W.; Fan, X. BiVO4-rGO with a novel structure on steel fabric used as high-performance photocatalysts. Sci. Rep. 2017, 7, 7979. [Google Scholar] [CrossRef]
  27. Phanichphant, S.; Nakaruk, A.; Chansaenpak, K.; Channei, D. Evaluating the photocatalytic efficiency of the BiVO4/rGO photocatalyst. Sci. Rep. 2019, 9, 16091–16099. [Google Scholar] [CrossRef]
  28. Isari, A.A.; Payan, A.; Fattahi, M.; Jorfi, S.; Kakavandi, B. Photocatalytic degradation of rhodamine B and real textile wastewater using Fe-doped TiO2 anchored on reduced graphene oxide (Fe-TiO2/rGO): Characterization and feasibility, mechanism and pathway studies. Appl. Surf. Sci. 2018, 462, 549–564. [Google Scholar] [CrossRef]
  29. Cui, H.; Ren, W. Low temperature and size controlled synthesis of monodispersed γ-Fe2O3 nanoparticles by an epoxide assisted sol–gel route. J. Sol-Gel Sci. Technol. 2008, 47, 81–84. [Google Scholar] [CrossRef]
  30. Shalaby, A.; Angelova, T.; Bachvarova-Nedelcheva, A.; Georgieva, N.; Iordanova, R.; Staneva, A.; Dimitriev, Y. Sol-gel synthesis of materials in the system SiO2/ZnO/TiO2/RGO and their antimicrobial efficiency against E. coli K12. C. R. Acad. Bulg. Sci. 2016, 69. [Google Scholar]
  31. Spurr, R.A.; Myers, H. Quantitative Analysis of Anatase-Rutile Mixtures with an X-Ray Diffractometer. Anal. Chem. 1957, 29, 760–762. [Google Scholar] [CrossRef]
  32. Murphy, A.B. Band-gap determination from diffuse reflectance measurements of semiconductor films, and application to photoelectrochemical water-splitting. Sol. Energy Mater. Sol. Cells 2007, 91, 1326–1337. [Google Scholar] [CrossRef]
  33. Gao, X.; Wachs, I.E. Titania–silica as catalysts: Molecular structural characteristics and physico-chemical properties. Catal. Today 1999, 51, 233–254. [Google Scholar] [CrossRef]
  34. Bagherzadeh, M.; Kaveh, R.; Ozkar, S.; Akbayrak, S. Preparation and characterization of a new CdS–NiFe2O4/reduced graphene oxide photocatalyst and its use for degradation of methylene blue under visible light irradiation. Res. Chem. Intermed. 2018, 44, 5953–5979. [Google Scholar] [CrossRef]
  35. Hung, W.-C.; Chen, Y.-C.; Chu, H.; Tseng, T.-K. Synthesis and characterization of TiO2 and Fe/TiO2 nanoparticles and their performance for photocatalytic degradation of 1,2-dichloroethane. Appl. Surf. Sci. 2008, 255, 2205–2213. [Google Scholar] [CrossRef]
  36. Ohno, T.; Sarukawa, K.; Tokieda, K.; Matsumura, M. Morphology of a TiO2 Photocatalyst (Degussa, P-25) Consisting of Anatase and Rutile Crystalline Phases. J. Catal. 2001, 203, 82–86. [Google Scholar] [CrossRef]
  37. Zhang, X.; Niu, Y.; Meng, X.; Li, Y.; Zhao, J. Structural evolution and characteristics of the phase transformations between α-Fe2O3, Fe3O4 and γ-Fe2O3 nanoparticles under reducing and oxidizing atmospheres. CrystEngComm 2013, 15, 8166. [Google Scholar] [CrossRef]
  38. Wang, C.; Zhang, X.; Shao, C.; Zhang, Y.; Yang, J.; Sun, P.; Liu, X.; Liu, H.; Liu, Y.; Xie, T.; et al. Rutile TiO2 nanowires on anatase TiO2 nanofibers: A branched heterostructured photocatalysts via interface-assisted fabrication approach. J. Colloid Interface Sci. 2011, 363, 157–164. [Google Scholar] [CrossRef]
  39. Yang, C.-H.; Ma, Z. Raman spectral analysis of TiO2 thin films doped with rare-earth samarium. Appl. Opt. 2012, 51, 5438–5441. [Google Scholar] [CrossRef]
  40. Li, G.; Lan, J. Chrysanthemum-like 3D hierarchical magnetic ?-Fe2O3 and Fe3O4 superstructures: Facile synthesis and application in adsorption of organic pollutants from water. RSC Adv. 2015, 5, 1705–1711. [Google Scholar] [CrossRef]
  41. Huang, C.-H.; Bai, H.; Liu, S.-L.; Huang, Y.-L.; Tseng, Y.-H. Synthesis of neutral SiO2/TiO2 hydrosol and its photocatalytic degradation of nitric oxide gas. Micro Nano Lett. 2011, 6, 646. [Google Scholar] [CrossRef]
  42. Pal, B.; Hata, T.; Goto, K.; Nogami, G. Photocatalytic degradation of o-cresol sensitized by iron–titania binary photocatalysts. J. Mol. Catal. A Chem. 2001, 169, 147–155. [Google Scholar] [CrossRef]
  43. Botelho, G.; Andrés, J.; Gracia, L.; Matos, L.S.; Longo, E. Photoluminescence and Photocatalytic Properties of Ag3 PO4 Microcrystals: An Experimental and Theoretical Investigation. ChemPlusChem 2015, 81, 202–212. [Google Scholar] [CrossRef] [PubMed]
  44. Bagherzadeh, M.; Kaveh, R. New Magnetically Recyclable Reduced Graphene Oxide rGO/MFe2 O4 (M = Ca, Mg)/Ag3 PO4 Nanocomposites With Remarkably Enhanced Visible-light Photocatalytic Activity and Stability. Photochem. Photobiol. 2018, 94, 1210–1224. [Google Scholar] [CrossRef]
  45. Ma, Y.; Wang, X.; Jia, Y.; Chen, X.; Han, H.; Li, C. Titanium Dioxide-Based Nanomaterials for Photocatalytic Fuel Generations. Chem. Rev. 2014, 114, 9987–10043. [Google Scholar] [CrossRef]
  46. Daghrir, R.; Drogui, P.; Robert, D. Modified TiO2For Environmental Photocatalytic Applications: A Review. Ind. Eng. Chem. Res. 2013, 52, 3581–3599. [Google Scholar] [CrossRef]
  47. Yuan, X.; Wang, H.; Wu, Y.; Zeng, G.; Chen, X.; Leng, L.; Wu, Z.; Li, H.; Hou, W. One-pot self-assembly and photoreduction synthesis of silver nanoparticle-decorated reduced graphene oxide/MIL-125(Ti) photocatalyst with improved visible light photocatalytic activity. Appl. Organomet. Chem. 2016, 30, 289–296. [Google Scholar] [CrossRef]
  48. Sansotera, M.; Kheyli, S.G.M.; Baggioli, A.; Bianchi, C.L.; Pedeferri, M.; Diamanti, M.V.; Navarrini, W. Absorption and photocatalytic degradation of VOCs by perfluorinated ionomeric coating with TiO2 nanopowders for air purification. Chem. Eng. J. 2019, 361, 885–896. [Google Scholar] [CrossRef] [Green Version]
  49. Cao, J.; Li, X.; Lin, H.; Chen, S.; Fu, X. In situ preparation of novel p–n junction photocatalyst BiOI/(BiO)2CO3 with enhanced visible light photocatalytic activity. J. Hazard. Mater. 2012, 239, 316–324. [Google Scholar] [CrossRef]
  50. Bagherzadeh, M.; Kaveh, R. A new SnS2-BiFeO3/reduced graphene oxide photocatalyst with superior photocatalytic capability under visible light irradiation. J. Photochem. Photobiol. A Chem. 2018, 359, 11–22. [Google Scholar] [CrossRef]
  51. Jang, I.; You, K.-E.; Kim, Y.C.; Oh, S.-G. Surfactant-assisted preparation of core-shell-type TiO2 –Fe2O3 composites and their photocatalytic activities under room light irradiation. Appl. Surf. Sci. 2014, 316, 187–193. [Google Scholar] [CrossRef]
  52. Abbasi, A.; Ghanbari, D.; Salavati-Niasari, M.; Hamadanian, M. Photo-degradation of methylene blue: Photocatalyst and magnetic investigation of Fe2O3–TiO2 nanoparticles and nanocomposites. J. Mater. Sci. Mater. Electron. 2016, 27, 4800–4809. [Google Scholar] [CrossRef]
  53. Wang, C.; Yin, L.; Zhang, L.; Kang, L.; Wang, X.; Gao, R. Magnetic (γ-Fe2O3@SiO2)n@TiO2 Functional Hybrid Nanoparticles with Actived Photocatalytic Ability. J. Phys. Chem. C 2009, 113, 4008–4011. [Google Scholar] [CrossRef]
  54. Zhao, D.; Sheng, G.; Chenab, C.; Wang, X. Enhanced photocatalytic degradation of methylene blue under visible irradiation on graphene@TiO2 dyade structure. Appl. Catal. B Environ. 2012, 111, 303–308. [Google Scholar] [CrossRef]
  55. Yang, Y.; Liu, E.; Dai, H.; Kang, L.; Wu, H.; Fan, J.; Hu, X.; Liu, H. Photocatalytic activity of Ag–TiO2-graphene ternary nanocomposites and application in hydrogen evolution by water splitting. Int. J. Hydrogen Energy 2014, 39, 7664–7671. [Google Scholar] [CrossRef]
  56. Min, Y.L.; Zhang, K.; Zhao, W.; Zheng, F.C.; Chen, Y.C.; Zhang, Y.G. Enhanced chemical interaction between TiO2 and graphene oxide for photocatalytic decolorization of methylene blue. Chem. Eng. J. 2012, 193, 203–210. [Google Scholar] [CrossRef]
  57. Madrakian, T.; Afkhami, A.; Haryani, R.; Ahmadi, M. Synthesis of γ-Fe2O3/TiO2 nanocomposite and its application in removal of dyes from water samples by adsorption and degradation processes. RSC Adv. 2014, 4, 44841–44847. [Google Scholar] [CrossRef]
  58. Fu, H.; Sun, S.; Yang, X.; Li, W.; An, X.; Zhang, H.; Dong, Y.; Jiang, X.; Yu, A. A facile coating method to construct uniform porous α-Fe2O3@TiO2 core-shell nanostructures with enhanced solar light photocatalytic activity. Powder Technol. 2018, 328, 389–396. [Google Scholar] [CrossRef]
  59. Abdel-Wahab, A.-M.; Al-Shirbini, A.-S.; Mohamed, O.; Nasr, O. Photocatalytic degradation of paracetamol over magnetic flower-like TiO2/Fe2O3 core-shell nanostructures. J. Photochem. Photobiol. A Chem. 2017, 347, 186–198. [Google Scholar] [CrossRef]
  60. Wang, F.; Yu, X.; Ge, M.; Wu, S. One-step synthesis of TiO2/γ-Fe2O3/GO nanocomposites for visible light-driven degradation of ciprofloxacin. Chem. Eng. J. 2020, 384, 123381. [Google Scholar] [CrossRef]
  61. Liu, S.; Huang, S.; Li, G.; Zhou, P.; Lv, H.; Wang, M.; Chen, Y.; Pan, J.; Liu, W. Magnetite CaF2 near-infrared photocatalysts fabricated with Ca-enriched ferrites derived from electroplating wastewater. Chem. Eng. J. 2020. [Google Scholar] [CrossRef]
  62. Huang, F.; Chen, L.; Wang, H.; Yan, Z. Analysis of the degradation mechanism of methylene blue by atmospheric pressure dielectric barrier discharge plasma. Chem. Eng. J. 2010, 162, 250–256. [Google Scholar] [CrossRef]
  63. Chithambararaj, A.; Sanjini, N.S.; Bose, A.C.; Velmathi, S. Flower-like hierarchical h-MoO3: New findings of efficient visible light driven nano photocatalyst for methylene blue degradation. Catal. Sci. Technol. 2013, 3, 1405. [Google Scholar] [CrossRef]
  64. Gnaser, H.; Savina, M.; Calaway, W.F.; Tripa, C.E.; Veryovkin, I.V.; Pellin, M.J. Photocatalytic degradation of methylene blue on nanocrystalline TiO2: Surface mass spectrometry of reaction intermediates. Int. J. Mass Spectrom. 2005, 245, 61–67. [Google Scholar] [CrossRef]
Sample Availability: Samples of the compounds TiO2, TS, TSF and TSFG are available from the authors.
Figure 1. SEM image of (a) TiO2, (b) TS, and (c) TSFG.
Molecules 25 02996 g001
Figure 2. XRD patterns of (a) TiO2, and (b) TiO2/SiO2, after heat treatment at 450 °C to 750 °C for 120 min in a furnace.
Molecules 25 02996 g002
Figure 3. XRD pattern of TSFG after heat treatment at 650 °C.
Molecules 25 02996 g003
Figure 4. Raman spectra of (a) TiO2 and TSFG; (b) GO samples in the wave number range from 100 to 1800 cm−1.
Molecules 25 02996 g004
Figure 5. FTIR spectra of TiO2, TS, γ-Fe2O3, and TSFG samples for wave numbers ranging from 300 to 4000 cm−1.
Molecules 25 02996 g005
Figure 6. Left: the vibrating sample magnetometer curve of synthesized γ-Fe2O3 and TSFG samples. A photograph of the TSFG nanoparticles separated with a magnetic field is presented on the right.
Molecules 25 02996 g006
Figure 7. (a) Nitrogen adsorption–desorption isotherms; (b) BET surface areas and pore volumes for TiO2 and TSFG.
Molecules 25 02996 g007
Figure 8. Tauc plots of (αhν)0.5 versus hν were employed to estimate the band gaps of the TiO2, γ-Fe2O3, TS, TSF, and TSFG samples.
Molecules 25 02996 g008
Figure 9. PL spectra of TiO2 and TSFG samples.
Molecules 25 02996 g009
Figure 10. The photocatalytic activity for the degradation of methylene blue under (a) UV and (b) visible lights for TS, TSF, and TSFG systems.
Molecules 25 02996 g010
Figure 11. Mott–Schottky plots for TiO2 and γ-Fe2O3.
Molecules 25 02996 g011
Figure 12. Effects of the various radical scavengers on MB photodegradation.
Molecules 25 02996 g012
Figure 13. Recycle stability of the photocatalytic decomposition of MB under UV LED.
Molecules 25 02996 g013
Figure 14. Schematic illustration of the proposed reaction mechanism for the photocatalytic degradation process in the presence of the prepared photocatalyst.
Molecules 25 02996 g014
Figure 15. Possible degradation mechanism of MB.
Molecules 25 02996 g015
Table 1. Anatase percentage in crystalline TiO2 (calculated by Spurr equation) and anatase particle size (calculated by Scherrer equation) for TiO2 and TiO2/SiO2.
TemperatureAnatase (%)Anatase Particle Size (nm)
TiO2Non calcined--
450 °C10015
550 °C8321
650 °C5829
750 °C3032
TiO2-SiO2Non calcined--
450 °C10013
550 °C9421
650 °C6624
750 °C5226
Table 2. Photocatalytic degradation of MB over different composite photocatalysts, including Fe2O3 and graphene, in comparison to present case.
CompositeLight SourceDegradation Time/RateDegradation Rate @ 40 minDye ConcentrationPhotocatalyst Amount
Core-shell-type TiO2–Fe2O3 [46]Room light200 min/88%40%100 mL, 1 × 10⁻⁵ M5 mg
Fe2O3–TiO2 [47]UV light100 min/90%35%40 mL, 10 ppm4 mg
(γ-Fe2O3@SiO2)n@TiO2 [48]UV light80 min/80%70%150 mL, 25 mg/L10 mg
Graphene@TiO2 [49]UV light
Vis light
UV 200 min/88%
Vis 200 min/70%
UV 70%
Vis 35%
100 mL, 10 mg/L50 mg
Ag–TiO2-graphene [50]UV light120 min/45%25%50 mL, 5 mg/L-
TiO2/graphene oxide [51]UV light
Vis light
UV 160 min/95%
Vis 160 min/65%
UV 40%
Vis 35%
100 mL, 2 × 10 5 M30 mg
Present studyUV light
Vis light
-UV 84%
Vis 66%
40 mL, 1 × 10 −5 M1 mg
Table 3. The kinetic constants of photocatalytic MB degradation under UV and Vis lights.
UVVis
SampleK (min −1)R2K (min −1)R2
TiO2−0.0110.98−0.0010.98
TS−0.0320.99−0.0120.95
TSF−0.0460.99−0.0290.97
TSFG−0.0620.98−0.0340.96
Table 4. The kinetic constants of recycle stability of the photocatalytic decomposition of MB under UV LED.
Recycle NumberK (min −1)R2
1−0.0190.95
2−0.0190.97
3−0.0190.98
4−0.0190.99
Table 5. Calcination temperature and label of prepared TiO2 and TiO2/SiO2.
Calcination TemperaturesTiO2TiO2/SiO2
No calcinationT-non-CalTS-non-Cal
450 °CT-Cal 450TS-Cal 450
550 °CT-Cal 550TS-Cal 550
650 °CT-Cal 650TS-Cal 650
750 °CT-Cal 750TS-Cal 750

