Article

The Influence of Selected Properties of Particles in the Jigging Process of Aggregates on an Example of Chalcedonite

Department of Environmental Engineering, Faculty of Mining and Geoengineering, AGH University of Science and Technology, 30-059 Kraków, Poland
*
Author to whom correspondence should be addressed.
Minerals 2020, 10(7), 600; https://doi.org/10.3390/min10070600
Submission received: 8 June 2020 / Accepted: 29 June 2020 / Published: 30 June 2020
(This article belongs to the Section Mineral Processing and Extractive Metallurgy)

Abstract

:
The influence of the physical, geometric and chemical properties of particles on the results of aggregate separation by means of a laboratory ring jig is presented in this paper. The experiment was based on separation of chalcedonite particles in a narrow particle size fraction composed separately of regular and irregular particles, which was prepared in accordance with patent inventions. On its basis, the geometric properties—projection diameter and (volumetric and dynamic) shape coefficients—as well as physical properties—particle density—were determined in products of the regular and irregular particles. The terminal settling velocities of the regular and irregular particles were calculated for a randomly selected sample of particles in each obtained separation product. The statistical analysis of the geometric properties of the particles allowed to evaluate the influence of these parameters on aggregate processing with respect to selection of particles homogenous in terms of their shapes. The comparison of the particle shapes’ influence on the chalcedonite feed separation effects was made by the means of the values of the shape coefficients: the dynamic and volumetric ones. Additionally, tests were carried out using Raman spectroscopy in order to determine the mechanisms of density change in the aggregate. The research goal was realised through detecting and analysing the polymorphic forms of the silica and allogenic minerals precipitated on the surface and inside the chalcedonite particles.

1. Introduction

Beneficiation of raw materials is a process crucial to provide a product with the appropriate qualitative parameters (like a useful component grade or removal of pollutants) and adequate strength properties, as required by a customer. Ensuring such appropriate product parameters, apart from fulfilling customers’ expectations, is significant because of the influence on the natural environment and allows to rationally distribute materials for various branches of the economy in accordance with the rule of optimal use. In Poland, jigging is a process used particularly for coal fines processing, mainly for the power industry sector. In this range, various structural solutions of pulsating water jigs are used for hard coal processing. However, in recent years, a high demand for good quality aggregates caused the development of structural solutions for the jigs. They are mainly used to clean sand and gravel feeds by removing the organic and mineral pollutants that occur in their composition. Mainly, the water pulsation angle in a jig is different, which allows to differentiate the course of a pulsation cycle in a working bed, and depends on the interval loads and quality of the products separated from them [1].
As the papers of various authors showed, the results of the technological research on industrial jigs confirm their usefulness in separating the sand and gravel feed, with a particle size distribution of 16.0–2.0 mm into two products as well as organic and mineral pollutants from the extracted aggregates [2,3,4,5]. Furthermore, various sorts of pollutants from construction debris containing concrete, brick or gypsum also may be separated by means of jigging [6,7,8]. In this way, the recovery of the required aggregates for engineering construction can be done. Moreover, the application of density separation methods for aggregates can be more efficiently applied in the industry because of the differentiation of the chemical and physical properties of the separation products as well as their strength and impregnability [9,10,11].
On the basis of widely conducted investigations, it was stated that the appropriate selection of technical and technological process data, such as the pulsation parameters, the intensity of the hutch water flow as well as the properties of separated feed, the height of a layer in a working bed and the feed characteristics (load, sand grade and density of the pollutants), allows to increase the efficiency of pollutant separation from the aggregate [12,13]. In such a case, a very important factor affecting the efficiency of density separation is the settling velocity of the light particles (pollutants), which depends on both particle density and size. With a decrease in the difference between the settling velocity of the light particles and the gravel ones, the difficulty in material density separation in a jig increases and the range of technological parameters of the process, for which the process efficiency achieves the acceptable level, decreases [14]. That is why it is suggested that for jigging the feed should be prepared in narrow particle size fractions directed to the process. Only in the case when the material is homogenous in terms of particle size, which means the elimination of particles of the same or very similar values of settling velocity, the satisfying results of the process can be obtained [15,16].
In the case of gravitational processing that occurs in water jigs, the separation into products is done according to a strictly determined separation feature, which is, for example, the density of the material particles. Usually, jigging is described by means of particle density as a separation feature. However, both particle density and their size and shape affect the effects of separation in the jig. The parameter that combines the density, size and shape of the particles is the settling velocity. In practice, the settling velocity of a free particle also influences the level of particle liberation in a jig working bed. It can be said then that the settling velocity of free particles is a feature characterizing the feed irregularly in terms of its physical properties (particle density) and geometrical ones (size and shape) during the jigging process. It must be noted that the density of the raw rock material particles, particularly in the case of sedimentary rocks, may vary. These processes can proceed at every stage of rock formation; that is, during the accumulation, sedimentation and diagenesis process, and later in the catagenesis process, for example, as a result of the migration of aqueous solutions through them. Therefore, changes in density within the same rock can be included in the special processes that directly depend on the deposit chemistry [17].
The terminal settling velocity of particles in jigging processes characterizes the feed directed to the process in an unambiguous way. Taking the complex geometric properties of particles (size and shape) as well as physical ones (particle density) into consideration allows for the calculation of the terminal settling velocity of particles. So, this value is a complex separation feature containing three basic particle properties inside: the density, size and shape of the particles. To calculate the settling velocity, the relation derived on the basis of heuristic considerations can be used, given by Equation (1) [18]:
v = 5.33 x d p k 1 k 2
where x = ρ ρ 0 ρ 0 —the reduced particle density; ρ—the particle density; ρo—the liquid density; dp—the particle projection diameter; k1—the volumetric shape coefficient; and k2—the dynamic shape coefficient.
Before Formula (1)—for the calculation of the terminal settling velocity of the particles—was derived and applied, a comprehensive overview of the literature with regard to the selection of methodology to calculate settling velocity [18] was performed. In the majority of papers, the authors use empirical or semi-empirical connections of the Laszczenko number, with the Reynolds number and Archimedes number [19,20,21,22,23,24,25,26,27,28] to calculate the settling velocity. The application of these methods to calculate the free settling velocity for the whole range of Reynolds numbers in the function of geometric and physical properties of a particle is difficult due to the fact that the settling velocity is expressed by the Reynolds number whose value depends on the movement velocity of a particle. Additionally, the majority of papers concerns spherical particles. The particle drag coefficient ψz depends on both the Reynolds number Re and particle shape: ψz = f(Re, particle shape), which, among others, results in the dependence of settling velocity on the particle shape.
For the purposes of this paper, to calculate the drag coefficient for an irregular particle moving in a liquid, a model of a particle with the shape of a sphere with the so-called boundary layer conditioned by the existence of an internal liquid friction forces layer was used [29]. The drag coefficient of an irregular particle is the function of the sphere drag coefficient and dynamic shape coefficient of a particle related to the statistical dependence with the sphericity coefficient. The particle drag coefficient is related to the sphere drag coefficient in the Newtonian range of Reynolds numbers by the following dependence [30,31]:
ψp = k2 ψs
where ψp—the particle drag coefficient; k2—the dynamic or Newtonian shape coefficient of a particle; and ψs—the sphere drag coefficient.

2. Materials and Methods

The purpose of the experimental research was to investigate the possibility of mineral aggregate processing by means of jigging as well as to determine the settling velocity of the chalcedonite sample’s particles for the feed consisting of regular and irregular particles. The achievement of the assumed goal will allow to determine guidelines for regulations of some working parameters of a newly constructed prototype jig, at first at the laboratory scale and then on an industrial scale, used in the patented technological system PL 233318B1 [32,33].
The material used in the tests was chalcedonite, which is a unique rock because of its minor spreading. It originates from the only deposit of crystalline silica in Europe—Teofilów (Inowłódz mine) [34,35]. Because of its chemical properties, it is practically homogenous because the silica content in the rock is above 94%. Chalcedonite consists of mainly silicon dioxide (SiO2), which is one of the most important rock-forming minerals in the Earth’s crust and can occur in many polymorphic variations. These variations include quartz, tridymite and cristobalite, which occur in low-temperature and high-temperature forms. Allogenic minerals precipitated on the surface, in pores and microcracks of the chalcedonite, are mostly iron compounds. In nature, they most often occur as oxide minerals, such as magnetite and hematite; in hydroxides, such as goethite and lepidocrocite; and in the form of carbonate as siderite [36,37].
Preparation of chalcedonite aggregate was done in a technological circuit in accordance with the patent no. PL233689 [38]. From the material that was comminuted in a jaw crusher, the particle size fractions between 6.30 and 8.00 mm was separated on a vibratory screener and then it was directed to another screen with a slotted sieve (with rectangular longitudinal mesh 4 mm × 30 mm). As a result of the classification, the 6.30–8.00 mm fraction of the regular particles was obtained in the upper product and the 6.30–8.00 mm fraction of the irregular particles was obtained in the lower product. The evaluation of the particles’ shapes was done in accordance with the standard applicable in aggregates production PN-EN 933–3:2012 [39], which defines regular particles as those whose length does not exceed three times their width and thickness. It should be noted that the idea of this invention allows to practically obtain any kind of particle size fraction starting from 2.0 mm, separately with regard to regular and irregular particles.
To calculate the settling velocity of the particles in the particle size fraction 6.30–8.00 mm, separation of the chalcedonite particles was done in a laboratory ring jig. The cross section through the working bed of a jig with numbers of layers (products of separation) is presented schematically in Figure 1.
The feed of the regular and irregular particles of size 6.3–8.0 mm prepared in this way was a narrow particle size fraction, which allowed to minimize the influence of equally settling particles on the results of the separation. Jigging was conducted separately for regular and irregular particles. The prepared aggregate of the chalcedonite particles was jigged. As a result of the process, four products, the so-called layers of separation, were collected through the separation at the height of the appropriate rings. Each layer has a thickness of 40 mm. Figure 2 shows the samples separated into four products. The time of separation was equal to 5 min and the height of the pulsation water was 10 mm for each experiment.
The density of a single particle was determined on a randomly selected sample of regular and irregular particles from each separation product by the pycnometric method and the measurements of the projection diameter and shape coefficients were made. The measurements of all the geometrical and physical parameters were made for exactly the same particles randomly selected from the samples of each product of separation of the regular and irregular particles.
The characteristic extreme particles from the first and fourth jig product were selected for tests using Raman spectroscopy.

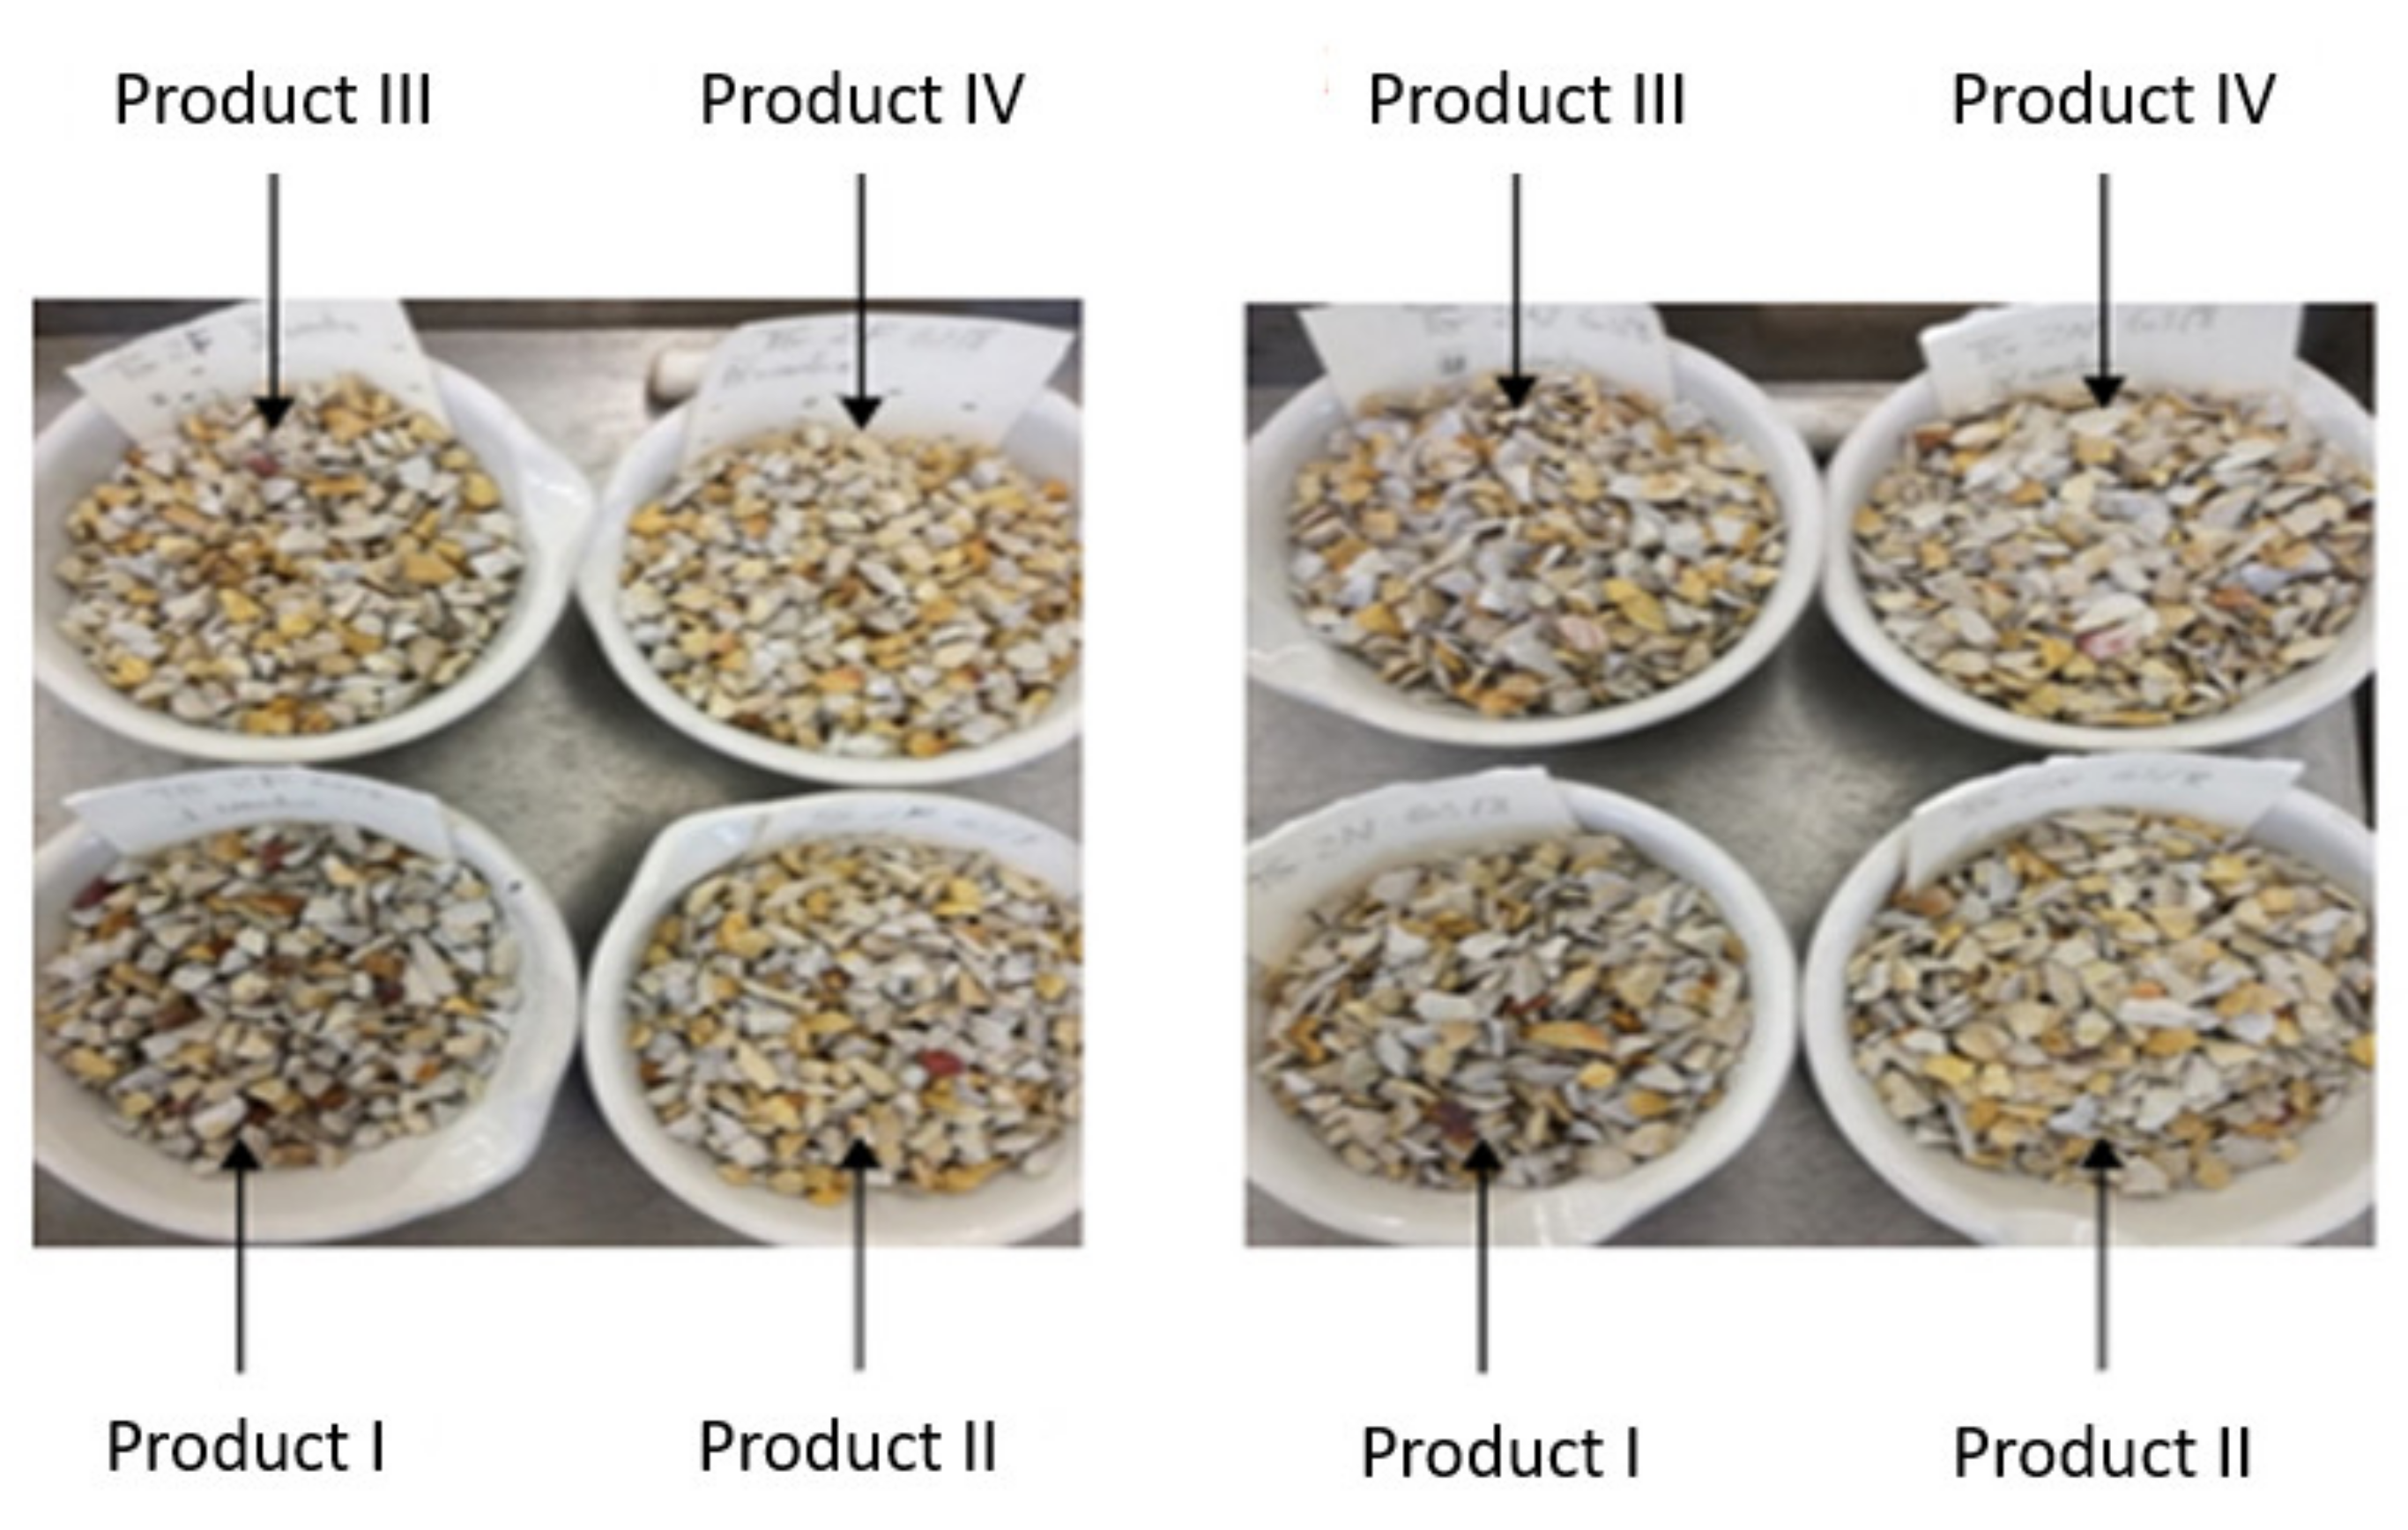
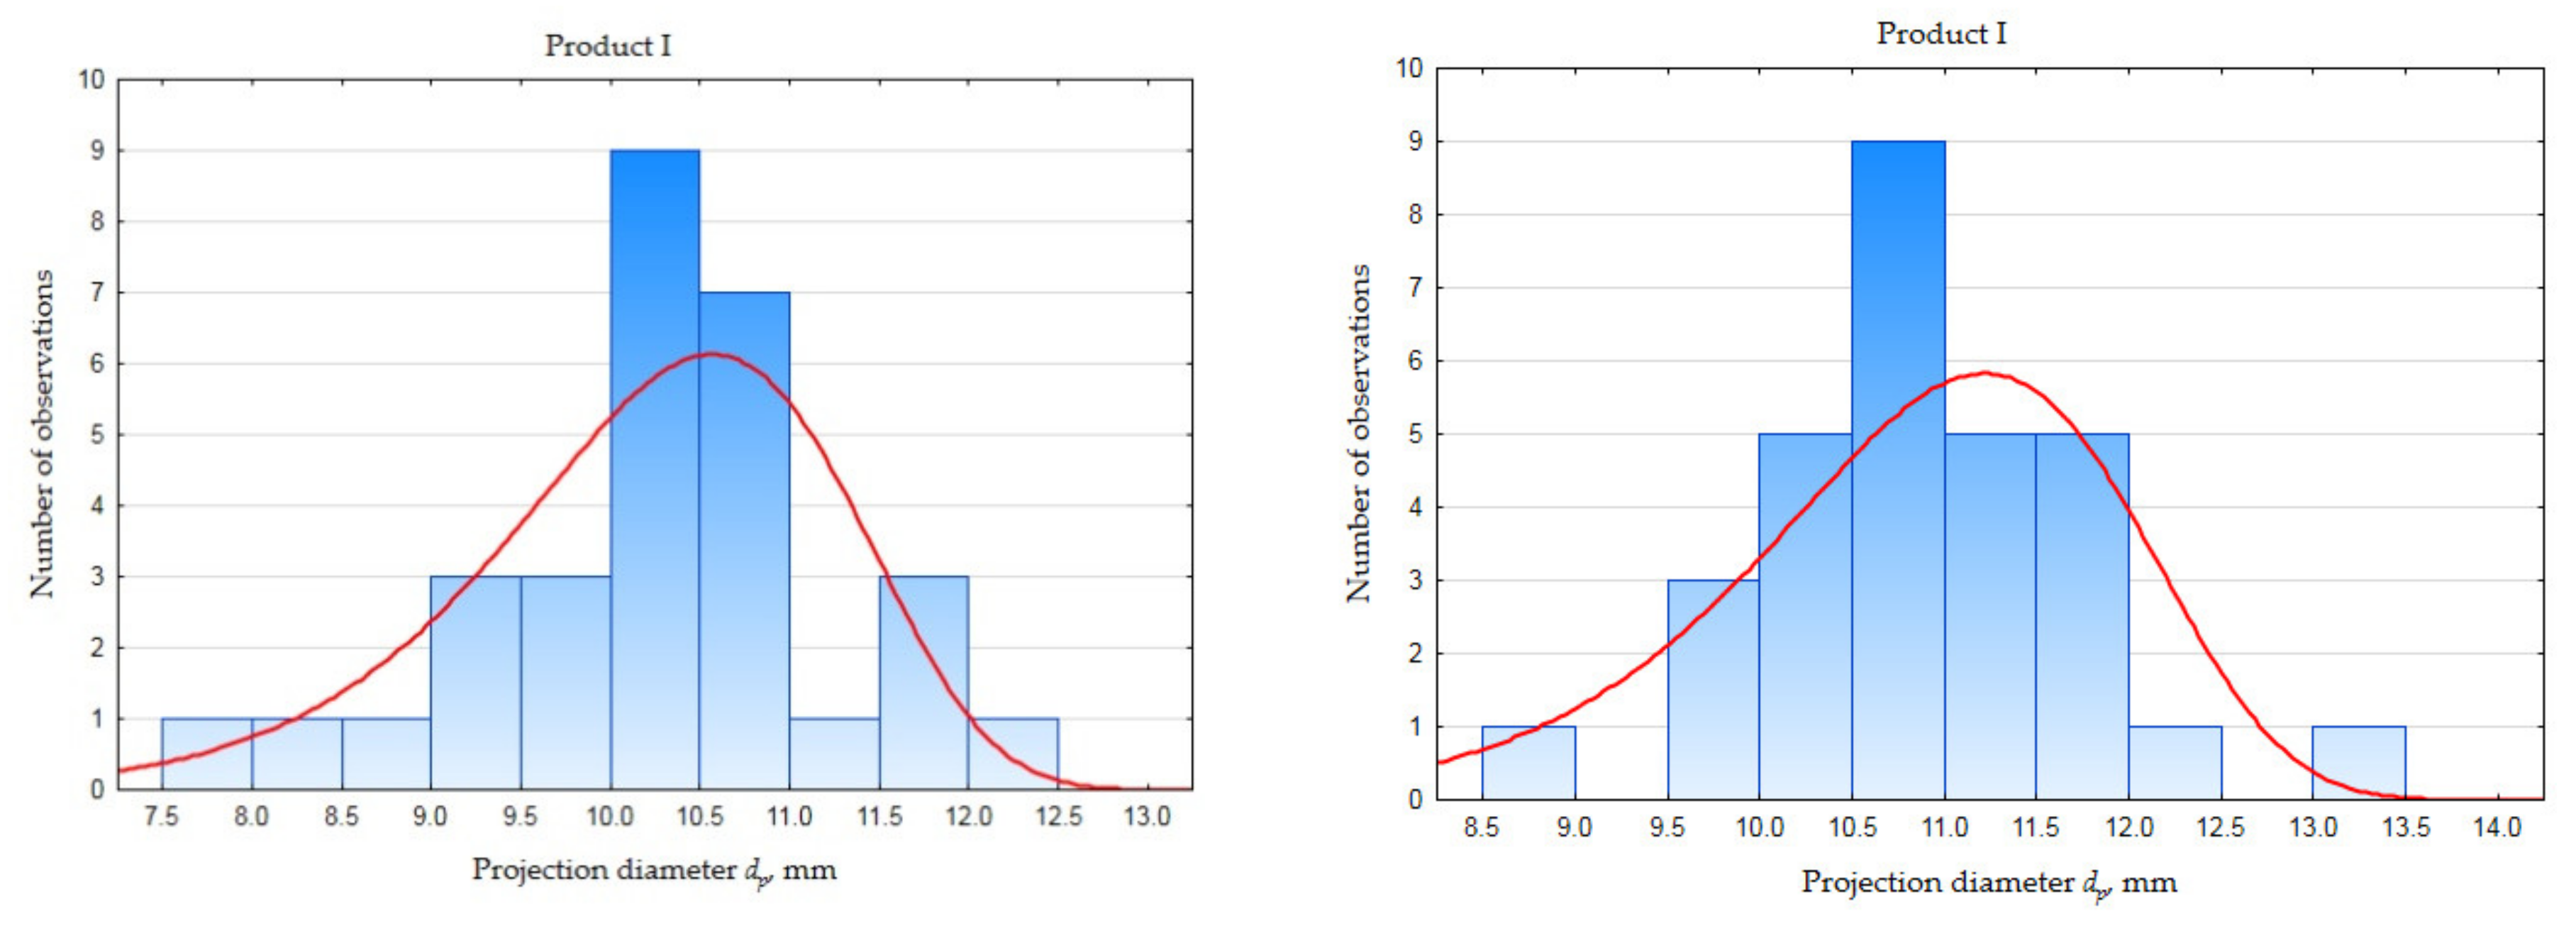
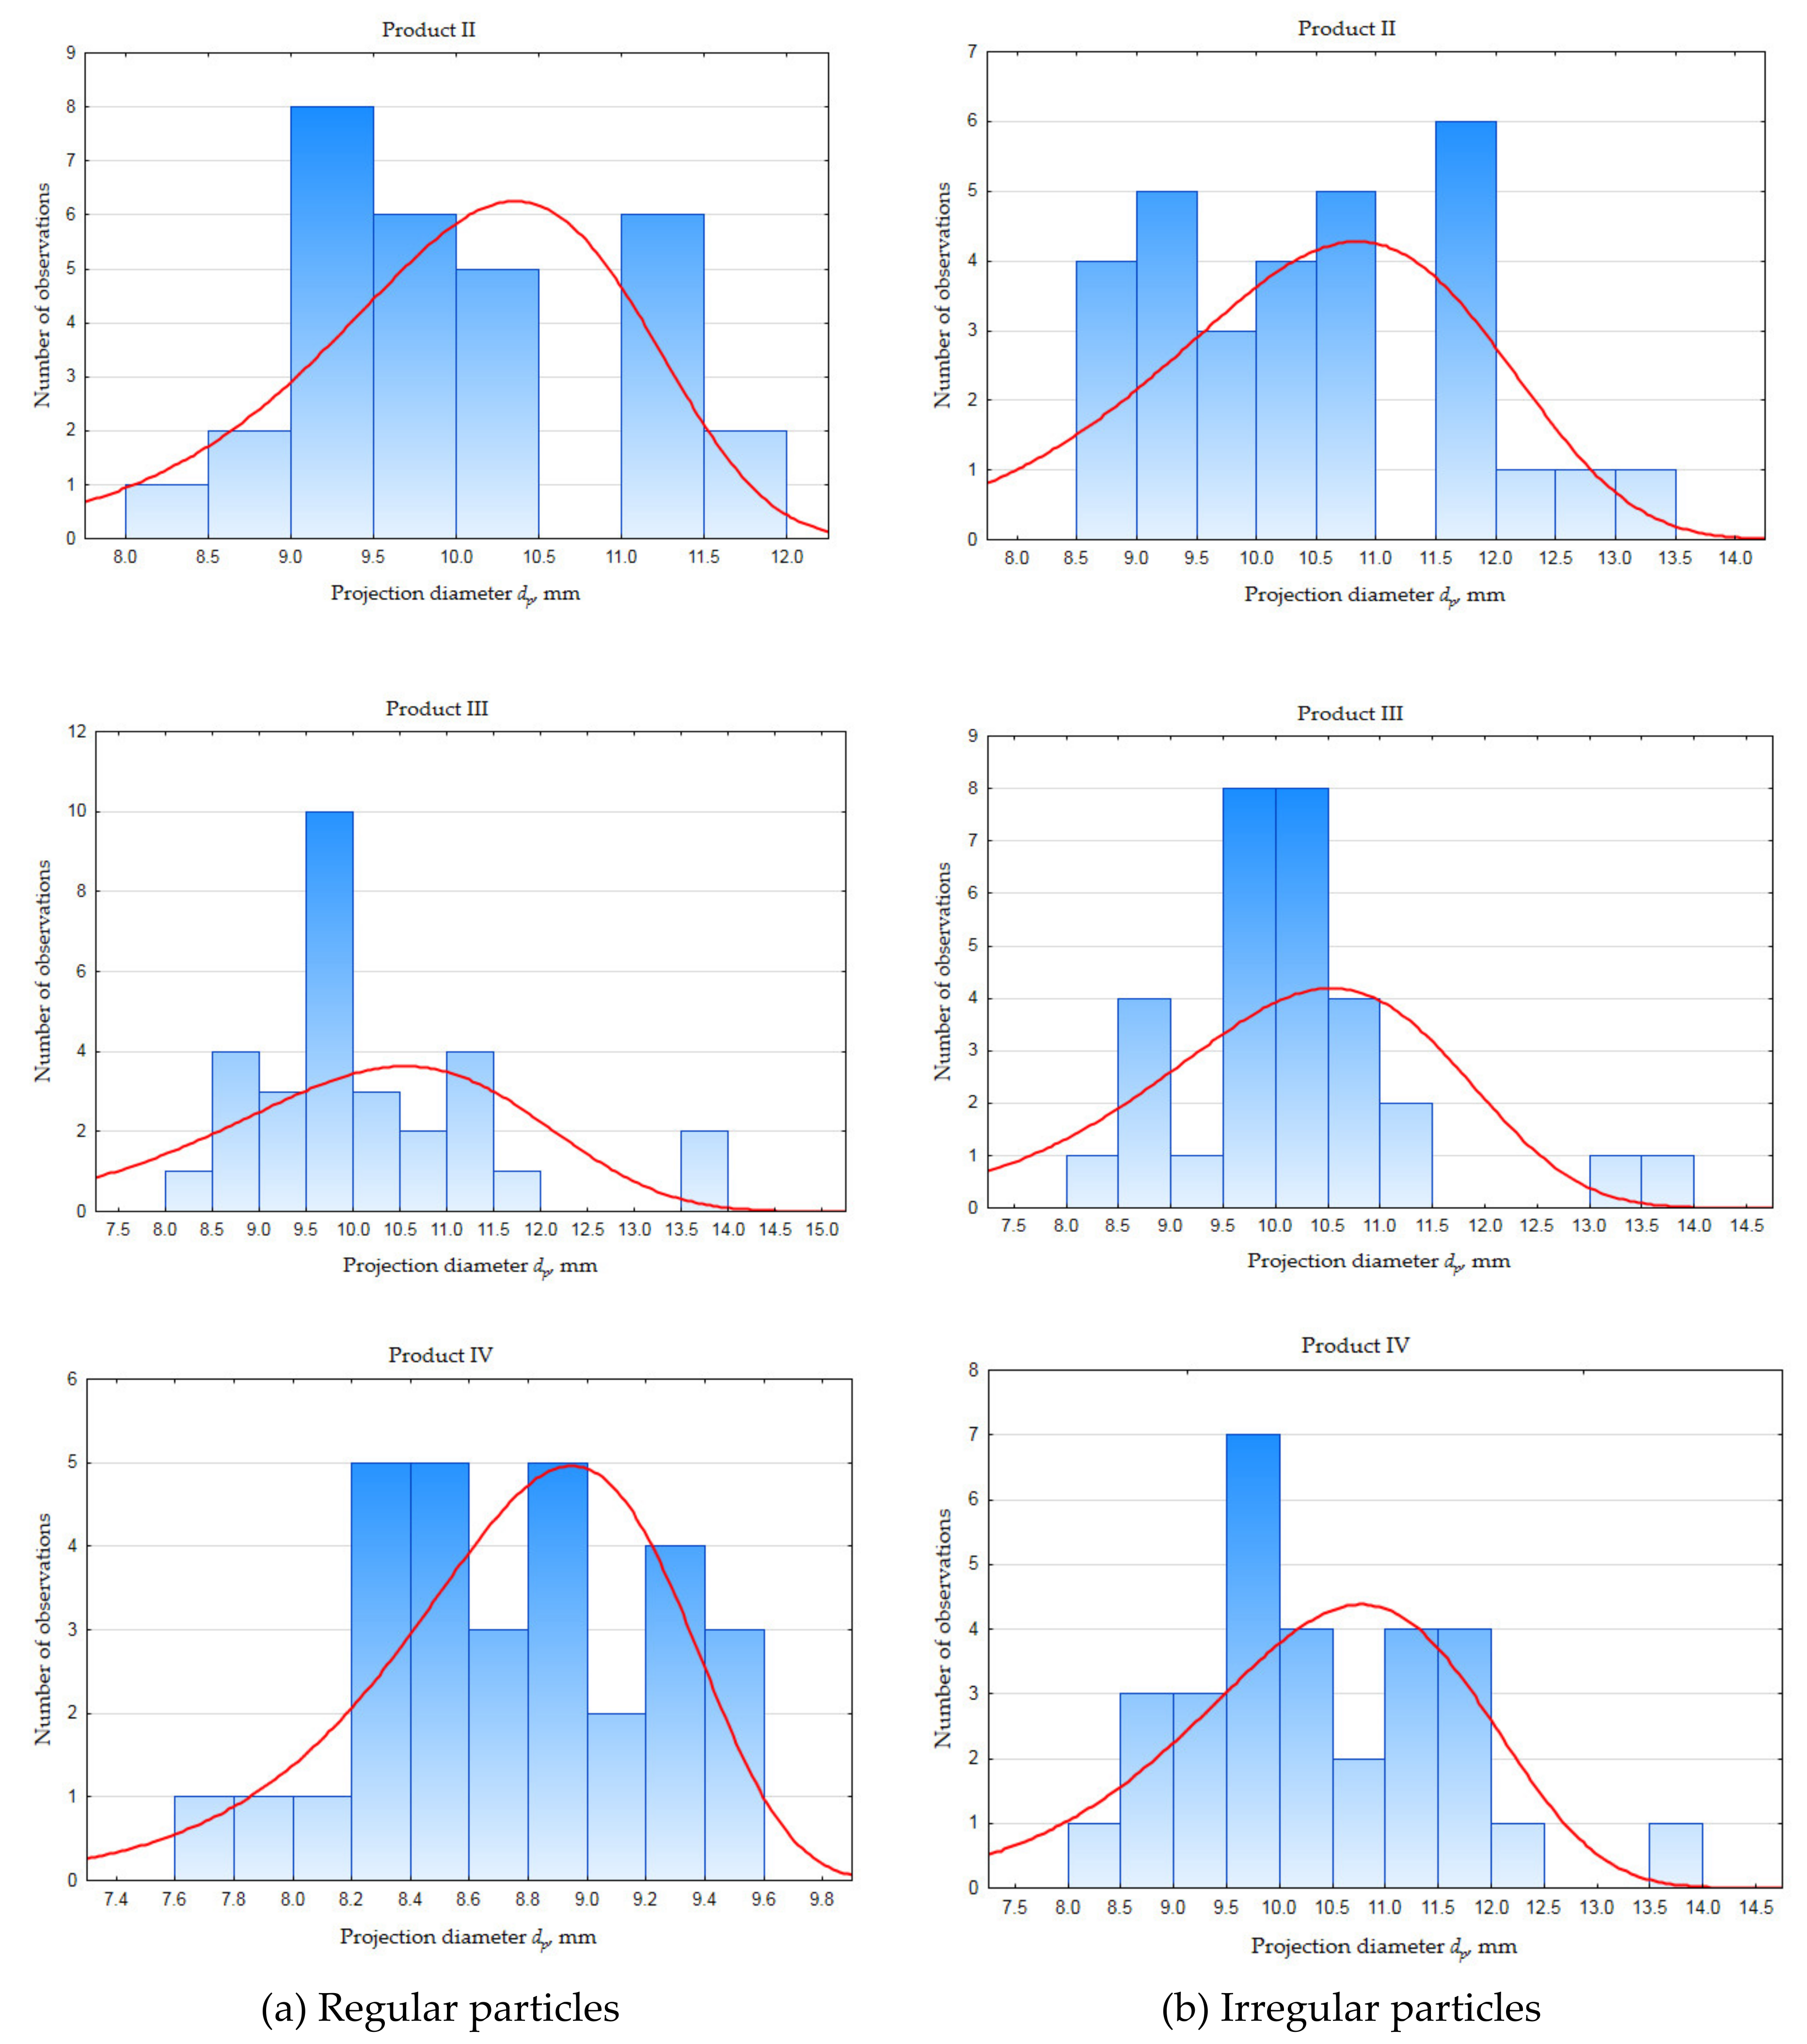
2.1. Investigations of the Projection Diameter and Shape Coefficients of Particles

In order to calculate the surface areas, the projection diameter and dynamic shape coefficient on the basis of a random sample of particles of each product, photos of the particles were taken by means of a digital camera in the most stable position. Using SigmaScanPro—the computer program for the image analysis—the values of the surface areas and perimeters of the individual particles were found. The projection diameters (dp) were calculated and the distribution of the projection diameters was determined by using the following equation:
d p = 4 S π
where dp is equal to the diameter of a circle of the surface equal to the particle projection S; and S is the particle surface area.
By using Equation (4), the sphericity coefficients ϕ were determined:
ϕ k c = C C z s
where Cz—the perimeter of the projection surface area of a particle; and C—the perimeter of a circle with the surface area being equal to the projection surface area of a particle.
The dynamic shape coefficient k2 was calculated from the following formula, provided by Ganser [31]:
k 2 = 10 1.8148 l o g ϕ 0.5743
Heiss and Coull [22] propose determining the particle volume through the volumetric shape coefficient k1H according to the formula:
V = k 1 H d p 3
In this paper, the volumetric shape coefficient k1 was found using the volumetric method based on the measurement of the density of the individual particles from each product by means of a pycnometer and calculating their volume. The shape coefficient k1 was calculated from the following equation:
V = k 1 π d p 3 6
where dp is given in Equation (2); and V is the volume of the particle.
Figure 3a,b present an example of determining the geometrical measures for regular and irregular particles by means of an image analysis computer program.

2.2. Chalcedonite Particles’ Chemistry Examination

Raman microspectroscopy is one of the most universal techniques used in examinations of crystalline and amorphous solids; that is, minerals, rocks, composite alloys, etc. It is a non-destructive method provided that the appropriate intensity of excitation radiation is used. This technique allows to determine the chemical composition, crystalline form, arrangement form and intermolecular interactions in the investigated material. A mineral is irradiated by the monochromatic laser radiation, due to the Raman phenomenon, and lines not occurring in the incident light appear in the diffused light spectrum, and their number and location depend on the internal structure of the particles of the diffusing substance stimulated to vibrate by the radiation field. Photons of the diffused light carry information on the energies of the oscillatory matter and the rotational transitions [40].
The Raman spectrum is a dependence between the radiation intensity and its frequency, and its measure is the so-called Raman shift. It is determined by differences in the reversal of an incident wave and the length of a dispersed wave and is measured in cm−1. In other words, the Raman spectrum is the oscillatory and rotational spectrum carrying information on the structure of the investigated substance. Every material possesses a unique spectrum allowing for its identification and characterisation.
Tests were carried out using an achromatic reflective Raman spectrometer LabRAM HR UV-Vis-NIR (200–1600 nm). The possibility to observe samples is ensured due to the use of a confocal optical microscope Olympus BX-41. Stimulation was provided by a laser at 532 nm.
Comparing the macroscopic images from the confocal microscope presenting the chalcedonite particles from the first and fourth jig layer, it can be stated, according to expectations, that they are not homogeneous (Figure 4). The surface of a particle from the first layer comprises foci of iron compounds, while the surface of a particle from the fourth layer remains white, which suggests that it is pure silica.

3. Results and Discussion

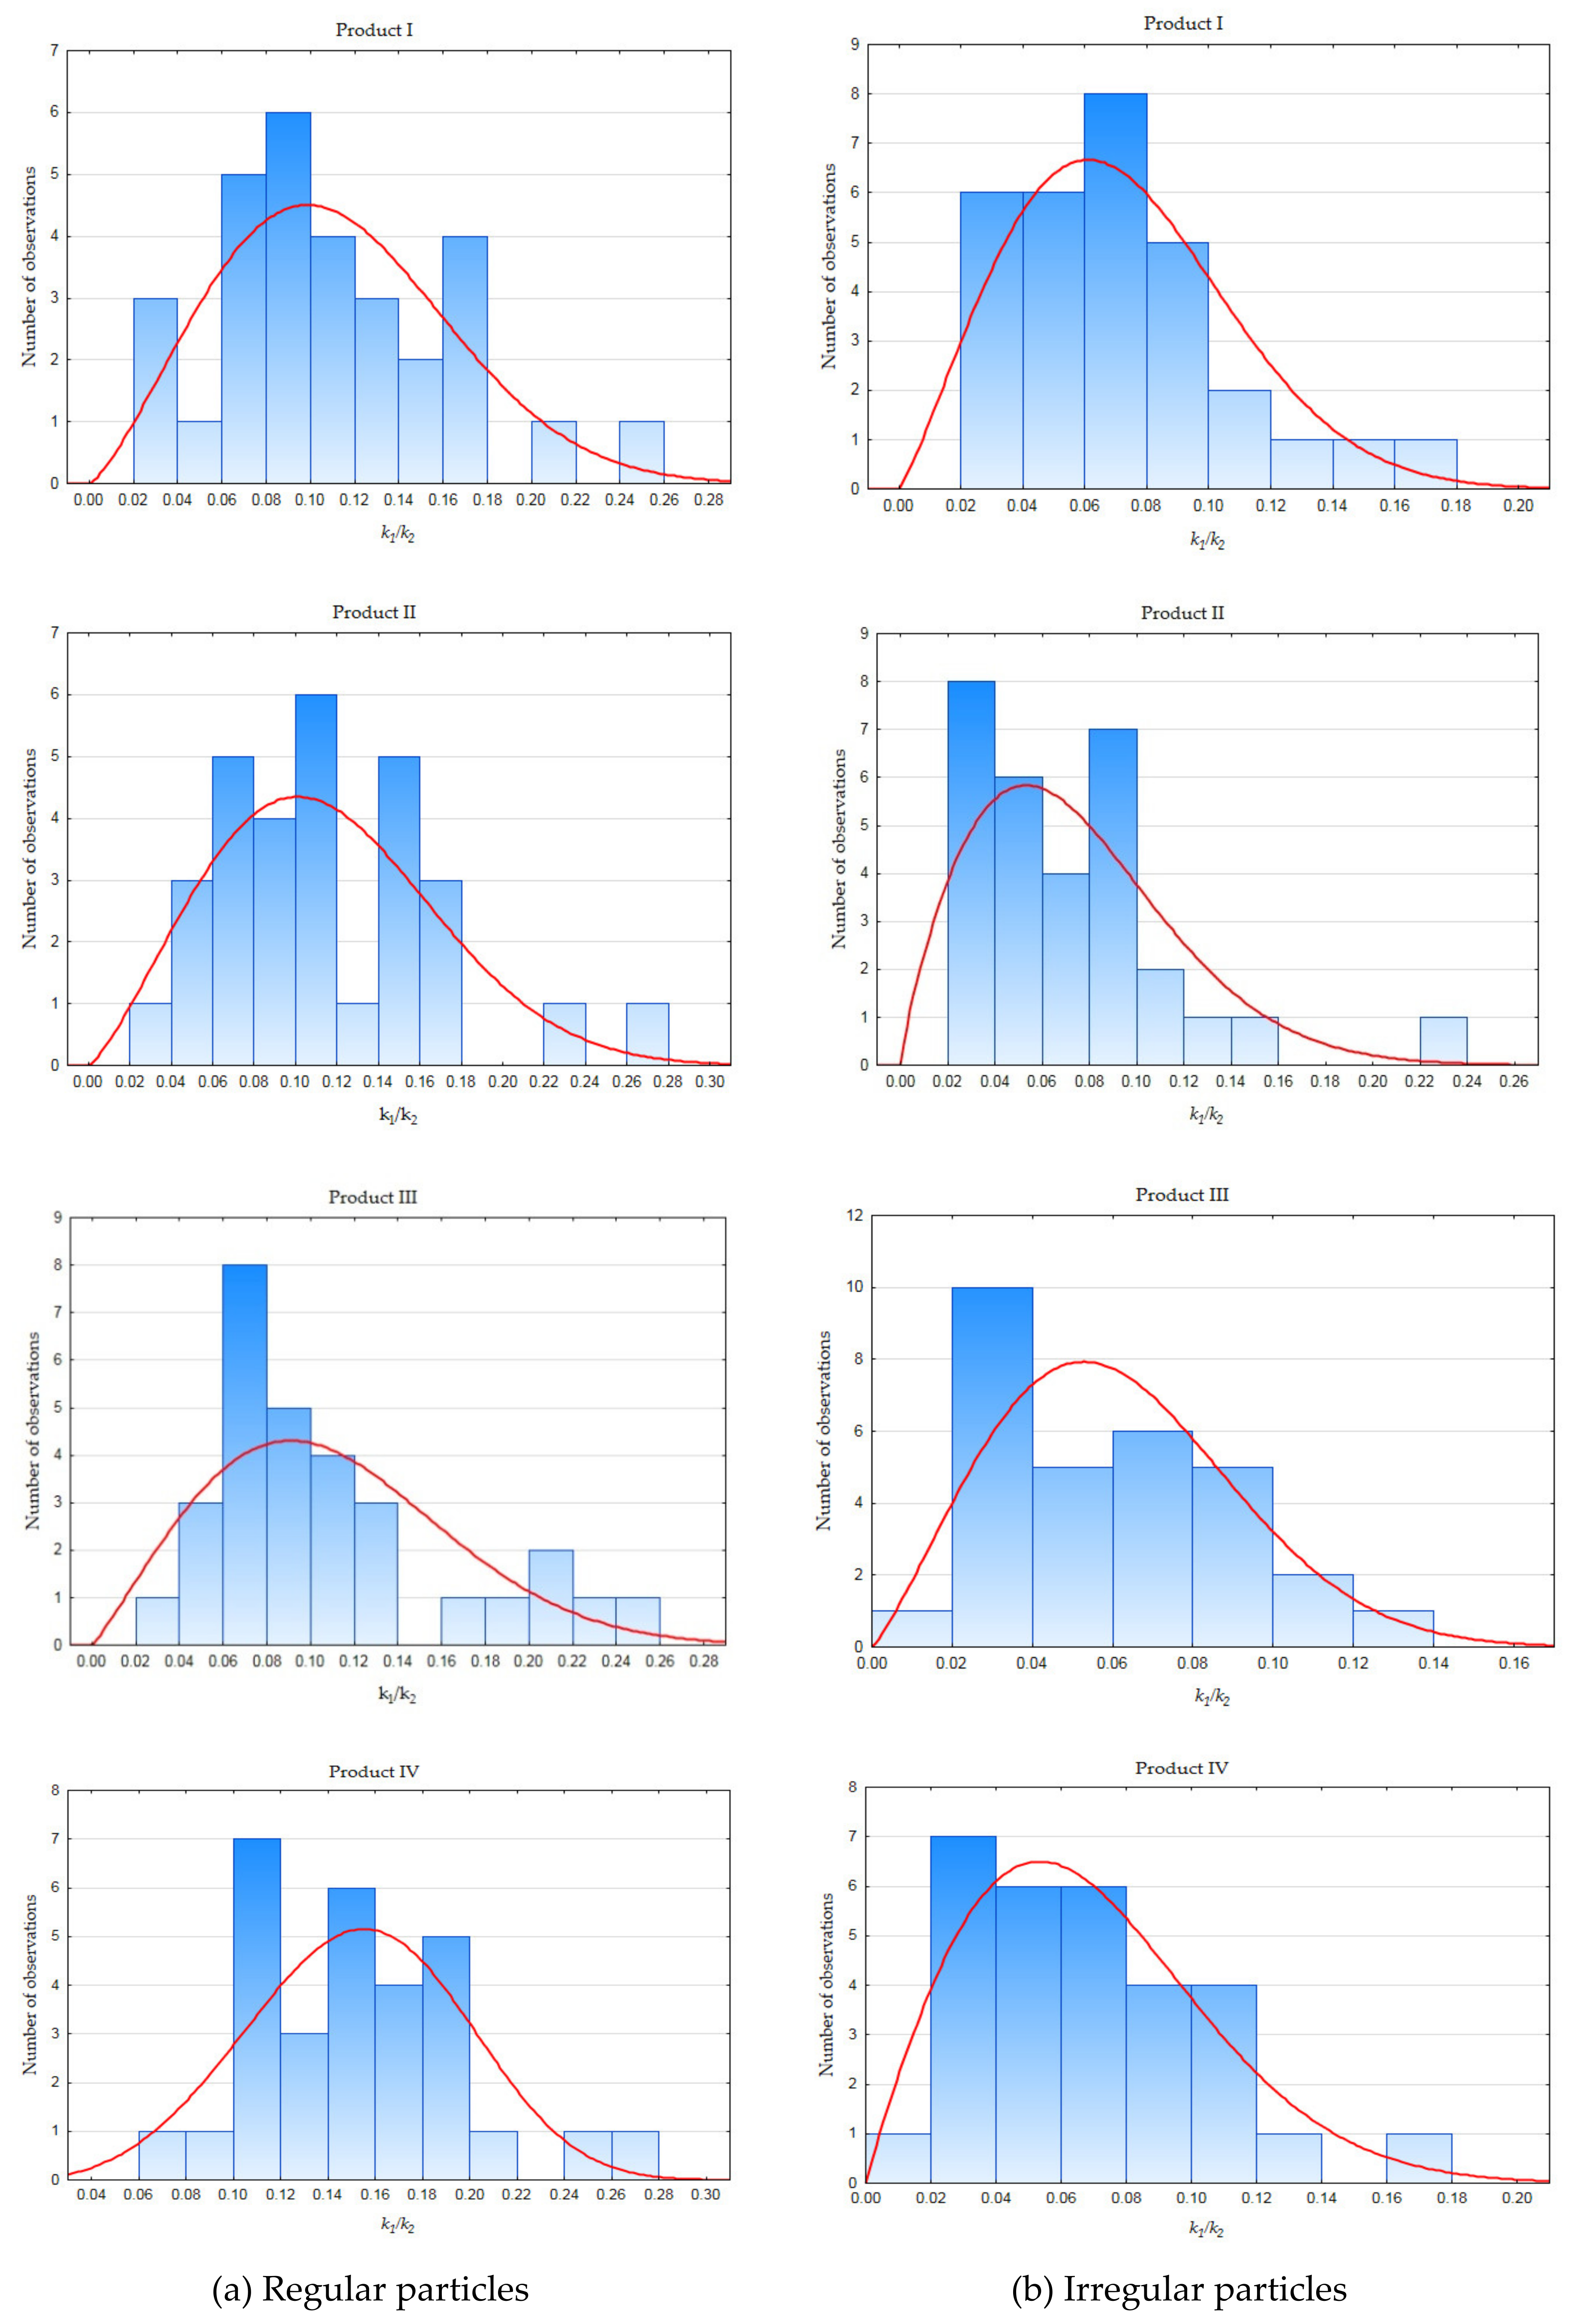
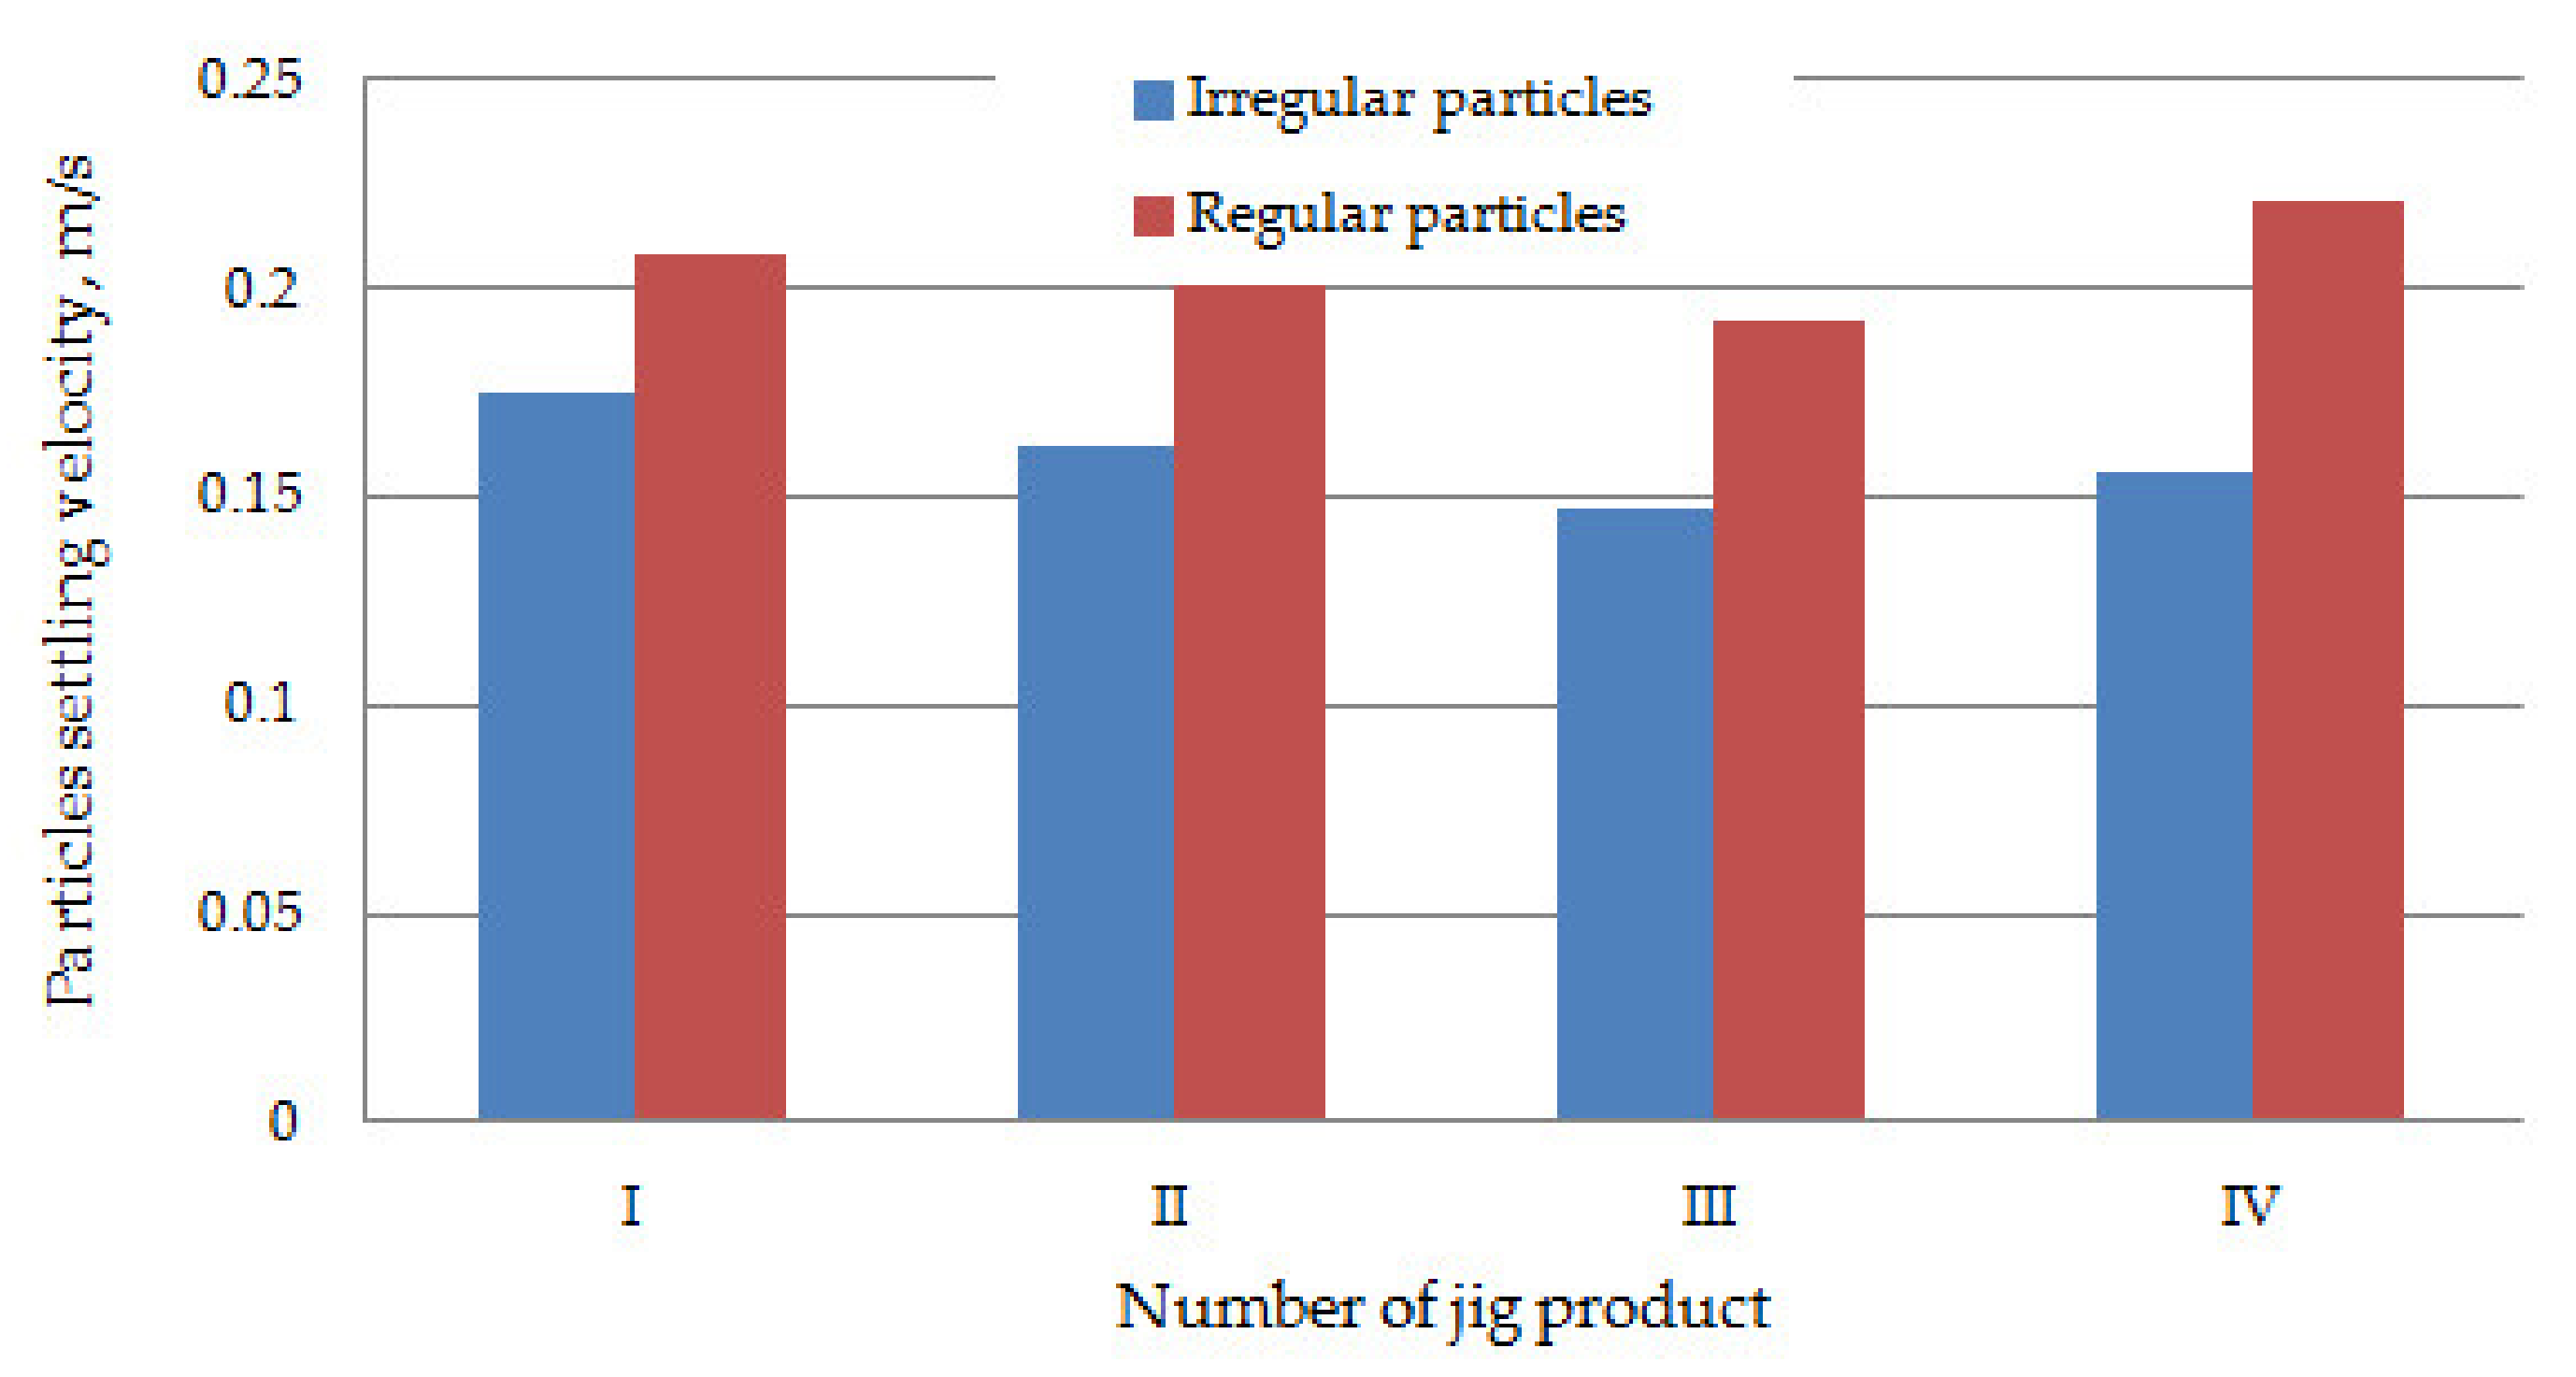
3.1. Analysis of the Geometric and Physical Properties

On the basis of the image analysis of a randomly selected sample of regular and irregular particles from each product, the histograms of the distributions of the projection diameter (Figure 5) and ratio between the shape coefficients (Figure 6) were calculated and plotted. By means of the Statistica computer program, for each histogram, the statistical density function was matched to a certain product of regular and irregular particles. The investigations of other authors indicate that the distributions of the shape coefficients are distributions of a gamma type [41,42]. For this reason, the Weibull distribution function was selected and matched to the histograms [43]. The histograms of a projection diameter were also described by means of the Weibull distribution function.
Despite the fact that investigations of the jigging process were conducted with a narrow particle size fraction, it is visible that differentiation in the particle projection diameter distribution occurs for regular and irregular particles. Right-side asymmetry is observed with prevalence of particles from the finer range of the already narrow particle size distribution. It is shown by means of the projection diameter values. This tendency can be observed for particles in the third product selected from the jig. Thus, despite the prepared homogenous narrow particle size fraction for jigging, it can be said that the feed was characterized by heterogeneity of the particle size considering the distribution of the geometrical properties represented by the projection diameter. The values of the standard deviation around mean values for the histograms, calculated and shown in Table 1, are characterized by higher values for irregular particles apart from the first product. It proves that there was higher heterogeneity considering the geometrical property—granulation in comparison with values of the standard deviation for regular particles. The values of the standard deviations for particle density do not differ significantly in the range of analyzed products of chalcedonite particles. Furthermore, the histograms for showing the distribution of the dynamic and volumetric shape coefficients for the regular and irregular particles of a chalcedonite sample in the jigging products were drawn. It allowed to state that the values of the coefficient k2 are characterized by higher values in comparison with the values of coefficient k1, and the values of the standard deviation are also higher for the dynamic shape coefficient values within the products. It allows to observe that the characteristics of the material used in the experiment was more heterogeneous in terms of shape in relation to the dynamic coefficient. Growth of the dynamic shape coefficient k2 and decreasing of the volumetric coefficient k1 proved that the level of particle irregularity is higher [44]. For the purpose of this paper, the histograms of the distribution of the ratios between the shape coefficients were drawn (Figure 6) because, according to Formula (1), they are part of the terminal settling velocity of the particles. In this case, the values of the standard deviations around the mean values remained on a constant level in both cases; that is, for the regular and irregular particles, respectively, in the products. It can be said, then, that from the point of view of hydrodynamic resistances, which occur in a working bed during the movement of particles in a jig, a greater role is played by the particles’ dynamic shape coefficient because of higher heterogeneity. The ratio of the shape coefficients has a lower influence on particle dissection in the case of the analysed narrow particle fraction. The light products—that is, the third and fourth products—are characterized by lower heterogeneity in terms of the volumetric coefficient in the case of regular and irregular particles, and the dynamic coefficient in the case of regular particles.
The mean values of the shape coefficients k1 and k2 are shown in Table 2. The values of these coefficients for regular particles are higher compared to the irregular particles (except k2 for product IV). The ratio between the mean values of k1 and k2 for the regular particles is also higher than for the irregular ones. Because of that, using Equation (1) to calculate the settling velocity for regular particles gave higher values.
Figure 7 shows the distribution of the mean particle density in the products after processing. The biggest differences in values are observed for particles in the first and third product, which beneficially affects the particle separation in accordance with differences in their densities. Particles of the first product—the heaviest product—are characterized by the highest densities for both regular and irregular particles. The differences in values of their densities are also the biggest. This fact is confirmed also by lithologic research of the layers in which it was observed that the color of the particles in the samples of the first product, for both the regular and irregular particles, is darker. This proves that they contain more compounds of iron oxides. These differences can also be observed in Figure 2. On the other hand, in the fourth product, theoretically the lightest one according to the rule of density separation in a jig, a slight growth in density occurs in comparison to the third one. This is important information, showing that there is a possibility of regulation by means of height of layers during the operation of a jig prototype working in the laboratory and at industrial scales. In this case, knowing the thickness of the first layer in the first ring, to obtain the product (aggregate) of the biggest density, the bed layer should be cut at a height of about 40 mm.
Figure 8 presents the calculated mean values of the settling velocities for the regular and irregular particles during the jigging process for the separation products. They were calculated by Formula (1). Differentiation in the settling velocities of the regular and irregular particles can be observed, while the biggest differences in the mean settling velocity occurred in the fourth product. The influence of the particles’ shape on their settling velocity, related to a smaller, medium movement resistance, is most likely manifested in the case of regular particles [29,45].
For the fourth product, the mean density of the regular and irregular particles is identical (Figure 7), but in this case, the value k1/k2 for the regular particles (0.147—Table 2) exceeds this value compared to the irregular particles (0.062—Table 2) by about 2.4 times. The value of the mean projective diameter of the regular particles is equal to 9.77 mm and for irregular ones 10.45 mm, and this causes the differences in the settling velocities occurring from the differentiation of the geometrical properties (shape coefficients and particle diameter). This mechanism can be additionally explained on the basis of consideration, which showed that “sphere-like” particles move with a different velocity than the “disk-like” particles, which are irregular chalcedonite particles [16]. It is caused mainly by the balance of forces acting on a particle having the same volume but different shapes.

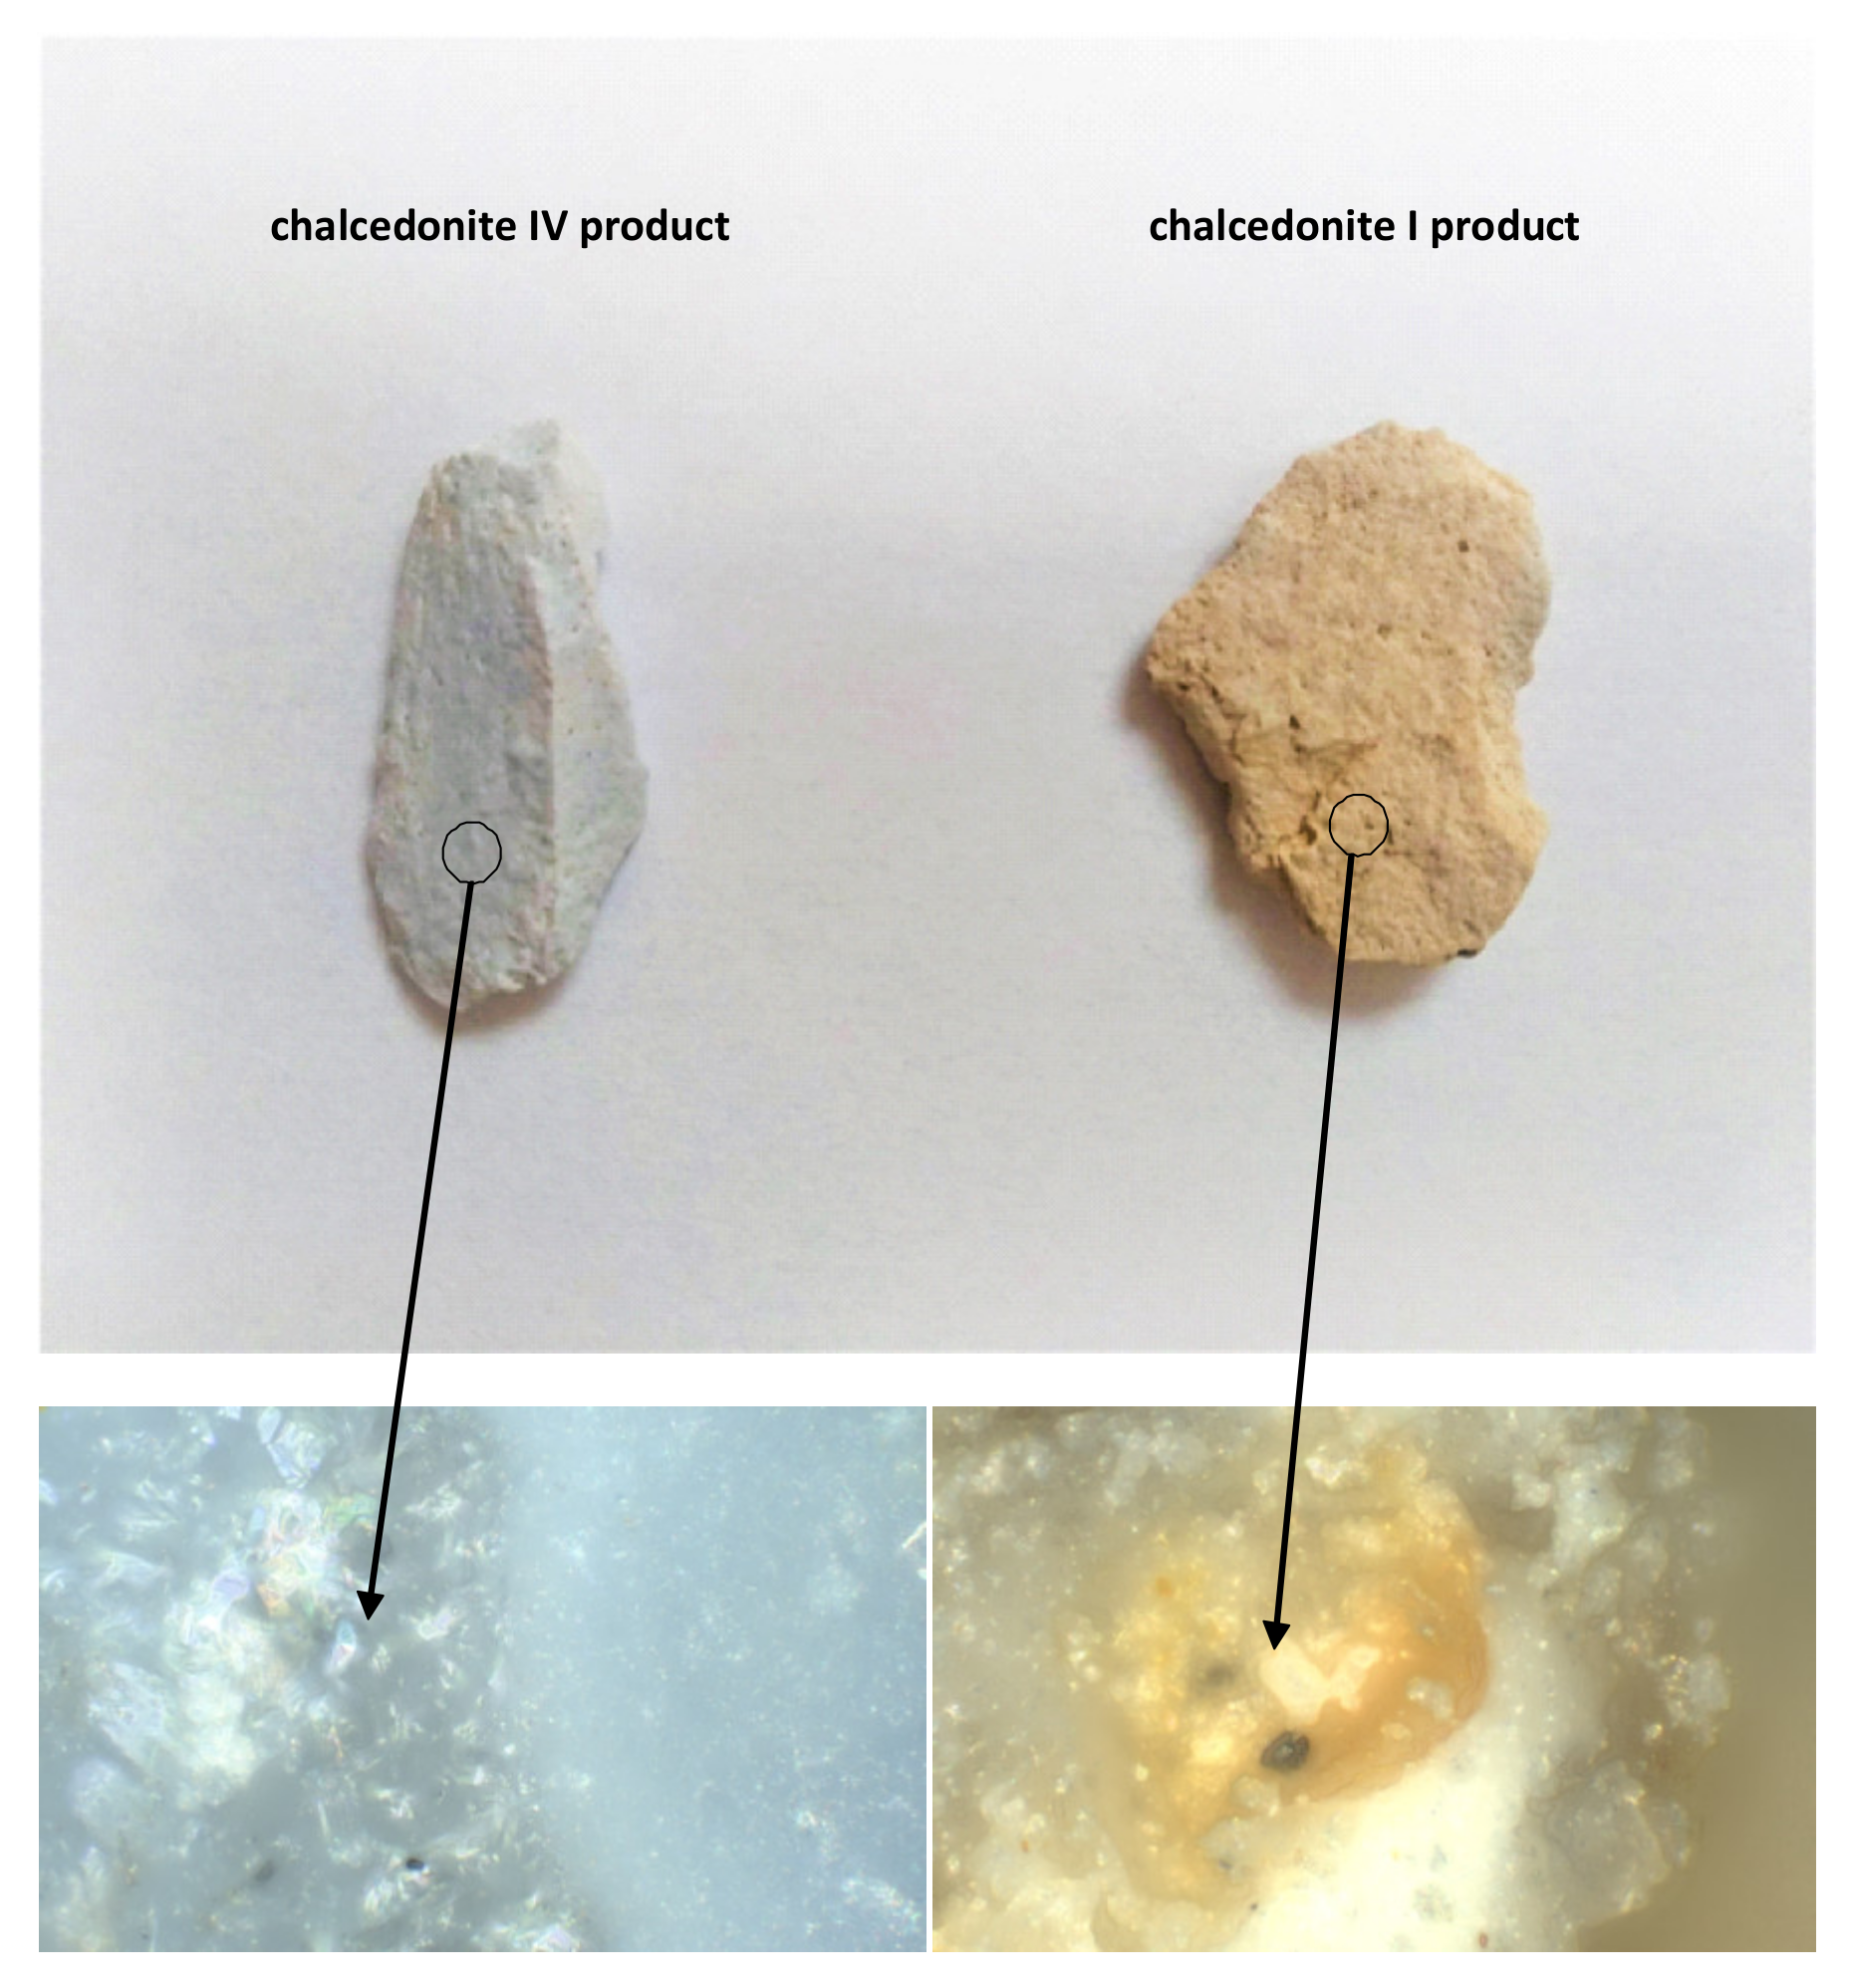
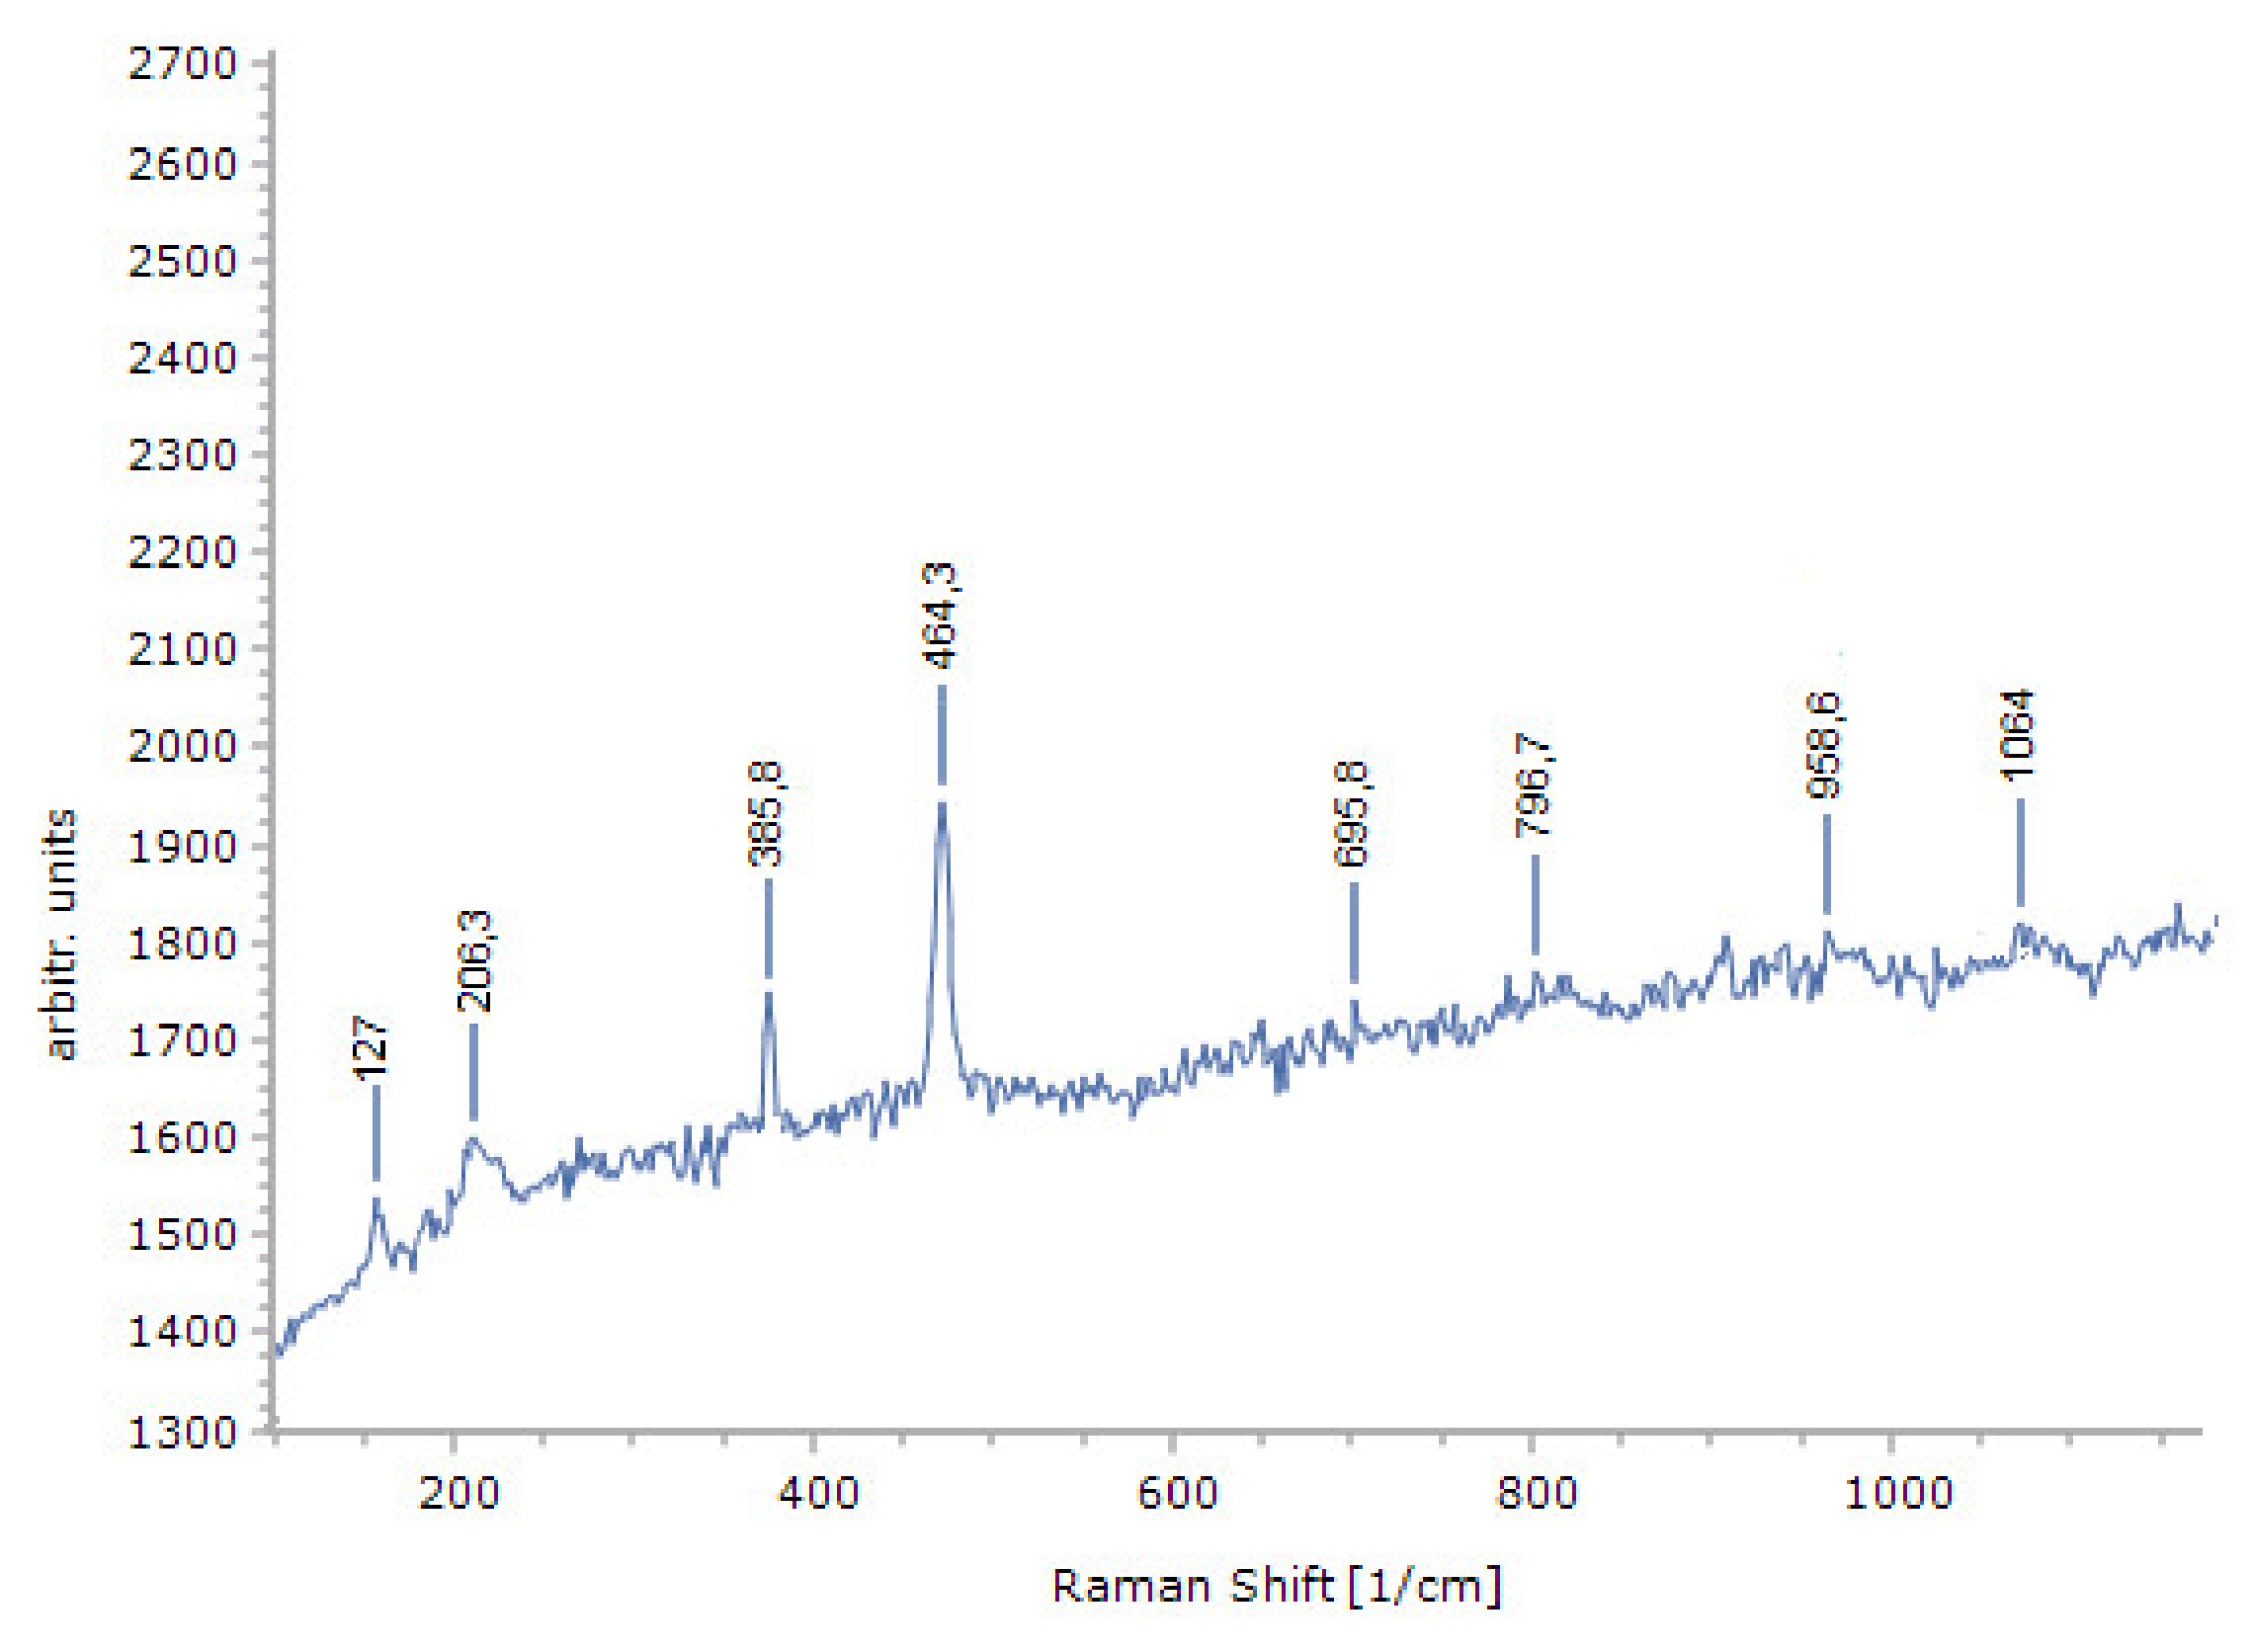
3.2. Analysis of the Chalcedonite Particles’ Surface Chemistry

In the Raman method, spectra of the investigated materials are compared with model spectra, specifying the values of the wavenumbers (that is, the Raman shifts) characteristic of a given material and its variation. Table 3 presents the model positions of the peaks, characteristic of minerals from the SiO2 group (quartz, tridymite and cristobalite) and of the most frequently occurring iron compounds: oxides (magnetite and hematite) and hydroxides (goethite and lepidocrocite). Due to the mechanism of Fe ion transfer, the possibility of precipitation of siderites as deposits was also taken into account. Peaks with the highest intensity are marked by underlining [46].
The SpectraGryf software was used to determine the shift values. The conducted comparison analysis of the Raman spectra with the model shift values demonstrated that silicon dioxide is the basic component of both particles, whereby the spectrum of chalcedonite IV is significantly easier to obtain from a diagnostic point of view. The identification of polymorphic variation was performed by comparing the recorded shifts in its Raman spectrum (Table 4) with the model spectra of the separate silica variations (Table 3). The Raman spectrum of the chalcedonite sample from the fourth jig product presented in Figure 9 demonstrates the maxima for the following wavenumbers: 127.6, 207.2 and 464.1 cm−1. The identical values of the wavenumbers specifying the location of the peaks can be determined in the quartz model spectrum (Table 3). Thus, chalcedonite (non-transformed) possesses the structure of pure quartz. There is also a possibility of small amounts of tridimite; however, not all types of shifts occur, and peaks from the higher range can overlap with the diagnostic siderite at 1090 cm−1. The samples’ fluorescence may suggest the presence of opal intrusions.
Factors acting on the surface of the Earth—free atmospheric oxygen, carbon dioxide, water and the organic world—cause multiple changes in mineral mass. Dissolution of deposits is a long-term process, but is of much importance, because it leads to chemical metamorphoses of crystallites, creation of mineral mixtures (solid solutions) and displacement of mineral mass. If dissolution of minerals occurs as a result of the action of water alone, then the dissolution processes are described by the product of these compounds’ solubility. Dissolution occurs for as long as the concentration of the ions created as a result of the dissolution does not exceed the product of the solubility. In the case of SiO2, the reaction with water assumes the following form:
SiO2 (quartz) + 2H2O = H4SiO4 (silicic acid)
and the amount of the created silicic acid in water is equal to [47]:
[H4SiO4] = K [SiO2] [H2O2] ≈ 2 × 10⁻⁴ kmol/m3
These processes cause an increase in the surface reactivity and ion exchanges at the boundary of the phases of a solid and migrating solution. The degree of surface transformation causes the development of open porosity, structure loosening and consequently increasing penetration of migrating solutions.
Solutions migrating through a mineral mass are never pure water as, depending on their origin, they contain dissolved ions. The chemical composition of these solutions is varied, but iron occurs in the majority of them. The majority of iron cations is transported in a reduced form as carbonates. They are subjected to transformations into different mineral forms on the surface [37].
According to the same method, Raman spectra for chalcedonite from the first jig product were compared (Figure 10). The occurrence of small local maxima coming from the quartz structure was found in the spectrum of the transformed chalcedonite; however, the whole reveals the form characteristic of states with low structural arrangement (amorphous forms). Catalytic oxidation of iron oxides on microcristallites of chalcedonite is the result of chemical reactions often supported by microbiological processes, which cause precipitation of the hydrated iron (III) oxides and hydroxides [48].
Oxides and hydroxides mutually coagulate and precipitate in the form of goethite gel and goethite–hematite gel. Thus, the identification of separate mineral structures is very difficult. However, a shift in the wave range of 385.8 cm−1, which corresponds to the diagnostic shift with the highest intensity for goethite, was observed. Mineral gel tightly fills the pores and voids, merging with the silica matrix; therefore, an increase in density of the transformed chalcedonite occurs. Goethite has an average density of 4.2 g/cm3, and hematite 5.0 g/cm3, while for silica it is 2.65 g/cm3. This fact allows the separation of chalcedonite into density fractions to occur.
Similarly, as in a chalcedonite particle from the fourth layer, a small peak in the range of 1083 cm−1 was observed, which suggested the presence of trace amounts of siderite (diagnostic peak 1090 cm−1) or tridymite (1073 cm−1); most likely both occur, causing peak overlapping and blurring.

4. Conclusions

The presented results of the investigation concerning beneficiation of chalcedonite separated in a jig demonstrated the possibilities to use this process to separate particles in industrial conditions provided that the applied processing methods are based on patented inventions PL233689 and PL23318B1, which allow to prepare the material for the beneficiation process in the appropriate way. The most important element of the system is preparation of the material by separating it into narrow particle fractions (the narrower, the more beneficial). Then these fractions should be separated according to their shape, namely, the regular and irregular particles. For this purpose, special screens and screening systems can be used. The applied laboratory ring jig allowed to observe the phenomenon of particle segregation according to layers, which indicates the possibility to regulate the height of the layers during the operation of the jig prototype, working at both the laboratory and industrial scales. Despite observations that the mean values of density in the fourth product for the regular and irregular particles were observed at very similar levels, the settling velocity in this product is the most differentiated. If the mixture of such particles is separated in a jig, then the separation would occur because of differences in the settling velocity. Here, the influence of the particles’ shapes on the effects of chalcedonite separation by means of gravitational methods appears. In addition, exogenous iron compounds cause a chemical change in chalcedonite density and support the possibility of gravitational separation.
The analysis of the results of the investigation presented in the paper on an example of chalcedonite particles is an incentive to conduct further research on the beneficiation of other aggregates by means of the pulsation method in an aqueous solution. The application of separation operations in jigs for regular and irregular particles creates the possibility to obtain aggregates of high quality and with a homogenous particle shape in the case when pre-classification—that is, the initial separation of material into regular and irregular particles—is used. The effects of such a beneficiation process can be significant for the economy. For example, separation of particles in samples of the first product for both regular and irregular particles with higher densities, which are simultaneously darker because of the content of more compounds of iron oxides, can be used in civil engineering, for example in thermal insulation. Because the maximum thermal energy depends directly on the material density, then both the regular and irregular particles from the first jigging product remain warm for a longer period of time (lower thermal power is emitted) and emit more energy during a certain time of exposure. The beneficiated aggregates from the higher jig layers, especially with irregular particles and having a lower density, higher porosity and larger specific surface, can be used in water engineering as filtration grits for water purification or in agriculture as the substratum for plants. The microstructure (shape and surface preference) decides, among others, the effects of adsorption on the particle surface. The development of external layer surfaces, projection surfaces, the appearance of microcracks and roughness causes the preferences of deposit precipitation. Therefore, chalcedonite deposits, especially those with irregular particles, can be used as oxidation filtering deposits.

5. Patents

Two patents granted in Poland were utilized in the paper:
Author: Gawenda, T. Title: Układ urządzeń do produkcji kruszyw foremnych, AGH w Krakowie. Patent No. PL233689 granted on 8 July 2019.
Authors: Gawenda, T., Saramak, D., Naziemiec, Z. Title: Układ urządzeń do produkcji kruszyw oraz sposób produkcji kruszyw. AGH w Krakowie, Patent No. PL 233318B1 granted on 7 June 2019.

Author Contributions

Conceptualization: A.S. and T.G.; methodology, A.S., A.N. and T.G.; formal analysis: A.N., A.S. and A.S.; investigations: A.S., A.S. and A.N.; writing—original draft preparation: A.S., T.G. and T.N.; writing—review and editing: A.S. and T.N.; visualization: A.S. and T.N.; supervision: T.G. All authors have read and agreed to the published version of the manuscript.

Funding

The Project is co-financed by the European Union from sources of the European Fund of Regional Development within the Action 4.1 of the Operation Program Intelligent Development 2014–2020.
Minerals 10 00600 i001

Acknowledgments

The paper is the effect of realization of the NCBiR Project, contest no. 1, within the subaction 4.1.4 “Appliaction projects” POIR in 2017, entitled “Opracowanie i budowa zestawu prototypowych urządzeń technologicznych do budowy innowacyjnego układu technologicznego do uszlachetniania kruszyw mineralnych wraz z przeprowadzeniem ich testów w warunkach zbliżonych do rzeczywistych” (in English: “Elaboration and construction of the set of prototype technological devices to construct an innovative technological system for aggregate beneficiation along with tests conducted in conditions similar to real ones”).

Conflicts of Interest

The authors declare no conflict of interest.

References

  1. Osoba, M. Osadzarki wodne pulsacyjne typu KOMAG, maszyny sprawdzone w przeróbce surowców mineralnych. Masz. Gór. 2005, 4, 104. (In Polish) [Google Scholar]
  2. Lutyński, A.; Osoba, M. Wpływ charakterystyki pulsacji wody w wodnych osadzarkach pulsacyjnych na proces pozyskiwania wybranych produktów mineralnych. In Prace Naukowe—Monografie; CMG KOMA: Gliwice, Poland, 2007. (In Polish) [Google Scholar]
  3. Lutyński, A.; Osoba, M. Dobór technologiczny osadzarek wodnych pulsacyjnych w procesie projektowania. Gór. Geoinż. 2009, 33, 259–268. (In Polish) [Google Scholar]
  4. Osoba, M. Osadzarki Wodne Pulsacyjne Typu KOMAG do Przeróbki Żwiru i Piasku, Prace Naukowe Instytutu Górnictwa Politechniki Wrocławskiej nr 119, Seria: Konferencje nr 48. In Kruszywa Mineralne; Szklarska Poręba, oficyna Wydawnicza Politechniki Wrocławskiej: Wrocław, Poland, 2007. (In Polish) [Google Scholar]
  5. Osoba, M. Polskie osadzarki wodne pulsacyjne do wzbogacania surowców mineralnych. Inż. Miner. 2014, 34, 287–294. (In Polish) [Google Scholar]
  6. Cazacliu, B.; Sampaio, C.H.; Miltzarek, G.; Petter, C.; Le Guen, L.; Paranhos, R.; Huchet, F.; Kirchheim, A.P. The potential to using air jigging to sort recycled aggregates. J. Clean. Prod. 2014, 66, 46–53. [Google Scholar] [CrossRef] [Green Version]
  7. Sampaio, C.H.; Ambrós, W.M.; Miranda, L.R.; Gerson, L.; Miltzarek, G.M.; Kronbauer, M.A. Improve the quality of recycled aggregate concrete by sorting in air jig. In Proceedings of the IIIrd Progress of Recycling in the Built Environment, São Paulo, Brazil, 3–5 August 2015. [Google Scholar]
  8. Sampaio, C.H.; Cazacliu, B.G.; Miltzarek, G.L.; Huchet, F.; le Guen, L.; Petter, C.O.; Paranhos, R.; Ambros, W.M.; Oliveira, M.L.S. Stratification in air jigs of concrete/brick/gypsum particles. Constr. Build. Mater. 2016, 109, 63–72. [Google Scholar] [CrossRef]
  9. Naziemiec, Z.; Pichniarczyk, P.; Saramak, D. Current issues of processing and industrial utilization of chalcedonite. Inż. Miner. 2017, 1, 89–96. [Google Scholar]
  10. Naziemiec, Z.; Pichniarczyk, P.; Saramak, D. Methods of improvement chalcedonite processing effectiveness with the use of density separation. Miner. Resourc. Manag. 2017, 33, 163–178. [Google Scholar] [CrossRef] [Green Version]
  11. Gawenda, T.; Saramak, D.; Nad, A.; Surowiak, A.; Krawczykowska, A.; Foszcz, D. Badania procesu uszlachetniania kruszyw w innowacyjnym układzie technologicznym. In Kruszywa Mineralne; Glapa, W., Ed.; Wrocław Wydział Geoinżynierii, Górnictwa i Geologii Politechniki Wrocławskiej: Wrocław, Poland, 2019. (In Polish) [Google Scholar]
  12. Kowol, D.; Matusiak, P. Optymalizacja parametrów procesowych oczyszczania nadaw żwirowych w klasyfikatorze pulsacyjnym w zależności od typu zanieczyszczeń i udziału ziaren piaskowych. ITG KOMAG 2012. Unpublished Materials (In Polish) [Google Scholar]
  13. Matusiak, P.; Kowol, D. Możliwości poprawy jakości kruszywa poprzez zastosowanie klasyfikatora pulsacyjnego typu KOMAG. Stud. Mater. 2013, 43, 109–118. (In Polish) [Google Scholar]
  14. Kowol, D.; Matusiak, P. Badania skuteczności osadzarkowego oczyszczania kruszywa z ziaren węglanowych. Min. Sci. Miner. Aggreg. 2015, 22, 83–92. [Google Scholar]
  15. Gawenda, T.; Krawczykowski, D.; Krawczykowska, A.; Saramak, A.; Nad, A. Application of dynamic analysis methods into assessment of geometric properties of chalcedonite aggregates obtained by means of gravitational upgrading operations. Minerals 2020, 10, 180. [Google Scholar] [CrossRef] [Green Version]
  16. Phengsaart, T.; Ito, M.; Azuma, A.; Tabelin, C.B.; Hiroyoshi, N. Jig separation of crushed plastics: The effects of particle geometry on separation efficiency. J. Mater. Cycles Waste Manag. 2020, 22, 787–800. [Google Scholar] [CrossRef]
  17. Gradziński, R. Zarys Sedymentologii; WG Wrocław: Wrocław, Poland, 1986. (In Polish) [Google Scholar]
  18. Brożek, M.; Surowiak, A. Argument of separation at upgrading in the JIG. Arch. Min. Sci. 2010, 55, 1–40. [Google Scholar]
  19. Finkey, J. Die Wissenschaftlichen Grundlagen der Nassen Erzaufbereitung; Springer: Berlin, Germany, 1924. (In German) [Google Scholar]
  20. Laszczenko, P.V. Gravitacionnyje Metody Obogaszczenija; Gostoptechizdat: Moscow, Russia, 1940. (In Russian) [Google Scholar]
  21. Olevskij, V.A. O Svobodnom Padenii Czastic v Żidkoj Srede; Trudy Instituta Mechanobr: Leningrad, Vypusk, 1953; pp. 88–96. (In Russian) [Google Scholar]
  22. Heiss, J.F.; Coull, J. On the settling velocity of non-isometric particles in a viscous medium. Chem. Eng. Prog. 1952, 48, 133–140. [Google Scholar]
  23. Akkerman, J.E. Skorost svobodnogo padenija mineralnych zeren v żidkostiach. Obogaszczenie Rud 1966, 6, 22–25. (In Russian) [Google Scholar]
  24. Chrisiansen, E.B.; Barker, D.E. The effect of shape and density on the free settling of particles at high Reynolds numbers. AIChE J. 1965, 11, 145–151. [Google Scholar] [CrossRef]
  25. Bedran, N.G.; Denisenko, A.I.; Pilov, P.I. Rasczet skorosti svobodnogo dvi-żenija mineralnych zeren v srede. Izv. VUZ Gornyj Ż. 1976, 9, 141–144. (In Russian) [Google Scholar]
  26. Concha, F.; Almendra, E.R. Settling velocities of particulate systems, 1. Settling velocities of individual spherical particles. Int. J. Miner. Process. 1979, 5, 349–367. [Google Scholar] [CrossRef]
  27. Haide, A.; Levenspiel, O. Drag coefficient and terminal velocity of spherical and non-spherical particles. Powder Technol. 1989, 58, 63–70. [Google Scholar] [CrossRef]
  28. Briens, C.L. Correlation for the direct calculation of the terminal velocity of spherical particles in newtonian and pseudoplastic (power-law) fluids. Powder Technol. 1991, 67, 87–91. [Google Scholar] [CrossRef]
  29. Abraham, F. Functional dependence of drag coefficient of a sphere on Reynolds number. Phys. Fluids 1970, 13, 2194–2195. [Google Scholar] [CrossRef]
  30. Thompson, T.L.; Clark, N.N. A holistic approach to particle drag prediction. Powder Technol. 1991, 67, 57–66. [Google Scholar] [CrossRef]
  31. Ganser, G.H. A rational approach to drag prediction of spherical and non-spherical particles. Powder Technol. 1993, 77, 143–152. [Google Scholar] [CrossRef]
  32. Gawenda, T.; Saramak, D.; Naziemiec, Z. Układ Urządzeń do Produkcji Kruszyw Oraz Sposób Produkcji Kruszyw. Poland Patent No. PL 233318B1, 7 June 2019. (In Polish). [Google Scholar]
  33. Gawenda, T. Innovative technological circuits for regular aggregates production. IOP Conf. Ser. Mater. Sci. Eng. 2019, 641, 012013. [Google Scholar] [CrossRef]
  34. Stempkowska, A.; Gawenda, T. Analiza właściwości cieplnych kruszywa chalcedonitowego na podstawie badań wykorzystujących metody termowizyjne. In Kruszywa Mineralne Vol. 4; Glapa, W., Ed.; Wrocław Wydział Geoinżynierii, Górnictwa i Geologii Politechniki Wrocławskiej: Wrocław, Poland, 2020. (In Polish) [Google Scholar]
  35. Kosk, L. Complex management of chalcedonite waste fractions from Inowłódz mine clarifiers in environment prevention and in building material industry. Gospod. Surow. Miner. Miner. Resourc. Manag. 2010, 26, 5–22. (In Polish) [Google Scholar]
  36. Michel, M. Charakterystyka chalcedonitu ze złoża Teofilów pod kątem możliwości wykorzystania w technologii uzdatniania wody i oczyszczania ścieków. Gospod. Surow. Miner. Miner. Resourc. Manag. 2011, 27, 49–67. (In Polish) [Google Scholar]
  37. Bolewski, A.; Manecki, A. Mineralogia Szczegółowa; PAE: Warsaw, Poland, 1993. (In Polish) [Google Scholar]
  38. Gawenda, T. Układ Urządzeń Do Produkcji Kruszyw Foremnych. Poland Patent nr PL233689, 8 July 2019. (In Polish). [Google Scholar]
  39. PN-EN 933-3. Badania Geometrycznych Właściwości Kruszyw. Część 3: Oznaczanie Kształtu Ziarn za Pomocą Wskaźnika Płaskości; Polski Komitet Normalizacyjny: Warsaw, Poland, 2012. (In Polish) [Google Scholar]
  40. Szurgot, M.; Tszydel, I. Zastosowanie spektroskopii Ramana do identyfikacji minerałów meteorytu NWA 4967. Acta Soc. Metheorol. Pol. 2011, 2, 158–170. [Google Scholar]
  41. Hodenberg, M. Gravimetric and optical particle analysis of mixed particle samples. Aufbereit. Tech. 1998, 39, 461–466. [Google Scholar]
  42. Stark, U.; Muller, A. Effective methods for measurement of particle size and shape. Aufbereit. Tech. 2005, 45, 6–16. [Google Scholar]
  43. Surowiak, A. Influence of particle density distributions of their settling velocity for narrow size fractions. Miner. Resourc. Manag. 2014, 30, 105–122. (In Polish) [Google Scholar]
  44. Brozek, M.; Surowiak, A. Effect of particle shape on jig separation efficiency. Physicochem. Probl. Miner. Proc. 2007, 41, 397–413. [Google Scholar]
  45. Surowiak, A.; Brożek, M. Methodology of calculation the terminal settling velocity distribution of irregular particles for values of the Reynold’s number. Arch. Min. Sci. 2014, 59, 553–562. [Google Scholar]
  46. Hanesh, M. Raman spectroscopy of iron oxides and (oxy)hydroxides at low laser power and possible applications in environmental magnetic studies. Geophys. J. Int. 2009, 177, 941–948. [Google Scholar] [CrossRef]
  47. Henderson, P. Inorganic Geochemistry; Pergamon: Oxford, UK, 1982. [Google Scholar]
  48. Jeż-Walkowiak, J.; Komorowska-Kaufmann, M.; Dymaczewski, Z.; Sozański, M.; Zakrzewski, P. Properties of catalyst for iron and manganese oxidation in filter materials. E3S Web Conf. 2018, 59, 00014. [Google Scholar] [CrossRef] [Green Version]
Figure 1. A scheme of investigations for testing the regular and irregular particles in the particle size fraction 6.3–8.0 mm in a laboratory ring jig device.
Minerals 10 00600 g001
Figure 2. The exemplary chalcedonite product separated into four fractions for the regular particles (left) and irregular particles (right).
Minerals 10 00600 g002
Figure 3. (a) Binary image (Scale bare: 10 mm) and (b) measurements of selected particle parameters.
Minerals 10 00600 g003
Figure 4. Chalcedonite particles—general view and photographs of microregions taken using a confocal optical microscope Olympus BX-41.
Minerals 10 00600 g004
Figure 5. Histograms of the distribution of the projection diameter of the regular and irregular particles separated into four products.
Minerals 10 00600 g005aMinerals 10 00600 g005b
Figure 6. Histograms of the distribution of the ratio between the shape coefficients k1/k2 in products of separation of the regular and irregular particles separated into four products.
Minerals 10 00600 g006
Figure 7. Distribution of the mean particle density in the jigging products.
Minerals 10 00600 g007
Figure 8. The relation between the settling velocity of particles for the separation products.
Minerals 10 00600 g008
Figure 9. The Raman spectrum obtained during irradiation of the chalcedonite samples from the first and fourth jig product.
Minerals 10 00600 g009
Figure 10. The Raman spectrum obtained during the irradiation of a chalcedonite sample from the first jig product with shift values.
Minerals 10 00600 g010
Table 1. Comparison of the standard deviation from the mean values for all the calculated variables.
Regular ParticlesIrregular Particles
No. of productdpk1k2k1/k2ρdpk1k2k1/k2ρ
I0.9880.1311.8120.0520.1100.8740.0970.9720.0350.116
II0.9060.1151.2360.0540.1521.2840.1170.6420.0440.119
III1.2890.1230.7900.0560.0901.1180.0790.8290.0300.167
IV0.4820.0960.5840.0420.1731.1810.0810.9480.0380.158
Table 2. Juxtaposition of the mean values of the shape coefficients.
Regular ParticlesIrregular Particles
Productk1k2k1/k2k1k2k1/k2
I0.3643.7280.0980.2103.0950.068
II0.3693.6130.1020.2253.2200.070
III0.3503.5120.1000.1913.3360.057
IV0.4543.0930.1470.2083.3490.062
Total mean0.3843.4860.1100.2083.2500.064
Table 3. Values of Raman shifts defined as diagnostic for the given minerals.
MineralValues of Raman Shifts (cm−1)
quartz127206464---
cristobalite114230420---
tridymite2103043494317991073
hematite Fe2O3225245290–300412--
magnetite FeO. Fe2O3310540670
goethite αFeOOH244299385480548681
lepidocrocite γFeOOH250348379528650-
siderite FeCO31842877311090--
Table 4. Raman shifts obtained as a result of irradiation of the chalcedonite samples.
Values of Raman Shifts (cm−1)
Fourth productFirst product
127.6127.0
207.2206.3
353.9385.8
464.1464.3
675.7675.8
804.8796.7
913.6958.6
1085.81083.0

