GeohashTile: Vector Geographic Data Display Method Based on Geohash


1
School of Computer Science and Technology, Beijing Institute of Technology, Beijing 100081, China
2
Department of Computer Science and Technology, Tsinghua University, Beijing 100084, China
3
School of Computer and Information Engineering, Beijing Technology and Business University, Beijing 102488, China
4
Department of Computer and Information Science at the University of Mississippi, University, MS 38677, USA
*
Author to whom correspondence should be addressed.
ISPRS Int. J. Geo-Inf. 2020, 9(7), 418; https://doi.org/10.3390/ijgi9070418
Submission received: 30 May 2020
/
Revised: 24 June 2020
/
Accepted: 25 June 2020
/
Published: 30 June 2020
Abstract
:In the development of geographic information-based applications for mobile devices, achieving better access speed and visual effects is the main research aim. In this paper, we propose a new geographic data display method based on Geohash, namely GeohashTile, to improve the performance of traditional geographic data display methods in data indexing, data compression, and the projection of different granularities. First, we use the Geohash encoding system to represent coordinates, as well as to partition and index large-scale geographic data. The data compression and tile encoding is accomplished by Geohash. Second, to realize a direct conversion between Geohash and screen-pixel coordinates, we adopt the relative position projection method. Finally, we improve the calculation and rendering efficiency by using the intermediate result caching method. To evaluate the GeohashTile method, we have implemented the client and the server of the GeohashTile system, which is also evaluated in a real-world environment. The results show that Geohash encoding can accurately represent latitude and longitude coordinates in vector maps, while the GeohashTile framework has obvious advantages when requesting data volume and average load time compared to the state-of-the-art GeoTile system.
1. Introduction
Geographic information-based applications such as navigation services, and electronic taxi services offer great convenience to daily life and contribute to the increasing popularity of personal mobile devices [1,2]. To achieve a better user experience, it is necessary to increase access speed while ensuring visual effects (i.e., significant information retention).
The existing method to find the best balance between “access speed” and “visual effect” is to reduce data transmission and improve index efficiency by dividing, indexing, and compressing large-scale map data. First, the data elements transmitted by most literature are vector map data carrying latitude and longitude coordinates [2,3]. If one-dimensional characters can be used to represent the latitude and longitude values, that is a feasible way to reduce the amount of data transmission and improve query efficiency. Second, for most tile maps, grid spatial indexing is considered to be an effective way to improve access to the massive data. However, grid spatial indexing uses a three-field query, which makes it inefficient in the case of massive data [4]. Third, data compression needs to make sure that compressed data does not significantly deteriorate visual effects. The quantization method compresses data by reducing the number of bits and the precision of real-valued coordinates [5], which can maintain the topological relationship of objects. However, how to choose a reasonable data quantization scale is a problem to be solved when realizing good visual effects.
Our solution is to use one-dimensional characters to represent latitude and longitude coordinates and improve query efficiency, and to achieve data compression without significantly reducing visual effects. Geohash meets our requirements with its characteristics of one-dimensional, query convenience and data compression [6]. Using Geohash in map tiles presents the following challenges. Challenge 1: Using one-dimensional character representations for latitude and longitude is not a trivial task in terms of map projection. Currently, the world’s mainstream maps, such as Google Maps [7] and Microsoft Bing Maps [8], use the web Mercator projection method. This method adopts the isometric positive axis cylinder projection mode, and simulates the earth as a sphere, which is one of the most used web map projections [9]. Nevertheless, these projection methods are designed for latitude and longitude. If one-dimensional characters of non-latitude and longitude are used to represent the location of geographic coordinates, this kind of method cannot be used. This problem can be solved by finding a direct calculation method between one-dimensional coordinate and pixel coordinate. Challenge 2: It is difficult to unify tile encoding and coordinate representation. So far neither Google Maps nor Bing Maps achieves the unity of tile encoding and coordinate representation. Challenge 3: New approaches are demanded to achieve both data partitioning and data compression. Our research strives to tackle all the 3 challenges.
To improve the speed of vector map access while ensuring a visual effect, this paper proposes a new Geohash-based geographic data display method named GeohashTile, which uses the Geohash encoding system to improve the performance of data partitioning, indexing, and compressing. To overcome the three challenges listed above, our GeohashTile uses one-dimensional characters, Geohash, to partition and index large-scale geographic data. The GeoJSON format data encoded by Geohash of different lengths are used to achieve data compression. The Geohash encoding method also unifies the tile encoding and coordinate representation. We use the relative position projection method to realize the direct conversion between Geohash and screen-pixel coordinates. In addition, GeohashTile also considers the preparation of Geohash data by the server.
The contributions of this work are summarized as follows:
- We design a vector geographic data structure based on Geohash architecture, named GeohashTile, which can use Geohash’s efficient partitioning and one-dimensional indexing of vector geographic data for easy querying.
- We use Geohash to unify geographic coordinate representation and map tile encoding, and organize and store vector geographic data with different granularity and detail, so as to reduce response time and network data transfer. Using relative position projection, we realize the direct conversion of Geohash and screen-pixel coordinates, making it easy to calculate. We also apply the intermediate results caching method to reduce the amount of calculations.
- We further implement the GeohashTile system and evaluate it by extensive experiments. The results show that the GeohashTile system provides efficient vector tile service in a convenient and user-friendly way, which also demonstrates that the GeohashTile system outperforms the GeoTile system in terms of both data transmission amount and loading time.
The rest of the paper is organized as follows. The background and related works are reviewed in Section 2. Section 3 presents the main idea of the GeohashTile framework and server configuration. Client configuration including GeohashTile calculation process, GeoServer map data request process, Geohash map data projection process and intermediate results caching process are reviewed in Section 4. Section 5 evaluates and analyzes the performance of GeohashTile by comparing it to the state-of-the-art works. Section 6 concludes our paper with potential topics for further exploration.
2. Background and Related Work
In this section, we review and discuss the vector map and spatial index methods involved in the application of Web client access to map data. We then introduce the Geohash encoding method and GeoServer and Leaflet used by our GeohashTile system as well as the comparison of related work.
2.1. Vector Map
Vector data maps are emerging as mobile users demand more interactive and informative mapping services. Vector data can present and distinguish features correctly in different colors at all resolutions [10]. Web Map Tile Service (WMTS) [11] can be used to solve the problems of the uneven distribution and the long transmission delay of vector data, which is also the map service standard for Web Map Service (WMS) [12] and pyramid technology. In the framework of WMTS, maps are divided into images called tiles, which can be transmitted to the client according to the requested area. The tiles are reassembled on the client side by using their respective coordinates. The encoding of vector data is also a critical factor affecting its transmission performance and reusability. XML and JSON are two vector data encoding methods commonly used in web applications [13]. XML (Extensible Markup Language) [14] is a markup language that is used as the standard for Internet information exchange. It has good semantics and extensibility, and can flexibly represent and organize data. GML (Geography Markup Language) [15] and KML (Keyhole Markup Language) [16] are two XML-based encoding methods. KML mode is more concise, while GML provides advanced functions for describing complex maps. Since XML uses a heavyweight grammar, the size of KML and GML are usually larger and complex in format, which are not conducive to data transmission on the Internet [17]. JSON (JavaScript Object Notation) is a lightweight data representation format that is easy to read and write and can be resolved quickly and efficiently. GeoJSON [18] is an open-standard format for encoding various geographic data structures, which can be used to represent simple geographic features such as Geometry, Feature or FeatureCollection and their properties. Compared with GML and KML, GeoJSON can be parsed by computer more conveniently and quickly and can describe complex data structures with good readability [19]. GeoJSON as a lightweight data encoding method is suitable for data transmission between mobile devices [20]. TopoJSON is an extension of GeoJSON to encode topology [21]. The directed arc of TopoJSON is recorded only once and geographic coordinates are used as integers instead of floating-point numbers. Therefore, compared with GeoJSON, TopoJSON eliminates redundancy, but it destroys the independence of the original object and coordinates need to be decoded for use, which is not conducive to data analysis and sharing [2].
For vector map data, pyramid technology is still an effective organization method, called vector tile map. Considering the transmission performance, readability, and easy analysis of the encoding method, we chose GeoJSON as the encoding method of vector data for mobile devices.
2.2. Spatial Index Technology
Spatial index technology is the key technology to improve the efficiency of massive spatial data query. Using a spatial index to manage and maintain the tile pyramid has important application value, and its performance directly affects the overall performance of geographic information network services. Grid index and quadtree index are widely used spatial indexing methods in the tile pyramid model [22,23,24].
The grid index is a rectangular grid arrangement that divides the geographic lines according to a certain resolution level [4]. The grid index method requires that when querying any tile in the pyramid, one only needs to conjunctive query the three values, which are X, Y and Z representing rows, column coordinates and scaling levels, respectively. Grid index is one of the earliest index methods and has a simple form. However, the three-field query also makes it inefficient in the case of massive data.
The pyramid-based quadtree index is named after each of its internal nodes with four sub-nodes, which is a common indexing method for multi-resolution online maps. The indexing method has the advantages of simple coding and easy implementation, and has been adopted by most major network map service providers including Google Maps [7] and Microsoft Bing Maps [8]. Google Maps is indexed in the same way as a grid index. The three fields of are used to represent the tile index values. Therefore, there is also a problem that the mass data query is inefficient. Bing Maps uses two fields of to represent the tile index value, wherein quadkeys, called quadtree keys, optimize the index and storage by combining the two-dimensional block coordinates into a one-dimensional string by bitwise cross-combination. Wan et al. [25] uses two-level tile query methods, namely a large vector map scope (the global map grid) and the sub-scope. Quadtree index was used in both two-level queries to improve the index efficiency, but increased the work of tile region expansion.
Geohash’s index method divides a block in layer M into n blocks in layer , so it is also a quadtree index method. Compared with the common index structure, Geohash has no recursive structure, so the spatial index has only one level, making dynamic updates less complicated [22]. At present, Geohash has been widely used to process spatial data with one-dimensional index [6,22,26,27].
2.3. Geohash Encoding
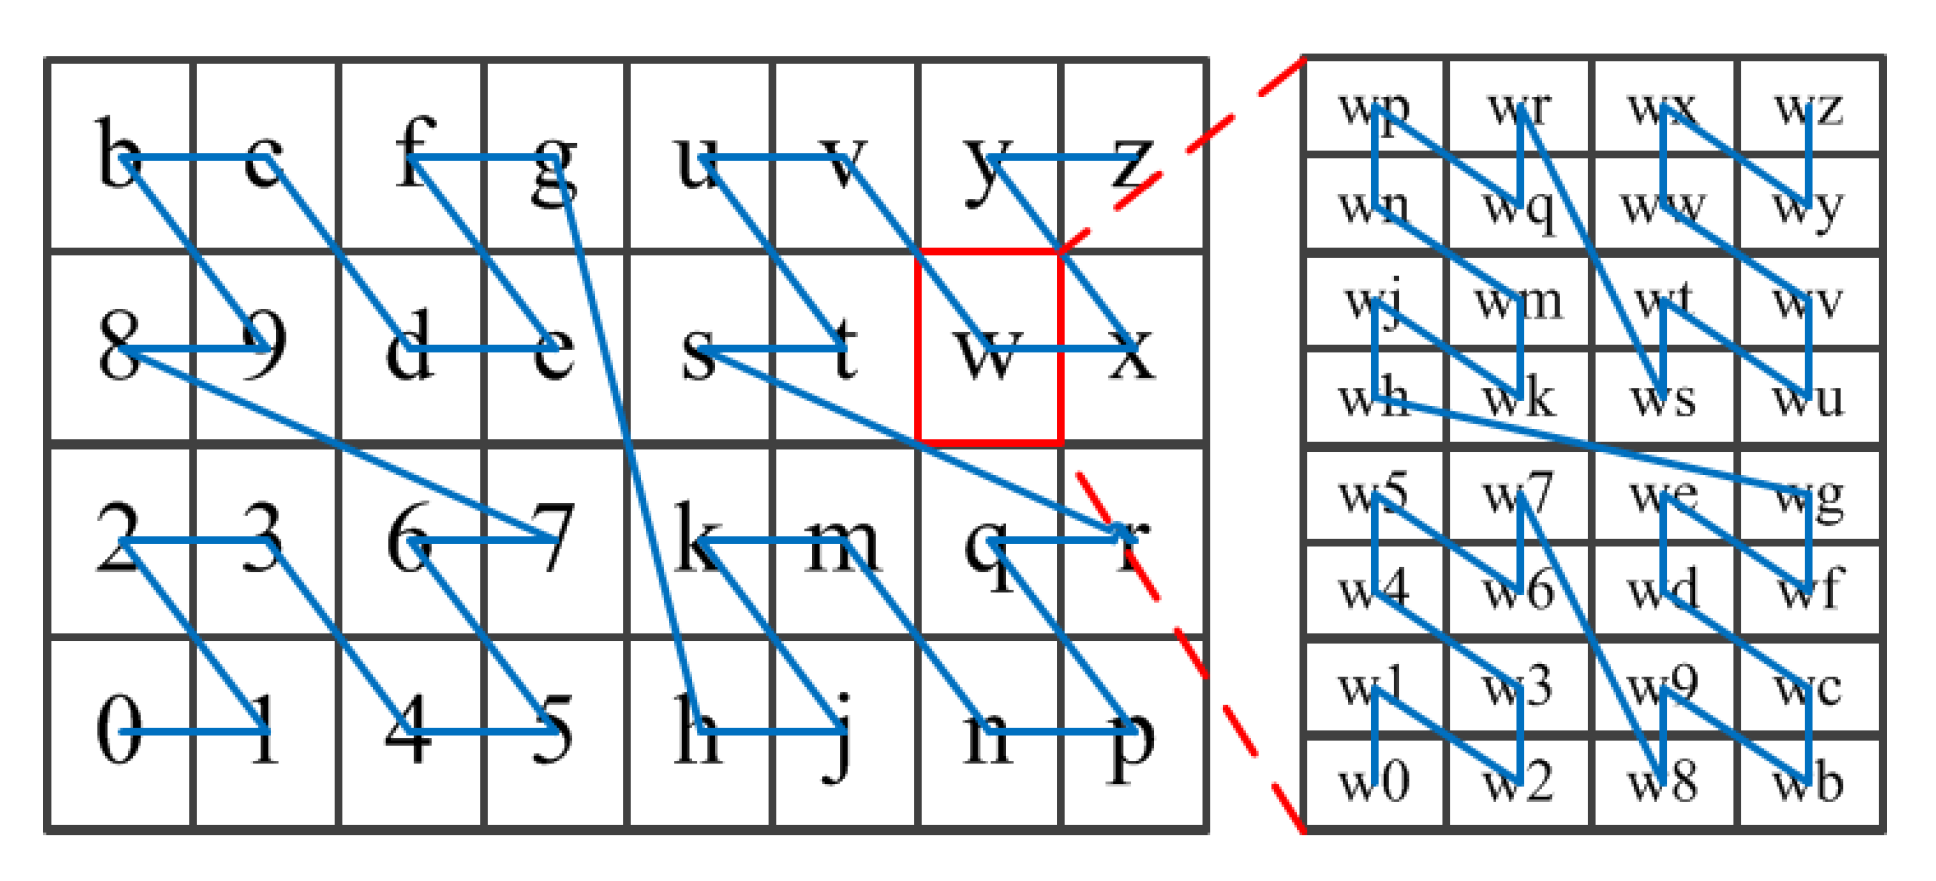
Geohash encoding converts latitude and longitude into a set of binary strings respectively and then crosses the two sets of strings bit by bit to generate a new set of binary strings. The sequence corresponding to even digits in the binary strings is longitude sequence, and the sequence corresponding to odd digits is latitude sequence. The new string is converted to decimal and encoded according to base32 (i.e., the range of values is 32 characters of the number 0–9 and the letter b–z (excluding a, i, l, o)), which can be used to represent two-dimensional arrays with one-dimensional arrays [22]. When Geohash first divides a map, longitude is divided into 8 sections , and latitude is divided into 4 sections , which forms 32 regions. After that, each region is alternately divided into or regions according to the alternating change of parity bits, which are indexed according to the Z-order curve [27]. The Geohash’s division process is shown in Figure 1.
Compared with the encoding method of Google Maps, Geohash converts two-dimensional spatial queries into one-dimensional string matching. With this advantage, Geohash can achieve fast query with time complexity of [22]. Compared with the encoding method of Bing Maps, Geohash encoding also uses latitude and longitude encoding to be bit-crossed and merged into one sequence storage; the difference is that Geohash uses Base32 encoding method, i.e., there are 32 different sub-sequences under the same prefix, while Bing Maps encoding method is Base4, i.e., there are only 4 different sub-sequences under the same prefix, so the Geohash query is more convenient. Literature [22] also shows that the Geohash-based spatial indexing algorithm has high-performance query capability for massive geographic data. At present, the mainstream map products, such as Google Maps and Bing Maps, adopt the latitude and longitude representation of geographic data coordinate positions, while the index adopts another method. According to the different encoding length, Geohash can represent the index range and coordinate of tiles simultaneously, which could realize unified encoding.
2.4. GeoServer and Leaflet
As a widely used webGIS server, GeoServer [28] has the functions of creating, storing, managing, and using geographic data, which can easily and quickly build geographic information services and realize the rapid sharing of spatial geographic information among users. GeoServer is an open-source geographic information network server developed based on Java. It is developed based on interoperability and supports any data source using an open-standard format. It complies with the OGC (Open Geospatial Consortium), WFS (Web Feature Service), and WCS (Web Coverage Service) Standard and provides high-performance compatible WMS (Web Map Service).
GeoServer is a more mature server than ncWMS [29], with better documentation, which allows users to easily modify the output format of the web feature service (used by the identity feature), and provides additional features for the vector layer, such as CQL(Contextual Query Language) filtering or the ability to request data in JSON format [30]. For these reasons, we chose GeoServer to provide GeoJSON data encoded by Geohash.
Leaflet [31] is one of the open-source JavaScript libraries for map, which is a widely used open-source software in the WebGIS development project on the B/S side. Developers can develop and expand based on the interface provided by the library, and realize the call of geographic information service and the basic operation of map data [32].
Leaflet’s powerful open-source library plug-ins involve all aspects of map applications, including map service, data provision, data format, geographic encoding, route search, map control and interaction, etc., and also support the implementation of custom controls. These controls enrich the functions of Leaflet [33]. This paper is based on the lightweight WebGIS library Leaflet to complete the function.
2.5. Comparison of Related Work
To provide a clear view on different methods for vector geographic data display in the literature, we compare them from five aspects of coordinate representation, indexing method, projection method, intermediate result caching, and scope of application. The intermediate result caching refers to the cache of relative position projection, which is detailed in Section 4. We select several latest and representative vector geographic data display methods for comparison, and the comparison results are shown in Table 1. In terms of coordinate representation, almost all of them are represented by latitude and longitude; in terms of indexing methods, except for the inverted index mode adopted by Zouhar et al. [9], all other methods belong to quadtree mode. However, due to the different encoding methods, there are different kinds of quadtree modes: from the perspective of the projection method, except for the method not explicitly stated in the article, the others use web Mercator projection; as far as the intermediate result caching is concerned, since there is no relative position projection method used in these methods, there is no function involving the relative position intermediate result caching; from the scope of application, except for Zouhar et al. which is only applicable to polygon data, and Ramos et al. [24], which is only applicable to polygonal lines data, other methods apply to all basic vector map data.
Our GeohashTile system uses GeoServer to set up the server data environment, providing GeoJSON data which are indexed and encoded by Geohash. We use Leaflet as the basis for the presentation of the client data to implement the GeohashTile calculation and the Geohash map data projection. As discussed in Section 1, there are many challenges to achieve these goals. The following will explain the GeohashTile system architecture in detail.
3. GeohashTile System Architecture and Server-Side Design
In this section, we focus on map data access using mobile devices in the GeohashTile system and elaborate on the overall structure of GeohashTile, and the configuration of server data service.
3.1. Architecture Overview
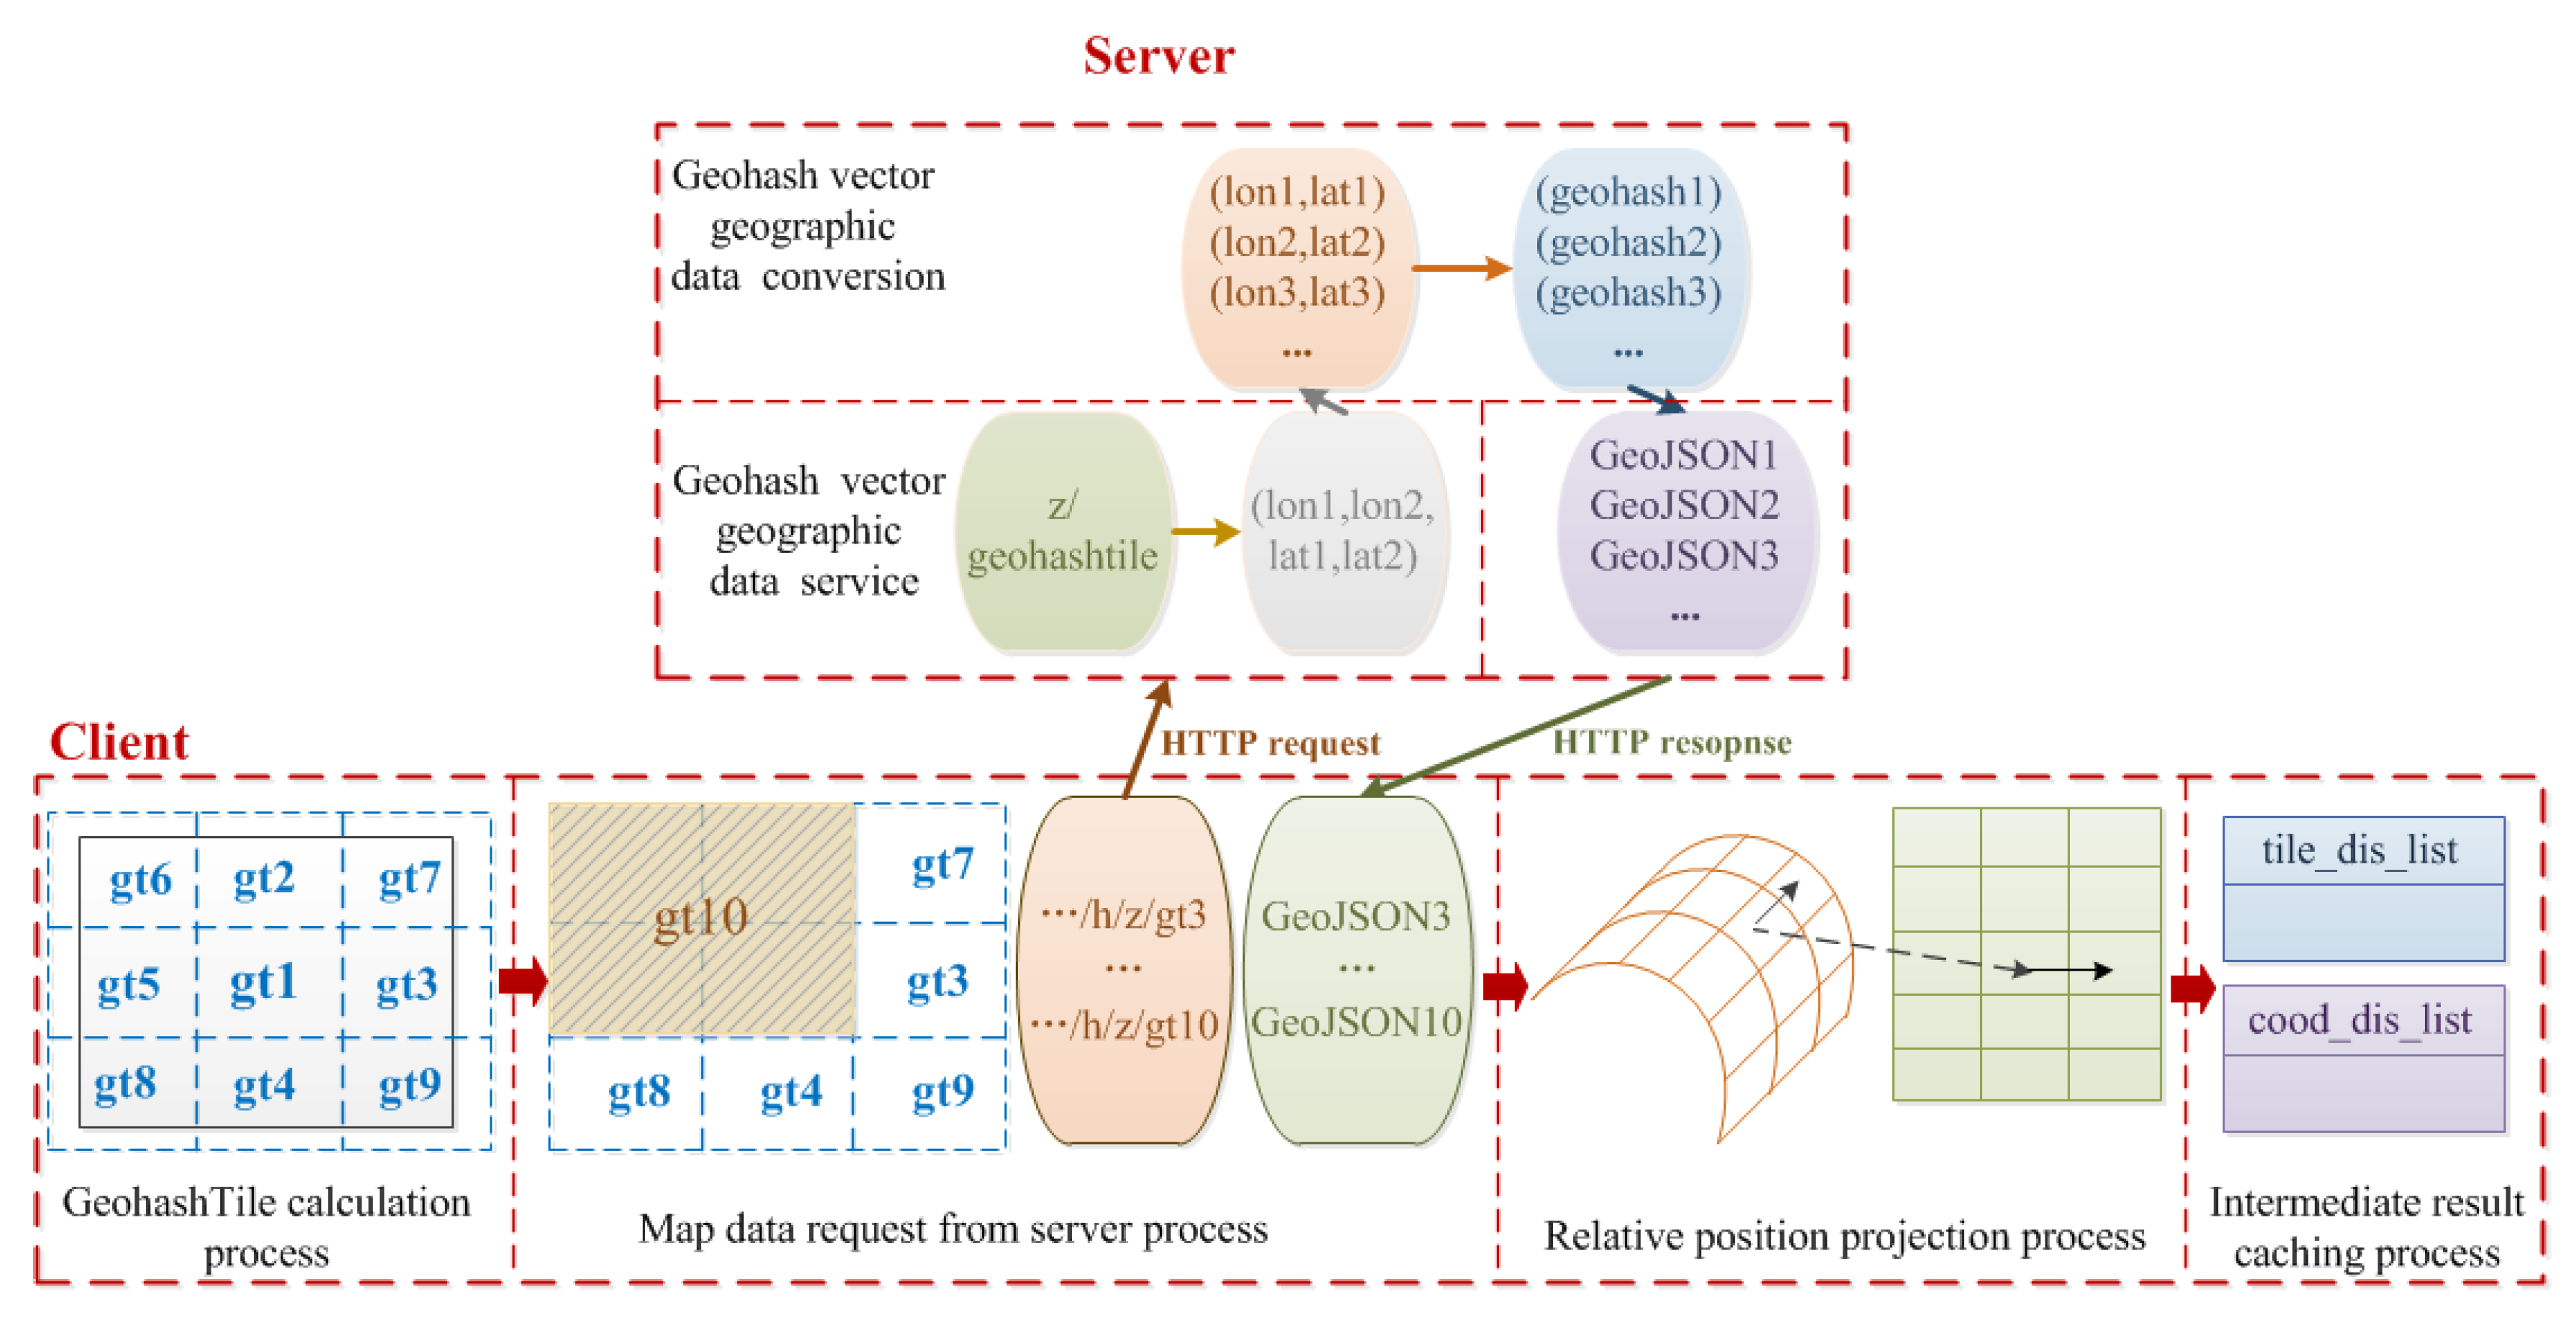
The GeohashTile system consists of two parts: the server side and the client side. The server side provides vector geographic data service, and the client side completes the display of Geohash vector geographic data, including the calculation process of GeohashTile, the request process of server map data, the projection process of Geohash map data and the intermediate result caching process. Figure 2 shows the functional framework of the GeohashTile system.
The work of the server is divided into two parts: Geohash vector geographic data conversion and Geohash vector geographic data service. The data conversion is responsible for converting the latitude and longitude coordinates of the original GeoJSON data set into Geohash encoded GeoJSON format data of a specified length corresponding to the zoom level, and reorganizing the data into GeoJSON format data for client access, which also defines the data access interface and sets data precision. After receiving the HTTP request sent by the client, the data service part will decompose the fields, query the corresponding Geohash encoded GeoJSON data and return it to the client through HTTP response, where the Geohash encoded vector geographic data service is provided by a GeoServer-based Web server. As a typical map server, GeoServer can convert vector data in OpenStreetMap (OSM) [34] into tile data for use by Web clients. The GeoServer-based map server consists of four main modules, namely the Apache HTTP server, the caching system, GeoServer-based Web server, and PostgreSQL-based data storage module. For specific settings, please refer to the literature [2].
The work of the client side is as follows. In the process of GeohashTile calculation, the first step is to calculate the size of GeohashTile corresponding to the zoom level z, named . The second step is to calculate the number of GeohashTile covering the scope of the screen, named . In addition, the third step is to calculate the neighbor GeohashTile from the center GeohashTile to get the GeohashTile queue, at the same time, two queues formed by the center point position and the relative pixel center point of each piece are calculated, which are called and . In the process of map data request from the server, before the request is sent out, the request merging must be completed first. Then the client sends GeohashTile index and zoom level z through HTTP request to request map data, and finally receives the GeoJSON data returned by the server. The relative position projection process first calculates the relative pixel distance list of the coordinate list of the geometric objects in each GeohashTile to the center point queue , and then calculates the screen coordinate position to the relative pixel center point queue . The intermediate result caching process is to save the relative position calculation results and reduce the amount of repeated calculations. Through the above four steps, we have implemented a direct conversion between Geohash and screen coordinates on the client. It is worth noting that the first three steps only need to be calculated during initialization, which do not need to be calculated repeatedly when only dragging in a small range.
3.2. Server-Side Design
The server-side configuration of the GeohashTile system includes two parts: Geohash vector geographic data conversion and Geohash vector geographic data service. The vector map data service has been briefly introduced in Section 3.1. In this section, we mainly introduce the Geohash coordinate conversion, data access interface configuration, and data precision setting involved in data conversion.
There are two coordinate conversion functions and one coordinate compression function on the server. The coordinate conversion function translates Geohash in the GeoJSON uploaded by the client into latitude and longitude coordinates and performs reverse conversion when it returns. The compression function can remove redundant Geohash accuracy based on zooming parameters.
3.2.1. Geohash Coordinate Conversion and Interface Configuration
The server needs to return GeoJSON map data based on the name of GeohashTile and zoom level z requested by the Web client. Figure 3 is a comparison of the data process of preparing the original GeoJSON and the Geohash encoded GeoJSON data by the server. We mainly completed Geohash coordinate conversion and data access interface configuration, including GeohashTile name conversion and geometric object latitude and longitude encoding. In the future, all the positional representations of the vector map data on the server can be converted into Geohash, so that Geohash is completely used as the unique representation of the coordinates.
The process of preparing the GeoJSON data in the server side:
- Tile data query. As shown in step ② of Figure 3, the server provides file system caching function, i.e., all the querying tile data will be cached. Compared to the query of the three fields x, y, z (x, y represents the tile encoding, and z represents the zoom level) in the processing of the original GeoJSON data, the processing of the Geohash encoded GeoJSON data only need to query two fields of and z, and thus the query efficiency is increased.
- Tile name conversion. As shown in step ④ of Figure 3, both GeoTile and GeohashTile need to decode the request field obtained from the client, namely the tile name, into a pair of latitude and longitude points representing the rectangular area where the tile is located when entering the server data request stage. There are two cases of GeohashTile name conversion according to whether there is a merged request for GeohashTile: One is that when there is no merge, the client requests a GeohashTile each time, and the name conversion process refers to the decoding process in Section 2.3; the other is that when the request is merged, each time the client delivers the request, there are two Geohash strings in the upper left corner and the lower right corner of the request area. This decoding process will be described in Section 4.2.
- Obtaining latitude and longitude map data. As shown in step ⑤ of Figure 3, we can obtain the geometric object represented by the latitude and longitude in the rectangular area. In this step, the two data acquisition methods are the same. Since the vector map stored in the server still uses latitude and longitude to represent the location of geometric objects, it is necessary to obtain the latitude and longitude map before subsequent conversion. Like most Online map service requirements, our system also follows the idea of LoD (Level of Detail). As the zoom level increases, the more granular geometric objects contained in the tile. The rules refer to the GeoTile. For example, the geometric objects with Category as Highway and Type as Primary will be displayed when the zoom level is 13–17; while the geometric objects with Category as Amenity and Type as Hospital will only appear at the zoom level of 15–17.
- The geometric object coordinate conversion. As shown in step ⑥ of Figure 3, this step is unique for GeohashTile. The obtained latitude and longitude coordinates of the geometric object (e.g., ) are encoded into Geohash coordinates (e.g., ) according to the encoding process introduced in Section 2.3.
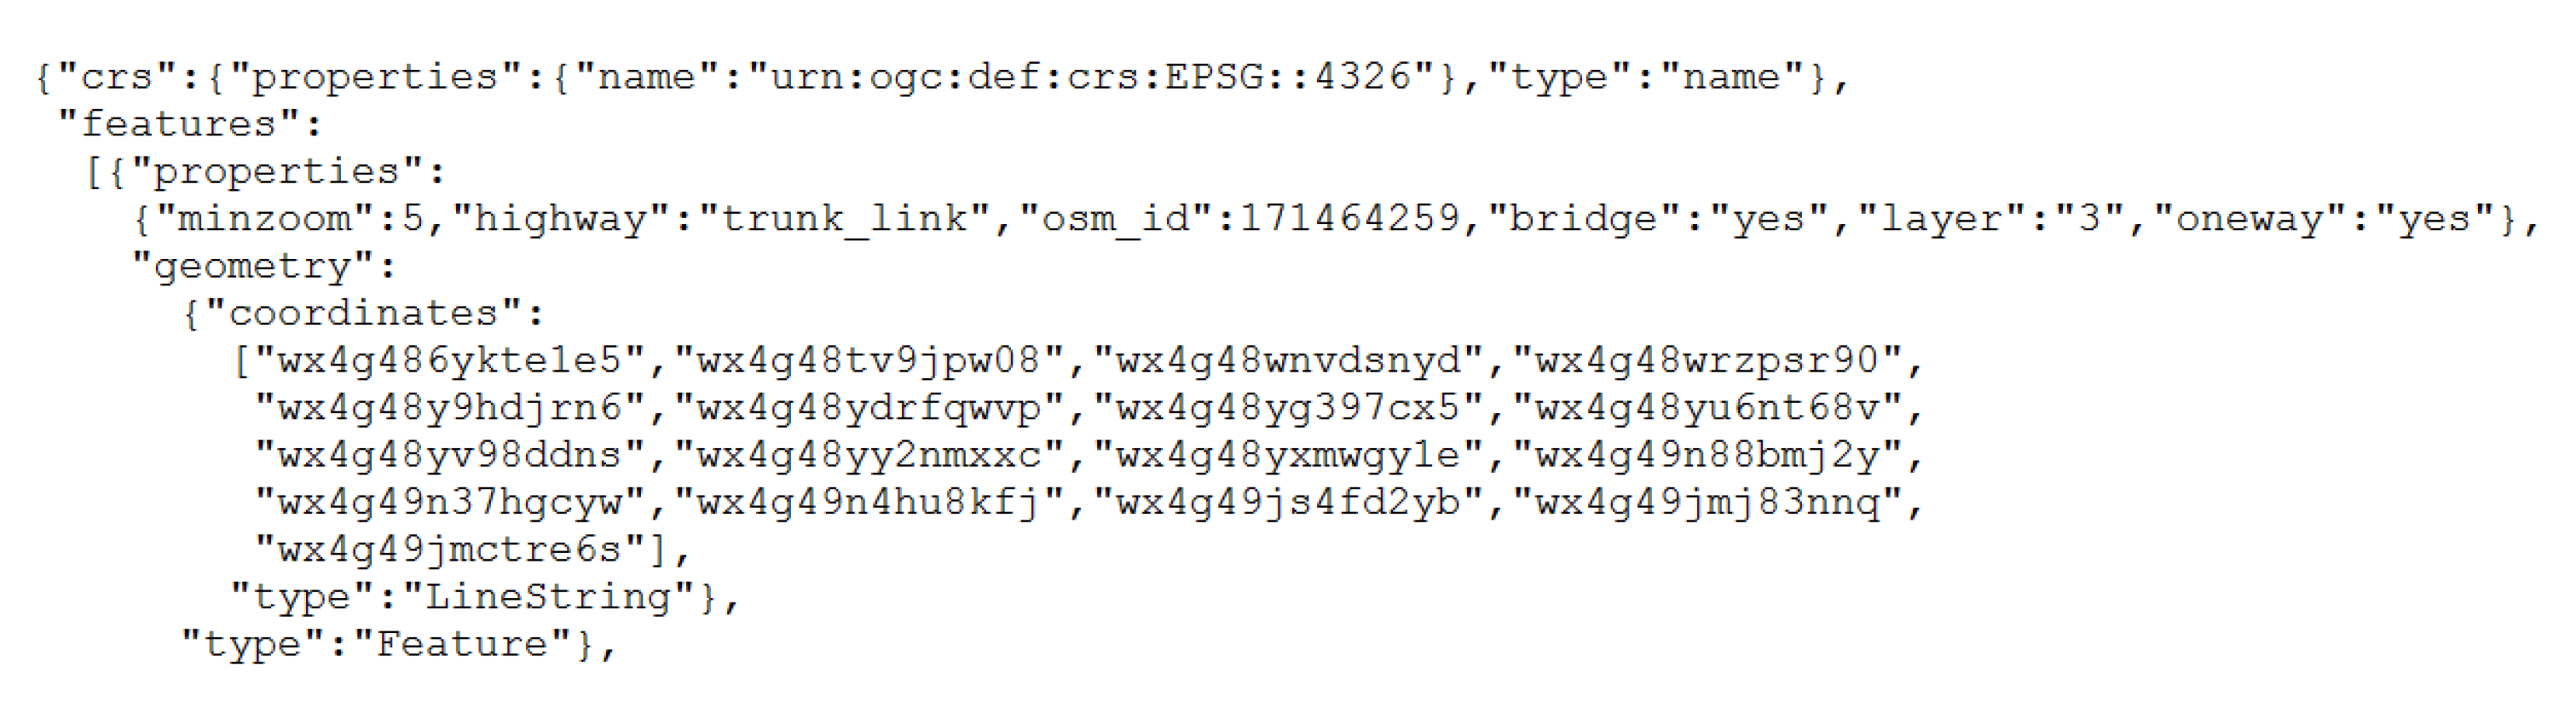
- Organizing into GeoJSON format. As shown in step ⑦ of Figure 3, the purpose is to return the GeoJSON data encoded by latitude and longitude or Geohash to the client. Figure 4 shows a set of GeoJSON objects encoded by Geohash. Compared to getting the original GeoJSON data directly, when the server provides GeoJSON encoded by Geohash, the process of converting the latitude and longitude coordinates of geometric objects into Geohash is added. Since this process is executed only once when the data is requested for the first time, subsequent access is directly read from the cache without excessive computation overhead.
Data access interface configuration:
GeoServer provides a method for publishing vector tiles but does not provide a method for publishing GeohashTile. To achieve the requirement of accessing GeoJSON data encoded by Geohash through URL, Apache is also required to add a new mapping relationship of the GeohashTile data, and mark Geohash as h. By adding a new mapping relationship, the web client can access GeoJSON data encoded by Geohash. Its access format is “”, where z represents the map zoom level.
3.2.2. Data Precision Setting
Geohash can represent different coverage depending on the length of the encoding. Similarly, we can also select different Geohash encoding lengths according to the map zoom level to achieve different granularity of geometric objects, i.e., data precision setting. Therefore, the amount of data storage is reduced while not reducing the precision of the screen-pixel coordinates of the map data. The equation of calculating the Geohash coverage latitude and longitude range can combine the Geohash encoding method taking the quarter or eighth of the latitude and longitude range alternately with the calculation method of zoom level and tile coverage latitude and longitude range in [34], as shown in Equation (1), where i is the encoding length of Geohash. The latitude and longitude values of the geometric object
coordinates in OpenStreetMap are taken to 7 decimal places. According to Equation (1), when the Geohash encoding length is 14 bytes, the latitude and longitude range it represents is × . Therefore, we chose the 14-byte Geohash to encode the highest precision geometric object coordinates. Table 2 shows the statistical results of the latitude and longitude values of the geometric object in the OSM and 14-byte Geohash decoding latitude and longitude values, which are all retained 7 decimal places. The latitude and longitude ranges are selected in four regions: Singapore, Hainan, Beijing and Heilongjiang. Table 2 shows that the latitude and longitude accuracy after Geohash decoding under this condition is 100%. Please note that here the Geohash data compression results are obtained with the highest latitude and longitude. In the next section, we will further examine the data compression under different accuracy requirements in conjunction with the GeohashTile calculation.
4. Client Data Display
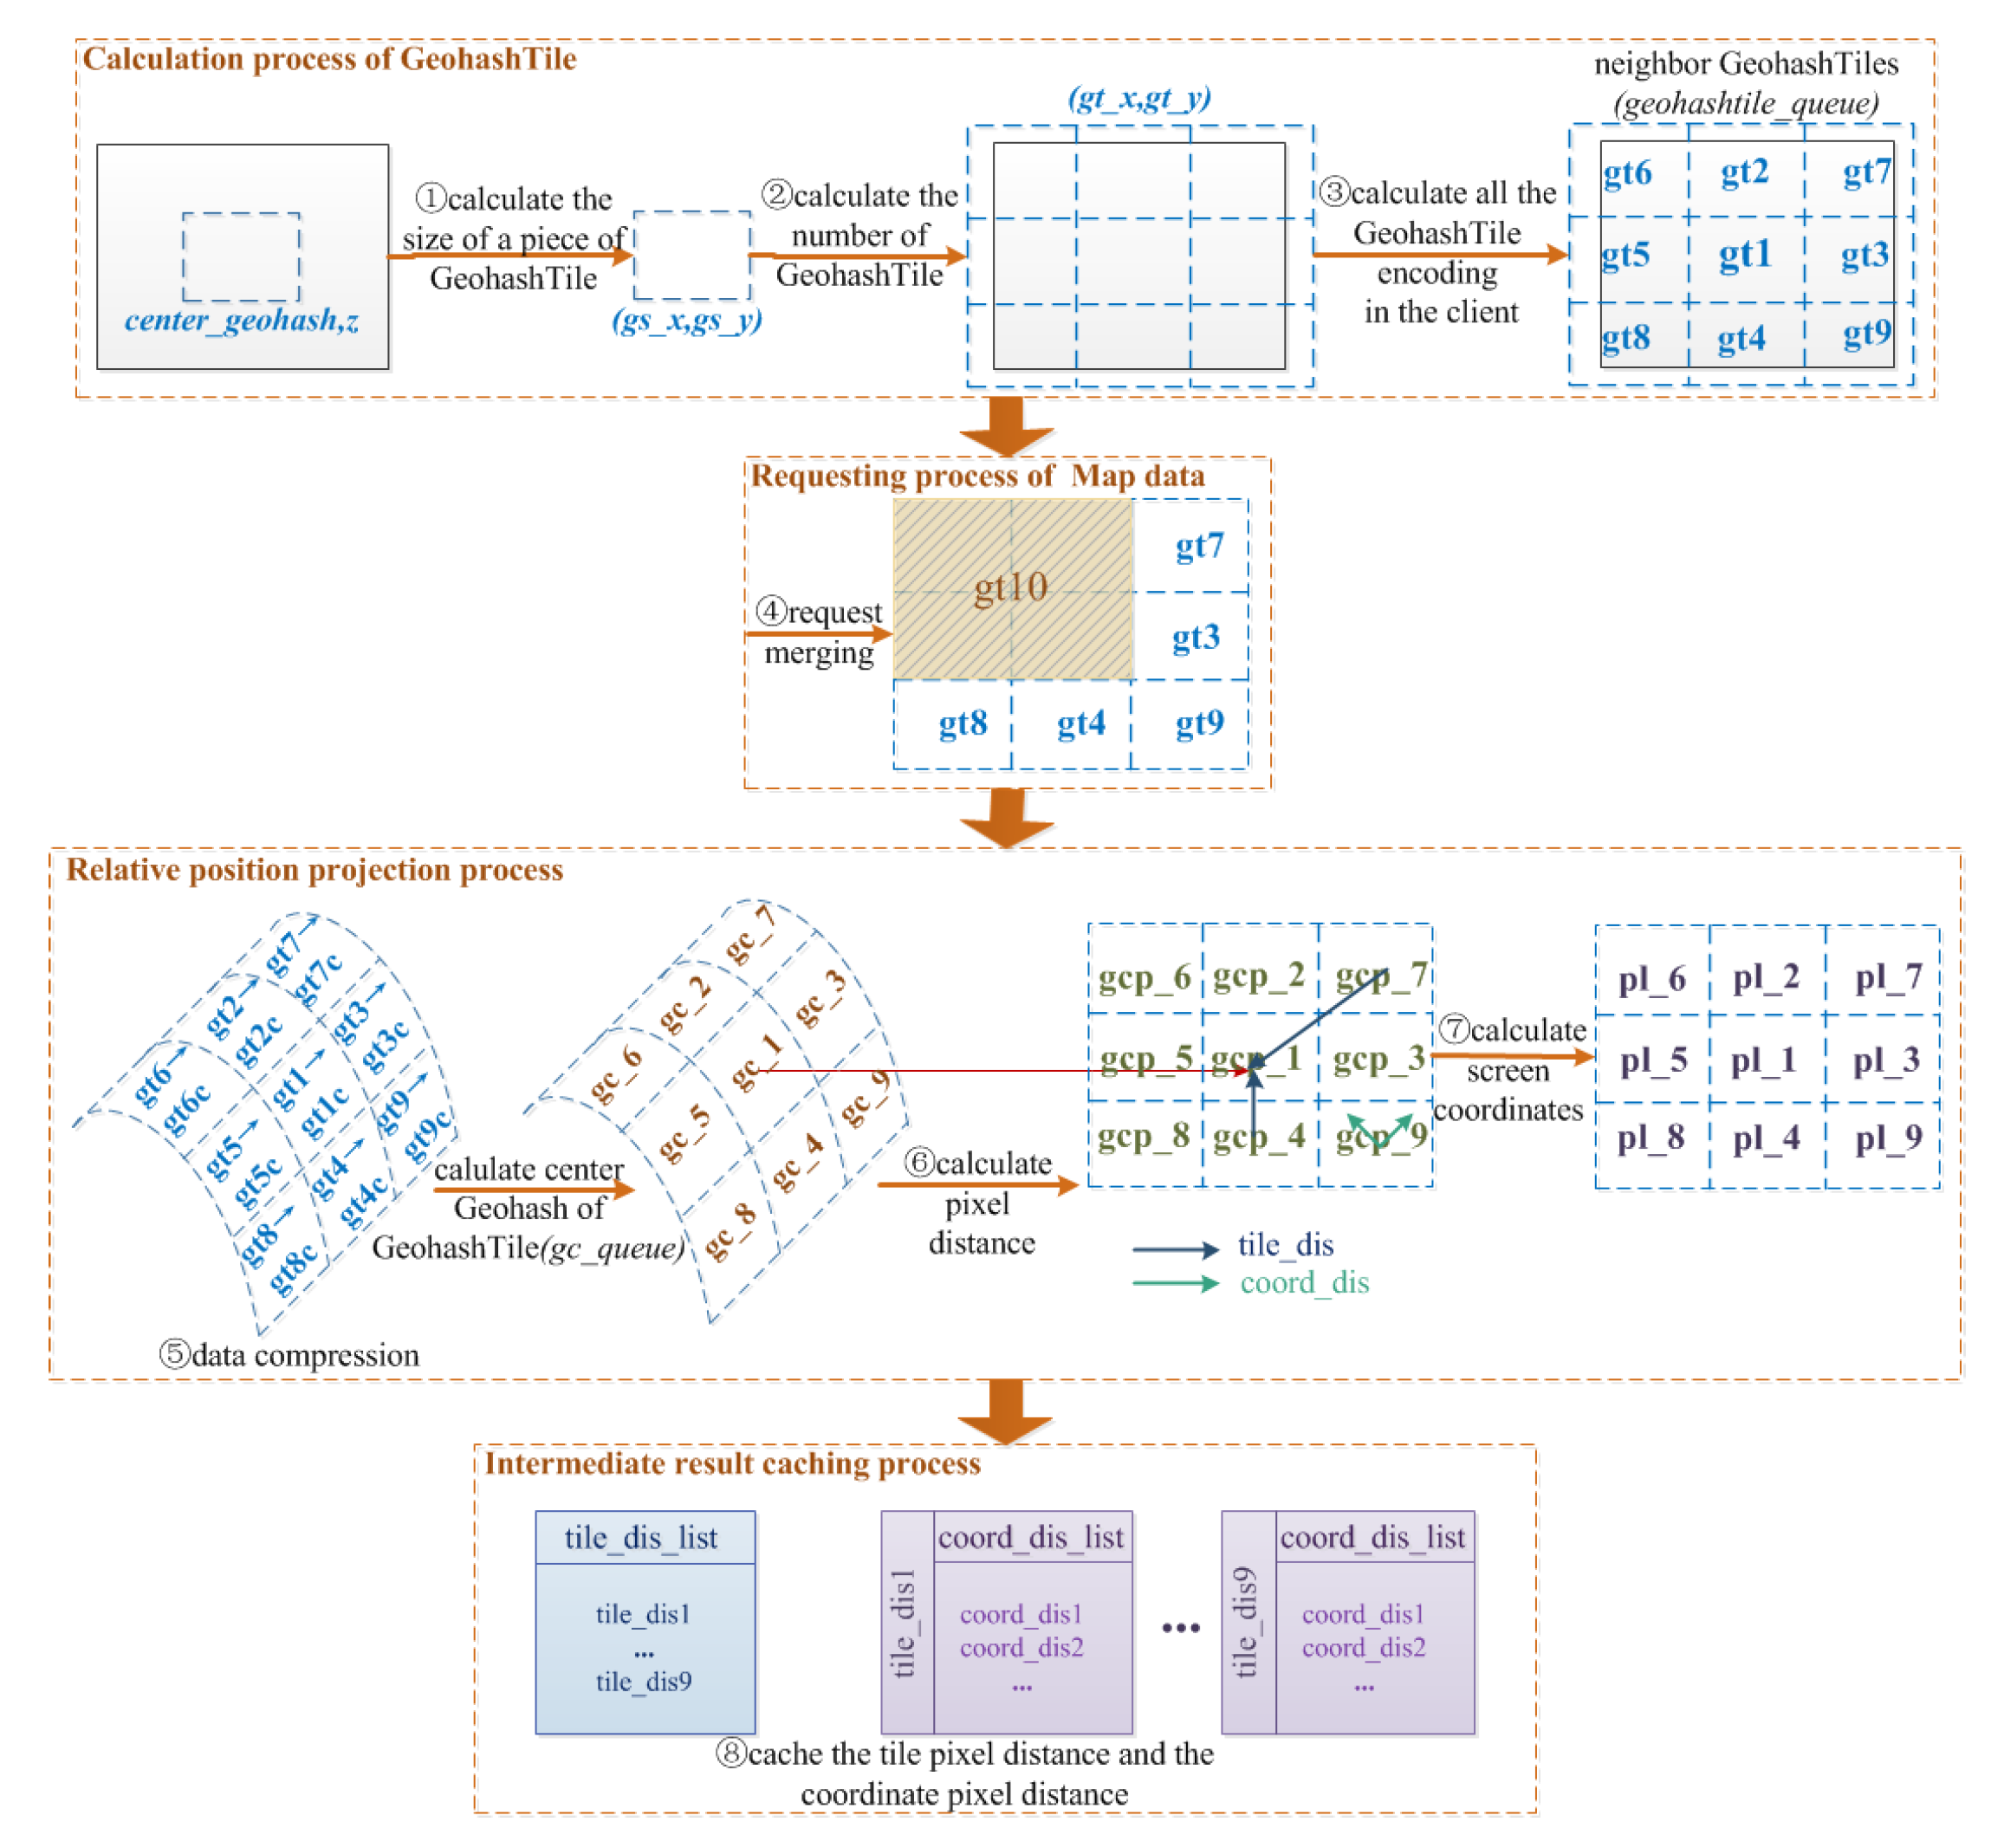
The server side is ready for data and needs the cooperation of the client side to complete the display work. In this section, we will show how the client can complete the process of displaying Geohash vector geographic data, as shown in Figure 5, including the four parts. (1) The calculation process of GeohashTile includes three steps: Calculating the size of a piece of GeohashTile, calculating the Number of GeohashTile in the client and calculating all the GeohashTile encoding in the client. (2) Merging process of map data requests sent to server, specifically, we can use the GeohashTile request merging algorithm to realize the merging of the requests to be sent. (3) The relative position projection process includes data compression, calculating pixel distance and calculating screen coordinates in three steps. (4) The intermediate result caching process is the process of reducing the repeated calculation by caching the tile pixel distance and the coordinate pixel distance in two relative position calculations. Next, we will introduce these four parts, respectively.
4.1. Calculation Process of GeohashTile
The calculation process of GeohashTile is the process of calculating the number of GeohashTile covered within the screen range and the GeohashTile sequence of corresponding encoding length by the given center position , zoom level z and screen size of client .
4.1.1. Calculating the Size of a Piece of GeohashTile
As shown in step ① in Figure 5. In the GeoTile system, the tile index follows the principle of the quadtree. At each zoom level, Equation (2) is used to calculate the number of tile encoding in the x-axis and y-axis directions of the tile coordinates, where z is the zoom level.
One byte of Geohash encoding represents one division, and a region is alternately divided into or sub-regions according to the alternation of odd and even bytes of the encoding. The calculation equation for the number of GeohashTile encoding in the x-axis and y-axis directions of the tile coordinates after each division is Equation (3), where l is the length of Geohash encoding.
When the Geohash division is associated with the zoom level in the GeoTile system, it is necessary to follow the principle that a tile can cover a complete Geohash tile (it is not allowed to cover only a part of one Geohash tile), and cover it with the shortest length of Geohash encoding to reduce storage. Therefore, we combine Equations (2) and (3) to obtain Equation (4) of the relationship between the Geohash encoding length l and the zoom level z, and the calculation result of l takes the smallest integer.
Regardless of Google Map, Bing Map, or other geographic information display systems, the tiles of each layer are fixed pixel size (the most common tile pixel size is ). As can be seen from the above, the tile size of each layer of Geohash is the same, and the tile size between each level changes regularly with the rules of division. Due to the inconsistent division size of the x and y directions, the Geohash tile is mostly rectangular. To make the GeohashTile approximate to the square pixel size of at each level and facilitate calculation, the pixel size of GeohashTile is set at zoom level 0 as . Combined with the calculation results of Equation (4), the size of GeohashTile under the corresponding zoom level z can be calculated by Equation (5). In Equation (5), z is the zoom level, and l is the Geohash encoding length. Since the division rules of Geohash in x and y directions are inconsistent, two different equations are needed to complete the calculation.
Table 3 illustrates the pixel sizes of GeohashTile calculated by Equation (5), where the zoom level is 1–18. In addition to being able to calculate the pixel sizes of GeohashTile with different encoding lengths, Equation (5) is also used to calculate the Geohash coordinate point conversion screen-pixel coordinates later.
4.1.2. Calculating the Number of GeohashTile in the Client
After getting the size of GeohashTile in the corresponding zoom level, the number of GeohashTile covered in the screen can be calculated by combining the client pixel size, so as to prepare for obtaining the corresponding map data from the server (as shown in step ② in Figure 5). Equation (6) is the equation for calculating the number of GeohashTile encoding in the x-axis and Y-axis directions of tile coordinates, where , are the pixel sizes of the client screen.
To ensure that the coverage of the screen is covered by GeohashTile, the calculation result is rounded up. This is also the reason the GeohashTile coverage shown in Figure 5 is beyond the screen.
4.1.3. Calculating All the GeohashTile Encoding in the Client
To get the corresponding map data from the server, we should calculate all the GeohashTile encoding in the screen coverage (as shown in step ③ in Figure 5). Since the center point GeohashTile encoding has been given, starting around the center point, we can calculate the neighbor GeohashTile of . According to the Geohash neighbor search algorithm, neighbor search can be divided into two groups: left and right neighbors as well as top and bottom neighbors. Starting from the position, non-repeating left and right neighbor are searched, and then non-repeating top and bottom neighbors of GeohashTile in are also searched, with all neighbor data stored in . To facilitate the subsequent calculation of the screen-pixel position of each Geohash coordinate in the GeohashTile, it is necessary to simultaneously calculate the center point position and the relative pixel center point of each GeohashTile. The process of searching all GeohashTile encoding in the client by the neighbor method is shown in Algorithm 1. When searching for neighbors, we should start with the last byte of Geohash encoding. Using Figure 1 as an example, if the current encoding is not the boundary value of the direction to be searched, it will be searched directly; if the current encoding is the boundary value of the direction to be searched, it will be searched reversely. In the searching process, the left and right neighbors and the top and bottom neighbors are carried out at the same time, which shortens the calculation time and improves the query efficiency.
| Algorithm 1 GeohashTile neighbor searching algorithm |
|
4.2. Merging Process of Map Data Requests Sent to Server
After getting the required GeohashTile sequence in the previous subsection, the client merges the request and starts sending an HTTP request to the server to request geographic information data in GeoJSON format. The request process is described in Section 3.2.1, Server Data Preparation (as shown in step ④ in Figure 5). This subsection focuses on the request merging process. Because each byte increase in GeohashTile encoding divides the region into 32 small regions, there are too many regions in one level. The more tiles in the same level, the more redundant data will be generated when the data is requested. For example, 35 GeohashTiles need to be requested in one request from the client, and the tiling order of these GeohashTiles in the client is shown in Table 4.
To reduce the number of data requests and data redundancy, a request merging process is added before requesting a GeohashTile. The request merging algorithm is shown in Algorithm 2.
| Algorithm 2 GeohashTile request merging algorithm |
|
The request merging algorithm adopts vertex-labeling to merge the small tiles with the number greater than or equal to 10 under the same division. We divide the larger number of rows or columns in the into two sets of sequences to be merged, and combine the two GeohashTiles in the top left and bottom right corner of the divided range to represent the merged range, thus reducing the number of data requests. As in the example of Table 4, according to the rules of Algorithm 2, each set of regions is after merging, i.e., the first combination is encoded as in the top left corner and in the bottom right corner with 15 GeohashTiles (i.e., the red part in the table), and the combined encoding is . In the second combination, the top left corner is encoded as and the bottom right corner is encoded as with 15 GeohashTiles (i.e., the blue part in the table), and the combined encoding is . After merging, you only need to request the merged GeohashTiles encoded as and and the remaining 5 unmerged GeohashTiles. When the server receives an encoding with the length of l (as in Table 4), it indicates a data request of normal GeohashTile. However, when the encoding length is (as in Table 4), it indicates that it is a merged request, and then the request is decomposed into two parts of equal length for subsequent data requests. It is worth noting that the merged request data does not increase or even decrease the data amount, which will be analyzed in detail in the experimental analysis of Section 5.
4.3. Relative Position Projection Process
All map data needs to be projected from spherical data to two-dimensional plane data for display. The Geohash map data’s relative position projection process described in this section is the process of projecting Geohash encoded map data directly into screen coordinates using a relative position calculation method. The specific calculation steps are as follows:
4.3.1. Data Compression
In Section 3.2.2, the data precision is only calculated from the highest precision latitude and longitude. According to Equation (5), when the projected coordinate point is within a pixel range, the encoding length can be determined to meet the accuracy requirements of the current zoom level, and data compression can thus be achieved (as shown in step ⑤ in Figure 5), i.e., we should make Equation (5) satisfy Equation (7). Equation (8) can be further derived from Equations (5) and (7). It is worth noting that since this is used to calculate the relationship between the encoding length and the zoom level of a geometric object’s coordinate points, the Geohash of the same encoding length represents a larger range as the latitude increases, whereas Equation (8) only applies to calculations near the equator.
Therefore, it is necessary to modify Equation (8) to make it suitable for calculating the length of Geohash encoding in the whole latitude range. According to Equation (8), when the zoom level is 1, the shortest Geohash encoding length is 4, so only the distance and the precision relationship of the first 4 bytes encoding is considered in the precision calculation.
Here we have two definitions to help the explanation.
Definition 1.
Encoding distance (d). Distance between the encoding of Geohash’s specified byte and the equatorial encoding of the same column.
Definition 2.
Geohash resolution. The pixel distance when encoding distance of Geohash specified byte is 1.
For example, when calculating the encoding distance of , the equatorial encoding of the column in which the first byte is , so is 0, and the Geohash resolution of this byte is 1. The equatorial encoding of the column in the second byte is , so is 7, and the Geohash resolution in this byte is 1/8. The equatorial encoding of the column where the third byte is , so is 0, and the Geohash resolution on this byte is . The equatorial encoding of the column where the forth byte is , so is 3, and the Geohash resolution on this byte is . According to the Geohash encoding rules shown in Figure 1, the encoding distance can be quickly obtained by looking up the table. Equation (9) is the encoding length calculation equation. In Section 5, the calculated and measured results will be analyzed in detail.
4.3.2. Calculating Pixel Distance
The GeoJSON obtained in the previous section contains a series of Geohash encoded that represents the coordinates of geometric objects, i.e., target points. The first step in implementing projection is to calculate the relative pixel distance from these target points to the center point. There are two relative distance calculations (as shown in step ⑥ in Figure 5). The first is tile pixel distance, which is the relative pixel distance from the GeohashTile center point to the actual center point. The second is the coordinate pixel distance , which is the relative pixel distance from the coordinate point of the geometric object to the center point of the GeohashTile. Algorithm 3 is the pixel distance calculation algorithm from the target point to the center point, which can be used for the above two calculations. Where is the current target Geohash to be calculated, one byte at a time, calculated from high to low. Since the Geohash division is done alternately by and , the position order of the two neighbors is different. uses a two-dimensional array to represent the relative position of Geohash. The current character position i of Geohash represents the division, and the division type is obtained by calculating the parity of i. We then look up the column where the target value is located to find out which set of values are currently used to complete the calculation. , record the relative distance of the current character from the center point, respectively. At different zoom level, the pixel distance in x and y direction represented by each byte of Geohash encoding can be calculated by substituting the calculated result of encoding length in Equation (9) into Equation (5). Since the pixel distance can be reused after being calculated once, the calculation result can be stored in an array, and only the array needs to be queried later. and respectively record the pixel distance between the current Geohash encoding data and the center point.
| Algorithm 3 Pixel distance calculation algorithm |
|
4.3.3. Calculating Screen Coordinates
Calculating the screen coordinates is the last step to show the Geohash encoded target points on the screen (as shown in step ⑦ in Figure 5). The relative pixel position from the target point to the center point has been obtained previously. Here, we only need to convert the relative pixel position to the actual pixel position, i.e., calculate the screen coordinate position of relative pixel distance according to the center point of the pixel queue . Equation (10) is the calculation equation of the actual pixel position of the target point, where is the actual center point pixel position of the client screen.
4.4. Intermediate Result Caching Process
Because GeohashTile uses the relative position projection method, the positions of all tiles and the positions of geometric objects are recorded in relative positions. It is possible to improve the calculation and rendering efficiency by caching the intermediate calculation results. According to the previous calculations, the tile pixel distance and the coordinate pixel distance in the two relative position calculations can be cached as intermediate results (as shown in step ⑧ in Figure 5).
The intermediate result caching process includes two parts: before and after the map position panning occurs on the client side. Before the map position panning, the tile pixel distance and the coordinate pixel distance need to be recorded. After the map position panning, it is necessary to recalculate , as well as calculate the of the new added tiles.
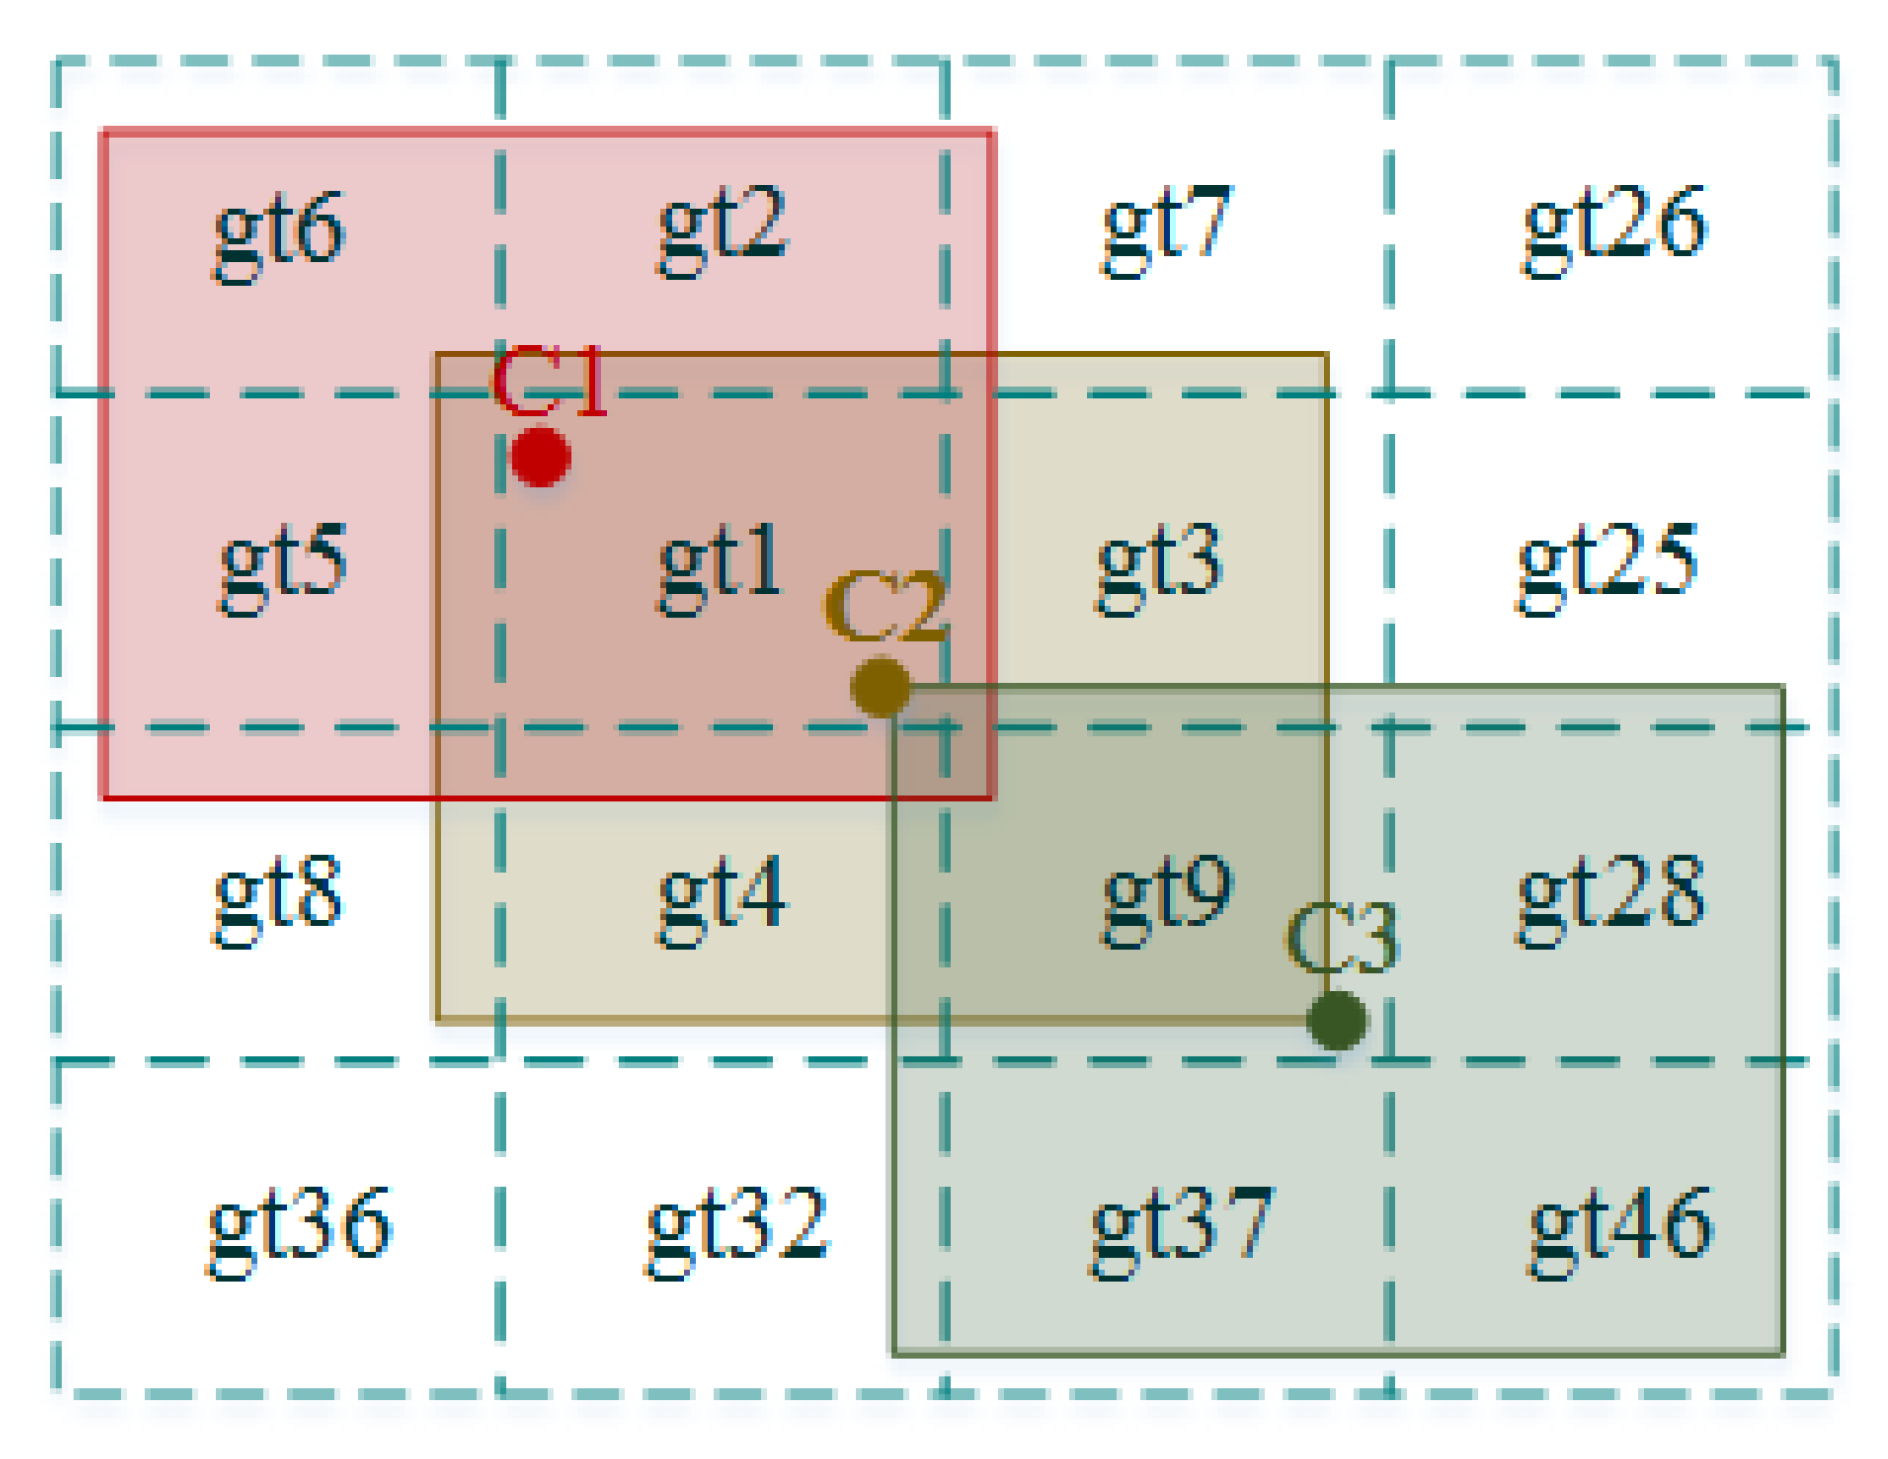
Figure 6 is a schematic diagram of client position translation, where – are GeohashTile numbers, and , , and represent the center point position of the client’s three times position movements. Taking Figure 6 as an example, we summarize the steps of the intermediate result caching as follows:
Calculating Geohash coordinate precision. As shown in Figure 5, a tile pixel distance list and a coordinate pixel distance list are established. When the client first loads GeohashTile, the calculation result is stored in the corresponding list. Figure 6 records the coordinate position of the center point , and the from the center point of – covering the client to C1, as well as the of the coordinates of each geometric object in the tile to the center point of the tile.
When the map position pan occurs on the client side, if no new tiles are added, it is not necessary to calculate the repeatedly, but only the relative position of needs to be calculated. In Figure 6, after the first translation, the center point position is . At this time, and the center point before the translation are in the same GeohashTile, and the tiles covering the client is still – with no new tile added. Therefore, we only need to calculate the pixel distance of and , , and then calculate the new .
When the map position of the client is panned, if new tiles are added, the relative positions of and need to be recalculated, while the relative positions of the original tiles only need to be recalculated for , which greatly reduces duplicate calculation. In Figure 6, after the second panning, the center point position is . are removed from the original tile covering the client, and are added. Now, we need to calculate the pixel distance of and . For the original tiles, we only need to update ; and the newly added tiles need to recalculate the and values.
When the map is zoomed on the client, the contents of the list will be cleared, and the new calculation results will be recorded.
To quickly locate the tile list as the client map position pans, we also need to cache the tile where the center point is located. When the map is loaded by Leaflet, the parameters that need to be initialized are the coordinates of the center point and the zoom level. After the center point’s Geohash is given, in combination with the zoom level, the first few bytes of the encoding are taken as the tile encoding. The number of changes of the center tile each time the client panning is much smaller than the number of changes of the center point coordinates, so it can further reduce the amount of calculation.
5. Experiments and Evaluation
To assess the effectiveness of the proposed GeohashTile, we evaluate it with on the real data from OpenStreetMap. In this section, we first introduce the experimental environment and dataset. We then compare and analyze the GeohashTile and the state-of-art latitude and longitude tile GeoTile [2], which is also based on Leaflet.
5.1. Experimental Setup and Dataset
Our experimental environment includes the server environment (GeoServer) and the client environment. The physical environment built by GeoServer is a virtual machine with 2 core Intel (R) Xeon (R) CPU e5-26200 @ 2.00 GHz processor and 2 GB memory. The architecture is based on Ubuntu OS 14.04 and a series of open-source software packages. It combines Apache HTTP server and Web server to realize server functions. The client environment is a laptop with Windows 7 64-bit operating system, Intel Core i5-4690K 3.5 GHz processor and 8 GB memory, which uses the Google Chrome browser to display Leaflet map. All the original geographic data comes from OpenStreetMap. Here we select four regions with different latitude distributions in Singapore, Hainan, Beijing and Heilongjiang for performance analysis.
Leaflet [31] is the main open-source JavaScript library for mobile interactive maps. Its JS file is only about 38 KB, and it has all the mapping features most developers need. The leaflet is widely used due to its excellent mobile interactive features and lightweight advantages. Therefore, when we analyze the proposed method, we compare the Geohash vector map display system based on Leaflet (i.e., GeohashTile) with the same latitude and longitude tile display system based on Leaflet (i.e., GeoTile).
5.2. Performance Analysis
In this section, we implement the GeohashTile prototype system and perform experiments from multiple perspectives. We analyze and calculate the Geohash encoding length and precision at different zoom levels. At the same time, we quantitatively analyze the amount of data transmitted by the client when loading the data of GeoTile, GeohashTile without merging (GeohashTileNoMerging for short), the fully optimized GeohashTile (GeohashTileFull for short) provided by the GeoServer, as well as the loading time of the GeoTile, the GeohashTile without the intermediate result cache (GeohashTileNoCahcing for short), and GeohashTileFull.
5.2.1. Geohash Encoding Length and Precision
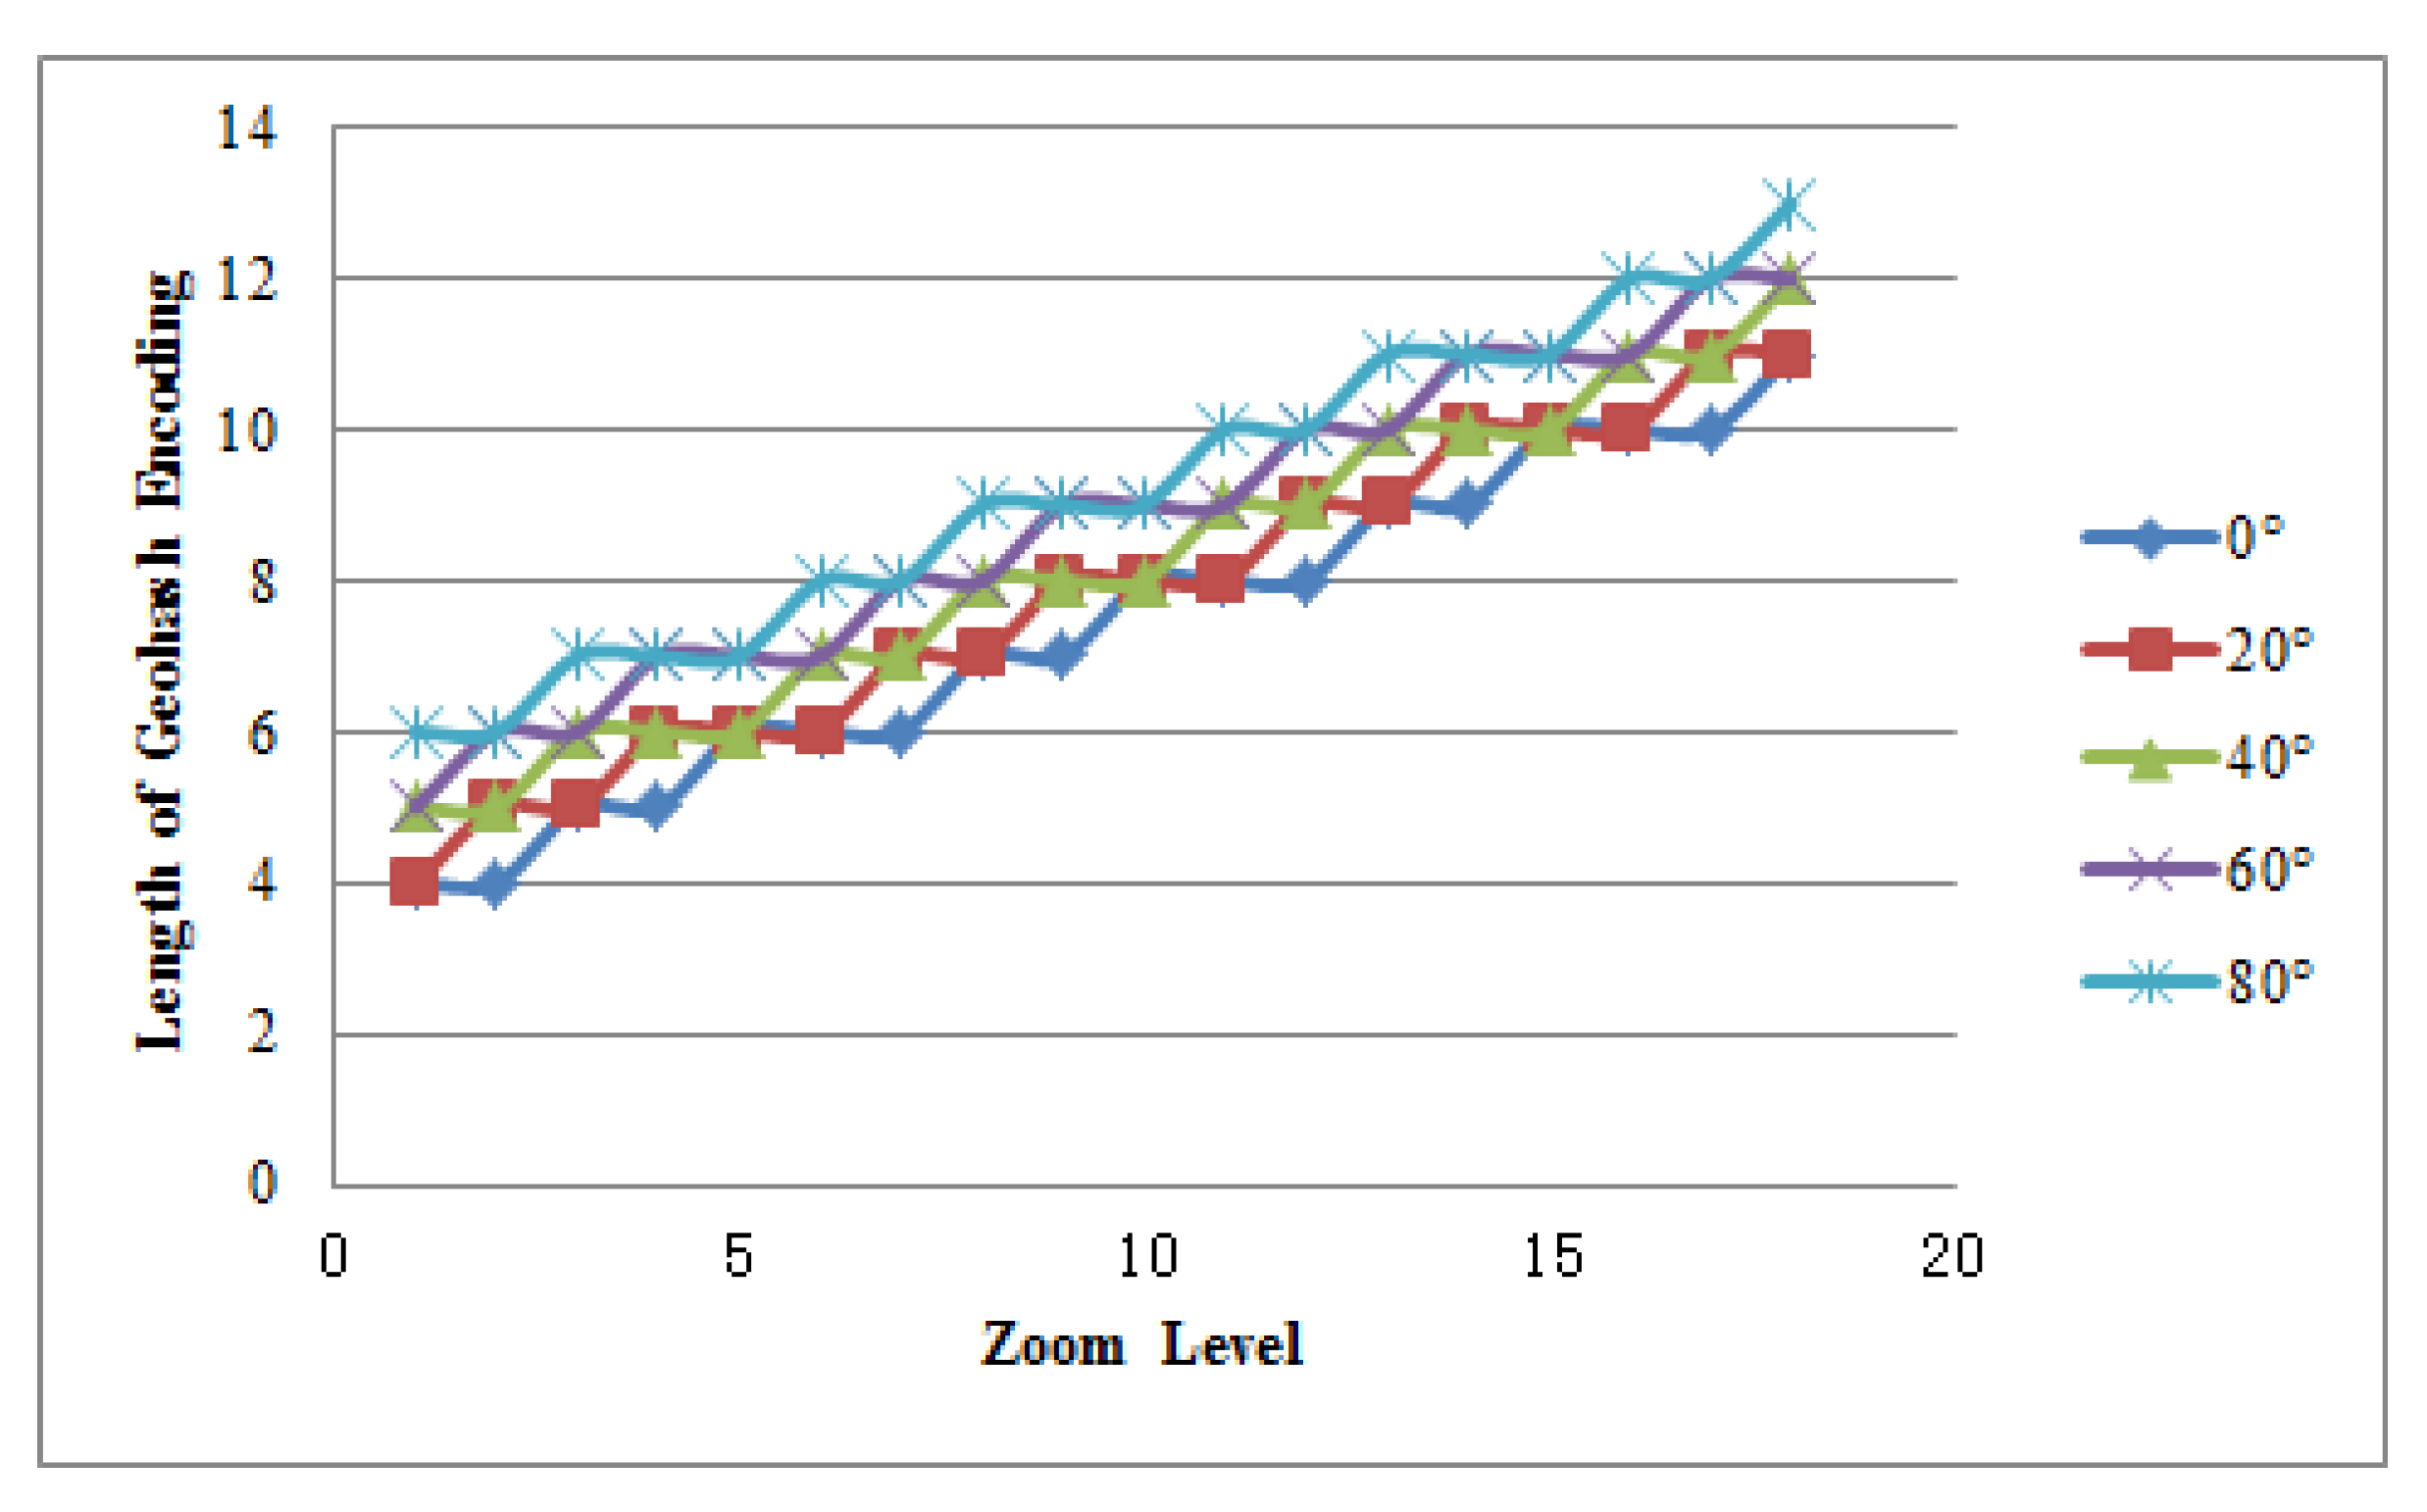
How to calculate the Geohash coordinate precision is introduced in Section 3.2.2 In this section, we will analyze the calculation results of Equation (9). Figure 7 shows the results of geohash encoding length and zoom level calculated using Equation (9). Since the closer to the poles, the larger the area represented by the Geohash of the same encoding length. For the convenience of calculation, the same longitude and different latitude values are used here. Figure 7 shows the result of selecting the Geohash encoding length of the 5 sets of latitude and longitude areas with the longitude of , and a latitude range of 0– with interval when the zoom level is 1–18. As can be seen from Figure 7, with the zoom level increases, the Geohash encoding length increases. At the same zoom level, the lower Geohash precision is required near the equator than near the poles. Under the same precision requirement, the length of Geohash encoding increases with the increase of latitude. The reasons are as follows: (1) The same Geohash covers the same latitude and longitude range instead of the same area; at different latitudes, the actual area covered by the Geohash of the same length are different, with a large area near the equator and a small area near the poles. (2) In terms of latitude and longitude, the distance of screen coordinates between the equator is short and the distance between the poles is long in the range of two sets of screen coordinate points with different latitudes and the same longitude interval. On the contrary, when the actual area is the same, the length of the corresponding Geohash encoding near the equator is shorter than the length near the poles. (3) Like GeoTile, each piece of GeohashTile specifies a pixel size represented when making screen projection, such as a piece of GeohashTile represents pixels at level 0. When the pixels of a piece of GeohashTile is fixed, the smaller the area it represents, the higher the precision required to more accurately represent the position.
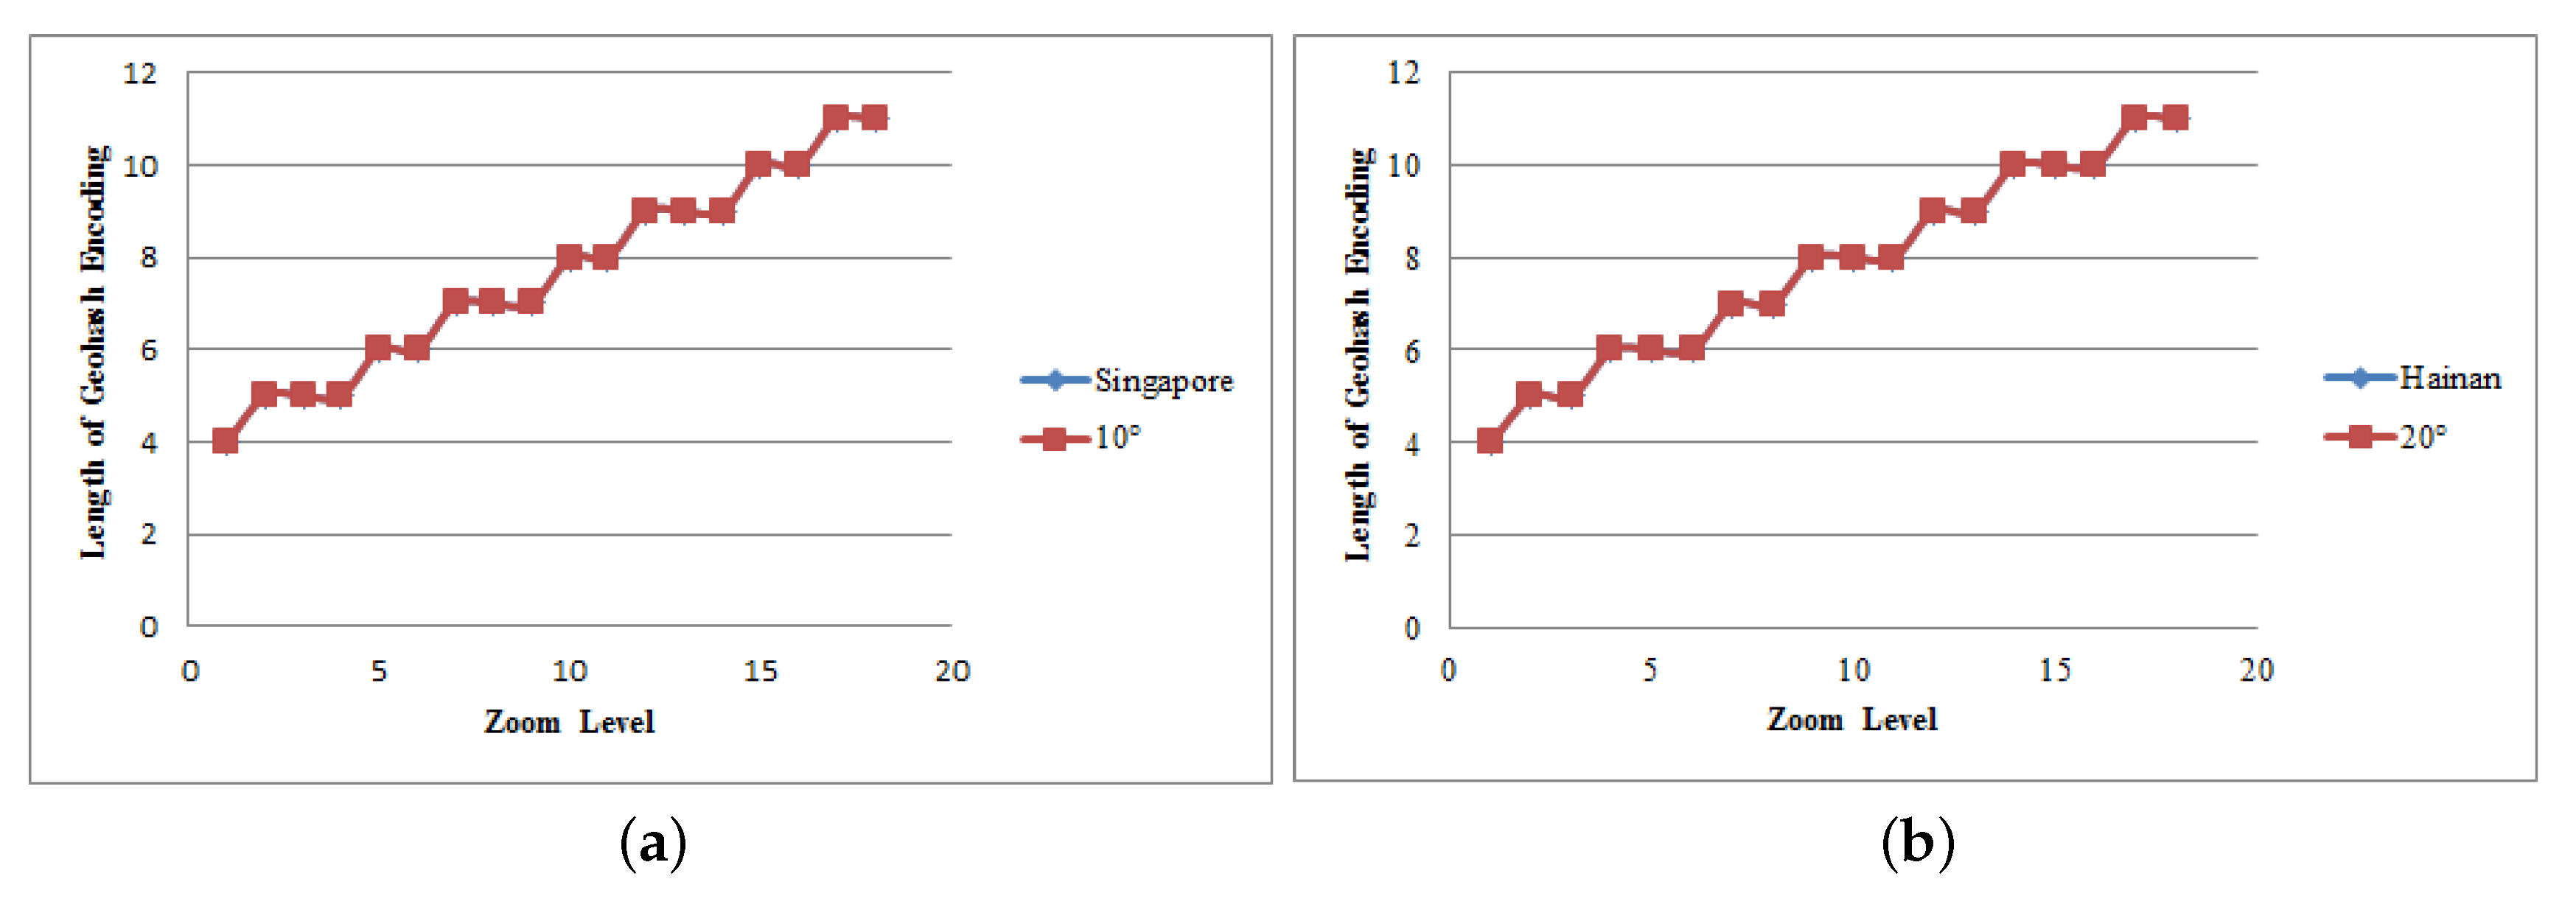
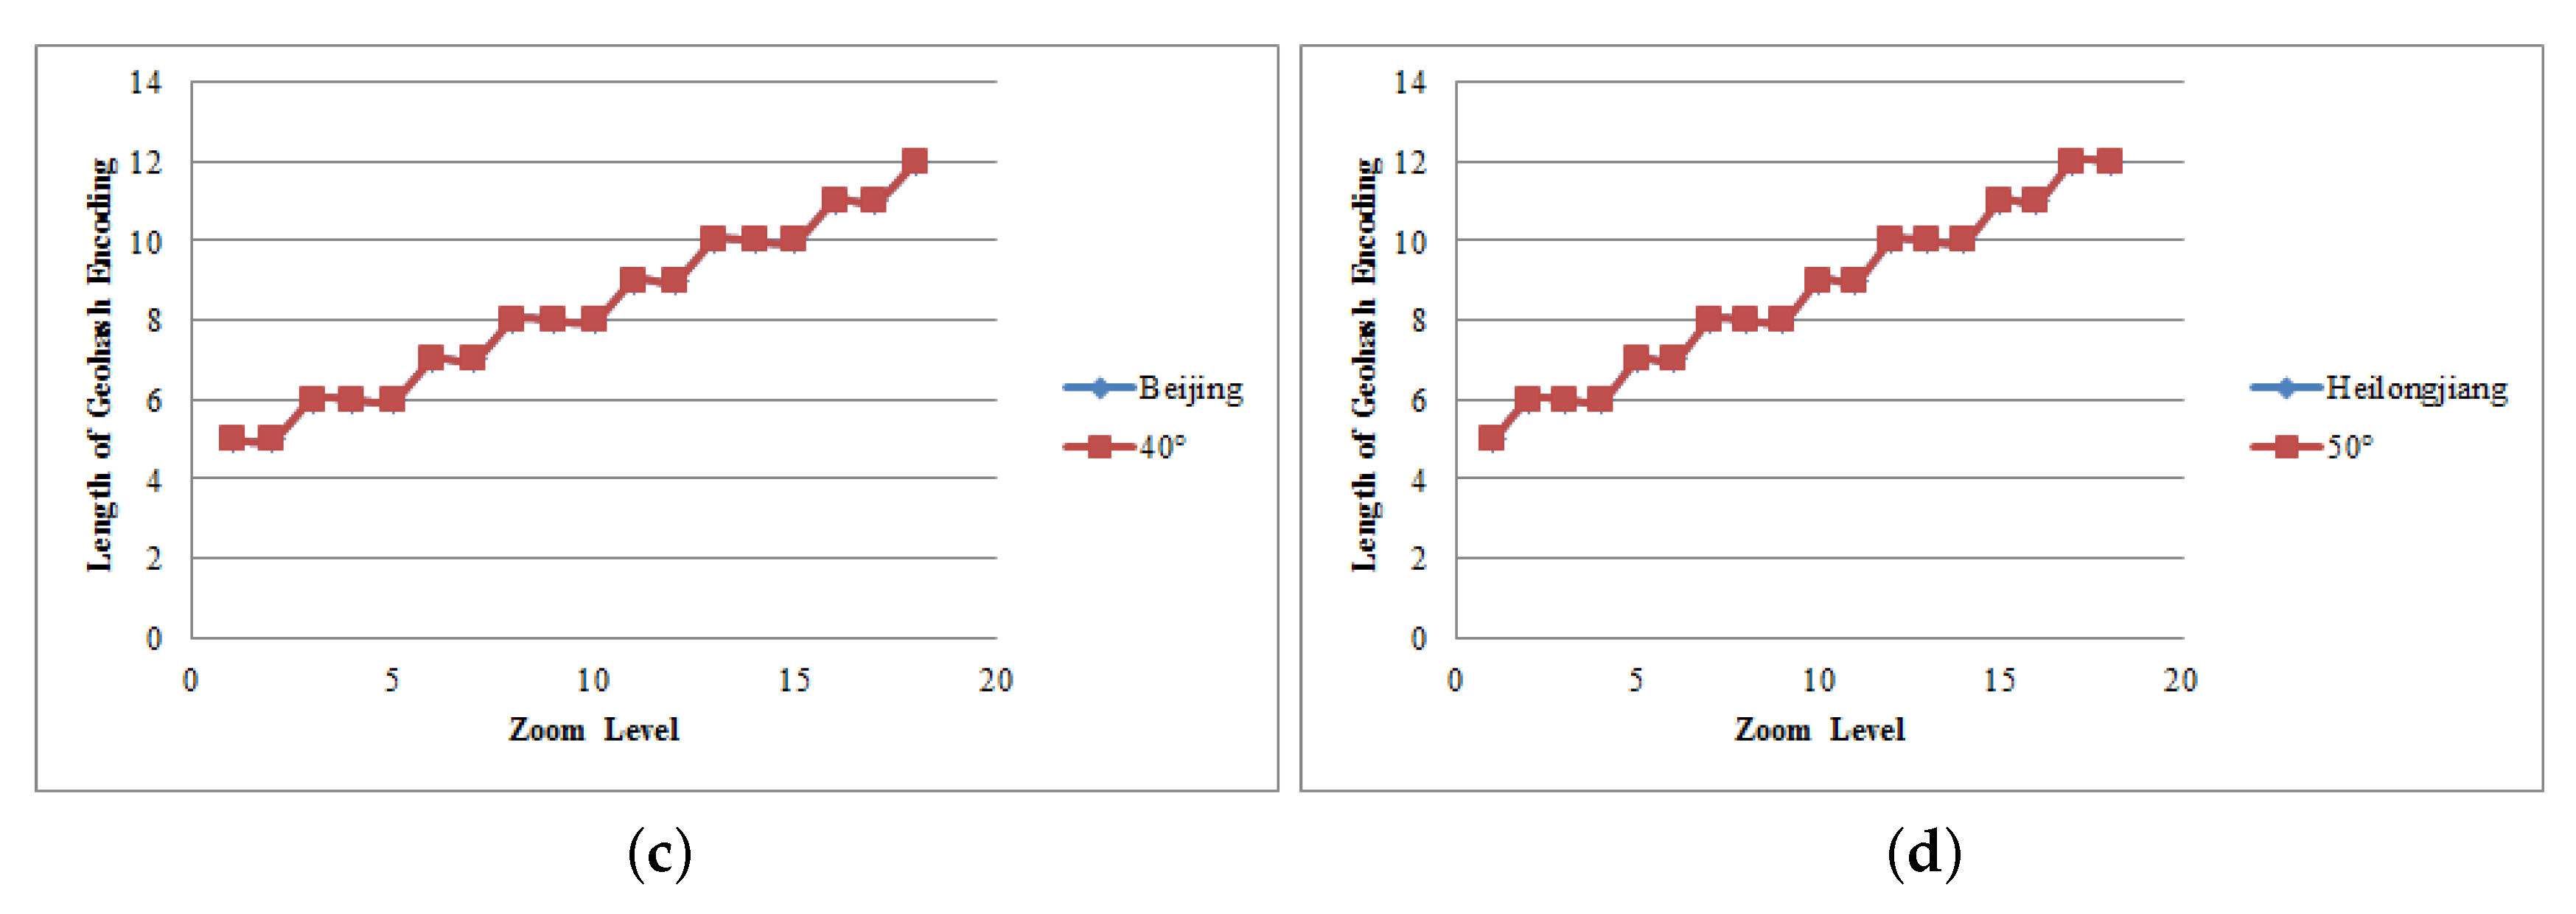
We also compare the actual statistical results of Geohash encoding length between the actual statistical and the corresponding latitude range in the four regions of Singapore, Hainan, Beijing and Heilongjiang when the zoom level is 1–18 show in Figure 8. The statistical result here is the result of the comparison with the screen coordinate position of the highest precision 14-byte Geohash encoding. The latitude ranges of the four areas are selected from the , and consistent with the calculation range. As can be seen from the Figure 8, the actual test results are consistent with the calculation results of the corresponding latitude range. Thus, when Geohash is used to represent the coordinate position of the geometric objects on the map, it is not necessary to use the 14-byte length but to select the appropriate length according to the latitude position and zoom level, which indicates that Geohash can realize multi-granularity data representation and data compression without loss of display effect. According to the results of our experiment, only 12 bytes Geohash is needed at most to meet all the experimental precision requirements.
5.2.2. Amount of Data Transmission
The first evaluation metric is the amount of data transmission since it has a direct impact on loading time. The counted GeohashTile data here is the Geohash data with encoding length according to the highest precision requirements shown in Figure 7. The number of tiles that need to be loaded within the same client screen range is also an important factor affecting loading time. Although the transmission of a tile with a small amount of data is shorter in time than a tile with a large amount of data, if the tile division is too small in the same display range, the number of tiles transmitted will increase significantly. Due to the increase of repeated data transmission, the loading time will also be greatly affected. According to the request merging algorithm described in Section 3.2.2, GeohashTile merges the requested tiles before sending them to the server. Whether the merging of GeohashTile will result in a large increase in the amount of requested data is an important indicator to judge whether the merging is reasonable.
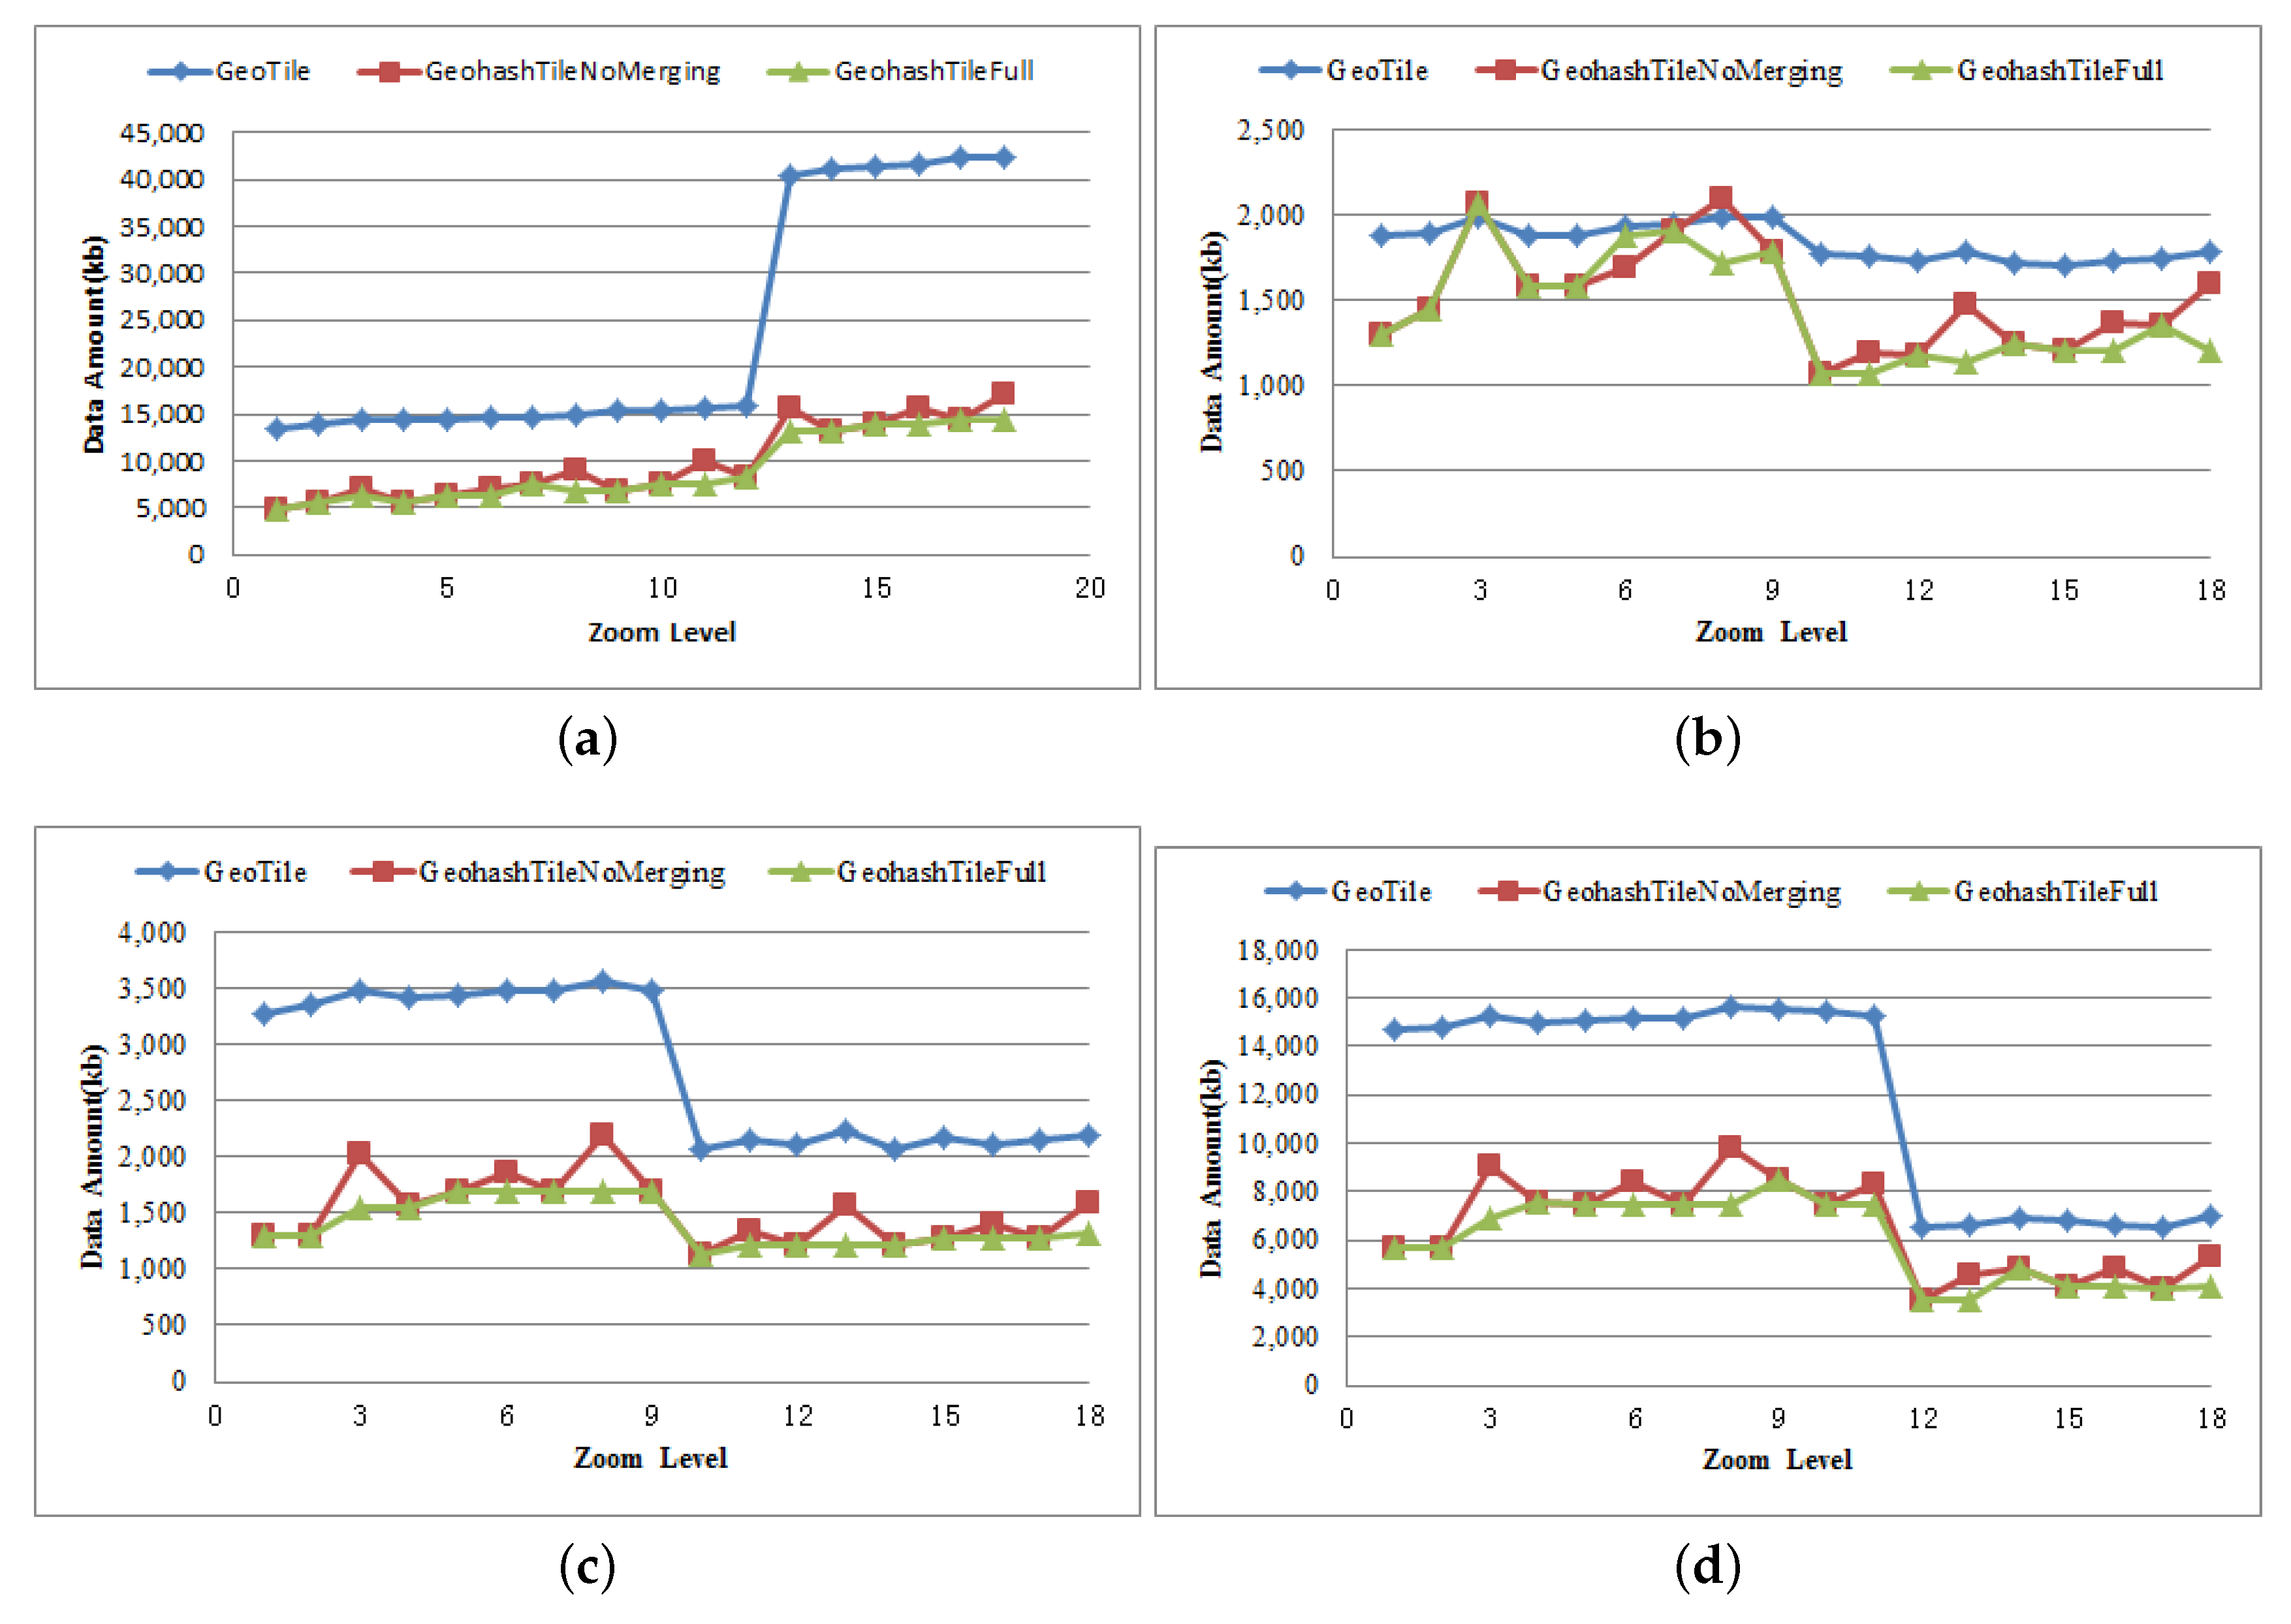
Figure 9 demonstrates the comparison of the data transmission amount when the four regions of Singapore, Hainan, Beijing and Heilongjiang are respectively loaded with GeoTile, GeohashTileNoMerging and GeohashTileFull giving the zoom level varies between 1–18. The vector map data transferred by GeoTile uses the latitude and longitude to represent the geometric object coordinates, and the latitude and longitude retains 7 decimal places. The vector map data transferred by GeohashTile uses Geohash to represent the geometric object coordinates, and retains the length consistent with the highest precision according to the encoding length described in the previous section.
As can be seen from Figure 9, the trend of data amount changes of both GeohashTile and GeoTile is basically the same under different zoom levels and geographic regions. Moreover, when storing geometric object data within the same coverage range, the data amount of GeohashTile is 47.3% less than that of GeoTile on average, which shows that GeohashTile has a great advantage in data amount than GeoTile. Figure 9a shows a significant increase in data amount when the zoom level is 13, while the other three statistics show a significant decrease in data amount. This is because the amount of data is related to the number of geometric objects included in the region, and the more detailed the description, the greater the amount of data in the region. GeohashTile has a lot of redundant data when the zoom level is 3 and 6, and there is more data outside the region after merging. Moreover, there will be a larger amount of data than GeoTile. When the amount of redundant data exceeds the amount of data compression, the situation in Figure 9b occurs.
For GeohashTileFull, the amount of data after merging has not increased significantly. Indeed, in most cases, the amount of data has decreased. The reason is that when the server provides the GeohashTile vector map data, it is divided according to the coordinate position of the geometric object. As long as the coordinates of the geometric object are within the GeohashTile range, the object is included in the corresponding GeoJSON data, so that the same object could be contained in multiple GeoJSON, i.e., there is redundant data. After the requests are merged, the geometric objects that were originally contained in multiple GeohashTiles now only appear once, so the amount of data is reduced. Although here the amount of data is reduced, it has not been greatly reduced because the data outside the original area is also included after the requests are merged.
According to the Geohash range calculation rules described in Section 4.1.1, the coverage of a tile is the smallest when the zoom level is 3, 8, 13 and 18, i.e., the number of Geohash blocks that need to be divided in the same range is the largest, and the redundancy data generated at this time is also the largest, which is the peak position of GeohashTileNoMerging in these figures. After merging, the number of divided blocks decreases, and the amount of redundant data decreases, so the change of GeohashTileFull tends to be flat.
5.2.3. Loading Time
The loading time of map data is an important indicator to measure the map display method. The loading time is the time from the Web client starts requesting tile data to all requested data is projected on the screen. In our system, three factors affect the loading time: the amount of data, the way of projection and whether there is intermediate result cache.
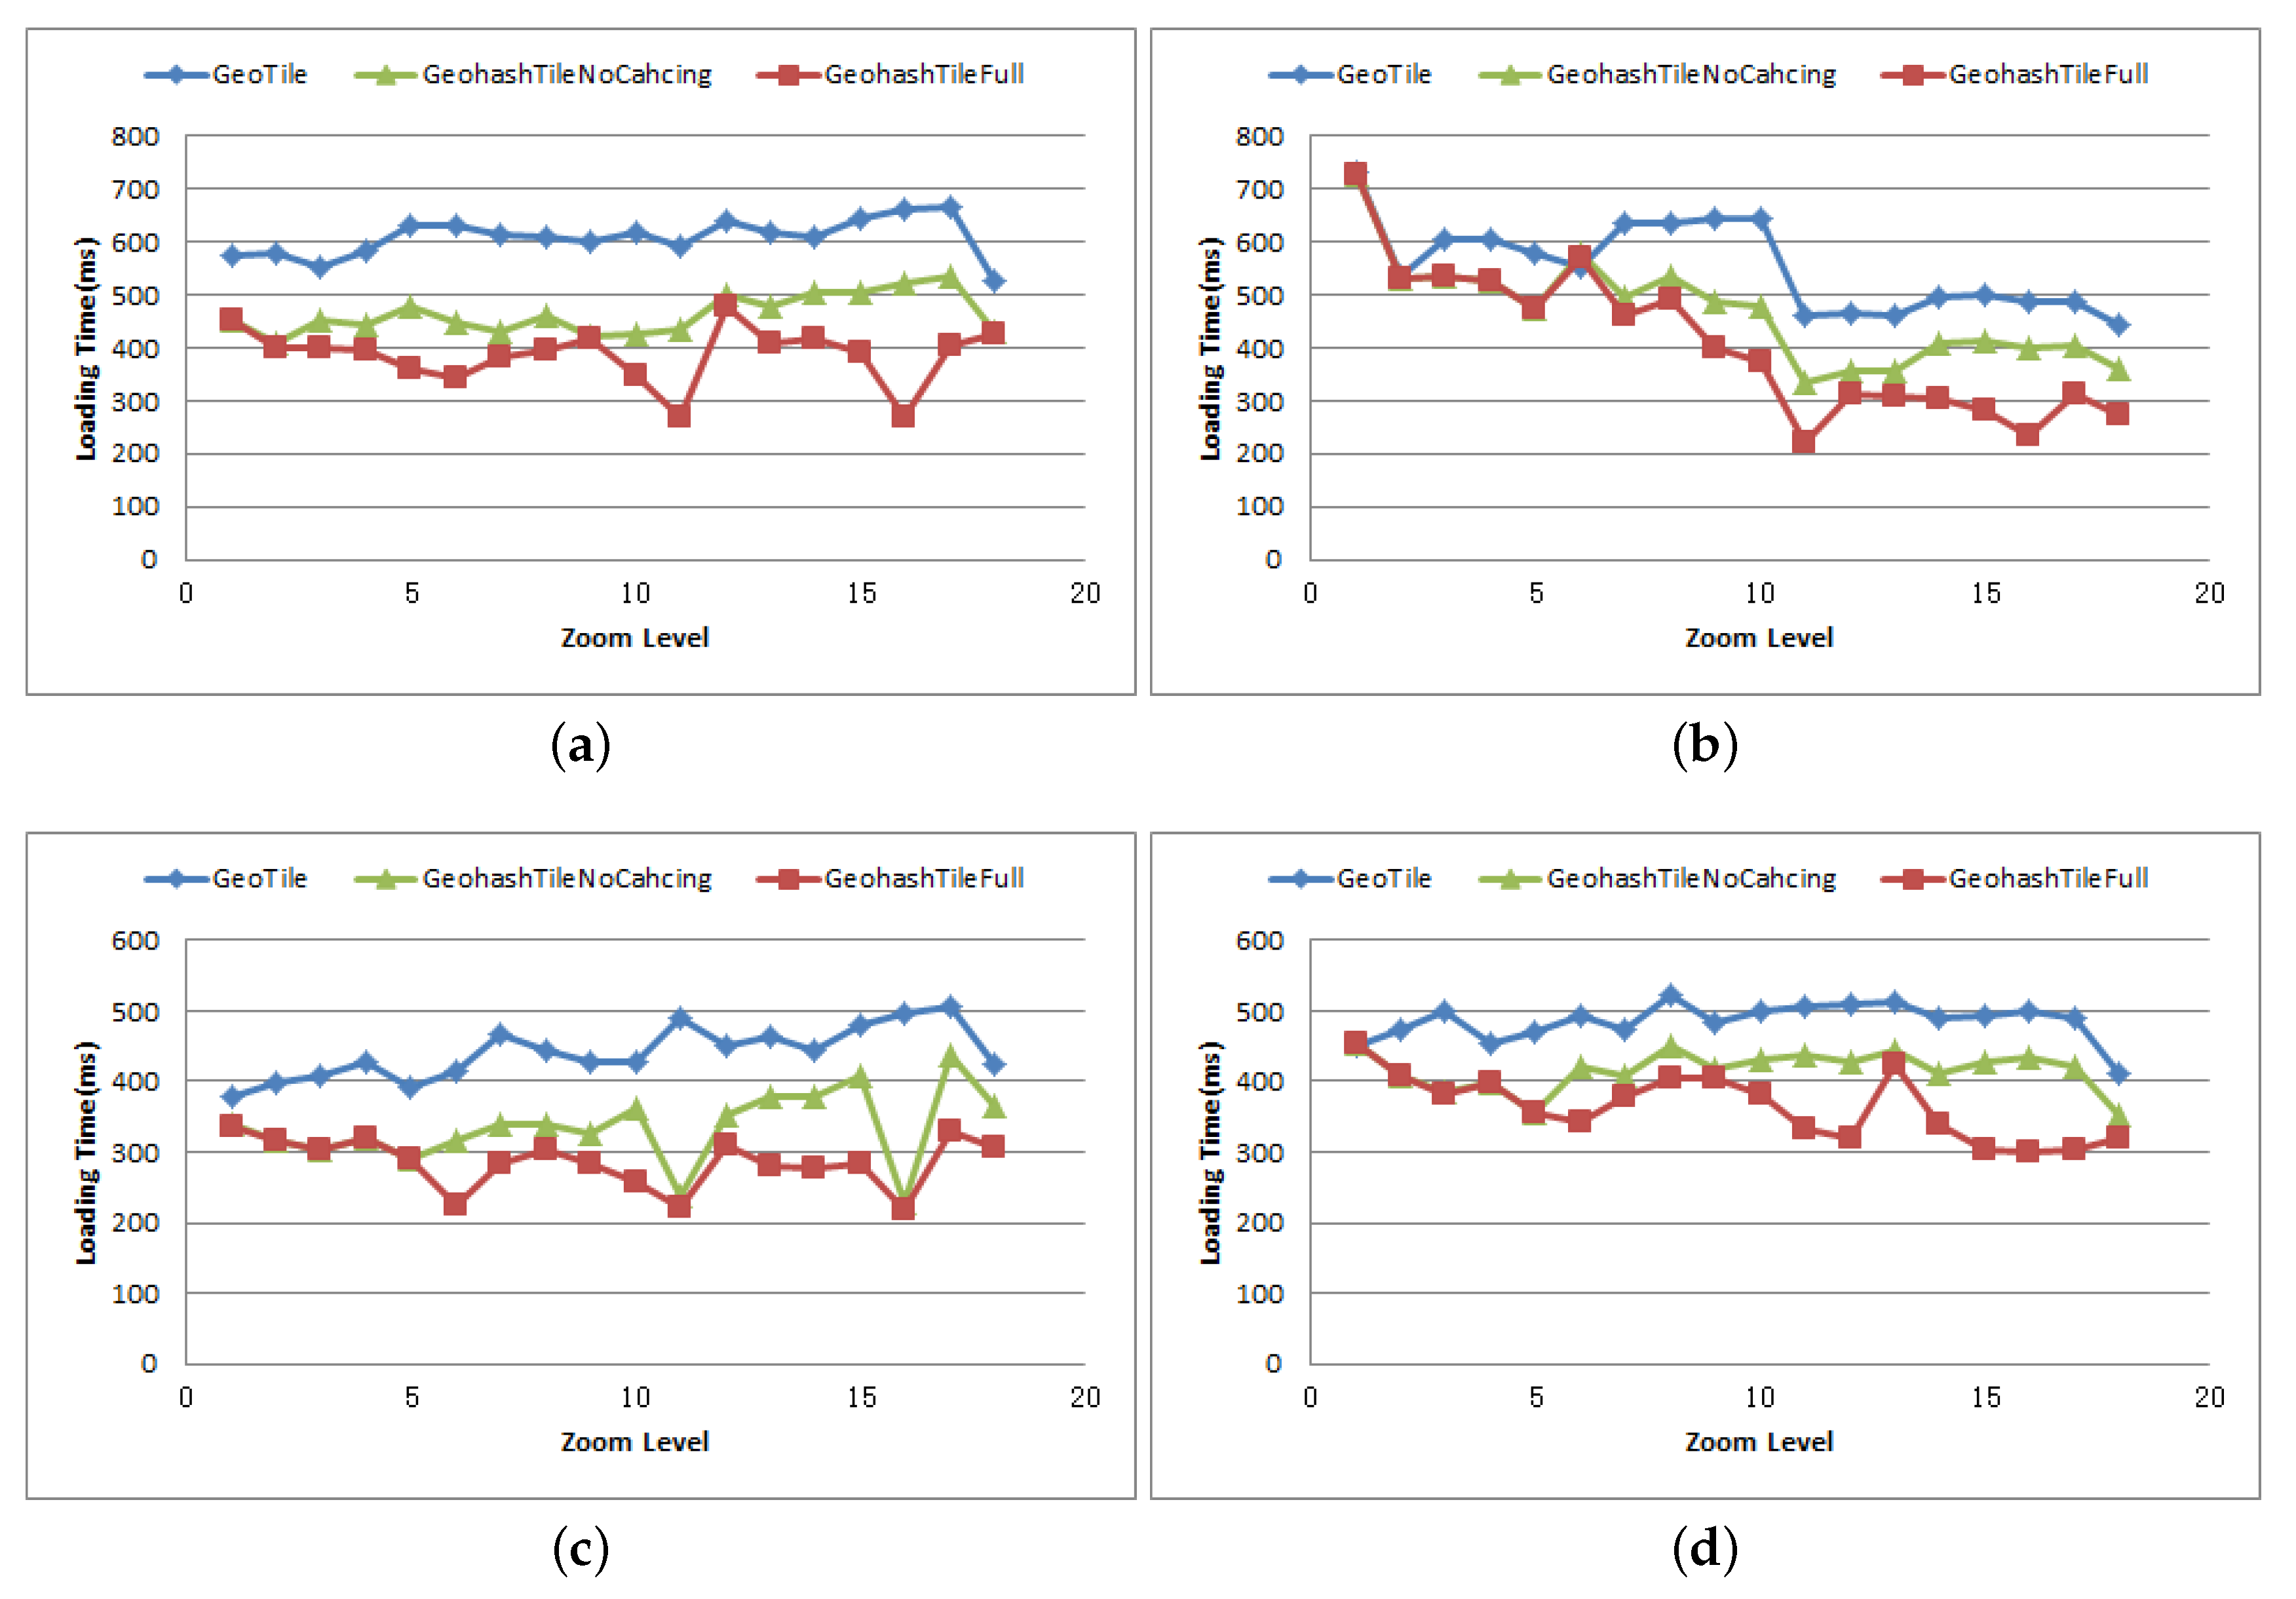
Figure 10 shows the loading time comparison of GeoTile, GeohashTileNoCahcing and GeohashTileFull for the four regions of Singapore, Hainan, Beijing and Heilongjiang when the zoom level is 1–18. As can be seen from Figure 10:
(1) When the zoom level is 1–18, the loading time of GeohashTileFull is reduced by 30.2% on average compared with GeoTile in the same range of the four regions, indicating that the GeohashTileFull has a significant advantage over the GeoTile in loading time. With the increase of zoom level and data amount, the loading time of GeoTile and GeohashTileFull has the same increasing trend. At some zoom levels, such as level 11, the loading time of GeohashTileFull is 50% less than the GeoTile on average. A closer look at this level reveals that the number of tiles loaded by GeohashTileFull after the request merging is exactly 1, and the amount of data is less than that before the request merging, so the loading time is greatly reduced. In some cases, for example, when the zoom level is 6 in Hainan, the GeohashTileFull has a slightly higher loading time than the GeoTile. This is because although the requested GeohashTile meets the requirements of merging, there are more data crossing multiple Geohash regions added after merging, resulting in the increase of loading time. Another reason for the shorter loading time of GeohashTileFull is the advantage of the projection. GeoTile uses Mercator projection, while GeohashTile uses a relative position projection method to make calculations easier.
(2) Comparing the loading time of GeohashTileNoCahcing and GeohashTileFull, it can be seen that the loading time of GeohashTileFull is 14.1% less than GeohashTileNoCahcing, which indicates that the intermediate result cache has significantly improved the loading time. In some cases, due to the large translation span and low tile repetition rate in the experiment, the loading time of the two is the same, such as when the zoom level is 1 and 2. Experiments after zoom level 6 present that the load time varies with the tile reuse rate when there is an intermediate result cache. This indicates that the effect of the intermediate result cache on the loading time is directly related to the reuse rate of the cached results. The higher the reuse rate, the smaller the number of repeated calculations, and the more the load time is reduced.
6. Conclusions
In this paper, motivated by simultaneous data partition and data compression, and starting from the aim of reducing data transmission, improving index efficiency and reducing loading time, we studied the vector geographic data structure based on Geohash, and a GeohashTile system that unifies map data indexing and geometric coordinate encoding is implemented. The GeohashTile system does not affect the display effect while reducing the user’s waiting time; it makes the application reducing the amount of data transmission and loading time; it also provides a new vector data service that supports Geohash encoding. The results of the experiment demonstrated that in terms of reducing the data amount, due to Geohash’s compression storage of latitude and longitude, the storage of different granularity map data of different levels and the data merge access, GeohashTile outperforms GeoTile by 43.7% on average. The loading time of GeohashTile on Web client is also 30.2% less than that of GeoTile because of its relative position projection and intermediate result caching.
However, there are some limitations in our study. In the Geohash framework, when the two points are within a small range, the spherical distance between the two points can be approximated to the two-point plane distance, and the calculation can be completed only to have Geohash coordinates. However, when calculating the spherical distance between two points in a large range, this approximate calculation has a large error, and it needs to be converted into latitude and longitude coordinates to calculate the accurate two-point spherical distance.
Although the display effect is not the only pursuit of the vector geographic data platform, the good display effect is the premise and basis of all data processing functions. In this paper, we only discuss the rendering and display of the map in Geohash coordinates, but not the calculation of spherical geometry in it. It will be an interesting work in the future to study the calculation of spherical geometry in Geohash coordinates, such as point-to-point distance and point-to-line distance. Another interesting future work is to further modify the affine transformation parameters. According to the latitude and longitude, the affine transformation parameters should be modified in different regions which could reduce the deviation between the north and south poles. The third direction worth exploring is to improve server functions. In the future, the location representation of all the incoming vector map data on the server can be converted into Geohash, so that the Geohash is completely used as the unique representation of the coordinates.
Author Contributions
Conceptualization and methodology, Chang Zhou and Yong Xiang; software, validation and investigation, Chang Zhou; writing—original draft preparation, Chang Zhou; writing—review and editing, Yong Xiang, Huimei Lu, Chang Zhou, Jingbang Wu and Feng Wang. All authors have read and agree to the published version of the manuscript.
Funding
This research received no external funding.
Conflicts of Interest
The authors declare no conflict of interest.
References
- Davis, N.; Raina, G.; Jagannathan, K. Taxi Demand Forecasting: A HEDGE-Based Tessellation Strategy for Improved Accuracy. IEEE Trans. Intell. Transp. Syst. 2018, 19, 3686–3697. [Google Scholar] [CrossRef] [Green Version]
- Li, C.; Lu, H.; Xiang, Y.; Liu, Z.; Yang, W.; Liu, R. Bringing Geospatial Data Closer to Mobile Users: A Caching Approach Based on Vector Tiles for Wireless Multihop Scenarios. Mob. Inf. Syst. 2018, 2018, 5186495. [Google Scholar] [CrossRef] [Green Version]
- Yang, C.P.; Wong, D.W.S.; Yang, R.; Kafatos, M.; Li, Q. Performance-improving techniques in web-based GIS. Int. J. Geogr. Inf. Sci. 2005, 19, 319–342. [Google Scholar] [CrossRef]
- Sagan, H. Space-Filling Curves; Springer: New York, NY, USA, 1994. [Google Scholar]
- OpenLayers 3 Vector Rendering with Topology Simplification. Website. 2014. Available online: https://boundlessgeo.com/2014/03/openlayers-vector-rendering/ (accessed on 21 September 2017).
- Keying Huang, G.L.; Wang, J. Rapid retrieval strategy for massive remote sensing metadata based on GeoHash coding. Remote Sens. Lett. 2019, 10, 111–119. [Google Scholar] [CrossRef]
- Google. Google Map—Tile and Coordinate Specification. Website. Available online: https://developers.google.com/maps/documentation/javascript/maptypes (accessed on 20 May 2020).
- Microsoft. Bing Maps Tile System. Website. Available online: https://docs.microsoft.com/en-us/bingmaps/articles/bing-maps-tile-system (accessed on 29 June 2020).
- Zouhar, F.; Senner, I. Web-Based Visualization of Big Geospatial Vector Data. In Geographic Information Science; Springer: Cham, Switzerland, 2019; pp. 59–74. [Google Scholar]
- Zhou, M.; Chen, J.; Gong, J. A virtual globe-based vector data model: Quaternary quadrangle vector tile model. Int. J. Digit. Earth 2016, 9, 230–251. [Google Scholar] [CrossRef]
- Martín, R.G.; Fernández, J.P.D.C.; Pérez, E.V.; Pérez, M.J.V.; Santos, L.M.R. An OLS regression model for context-aware tile prefetching in a web map cache. Int. J. Geogr. Inf. Sci. 2013, 27, 614–632. [Google Scholar] [CrossRef]
- Wenjuecandidate, J. Implementation of OGC Web Map Service Based on Web Service. Geo-Spat. Inf. Sci. 2004, 7, 148–152. [Google Scholar]
- Guanhua, W. Improving Data Transmission in Web Applications via the Translation between XML and JSON. In Proceedings of the 2011 Third International Conference on Communications and Mobile Computing, Qingdao, China, 18–20 April 2011; pp. 182–185. [Google Scholar]
- Bray, T.; Paoli, J.; Sperbergmcqueen, C.M. Extensible Markup Language (XML). World Wide Web 1997, 2, 27–66. [Google Scholar]
- Lake, R. The application of geography markup language (GML) to the geological sciences. Comput. Geosci. 2005, 31, 1081–1094. [Google Scholar] [CrossRef]
- Nolan, D.; Lang, D.T. Keyhole Markup Language; Springer: New York, NY, USA, 2014; pp. 581–618. [Google Scholar]
- Steiniger, S.; Hunter, A.J.S. Data Structure: Spatial Data on the Web; John Wiley & Sons, Ltd.: Hoboken, NJ, USA, 2017. [Google Scholar]
- GeoJSON. Website. Available online: http://geojson.org/geojson-spec.html (accessed on 29 June 2020).
- Li, W.; Song, M.; Zhou, B.; Cao, K.; Gao, S. Performance improvement techniques for geospatial web services in a cyberinfrastructure environment—A case study with a disaster management portal. Comput. Environ. Urban Syst. 2015, 54, 314–325. [Google Scholar] [CrossRef] [Green Version]
- Li, L.; Hu, W.; Zhu, H.; Li, Y.; Zhang, H. Tiled vector data model for the geographical features of symbolized maps. PLoS ONE 2017, 12, e0176387. [Google Scholar]
- TopoJSON. Website. Available online: https://github.com/topojson/topojson-specification (accessed on 25 May 2020).
- Liu, J.; Li, H.; Yong, G.; Hao, Y.; Dan, J. A geohash-based index for spatial data management in distributed memory. In Proceedings of the International Conference on Geoinformatics, Kaohsiung, Taiwan, 25–27 June 2014. [Google Scholar]
- Nie, Y.; Zhou, W.; Jian, S. Spatial index for tile map service based on Z curve. J. Image Graph. 2012, 2, 286–292. (In Chinese) [Google Scholar]
- Ramos, J.A.S.; Esperana, C.; Clua, E.W.G. A progressive vector map browser for the web. J. Braz. Comput. Soc. 2009, 15, 35–48. [Google Scholar] [CrossRef] [Green Version]
- Wan, L.; Huang, Z.; Peng, X. An Effective NoSQL-Based Vector Map Tile Management Approach. ISPRS Int. J. Geo-Inf. 2016, 5, 215. [Google Scholar] [CrossRef] [Green Version]
- Zhang, J.; Yang, C.; Yang, Q.; Lin, Y.; Zhang, Y. HGeoHashBase: An optimized storage model of spatial objects for location-based services. Front. Comput. Sci. China 2018, 14, 208–218. [Google Scholar] [CrossRef]
- Zhou, Y.; De, S.; Wang, W.; Moessner, K.; Palaniswami, M. Spatial Indexing for Data Searching in Mobile Sensing Environments. Sensors 2017, 17, 1427. [Google Scholar] [CrossRef] [Green Version]
- Deoliveira, J. GeoServer: Uniting the GeoWeb and spatial data infrastructures. In Proceedings of the 10th International Conference for Spatial Data Infrastructure, Beijing, China, 25–29 February 2008. [Google Scholar]
- Blower, J.D.; Gemmell, A.L.; Griffiths, G.H.; Haines, K.; Santokhee, A.; Yang, X. A Web Map Service implementation for the visualization of multidimensional gridded environmental data. Environ. Model. Softw. 2013, 47, 218–224. [Google Scholar] [CrossRef] [Green Version]
- Zavala-Romero, O.; Ahmed, A.; Chassignet, E.P.; Zavala-Hidalgo, J.; Fernández Eguiarte, A.; Meyer-Baese, A. An open source Java web application to build self-contained web GIS sites. Environ. Model. Softw. 2014, 62, 210–220. [Google Scholar] [CrossRef]
- Leaflet-An Open-Source JavaScript Library for Mobile-Friendly Interactive Maps. Website. Available online: https://leafletjs.com/ (accessed on 29 June 2020).
- Edler, D.; Vetter, M. The Simplicity of Modern Audiovisual Web Cartography: An Example with the Open-Source JavaScript Library leaflet.js. KN J. Cartogr. Geogr. Inf. 2019, 69, 51–62. [Google Scholar] [CrossRef] [Green Version]
- Brambilla, G.; Amoretti, M.; Zanichelli, F. Adgt.js: A Web Application Framework for Peer-to-Peer Location-Based Services. In European Conference on Parallel Processing; Springer: Cham, Switzerland, 2016. [Google Scholar]
- Haklay, M.; Weber, P. OpenStreetMap: User-Generated Street Maps. IEEE Pervasive Comput. 2008, 7, 12–18. [Google Scholar] [CrossRef] [Green Version]
Figure 1.
Schematic diagram of Geohash division and Z-curve index [27].
Figure 1.
Schematic diagram of Geohash division and Z-curve index [27].

Figure 2.
Functional framework of GeohashTile system.

Figure 3.
A comparison of the data process of preparing the original GeoJSON and the Geohash encoded GeoJSON by the server.
Figure 3.
A comparison of the data process of preparing the original GeoJSON and the Geohash encoded GeoJSON by the server.

Figure 4.
A sample diagram of Geohash encoded GeoJSON object.

Figure 5.
Geohash vector map display process of client.

Figure 6.
Schematic diagram of client location panning.

Figure 7.
Diagram of Geohash encoding length and screen coordinate precision statistics.

Figure 8.
Comparison of the measured and calculated results of Geohash encoding precision: (a) Singapore; (b) Hainan; (c) Beijing; (d) Heilongjiang.
Figure 8.
Comparison of the measured and calculated results of Geohash encoding precision: (a) Singapore; (b) Hainan; (c) Beijing; (d) Heilongjiang.


Figure 9.
Comparison charts of amount of data transmission among GeoTile, GeohashTileNoMerging and GeohashTileFull: (a) Singapore; (b) Hainan; (c) Beijing; (d) Heilongjiang.
Figure 9.
Comparison charts of amount of data transmission among GeoTile, GeohashTileNoMerging and GeohashTileFull: (a) Singapore; (b) Hainan; (c) Beijing; (d) Heilongjiang.

Figure 10.
Comparison charts of loading time among GeoTile, GeohashTileNoCahcing and GeohashTileFull: (a) Singapore; (b) Hainan; (c) Beijing; (d) Heilongjiang.
Figure 10.
Comparison charts of loading time among GeoTile, GeohashTileNoCahcing and GeohashTileFull: (a) Singapore; (b) Hainan; (c) Beijing; (d) Heilongjiang.


Table 1.
Comparison Table of Related Work.
| Method | Coordinate Representation | Indexing Method | Projection Method | Intermediate Result Caching | Scope of Application |
|---|---|---|---|---|---|
| Google Map [7] | Latitude and longitude | XYZ Quadtree | Web Mercator | no | All basic vector maps |
| Bing Map [8] | Latitude and longitude | Quadkey Quadtree | Web Mercator | no | All basic vector maps |
| Zouhar et al. [9] | Latitude and longitude | Inverted Index | Web Mercator | Not mentioned | Polygon |
| wan et al. [25] | Latitude and longitude | Quadtree | Not mentioned | Not mentioned | All basic vector maps |
| Ramos et al. [24] | Not mentioned | MX-CIF Quadtree | Not mentioned | No | Polygonal lines |
| GeoTile [2] | Latitude and longitude | XYZ Quadtree | Web Mercator | No | All basic vector maps |
| Proposed Approach | Geohash | Geohash | Relative position | Yes | All basic vector maps |
Table 2.
Latitude and longitude accuracy after Geohash decoding.
| Location | Longitude Range | Latitude Range | Data Size | Accuracy |
|---|---|---|---|---|
| Heilongjiang | (121.18, 135.09) | (43.42, 53.56) | 2198 | 100% |
| Beijing | (115.42, 117.49) | (39.44, 41.05) | 1431 | 100% |
| Hainan | (89.88, 92.48) | (15.65, 18.25) | 1987 | 100% |
| Singapore | (99.25, 119.61) | (6.71, 7.65) | 2636 | 100% |
Table 3.
GeohashTile pixel size and zoom level correspondence table.
| Zoom | GeohashTile_Size | Zoom | GeohashTile_Size | Zoom | GeohashTile_Size |
|---|---|---|---|---|---|
| 1 | 7 | 13 | |||
| 2 | 8 | 14 | |||
| 3 | 9 | 15 | |||
| 4 | 10 | 16 | |||
| 5 | 11 | 17 | |||
| 6 | 12 | 18 |
Table 4.
A GeohashTile request sample table.
| Col 1 | Col 2 | Col 3 | Col 4 | Col 4 | Col 6 | Col 7 |
|---|---|---|---|---|---|---|
| wrekg | wreku | wrekv | wreky | wrekz | wresb | wrese |
| wreke | wreks | wrekt | wrekw | wrekx | wres8 | wres9 |
| wrek7 | wrekk | wrekm | wrekq | wrekr | wres2 | wres3 |
| wrek5 | wrekh | wrekj | wrekn | wrekp | wres0 | wres1 |
| wre7g | wre7u | wre7v | wre7y | wre7z | wreeb | wreee |
© 2020 by the authors. Licensee MDPI, Basel, Switzerland. This article is an open access article distributed under the terms and conditions of the Creative Commons Attribution (CC BY) license (http://creativecommons.org/licenses/by/4.0/).
Share and Cite
MDPI and ACS Style
Zhou, C.; Lu, H.; Xiang, Y.; Wu, J.; Wang, F. GeohashTile: Vector Geographic Data Display Method Based on Geohash. ISPRS Int. J. Geo-Inf. 2020, 9, 418. https://doi.org/10.3390/ijgi9070418
AMA Style
Zhou C, Lu H, Xiang Y, Wu J, Wang F. GeohashTile: Vector Geographic Data Display Method Based on Geohash. ISPRS International Journal of Geo-Information. 2020; 9(7):418. https://doi.org/10.3390/ijgi9070418
Chicago/Turabian StyleZhou, Chang, Huimei Lu, Yong Xiang, Jingbang Wu, and Feng Wang. 2020. "GeohashTile: Vector Geographic Data Display Method Based on Geohash" ISPRS International Journal of Geo-Information 9, no. 7: 418. https://doi.org/10.3390/ijgi9070418
Note that from the first issue of 2016, this journal uses article numbers instead of page numbers. See further details here.