Nutrient Dynamics in Switchgrass as a Function of Time


1
Oklahoma Agricultural Experiment Station Field and Research Service Unit, Stillwater, OK 74078, USA
2
Plant and Soil Sciences Department, Oklahoma State University, Stillwater, OK 74075, USA
*
Author to whom correspondence should be addressed.
Agronomy 2020, 10(7), 940; https://doi.org/10.3390/agronomy10070940
Submission received: 23 May 2020
/
Revised: 26 June 2020
/
Accepted: 28 June 2020
/
Published: 30 June 2020
Abstract
:There are wide variations in fertilizer recommendations for switchgrass (Panicum virgatum L.) as biofuel feedstock or forage. Inconsistent yield responses to fertilization are common. Nutrient translocation, from aboveground leaves and stems to belowground roots, is a contributor to variable, and sometimes the absence of, fertilizer response. A field study evaluated how major nutrients are cycled within switchgrass during the growing season. Aboveground (AG) and belowground (BG) biomasses were harvested and analyzed separately for yield (AG) and nutrient concentrations (AG and BG). Maximum yields were 26.3 (2008), 17.5 (2009) and 29.3 (2010) Mg ha−1 until senescence. In all years, the N concentration of the AG biomass decreased as the season progressed (p < 0.0001). The belowground biomass N concentration increased over time in 2008 and 2010 (p < 0.05). Phosphorus (P) and potassium (K) displayed similar trends to nitrogen concentration. Temporal changes of other nutrients in the AG and BG biomass concentrations were inconsistent and varied compared with N. The dynamics of the macronutrients suggested translocation from AG to BG as the switchgrass matured. Nutrients stored in roots can be beneficial for regrowth in the following growing season, which may reduce response to fertilizers. A greater understanding of nutrient cycling and harvest timing is needed to better manage different switchgrass production systems.
1. Introduction
Switchgrass (Panicum virgatum L.) has been selected as an ideal biofuel feedstock for the production of biofuels. Its wide distribution across North America and ability to grow well on marginal lands [1] have made it useful as a buffer in riparian areas to control erosion [2]. However, switchgrass yield response to applied nitrogen (N) has often been inconsistent in fertilization studies [3,4,5,6]. Some works have suggested that nutrient transfer from aboveground portions of the plant (AG) to belowground (BG) is the reason for the poor response to applied nutrients [7]. A transfer such as this would likely be important for regrowth during the following growing season [8,9,10]. Nutrient dynamics within switchgrass plants during the growing season offer insight into the need and use of fertilizer in biomass production.
Native switchgrass was developed in areas under low N input [11,12,13]. Without the application of N, nutrient needs are met by input from natural N sources, such as N deposition from lightning and rainfall, microbial decomposition and mineralization from plant and animal residues, and N fixation by legumes within native plant communities. The nutrient translocation within the plant is also an important source of nutrients for the subsequent season. Nitrogen and other nutrients have been reported to translocate from the AG to the BG tissues as the plant matures towards senescence [13,14]. This translocation may be one of the reasons why switchgrass yield has often shown no or inconsistent responses to N fertilization when cultivated as a forage crop. Seasonal nutrient movement within the plant has been observed in other prairie grasses, such as big bluestem (Andropogon gerardii), little bluestem (Schizachyrium scoparium) and indiangrass (Sorgnastrum nutans) [11,14]. Heckathorn and Delucia [15,16] researched nutrient translocation in prairie grasses in response to fire and drought conditions, and found tallgrass prairie species translocated 30% of N held in AG shoots to BG rhizomes to conserve N and limit N losses by fire and grazing. Observations like these indicate that switchgrass and other native prairie species are very efficient in their use of nutrients [13], and they should be managed accordingly.
The phosphorus and potassium needs of switchgrass are often met by reserved nutrients in the soil profile through chemical release and mycorrhizal associations [17,18]. Studies involving P have found little to no yield response to P fertilization, although increased yield and P-use efficiency with an N × P interaction have been shown [19]. Mycorrhizal activity cannot be overlooked when considering the P requirements of switchgrass, but the amount of P received in the plant due to mycorrhizae associations is unknown [13]. Similarly, studies have often reported no response to K fertilization [13]. Seasonal translocation within the plant may play a role in the cycling of P, K, secondary and micronutrients. Little research has been conducted on switchgrass concerning P, K, and other nutrients, as N is considered to be the most limiting nutrient. Those studies, which considered other nutrients [20], did not show different concentrations of secondary and micronutrients in AG and BG to be significant contributors to switchgrass growth.
A better understanding of the nutrient concentration in AG and BG as it relates to nutrient translocation in switchgrass is needed to more efficiently manage the crop for production. During harvest, nutrient removal can become a sustainability issue in nutrient management. Nitrogen removal rates have been recorded as 18 to 39 kg N ha−1 [14,21,22,23,24]. Depending upon the harvest system, Reynolds et al. [25] reported total N removal could range from 31 to 63 kg N ha−1 yr−1 in a single harvest system, and from 90 to 144 kg N ha−1 yr−1 in a two-harvest system. In Kansas, P removal rates were reported to be between 5 and 9 kg P ha−1, and K removal rates were between 32 and 69 kg K ha−1, depending upon the year and location [23]. Kimura et al. [26] reported P removal of between 39 and 44 kg P ha−1 and K removal of between 357 and 434 kg K ha−1, depending upon the N fertilization rate in Kanlow switchgrass. Nutrient removal due to harvesting will eventually lead to the need for additional fertilization [6]. Changes in the removal rates of nutrients are dependent on the time of year when the harvest occurs [27], along with nutrient concentration in the harvested portions of the plant.
The objective of this study was to evaluate the nutrient concentrations in switchgrass AG and BG biomass throughout the growing season to determine the role of nutrient cycling in the plant life cycle. Understanding these intraseasonal changes will assist in determining the role of anthropogenic fertilization in switchgrass management. Investigating seasonal changes in yield and tissue nutrient concentration, and nutrient cycling and dynamics in switchgrass as it relates to the nutrient translocation, will add to the knowledge of both managed and natural systems.
2. Materials and Methods
2.1. Experimental Area and Treatments Description
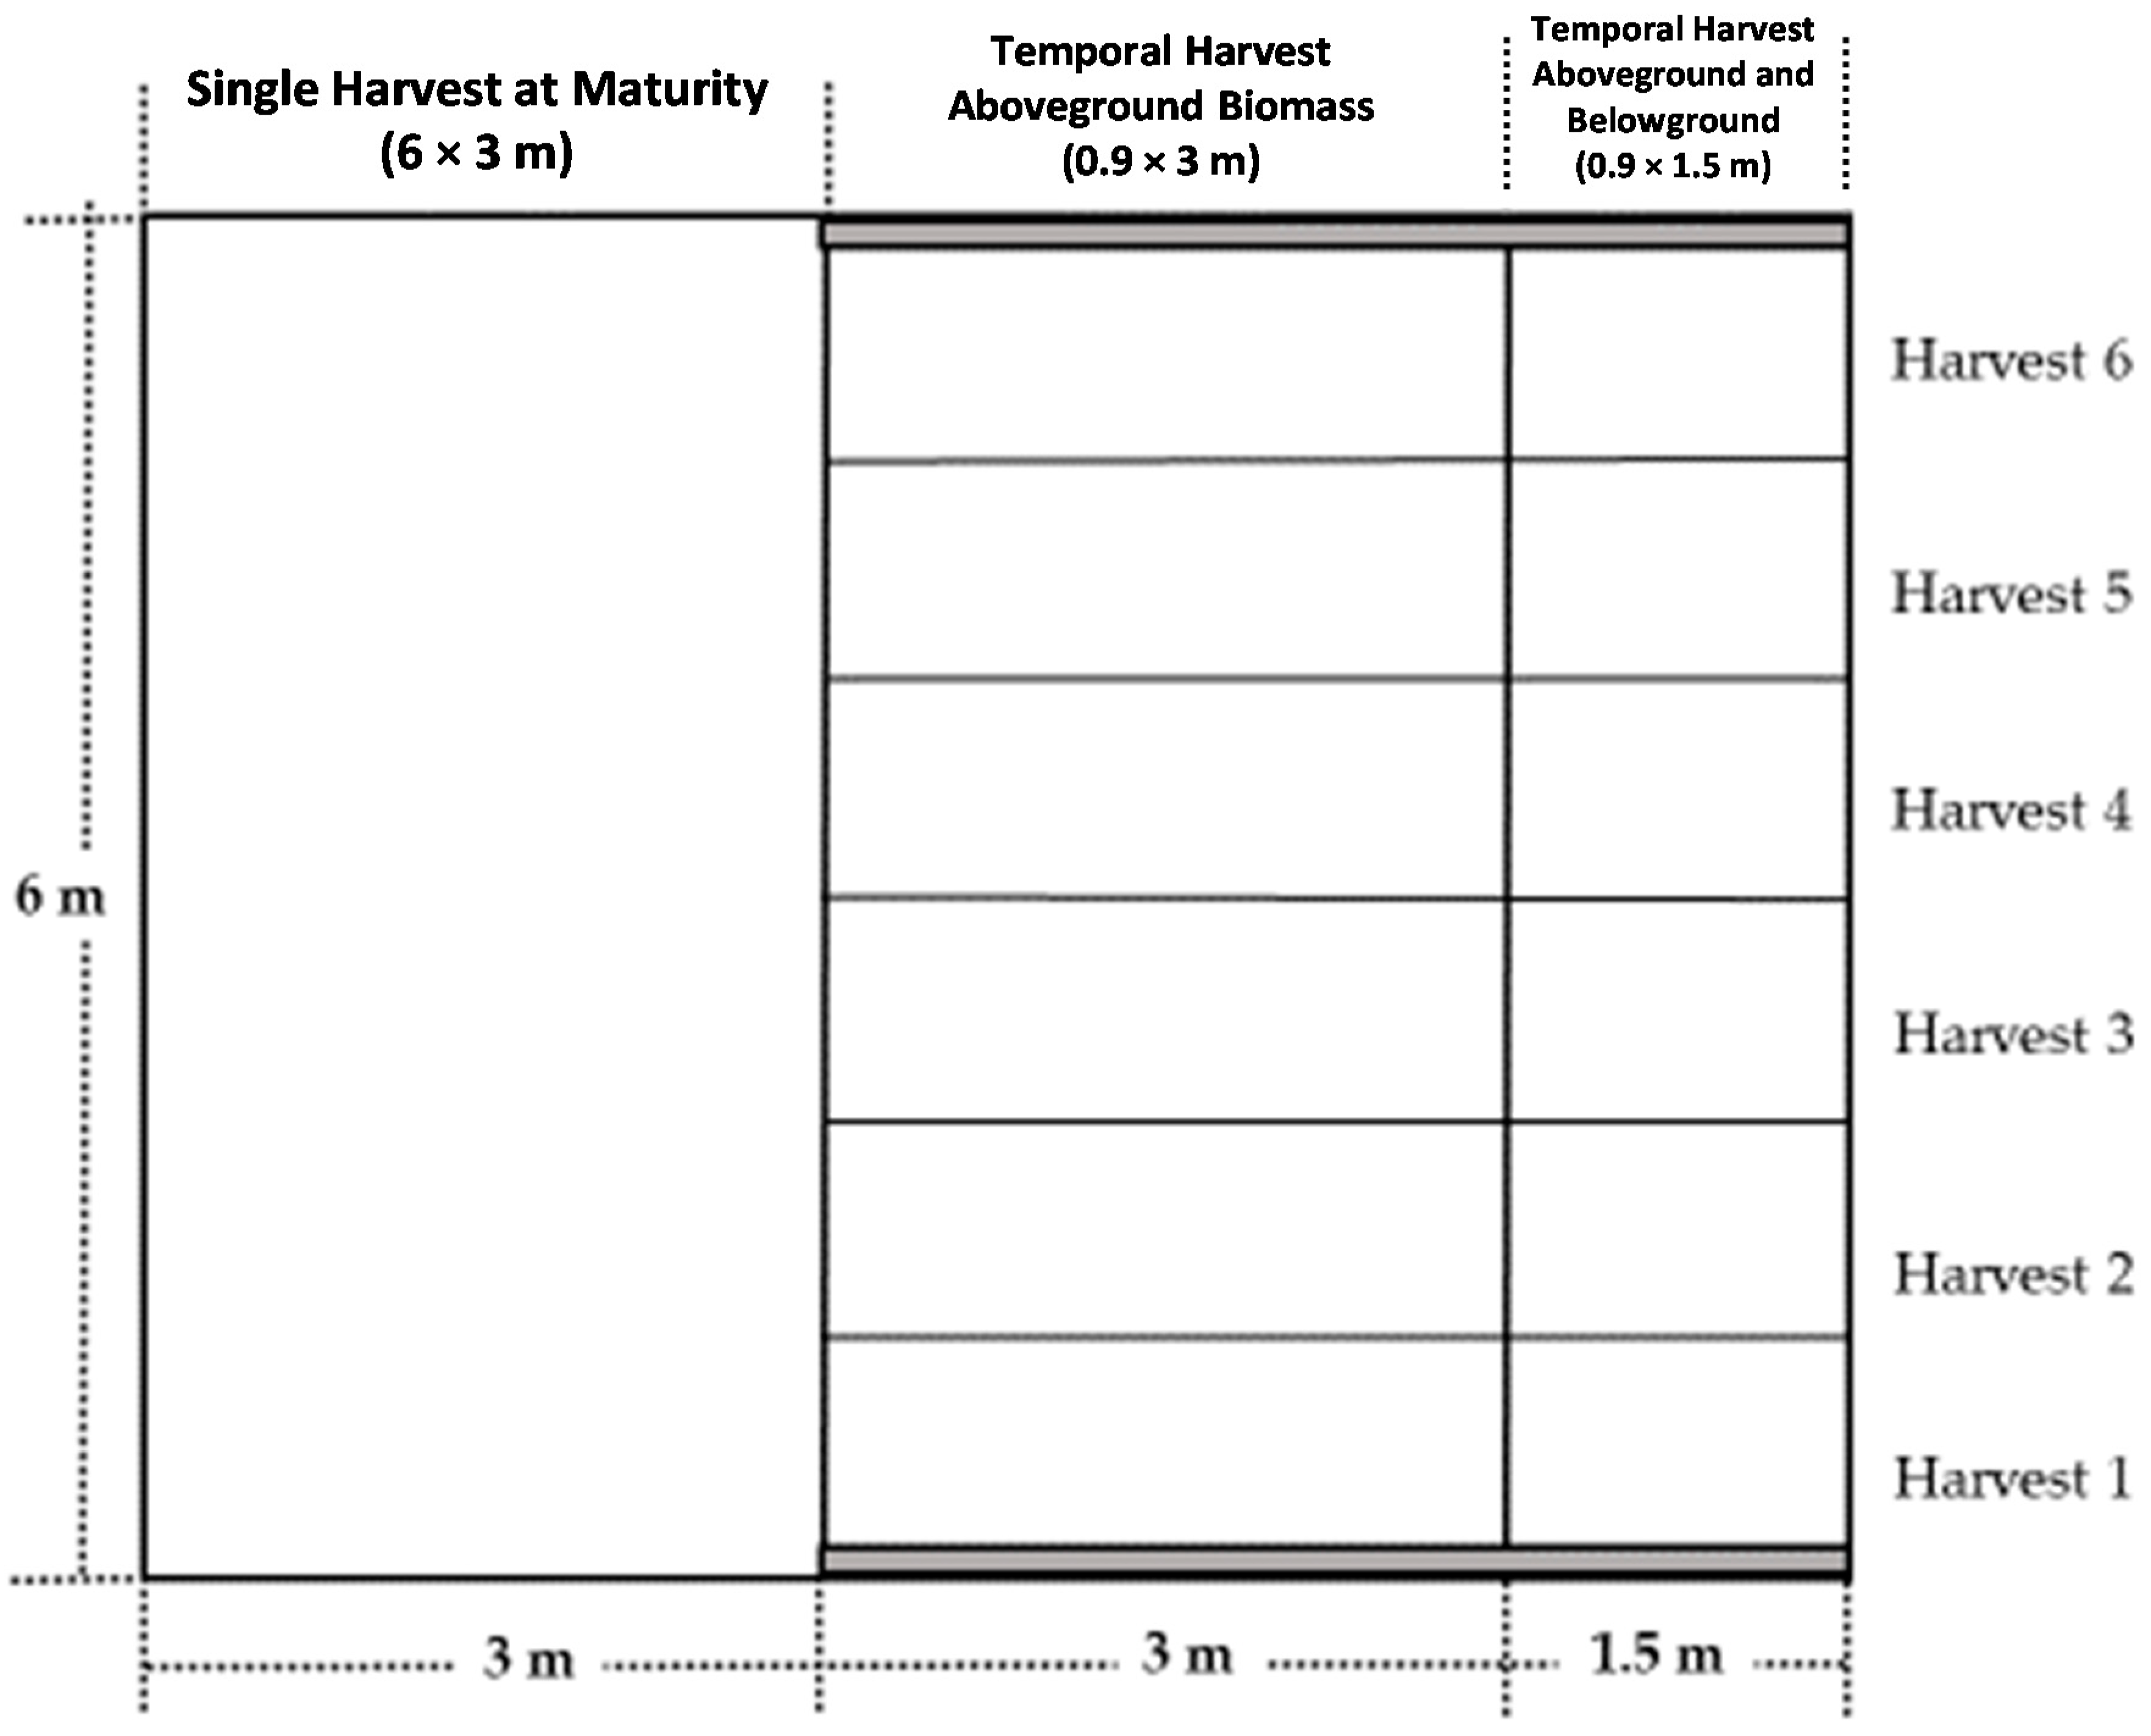
The study was initiated in 2008 in a Kanlow switchgrass stand in Stillwater, OK (36°08′01.54” N; 97°06′17.16” W) which was established in 1998. The soil at the site is a Norge Loam (fine silty, mixed, active, and thermic Udic Paleustoll) [28]. Figure 1 shows one of four plots designed for biomass harvesting in each year. The left side 6 × 3 m area was harvested at maturity for annual yields. The right side was divided into six (6) 0.9 × 3 m subplots, each of which was harvested at different time throughout the growing season. Only the right side (0.9 × 1.5 m) harvested both AG and BG biomasses; the others were only AG. The N rates for each of the three years studied were about 134.4 kg N ha−1, which is within the critical range of N needed, according to Anderson et al. and other studies [5,29,30]. Phosphorus was applied as triple superphosphate (TSP, 0-46-0), as needed according to Oklahoma State University soil test recommendations. Additional K fertilization was not needed.
2.2. Soil Sampling and Analysis
Prior to fertilization each year, soil samples were taken from depths of 0 to 15 cm. Samples were oven-dried at 65 °C for 24 h and ground to pass through a 2-mm sieve. Soil pH was measured with an electrode in a 1:1 soil to water suspension [31]. Plant available NO3-N was extracted by 1 M KCl and analyzed using a LACHAT Quick Chem QC8500 Series 2 flow injection auto-analyzer [32]. Plant available phosphorus (P), potassium (K), calcium (Ca), and magnesium (Mg) were extracted by the Mehlich-3 solution [33]. Sulfate-S was extracted by 0.008 M calcium phosphate. Micronutrients iron (Fe), zinc (Zn), boron (B), and copper (Cu) were extracted using DPTA-Sorbitol [34]. Extracts were properly filtered and analyzed for nutrient concentrations using a Spectro Blue FMS26 inductively coupled plasma–atomic emission spectrometer (ICP-AES) [35]. The results of soil testing from samples taken at the beginning of each growing season are shown in Table 1.
2.3. Switchgrass Sampling and Analyses
Switchgrass plants were harvested periodically from June to January, February or March of the following year. It should be noted that harvested areas received an average of 134.4 kg N ha−1 each year, as early season harvests hindered plant regrowth in some plots and did not allow harvesting to occur from the same plots each year. In 2010, a killing frost occurred between the 3rd and 4th harvests, on 26 November [36], after which plants began senescence, produced seed and started to die back.
The temporal harvests were designated as accumulated growing degree days (AGDD) starting from January 1 of each year (Table 2). Switchgrass AG biomass yield and nutrient removal data were all replicated each year (2008, 2009 and 2010) and standardized by AGDD (Temperature base = 10 °C) [37]. Growing degree days (GDD) were calculated as Sanderson and Moore [38], shown in Equation (1).
GDD = [(maximum daily temperature − minimum daily temperature)/2]−10 °C,
Daily maximum and minimum temperatures in Stillwater (2008, 2009 and 2010) were acquired from the Oklahoma Mesonet website [36]. Accumulated growing degree days were obtained by summing up positive GDD (GDD > 0) beginning on January 1 of each year [37,38,39]. In order to observe the role of nutrients in regrowth, AGDD was added from the previous year. The mean growth stage count of switchgrass (MSC) was calculated according to the method proposed by Mitchell et al. [40], as shown in Equation (2).
MSC = [0.875 + (0.0017 × AGDD)]
The values used in Equation (2) estimate the growth stage of switchgrass by AGDD. The 0.875 value represents a starting point of growth, and 0.0017 represents growth rate of switchgrass. The switchgrass growth stages and their descriptions can be found in Moore and Moser [41,42], who considered MSC values from 0.0 to 4.9 (Table 2). Estimated MSC > 4.9 were listed as “postripening/senescence” for our study, because some harvests took place after physiological maturity and senescence (Table 2). Differences due to weather data are described by Massey et al. [43].
In the collection of whole plant samples, a single plant patch from the one side of the plot (0.9 × 1.5 m area, shown in Figure 1) was harvested to estimate temporal nutrient concentrations in both the above- and below- ground portions of the plant (AG and BG, respectively). One plant was randomly selected and excavated to an approximate depth of 0.9 m to obtain the root biomass. The diameter of the excavated area was approximately 0.5 m. As switchgrass is a bunchgrass with large AG and BG biomass, a single plant was adequate to represent the whole plot, and more practical than harvesting a fixed area for this study. Four plants were sampled at each AGDD harvest, one from each replicated plot. Whole plant samples were separated into AG and BG plant portions and analyzed for nutrient concentrations separately. Aboveground portions (leaves and stems) were chopped and ground to pass through a 1-mm sieve. For BG portions, the soil was washed from the roots, and samples were dried intact. Roots were chopped and ground to pass through a 1-mm sieve to prepare them for analysis.
Both AG and BG plant samples were digested with nitric acid (HNO3), in which 0.5 g of ground plant materials were predigested for 1 h with 10 mL of trace-metal-grade HNO3 in the HotBlockTM Environmental Express block digester. The digests were then heated to 115 °C for 2 h and diluted with deionized water to 50 mL [44]. Digested samples were analyzed by a Spectro Blue FMS26 ICP-AES for mineral nutrients (P, K, Ca, Mg, S, Na, Fe, Cu, Zn, Mn and Ni). Total N was determined with a LECO Truspec 628 carbon/nitrogen (C/N) analyzer [45].
2.4. Statistical Analysis
Regression analyses between AGDD and AG yield, nutrient removal (yield × nutrient concentration) and AG and BG nutrient concentrations were conducted for the whole data set of measurements (all replicate data). A trend analysis was conducted using best-fit models. Best-fit models were determined from linear and quadratic regression models by the level of significance using p ≤ 0.05. The higher level of significance for each model (lower p-value), higher coefficient of determination (R2), and the lowest root mean square error (RMSE) were used to determine a best-fit model, using the PROC REG procedure in SAS ver. 9.4. In addition, the equation coefficients associated with the adopted regression models were also tested for significance.
3. Results
3.1. Switchgrass Yield
The switchgrass aboveground biomass yield from periodic harvests throughout the growing season increased throughout the summer, and a significant quadratic relationship between biomass yield and AGDD was observed (p < 0.0001) in 2008 (Figure 2).
A significant trend in yield at p < 0.05 was seen in 2009 (Figure 2). An expected plateau or decrease in harvested yield was not indicated here because of a lack of harvest data for the rest of the growing season. Yield at AGDD 1822 (DOY 221, August 9th) was much higher (13.7 ± 2.9 Mg ha−1) than the first harvest date (4.8 ± 3.8 Mg ha−1), and higher than the other two harvest dates (8.0 ± 2.3 and 9.5 ± 3.1 Mg ha−1, respectively).
3.2. Nutrient Removal with Harvest
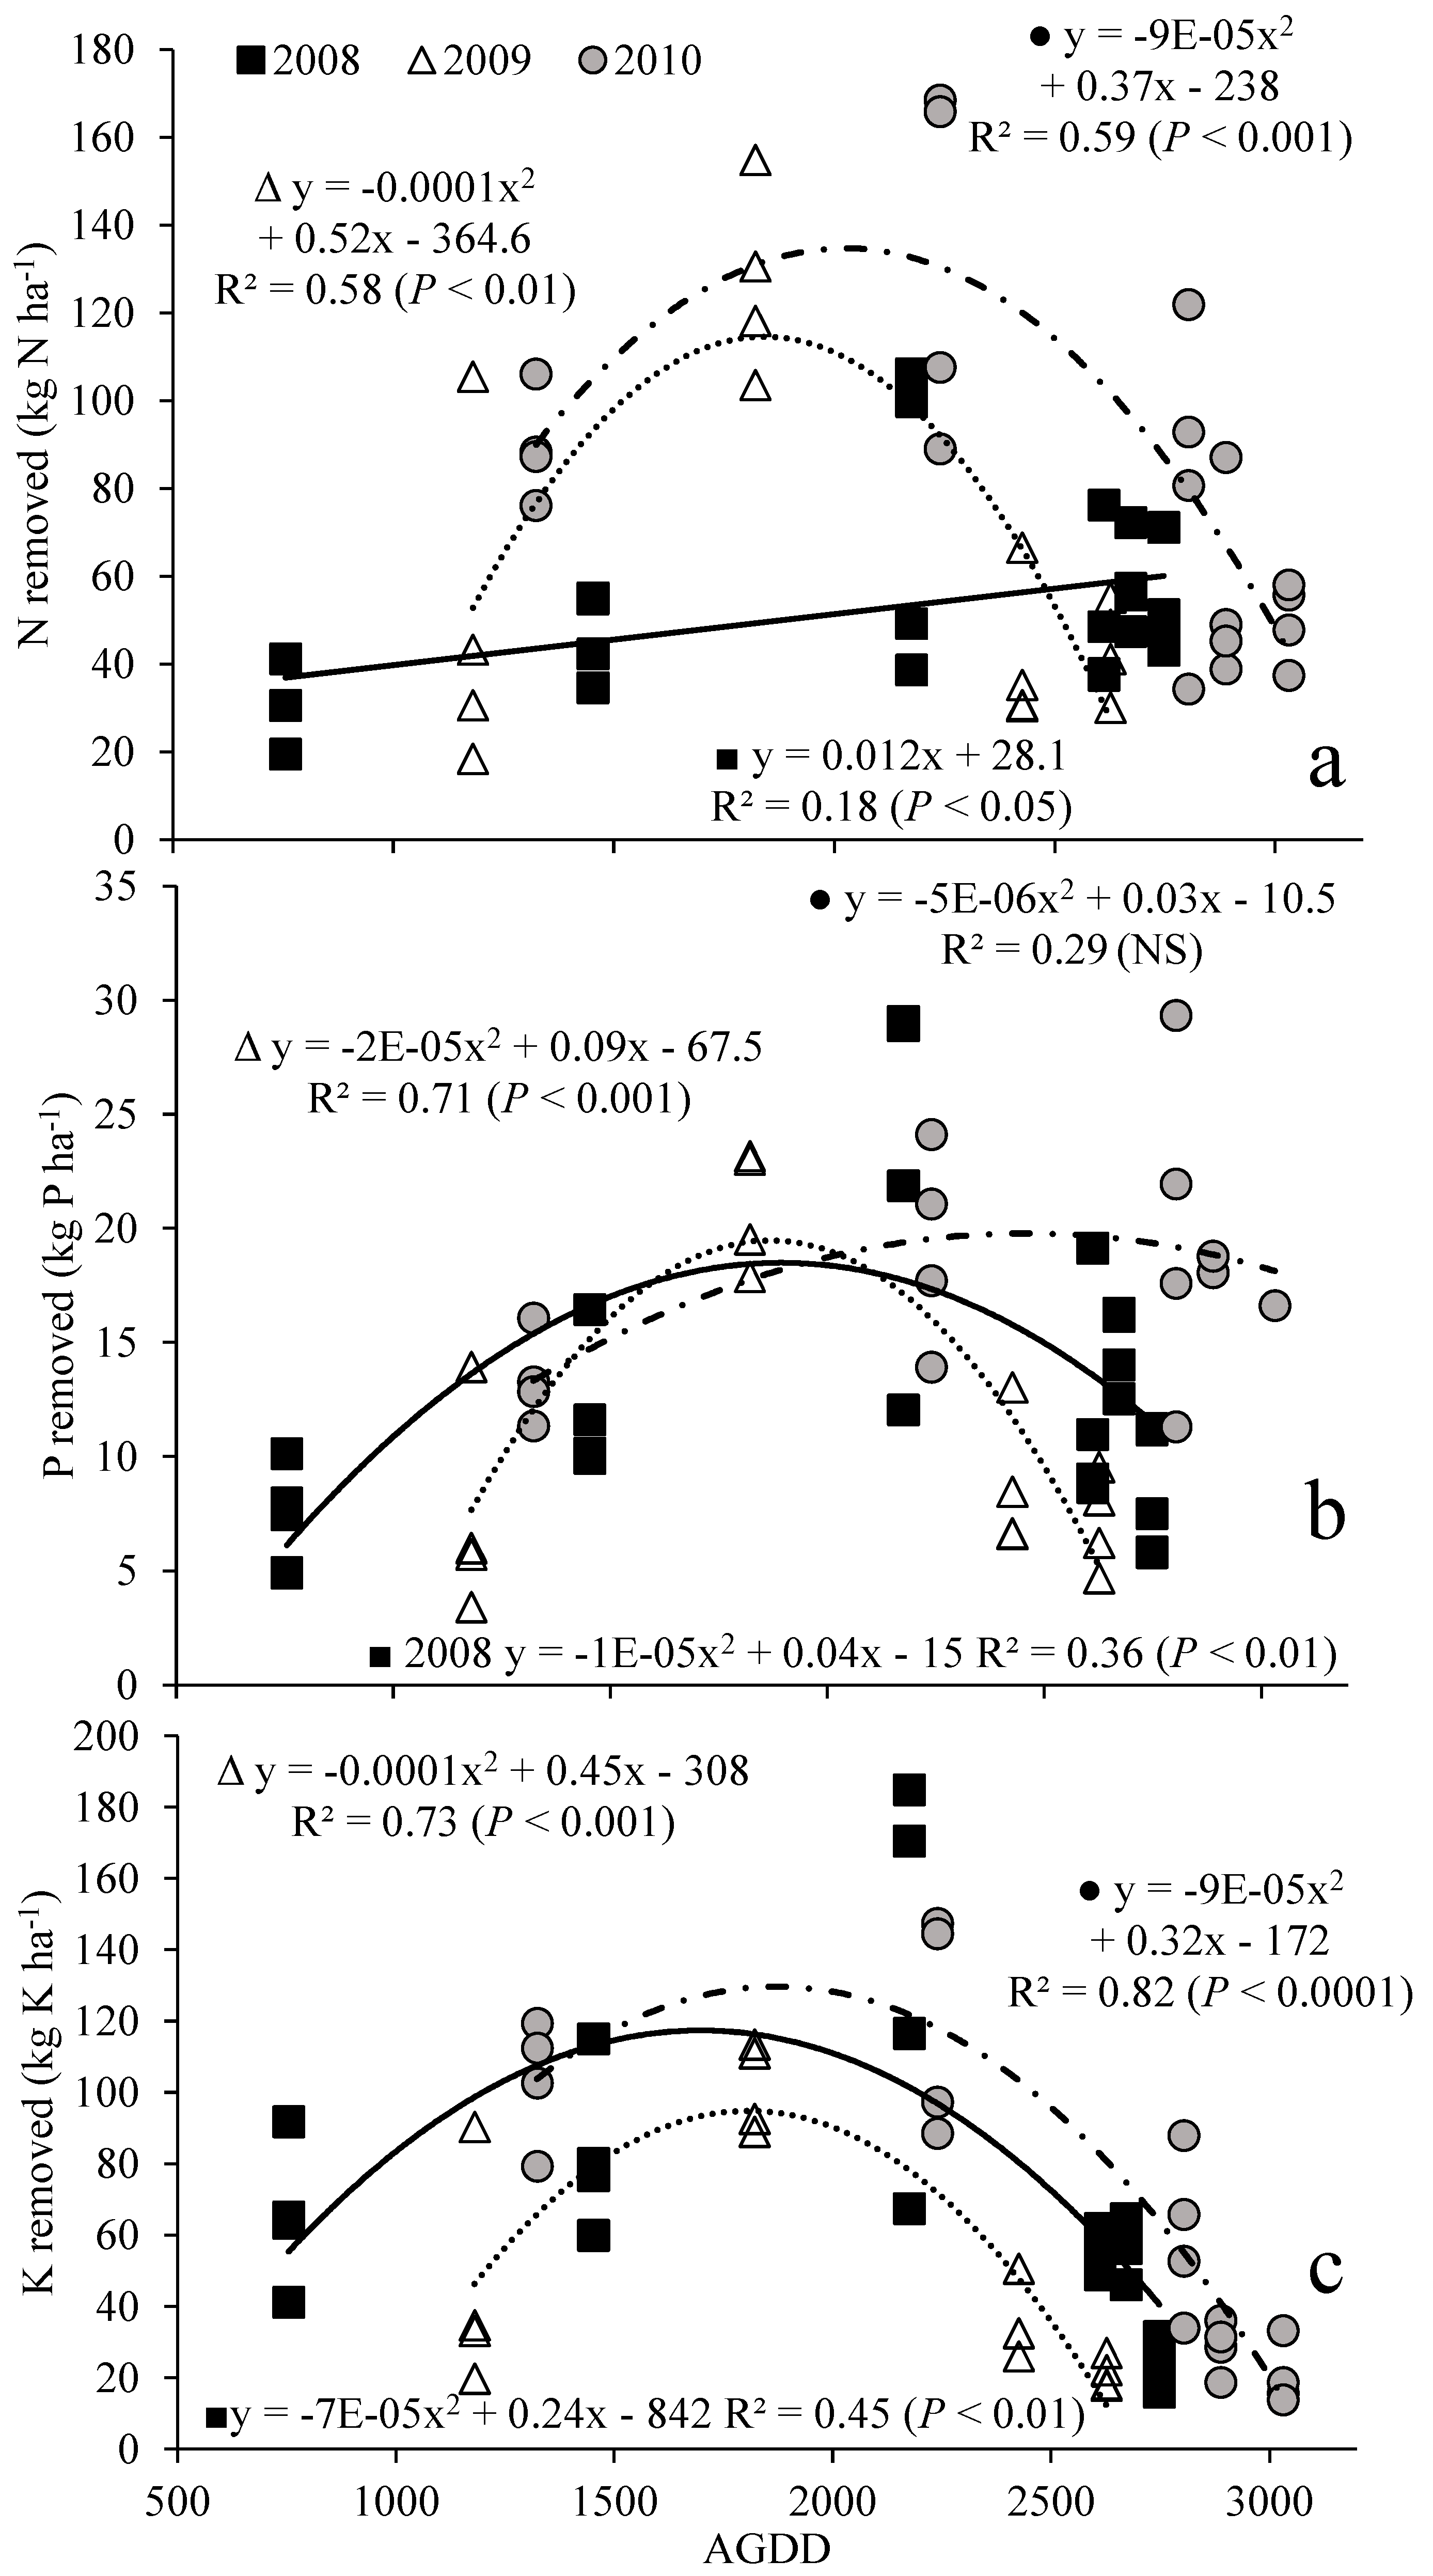
Removal of macronutrients N, P, and K displayed an increasing pattern up to a point with yield, and then decreased with increasing AGDD, with the exception being N in 2008 (Figure 3a). Nitrogen removal in 2008 showed a linear trend, while N removal in 2009 and 2010 showed quadratic trends. Phosphorus removal was described by a quadratic function in 2008 and 2009, but was nonsignificant by either linear or quadratic functions (Figure 3b). Quadratic functions described potassium removal (Figure 3c). In all years, maximum nutrient removal occurred between 1500 and 2500 AGDD. Increases in N removal with harvest were definitely seen in 2009 and 2010.
In simple correlations of yield and nutrient content, as listed in Table 3, the significant negative correlations of N, P, and K as a function of switchgrass yields in 2008 indicated a dilution effect where the nutrients concentrations decreased as the yield increased [46]. This is reflected in the best-fit model for N in 2008 being a linear regression (Figure 3a). However, the nonsignificant correlation obtained for all macronutrients in 2009 and 2010 indicated that no dilution effect had occurred [46]. This suggests that nutrient concentration decreases with an increase in AGDD.
3.3. Nitrogen Dynamics
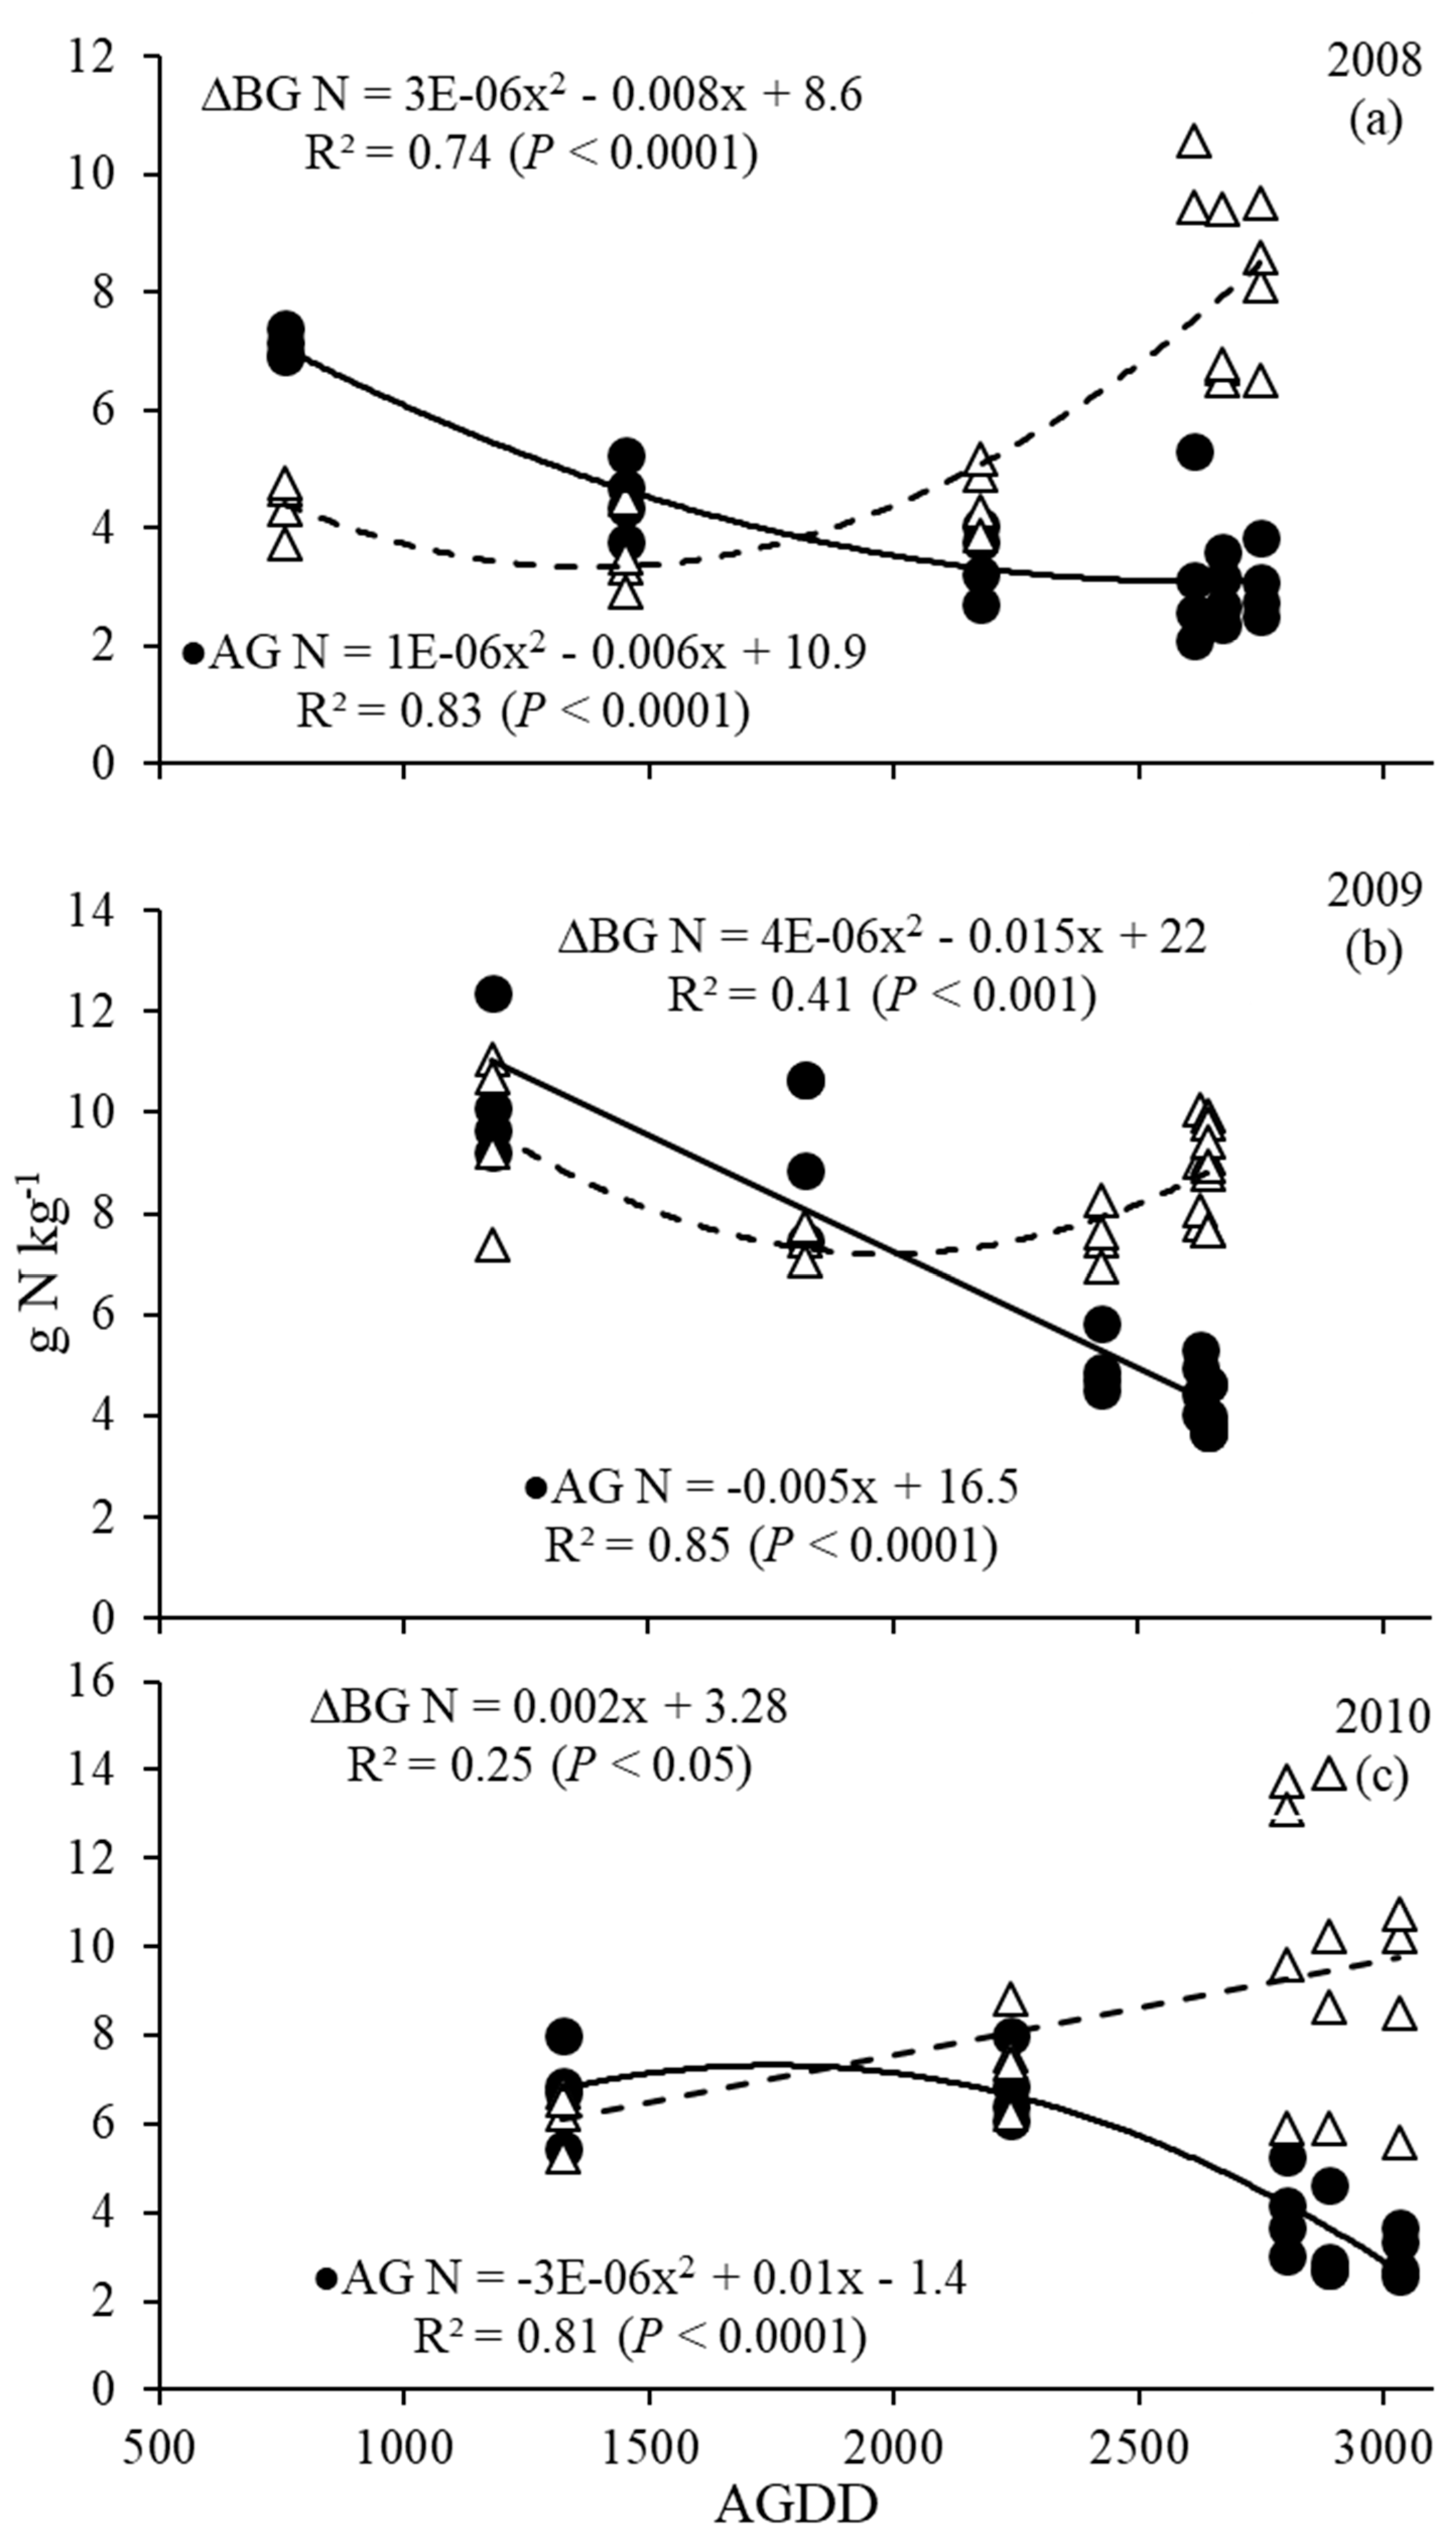
Concentrations of N followed a general trend of decrease in AG harvested biomass and increase with time in BG biomass as AGDD increased for all 3 years (Figure 4), suggesting that N was moving from AG to BG starting at ~1500 to 2000 AGDD (Elongation-Stem elongation to Seed development and ripening) (Figure 4 and Table 2). Changes in AG biomass N concentrations ranged from 7.3 to 2.1 g N kg−1 in 2008 (Figure 4a), 12.4 to 3.7 g N kg−1 in 2009 (Figure 4b) and 8.0 to 2.6 g N kg−1 in 2010 (Figure 4c). Nitrogen concentrations in the BG biomass ranged from 2.9 to 10.6 g N kg−1 in 2008 (Figure 4a), from 7.0 to 11.1 g N kg−1 in 2009 (Figure 4b) and 5.3 to 13.9 g N kg−1 in 2010 (Figure 4c). There seemed to be an equal N concentration between the AG and BG portions of the plant at around the same time each year, which was between AGDD 1500 and 2000, (late July, early August), ranging from 4.0 to 9.0 g kg−1. Quadratic models were significant for each year in describing nitrogen dynamics, except for N concentration in AG in 2009 and BG biomass in 2010 (Figure 4).
3.4. Phosphorus and Potassium Dynamics
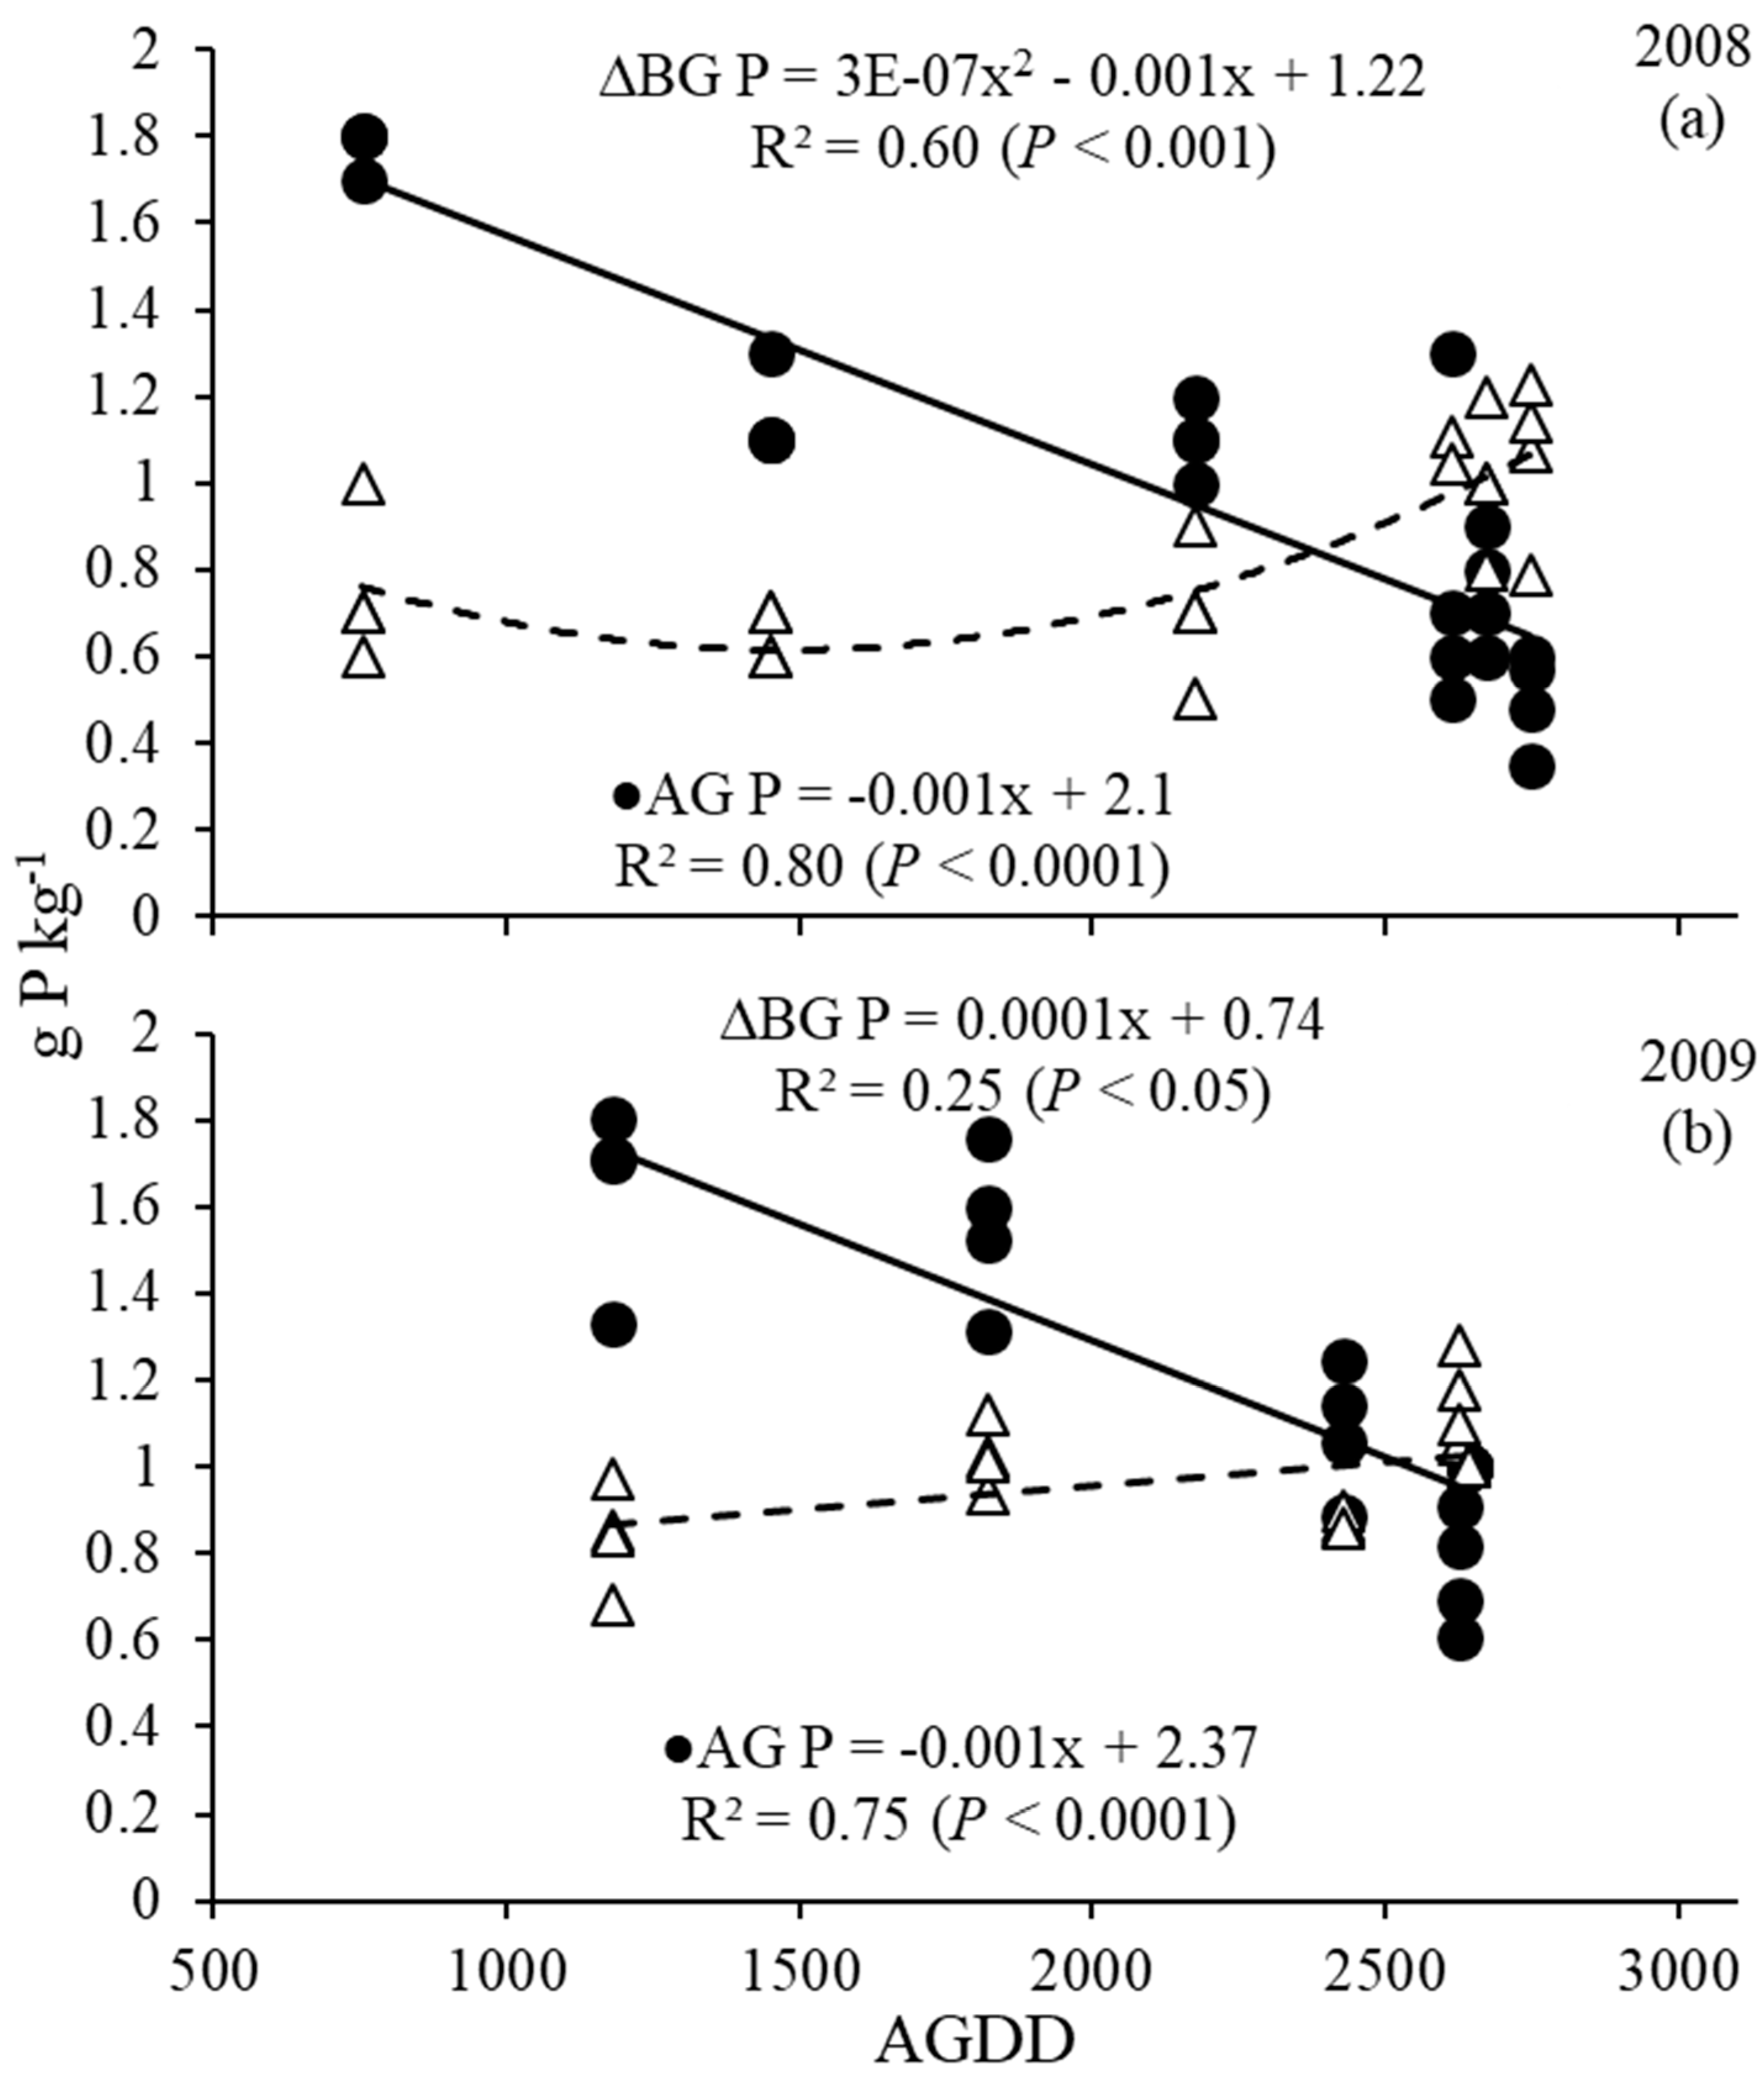
Overall, phosphorus (P) concentrations in the AG biomass ranged from 1.8 to 0.4 g P kg−1 in 2008 and 1.8 to 0.6 g P kg−1 in 2009; and 0.5 to 1.1 g P kg−1 in 2008 and 0.7 to 1.2 g P kg−1 in 2009 in the BG biomass. AG and BG P concentrations for 2008 and 2009 were described with significant linear trends with AGDD (Figure 5), and sharp decreases in AG P, as well as slight increases in BG P, were observed as AGDD increased. Increases in BG P were more prominent in 2008 than in 2009. The P data for 2010 are not available due to an analytical problem.
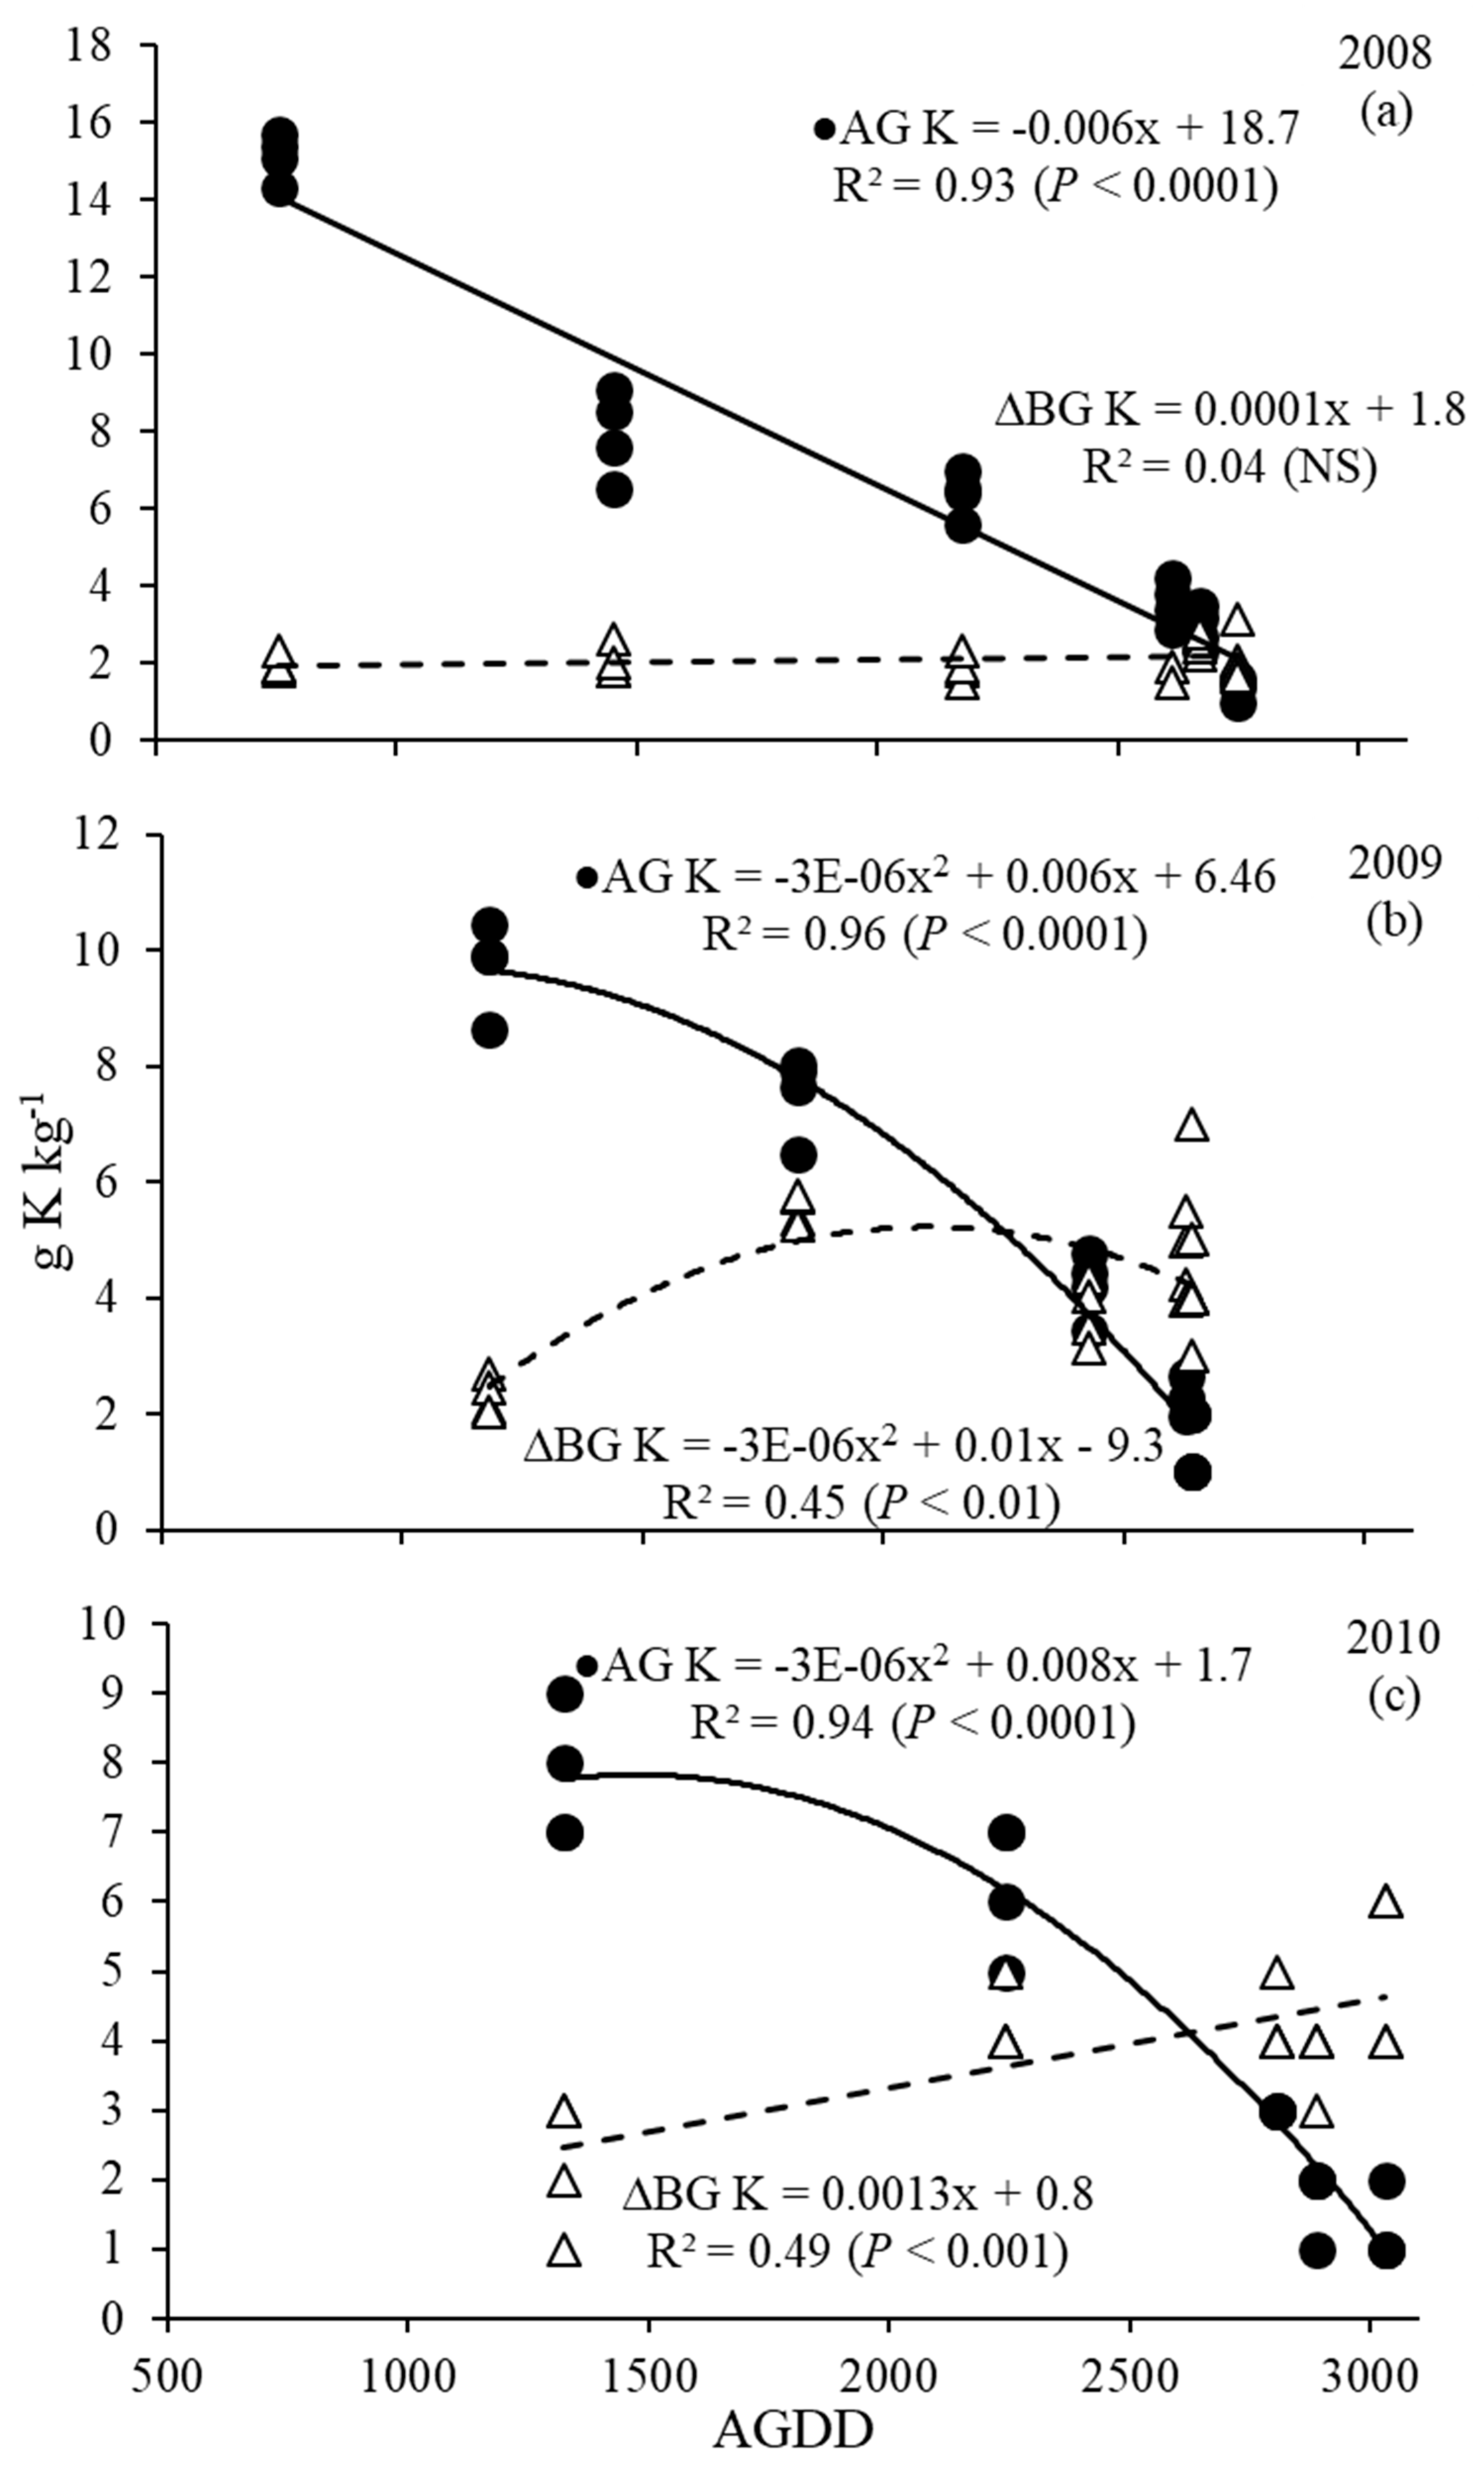
Potassium concentrations in the AG biomass ranged from 15.7 to 1.0 g K kg−1 in 2008, from 10.4 to 1.0 g K kg−1 in 2009 and from 9.0 to 1.0 g K kg−1 in 2010. Belowground biomass K concentrations ranged from 1.5 to 3.1 g K kg−1 in 2008, 2.1 to 7.0 g K kg−1 in 2009 and 1.0 to 6.0 g K kg−1 in 2010 (Figure 6 a, b, c, respectively). In all years, AG and BG were described with a significant linear or quadratic model, except for the BG K concentration in 2008 (p > 0.05).
3.5. Secondary and Micronutrient Dynamics
Secondary and micronutrients did not exhibit the aforementioned patterns of increasing concentrations in BG biomass and decrease in AG biomass with time as definitively as N, P and K (Table 4). Calcium (Ca), magnesium (Mg) and sulfur (S) displayed decreases in AG and increases in BG in 2008 and 2009. For both years, Ca ranged from 3.2 to 1.0 g kg−1 AG and 1.0 to 4.7 g kg−1 in BG biomass. Magnesium showed a decrease in both AG and BG ranging from 2.4 to 0.8 g kg−1 AG and 0.8 to 1.5 g kg−1 BG. Micronutrients were not consistent from year to year in AG and BG concentration changes. Sodium (Na) had slight increases in AG and BG for 2008, but slight decreases in 2009, ranging from 0.1 to 0.5 g kg−1 AG, and 0.3 to 1.2 g kg−1 BG in 2008, and 0.5 to 0.1 g kg−1 AG and 1.4 to 0.6 g kg−1 BG in 2009. Copper (Cu) and nickel (Ni) displayed similar trends as Na. Copper ranged from 1.42 to 325 mg kg−1 in AG and 13.7 to 2055 mg kg−1 in BG biomass in 2008, and 12 to 1.0 mg kg−1 AG and 35 to 15 mg kg−1 BG in 2009. Meanwhile, Ni ranged from 0.13/4.26 to 83.7/97.6 mg kg−1 in AG/BG in 2008 and 75.5/179 to 0.13/2.3 mg kg−1 in AG/BG biomass in 2009. Since the soil nutrient availability was similar between 2008 and 2009 (Table 1), the reason for this increase in one year followed by a decrease the next year may be the dilution effect of increased AG and BG biomasses in 2009 lowering the concentration of micronutrients in plant tissues.
Iron (Fe) displayed no significant trends in AG in any year (ranging from 34.6 to 194 mg kg−1). For BG portions, Fe decreased in both 2008 and 2009 and had no significant increase in 2010 (range from 52.6 to 6456 mg kg−1 across all years). Manganese (Mn) decreased in AG and BG for 2008 and 2009 (98.5 to 24.7 mg kg−1 AG and 417 to 69.0 mg kg−1 BG). Zinc (Zn) displayed decreases in AG and BG, except for 2010, with an increase in BG, ranging from 6.76 to 34.5 mg kg−1 AG and 23.8 to 113.7 mg kg−1 BG (Table 4).
4. Discussion
The variable yield responses shown in the harvests are a natural occurrence in switchgrass growth and development throughout the growing season. Inconsistent trends in switchgrass yield, such as those seen here, have been noted in other studies as well [47,48,49].
As the growing season progresses, the plant matures and moves towards flowering and seed production, and then to senescence (Table 2). Ashworth et al. [10] found a peak of N uptake in AG yields in August at 80 kg N ha−1 (2009) and 141 kg N ha−1 (2010). Makaju et al. [20] studied changes in nutrient concentrations monthly, and found insignificant changes in N concentrations in the winter months. At this time, insignificant changes in AG and BG N concentrations would be expected, since physiologically, the plant has met its reproductive goal, i.e., producing seed.
A general pattern of nutrient concentrations of the AG portions decreasing over time as BG concentrations increased was seen, especially with the primary macronutrients (N, P, and K). Ashworth et al. [10] found peaks of P uptake in July and August at 15.7 kg P ha−1 (2009) and 16.8 kg P ha−1 (2010). Ashworth et al. [10] also observed peak K removal of 136 kg K ha−1 in early July 2009 (DOY 184, AGDD 1180) and 185 kg K ha−1 in June 2010 (DOY 165, AGDD 788). In another study, Ashworth et al. [9] found peaks in AG concentrations in mid-September at approximately 1.75 kg Mg−1 on a dry matter basis (DM) for both P and K.
Peaks in concentrations of P and K in BG portions were found in the late winter or early spring of the following year (for P, 1.3 g kg−1 in 2008 and 1.2 g kg−1 in 2009; for K, 2.2 g kg−1 in 2008, 7.0 g kg−1 in 2009, and 6.0 g kg−1 in 2010), at the last harvests in February (2010 DOY 449, AGDD 3031) and March (2008 DOY 425, AGDD 2748, and 2009 DOY 426, AGDD 2642). Makaju et al. [20] found significant (p = 0.001) changes in P and K concentrations of AG biomass even in the winter months in monthly harvests.
Changes in nutrient removal with AG harvest indicate a decrease in nutrient concentration with increasing AGDD. Unfortunately, no yield data was recorded for BG harvests (roots). These changes in nutrient removal with AG harvests enhance our understanding of nutrient concentrations of whole plant samples.
Secondary and micronutrients did not display a consistent decreasing pattern in AG concentrations with increasing BG concentrations, because they varied from year to year, depending on the nutrient, except for S and perhaps Ca. More field research is needed to determine the secondary and micronutrient dynamics over time during the switchgrass growth cycle.
The results from this study support previous findings that N is transported from the AG to BG biomass in switchgrass [50,51,52,53,54]. It was also observed that plants harvested in the early season did not regrow, suggesting that early harvest may limit the ability of switchgrass to regrow for a second harvest. This is likely due to a lack of nutrient translocation to the root system to replenish growth [55]. Several studies have supported switchgrass harvesting once a year after frost to allow a maximal translocation of nutrients and the establishment of storage reserves in the roots to occur [4,6,21,22,56,57]. Indeed, seasonal nutrient translocation would seem to contribute to the next season’s growth, as nutrient movement to the root system allows switchgrass to overwinter and is a key component in its perennial plant growth. Nutrients stored in the BG parts in the early growing season make the plant less reliant on anthropogenic nutrient sources. This type of translocation and the BG storage of certain nutrients has been observed in other native grasses [29,51]. Native C4 grasses developed these nutrient-cycling characteristics over many years during their evolution [12,19,50,58]. The connection between high N requirements for optimum AG production and relatively low fertilizer N use efficiency by switchgrass, as observed in other studies [59,60,61], could be also explained by N translocation within the plant. It is reasonable to assume that increases of N in the BG would serve the purpose of aiding regrowth the following spring in perennial plants such as switchgrass [13,61].
Perennial grasses, such as switchgrass, remobilize nutrients from AG to BG late in the growing season, which affects the levels of N, P, and K in harvested material, depending on harvest time [5,22,62]. Thomas [63] reported the importance of the senescence process in the plant’s life cycle, and that time is a stress factor triggering responses leading to senescence, nutrient remobilization and recycling. Blagosklonny and Hall [64] suggested that senescence should be seen as a nutrient-driven process in cells. Particularly, the transition and relocation of nutrients and remobilization occur after nutrient uptake and assimilation [65]. Other studies have observed that translocation occurred in response to drought, fire or other stresses [9,13,20], although these are an integral part of the life cycle of many prairie grasses and other plants. In addition to these naturally occurring environmental stresses, time needs to be included as a stress factor [63]. Gregersen et al. [66] noted that leaf senescence should be viewed more as recycling for nutrient management. Nutrient concentrations change in AG and BG occur with the aging of the plant and senescence. However, changes in the nutrients concentration in various plant tissues can occur for many reasons, and it should not be assumed that there is a direct transfer of nutrients from one tissue to another simply because the concentrations indicated this. For example, in the case of nitrogen (N), switchgrass stems have lower N concentrations compared to leaves; thus, as the plants develop and the ratio of stems to leaves increases, so the overall concentration of N increases in the total AG biomass [3].
The timing of nutrient translocation can affect decisions on harvest timing, in relation to plant regrowth of the following year and the sustainability of the switchgrass stand. Harvests need to be timed to take place after an adequate amount of nutrient translocation has occurred so that the subsequent regrowth can benefit. If switchgrass is to be cultivated as a commercially viable crop, it will likely be as a dual-purpose switchgrass, i.e., either grazed or harvested as hay for livestock and then again as biofuel feedstock postsenescence. Harvests for hay occurring in the early season, e.g., June, have higher nutrient concentrations than later harvests. Therefore, the quality of early harvested forage will be better than that of late-harvested forage for hay [50,60,62]. On the other hand, late-season switchgrass harvests will have lower N and mineral concentrations than early season harvests, which makes them suitable for biofuel conversion. Harvest timing for biomass quality may be the most important management difference between biofuel feedstock and forage production systems [7,66,67,68,69].
5. Conclusions
Yields and nutrient concentrations within switchgrass undergo significant changes throughout the growing season. Significant decreases of N, P, and K concentrations in AG and an increase in BG plant portions occur as switchgrass moves to senescence in its life cycle. However, no micronutrients displayed consistent trends in AG and BG concentrations. Understanding the dynamics of nutrient uptake and cycling within the plant is essential to nutrient management, and harvesting time for different purposes.
Author Contributions
Conceptualization, J.M. and H.Z.; methodology, J.M. and H.Z. validation, J.M., H.Z., and J.A.; formal analysis, J.A.; investigation, J.M. and H.Z.; resources, J.M.; data curation, J.M., H.Z., and J.A.; writing—original draft preparation, J.M.; writing—review and editing, J.A. and H.Z.; visualization, J.M.; supervision, H.Z.; project administration, H.Z.; funding acquisition, H.Z. All authors have read and agreed to the published version of the manuscript.
Funding
This research was partially funded by the Oklahoma Bioenergy Center and Oklahoma Agricultural Experiment Station.
Conflicts of Interest
The authors declare no conflict of interest.
References
- Von Haden, A.C.; Dornbush, M.E. Prairies thrive where row crops drown: A comparison of yields in upland and lowland topographies in the Upper Midwest US. Agronomy 2016, 6, 32. [Google Scholar] [CrossRef] [Green Version]
- Márquez, C.O.; García, V.J.; Schultz, R.C.; Isenhart, T.M. Assessment of soil aggradation through soil aggregation and particulate organic matter by riparian switchgrass buffers. Agronomy 2017, 7, 76. [Google Scholar] [CrossRef] [Green Version]
- Fike, J.H.; Parrish, D.J.; Wolf, D.D.; Balasko, J.A.; Green, J.T.; Rasnake, M.; Reynolds, J.H. Long-Term yield potential of switchgrass-for-biofuel systems. Biomass Bioenergy 2006, 30, 198–206. [Google Scholar] [CrossRef]
- Guretzky, J.A.; Biermacher, J.T.; Cook, B.J.; Kering, M.K.; Mosali, J. Switchgrass for forage and bioenergy: Harvest and nitrogen rate effects on biomass yields and nutrient composition. Plant Soil 2011, 339, 69–81. [Google Scholar] [CrossRef] [Green Version]
- Kering, M.K.; Butler, T.J.; Biermacher, J.T.; Guretzky, J.A. Biomass yield and nutrient removal rates of perennial grasses under nitrogen fertilization. Bioenergy Res. 2011, 5, 61–70. [Google Scholar] [CrossRef]
- Muir, J.P.; Sanderson, M.A.; Ocumpaugh, W.R.; Jones, R.M.; Reed, R.L. Biomass production of ‘Alamo’ switchgrass in response to nitrogen, phosphorus, and row spacing. Agron. J. 2001, 93, 896–901. [Google Scholar] [CrossRef]
- Jach-Smith, L.C.; Jackson, R.D. Inorganic N addition replaces N supplied to switchgrass (Panicum virgatum by arbuscular mycorrhizal fungi. Ecol. Appl. 2020, 30, 1–11. [Google Scholar] [CrossRef]
- Parrish, S.D.J.; Wolfe, D.D.; Fike, J.H.; Daniels, W.L. Switchgrass as a Biofuels Crop for the Upper Southeast: Cultivar Trials and Cultural Environments; Final Report for 1997–2001. ORNL/SUB-03-19XSY163/01; Oak Ridge National Laboratory: Oak Ridge, TN, USA, 2003. [Google Scholar]
- Ashworth, A.J.; Allen, F.L.; Bacon, J.L.; Sams, C.E.; Hart, W.E.; Grant, J.F.; Moore, P.A., Jr.; Pote, D.H. Switchgrass cultivar, yield, and nutrient removal responses to harvest timing. Agron. J. 2017, 109, 2598–2605. [Google Scholar] [CrossRef] [Green Version]
- Ashworth, A.J.; Rocateli, A.C.; West, C.P.; Brye, K.R.; Popp, M.P. Switchgrass growth and effects on biomass accumulation, moisture content, and nutrient removal. Agron. J. 2017, 109, 1359–1367. [Google Scholar] [CrossRef] [Green Version]
- Clark, F.E. Internal cycling of 15Nitrogen in shortgrass prairie. Ecology 1977, 58, 1322–1333. [Google Scholar] [CrossRef]
- Chapin, F.S., III. The mineral nutrition of wild plants. Ann. Rev. Ecol. Syst. 1980, 11, 233–260. [Google Scholar] [CrossRef]
- Parrish, D.J.; Fike, J.H. The biology and agronomy of switchgrass for biofuels. Crit. Rev. Plant Sci. 2005, 24, 423–459. [Google Scholar] [CrossRef]
- Heggenstaller, A.H.; Moore, K.J.; Liebman, M.; Anex, R.P. Nitrogen influences biomass and nutrient partitioning by perennial, warm-season grasses. Agron. J. 2009, 101, 1363–1371. [Google Scholar] [CrossRef]
- Heckathorn, S.A.; DeLucia, E.H. Drought-Induced nitrogen translocation in perennial C4 grasses of tallgrass prairie. Ecology 1994, 75, 1877–1886. [Google Scholar] [CrossRef]
- Heckathorn, S.A.; DeLucia, E.H. Retranslocation of shoot nitrogen to rhizomes and roots in prairie grasses may limit loss of N to grazing and fire during drought. Funct. Ecol. 1996, 10, 396–400. [Google Scholar] [CrossRef]
- Clark, R.B. Differences among mycorrhizal fungi for mineral uptake per root length of switchgrass grown in acidic soil. J. Plant Nutr. 2002, 25, 1753–1772. [Google Scholar] [CrossRef]
- Petipas, R.H.; Bowsher, A.W.; Bekkering, C.S.; Jack, C.N.; Mclachlan, E.E.; White, R.A.; Younginger, B.S.; Tiemann, L.K.; Evans, S.E.; Friesen, M.L. Interactive effects of microbes and nitrogen on Panicum virgatum root functional traits and patterns of phenotypic selection. Int. J. Plant Sci. 2020, 181, 20–32. [Google Scholar] [CrossRef]
- Brejda, J.J. Fertilization of Native Warm-Season Grasses. In Native Warm Season Grasses: Research Trends and Issues; Moore, K.J., Anderson, B.E., Eds.; CSSA Special Publication; CSSA: Madison, WI, USA, 2000; Volume 30. [Google Scholar] [CrossRef]
- Makaju, S.O.; Wu, Y.Q.; Zhang, H.; Kakani, V.G.; Taliaferro, C.M.; Anderson, M.P. Switchgrass winter yield, year-Round elemental concentrations, and associated soil nutrients in a zero input environment. Agron. J. 2013, 105, 463–470. [Google Scholar] [CrossRef] [Green Version]
- Vogel, K.P.; Brejda, J.J.; Walters, D.T.; Buxton, D.R. Switchgrass biomass production in the Midwest USA: Harvest and nitrogen management. Agron. J. 2002, 94, 413–420. [Google Scholar] [CrossRef]
- Heaton, E.A.; Dohleman, F.G.; Long, S.P. Seasonal nitrogen dynamics of Miscanthus x giganteus and Panicum virgatum. Glob. Chang. Biol. Bioenergy 2009, 1, 297–307. [Google Scholar] [CrossRef]
- Propheter, J.L.; Staggenborg, S.A.; Wu, X.; Wang, D. Performance of annual and perennial biofuel crops: Yield during the first two years. Agron. J. 2010, 102, 806–814. [Google Scholar] [CrossRef]
- Wilson, D.M.; Dalluge, D.L.; Rover, M.; Heaton, E.A.; Brown, R.C. Crop management impacts biofuel quality: Influence of switchgrass harvest time on yield, nitrogen and ash of fast pyrolysis products. Bioenergy Res. 2013, 6, 103–113. [Google Scholar] [CrossRef]
- Reynolds, J.H.; Walker, C.L.; Kirchner, M.J. Nitrogen removal in switchgrass biomass under two harvest systems. Biomass Bioenergy 2000, 19, 281–286. [Google Scholar] [CrossRef]
- Kimura, E.; Collins, H.P.; Fransen, S. Biomass production and nutrient removal by switchgrass under irrigation. Agron. J. 2015, 107, 204–210. [Google Scholar] [CrossRef]
- Mislevy, P.; Martin, F.G. Biomass yield and forage nutritive value of Cynodon grasses harvested monthly. Soil Crop Sci. Soc. Fla. Proc. 2006, 65, 9–14. [Google Scholar]
- Soil Survey Staff. Natural Resources Conservation Service, United States Department of Agriculture. Web Soil Survey. Available online: https://websoilsurvey.sc.egov.usda.gov/App/HomePage.htm (accessed on 2 October 2019).
- Anderson, E.K.; Parrish, A.S.; Voight, T.B.; Owens, V.N.; Hong, C.-H.; Lee, D.K. Nitrogen fertility and harvest management of switchgrass for sustainable bioenergy feedstock production in Illinois. Ind. Crops Prod. 2013, 48, 19–27. [Google Scholar] [CrossRef]
- Fike, J.H.; Parrish, D.J.; Wolf, D.D.; Balasko, J.A.; Green, J.T.; Rasnake, M.; Reynolds, J.H. Switchgrass production for the upper southeastern USA: Influence of cultivar and cutting frequency on biomass yields. Biomass Bioenergy 2006, 30, 207–213. [Google Scholar] [CrossRef]
- Thomas, J.S. Soil pH and Soil Acidity. In Methods of Soil Analysis; Sparks, D.L., Ed.; Part 3. SSSA Book Series 5; SSSA: Madison, WI, USA, 1996; pp. 475–490. [Google Scholar] [CrossRef] [Green Version]
- Kachurina, O.M.; Zhang, H.; Raun, W.R.; Krenzer, E.G. Simultaneous determination of soil aluminum, ammonium- and nitrate-nitrogen using 1 M potassium chloride extraction. Commun. Soil Sci. Plant Anal. 2000, 31, 893–903. [Google Scholar] [CrossRef]
- Mehlich, A. Mehlich 3 soil test extractant: A modification of Mehlich 2 extractant. Commun. Soil Sci. Plant Anal. 1984, 15, 1409–1416. [Google Scholar] [CrossRef]
- Hanson, D.; Kotuby-Amacher, J.; Miller, R.O. Soil analysis: Western States Proficiency Testing Program for 1996. Anal. Bioanal. Chem. 1998, 360, 348–350. [Google Scholar] [CrossRef]
- Soltanpour, P.N.; Johnson, G.W.; Workman, S.M.; Jones, J.B., Jr.; Miller, R.O. Inductively Coupled Plasma Emission Spectrometry and Inductively Coupled Plasma-Mass Spectrometry. In Methods of Soil Analysis; Sparks, D.L., Ed.; Part 3. Chemical Methods. SSSA Book Series 5; SSSA: Madison, WI, USA; ASA: Madison, WI, USA, 1996; pp. 91–139. [Google Scholar] [CrossRef] [Green Version]
- Oklahoma Mesonet. Available online: www.mesonet.org (accessed on 10 October 2019).
- Sena, K.L.; Goff, B.; Davis, D.; Smith, S.R. Switchgrass growth and forage quality trends provide insight for management. Crop Forage Turfgrass Manag. 2018, 4, 170053. [Google Scholar] [CrossRef]
- Sanderson, M.A.; Moore, K.J. Switchgrass morphological development predicted from day of the year or degree day models. Agron. J. 1999, 91, 732–734. [Google Scholar] [CrossRef]
- Dhillon, J.; Figueiredo, B.; Eickhoff, E.; Raun, W. Applied use of growing degree days to refine optimum times for nitrogen stress sensing in winter wheat (Triticum aestivum L.). Agron. J. 2019, 112, 537–549. [Google Scholar] [CrossRef] [Green Version]
- Mitchell, R.B.; Moore, K.J.; Moser, L.E.; Fritz, J.O.; Redfearn, D.D. Predicting developmental morphology in switchgrass and big bluestem. Agron. J. 1997, 89, 827–832. [Google Scholar] [CrossRef] [Green Version]
- Moore, K.J.; Moser, L.E.; Vogel, K.P.; Waller, S.S.; Johnson, B.E.; Pedersen, J.F. Describing and quantifying growth stages of perennial forage grasses. Agron. J. 1991, 83, 1073–1077. [Google Scholar] [CrossRef] [Green Version]
- Moore, K.J.; Moser, L.E. Quantifying developmental morphology of perennial grasses. Crop Sci. 1995, 35, 37–43. [Google Scholar] [CrossRef]
- Massey, J.R.; Antonangelo, J.A.; Zhang, H. Nitrogen affecting switchgrass yield, nitrogen removal and use efficiency. Agrosyst. Geosci. Environ. 2020, 3. [Google Scholar] [CrossRef]
- Jones, J.B.; Case, V.W. Sampling, Handling, and Analyzing Plant Tissue Samples. In Soil Testing and Plant Analysis, 3rd ed.; Westerman, R.L., Ed.; SSSA: Madison, WI, USA, 1990; pp. 404–410. [Google Scholar] [CrossRef]
- Undersander, D.; Mertens, D.R.; Thiex, N. Forage Analysis Procedures; National Forage Testing Association: Omaha, NE, USA, 1993. [Google Scholar]
- Antonangelo, J.A.; Zhang, H. Heavy metal phytoavailability in a contaminated soil of northeastern Oklahoma as affected by biochar amendment. Environ. Sci. Pollut. Res. 2019, 26, 33582–33593. [Google Scholar] [CrossRef]
- Mulkey, V.R.; Owens, V.N.; Lee, D.K. Management of switchgrass-dominated Conservation Reserve Program lands for biomass production in South Dakota. Crop Sci. 2006, 46, 712–720. [Google Scholar] [CrossRef]
- Hong, C.O.; Owens, V.N.; Bransby, D.; Farris, R.; Fike, J.; Heaton, E.; Kim, S.; Mayton, H.; Mitchell, R.; Viands, D. Switchgrass response to nitrogen fertilizer across diverse environments in the USA: A regional feedstock partnership report. Bioenergy Res. 2014, 7, 777–788. [Google Scholar] [CrossRef]
- Aurangzaib, M.; Moore, K.J.; Lenssen, A.W.; Archontoulis, S.V.; Heaton, E.A.; Fei, S. Developmental morphology and biomass yield of upland and lowland switchgrass ecotypes grown in Iowa. Agronomy 2018, 8, 61. [Google Scholar] [CrossRef] [Green Version]
- Dubeux, J.C.B., Jr.; Sollenberger, L.E.; Mathews, B.W.; Scholberg, J.M.; Santos, H.Q. Nutrient cycling in warm-Climate grasslands. Crop Sci. 2007, 47, 915–928. [Google Scholar] [CrossRef]
- Yang, J.; Worley, E.; Ma, Q.; Li, J.; Torres-Jerez, I.; Li, G.; Zhao, P.X.; Xu, Y.; Tang, Y.; Udvardi, M. Nitrogen remobilization and conservation, and underlying senescence-Associated gene expression in the perennial switchgrass Panicum virgatum. New Phytol. 2016, 211, 75–89. [Google Scholar] [CrossRef] [PubMed] [Green Version]
- Dell, C.J.; Williams, M.A.; Rice, C.W. Partitioning of nitrogen over five growing seasons in tallgrass prairie. Ecology 2005, 86, 1280–1287. [Google Scholar] [CrossRef] [Green Version]
- Bausenwein, U.; Millard, P.; Raven, J.A. Remobilized old-Leaf nitrogen predominates for spring growth in two temperate grasses. New Phytol. 2001, 152, 283–290. [Google Scholar] [CrossRef]
- Dohleman, F.G.; Heaton, E.A.; Arundale, R.A.; Long, S.P. Seasonal dynamics of above- and below-Ground biomass and nitrogen partitioning in Miscanthus x giganteus and Panicum virgatum across three growing seasons. GCB Bioenergy 2012, 4, 534–544. [Google Scholar] [CrossRef] [Green Version]
- Wilson, D.M.; Heaton, E.A.; Liebman, M.; Moore, K.J. Intraseasonal changes in switchgrass nitrogen distribution compared with corn. Agron. J. 2013, 105, 285–294. [Google Scholar] [CrossRef]
- Thomason, W.E.; Raun, W.R.; Johnson, G.V.; Taliaferro, C.M.; Freeman, K.W.; Wynn, K.J.; Mullen, R.W. Switchgrass response to harvest frequency and time and rate of applied nitrogen. J. Plant Nutr. 2005, 27, 1199–1226. [Google Scholar] [CrossRef]
- Staley, T.E.; Stout, W.L.; Jung, G.A. Nitrogen use by tall fescue and switchgrass on acidic soils of varying water holding capacity. Agron. J. 1991, 83, 732–738. [Google Scholar] [CrossRef]
- Stout, W.L.; Jung, G.A. Biomass and nitrogen accumulation in switchgrass: Effects of soil and environment. Agron. J. 1995, 87, 663–669. [Google Scholar] [CrossRef]
- Garten, C.T., Jr.; Smith, J.; Tyler, D.; Amonette, J.; Bailey, V.; Brice, D.; Castro, H.; Graham, R.; Gunderson, C.; Izaurralde, R. Intra-Annual changes in biomass, carbon, and nitrogen dynamics at 4-year old switchgrass field trials in west Tennessee, USA. Agric. Ecosyst. Environ. 2010, 136, 177–184. [Google Scholar] [CrossRef]
- Silver, W.L.; Miya, R.K. Global patterns in root decomposition: Comparisons of climate and litter quality effects. Oecologia 2001, 129, 407–419. [Google Scholar] [CrossRef] [PubMed]
- Ma, Z.; Wood, C.; Bransby, D. Impacts of soil management on root characteristics of switchgrass. Biomass Bioenergy 2000, 18, 105–112. [Google Scholar] [CrossRef]
- Adler, P.R.; Sanderson, M.A.; Boateng, A.A.; Weimer, P.J.; Jung, H.-J.G. Biomass yield and biofuel quality of switchgrass harvested in fall or spring. Agron. J. 2006, 98, 1518. [Google Scholar] [CrossRef] [Green Version]
- Thomas, H. Senescence, ageing, and death of the whole plant. New Phytol. 2012, 197, 696–711. [Google Scholar] [CrossRef]
- Blagosklonny, M.V.; Hall, M.N. Growth and aging: A common molecular mechanism. Aging 2009, 1, 357–362. Available online: www.impactaging.com (accessed on 10 April 2019). [CrossRef] [Green Version]
- Masclaux, C.; Quillere, I.; Gallais, A.; Hirel, B. The challenge of remobilisation in plant nitrogen economy. A survey of physio-Agronomic and molecular approaches. Ann. Appl. Biol. 2001, 138, 69–81. [Google Scholar] [CrossRef]
- Gregersen, P.L.; Culetic, A.; Boschian, L.; Krupinska, K. Plant senescence and crop productivity. Plant Mol. Biol. 2013, 82, 603–622. [Google Scholar] [CrossRef]
- Casler, M.D.; Vogel, K.P.; Taliaferro, C.M.; Wynia, R.L. Latitudinal adaptation of switchgrass populations. Crop Sci. 2004, 44, 293–303. [Google Scholar] [CrossRef]
- Sanderson, M.; Reed, R.; Ocumpaugh, W.; Hussey, M.; Esbroeck, G.V.; Read, J.; Tischler, C.; Hons, F. Switchgrass cultivars and germplasm for biomass feedstock production in Texas. Bioresour. Technol. 1999, 67, 209–219. [Google Scholar] [CrossRef]
- Aravindhakshan, S.C.; Epplin, F.M.; Taliaferro, C.M. Switchgrass, bermudagrass, flaccidgrass, and lovegrass biomass yield response to nitrogen for single and double harvest. Biomass Bioenergy 2011, 35, 308–319. [Google Scholar] [CrossRef]
Figure 1.
One of the four plots designed for harvest sampling. The plot measured 6 × 7.5 m.

Figure 2.
Switchgrass yield as a function of AGDD (accumulated growing degree days) harvests in 2008, 2009, and 2010. NS: nonsignificant (p > 0.05).
Figure 2.
Switchgrass yield as a function of AGDD (accumulated growing degree days) harvests in 2008, 2009, and 2010. NS: nonsignificant (p > 0.05).

Figure 3.
Switchgrass nutrient removal of N (a), P (b) and K (c) (kg ha−1) in aboveground (AG) harvests as a function of AGDD (accumulated growing degree days) in 2008, 2009 and 2010. NS: nonsignificant (p > 0.05).
Figure 3.
Switchgrass nutrient removal of N (a), P (b) and K (c) (kg ha−1) in aboveground (AG) harvests as a function of AGDD (accumulated growing degree days) in 2008, 2009 and 2010. NS: nonsignificant (p > 0.05).

Figure 4.
Switchgrass above (AG) and belowground (BG) nitrogen concentration (g N kg−1) as a function of AGDD (accumulated growing degree days) harvests in 2008 (a), 2009 (b) and 2010 (c).
Figure 4.
Switchgrass above (AG) and belowground (BG) nitrogen concentration (g N kg−1) as a function of AGDD (accumulated growing degree days) harvests in 2008 (a), 2009 (b) and 2010 (c).

Figure 5.
Switchgrass above (AG) and belowground (BG) phosphorus concentration (g P kg−1) as a function of AGDD (accumulated growing degree days) harvests in 2008 (a), 2009 (b) and 2010.
Figure 5.
Switchgrass above (AG) and belowground (BG) phosphorus concentration (g P kg−1) as a function of AGDD (accumulated growing degree days) harvests in 2008 (a), 2009 (b) and 2010.

Figure 6.
Switchgrass above- (AG) and below- ground (BG) potassium concentration (g K kg−1) as a function of AGDD (accumulated growing degree days) harvests in 2008 (a), 2009 (b) and 2010 (c). NS: nonsignificant (p > 0.05).
Figure 6.
Switchgrass above- (AG) and below- ground (BG) potassium concentration (g K kg−1) as a function of AGDD (accumulated growing degree days) harvests in 2008 (a), 2009 (b) and 2010 (c). NS: nonsignificant (p > 0.05).


Table 1.
Soil pH and plant available nutrients tested by year (2008, 2009 and 2010). Samples taken prior to fertilization.
Table 1.
Soil pH and plant available nutrients tested by year (2008, 2009 and 2010). Samples taken prior to fertilization.
| Year | pH | NO3-N | P | K | SO4-S | Ca | Mg | Fe | Zn | B | Cu |
|---|---|---|---|---|---|---|---|---|---|---|---|
| kg ha−1 | mg kg−1 | ||||||||||
| 2008 kg N ha−1 | 6.3 ± 0.2 | 3 ± 0.8 | 16 ± 1 | 118 ± 16 | 8.4 ± 0.2 | 1563 ± 125 | 317 ± 32 | 48.5 ± 11 | 0.7 ± 0.1 | 0.34 ± 0.0 | 1.4 ± 0.1 |
| 2009 | 6.2 ± 0.2 | 6.4 ± 2.7 | 17 ± 2 | 109 ± 14 | 5.7 ± 0.3 | 1538 ± 172 | 309 ± 31 | 60.3 ± 9 | 0.8 ± 0.1 | 0.36 ± 0.0 | 1.5 ± 0.0 |
| 2010 | 6.4 ± 0.1 | 2.5 ± 1.5 | 14.9 ± 3 | 110 ± 8 | 5.9 ± 0.5 | 1560 ± 107 | 310.7 ± 16 | 58.4 ± 8 | 0.7 ± 0.2 | 0.27 ± 0.0 | 1.5 ± 0.3 |
±: Standard deviation of the mean (n = 4).
Table 2.
Dates of periodic whole plant biomass harvests from and the accumulated growing degree days (AGDD) according to the Julian Day of the Year (DOY).
Table 2.
Dates of periodic whole plant biomass harvests from and the accumulated growing degree days (AGDD) according to the Julian Day of the Year (DOY).
| Year | Date | AGDD §§ | MSC | Growth Stage | Description |
|---|---|---|---|---|---|
| 2008 | 12 June 2008 | 755 | 2.2 | E1: Elongation-Stem elongation | First node palpable/visible |
| 2008 | 24 July 2008 | 1452 | 3.3 | R2: Reproductive-Floral development | Spikelets fully emerged/peduncle not emerged |
| 2008 | 5 September 2008 | 2175 | 4.6 | S3: Seed development and ripening | Hard dough |
| 2008 | 30 October 2008 | 2611 | 5.3 | -- Postripening/senescence | -- |
| 2008 | 4 December 2008 | 2672 | 5.4 | -- Postripening/senescence | -- |
| 2009 | 28 February 2009 | 2748 | 1.0 | V0: Vegetative-Leaf development | Emergence of 1st leaf |
| 2009 | 3 July 2009 | 1180 | 2.9 | E4: Elongation-Stem elongation | 4th node palpable/visible |
| 2009 | 9 August 2009 | 1822 | 4.0 | S0: Seed development and ripening | Caryopsis visible |
| 2009 | 25 September 2009 | 2426 | 5.0 | S5: Seed development and ripening | Endosperm dry/seed ripe |
| 2009 | 19 November 2009 | 2627 | 5.3 | -- Postripening/senescence | -- |
| 2010 | 26 January 2010 | 2642 | 0.9 | G5: Germination | Coleoptile emergence from soil |
| 2010 | 2 March 2010 | 2642 | 0.9 | G5: Germination | Coleoptile emergence from soil |
| 2010 | 15 July 2010 | 1323 | 3.1 | R1: Reproductive-Floral development | Inflorescence emergence/1st spikelet visible |
| 2010 | 3 September 2010 | 2240 | 4.7 | S4: Seed development and ripening | Endosperm hard/physiological maturity |
| 2010 | 28 October 2010 | 2803 | 5.6 | -- Postripening/senescence | -- |
| 2010 | 2 December 2010 | 2878 | 5.8 | -- Postripening/senescence | -- |
| 2011 | 7 January 2011 | 2888 | 0.9 | G5: Germination | Coleoptile emergence from soil |
| 2011 | 25 March 2011 | 3031 | 1.1 | V1: Vegetative-Leaf development | First leaf collared |
§§: Accumulated Growing Degree Days. MSC: Mean Stage Count (MSC considers AGDD from January 1 of the current year, without taking into account the previous year).
Table 3.
Simple correlation (Pearson) between yields and macronutrients concentration in the aboveground portions (AG) of switchgrass. Results were obtained with all replicate data.
Table 3.
Simple correlation (Pearson) between yields and macronutrients concentration in the aboveground portions (AG) of switchgrass. Results were obtained with all replicate data.
| 2008 | 2009 | 2010 | |||||||
|---|---|---|---|---|---|---|---|---|---|
| Yield | N | P | K | N | P | K | N | P | K |
| 2008 | −0.75 *** | −0.67 *** | −0.74 *** | -- | -- | -- | -- | -- | -- |
| 2009 | -- | -- | -- | −0.08 NS | −0.20 NS | −0.26 NS | -- | -- | -- |
| 2010 | -- | -- | -- | -- | -- | -- | −0.01 NS | -- | −0.18 NS |
***: Significant at p < 0.001. NS: nonsignificant (p > 0.05). “--”: not given.
Table 4.
Significance levels of regression models on nutrient movement through the plant (above ground (AG) and belowground (BG) portions) as a function of different stand ages (AGDD: accumulated growing degree days).
Table 4.
Significance levels of regression models on nutrient movement through the plant (above ground (AG) and belowground (BG) portions) as a function of different stand ages (AGDD: accumulated growing degree days).
| Regression | Plant | Ca | Mg | S | Na | Cu | Fe | Zn | Mn | Ni |
|---|---|---|---|---|---|---|---|---|---|---|
| Model | Portion | p-Value | ||||||||
| 2008 | AG | 0.001 | <0.0001 | <0.0001 | NS | NS | NS | <0.0001 | <0.0001 | 0.008 |
| Linear | BG | NS | 0.0013 | <0.001 | NS | 0.001 | <0.001 | NS | 0.0095 | 0.0003 |
| 2008 | AG | 0.006 | <0.001 | <0.0001 | NS | NS | NS | <0.0001 | <0.0001 | 0.015 |
| Quadratic | BG | NS | 0.002 | <0.0001 | NS | NS | <0.0001 | NS | <0.0001 | <0.0001 |
| 2009 | AG | 0.032 | <0.001 | <0.0001 | NS | <0.0001 | NS | <0.001 | 0.005 | NS |
| Linear | BG | 0.002 | 0.032 | 0.012 | NS | 0.0005 | 0.0037 | NS | 0.022 | <0.0001 |
| 2009 | AG | NS | <0.001 | <0.0001 | NS | <0.0001 | NS | <0.0001 | 0.017 | NS |
| Quadratic | BG | 0.001 | NS | 0.004 | NS | 0.0027 | 0.0049 | NS | 0.037 | <0.001 |
| 2010 | AG | 0.03 | 0.0126 | --- | --- | 0.001 | NS | 0.012 | --- | --- |
| Linear | BG | NS | --- | --- | NS | NS | NS | NS | --- | --- |
| 2010 | AG | 0.044 | 0.0107 | --- | --- | 0.0036 | NS | 0.032 | --- | --- |
| Quadratic | BG | NS | --- | --- | NS | NS | NS | NS | --- | --- |
NS: Nonsignificant (p > 0.05).
© 2020 by the authors. Licensee MDPI, Basel, Switzerland. This article is an open access article distributed under the terms and conditions of the Creative Commons Attribution (CC BY) license (http://creativecommons.org/licenses/by/4.0/).
Share and Cite
MDPI and ACS Style
Massey, J.; Antonangelo, J.; Zhang, H. Nutrient Dynamics in Switchgrass as a Function of Time. Agronomy 2020, 10, 940. https://doi.org/10.3390/agronomy10070940
AMA Style
Massey J, Antonangelo J, Zhang H. Nutrient Dynamics in Switchgrass as a Function of Time. Agronomy. 2020; 10(7):940. https://doi.org/10.3390/agronomy10070940
Chicago/Turabian StyleMassey, Joshua, João Antonangelo, and Hailin Zhang. 2020. "Nutrient Dynamics in Switchgrass as a Function of Time" Agronomy 10, no. 7: 940. https://doi.org/10.3390/agronomy10070940
Note that from the first issue of 2016, this journal uses article numbers instead of page numbers. See further details here.