Wild Blueberry Fruit Drop: A Consequence of Seed Set?


Professor Emeritus, School of Biology and Ecology, and Cooperative Extension, University of Maine, Orono, ME 04469, USA
Agronomy 2020, 10(7), 939; https://doi.org/10.3390/agronomy10070939
Submission received: 22 May 2020
/
Revised: 18 June 2020
/
Accepted: 25 June 2020
/
Published: 30 June 2020
(This article belongs to the Special Issue Pollinator Diversity and Pollination in Agricultural Systems)
Abstract
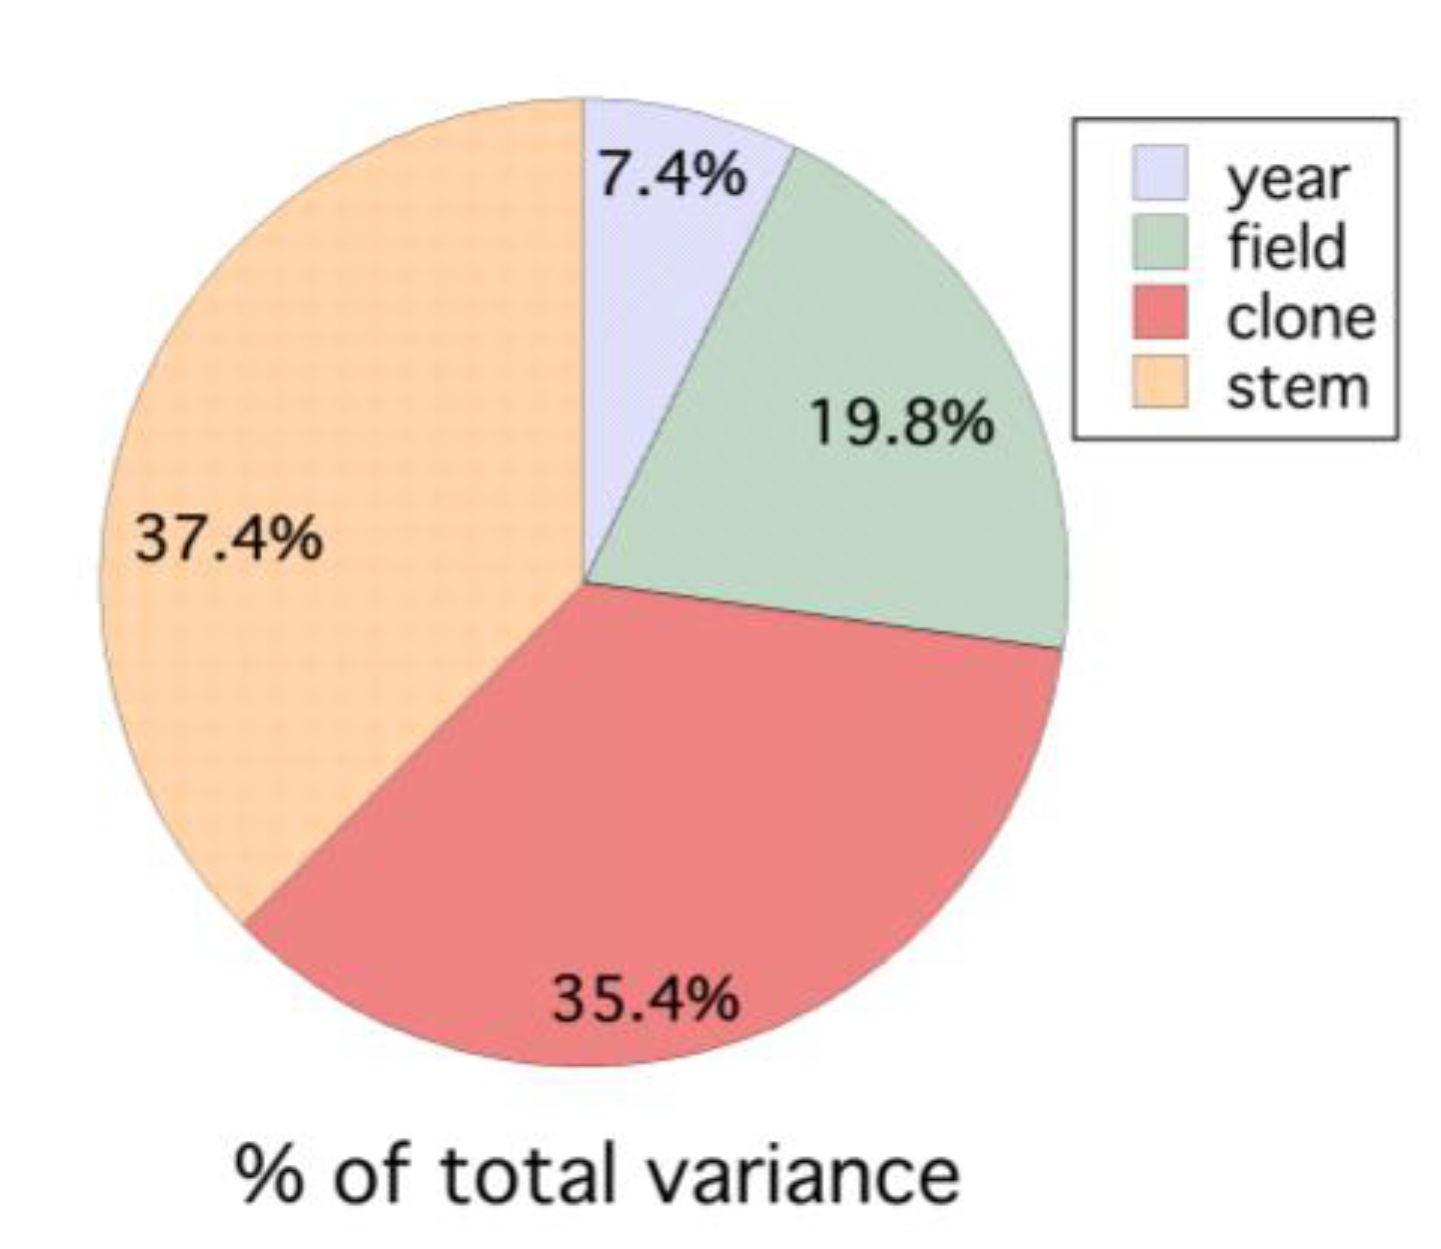
:Wild blueberry is a native plant managed as a crop in northeastern North America. Fruit drop in wild blueberry, Vaccinium angustifolium Aiton, was studied over 6 years (1996–1999, 2008 and 2011). Three hypotheses were tested regarding fruit drop mechanisms from plants (clones) sampled in the field: (1) proportional fruit drop; (2) constant or uniform fruit drop; and (3) pollen or resource limitation. In addition, the temporal rate of fruit drop was measured between the end of pollination (petal fall) and fruit maturity just prior to harvest (2008 and 2011). The dynamics of fruit drop were different in the two years. The role of pollination intensity in fruit drop was also assessed. Evidence for both proportional fruit drop and resource limitation at the clone level was found but only proportional drop at the field level. Low levels of seed set are associated with fruit drop. In a four-year study (1996–1999), fruit drop ranged from 23.3 to 49.4% of the total set fruit. Partitioning the variance in fruit drop between years, fields and clones (plant genotypes) showed that the highest variation is between stems within clones (37.4%) and clones (plant genotype) within fields (35.4%), followed by between fields (19.8%) and between years (7.4%).
1. Introduction
Wild blueberry (Vaccinium angustifolium Aiton) is a native North American crop. It is grown commercially in Maine, New Hampshire, Massachusetts, Michigan and the Canadian Maritimes and Quebec [1]. The species is a natural understory plant in the forest [2]. To establish a field, the forest is harvested and the wild blueberry plants that were in the understory are managed with herbicides or fire pruning to reduce interspecific plant competition [3]. The crop is dependent upon insect pollination [4] and this is primarily due to bees [5]. Fruit set ranges from 10 to 50% in fields that do not have commercial honey bees [6] on them, and up to 80% in fields associated with high densities of commercial bumble bees and honey bees [7]. Drummond [8] has reviewed the reproductive biology of wild blueberry and discussed factors that affect fruit set and yield in wild blueberry. Fruit set is an indicator of potential yield because it integrates bee species densities and genotypic pollen compatibility throughout the field. However, high fruit set levels do not always reach high yields because of plant disease, insect pests, weeds, inclement weather and fruit drop [9]. While the impacts of many of the factors that affect yield are well understood in wild blueberry production [10], causes of fruit drop in this wild crop is not well understood.
Fruit drop is a ubiquitous phenomenon, both in wild plant species and species bred and managed for crop production as cultivars. A system of autoregulation appears to cause the drop of a fraction of fruits in spite of pollination and resulting ovule fertilization [11]. Fruit drop can enhance the plant fitness of wild plant species [12] and either increase or decrease the net profit of farmers, depending upon the crop being grown and market conditions [13]. Fruit drop has not been well studied in wild blueberry production systems. In fact, published studies that have referred to fruit drop have not always measured the level of fruit drop but mention its occurrence as a factor affecting yield [14]. Highbush blueberry (Vaccinium corymbosum L.) and rabbiteye blueberry (Vaccinium virgatum Aiton; syn. V. ashei) production systems have been the focus of much research conducted on plant productivity, but measures of fruit drop are usually not included. However, some studies have determined the fruit drop response to applications of fertilizers or plant hormones. For instance, Milić et al. [15] referred to the plant growth regulator, α-naphthaleneacetic acid, as having a “thinning effect” on fruit as a response to increased berry size as a result of applications during highbush blueberry petal fall. Foliar applications of calcium have been shown to reduce fruit drop in the highbush blueberry cultivar “Draper”, which is characterized by a physiological calcium deficiency disorder that causes premature fruit drop [16], suggesting that nutrient deficiency can be one cause of fruit drop. With rabbiteye blueberry, it has been found that applications of aminoethoxyvinylglycine (AVG), an inhibitor of ethylene synthesis, reduce fruit drop in the field [17]. Plant disease can also cause premature fruit drop. The blueberry fruit drop associated virus (BFDaV) (Family: Caulimoviridae) results in significant levels of fruit drop in highbush blueberry [18].
Fruit drop occurs mostly in plant species with multiple seeds per fruit, such as milkweed, walnuts, citrus species, cranberry, apples, pears, peaches, cherries, almonds, blackberries, raspberries, strawberries, red currents, gooseberries and highbush blueberries. Fruit drop has most intensively been studied in apple and citrus fruit crops and has recently been comprehensively reviewed by Racskó et al. [19]. They suggest that embryo abortion and fruit drop are a continuum of the same phenomenon and is a consequence of many interacting causal factors. Causal factors in fruit drop of many plant species can be endogenous factors, such as plant genetic makeup, physiological limits and hormonal disorders, as well as exogenous factors, such as poor soil fertility and nutrient deficiency, low or high soil moistures, excessive heat along with drought, excessive rain, plant disease, insect pests, resource limitation due to too many fruits, competition between plant tissues for resources, pollen quality (non-compatible genotypes) and pollen quantity [19].
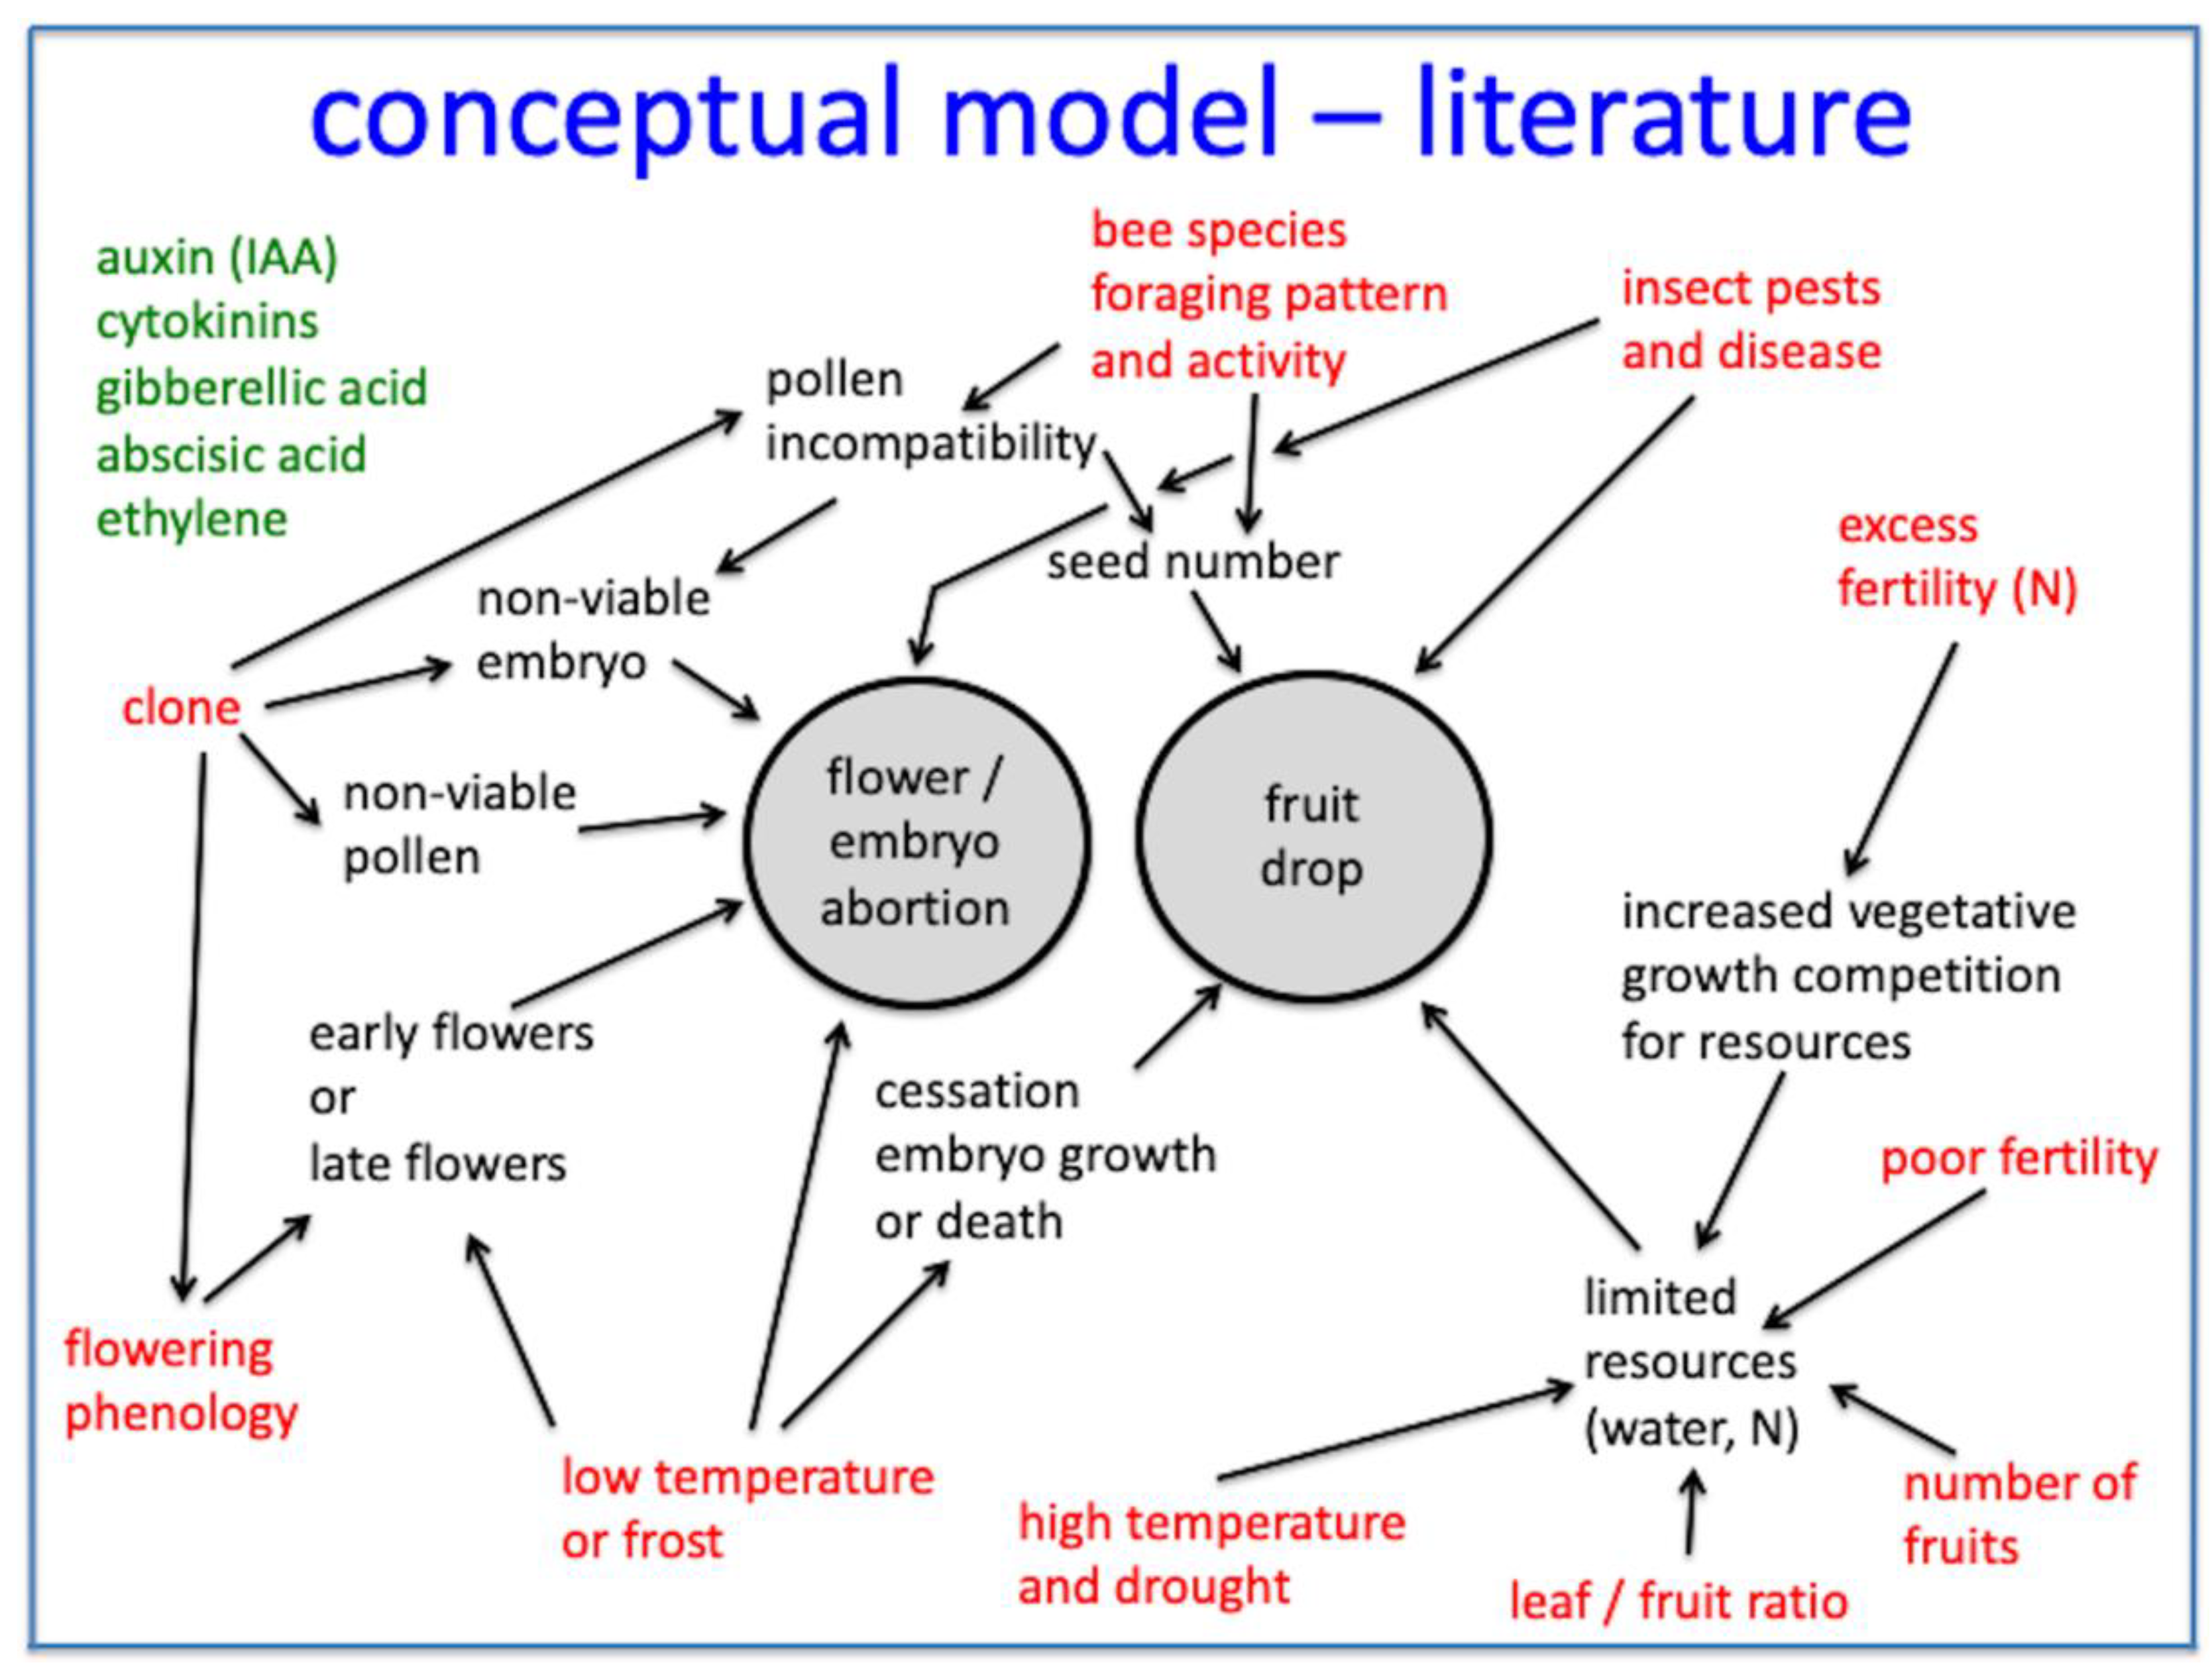
Figure 1 is a conceptual model of the complex factors that are hypothesized to be involved in wild blueberry fruit drop based upon the Racskó et al. [19] review and the author’s research and observations. Previous studies suggest that several factors can cause fruit drop in wild blueberry. The extent to which the interactions of these factors cause fruit drop is unknown. Figure 1 shows how early blooming clones (flowering phenology) may be more at risk to fruit drop due to frosts. It is also hypothesized that stresses due to low soil fertility interact with high fruit density to cause fruit drop. Insect pest attack and disease infestation can result in fruit drop. Blueberry maggot fly (Rhagoletis mendax Curran) [20], spotted wing drosophila (Drosophila suzukii Matsumura) [21] and mummy berry disease (Monilinia vaccinii-corymbosi (Reade)) [22] are causal agents of wild blueberry fruit drop. Nitrogen fertilizer can cause fruit drop by resulting in increased vegetative growth and competition for nutrients with reproductive tissue [23]. Frost conditions have the potential to cause fruit drop by resulting in the death of embryos [10]. High air temperatures and drought can affect plant resources and cause physiological stress (optimal threshold for wild blueberry synthesis photosynthesis is 25 °C [24]). High numbers of fruits per stem or fruit per unit leaf area may result in fruit drop [23,25], and it is hypothesized that plant resources, such as water and nutrients, may enhance fruit drop at high fruit densities. The endogenous effect of genotype or clone is most likely a major causal agent of fruit drop. It can be mediated through the physiological/genetic incompatibility of outcrossed pollen during fertilization in wild blueberry [26]. Incompatibility not only results in embryo abortion [4], but also in reduced viable seed numbers per fruit [26]. Pollen number and sterility appears to be a clone characteristic, as does ovule number [27], and can have an effect on the pollination level and the seeds per berry. Seed number has been shown to be a result of the bee species’ pollination efficiency (number of pollen tetrads place/stigma in a single visit [8]). Seed number is related to wild blueberry fruit mass [8], and in highbush blueberry, auxins produced by seeds have been shown to increase yields and reduce premature fruit drop [15]. Because of this, it is hypothesized that low seed numbers per berry can result in premature fruit drop. Figure 1 also suggests that, as with other crops, the levels and activity of plant hormones and other bioactive chemical compounds are involved in some of the physiological mechanisms associated with fruit drop; this has not been established for wild blueberry, but has been the case for other crops [19].
The research reported here on patterns of fruit drop in wild blueberry was conducted to help explain why fruit set does not always translate into realized yield and to provide growers with a possible explanation for experiencing high fruit set levels, but only moderate yield. This is important because pollination is the most expensive capital investment in production [28], and some growers tend to over invest in honey bee rentals or bumble bee purchases to obtain high fruit set [29], but they do not always maximize yield this way, in part because of fruit drop.
2. Materials and Methods
Research was conducted in growers’ fields in the two major wild blueberry growing regions in Maine, USA (Hancock, Lincoln, Waldo and Washington Counties), and at the University of Maine Blueberry Hill Research Farm, Jonesboro, ME (Washington Co.). Methods for the following four studies are listed below.
2.1. Time Sequence of Fruit Drop (2008 and 2011)
The objective of this experiment was to assess the timing of fruit drop and its severity throughout the growing season post-pollination. In early May 2008 and 2011, clones (genets or genetically distinct individual plants) were selected in a fruit-bearing field at the University of Maine Blueberry Hill Farm, where ultimately 10 and 6 (2008 and 2011, respectively) clones were flagged. Observations were made at 4–5-day (2008) or 5–7-day (2011) intervals. For each clone from each sample date, five blueberry stems were randomly selected. On each stem, for each flower cluster, the number of flowers in the tight-loose cluster stage and the number of open flowers were counted, and fruit set was estimated. Beginning in late June, after bloom had finished, and utilizing the same clones, five stems within each clone were selected, and an open-topped plastic container (10 cm diameter) with drainage holes in the bottom was fitted around the bottom of each stem to catch dropped fruit. Any other overhanging stems were pruned back. Twice a week, beginning on 23 June 2008 and 17 June 2011 and continuing until 31 July 2008 and 13 August 2011 (harvest), green or ripe fruit and aborted flowers from each container were collected. Subsequently, the collections from the five stems per clone were pooled into one bag, dated, and frozen for later counting and analysis. In late December of both years, counted were: (a) the number of dropped flowers (inadequately pollinated); (b) the dropped green fruit; and (c) the ripened fruit from each clone and each date. The final yield was determined by counting the number of fruits on each of five additional stems per clone on 31 July. Graphical visual analysis was used to assess the temporal pattern of fruit drop. A chi-square test was used to compare the temporal pattern frequency distributions of fruit drop between 2008 and 2011 to determine if they were the same between the two years [30]. Frequency classes were 4–7-day intervals.
2.2. Seed Set and Fruit Drop (2011)
In 2011, three commercial wild blueberry fields in Washington Co., ME, were sampled and 131 dropped fruit were collected during the season and an additional 240 mature (ripe) fruit were collected at harvest. The fruit was brought back to the laboratory and dissected to count the number of viable seeds per fruit using the methods described by Drummond [8]. The number of viable seeds per berry is a measure of pollen quality and quantity [26]. Viable seed number is a result of the number of genetically/physiologically compatible (SI) pollen tetrads that was placed upon a flower stigma during pollination. The berry samples were pooled from the three fields and a chi-square test was used to compare seed per berry frequency distribution between the dropped and harvested fruit [31]. Frequency classes were the seeds/berry intervals of five seeds/berry increments.
2.3. Fruit Drop Hypotheses (Models—1997)
In 1997, two large clones (ca. 20 m in diameter) were sampled intensively in a commercial wild blueberry field in Waldo Co., ME. In each of the clones, 200 stems were sampled for proportion fruit set and proportion mature fruit at harvest. The sampling method involved selecting 100 arbitrary stems independent of the density of the flowers per stem. Each stem was marked with a string tied loosely about the stem with a unique stem identifier label. This method captured the natural range of flower density in the two clones. To measure fruit set, the field was visited in peak bloom and all of the flowers were counted on each stem three times and averaged to obtain a reliable estimate of the flowers/stem [29]. After bloom had finished and calyx swelling had started to occur for set fruit, the number of set fruits were counted three times, and the average of the three counts was recorded. One day prior to harvest, the number of mature fruits were counted three times and the average was recorded. Proportion fruit set and proportion mature fruit were calculated by dividing the set fruit and mature fruit on each stem by the number of flowers that bloomed on each stem.
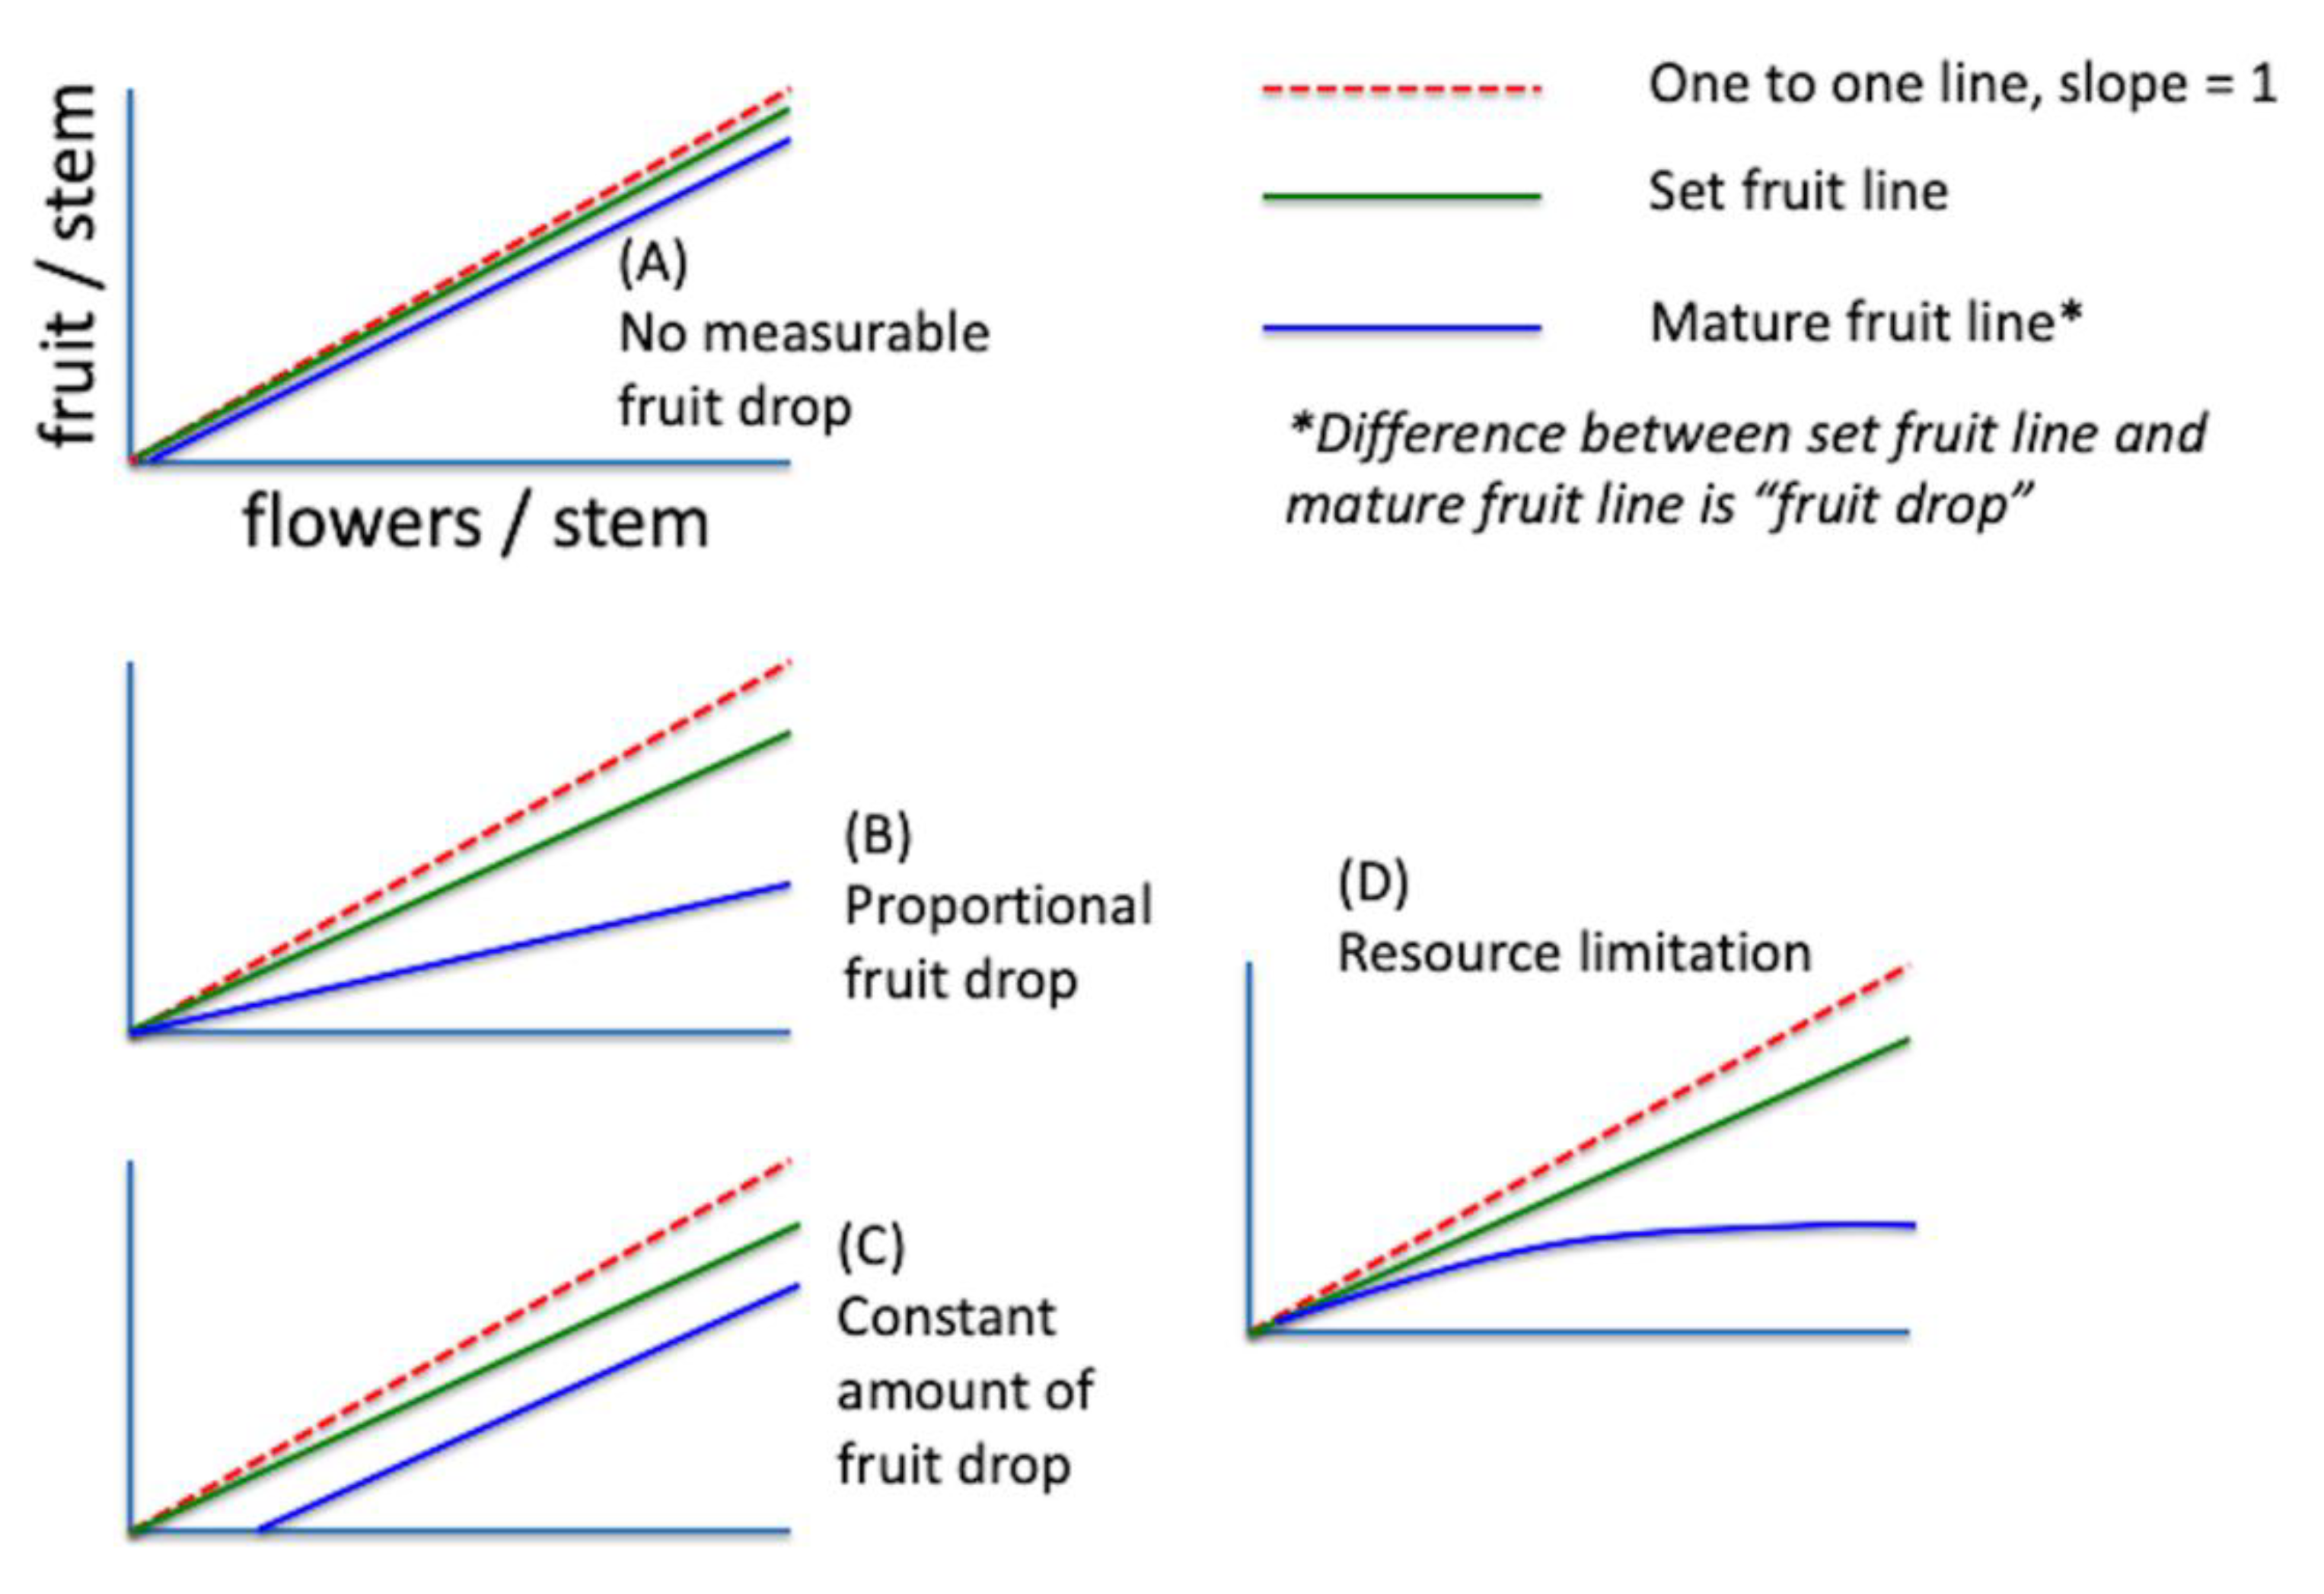
In each of the clones, four potential relationships between the flowers/stem and mature fruit per stem were tested using linear least-squares regression [30]. The tests represent conceptual models for the mechanism of fruit set and are shown in Figure 2.
The first model (A), is the model where no measurable fruit drop is observed—the set fruit is equal in slope and intercept to the mature fruit. The second model is proportional fruit drop, where the slope of the set fruit is significantly different than the mature fruit slope (i.e., the difference between the set and mature fruit is a constant proportion as flowers/stem increases, but the amount of dropped fruit increases with flowers/stem). The third model is one of a constant number of fruit dropped. In this model, the slopes are the same for set fruit and mature fruit, but the intercept is significantly different. This model is not expected as the amount of dropped fruit holds constant over increasing flower density, but the proportion of dropped fruit actually decreases. The fourth and last model is one of resource limitation, either nutrients, water or pollen. The slope of the dropped fruit is not constant but increases at a decreasing rate. In this case, both fruit drop amount and proportion increase with increasing flower density. The coefficient of determination and pattern of residuals were used to evaluate the best fitting model for explaining the fruit drop patterns in the data [30].
2.4. Within and between Fields and Years (1996–1999)
Between 1996 and 1999, 23 (6 fields/year, except for 1999—5 fields) commercial wild blueberry fields (Hancock, Lincoln, Waldo, and Washington Counties) were sampled for proportion fruit (mature fruit as a proportion of flowers that bloomed). These two measures were used to estimate fruit drop using the methodology described above (Materials and Methods—Section 2.1 and Section 2.3). In 1996–1999, 100–150 stems were sampled in each field across three 75-m transects. A mixed model was used to assess the effects of year, field and set fruit on fruit drop. Dropped fruit was measured as the remaining mature fruit at harvest subtracted from set fruit after pollination. The dependent variable in the model was dropped fruit. Set fruit was the fixed effect, and year, field and all interactions between year, field and set fruit were the random effects. Model fit and appropriateness was evaluated with the chi-square convergence test. Fixed effects were tested for significance using Satterthwaite’s method for estimating denominator degrees of freedom in fixed effects F-tests in a mixed model [31]. Wald tests were used to evaluate significance of random effects by evaluating their slope estimates relative to 0 [30]. Linear regression (based upon a proportional fruit drop hypothesis for the mechanism after testing the alternative models) was used to determine the estimated fruit drop within fields in each field in each year that was modeled with the mixed model. Another way that was chosen to display the annual fruit drop by field was to regress the average set fruit for a field on the average dropped fruit/stem per field for all fields for each year. While this method (n = 5–6 fields) is not as precise as using all stems sampled in a field (n = 100–150 stems/field), it provides a means of visualizing fruit drop between years.
A hierarchical nested analysis of variance was used with the data from all years (n = 3070 stems) to partition the variance in fruit drop between year, field, clone and stem [30]. The model was: dropped fruit = year + field (year) + clone (field) + stem (clone). The expected variances formulae were obtained from Zar [32] and used to estimate the components of variance for year, field, clone and stem.
3. Results
3.1. Time Sequence of Fruit Drop (2008 and 2011)
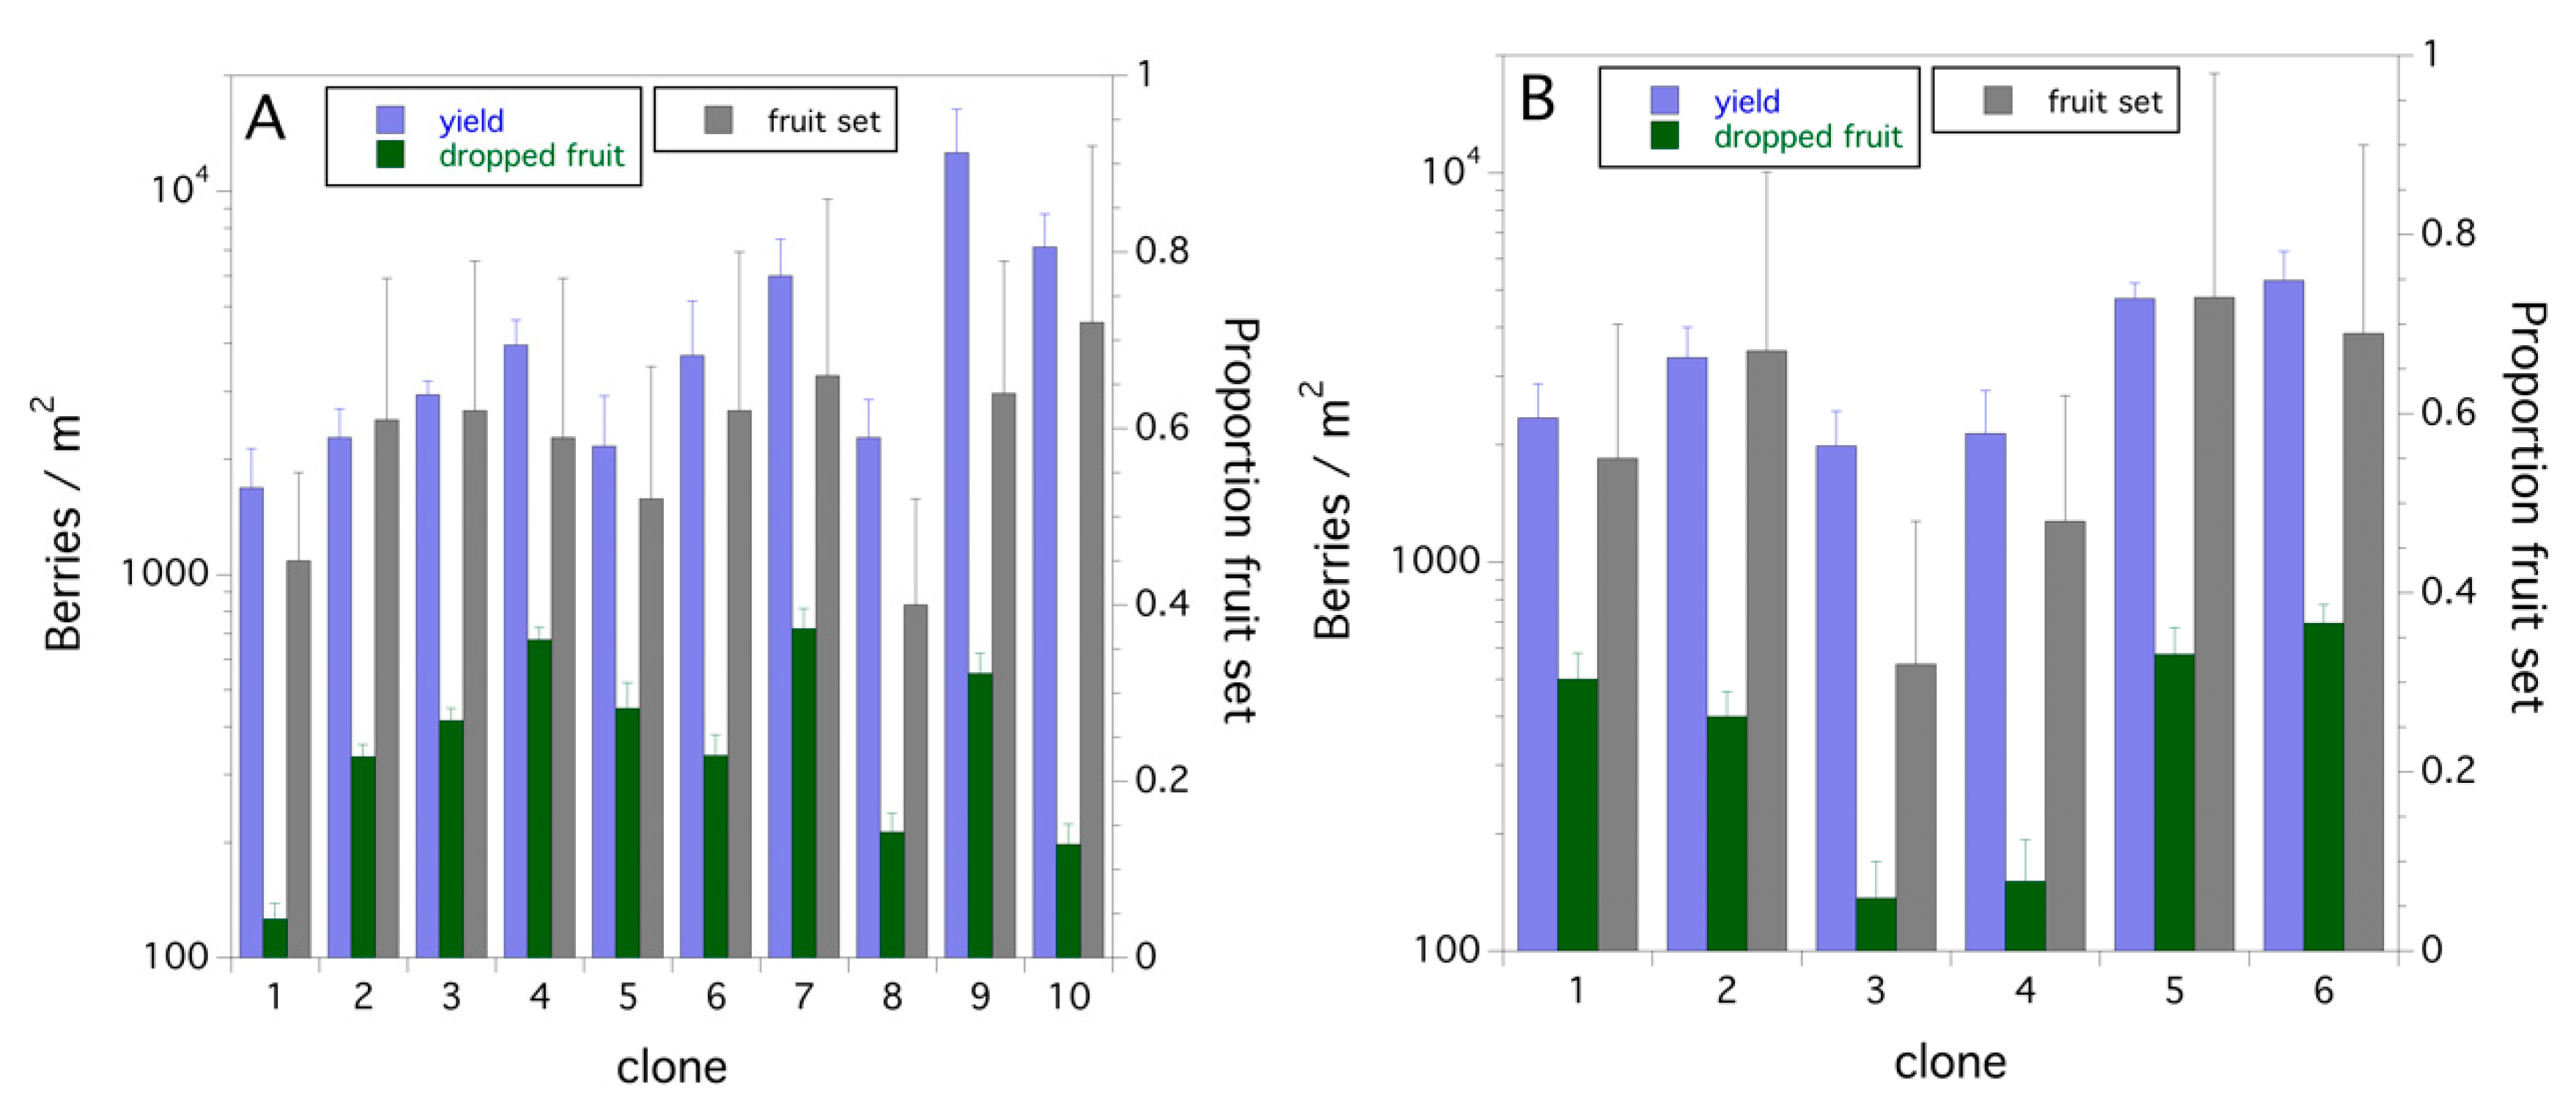
The clones sampled in 2008 and 2011 resulted in a mean proportion fruit set of 0.58 ± 0.03 (s.e.) and 0.57 ± 0.06, respectively, with a range of 0.40–0.72 and 0.32–0.73 in 2008 and 2011, respectively (Figure 3A,B). Yield (berries/m2) and dropped fruit (green and mature) for each clone (10 in 2008 and 6 in 2011) are also shown in Figure 3A,B. Dropped fruit (green and mature) had proportions of 0.11 ± 0.02 (2008) and 0.12 ± 0.02 (2011) of the harvested number of berries per stem (yield). This consistent amount of fruit set and fruit drop between the two years was not expected. Fruit set in 2008 explained 33.5% of the variance in yield (P = 0.079), whereas in 2011 fruit set explained 70.8% of the variance in yield (P = 0.036). Fruit drop (green + mature dropped fruit) was not dependent upon total berries (yield + dropped fruit) in 2008 (P = 0.169) but was dependent upon total berries in 2011 (r2 = 0.688, F(1,4) = 8.662, P = 0.042).
The temporal pattern in cumulative fruit drop over time (Figure 4A,B) differed between years for green fruit (x2 (5) = 85.431, P < 0.001) and mature fruit (x2 (2) = 22.376, P < 0.001). In 2008, green fruit dropped continuously from after bloom until harvest, while in 2011, green fruit drop finished by mid-July, almost a month prior to harvest. In 2008, mature ripe fruit began dropping in mid-July, about the time that ripe fruit started appearing on stems, while in 2011, mature fruit did not begin dropping until early August, near harvest. Overall, most of the dropped fruit were green and not mature ripe fruits (Figure 4A,B). The calyx portion of the non- or poorly pollinated flowers (referred to as pinheads in the wild blueberry industry) dropped in a temporal pattern over the growing season, similar to that of green fruit in each year (data not shown). As with green fruit drop, there was a significant difference in the pattern of pinhead drop between years (x2 (6) = 101.925, P < 0.001).
3.2. Seed Set and Fruit Drop (2011)
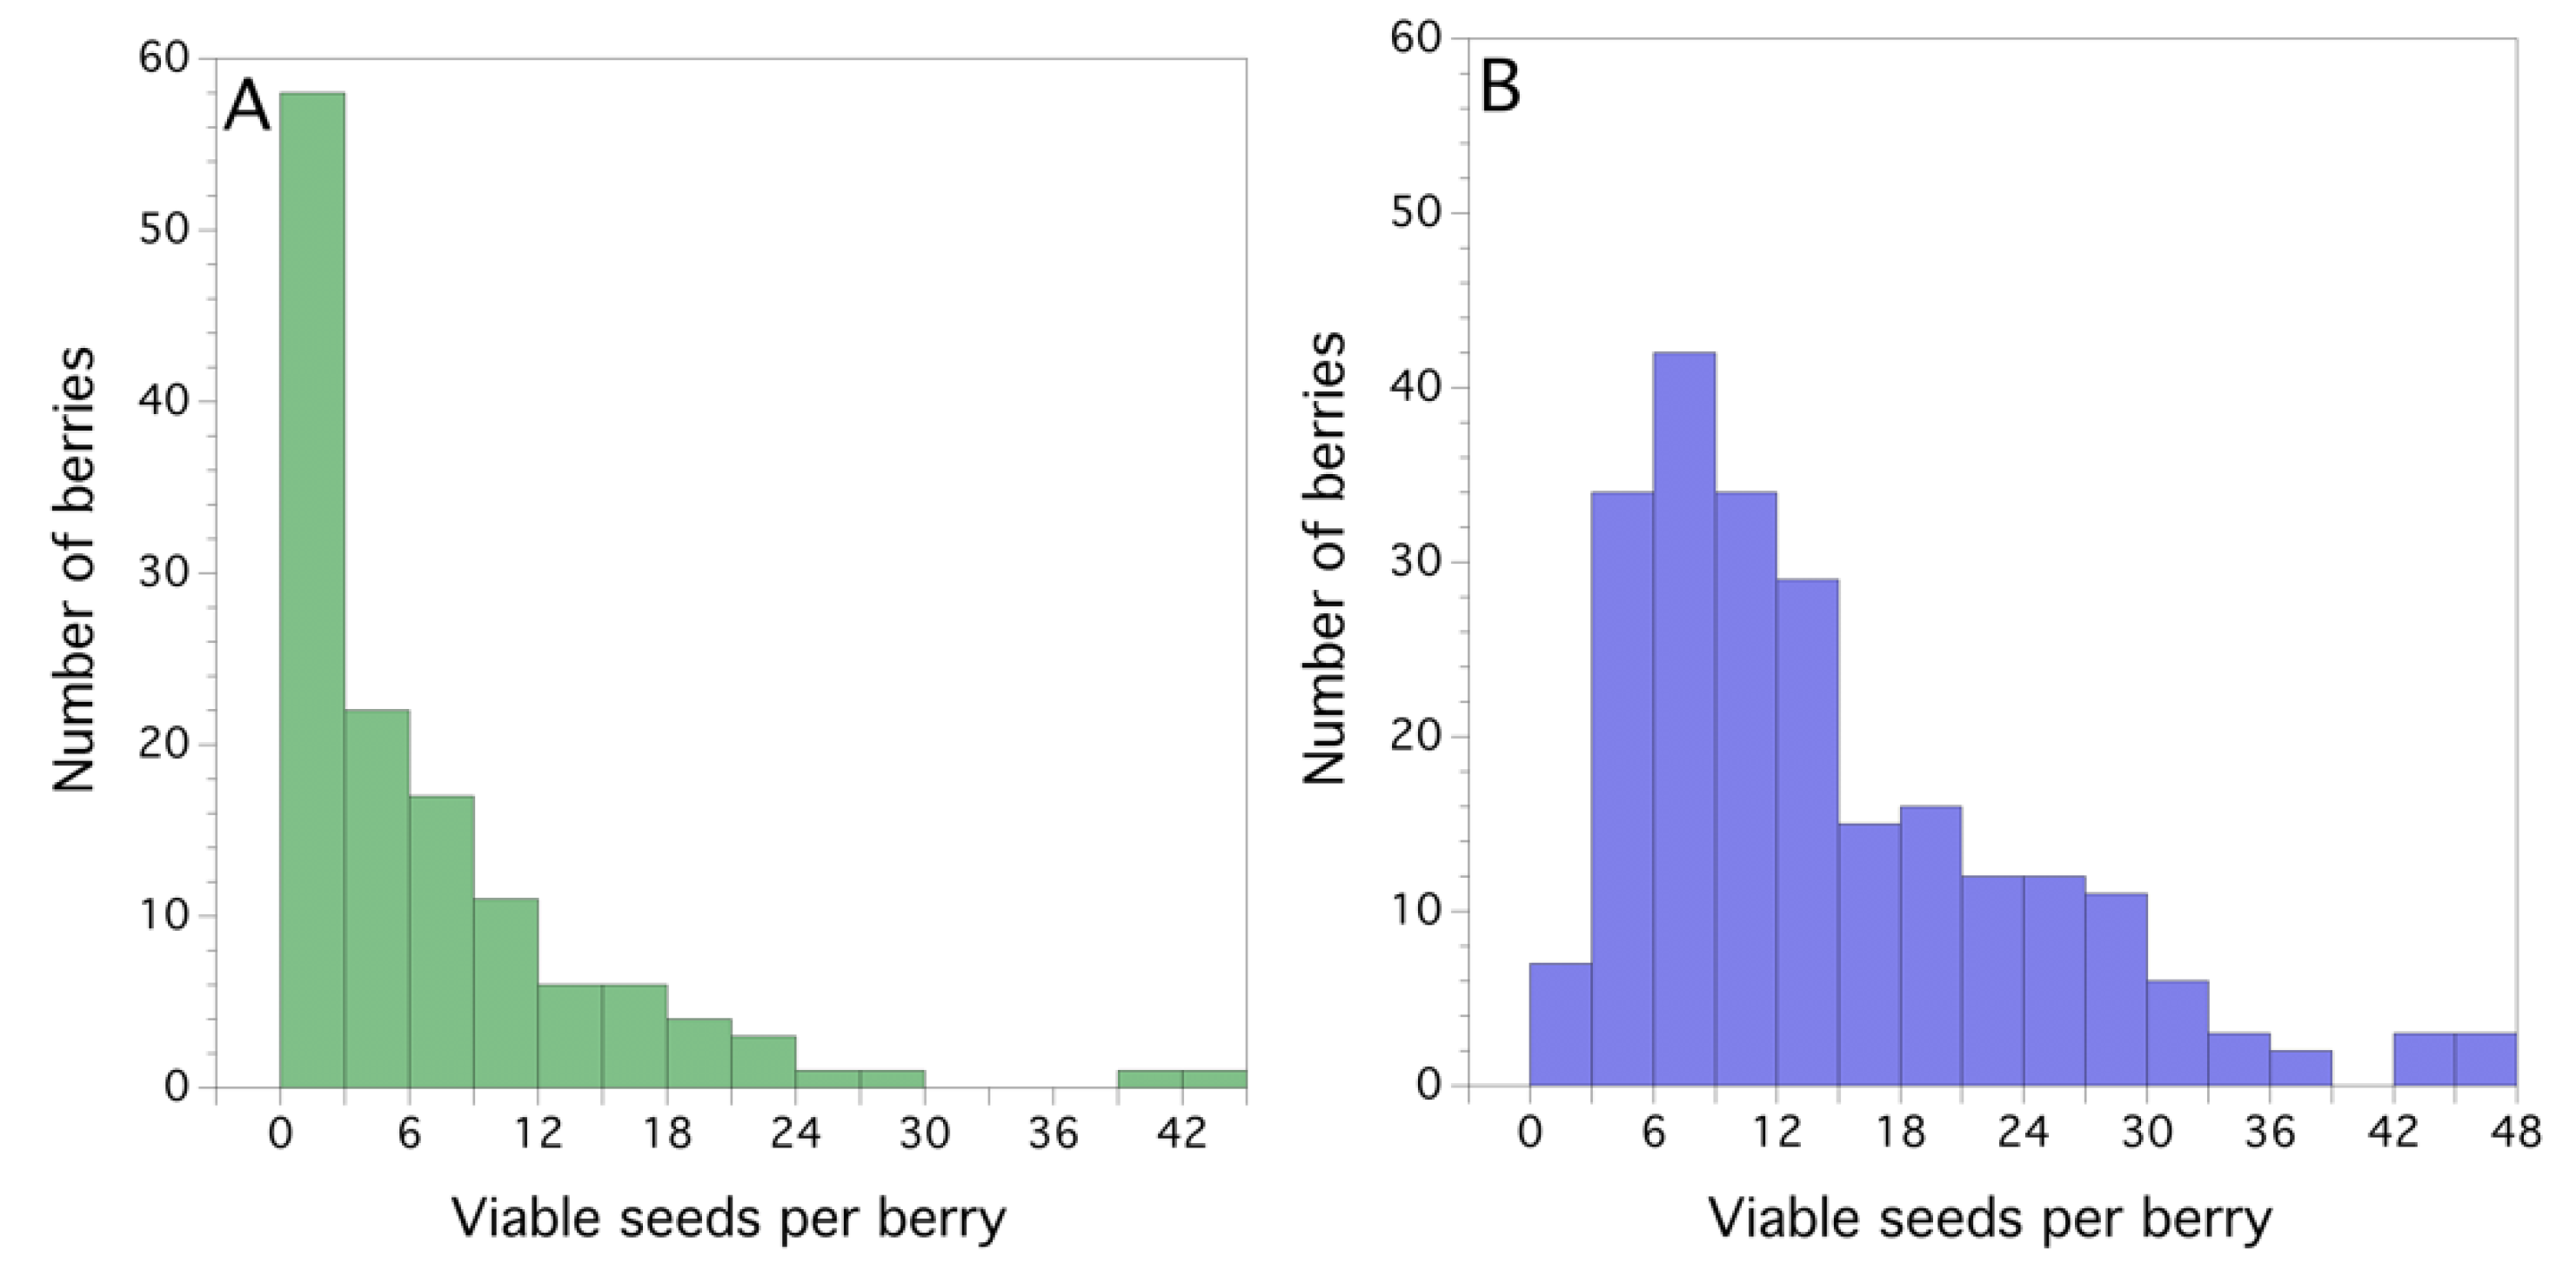
The mean seed set (seeds/berry) was significantly less in dropped fruit than fruit kept on the plant until harvest (Poisson regression, x2 (1) = 398.894, P < 0.001, Figure 5A,B). The frequency distribution of seeds/berry for dropped berries was significantly different from the harvested berries (x2 (15) = 111.752, P < 0.001). The average seeds/berry for dropped fruit was 5.3 ± 0.7 (s.e.), and for harvested fruit, 13.0 ± 0.64.
3.3. Fruit Drop Hypotheses (Models—1997)
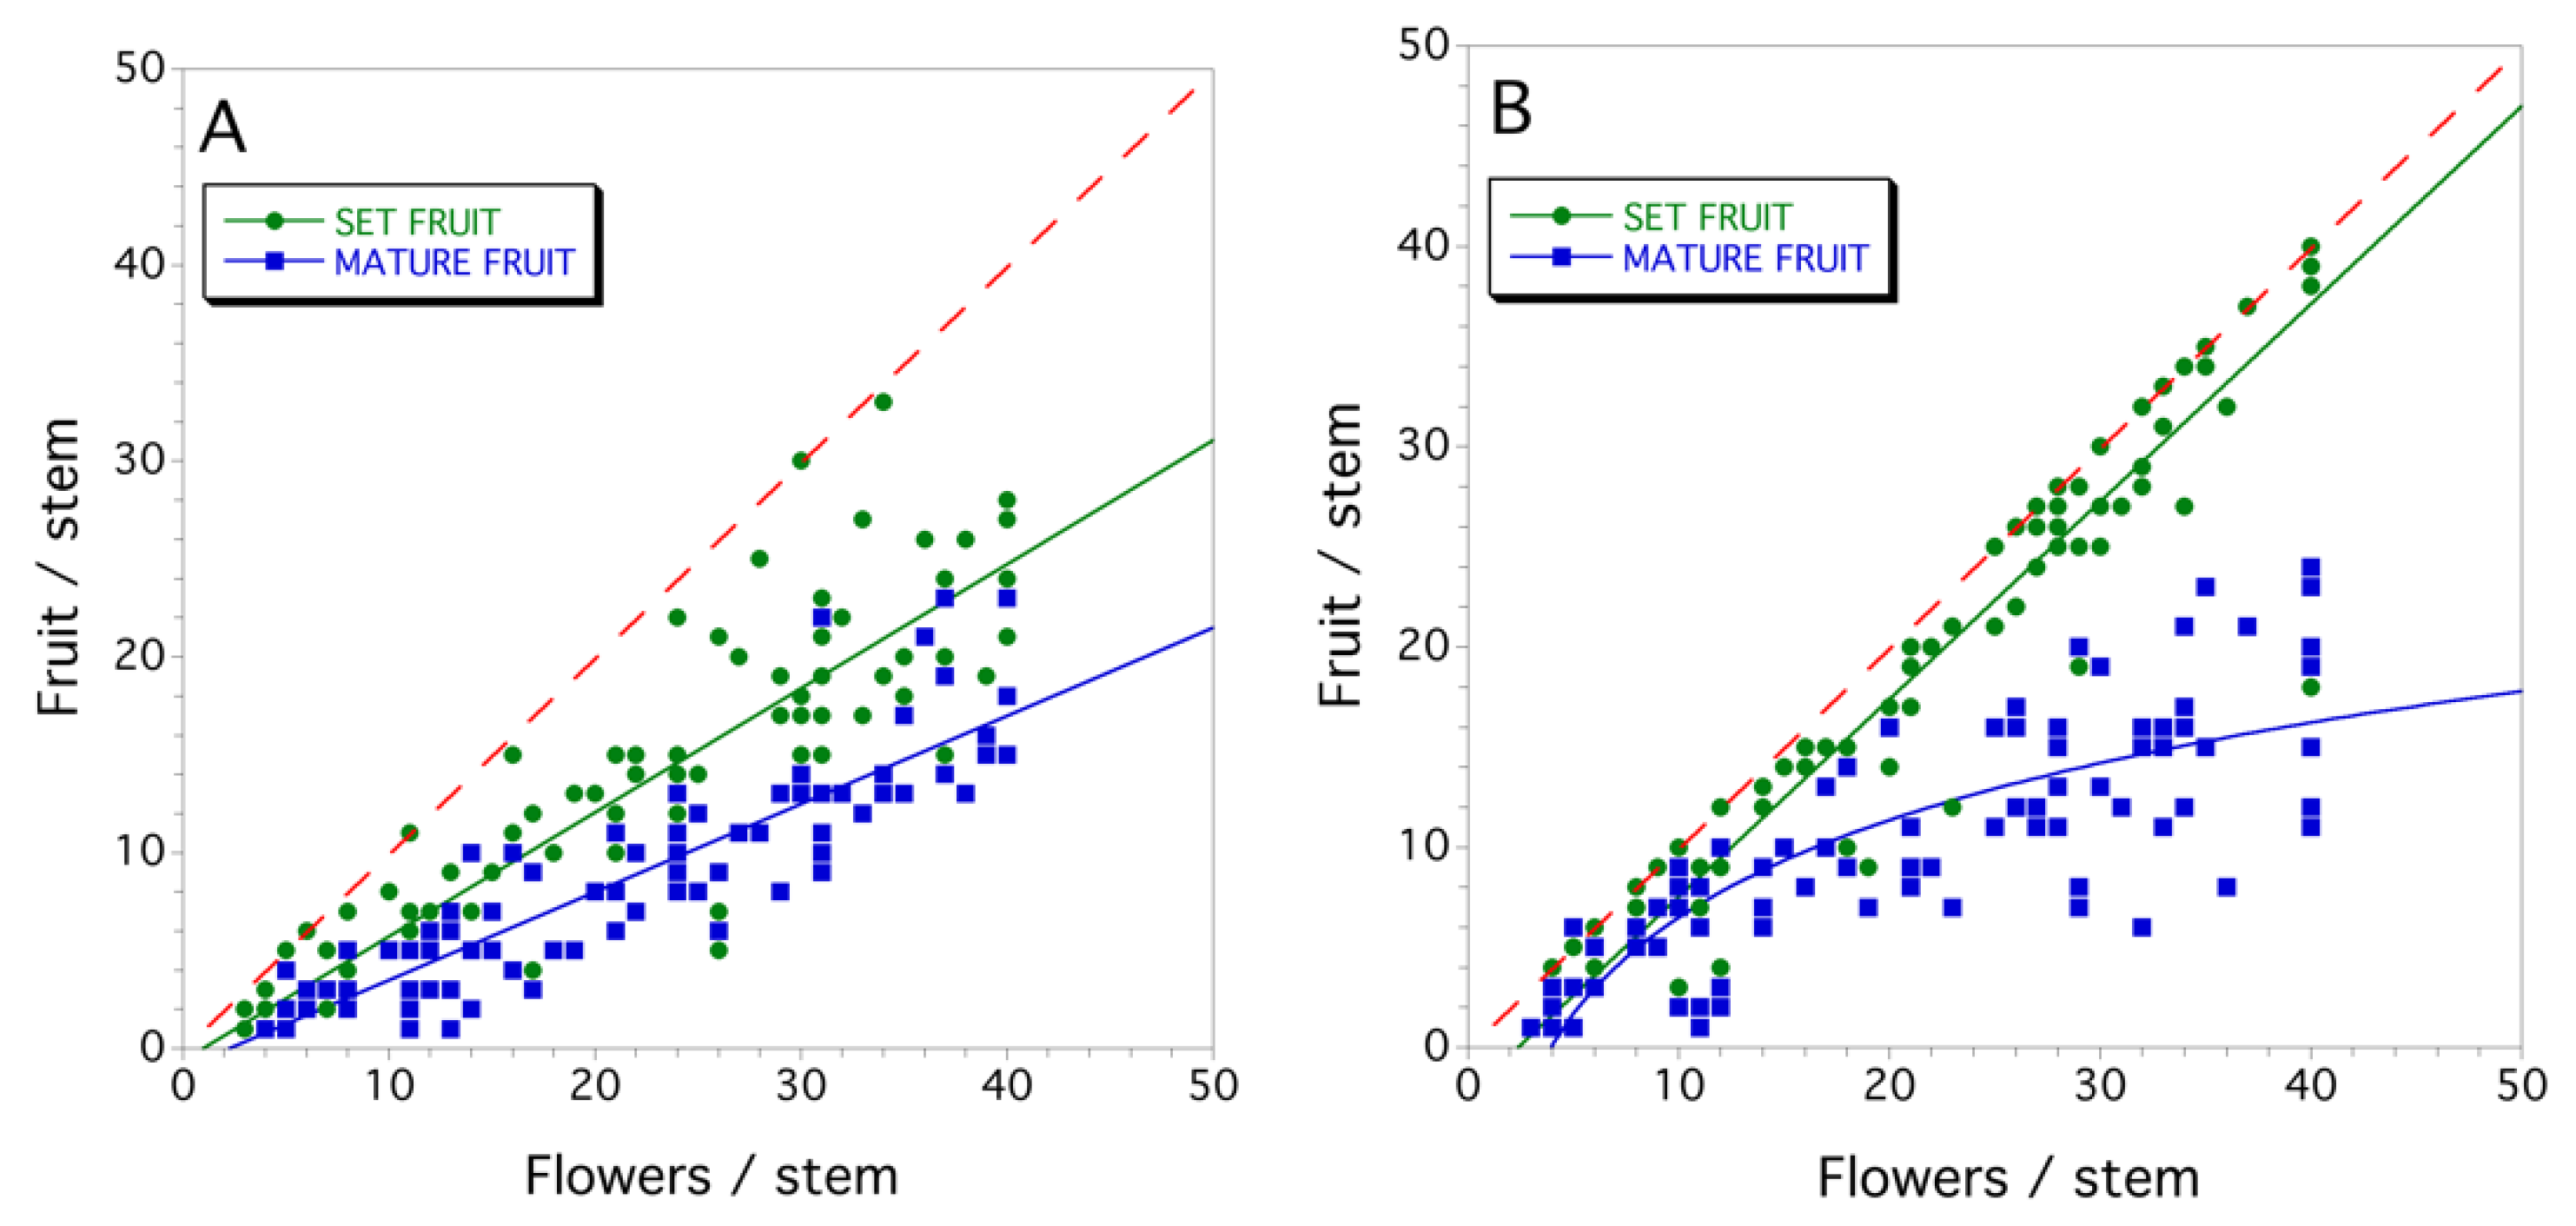
The two clones sampled in 1997 showed different mechanistic forms of fruit drop. In Clone #1, the relationships between flower density, and set fruit and mature fruit were best described by linear models (F(1,92) = 353.427, P < 0.001, r2 = 0.793; and F(1,86) = 322.534; P < 0.001, r2 = 0.789; set fruit and mature fruit, respectively; Figure 6A). The slopes, but not the intercepts of these two regressions were significantly different (P < 0.05; slopes: set fruit = 0.634 ± 0.107 and mature fruit = 0.419 ± 0.091). These relationships suggest a proportional model for the fruit drop mechanism. In Clone #2, the relationships between flower density and set fruit was best described by a linear model (F(1,90) = 1030.512, P < 0.001, r2 = 0.919; Figure 6B), but the relationship between flower density and mature fruit was best described by a logarithmic model (Figure 6B; F(1,89) = 167.511; P < 0.001, r2 = 0.764). The Clone #2 relationships suggest a resource limitation model.
3.4. Within and between Fields and Years (1996–1999)
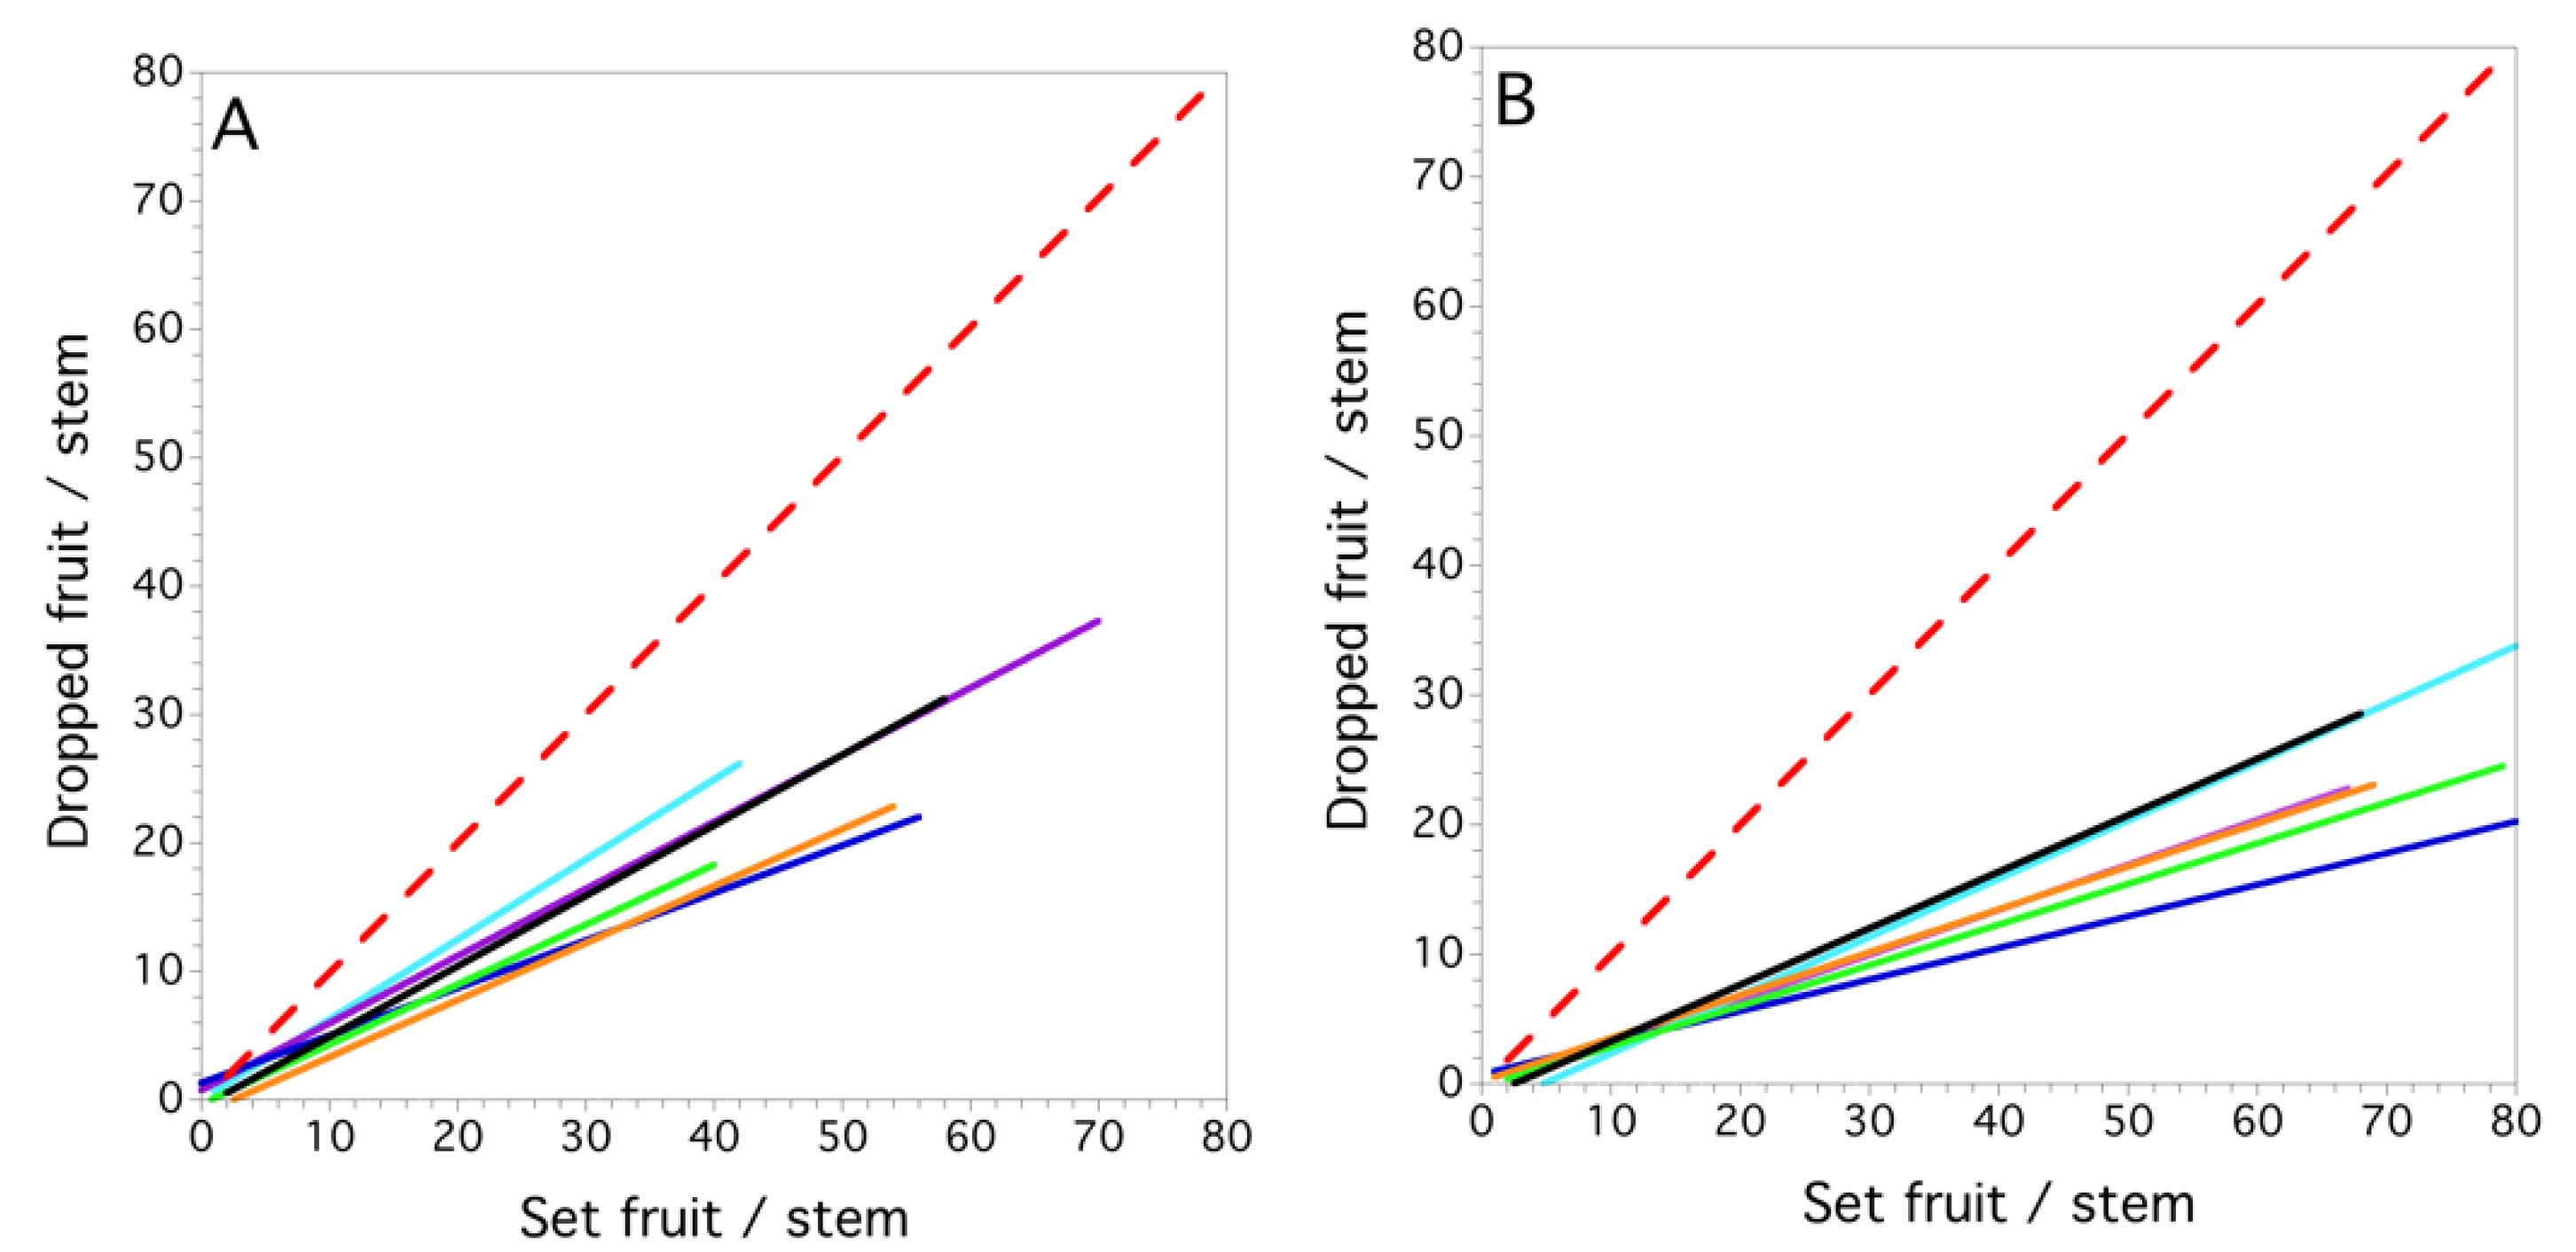
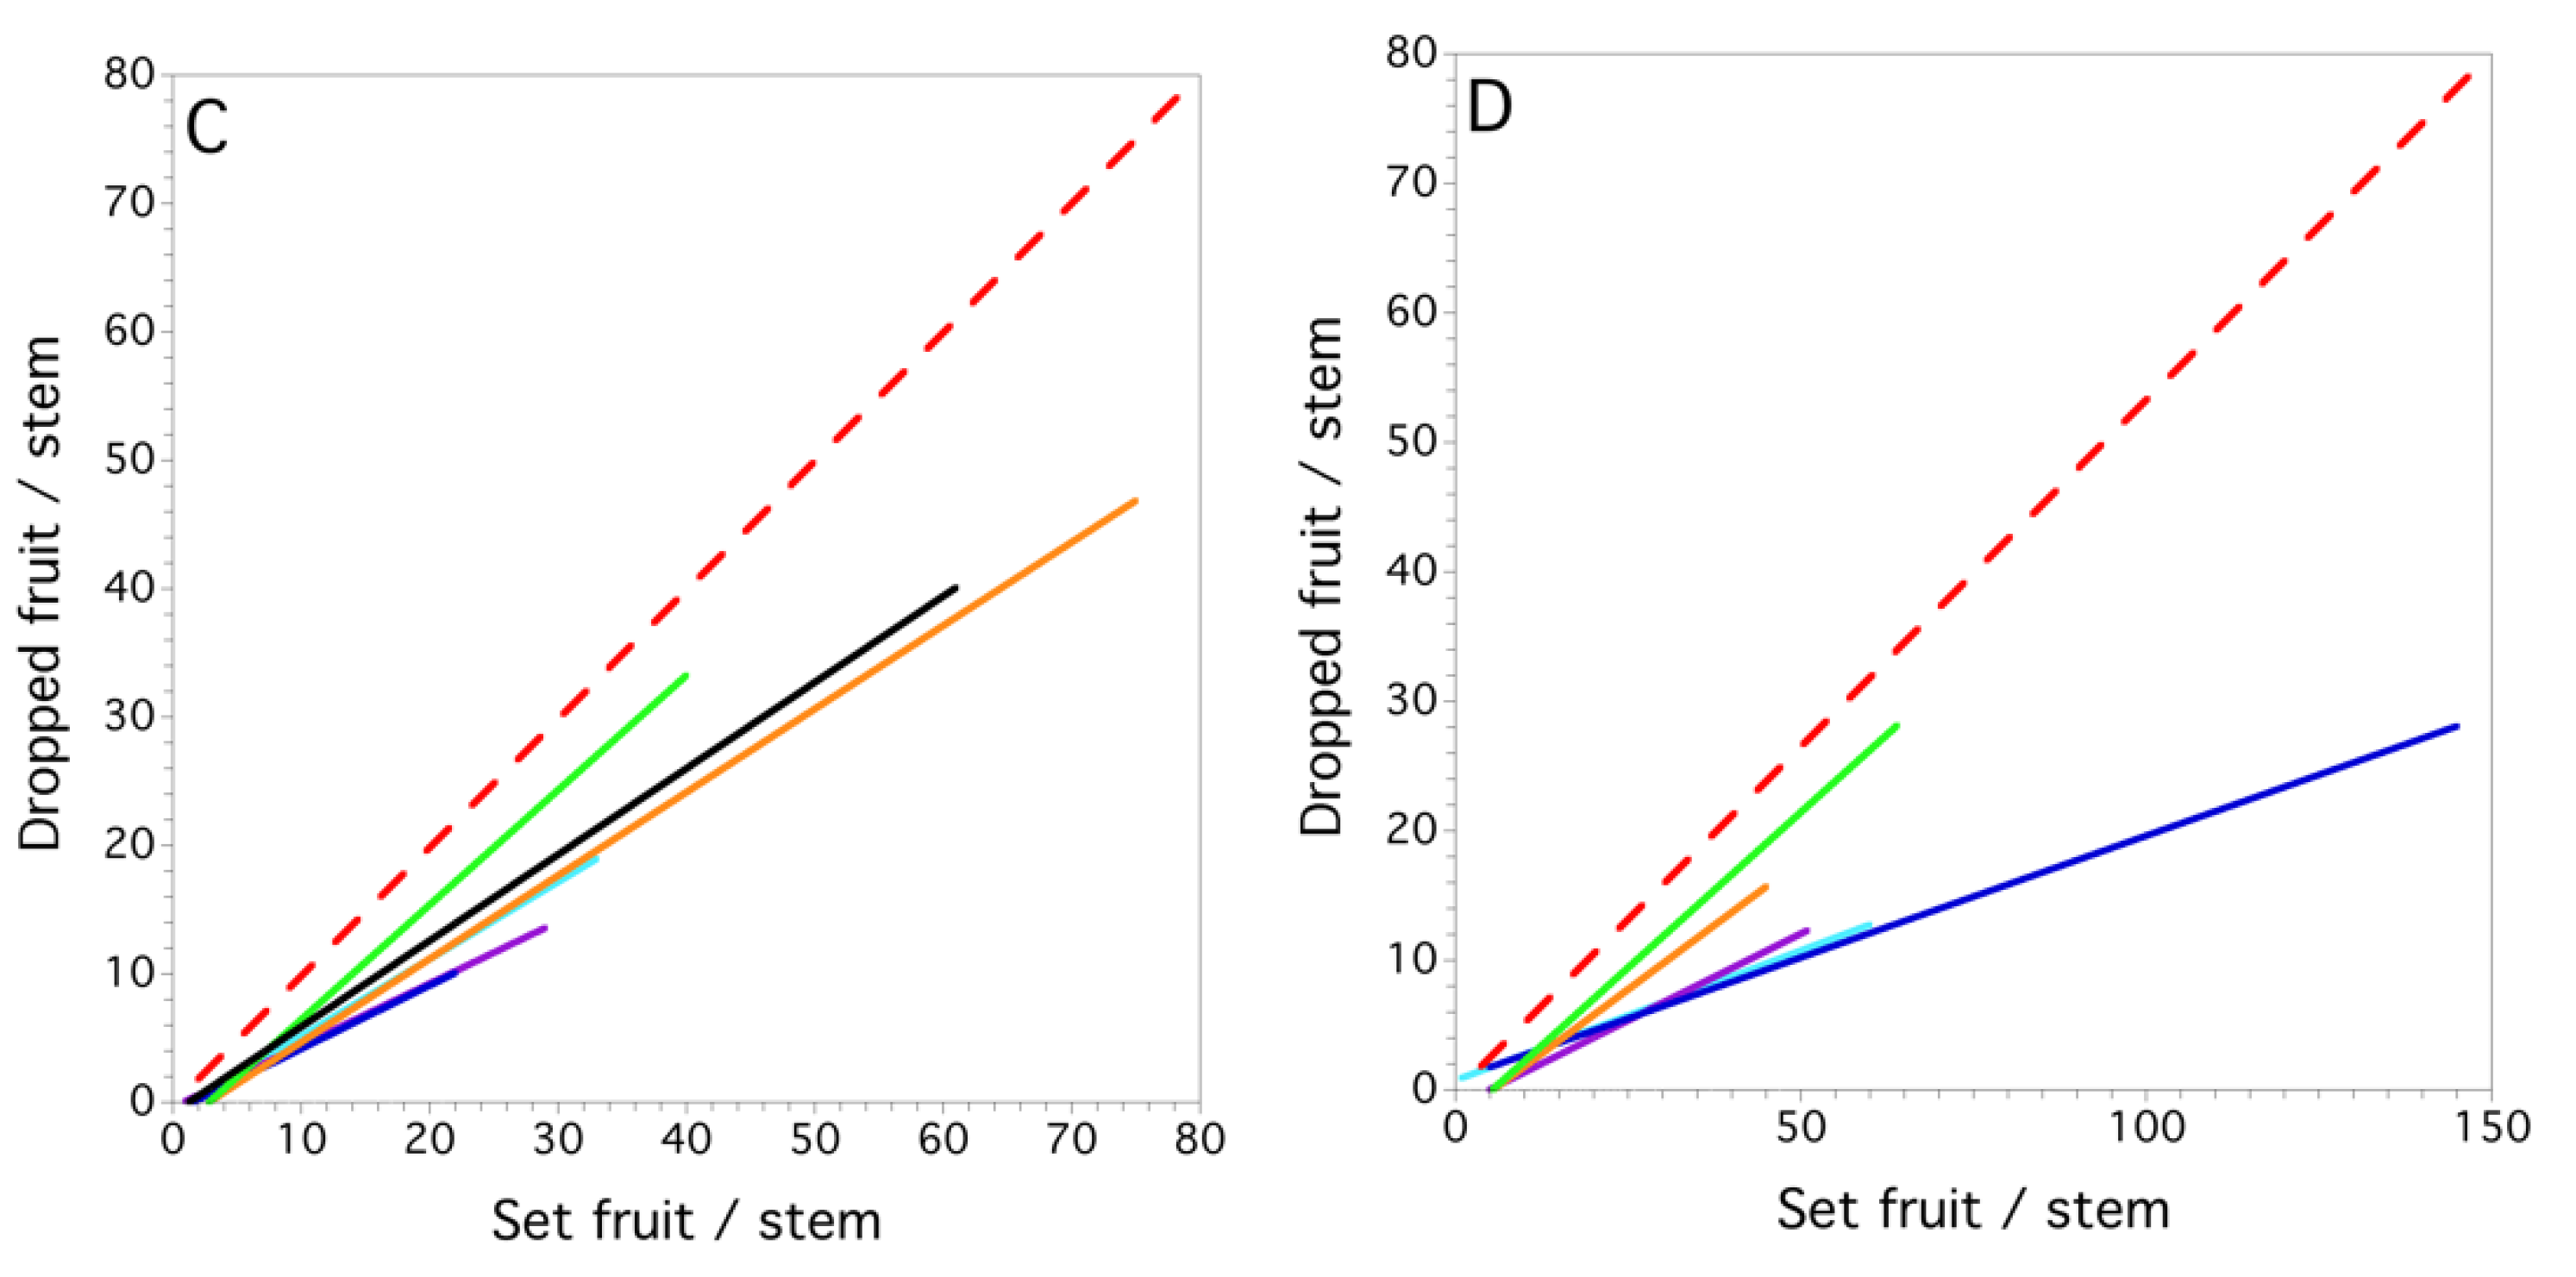
The mixed model for fruit drop showed that set fruit explained the variation in dropped fruit (F(1, 3.1) = 34.695, P = 0.010, marginal r2 = 0.597). Significant random effects were the interactions, field within year (P = 0.007) and set fruit x field within year (P = 0.009). At the field level, we found that the proportional linear model was best for all fields and years. Figure 7A–D show the linear relationships derived by regressions between the fruit drop and set fruit for each field within each year. The proportion of dropped fruit in each year was 0.494 ± 0.042 (s.e.), 0.312 ± 0.015, 0.435 ± 0.048 and 0.233 ± 0.016; 1996–1999, respectively. All regressions by field for each of the years were highly significant (P < 0.001), the coefficients of determination ranged from 0.212 to 0.810 and the slopes of the relationships between set fruit and dropped fruit ranged from 0.211 to 0.894, with the mean = 0.453 ± 0.034. The variance in fruit drop due to year, field, clone and stem is shown in Figure 8. The variance in fruit drop was the highest between stems and clones and the least between years when averaged over all fields within a year.
When set fruit and dropped fruit were averaged for each field (a single mean value per field), a linear regression was constructed for each year (Figure 9). This relationship would be expected if a single sample of 100–150 stems were sampled to estimate set fruit and dropped fruit in each field to obtain one average point estimate per field (a field basis estimate). It can be seen that on a field basis, the average set fruit estimates varied, but overlapped considerably for 1996–1997 and 1999. The relationship between set fruit and drop was significant for 1998, with a slope of 0.867 ± 0.169, suggesting high levels of average fruit drop that year (close to the red dashed 1:1 line). In 1996 and 1997, there was only a marginally significant relationship between set fruit and dropped fruit (P < 0.1, with much lower levels of fruit drop but also a lower proportional relationship to set fruit (slopes approaching 0)). The year 1999 regression suggests a high level of fruit drop and no proportional response to set fruit (P > 0.1), but instead constant numbers of fruit/stem were dropped.
4. Discussion
Pollination is the most critical, and in some cases, the most expensive input for producing a wild blueberry crop [28,29]. An understanding of fruit drop in wild blueberry is important in making decisions about pollination. Growers have tools to determine the abundance of bees, both native and commercial bees, for estimating fruit set—an estimate of potential yield [33,34,35]. It has been shown in this study that fruit set is not a good estimate of realized yield due to fruit drop alone. Factors that reduce the size of fruit prior to harvest often reduce yield, and thus reduce the usefulness of fruit drop as a predictor of yield [9].
From an evolutionary perspective, plants are often seen as optimally tuned organisms when it comes to reproduction [36]. Flowers are relatively inexpensive to produce and if pollination is high in a year, the plant can drop fruit so that limitations of water and nutrients do not jeopardize all the set fruit that can be developed during the growing season [37]. Wild blueberry produces high numbers of flowers in the spring [8], but the plant species is highly plastic and can alter allocation of growth in vegetative relative to reproductive tissues [23,25]. However, growers’ objectives are not always in congruence with the stable evolutionary strategies of plants. Maximizing yields and profits over the short term does not always equate to maximization of plant evolutionary fitness [38].
This study showed that fruit drop at the field-level in wild blueberry can be high, ranging from 23–49% of the potential yield based on fruit set. Therefore, it appears to be a significant annual crop loss. Annual variation in fruit drop explained only about 7% of the total variance in fruit drop. The source of variation between years most likely accounts for weather conditions and other stochastic events that cannot be always or easily managed by growers, such as high air temperatures, wet springs, droughts, etc. [11]. As an example, the author has observed high levels of fruit drop in wild blueberry during a late summer extreme drought just before harvest. Even though the annual variation in the level of fruit drop may be small, the temporal pattern of fruit drop appears to be quite dynamic. In 2008, fruit drop continued to occur throughout the growing season, whereas in 2011, the period of fruit drop was much shorter. This may be related to the underlying causes, but with only two years of data, viable hypotheses cannot be put forth. A search of the literature did not provide reference to other studies that have focused on the temporal patterns of fruit drop and their explanation.
Field-to-field variation in fruit drop, explaining about 20% of the variance, may be due to factors of wild blueberry grower production that cannot be managed, such as soil depth relative to bedrock, genotype spatial composition and resulting pollen compatibility in outcrossing. Qu et al. [39] have shown that a large clone size reduces productivity due to reduction of outcrossing by bees, and Bell et al. [40] showed that spatial relatedness of clones and hence outcrossing compatibility might potentially affect productivity. However, field-to-field variation in fruit drop can also be due to differential ability or effort in growers to manage soil fertility, soil moisture through irrigation, pest and disease outbreaks and bee densities for pollination. In lowbush, highbush and rabbiteye blueberry, boron and calcium limitations have been hypothesized as causes for fruit drop [14,15,16,17].
However, micro-spatial factors appear to be predominant in explaining wild blueberry fruit drop variation. The clone and stem sources of variation accounted for almost 73% of the variance in fruit drop. Clone and stem physiological characteristics, local soil fertility and moisture as well as clone pollination attributes, such as compatibility with outcrossed pollen [26], clone size [39], gene flow [27,41], attractiveness of wild blueberry to pollinators compared to other co-flowering plants [42], attractiveness of wild blueberry flower size and age [42], flower density [8], and bee species visitation efficiency [42], may all play a role in fruit set. These factors will affect the number of compatible pollen tetrads deposited on stigmas during pollination, resulting in variable seed set leading to fruit drop. Drummond [8] found that at least 12 genetically compatible tetrads need to be placed upon a wild blueberry stigma to result in a 50% likelihood of set fruit. This study suggests that dropped fruit had lower overall viable seed set than harvested fruit and that these factors can be operating in a field, most likely at the clone level. In addition, a three-year study conducted on the efficacy of commercial bumble bee hives for pollination of wild blueberry compared to the use of honey bees showed that fruit drop was more prevalent with honey bee pollination [7]. The likely cause is the 8-fold reduction of pollen deposition on wild blueberry flower stigmas per honey bee visit compared to bumble bees [42].
The two-clone study conducted in 1997 suggests that clone is a major driver in the expression and possible mechanism for fruit drop. This study measured fruit drop in two clones in the same field. One clone showed a proportional response with fruit drop and the other clone was characterized by a resource limitation response. These clones, while exhibiting different fruit drop dynamics, were only ca. 10 m apart. This indicates that the two different responses observed were due to endogenous genotype physiological characteristics rather than exogenous factors, such as weather, pest attack, or grower management factors, even though exogenous factors have been hypothesized to cause fruit drop in wild blueberry (Figure 1). If the endogenous clone influence on fruit drop is borne out to be a consistent modifier or cause of fruit drop then the hypotheses conceptualized in Figure 1 should emphasize the clone effect by illustrating its effect with a heavy line. If this clone-to-clone variation in fruit set is based upon genotype characteristics, then determining the causes of fruit drop in wild blueberry, which are not planted, might be quite difficult. Genotype or “cultivar” causes of fruit drop have been shown to be common in highbush blueberry systems, both directly and indirectly [16,18]. Cultivars in other fruit crops show differential fruit drop [11,19]. Stems explain high levels of variation as well (37.4%). Some of this variance undoubtably reflects the clone effect, but it could also reflect the effect of variation in flower density per stem. In this study, flower density ranged from 4 to 127 flowers/stem between 1996 and 1999. Flower density has been implicated in both wild plant species and domesticated crop species as a factor in fruit drop [19,36,37,43,44]. The effect of flower density was not explicitly included in the conceptual model for fruit drop in wild blueberry, but it is reflected by the fruit density causal agent, “number of fruits” (depicted in red text in Figure 1). This is because our previous research, based upon flower removal, showed a differential effect of flower density on fruit drop [23,25].
The literature suggests that premature fruit drop is complex, with many causal factors, ranging from weather stress to a lack of nutrients, poor pollination (incompatible pollen), and attacks on the fruit by plant insect pests and diseases. Fruit drop may not only be due to these factors acting independently, but to interactions among these factors. A hypothesis diagramed in Figure 1 shows that both exogenous factors, such as weather, and endogenous factors, such as plant genotype (clone), are plausible causes of fruit drop. This study was not designed to test the hypothesis of multiple interacting stressors that cause fruit drop, but only the severity, temporal progression and the general mechanistic form of the causal factor(s) (proportional vs. resource limitation). It is hoped that the theoretical models for testing the form of the causal factor might be useful in future studies of fruit drop across plant species and genotypes or cultivars. There is not a technique such as this that could found in the literature for determining mechanistic dynamics.
In answering the central question referred to in the title of this paper, circumstantial evidence was provided that poor seed set can be a cause of fruit drop in wild blueberry. Seed set is a consequence of multiple factors, such as specific bee species visitation due to differences in pollination efficiency [42]; the genotypes of sire (compatible pollen) matched with mother (ovules) [26] at the plant level; and bee density [29], clone spatial pattern [39,40] and average fruit set [8] at the field level. Therefore, pollination and the resulting fertilization of ovules and development of fruit is a complex dynamic and not predictable without computer simulation modeling. Modeling by Qu and Drummond [39] have shown that it is not only these factors, but also clone two-dimensional size that can affect the amount of compatible pollen deposition on stigmas and subsequent fruit and seed set. Unfortunately, their modeling also showed that conditions for fruit drop (described above) consistently occurred under current wild blueberry production methods that are implemented in fields of randomly compatible clone composition. Fruit drop caused by controlled exogenous factors, such as soil fertility, may be difficult to predict or manage by growers due to the potential interaction of several endogenous and exogenous factors. In summary, fruit drop can be severe in wild blueberry and it can be due to low levels of pollination resulting in low seed set. However, increasing densities of efficient pollinating bee species in the field is not likely to eliminate fruit drop. This is because high levels of fruit set on plants with high flower densities can end up increasing fruit drop [7], presumably due to the water and nutrient limitations associated with an overabundant crop. The plant “choses” to drop some fruit in order to support and maintain the remaining fruits.
Funding
This research was funded by the Maine Wild Blueberry Commission and was supported by the USDA National Institute of Food and Agriculture, Hatch Project number ME0-21505 through the Maine Agricultural & Forest Experiment Station. This is Maine Agricultural and Forest Experiment Publication Number 3757.
Acknowledgments
I would like to thank the wild blueberry growers who allowed me to use their fields for this research. I would like to thank my long-time colleague, Constance Stubbs, for initiating this study with me. It was her question of whether a lack of pollination intensity was associated with fruit drop in wild blueberry that initiated this study. She collected much of the early data on this study. I would also like to thank Judy Collins who helped me collect some of the data in this study. Her attention to careful data collection and detail are exemplary.
Conflicts of Interest
The author declares no conflict of interest.
References
- Calderwood, L.; Yarborough, D.E.; Tooley, B. Maine Wild Blueberry Production Statistics. Wild Blueberry Fact Sheet. 2019. Available online: https://extension.umaine.edu/blueberries/factsheets/statistics-2/crop-production-statistics-2019/ (accessed on 30 April 2020).
- Jones, M.S.; Vanhanen, H.; Peltola, R.; Drummond, F.A. A global review of arthropod-mediated ecosystem-services in Vaccinium berry agroecosystems. Terr. Arthropod Rev. 2014, 7, 41–78. [Google Scholar] [CrossRef]
- Yarborough, D.E. Wild Blueberry Culture in Maine. Wild Blueberry Fact Sheet. No. 220, Bulletin No. 2088. 2009. Available online: https://extension.umaine.edu/blueberries/factsheets/production/wildblueberryculture-in-maine/ (accessed on 6 May 2020).
- Bell, D.J.; Rowland, L.J.; Smagula, J.; Drummond, F.A. Recent advances in the biology and genetics of lowbush blueberry. Maine Agric. For. Exp. Stn. Tech. Bull. 2009, 203, 1–28. [Google Scholar]
- Eaton, L.J.; Murray, J.E. Relationships of pollinator numbers in blueberry fields to fruit development and yields. Acta Hort. 1996, 446, 181–188. [Google Scholar] [CrossRef]
- Bushmann, S.; Drummond, F.A. A literature review and analysis of pollination services provided by wild and managed bees (Apoidea) in wild blueberry (Vaccinium angustifolium Aiton) production. In Prep.
- Drummond, F.A. Commercial bumblebee pollination of lowbush blueberry. Int. J. Fruit Sci. 2012, 12, 54–64. [Google Scholar] [CrossRef]
- Drummond, F.A. Reproductive biology of wild blueberry (Vaccinium angustifolium Aiton). Agriculture 2019, 9, 69. [Google Scholar] [CrossRef] [Green Version]
- Drummond, F.A. Factors that affect yield in wild blueberry, Vaccinium angustifolium Aiton. Agirc. Res. Technol. Open Access J. 2019, 22. [Google Scholar] [CrossRef]
- Yarborough, D.; Drummond, F.A.; Annis, S.; D’Appollonio, J. Maine Wild blueberry systems analysis. Acta Hortic. 2017, 1180, 151–160. [Google Scholar] [CrossRef]
- Racsko, J.; Nagy, J.; Soltész, M.; Nyeki, J.; Szabo, Z. Fruit drop: I. Specific characteristics and varietal properties of fruit drop. Int. J. Hortic. Sci. 2006, 12, 59–67. [Google Scholar] [CrossRef]
- Bookman, S.S. Costs and benefits of flower abscission and fruit abortion in Asclepias speciosa. Ecology 1983, 64, 264–273. [Google Scholar] [CrossRef]
- Allen, J.C. The effect of citrus rust mite damage on citrus fruit drop. J. Econ. Entomol. 1978, 71, 746–750. [Google Scholar] [CrossRef]
- Smagula, J.M. Effect of boron on lowbush blueberry fruit set and yield. Acta Hortic. 1993, 346, 183–192. [Google Scholar] [CrossRef]
- Milić, B.; Tarlanović, J.; Keserović, Z.; Magazin, N.; Miodragović, M.; Popara, G. Bioregulators can improve fruit size, yield and plant growth of northern highbush blueberry (Vaccinium corymbosum L.). Sci. Hortic. 2018, 235, 214–220. [Google Scholar] [CrossRef]
- Gerbrandt, E.M.; Mouritzen, C.; Sweeney, M. Foliar calcium corrects a deficiency causing green fruit drop in ‘Draper’ highbush blueberry (Vaccinium corymbosum L.). Agriculture 2019, 9, 63. [Google Scholar] [CrossRef] [Green Version]
- Koura, S.; Minowa, Y.; Tachikawa, S.; Kato, T.; Taniguchi, M. Study on Control of Fruit Drop of Rabbiteye Blueberry (Vaccinium ashei), 1: The Effect of GA3 and Aminoethoxyvinylglycine on Fruit Setting under Severe Condition. 2000. Available online: https://agris.fao.org/agris-search/search.do?recordID=JP2000003686 (accessed on 6 May 2020).
- Diaz-Lara, A.; Martin, R.R. Blueberry fruit drop-associated virus: A new member of the family Caulimoviridae isolated from blueberry exhibiting fruit-drop symptoms. Plant Dis. 2016, 100, 2211–2214. [Google Scholar] [CrossRef] [PubMed] [Green Version]
- Racskó, J.; Leite, G.B.; Petri, J.L.; Zhongfu, S.; Wang, Y.; Szabó, Z.; Soltész, M.; Nyéki, J. Fruit drop: The role of inner agents and environmental factors in the drop of flowers and fruits. Int. J. Hortic. Sci. 2007, 13, 13–23. [Google Scholar] [CrossRef]
- Drummond, F.A.; Collins, J. Dispersal from Overwintering Sites, Action Thresholds for Rhagoletis mendax (Diptera: Tephritidae), and Factors that can Influence Variation in Predicted Fruit Infestation Levels in Maine Wild Blueberry. Part I. J. Econ. Entomol. 2020, 113, 851–859. [Google Scholar] [CrossRef]
- Drummond, F.A.; Collins, J.; Ballman, E. Population dynamics of spotted wing drosophila (Drosophila suzukii (Matsumura)) in Maine wild blueberry. Insects 2019, 10, 205. [Google Scholar] [CrossRef] [Green Version]
- Penman, L.N.; Annis, S.L. Leaf and flower blight caused by Monilinia vaccinii-corymbosi on lowbush blueberry: Effects on yield and relationship to bud phenology. Phytopathology 2005, 95, 1174–1182. [Google Scholar] [CrossRef] [Green Version]
- Bajcz, A.W.; Drummond, F.A. Flower power: Floral and resource manipulations reveal the consequences of reproductive effort in lowbush blueberry (Vaccinium angustifolium). Ecol. Evol. 2017, 7, 5645–5659. [Google Scholar] [CrossRef] [Green Version]
- Tasnim, R.; Calderwood, L.; Annis, S.; Drummond, F.A.; Zhang, Y.-J. The future of wild blueberries: Testing warming impacts using open-top chambers. Spire 2020. Available online: https://umaine.edu/spire/2020/02/10/ wildblueberries/ (accessed on 17 June 2020).
- Bajcz, A.W.; Drummond, F.A. Bearing fruit: Flower removal reveals the trade-offs associated with high reproductive effort for lowbush blueberry. Oecologia 2017, 185, 13–26. [Google Scholar] [CrossRef]
- Bell, D.J.; Rowland, L.J.; Stommel, J.; Drummond, F.A. Yield variation among clones of lowbush blueberry as a function of kinship and self-compatibility. J. Am. Soc. Hortic. Sci. 2010, 135, 1–12. [Google Scholar]
- Bell, D.J.; Drummond, F.A.; Rowland, J.L. Evidence of functional gender polymorphisms in a population of the hermaphroditic lowbush blueberry (Vaccinium angustifolium Ait.). Botany 2012, 90, 393–399. [Google Scholar] [CrossRef]
- Yarborough, D. Blueberry Enterprise Budget. Wild Blueberry Fact Sheet. No. 260. Bulletin No. 2016. 2011. Available online: https://extension.umaine.edu/blueberries/factsheets/marketing-and-business-manage-ment/260-blueberry-enterprise-budget/ (accessed on 30 April 2020).
- Asare, E.; Hoshide, A.K.; Drummond, F.A.; Chen, X.; Criner, G.K. Economic risk of bee pollination in Maine wild blueberry, Vaccinium angustifolium Aiton. J. Econ. Entomol. 2017, 110, 1980–1992. [Google Scholar] [CrossRef] [PubMed] [Green Version]
- SAS Institute. JMP® Version 14; SAS Institute Inc.: Cary, NC, USA, 2017. [Google Scholar]
- Kuznetsova, A.; Brockhoff, P.V.; Christensen, R.H.B. Lmertest Package: Tests in linear mixed effects models. J. Stat. Software 2017, 88, 1–26. [Google Scholar] [CrossRef] [Green Version]
- Zar, J.H. Biostatistical Analysis, 5th ed.; Prentice-Hall/Pearson: Upper Saddle River, NJ, USA, 2010; 944p. [Google Scholar]
- Drummond, F.; Collum, K.; Hanes, S.; Wilson, M.; Skinner, J.; Collins, J. A Pollination Toolbox for Wild Blueberry Growers. J. Res. Exten. Workers Conf. 2015. [Google Scholar] [CrossRef]
- Drummond, F.A. Estimating fruit set and pollinator force in wild blueberry. Wild Blueberry Fact Sheet. 2020. Univ. Maine Coop. Ext. Fact Sheet No. 2019. Available online: https://extension.umaine.edu/blueberries/estimating-the-strength-of-your-pollinator-force-in-wild-blueberry/ (accessed on 9 May 2020).
- Du Clos, B.; Loftin, C.; Drummond, F.A. BeeMapper Tool Quick Reference Guide. 2017. Available online: https://umaine.edu/beemapper/wp-content/uploads/sites/353/2017/07/BeeMapper-Quick-Guide-for-Web.pdf (accessed on 5 May 2020).
- Ehrlen, J. Why do plants produce surplus flowers? A reserve-ovary model. Am. Nat. 1991, 138, 918–933. [Google Scholar] [CrossRef]
- Stephenson, A.G. Flower and fruit abortion: Proximate causes and ultimate functions. Ann. Rev. Ecol. Syst. 1981, 12, 253–279. [Google Scholar] [CrossRef]
- Sadras, V.O. Evolutionary aspects of the trade-off between seed size and number in crops. Field Crops Res. 2007, 100, 125–138. [Google Scholar] [CrossRef]
- Qu, H.; Drummond, F.A. Simulation-based modeling of wild blueberry pollination. Electron. Comp. Agric. 2018, 144, 94–101. [Google Scholar] [CrossRef]
- Bell, D.J.; Rowland, L.J.; Drummond, F.A. Fine-scale spatial genetic structure associated with Vaccinium angustifolium Aiton (Ericaceae). Int. J. Bot. 2012, 2, 72–82. [Google Scholar]
- Rowland, L.J.; Ogden, E.L.; Bell, D.J.; Drummond, F.A. Pollen-mediated gene flow in managed fields of lowbush blueberry. Can. J. Plant Sci. 2019, 100, 95–102. [Google Scholar] [CrossRef]
- Drummond, F.A. Behavior of bees associated with the wild blueberry agro-ecosystem in the USA. Int. J. Entomol. Nematol. 2016, 2, 27–41. [Google Scholar]
- Quinlan, J.D.; Preston, A.P. Effects of thinning blossom and fruitlets on growth and cropping of Sunset apple. J. Hortic. Sci. 1968, 43, 373–381. [Google Scholar] [CrossRef]
- Willson, M.F.; Price, P.W. The evolution of inflorescence size in Asclepias (Asclepiadaceae). Evolution 1977, 31, 495–511. [Google Scholar] [CrossRef]
Figure 1.
A conceptual model for fruit drop in wild blueberry. Relationships are based upon a review of more than 47 research studies [19]. Terms in red text are presumed major mechanisms that result in drop characterized either by abortion of flowers/embryos or by abscission of fruit (fruit drop). Green-colored text represents the plant hormones and bioactive plant growth regulating compounds that may be involved in the physiological mechanism of abortion of embryos or fruit drop.

Figure 2.
Conceptual model of the four expectations of fruit drop tested with field data from two clones (1977): (A) no measurable fruit drop; (B) proportional fruit drop; (C) constant amount of fruit drop; and (D) resource limitation. An explanation of the four expectations is in the main text.
Figure 2.
Conceptual model of the four expectations of fruit drop tested with field data from two clones (1977): (A) no measurable fruit drop; (B) proportional fruit drop; (C) constant amount of fruit drop; and (D) resource limitation. An explanation of the four expectations is in the main text.

Figure 3.
Proportion fruit set, yield (harvested berries/m2) and dropped fruit (green + mature ripe fruit/m2) for individual wild blueberry clones in eastern Maine, USA: (A) 2008; and (B) 2011.
Figure 3.
Proportion fruit set, yield (harvested berries/m2) and dropped fruit (green + mature ripe fruit/m2) for individual wild blueberry clones in eastern Maine, USA: (A) 2008; and (B) 2011.

Figure 4.
Temporal pattern of wild blueberry fruit drop (green fruit and mature ripe fruit) during the growing season (post-bloom) in eastern Maine, USA: (A) 2008; and (B) 2011.
Figure 4.
Temporal pattern of wild blueberry fruit drop (green fruit and mature ripe fruit) during the growing season (post-bloom) in eastern Maine, USA: (A) 2008; and (B) 2011.

Figure 5.
Frequency distributions of viable seeds/berry in eastern Maine, USA: (A) dropped fruit and (B) harvested fruit, collected in a commercial wild blueberry field in 2011.
Figure 5.
Frequency distributions of viable seeds/berry in eastern Maine, USA: (A) dropped fruit and (B) harvested fruit, collected in a commercial wild blueberry field in 2011.

Figure 6.
Relationships between wild blueberry flower density and set fruit densities and harvested (mature ripe) fruit in eastern Maine, USA: (A) Clone #1; and (B) Clone #2. The red dashed line is the 1:1 slope where no fruit drop occurs (flowers/stem = set fruit/stem and mature fruit/stem).
Figure 6.
Relationships between wild blueberry flower density and set fruit densities and harvested (mature ripe) fruit in eastern Maine, USA: (A) Clone #1; and (B) Clone #2. The red dashed line is the 1:1 slope where no fruit drop occurs (flowers/stem = set fruit/stem and mature fruit/stem).

Figure 7.
Maine, USA, wild blueberry linear proportional models for set fruit vs. dropped fruit (see methods for description of model: (A) 1996; (B) 1997; (C) 1998; and (D) 1999. Each field is a colored solid line. The red dashed line is the 1:1 relationship between set fruit and dropped fruit in which all set fruit are dropped, thus rendering no harvestable yield.


Figure 8.
Variance in wild blueberry dropped fruit in eastern Maine, USA, partitioned due to year, field, clone and stem (all variance estimates are significantly different from 0, P < 0.05).
Figure 8.
Variance in wild blueberry dropped fruit in eastern Maine, USA, partitioned due to year, field, clone and stem (all variance estimates are significantly different from 0, P < 0.05).

Figure 9.
The average wild blueberry fruit drop determined by the average set fruit for each field (a single data point) within each year in eastern Maine, USA. Slope values are represented by “b” and the significance of the slopes (whether greater than 0) are given by the P values. The error bars are standard errors per field and the red dashed line is the 1:1 relationship between the set fruit and dropped fruit where set fruit are dropped and thus rendering no harvestable yield; so, the closer the regression lines are to the dashed red line, the greater the fruit drop.

© 2020 by the author. Licensee MDPI, Basel, Switzerland. This article is an open access article distributed under the terms and conditions of the Creative Commons Attribution (CC BY) license (http://creativecommons.org/licenses/by/4.0/).
Share and Cite
MDPI and ACS Style
Drummond, F.A. Wild Blueberry Fruit Drop: A Consequence of Seed Set? Agronomy 2020, 10, 939. https://doi.org/10.3390/agronomy10070939
AMA Style
Drummond FA. Wild Blueberry Fruit Drop: A Consequence of Seed Set? Agronomy. 2020; 10(7):939. https://doi.org/10.3390/agronomy10070939
Chicago/Turabian StyleDrummond, Francis A. 2020. "Wild Blueberry Fruit Drop: A Consequence of Seed Set?" Agronomy 10, no. 7: 939. https://doi.org/10.3390/agronomy10070939
Note that from the first issue of 2016, this journal uses article numbers instead of page numbers. See further details here.