Quantitative Analysis of the Effects of Natural and Human Factors on a Hydrological System in Zhangweinan Canal Basin


1
College of Water Sciences, Beijing Normal University, Beijing 100875, China
2
Beijing Key Laboratory of Urban Hydrological Cycle and Sponge City Technology, Beijing Normal University, Beijing 100875, China
3
Environment Science Division, Argonne National Laboratory, Lemont, IL 60439, USA
*
Author to whom correspondence should be addressed.
Water 2020, 12(7), 1864; https://doi.org/10.3390/w12071864
Submission received: 20 May 2020
/
Revised: 26 June 2020
/
Accepted: 26 June 2020
/
Published: 29 June 2020
(This article belongs to the Section Hydrology)
Abstract
:Drought is a water deficit state caused by large-scale climate change that cannot be avoided by a water resource management system. Water scarcity refers to the unsustainable utilization of water resources over a long time, which is the result of water management policies. However, water deficits caused by drought and water scarcity often occur simultaneously and are indistinguishable. This study proposes a model-based simulation framework that can quantitatively distinguish natural factors (drought) from human factors (water scarcity) in a hydrological system. The simulation was applied to the Zhangweinan Canal Basin, based on the runoff sequences from 1950 to 2004. The results show that the runoff curve number, soil depth, soil available water, soil evaporation compensation coefficient, base runoff α coefficient and the maximum canopy interception have the highest sensitivity to runoff, and that the calibrated and validated SWAT model can effectively simulate the runoff process in the Zhangweinan Canal Basin and similar areas. Abrupt changes in human activities in 1975 and water scarcity led to the disappearance of the summer peak runoff period in both wet and dry years. Human factors are the main reason for the change in the hydrological system in the study area; the runoff loss caused by human factors is four times that caused by natural factors according to the proposed variable threshold. This study proposes a model-based simulation framework that can help water resource managers to distinguish the effects of drought and water scarcity in water-stressed areas and adjust management accordingly.
1. Introduction
The field of hydrology and water resources usually exhibits very complex features; this complexity is mainly reflected in uncertainty. Drought research has always been an important element in the field of hydrology and water resources. However, with the rapid development of human society in recent years, water scarcity has gradually become a research hotspot, especially in developing countries [1].
The definition of “drought” usually depends on the selected influencing factors; thus, droughts can be divided into four categories: meteorological [2], hydrological [3], agricultural, and socio-economic [4,5]. Similar to droughts, definitions and criteria for water scarcity are not uniform internationally. Water scarcity is generally considered to refer to the relative shortage of water resources and the inability to meet production, living and ecological needs. Research on water scarcity is often regional (e.g., on watershed, city, or country scales), while the effects of water scarcity include impacts on the functioning of the economy and society, and on human life [6,7].
Although drought and water scarcity are important aspects of water resources management, they are often confused [8,9]. Drought is a natural phenomenon where rainfall in a certain area has been reduced for a period of time, thus affecting the society, the economy and the environment. In addition, drought is a normal cyclical climatic event characterized by many complex factors, not only related to rainfall, but also to topography, soil properties and water facilities [10]. Water scarcity is mainly affected by two factors: supply and demand. Its essence is the imbalance of water supply and demand. When water supply does not meet demand, there is a risk of water scarcity [11]. There are varying degrees of uncertainty in water supply and demand due to rainfall, runoff, human activity and other factors. Therefore, the risk of water scarcity is inevitable [12,13]. In general, a drought is a natural disaster caused by large-scale climate change, is less affected by human activity, and cannot be resolved by regional water resource management systems [14]. Water scarcity is caused by socio-economic development and the unsustainable utilization of water resources for human activities, and can be addressed by water resource management measures [15,16]. Globally, for human socio-economic problems caused by drought and water scarcity, the concepts of “water scarcity” and “drought” are confused, which misleads water resource management departments in the formulation of water management methods and related policies [8,17]. Accordingly, a clear distinction between the concepts allows water resource management systems to be based on sound and effective decisions in water-poor regions.
The Soil and Water Assessment Tool (SWAT) model is a physically-based, deterministic, continuous, GIS-linked watershed-scale simulation model developed by the United States Department of Agriculture-Agricultural Research Service (USDA-ARS) [18,19]. Based on a number of independent models, SWAT has evolved over more than 30 years, and has been tested on different regions, conditions, practices and time scales [20]. Its input options include factors such as hydrological, nutrient, erosion, land management and meteorological data, whereas the output options include runoff, sediment and nutrient yield [21,22]. There are already thousands of journal articles covering SWAT research around the world. These studies have assessed daily, monthly and annual runoff, as well as pollutant output. It has therefore been established that the SWAT model functions well with watersheds under different situations [20].
This study proposes a model-based simulation framework that can quantitatively distinguish natural factors (drought) and human factors (water scarcity) in a hydrological systems. The core of the model framework is to use the SWAT model to simulate natural hydrological scenarios without human disturbances (natural scenarios) and actual hydrological scenarios (coexistence of human and natural scenarios). Based on the difference between the two scenarios, the contributions of drought and water scarcity to the water deficit state, namely, the natural effect and the human effect, are distinguished. The Zhangweinan Canal Basin was used as the study area. The analytical process comprised the following steps: (i) sensitivity analysis and calibration of SWAT model parameters in the Zhangweinan Canal Basin; (ii) applicability evaluation of the SWAT model; (iii) comparative analysis of runoff during natural periods and human disturbance periods; and (iv) quantitative analysis of drought (natural factors) and water scarcity (human factors). The proposed model-based simulation framework will help water resources managers in water-stressed regions to quantify the relative effects of drought and water scarcity and make decisions regarding drought and water scarcity conditions.
2. Materials and Methods
2.1. Study Area
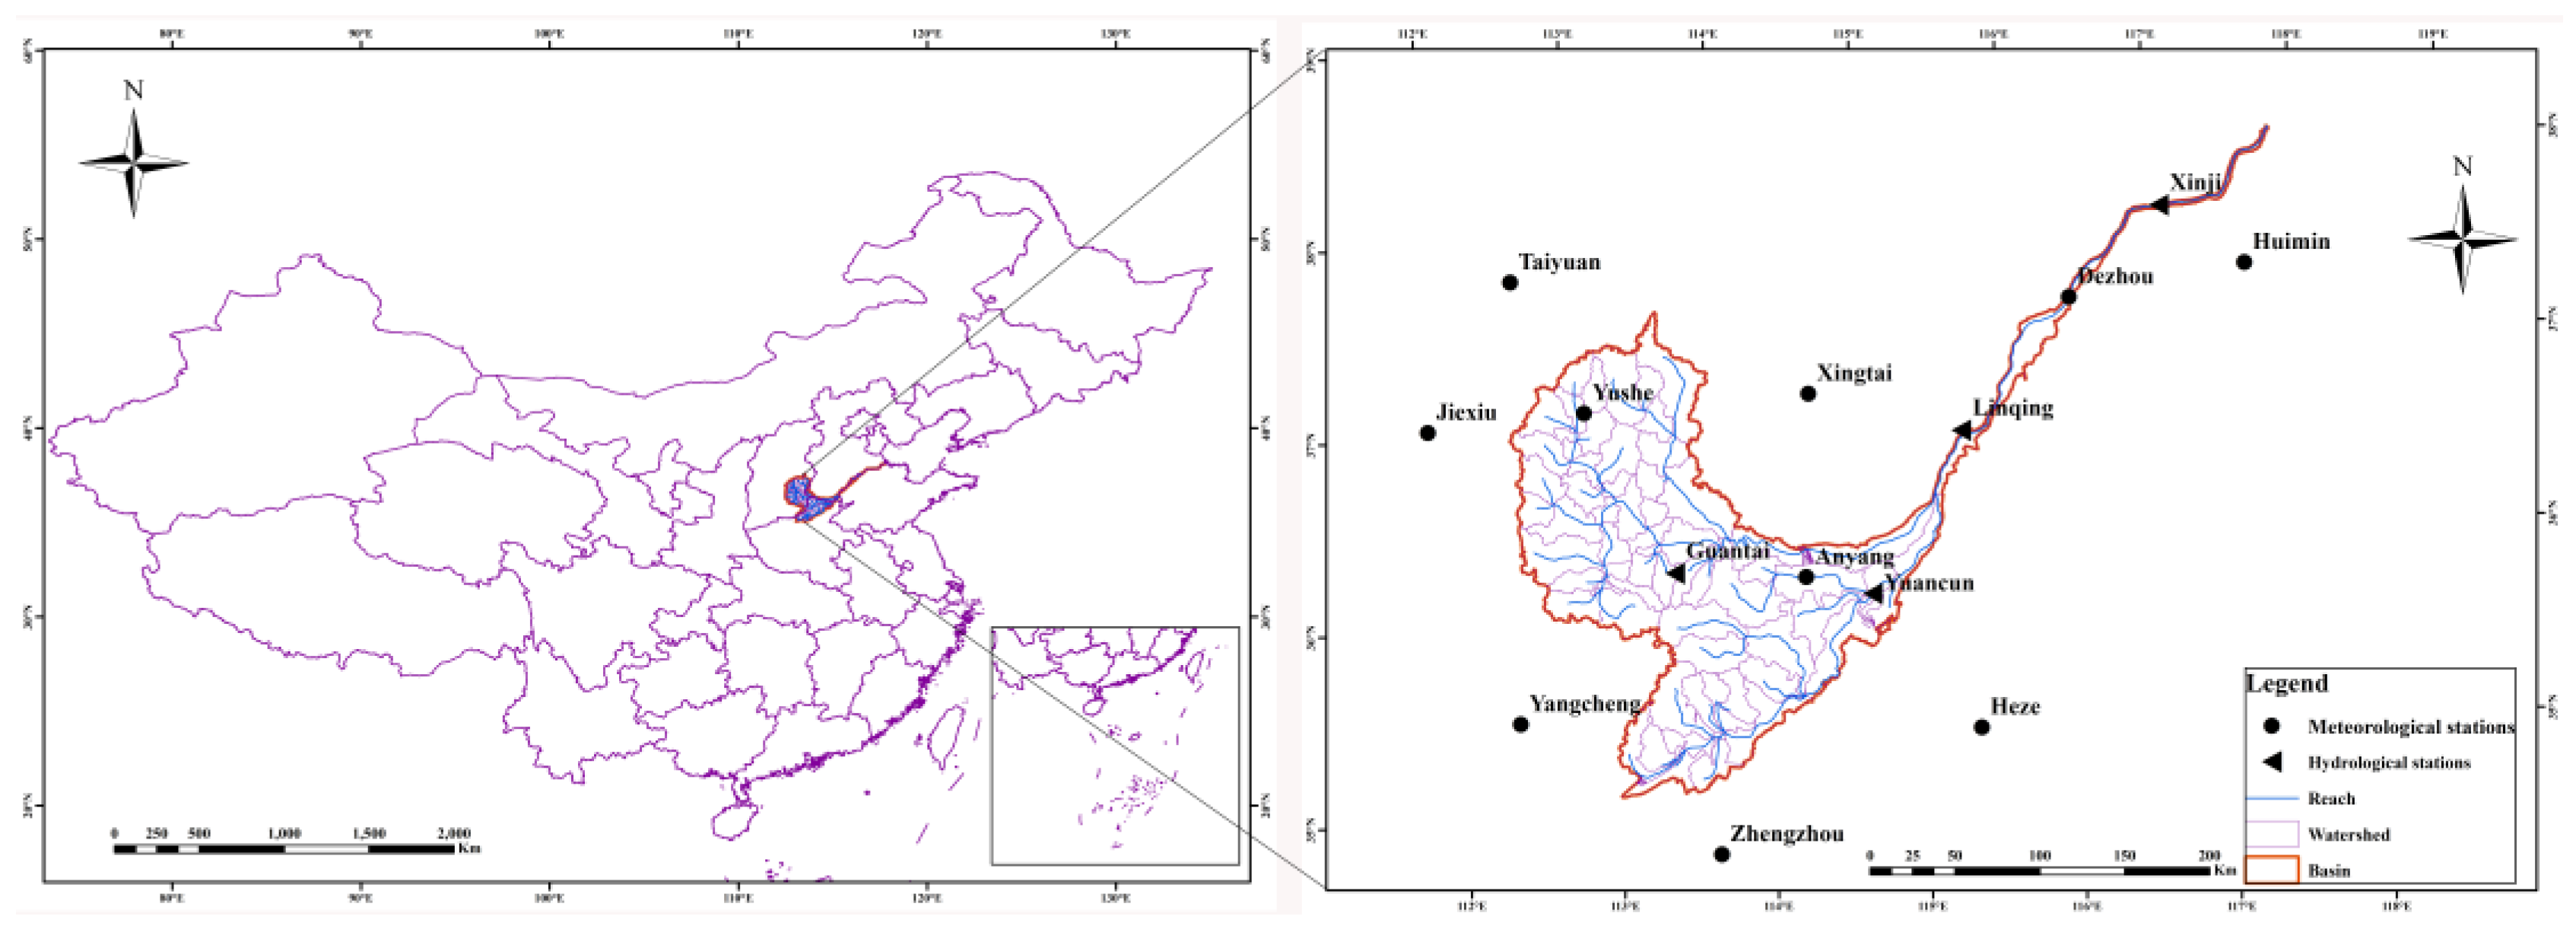
The study area, the Zhangweinan Canal Basin, is located in the southern Haihe River Basin (Figure 1). The watershed covers an area of 37,700 km2, and the basin range is 112°–118° E, 35°–39° N. The Zhangweinan Canal Basin originates from the Taihang Mountains in Shanxi Province, flows from west to east, and eventually into Bohai Bay. The South Canal, the Weihe River, the Wei Canal, the Wei New River and the Wei River form the river system. The terrain of the basin is high in the southwest and low in the northeast, and can be divided into two types of landforms: mountains and plains. The climate of Zhangweinan Canal Basin is considered to be a temperate, continental monsoon climate with a multiyear average temperature of 14 °C and a multiyear average rainfall of 608.4 mm [23,24,25]. Human activities in the river basin of the Zhangweinan Canal Basin mainly involve the urban development which has taken place there in recent decades [26].
2.2. Research Methods
2.2.1. Principle of the Model Framework
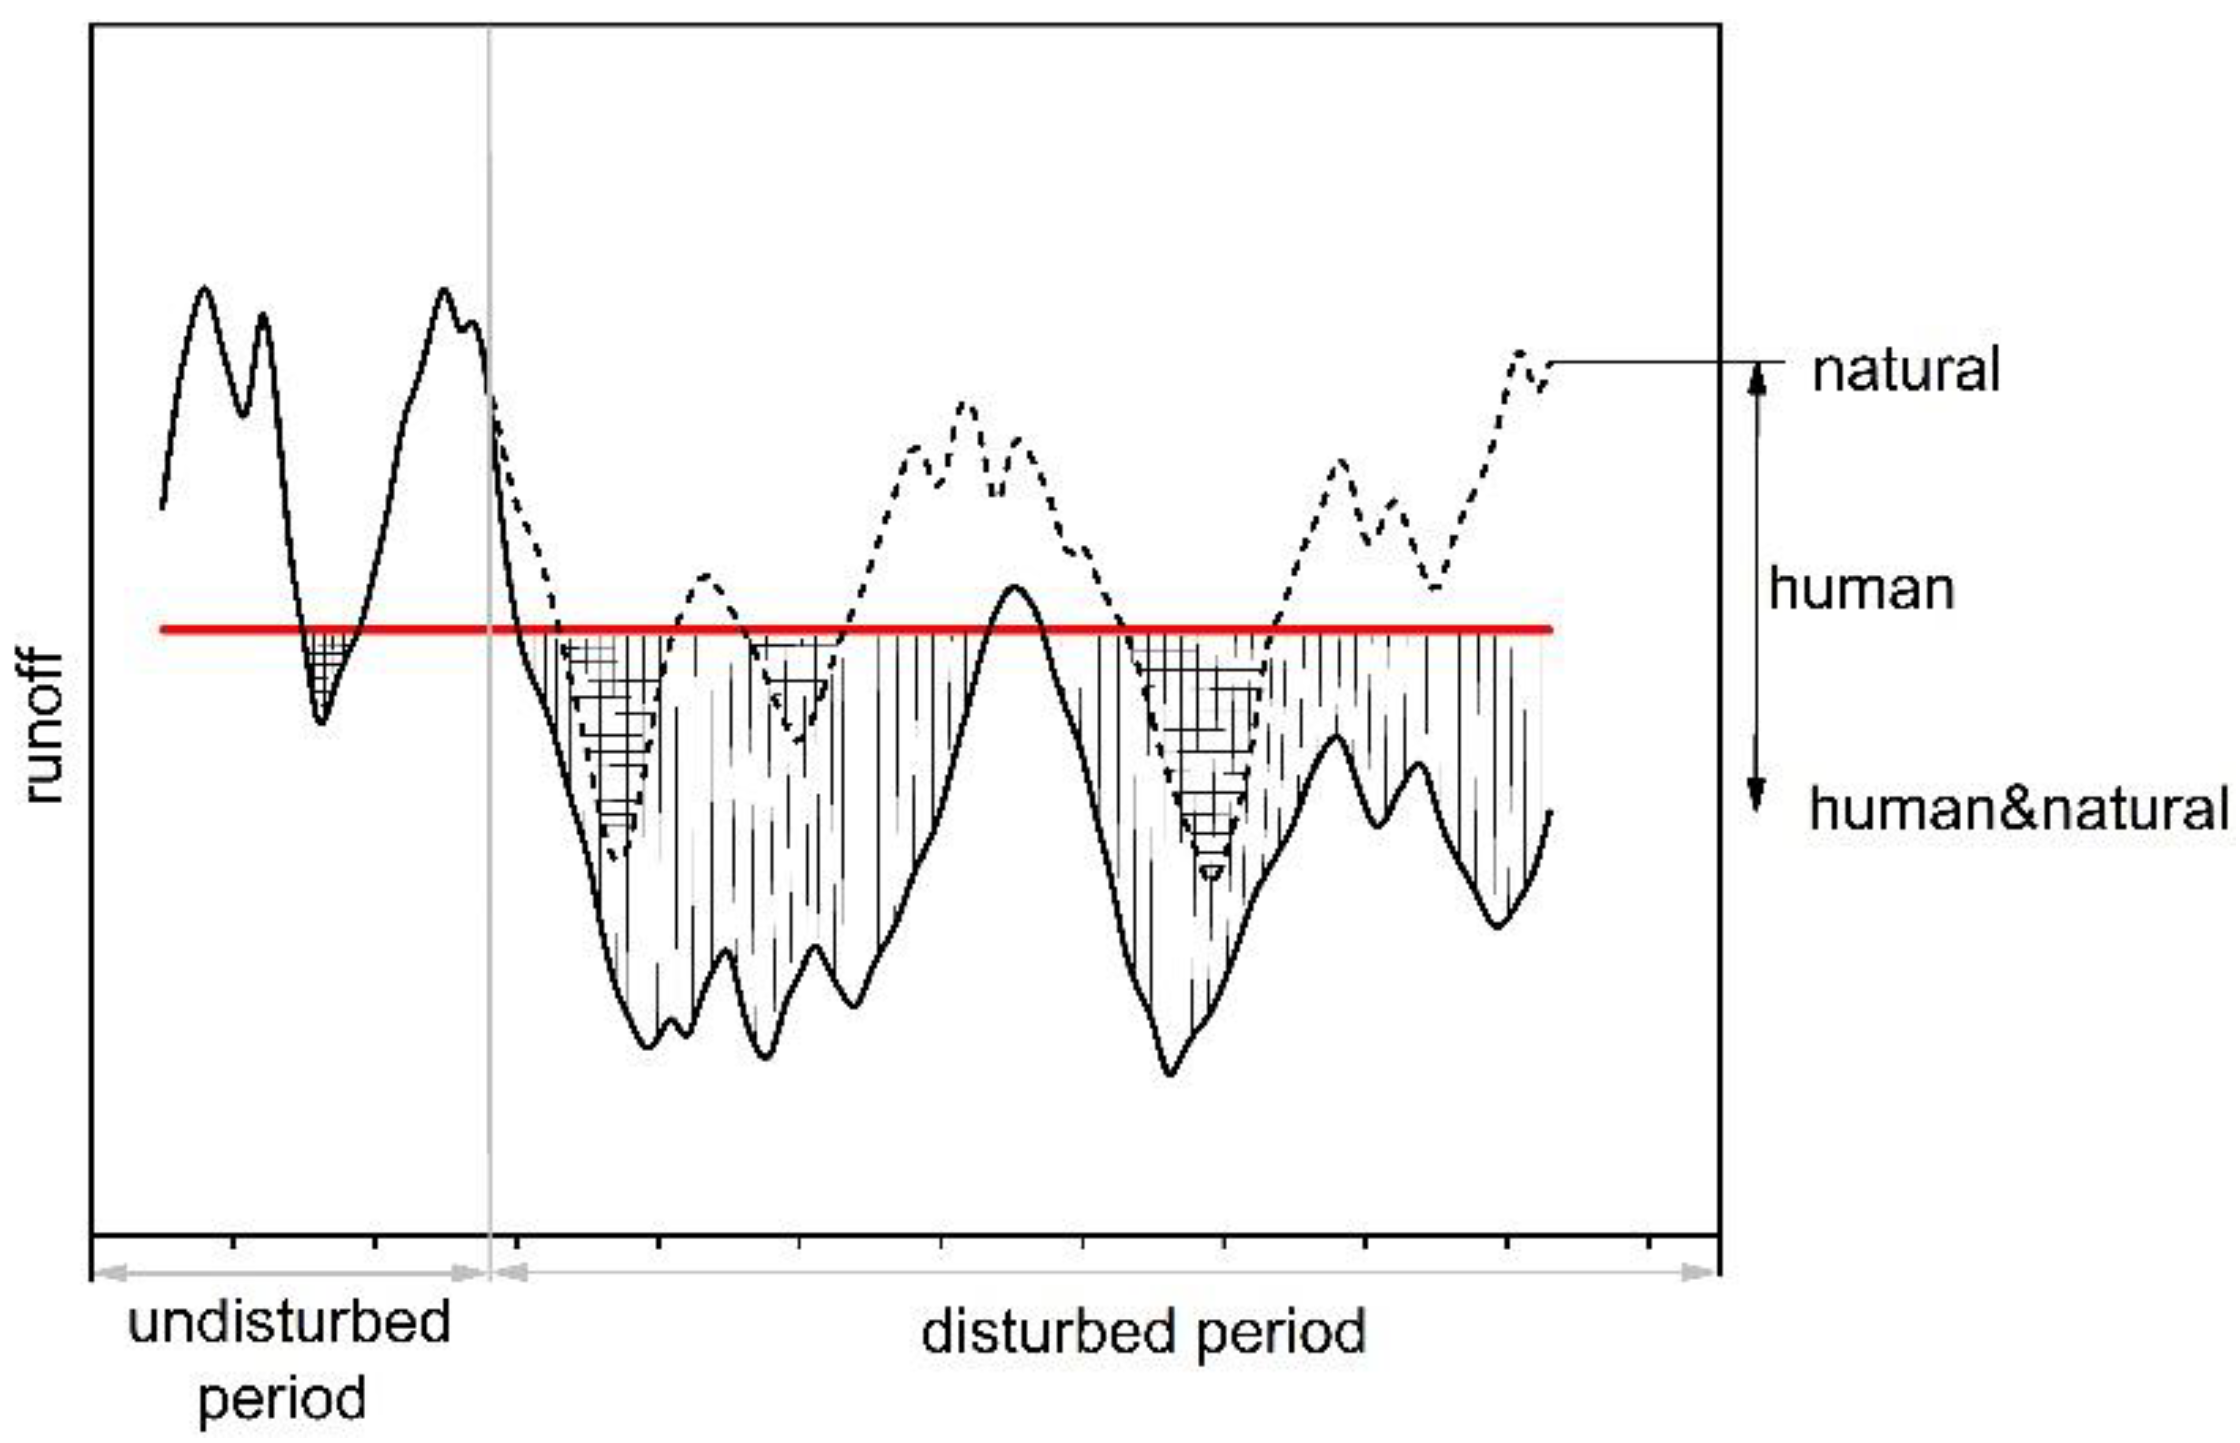
The core of the model-based simulation framework in this study is the hydrological model, which aims to simulate the effect of natural factors on the hydrological system and to exclude the effect of human activities (mainly represented by state variables that characterize the hydrological system, e.g., runoff and groundwater level). Additionally, a difference analysis between natural and human effects (Figure 2) was carried out, and the thresholds under natural conditions were used to further analyze the effects of natural and human factors on the hydrological system [8].
In Figure 2, the solid line represents the observed values, which are the hydrological process under the effects of natural and human factors; the dotted line represents the simulated values, which indicate the hydrological process (e.g., the natural state) excluding human factors; the difference between natural factors and human plus natural factors can be used to determine human factors; finally, the horizontal red line represents the natural average state, that is, the fixed threshold (the minimum ecological environment water demand and the reservoir dead storage capacity). In the first half of the period, the observed values are almost coincident with the simulated values, indicating that the effect of human activities is negligible. This period is called “the period without human disturbance”. The latter half of the period is called “the period of human disturbance”, and the difference between the observed and simulated values during this period can be viewed as describing the human effect. Moreover, this hydrological process line can be characterized by hydrological variables such as soil water content, groundwater reserves and runoff. The red line represents the natural average state, which is a fixed threshold; the hydrological system is adversely affected and cannot maintain the normal state if it is below the threshold. Therefore, the difference between the observed and simulated hydrological process can be distinguished based on this threshold. In Figure 2, the natural factors (dashed line) produce three short-term effects (grid lines) under the exclusion of human disturbance, whereas the interaction of human and natural factors (solid line) produces two longer effects (vertical grid). Therefore, the effects of natural and human factors on the hydrological system are quantified by comparing the observed and simulated hydrological processes with the threshold.
2.2.2. Mann-Kendall Test
The Mann-Kendall (MK) nonparametric test is often used to analyze trend changes in time series of rainfall, runoff and other factors. One advantage of its use is that the sample does not need to follow a certain distribution, and it is rarely disturbed by abnormal values. Therefore, this test is recommended for general use by the World Climate Organization, and has been widely used for analyses of climate trends [27].
(1) Mann-Kendall trend analysis
In the Mann-Kendall test, the statistical value S and the standardized test statistic Z are calculated as follows [28,29]:
where x is the sequential values of the variable, n is the length of the data sequence, and z is used to evaluate the statistical trend; a positive z indicates an upwards trend, whereas a negative value represents a downwards trend. In addition, H0 is rejected at the two-sides significance level of α if .
(2) Abrupt change point
Mann-Kendall analysis can be used to test the abrupt change point of a sequence as follows [30,31]:
where UFk is a sequence of statistics calculated in time series x, and UBk is a sequence of statistics calculated in reverse order to the time series x. Ufi is a standard normal distribution; if significance level α is given and , it indicates a significant trend change in the sequence, and if there is an intersection point between the two curves of UFk and UBk, this is the moment when the change starts.
2.2.3. Run Analysis Theory
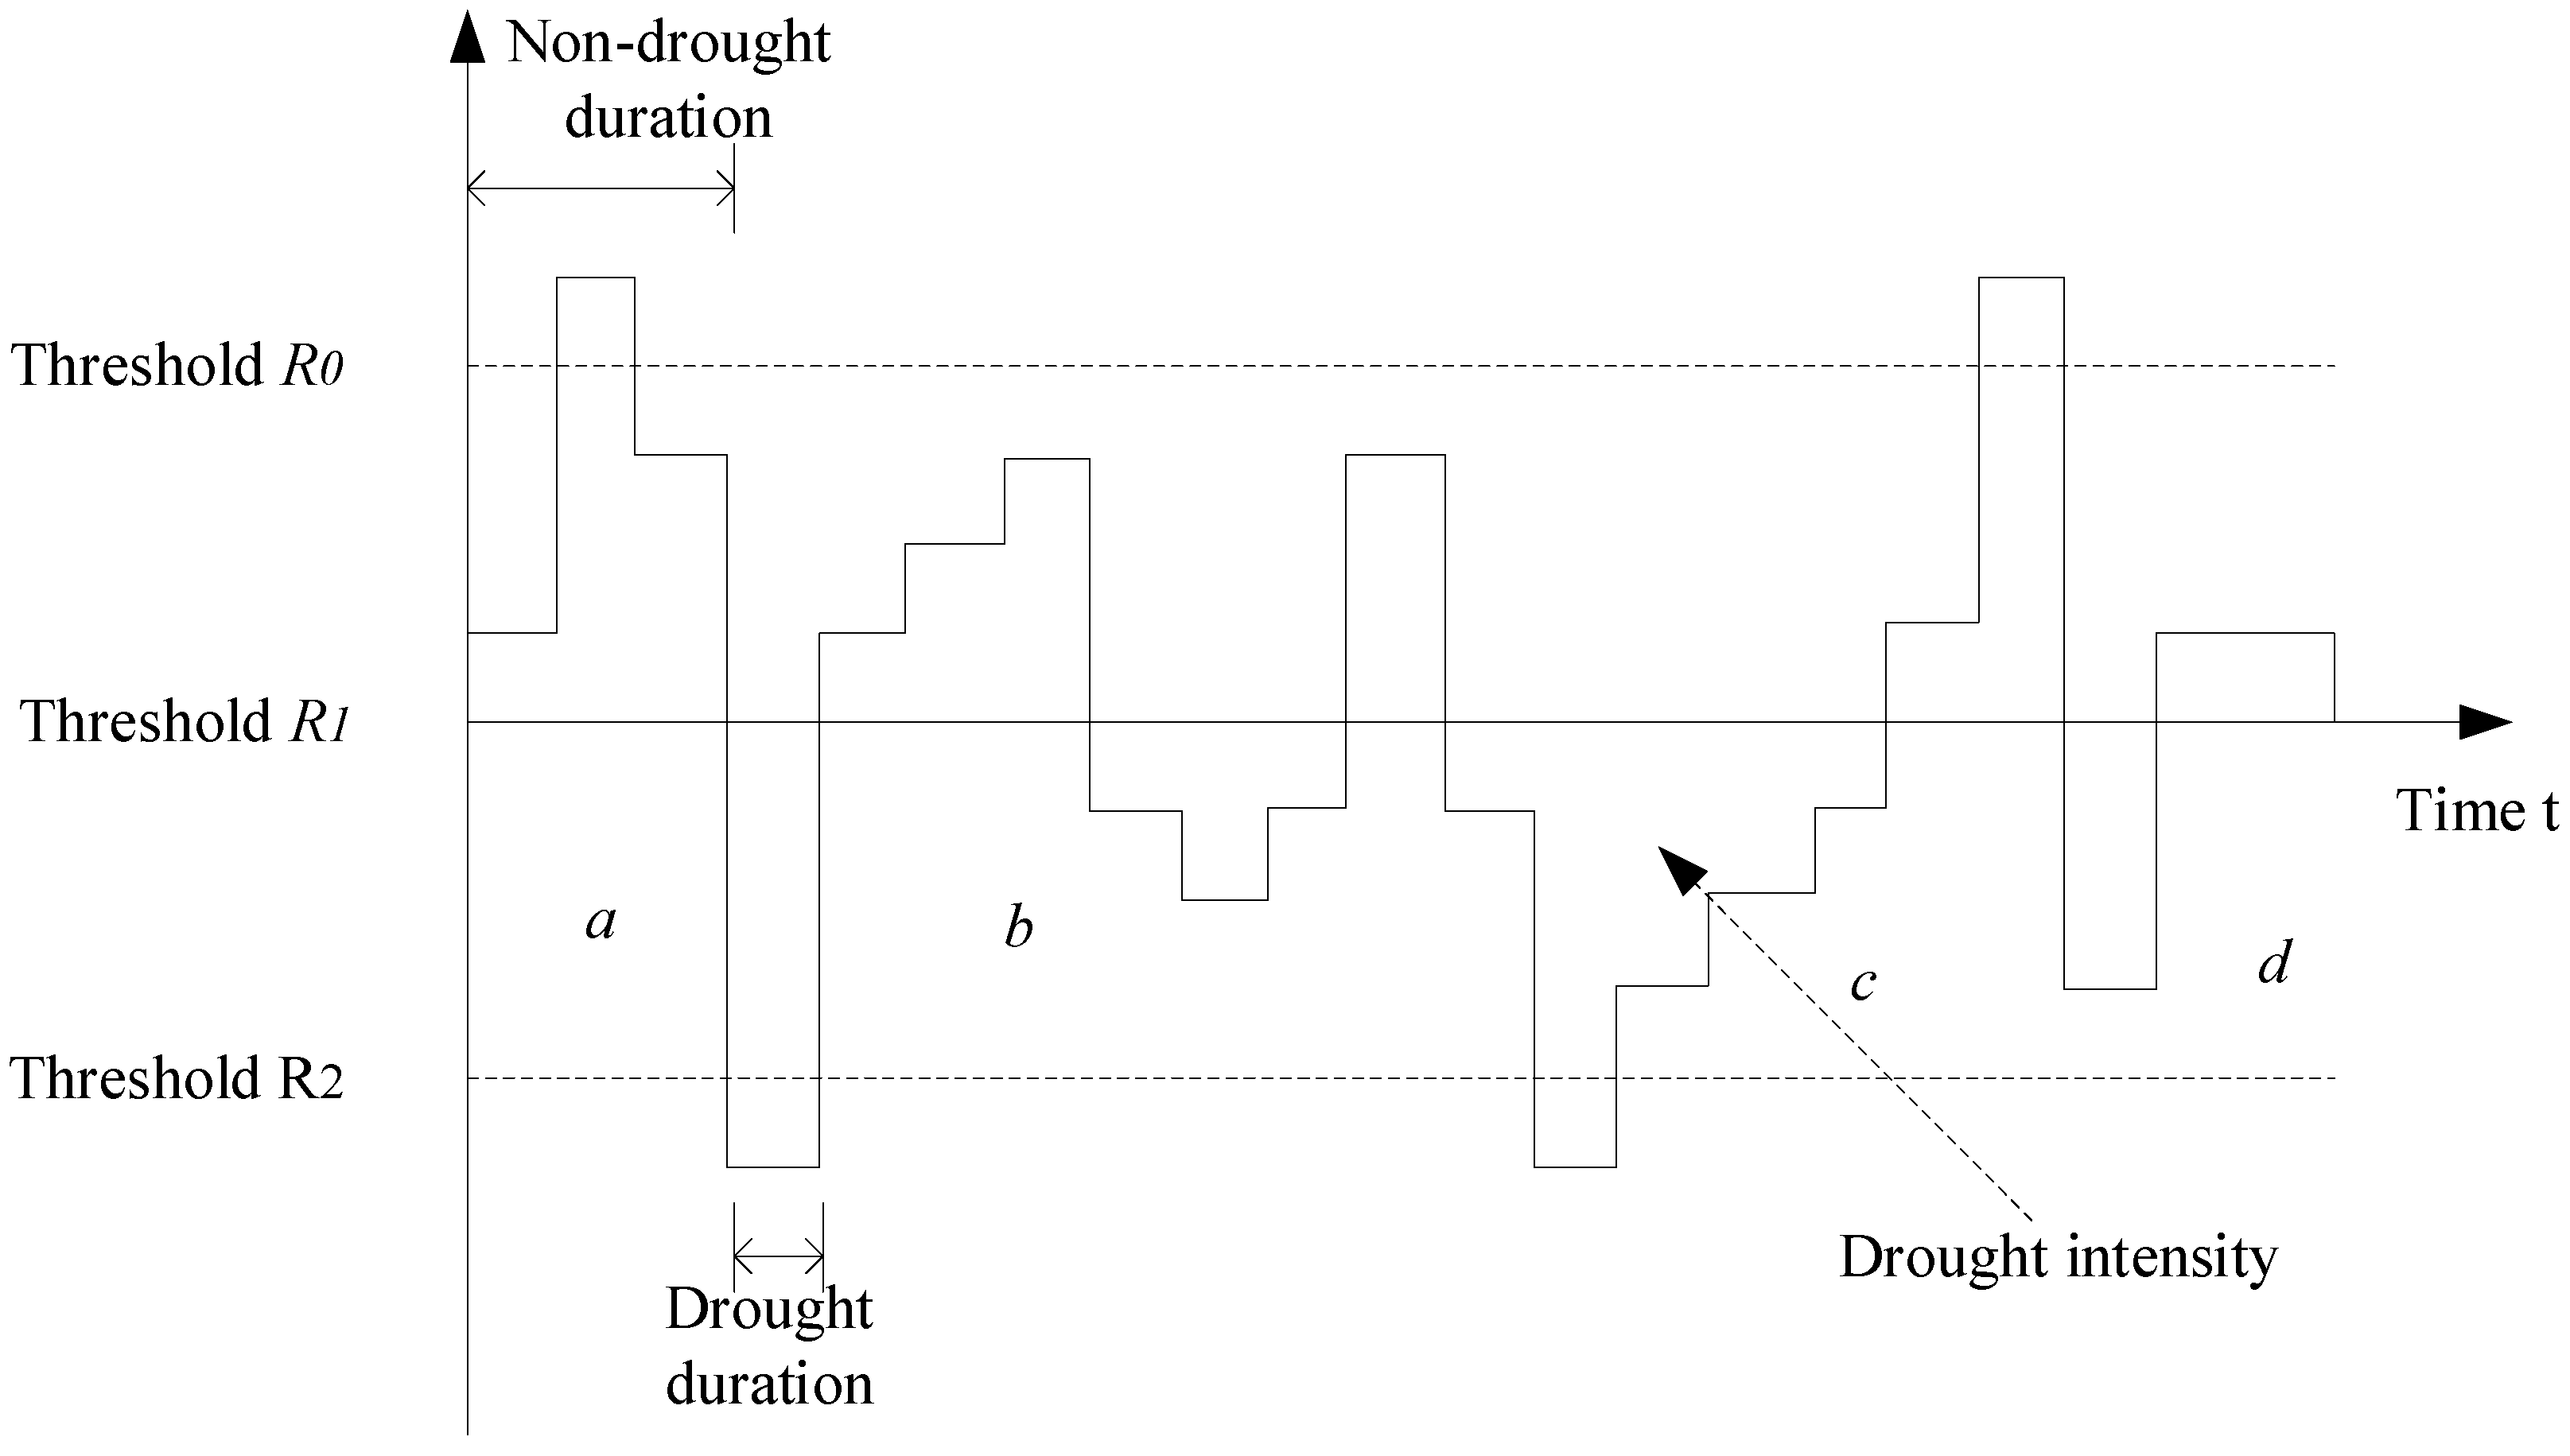
The run analysis theory proposed by Hirsch is currently the most widely used method for identifying drought processes based on the monthly scale drought index [32]; the process when the percentage of monthly rainfall anomalies at a meteorological station meets a drought index is shown in Figure 3.
First, the drought index thresholds R0, R1 and R2 are set, and it is preliminarily judged that the month represents drought (drought process a, b, c and d) when the index value is less than R1. Second, for a drought that lasts only 1 unit period (such as a and d), this month is determined to represent a drought process if its drought index is less than R2 (such as a), and vice versa (such as d). Moreover, for two adjacent drought processes (such as b and c) with an interval of 1 unit, it can be regarded as one drought process if the drought index of the interval is less than R0, and vice versa. In general, there are two drought processes in Figure 3, namely a and b + c.
In this study, run analysis theory and moving average methods were chosen for identifying drought events and determining drought intensity, and the difference analysis was mainly completed using run analysis theory. In general, the difference will occur when the runoff is lower than the set threshold. Moreover, it starts below the threshold and ends above the threshold. Although the threshold is generally fixed, to better match the apparent seasonally of the runoff in the Zhangweinan Canal Basin in this study, the selected threshold was based on 80% of the monthly runoff and the average moving forward in 30-day steps. Eventually, independent hydrological drought events were formed, enabling each individual hydrological drought event to be calculated. In addition, to eliminate minor events, events with durations of no more than 15 days were not analyzed for differences.
2.2.4. Data Collection and Processing
The SWAT model is based on physical mechanisms and required spatial data such as watershed digital elevation, soil type map, land use map and river network data. In addition, the model calculations also require information from meteorological stations such as rainfall, temperature, wind speed, relative humidity and solar radiation. As the Zhangweinan Canal Basin spans four provinces and one city, the water use relationship in the basin is very complicated. Therefore, a large number of investigations are needed on reservoirs, irrigation areas and water withdrawal for the model to more accurately reflect the actual situation of the river basin. This study summarized the various data items and data sources required for the SWAT model. Although human activities have become more frequent in the past 20 years, data from this period is not available; the research period of this study is therefore from 1950 to 2004 (Table 1).
2.2.5. Statistical Evaluation
In this study, model performance was evaluated based on three statistical coefficients: (i) Nash-Sutcliffe efficiency coefficient, ENS [33]; (ii) relative error, Re; (iii) the decision coefficient, R2:
where and are the observed and predicted values, and are the averages of the observed and predicted values, and n is the number of observed data. The best simulation results were achieved when . If is negative, the reliability of the simulated average value is lower than that of the observed average value. When is 0, the simulation result is consistent with the observed value. Finally, if is positive or negative, the predicted and simulated values are too large or small, respectively. Parameter R2 is used to evaluate the coincidence degree between the simulated and observed values; a smaller R2 indicates a worse coincidence degree between the observed and simulated values.
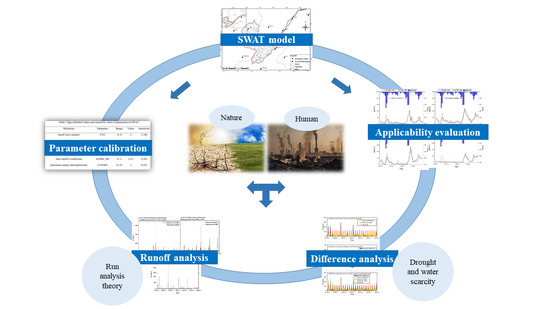
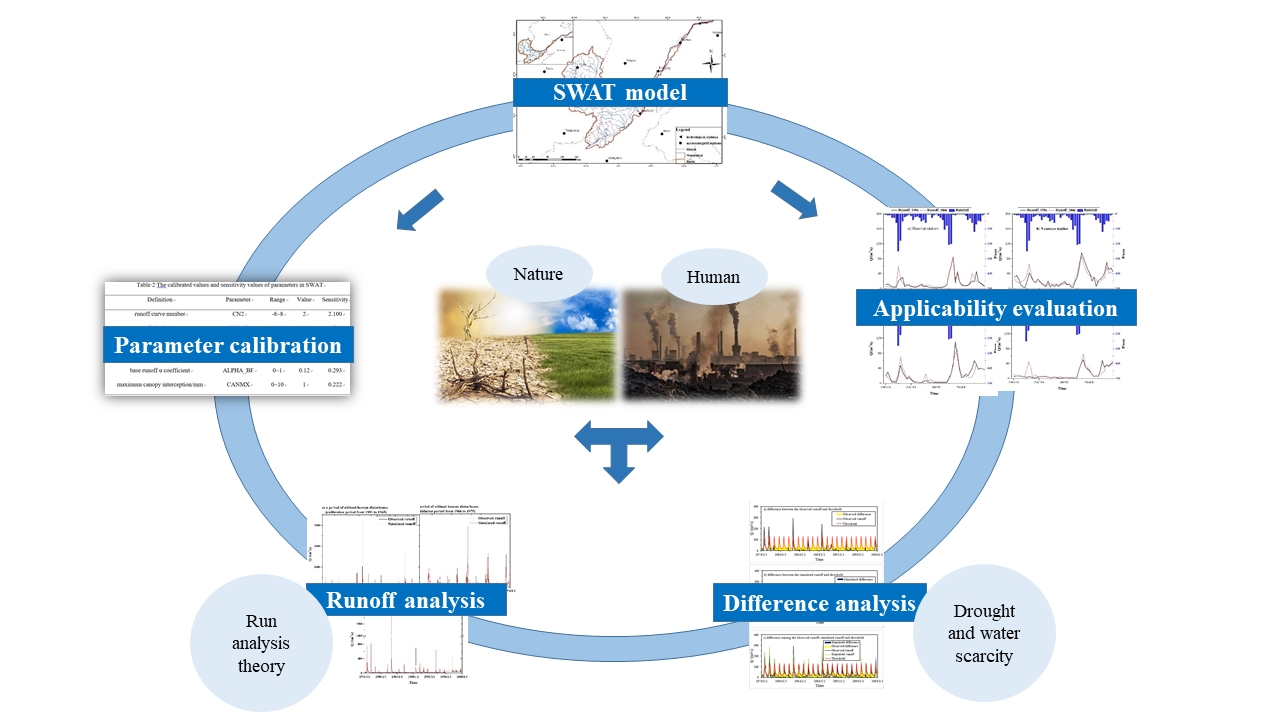
2.2.6. Technology Roadmap
To quantitatively distinguish the effects of natural factors (drought) and human factors (water scarcity) on hydrological systems, a model-based simulation framework was proposed. This framework mainly includes the construction of the SWAT model, the determination of the period without human disturbance, and comparative analysis of drought and water scarcity (Figure 4).
3. Results and Analysis
3.1. Sensitivity Analysis and Calibration of SWAT Model Parameters
The sensitivity analysis of the parameters can be efficiently modeled to further understand the key factors affecting the hydrological processes in the basin. In this study, the model parameters were calibrated and validated, which made the simulated and observed values coincide well. According to the SWAT model mechanism mentioned above, 28 parameters that affected the runoff process were compared and judged by the SWAT automatic sensitivity analysis tool. The six parameters with the highest sensitivity to runoff were determined and calibrated (Table 2), i.e.,: runoff curve number, soil depth, soil available water, soil evaporation compensation coefficient, base runoff α coefficient and the maximum canopy interception.
3.2. SWAT Model Applicability Evaluation
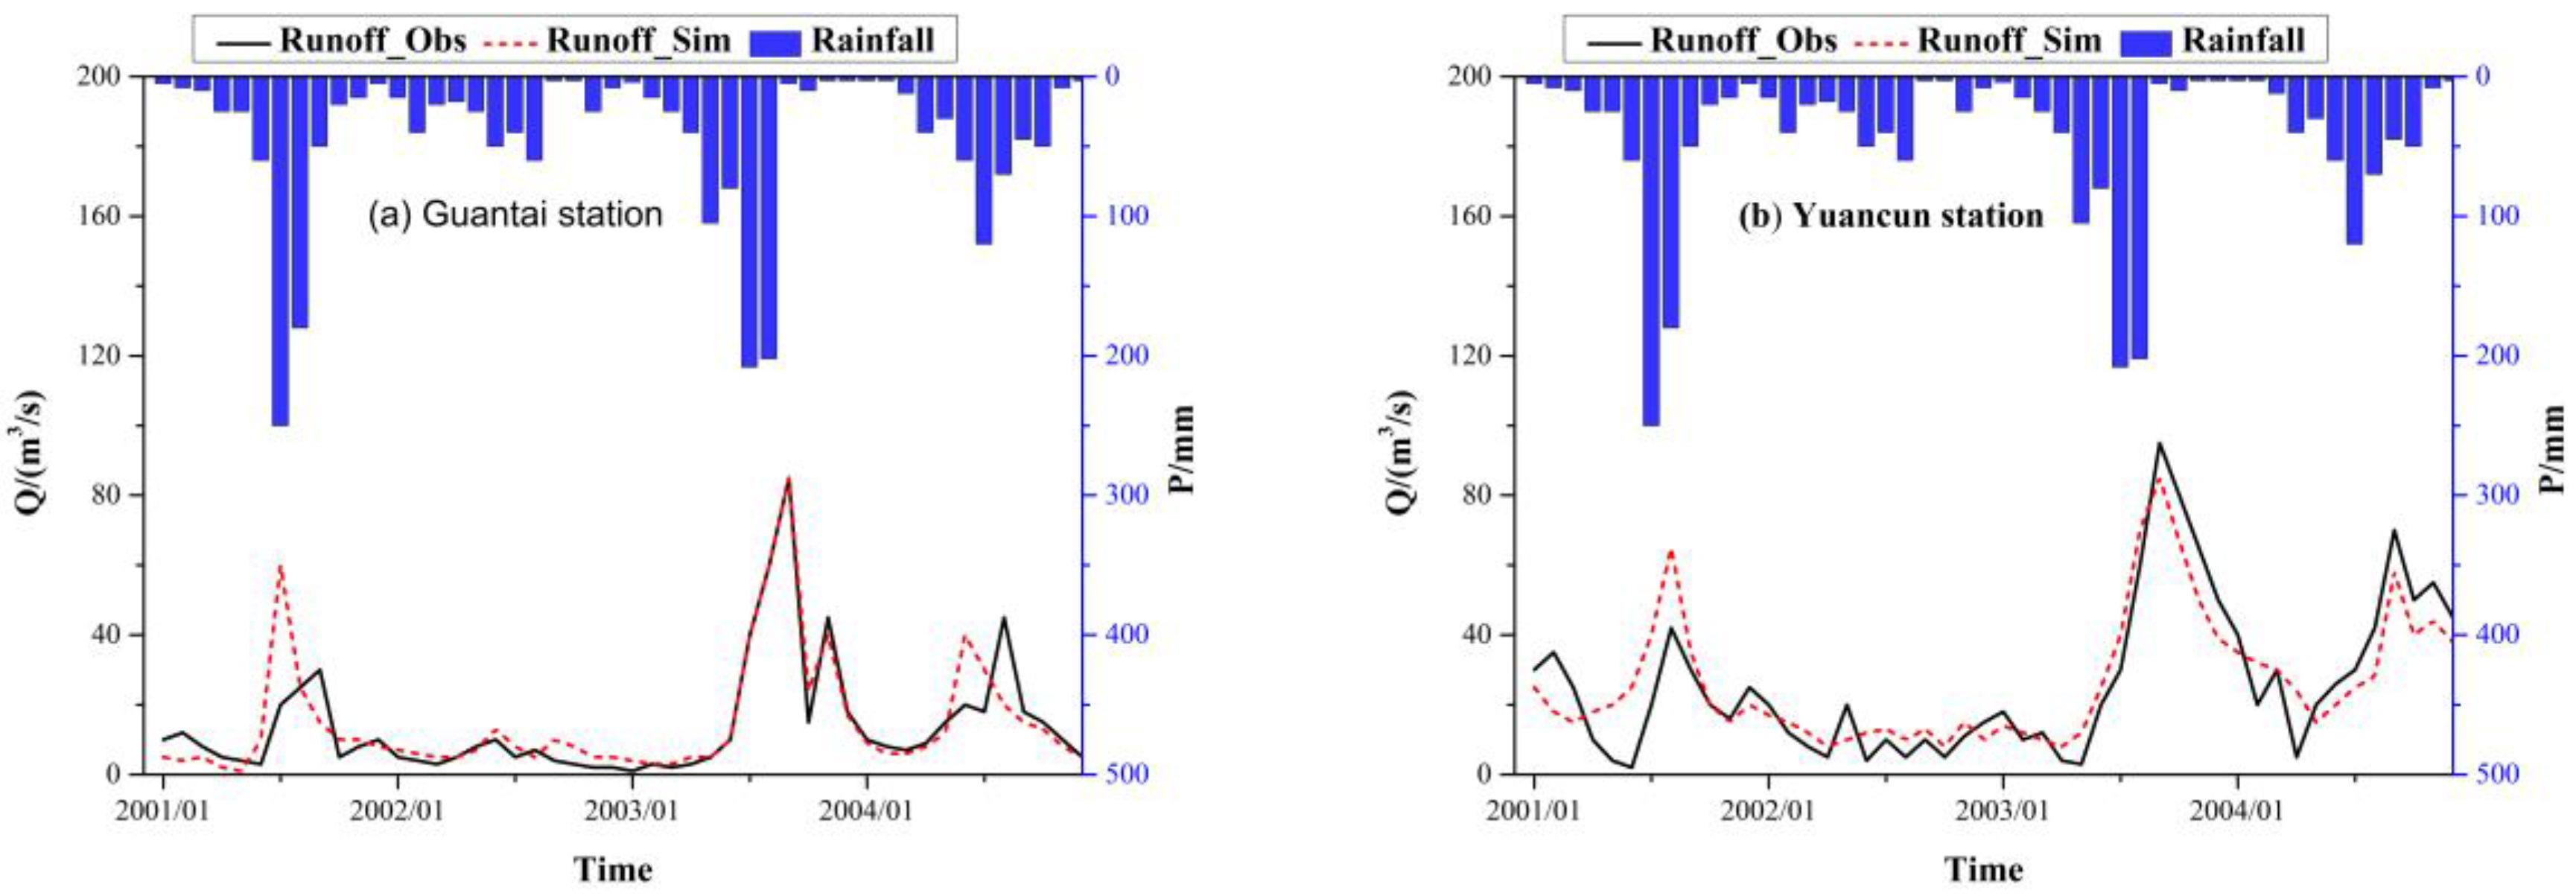
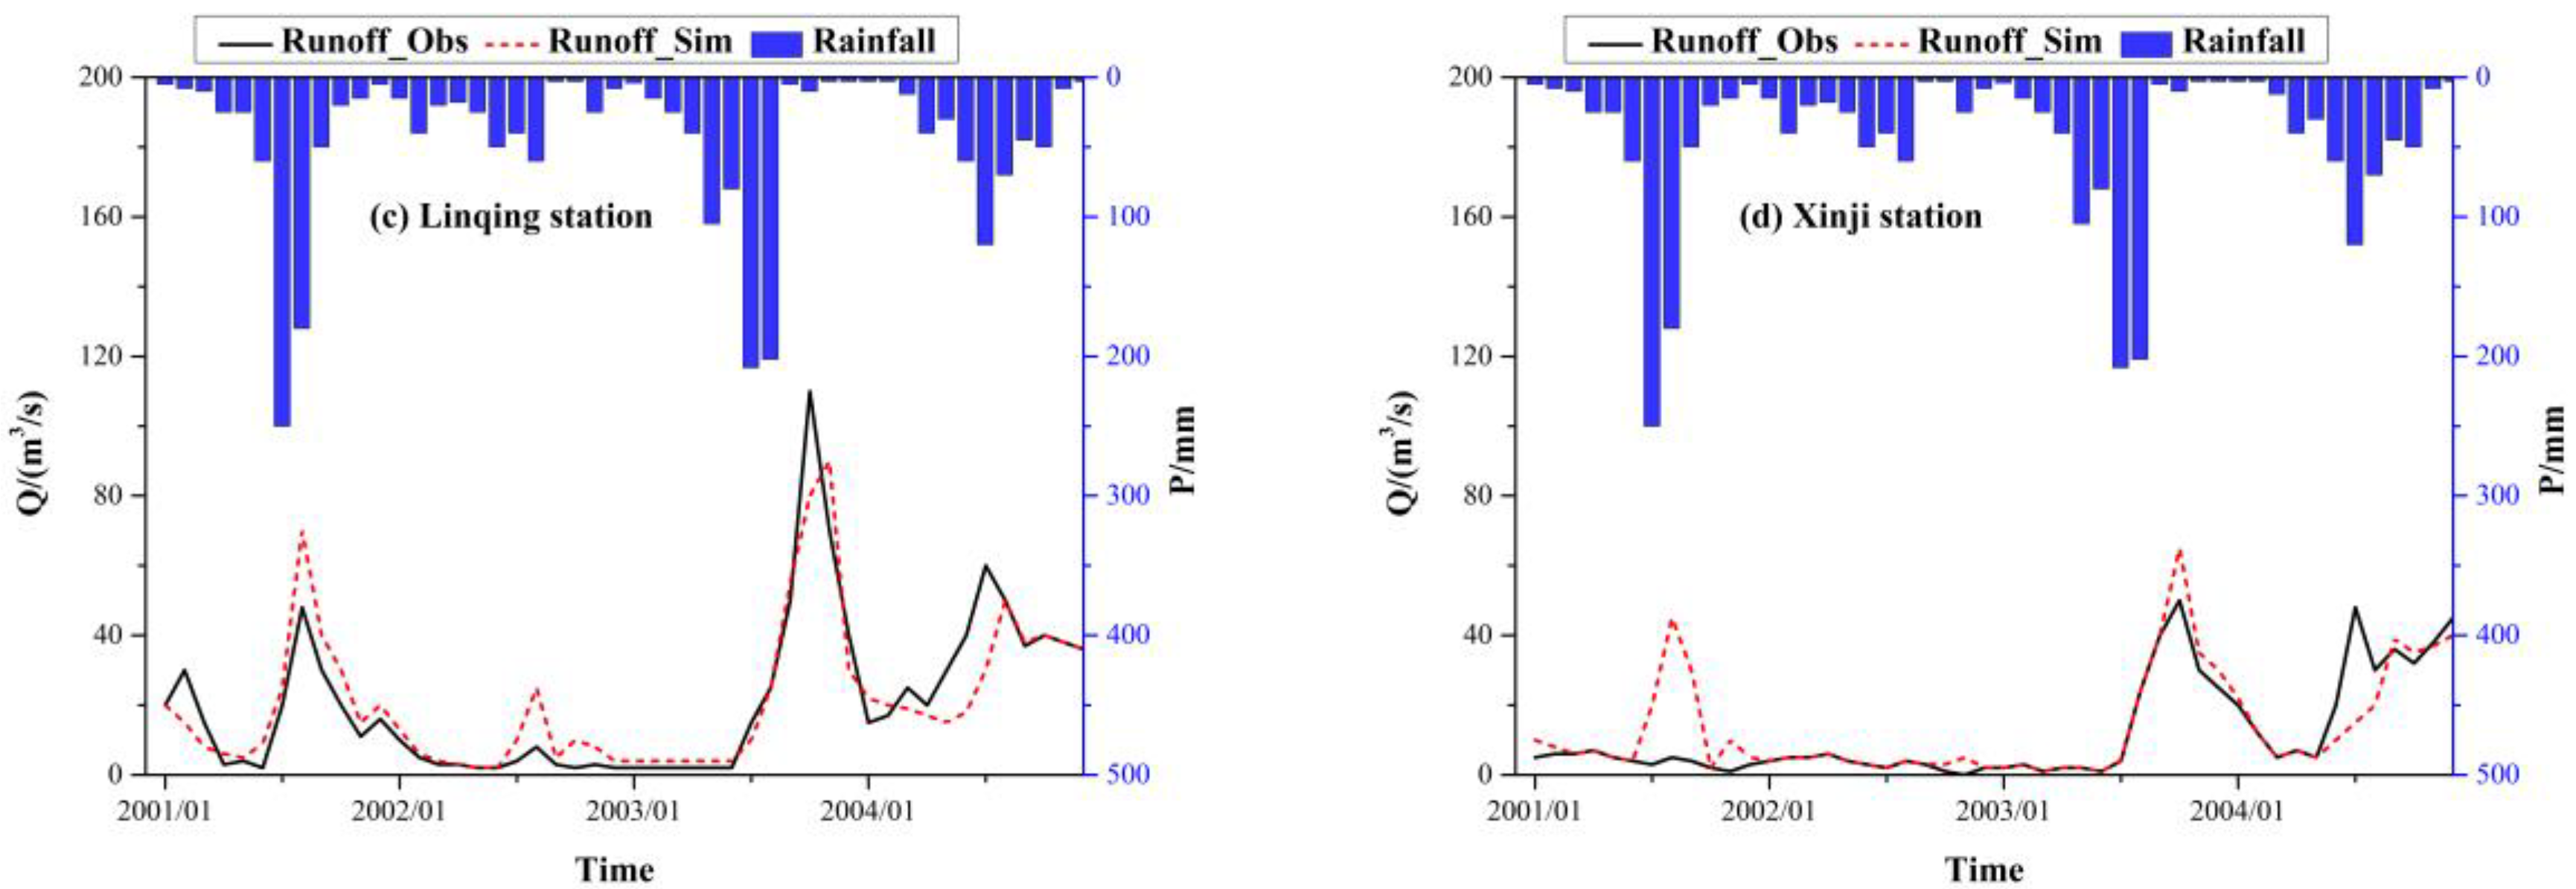
The simulation effect of the SWAT model needed to be evaluated after the parameters were determined and calibrated. For this study, four representative hydrological stations in the Zhangweinan Canal Basin were selected for runoff simulation, i.e., the Guantai, Yuncun, Linqing and Xinji stations. The runoff process period was from 2001 to 2004, and the calibration period was from 2001 to 2003, whereas the verification period was 2004 (Figure 5). Generally, the trends of runoff variation at the hydrological stations were basically the same. Most of the months matched well, although some matched relatively poorly. In particular, Xinji station, which was close to the estuary, had no flood peak because of river flow interruption. However, the flood peak appeared in the simulation results, indicating that human activities had a greater effect and changed the natural runoff dramatically.
The Nash-Sutcliffe efficiency coefficients (ENS) of Linqing station, Guantai station, Yuancun station and Xinji station in the calibration period were 0.73, 0.79, 0.71, and 0.75, respectively, whereas they were 0.66, 0.74, 0.61, and 0.63 in the verification period, respectively. The ENS values were greater than 0.7 in the calibration period, indicating that the simulation results were satisfactory, whereas the ENS values were relatively poor during the verification period. There may be two reasons for this result. One was that human activities were frequent, and the other was that urbanization development greatly disturbed the underlying surface. Taking the Guantai station as an example (Table 3), the decision coefficient between the observed and simulated monthly runoff during the calibration and verification period were both more than 0.7, and the multiyear average relative error was less than 30%, which indicated that the simulation results were good. In general, the runoff simulation results based on the SWAT model were acceptable. Furthermore, the model was capable of simulating the “naturalized” runoff process during the period of human disturbance.
3.3. Comparative Analysis of Runoff during Natural Periods and Human Disturbance Periods
Although the core of the model framework proposed in this study was to simulate the hydrological process of naturalization without human disturbance, it was very difficult to find hydrological processes without human activities as the input data of the SWAT model, because the study area has been strongly affected by human activities in the North China Plain. Therefore, the period without human disturbance was determined by (i) identifying abrupt change points in the observed hydrological sequence, i.e., major changes in the hydrological processes; although abrupt change points may not directly reflect the effect of human activities, they could explain their aggravating effect to a certain extent; (ii) inferring the period without human disturbance based on collected data (such as research on historical literature, on-site investigation and network corroboration). Generally speaking, it is possible to objectively and scientifically identify a period without human disturbance according to the analysis of abrupt change points of hydrological sequences and the combination of historical evidence and literature research.
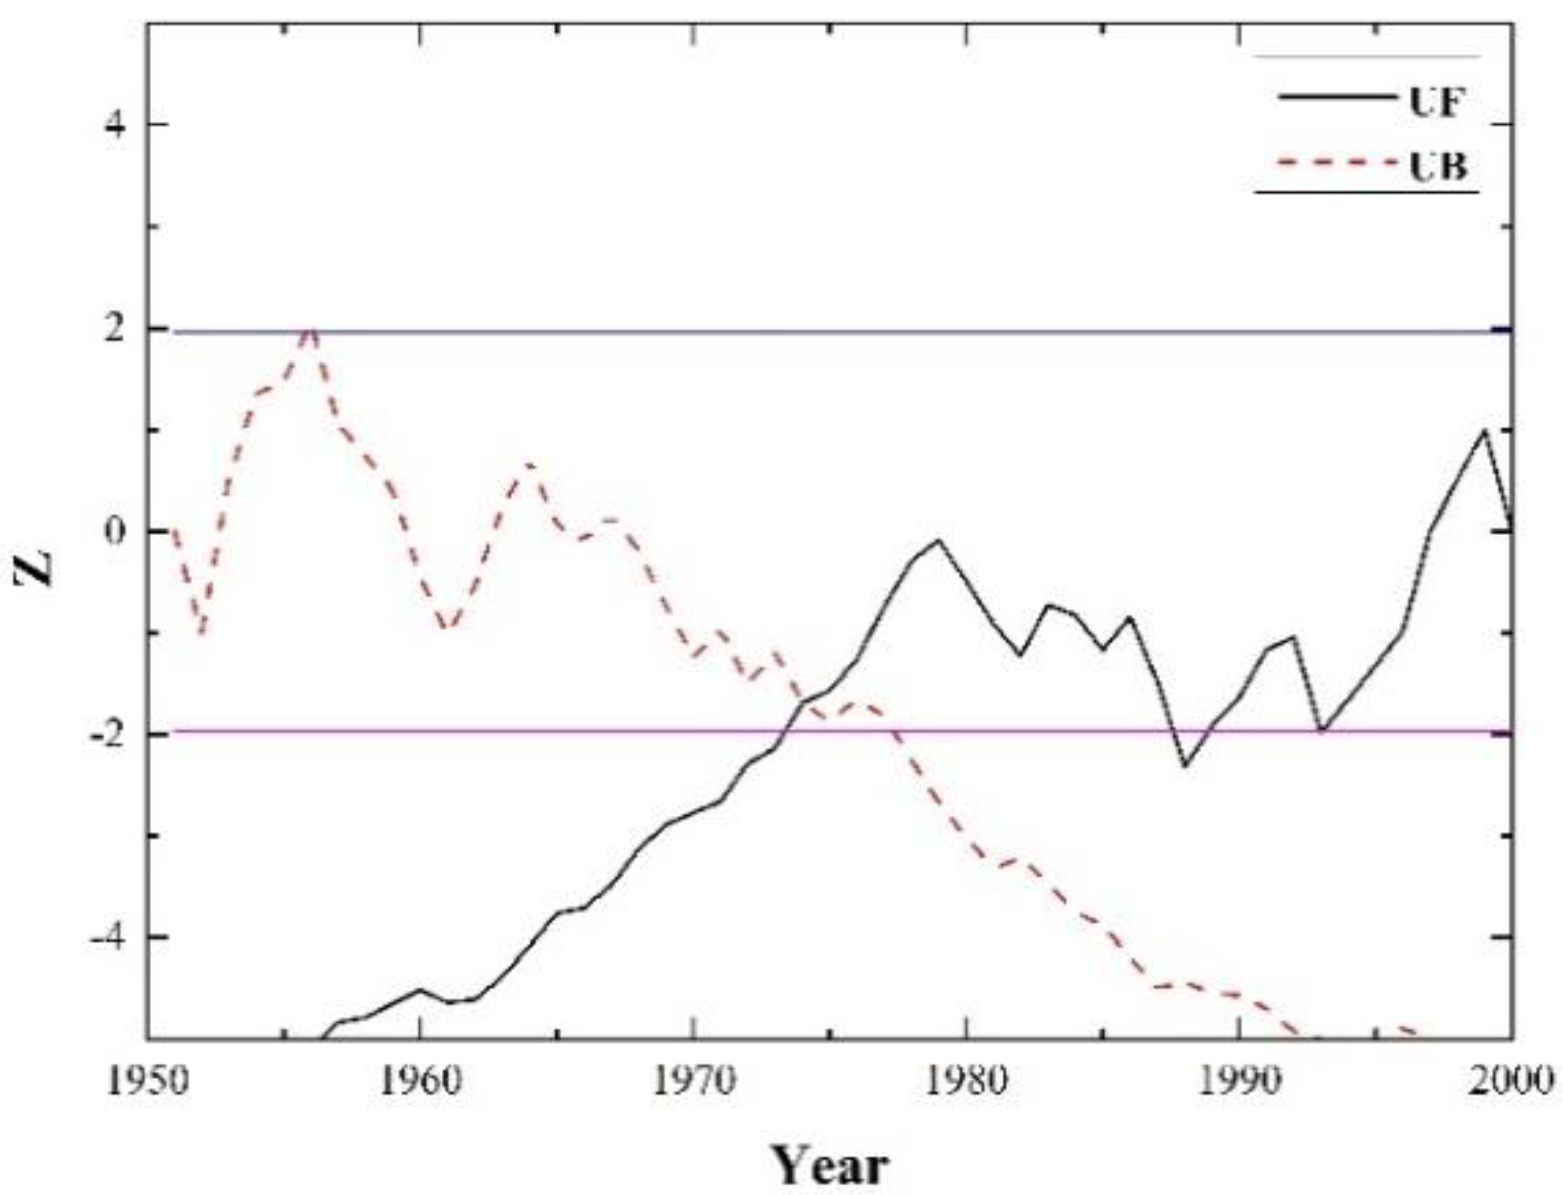
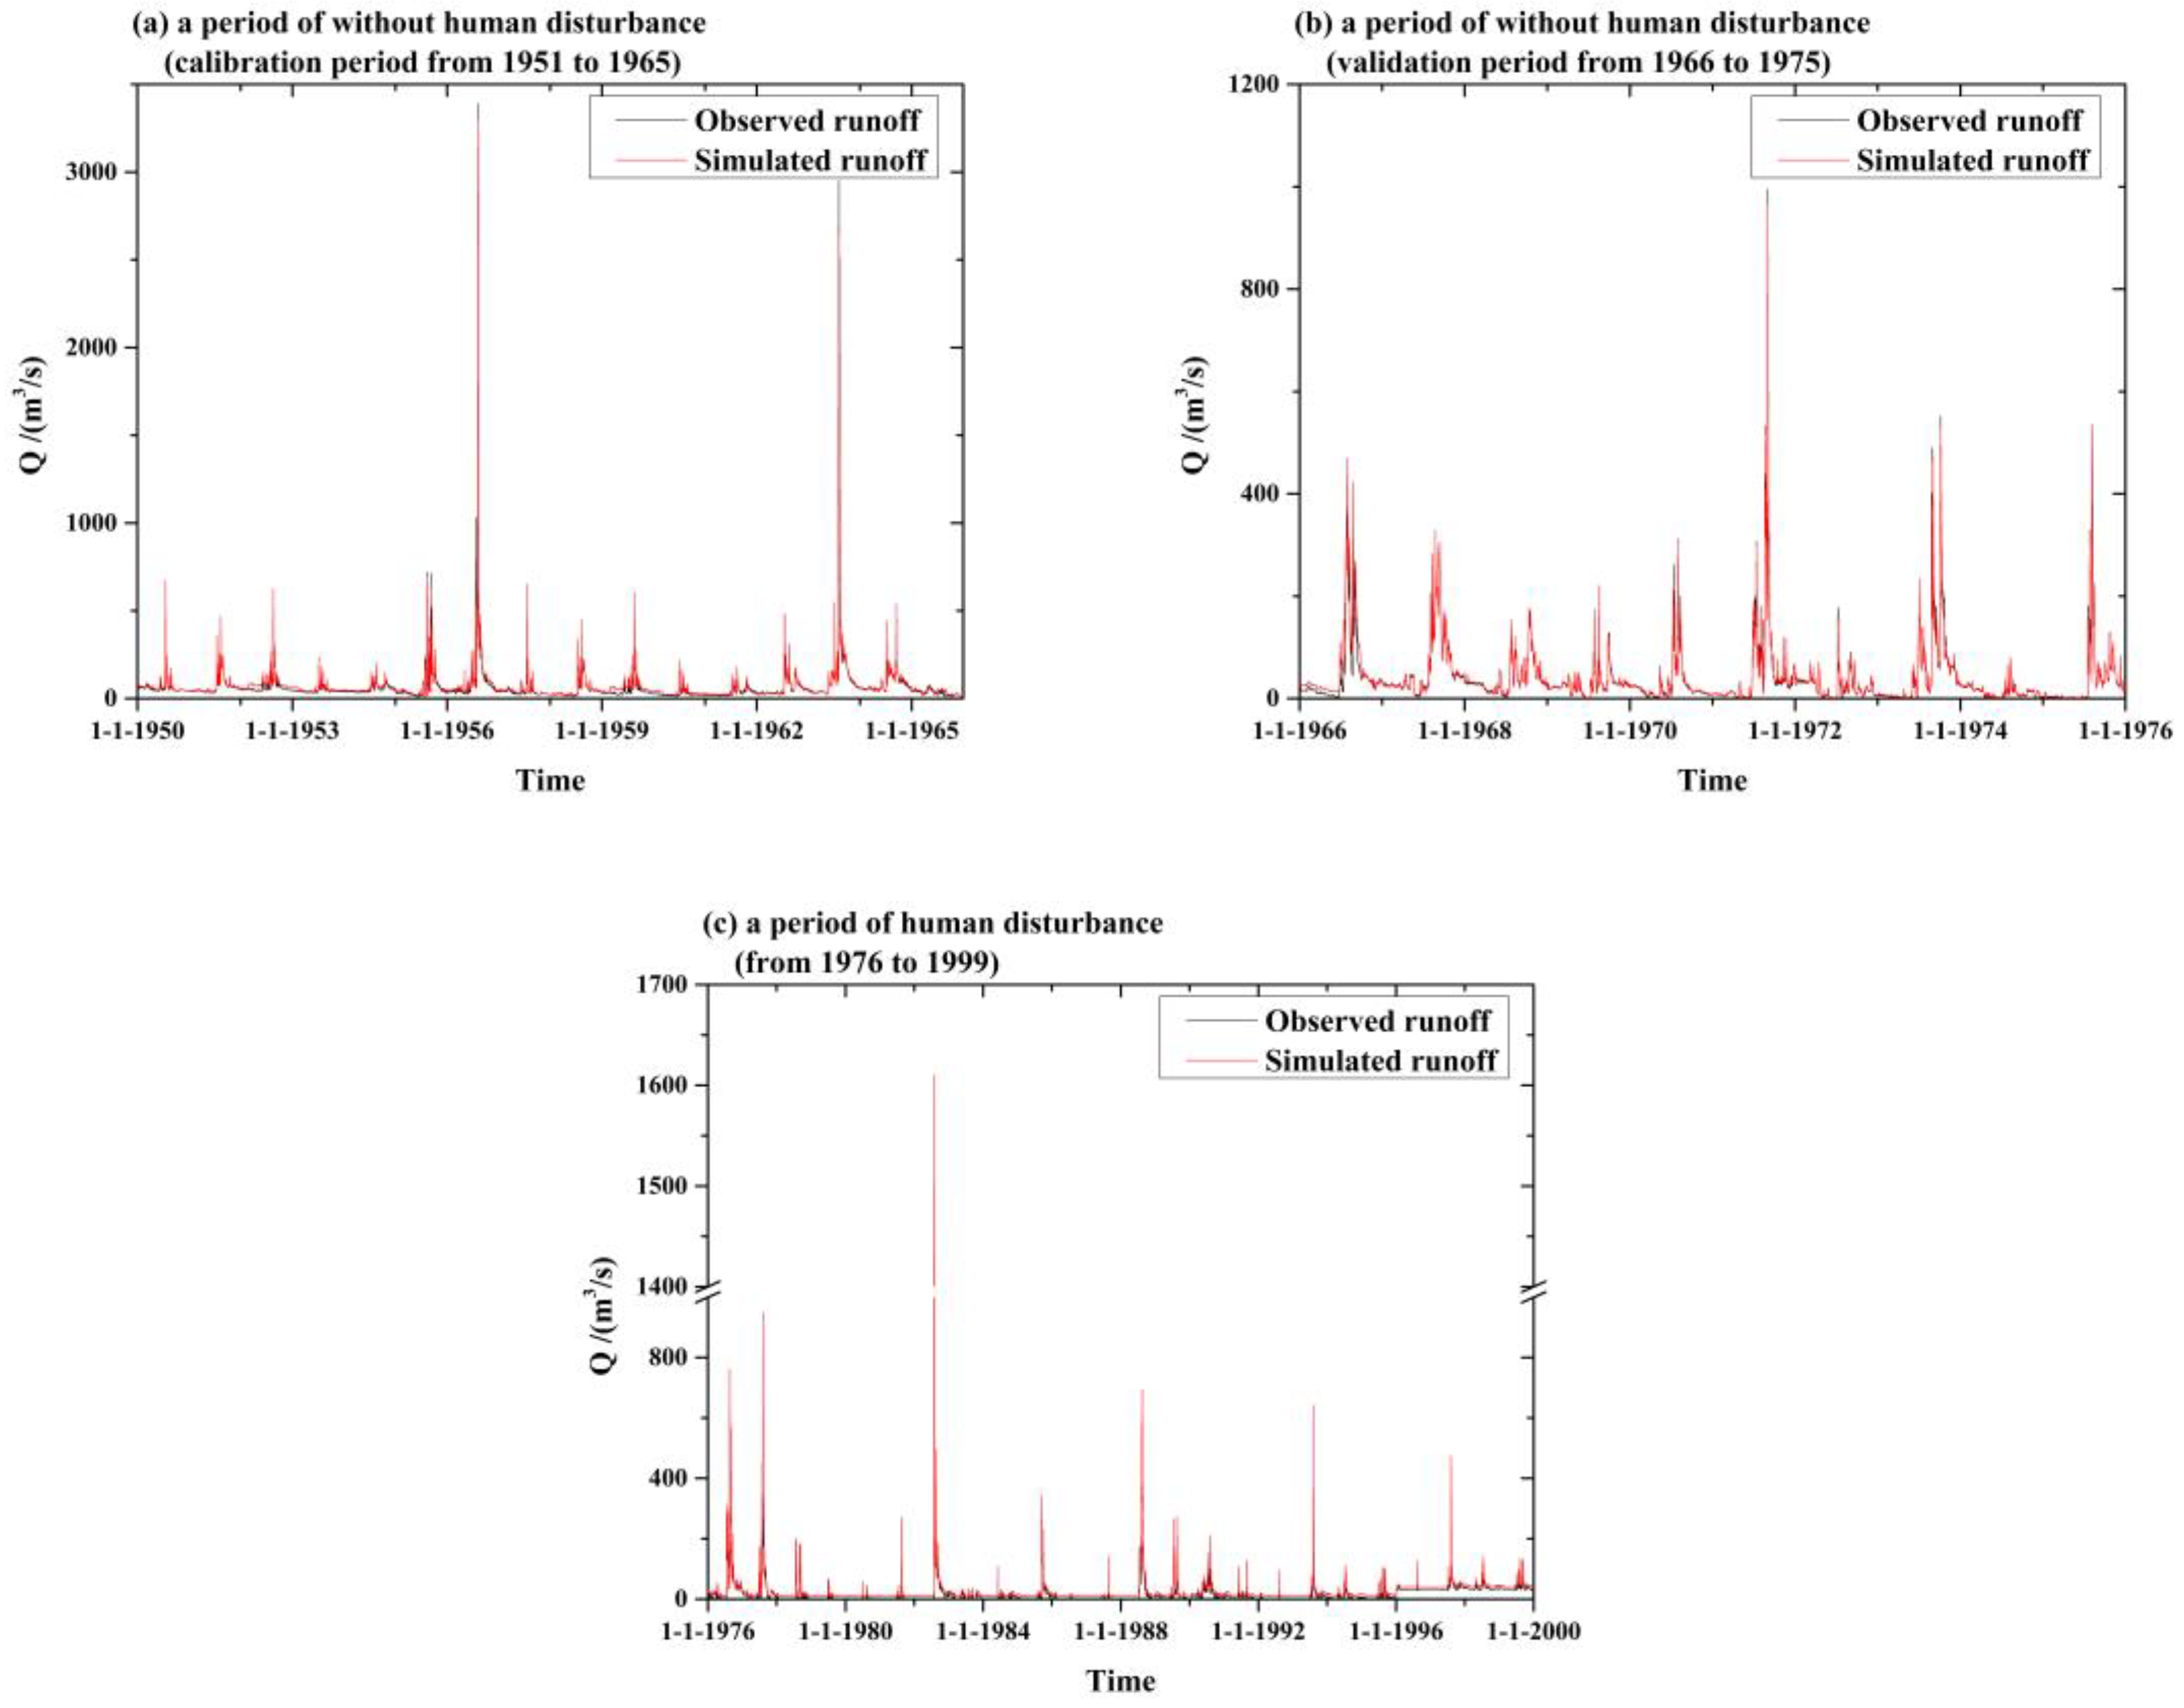
Taking the Guantai Station in the Zhangweinan Canal Basin as an example, this study first calculated the annual average runoff (from 1951 to 2000), and then identified the abrupt change point according to the Mann-Kendall method. As depicted in Figure 6, the abrupt change point was 1975. According to the historical data from around 1975, human activities were relatively weak before that year and frequent thereafter (e.g., water conservancy construction). Therefore, it could be considered that there was a period without human disturbance before 1975. Ultimately, the hydrological sequence was divided into two parts: the calibration period from 1951 to 1965, and the validation period from 1966 to 1975. The simulated and observed sequences were obtained for the period without human disturbance (Figure 7a,b).
Generally, the runoff process had obvious seasonal variations throughout each year, with peak runoff from August to September and low runoff from April to May. There were three periods of wet years, i.e., from 1956 to 1960, from 1963 to 1965 and from 1971 to 1974, and there were three periods of dry years, i.e., from 1953 to 1955, from 1960 to 1963 and from 1974 to 1975. In addition, although the simulated runoff was slightly lower than the observed runoff at the time of peak runoff, it was basically the same in the whole process. Moreover, two major floods occurred in 1956 and 1963, with observed peaks approaching 3500 m3/s and 3000 m3/s respectively. The ENS of the calibration period, the validation period, the period of human disturbance and the whole period were 0.78, 0.66, 0.64 and 0.69 respectively, suggesting that the simulation results were reasonable. In general, it is possible to simulate the natural runoff process without human disturbance.
For the period of human disturbance (from 1976 to 1999), the comparison between simulated and observed runoff is shown in Figure 7c. The simulated runoff could be considered a naturalized scenario, whereas the difference between the simulated and observed runoff could be seen as being due to human activity. Although the simulated runoff was basically consistent with the observed runoff from 1976 to 1977, the observed runoff lacked a flood peak from 1978 onward. Until 1982, both the observed runoff and the simulated peak runoff emerged at the same time because of the occurrence of peak rainfall. However, the observed peak runoff was only a short-lived phenomenon; it then dropped to a state close to 0 m3/s until peak runoff occurred again in 1988. Furthermore, the observed and simulated runoff both dropped to a relatively stable state from 1989. There were three periods of observed runoff with a steady low state of almost 50 m3/s: from 1978 to 1981, from 1983 to 1987 and from 1989 to 1995.
3.4. Quantitative Analysis of Drought and Water Scarcity
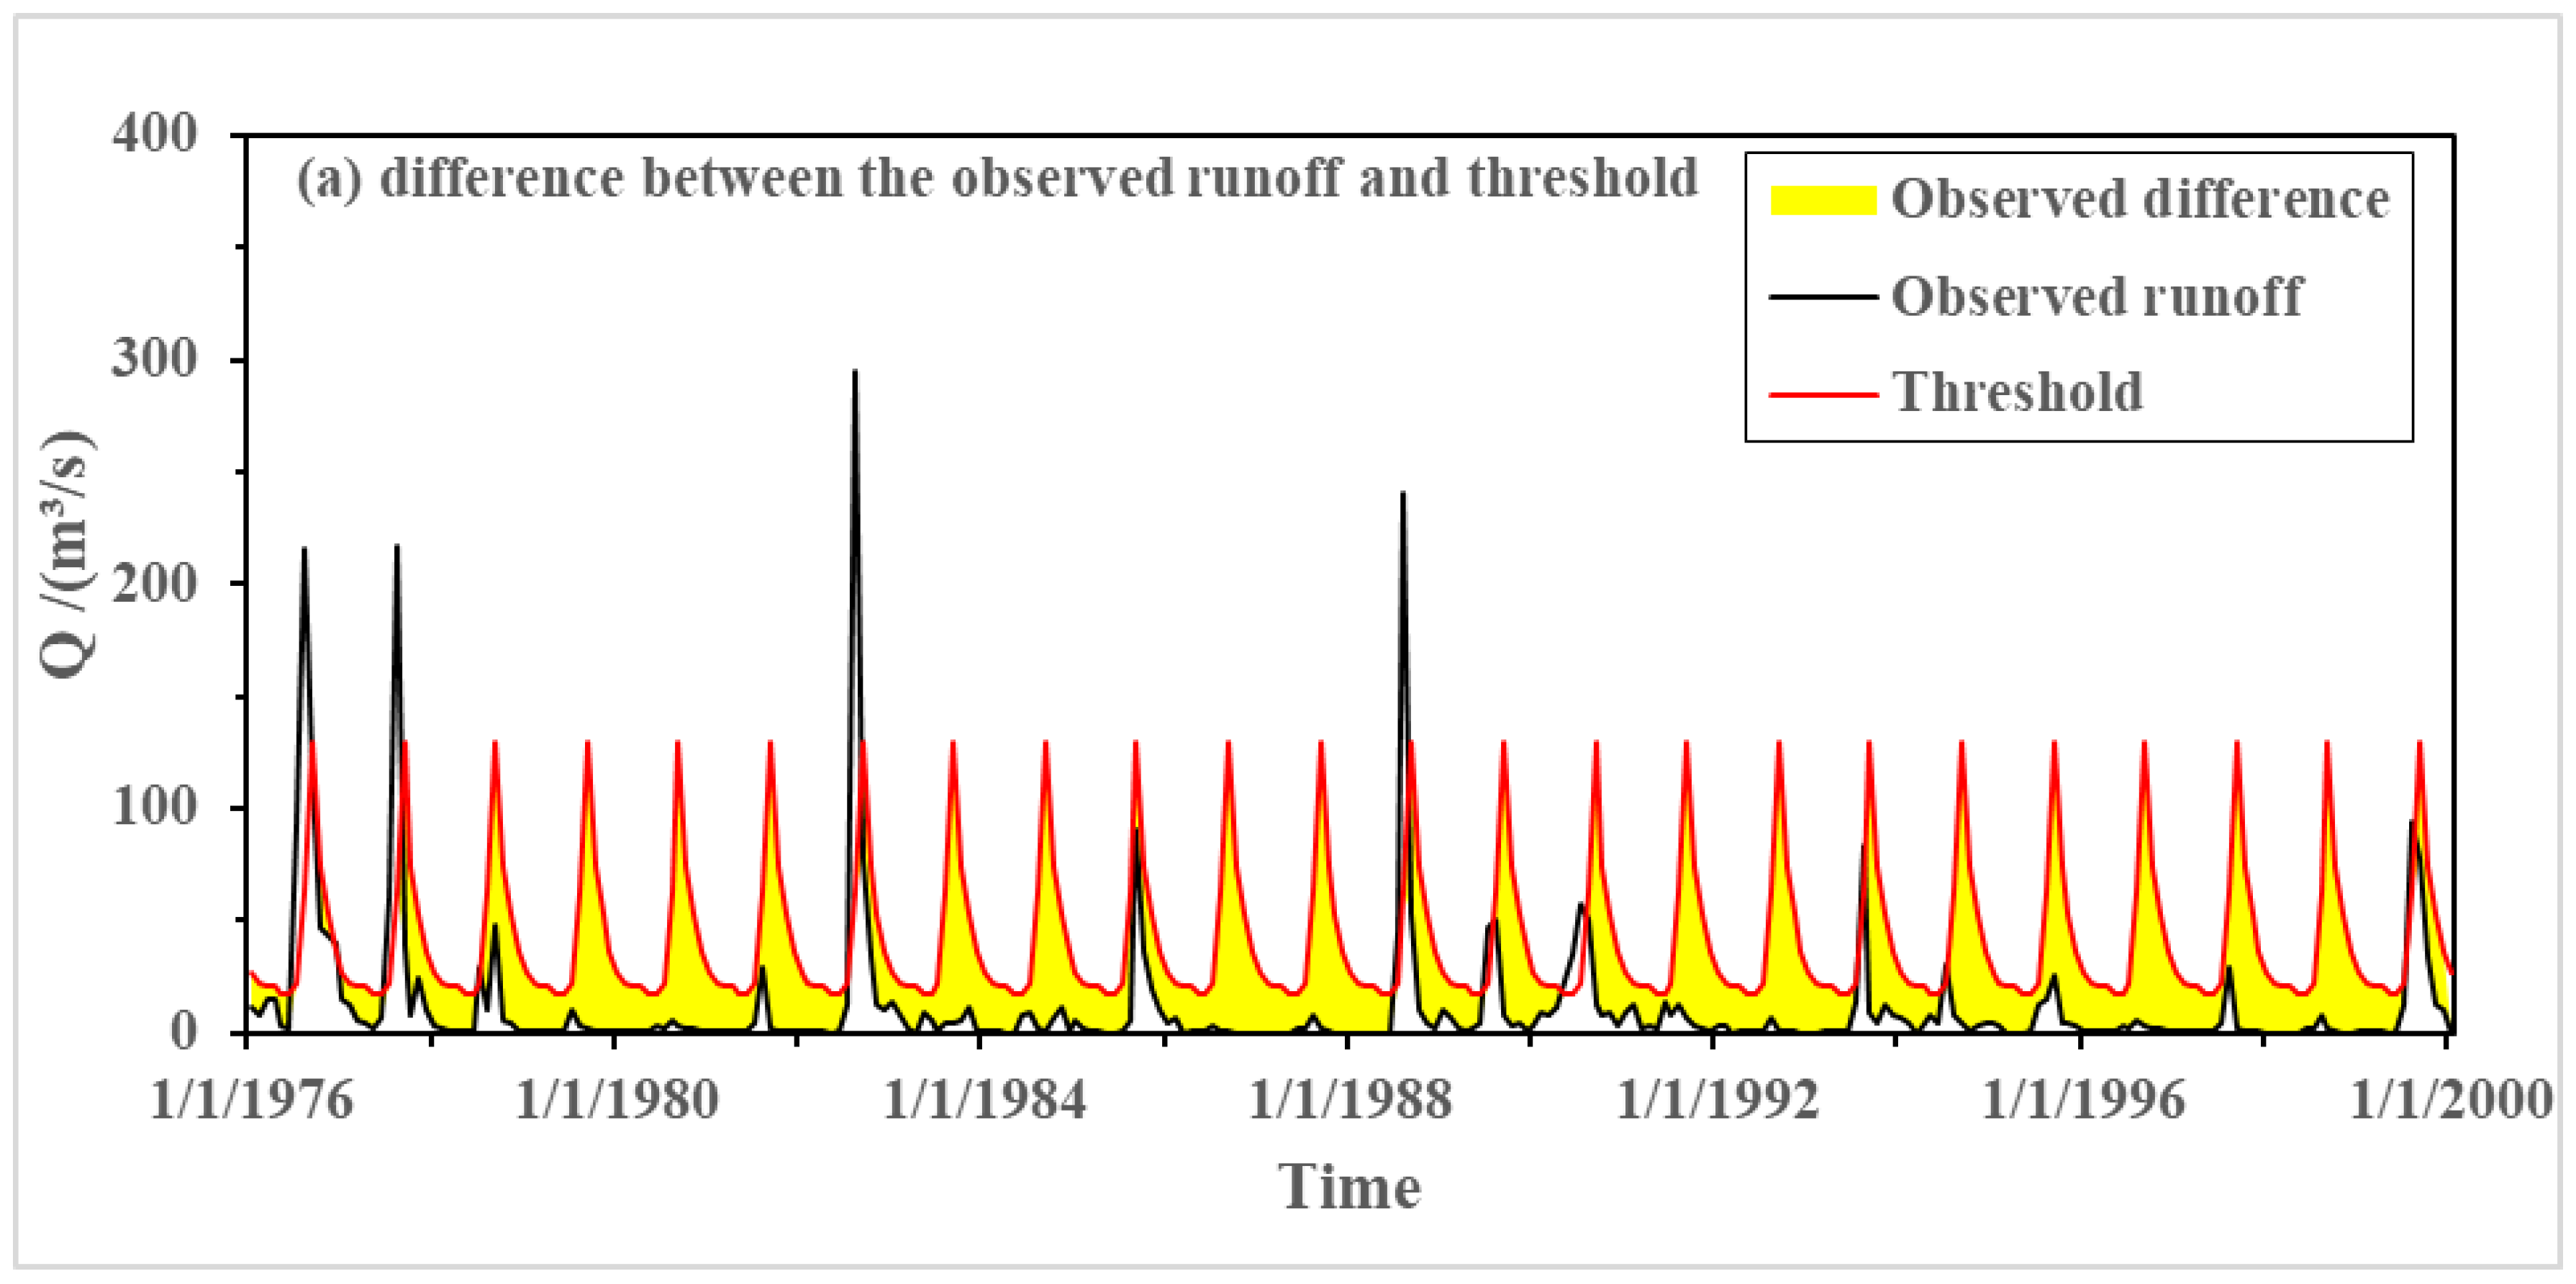
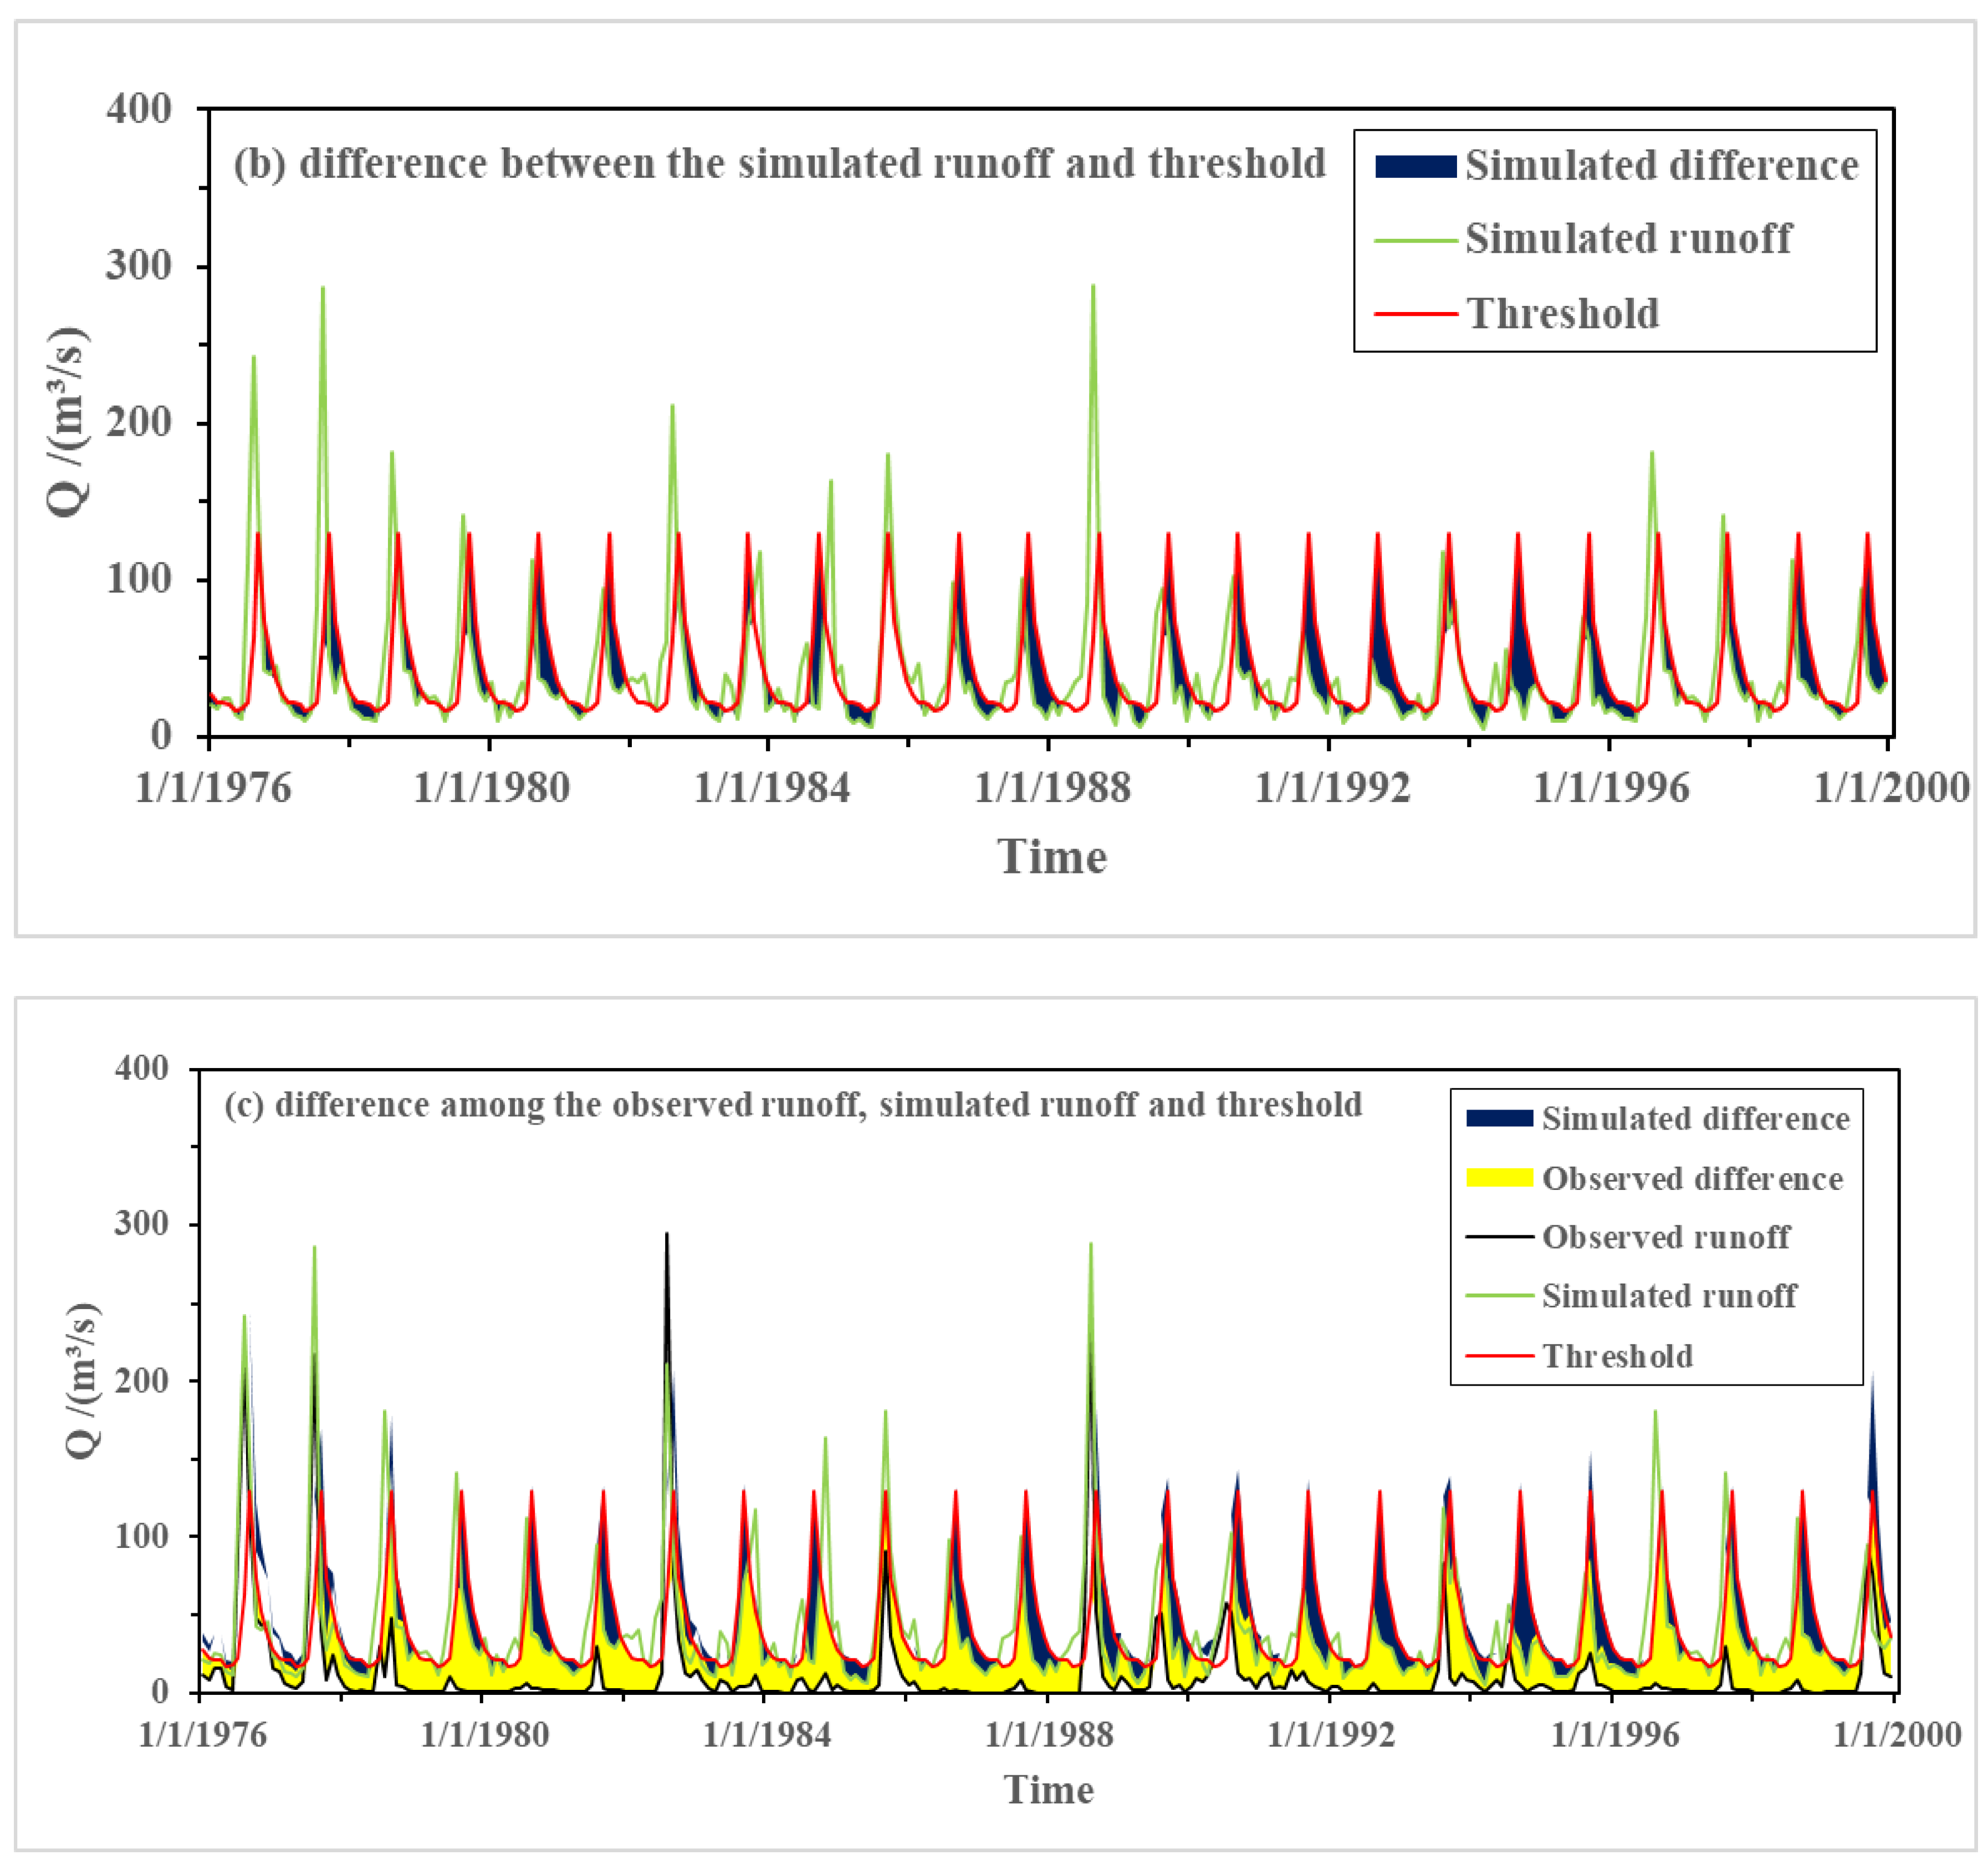
Based on the run analysis theory and the moving average method, the variable threshold was obtained. To better assess the relationship between drought (natural factors) and water scarcity (human factors), this study again simulated runoff without human disturbance (Figure 8).
The yellow shaded area depicted in Figure 8a represents several serious water deficit events (with coexistence of nature and human factors), i.e., from 1977 to 1982, from 1983 to 1988 and from 1989 to 1995. The longest duration was from 1989 to 1995, which lasted for 6 years (70 months). In Figure 8b, the blue shaded area indicates a natural effect event (drought), which is characterized by multiple occurrences and short spans, with the longest period being only 15 months. Moreover, some dry years did not appear in the simulated naturalization scenarios from 1978 to 1979, from 1985 to 1986 and from 1993 to 1999. Additionally, the runoff flood peak in the wet years could not reduce the water deficit caused by natural factors (e.g., from 1988 to 1989).
In general, the water deficit state caused by natural factors (i.e., drought event; blue shaded areas) was much smaller than that caused by human factors, (i.e., water scarcity event; yellow shaded areas) (Figure 8c). In fact, most drought events occurred in the spring and winter seasons after the flood peak (October to May of the following year). Water scarcity caused by human factors (yellow shaded area) led to the disappearance of summer runoff peak flooding, even in wet years (e.g., from 1983 to 1984).
To quantify the effects of natural and human factors on the hydrological system, some quantitative parameters were obtained for this study (Table 4). In the Zhangweinan Canal Basin, although the actual occurrence of water deficit events (coexistence of natural and human factors) comprised 1/3 of natural water deficit events (drought), the average duration was five times greater. Specifically, the maximum duration of actual water deficit events reached six years, while the natural water deficit event lasted less than two years.
There was also a huge gap in terms of the threshold comparison. The average loss runoff of natural water deficit events was 2.60 × 10⁸ m3, whereas that of actual water deficit events was 1.881 × 10⁹ m3. For the maximum threshold deviation, the runoff loss due to water deficit caused by natural factors was 1.28 × 10⁹ m3, whereas that due to water deficit caused by human factors was 5.20 × 10⁹ m3. Specifically, the human factor was four times greater than the contribution of natural factors to the water deficit. Based on the strong disturbance of human activities in the Zhangweinan Canal Basin, it was further revealed that human activities were the dominant factor affecting the changes of the hydrological system. The amount of runoff loss caused by the human factor was four times greater than the loss of runoff caused by natural factors.
4. Discussion
4.1. The Definition of “Drought” and “Water Scarcity”
In the existing literature, the terms “drought” and “water scarcity” are not used consistently. For the former, there are two main types of definitions: conceptual and operational. The operational definition is primarily used to describe the onset, end and severity of a drought. In this respect, a definition that applies to all aspects does not exist. Therefore, policy makers and resource planners generally use drought index thresholds to determine the moments at which a drought begins and ends [34,35]. However, we do not agree with this concept, because the definition has become less clear. Conceptual definitions are expressed in general terms to describe the concept of drought. This is consistent with Estrela, who pointed out that droughts are natural disasters caused by an expected or normal lack of rainfall, but contrasts with the European Community (EC) definition, i.e., that a drought is a period of below-normal, natural water availability [35,36].
In general, water scarcity includes all aspects of restricted water availability. According to the definition of the EU (2007), water scarcity is insufficient for water resources to meet long-term average demand. Similarly, Van Loon argued that water scarcity represents human overexploitation, i.e., exceeding the sustainability of water resources [8,36]. In addition, although the terms “water scarcity” and “drought” refer to completely different phenomena, they are used interchangeably in some studies [37,38]. In short, we have clearly defined the terms "drought" and "water scarcity" in this study based upon difference analysis rather than drought analysis.
4.2. Comparative Results of “Drought” and “Water Scarcity”
The direct consequence of “drought” and “water scarcity” is loss, which can be divided into direct and indirect loss. “Drought” and “water scarcity” are different in terms of loss estimates [35]. Agriculture is worst affected by drought, and there are many study related to agricultural production and crops in terms of damage assessment. Direct losses are mainly manifested in the reduction of crop yields and the human and material resources of drought-resistant inputs, whereas indirect economic losses are mainly reflected in the effect on ecosystems [39].
Water scarcity affects not only agriculture, but also other industries. For example, the production, catering and service industries are affected by the ecological environment and water conservancy in the ecosystem. In addition, loss estimates are calculated separately for each type of industry. For example, the production function method is applied in agriculture and the price elasticity method is used in industrial applications [40]. However, it is impossible to fully separate the various industries because of the complexity of the water resources system. Moreover, in calculating the economic losses of water scarcity, it is necessary to incorporate the changes in water resources into the corresponding macromodels [35].
The model-based simulation framework proposed in this study focuses on runoff losses caused by drought and water scarcity; it is concluded that the runoff losses caused by human factors (water scarcity) are four times greater than those of natural factors (drought) in the Zhangweinan Canal Basin, which is consistent with most research on other areas in the past few decades [8,41,42].
4.3. Expansion of the Model in the Study
Although the model-based simulation framework proposed in this study has successfully distinguished the effects of drought and water scarcity in the Zhangweinan Canal Basin, it can also be applied to other notions (e.g., agricultural production and the greenhouse effect) [43]. Comparison 1 is a common method in hydrology, and can be used to investigate other effects (such as river water temperature and land use change) [8]. Comparison 2 quantitatively analyzes the effects of natural factors (drought) and human factors (water scarcity), and is considered a novel approach.
In addition, the SWAT model was selected in this model-based simulation framework because of the abundant basic data (e.g., DEM, land use, soil type, meteorological data, rainfall data, reservoir data, management measures, agricultural irrigation and water withdrawal). If high-quality basic data for all aspects are not available, the model can be adapted using a different model that only needs a few variables (such as the HBV model) [44]. Also, the specific method used for the threshold level can vary, depending on the requirements of the system’s healthy state [8]. In this study, the threshold level is the natural average state based on the SWAT model, that is, the minimum ecological environment water demand and the reservoir dead storage capacity.
4.4. Uncertainties
This study presents a model-based simulation framework that can quantitatively distinguish between natural factors (drought) and human factors (water scarcity) in hydrological systems. However, we should note that some methods related to the framework are not perfect; thus, uncertainties were potentially introduced into our results. The selection period without human disturbance is the focus of this study. This study used a Mann-Kendall test and field surveys to identify abrupt change points, which contain uncertainties to some extent. To improve the rationality and interpretability of abrupt change points in a hydrological sequence, a variety of methods (e.g., the Mann-Kendall test, Pettitt test, Buishand U test, and Standard Normal Homogeneity Test) should be used to explore and verify the hydrological cycle processes (e.g., the physical mechanism, underlying surface and rainfall) [45]. Moreover, the selection of the threshold is crucial. This study only determined the threshold based on the SWAT simulation results, which is not sufficient. Thus, a full-scale assessment of the threshold should be conducted with the actual characteristics of the study area to ensure the applicability of the threshold.
4.5. Correlation Study of “Drought” and “Water Scarcity” in Future Research
Although the nature of drought and water scarcity events is different, these issues have often been overlooked in previous studies. The Copula method is a multivariate joint distribution analysis method based on the Copula function. It can construct its joint distribution function for multivariates satisfying different edge distributions [46,47]. In the study of the relationship between drought and water scarcity, the Copula function not only has good applicability, but also has a certain theoretical and practical significance. Based on this, this study proposes possible future research ideas as follows: (i) establishing empirical distributions of drought indicators and water scarcity indicators in the study area; (ii) dividing different time periods for drought and water scarcity indicators to construct a time-varying Copula function; (iii) calculating the probability of occurrence of drought events and water scarcity events based on the time-varying Copula function; (iv) exploring the interdependence relationship between drought and water scarcity by calculating various types of recurrence intervals.
5. Conclusions
Although drought and water scarcity are important aspects of water resources management, they are often confused. In this study, we proposed a model-based simulation framework that can quantitatively distinguish natural factors (drought) and human factors (water scarcity) in a hydrological system. The core of the model framework is a hydrological model (SWAT) that can simulate natural hydrological scenarios without human disturbances (natural scenarios) and actual hydrological scenarios (coexistence of human and natural scenarios). Based on the difference between the two scenarios, the effects of drought and water scarcity are distinguished. We demonstrated the application of the proposed model-based simulation framework to the Zhangweinan Canal Basin.
After the sensitivity analysis and calibration of SWAT model parameters, the Nash-Sutcliffe efficiency coefficient (ENS) and decision coefficient (R2) were greater than 0.6 and 0.7, respectively, and the relative error (Re) was less than 30%, indicating that the SWAT model can better simulate the runoff process in the Zhangweinan Canal Basin. Furthermore, water scarcity led to the disappearance of the summer peak runoff period in both wet and dry years. The abrupt change point of runoff in the Zhangweinan Canal Basin was 1975, based on the Mann-Kendall method and field investigation, which distinguished between the human disturbance and natural periods. Combined with the naturalized runoff process in the period of human disturbance obtained by the SWAT model and the threshold analysis, the difference between the simulated and observed hydrological series was found. Human factors (water scarcity) were the main cause of changes in the hydrological system in the Zhangweinan Canal Basin, and runoff loss caused by human factors is four times greater than that caused by natural factors.
The proposed model-based simulation framework provides water resources managers with a tool to distinguish natural and human effects on hydrological systems, allowing them to adjust management accordingly. In future, we must not only adapt to natural variability (drought), but also reduce unsustainable water resource utilization (water scarcity).
Author Contributions
Z.Z. contributed substantially to conceptualization, methodology, validation, data curation, data interpretation, and writing. Z.Z., H.W., Q.B., Y.W., C.W. participate in drafting the article or revising it critically, and give final approval of the version to be submitted. All authors have read and agreed to the published version of the manuscript.
Funding
This research was supported by the National Key Research and Development Program of China (2019YFC0408902), the National Natural Science Foundation of China (Grant Nos.51879010 and 51479003), the Graduate Innovation Fund in Beijing Key Laboratory of Urban Hydrological Cycle and Sponge City Technology (HYD2020IFDC03) and the 111 Project (Grant No. B18006).
Acknowledgments
The authors thank the editors and anonymous reviewers for suggesting the constructive comments and corrections that substantially improved the quality of the paper.
Conflicts of Interest
The authors declare no conflict of interest.
References
- Iglesias, A.; Garrote, L.; Flores, F.; Moneo, M. Challenges to manage the risk of water scarcity and climate change in the Mediterranean. Water Resour. Manag. 2007, 21, 775–788. [Google Scholar] [CrossRef]
- Kai, D.; Xiao, W.; Mei, Y.; Liu, D. Multi-scale analysis of meteorological drought risks based on a Bayesian interpolation approach in Huai River basin, China. Stoch. Environ. Res. Risk Assess. 2014, 28, 1985–1998. [Google Scholar]
- Dracup, J.A.; Lee, K.S.; Paulson, E.G. On the Statistical Characteristics of Drought Events. Water Resour. Res. 1980, 16, 289–296. [Google Scholar] [CrossRef]
- Mishra, A.K.; Singh, V.P. A review of drought concepts. J. Hydrol. 2010, 391, 202–216. [Google Scholar] [CrossRef]
- Mishra, A.K.; Singh, V.P. Drought modeling—A review. J. Hydrol. 2011, 403, 157–175. [Google Scholar] [CrossRef]
- Gohari, A.; Eslamian, S.; Mirchi, A.; Abedikoupaei, J.; Massah Bavani, A.; Madani, K. Water transfer as a solution to water shortage: A fix that can Backfire. J. Hydrol. 2013, 491, 23–39. [Google Scholar] [CrossRef]
- Livingston, M.L.; Garrido, A. Entering the policy debate: An economic evaluation of groundwater policy in flux. Water Resour. Res. 2004, 40, 417–427. [Google Scholar] [CrossRef]
- Van Loon, A.; Van Lanen, H. Making the distinction between water scarcity and drought using an observation-modeling framework. Water Resour. Res. 2013, 49, 1483–1502. [Google Scholar] [CrossRef]
- Van Lanen, H.; Wanders, N.; Tallaksen, L.; Van Loon, A. Hydrological drought across the world: Impact of climate and physical catchment structure. Hydrol. Earth Syst. Sci. 2013, 17, 1715–1732. [Google Scholar] [CrossRef] [Green Version]
- Chang, T.J. Investigation of precipitation droughts by use of kriging method. J. Irrig. Drain. Eng. 1991, 117, 935–943. [Google Scholar] [CrossRef]
- Mekonnen, M.M.; Hoekstra, A.Y. Four billion people facing severe water scarcity. Sci. Adv. 2016, 2, e1500323. [Google Scholar] [CrossRef] [PubMed] [Green Version]
- OhIsson, L. Water conflicts and social resource scarcity. Phys. Chem. Earth Part B Hydrol. Ocean. Atmos. 2000, 25, 213–220. [Google Scholar] [CrossRef]
- van Dijk, A.I.; Beck, H.E.; Crosbie, R.S.; de Jeu, R.A.; Liu, Y.Y.; Podger, G.M.; Timbal, B.; Viney, N.R. The Millennium Drought in southeast Australia (2001–2009): Natural and human causes and implications for water resources, ecosystems, economy, and society. Water Resour. Res. 2013, 49, 1040–1057. [Google Scholar] [CrossRef]
- Yuan, F.; Ma, M.; Ren, L.; Shen, H.; Li, Y.; Jiang, S.; Yang, X.; Zhao, C.; Kong, H. Possible Future Climate Change Impacts on the Hydrological Drought Events in the Weihe River Basin, China. Adv. Meteorol. 2016, 2016, 2905198. [Google Scholar] [CrossRef] [Green Version]
- Watts, G.; von Christierson, B.; Hannaford, J.; Lonsdale, K. Testing the resilience of water supply systems to long droughts. J. Hydrol. 2012, 414, 255–267. [Google Scholar] [CrossRef] [Green Version]
- Lee, S.; Abdul-Talib, S.; Park, H. Lessons from water scarcity of the 2008–2009 Gwangdong reservoir: Needs to address drought management with the adaptiveness concept. Aquat. Sci. 2012, 74, 213–227. [Google Scholar] [CrossRef]
- Van Loon, A.F.; Gleeson, T.; Clark, J.; Van Dijk, A.I.J.M.; Stahl, K.; Hannaford, J.; Di Baldassarre, G.; Teuling, A.J.; Tallaksen, L.M.; Uijlenhoet, R.; et al. Drought in the Anthropocene. Nat. Geosci. 2016, 9, 89. [Google Scholar] [CrossRef] [Green Version]
- Arnold, J.G.; Srinivasan, R.; Muttiah, R.S.; Williams, J.R. Large area hydrologic modeling and assessment part I: Model development 1. JAWRA J. Am. Water Resour. Assoc. 1998, 34, 73–89. [Google Scholar] [CrossRef]
- Srinivasan, R.; Ramanarayanan, T.S.; Arnold, J.G.; Bednarz, S.T. Large area hydrologic modeling and assessment part II: Model application 1. JAWRA J. Am. Water Resour. Assoc. 1998, 34, 91–101. [Google Scholar] [CrossRef]
- Gassman, P.W.; Reyes, M.R.; Green, C.H.; Arnold, J.G. The soil and water assessment tool: Historical development, applications, and future research directions. Trans. ASABE 2007, 50, 1211–1250. [Google Scholar] [CrossRef] [Green Version]
- White, K.L.; Chaubey, I. Sensitivity analysis, calibration, and validations for a multisite and multivariable SWAT model 1. JAWRA J. Am. Water Resour. Assoc. 2005, 41, 1077–1089. [Google Scholar] [CrossRef]
- Arnold, J.G.; Fohrer, N. SWAT2000: Current capabilities and research opportunities in applied watershed modelling. Hydrol. Process. 2005, 19, 563–572. [Google Scholar] [CrossRef]
- Xu, H.S.; Xu, Z.X.; Wu, W.; Tang, F. Assessment and spatiotemporal variation analysis of water quality in the Zhangweinan River Basin, China. Procedia Environ. Sci. 2012, 13, 1641–1652. [Google Scholar] [CrossRef] [Green Version]
- Wang, X.; Zhang, Y.; Zeng, Y.; Liu, C. Resolving trans-jurisdictional water conflicts by the Nash bargaining method: A case study in Zhangweinan canal basin in north China. Water Resour. Manag. 2013, 27, 1235–1247. [Google Scholar] [CrossRef]
- Li, Y.; Qiu, R.; Yang, Z.; Li, C.; Yu, J. Parameter determination to calculate water environmental capacity in Zhangweinan Canal Sub-basin in China. J. Environ. Sci. 2010, 22, 904–907. [Google Scholar] [CrossRef]
- Fu, X.; Dong, Z.; Liu, C.; Xu, W.; Tan, J. Impact of different driving factors on runoff in Zhangweinan River Basin. J. Hohai Univ. Nat. Sci. 2015, 43, 555–561. [Google Scholar]
- Zhang, B.; Wang, Z.; Guan, C. A sensitivity study of applying a two-source potential evapotranspiration model in the Standardized Precipitation Evapotranspiration Index for drought monitoring: Two-Source PET model is used and evaluated in calculating the SPEI. Land Degrad. Dev. 2017, 28, 783–793. [Google Scholar] [CrossRef]
- Gao, X.; Zhao, Q.; Zhao, X.; Wu, P.; Pan, W.; Gao, X.; Sun, M. Temporal and spatial evolution of the standardized precipitation evapotranspiration index (SPEI) in the Loess Plateau under climate change from 2001 to 2050. Sci. Total Environ. 2017, 595, 191. [Google Scholar] [CrossRef]
- Han, J.; Wang, J.; Zhao, Y.; Wang, Q.; Zhang, B.; Li, H.; Zhai, J. Spatio-temporal variation of potential evapotranspiration and climatic drivers in the Jing-Jin-Ji region, North China. Agric. Meteorol. 2018, 256, 75–83. [Google Scholar] [CrossRef]
- Ullah, S.; You, Q.; Ali, A.; Ullan, W.; Jan, M.A.; Zhang, Y.; Xie, W.; Xie, X. Observed changes in maximum and minimum temperatures over China-Pakistan economic corridor during 1980–2016. Atmos. Res. 2019, 216, 37–51. [Google Scholar] [CrossRef]
- Ullah, S.; You, Q.; Ullah, W.; Ali, A. Observed changes in precipitation in China-Pakistan economic corridor during 1980–2016. Atmos. Res. 2018, 210, 1–14. [Google Scholar] [CrossRef]
- Hirsch, R.M.; Slack, J.R. A nonparametric trend test for seasonal data with serial dependence. Water Resour. Res. 1984, 20, 727–732. [Google Scholar] [CrossRef] [Green Version]
- Nash, J.E.; Sutcliffe, J.V. River flow forecasting through conceptual models part I—A discussion of principles. J. Hydrol. 1970, 10, 282–290. [Google Scholar] [CrossRef]
- Quiring, S.M. Developing objective operational definitions for monitoring drought. J. Appl. Meteorol. Climatol. 2009, 48, 1217–1229. [Google Scholar] [CrossRef]
- Pedro-Monzonís, M.; Solera, A.; Ferrer, J.; Estrela, T.; Paredes-Arquiola, J. A review of water scarcity and drought indexes in water resources planning and management. J. Hydrol. 2015, 527, 482–493. [Google Scholar] [CrossRef] [Green Version]
- Estrela, T.; Vargas, E. Drought Management Plans in the European Union. The Case of Spain. Water Resour. Manag. 2012, 26, 1537–1553. [Google Scholar] [CrossRef]
- Alam, K. Farmers’ adaptation to water scarcity in drought-prone environments: A case study of Rajshahi District, Bangladesh. Agric. Water Manag. 2015, 148, 196–206. [Google Scholar] [CrossRef] [Green Version]
- Gleick, P.H. Water, drought, climate change, and conflict in Syria. Weather Clim. Soc. 2014, 6, 331–340. [Google Scholar] [CrossRef]
- Hayes, M.J.; Wilhelmi, O.V.; Knutson, C.L. Reducing drought risk: Bridging theory and practice. Nat. Hazards Rev. 2004, 5, 106–113. [Google Scholar] [CrossRef]
- Van Loon, A.F.; Stahl, K.; Di Baldassarre, G.; Clark, J.; Rangecroft, S.; Wanders, N.; Gleeson, T.; Van Dijk, A.I.J.M.; Tallaksen, L.M.; Hannaford, J.; et al. Drought in a human-modified world: Reframing drought definitions, understanding, and analysis approaches. Hydrol. Earth Syst. Sci. 2016, 20, 3631–3650. [Google Scholar] [CrossRef] [Green Version]
- Custodio, E. Aquifer overexploitation: What does it mean? Hydrogeol. J. 2002, 10, 254–277. [Google Scholar] [CrossRef]
- Lorenzo-Lacruz, J.; Vicente-Serrano, S.M.; López-Moreno, J.I.; Beguería, S.; García-Ruiz, J.M.; Cuadrat, J.M. The impact of droughts and water management on various hydrological systems in the headwaters of the Tagus River (central Spain). J. Hydrol. 2010, 386, 13–26. [Google Scholar] [CrossRef] [Green Version]
- Van Vliet, M.T.; Yearsley, J.R.; Ludwig, F.; Vögele, S.; Lettenmaier, D.P.; Kabat, P. Vulnerability of US and European electricity supply to climate change. Nat. Clim. Chang. 2012, 2, 676. [Google Scholar] [CrossRef]
- Lindström, G.; Johansson, B.; Persson, M.; Gardelin, M.; Bergström, S. Development and test of the distributed HBV-96 hydrological model. J. Hydrol. 1997, 201, 272–288. [Google Scholar] [CrossRef]
- Chahine, M.T. The hydrological cycle and its influence on climate. Nature 1992, 359, 373. [Google Scholar] [CrossRef]
- Qian, L.; Wang, H.; Dang, S.; Wang, C.; Jiao, Z.; Zhao, Y. Modelling bivariate extreme precipitation distribution for data-scarce regions using Gumbel–Hougaard copula with maximum entropy estimation. Hydrol. Process. 2018, 32, 212–227. [Google Scholar] [CrossRef]
- Fan, L.; Wang, H.; Liu, Z.; Li, N. Quantifying the Relationship between Drought and Water Scarcity Using Copulas: Case Study of Beijing-Tianjin-Hebei Metropolitan Areas in China. Water 2018, 10, 1622. [Google Scholar] [CrossRef] [Green Version]
Figure 1.
Location and map of the Zhangweinan Canal Basin.

Figure 2.
Conceptual diagram of a system affected by natural factors and human factors.

Figure 3.
Conceptual diagram of the run analysis theory.

Figure 4.
Technical roadmap for this study.

Figure 5.
Comparison of observed and simulated values of monthly runoff based on the SWAT model.


Figure 6.
Mann-Kendall abrupt change point test of runoff at the Guantai Station.

Figure 7.
Comparison of simulated and observed runoff in the Zhangweinan Canal Basin.

Figure 8.
Differences among the observed runoff, simulated runoff and threshold during the human disturbance period from 1976 to 1995.
Figure 8.
Differences among the observed runoff, simulated runoff and threshold during the human disturbance period from 1976 to 1995.


Table 1.
Data items and data sources of the SWAT model.
| Data Type | Scale | Data Source |
|---|---|---|
| DEM | 1:250,000 | Basic Geographic Database |
| Land use | 1:10,000 | Remote sensing image interpretation, |
| Soil type | 1:100,000 | Nanjing Institute of Soil Science |
| Meteorological | 10 stations | National Meteorological Center |
| Rainfall | 102 stations | National Meteorological Center |
| Reservoir | — | Zhangweinan Canal Basin Administration |
| Management measures | — | Agricultural statistics yearbook |
| Agricultural irrigation | — | Agricultural statistics yearbook |
| Water withdrawal | — | Zhangweinan Canal Basin Administration |
Table 2.
The calibrated values and sensitivity values of parameters in SWAT.
| Definition | Parameter | Range | Value | Sensitivity |
|---|---|---|---|---|
| Runoff curve number | CN2 | −8–8 | 2 | 2.100 |
| Soil depth/mm | SOL_Z | 0–3000 | 1000 | 0.706 |
| Soil available water/mm/mm | SOL_AWC | 0–1 | 0.9 | 0.443 |
| Soil evaporation compensation coefficient | ESCO | 0–1 | 0.01 | 0.322 |
| Base runoff α coefficient | ALPHA_BF | 0–1 | 0.12 | 0.293 |
| Maximum canopy interception/mm | CANMX | 0–10 | 1 | 0.222 |
Table 3.
Evaluation of the simulation results of monthly runoff during the calibration and validation periods at Guantai station.
Table 3.
Evaluation of the simulation results of monthly runoff during the calibration and validation periods at Guantai station.
| Simulation Period | ENS | R2 | Re/% |
|---|---|---|---|
| Calibration period | 0.79 | 0.813 | 12.5 |
| Validation period | 0.74 | 0.721 | −11.3 |
Table 4.
Quantitative parameters in the human disturbance period (from 1976 to 1999).
| Water Deficit State | Number | Duration/month | Threshold Deviation/106 m3 | ||
|---|---|---|---|---|---|
| Average | Maximum | Average | Maximum | ||
| Natural factors | 32 | 4.5 | 15 | 260 | 1280 |
| Human factors | 11 | 20.5 | 70 | 1881 | 6480 |
© 2020 by the authors. Licensee MDPI, Basel, Switzerland. This article is an open access article distributed under the terms and conditions of the Creative Commons Attribution (CC BY) license (http://creativecommons.org/licenses/by/4.0/).
Share and Cite
MDPI and ACS Style
Zhao, Z.; Wang, H.; Bai, Q.; Wu, Y.; Wang, C. Quantitative Analysis of the Effects of Natural and Human Factors on a Hydrological System in Zhangweinan Canal Basin. Water 2020, 12, 1864. https://doi.org/10.3390/w12071864
AMA Style
Zhao Z, Wang H, Bai Q, Wu Y, Wang C. Quantitative Analysis of the Effects of Natural and Human Factors on a Hydrological System in Zhangweinan Canal Basin. Water. 2020; 12(7):1864. https://doi.org/10.3390/w12071864
Chicago/Turabian StyleZhao, Ziyang, Hongrui Wang, Qijie Bai, Yifan Wu, and Cheng Wang. 2020. "Quantitative Analysis of the Effects of Natural and Human Factors on a Hydrological System in Zhangweinan Canal Basin" Water 12, no. 7: 1864. https://doi.org/10.3390/w12071864
Note that from the first issue of 2016, this journal uses article numbers instead of page numbers. See further details here.